Article

Optimization of Low-Carbon Operation and Capacity Expansion of Integrated Energy Systems in Synergy with Incremental Distribution Network for Industrial Parks

1
College of Energy, Xiamen University, Xiamen 361102, China
2
State Grid Shanghai Electric Power Supply Company, Shanghai 200122, China
3
State Nuclear Electric Power Planning Design & Research Institute Co., Ltd., Beijing 100095, China
4
State Power Investment Corporation Limited, Beijing 100033, China
5
State Power Investment Corporation Hebei Electric Power Co., Ltd., Shijiazhuang 361009, China
6
College of Physical Science and Technology, Xiamen University, Xiamen 361005, China
*
Authors to whom correspondence should be addressed.
These authors contributed equally to this work.
Energies 2025, 18(19), 5206; https://doi.org/10.3390/en18195206
Submission received: 16 July 2025 / Revised: 14 September 2025 / Accepted: 24 September 2025 / Published: 30 September 2025

Abstract

Against the backdrop of an intensifying global climate change and energy crisis, energy system decarbonization constitutes a primary sector for carbon mitigation. Integrated Energy Systems (IES) of district heating systems (DHS), a critical component of district energy networks (DEN), enable energy cascade utilization and enhance renewable energy integration efficiency when coupled with incremental distribution networks (IDN). However, retrofitting coupled systems necessitates significant capital investment and sustained operational expenditures. To evaluate the economic and environmental benefits of system retrofitting and assess cross-sector coordinated optimization potential, this study develops a multi-objective optimization framework for IES transition planning of DHS. Using an operational DHS energy station as a case study, we establish multi-scenario retrofitting strategies and operational protocols with comprehensive feasibility assessments, incorporating sensitivity analysis of cross-sector optimization potential while evaluating how varying electricity-to-heat load ratios affect optimization performance. Results demonstrate that intelligent operation optimization is essential for coordinating multi-equipment operations and maximizing energy conservation. Significant long-term economic and carbon mitigation potential remains untapped in ground source heat pumps and combined cooling, heating, and power (CCHP) systems. Coordinated optimization with campus incremental distribution networks further enhances energy cascade utilization in urban energy systems.

1. Introduction

Following the establishment of dual carbon goals, district energy networks (DEN) represent a crucial domain for carbon mitigation [1,2,3]. DEN delivers integrated energy services within localized areas through centralized or distributed energy stations that produce and distribute cooling, heating, and electricity via pipeline networks to enhance energy efficiency, reduce costs, and minimize environmental impacts. DEN achieves systematic carbon reduction via renewable integration [4], utilization of available heat sources [5], multi-energy complementarity [6,7], coordinated dispatch, and reduced heating network temperatures. As a critical DEN component, district heating systems (DHS) integrate diverse heat sources for thermal supply while enabling energy conversion within DEN [8,9]. Given substantial urban energy consumption and associated carbon emissions, large-scale DHS expansion becomes imperative [10]. Coupling DHS with incremental distribution networks (IDN) enables energy cascade utilization [11], enhances renewable integration [4], improves operational efficiency [12,13], and reduces operating costs, thereby fulfilling urban energy requirements with greater efficiency and lower environmental impact while advancing dual carbon goal attainment. Furthermore, IDN coupling establishes the infrastructure for DHS digitalization and intelligent transformation [14,15]. This transition from isolated to actively coupled networks constitutes a critical advancement toward intelligent energy networks [16]. The application of Cyber-Physical Systems enables intelligent energy management for district energy stations. Based on system optimization models, the establishment of high-fidelity network models facilitates real-time monitoring and optimization of energy conversion, storage, and supply processes throughout an energy station [17]. This infrastructure supports dynamic energy allocation adjustments in response to real-time load fluctuations, thereby enhancing both operational efficiency and system stability.
Despite significant advantages in energy efficiency enhancement and renewable integration from DHS-IDN coupling, substantial challenges persist. DHS operational data often reflects single-energy profiles without multi-energy coupling parameters [18], with insufficient data refresh rates for intelligent control and demand response compounded by data gaps and heterogeneous structures, impeding effective coupled system operation [19,20,21]. Coupled systems necessitate retrofitting existing equipment. As district heating networks undergo generation transitions, differing energy sources and operating temperatures across generations mandate pipeline system modifications to enable cross-generational interoperability, yet entail significant capital investment and sustained operational expenditures, creating barriers to DHS transition. This study establishes a multi-objective optimization framework for DHS transition planning incorporating (1) operational characteristic analysis, (2) feasibility assessments of retrofitting strategies, (3) capacity optimization, and (4) sensitivity analysis of cross-sector optimization potential.

1.1. Literature Review

Extensive research exists on DHS retrofitting. Martina et al. analyzed the potential for supply temperature reductions in district heating networks to support the transition of existing infrastructure to next-generation systems [22]. Jan et al. proposed an optimization model that takes into account the installation of heat pumps and the renovation of buildings to optimize the integration of low-temperature heat sources into existing district heating systems, and the results show that building renovation decisions can be incorporated into the process of redistribution heating retrofits to achieve efficient integration of low-temperature heat sources [23]. Souza et al. provide an overview of how CHP equipment can be retrofitted to support a low-carbon transition in a 100% renewable energy scenario [24]. Naimaster et al. evaluated the use of a solid oxide fuel cell cogeneration system in a building heating system to save 14.5% of annual costs [25]. Bancha et al. evaluated retrofit measures for building HVAC efficiency, demonstrating 34% energy reduction via high-efficiency chiller replacement with payback periods reduced to 60% of the original duration [26]. Yue et al. implemented building HVAC system control by integrating data-driven model predictive control into an existing building automation system, and the results showed that the proposed control retrofit method could reduce the daily energy consumption of the system by 24.5% [27]. Shcherbakova established cost–benefit analyses comparing repair and replacement costs, incorporating residual value recovery (market/liquidation value) into financial models, revealing that repair costs exceeding 70% of replacement cost makes replacement economically preferable, with optimal retrofit paths dependent on organizational financing capacity [28].
Coupled equipment utilization has been investigated. Sun et al. combined semi-effective absorption and electric compression heat pumps with heat exchangers and used them in a low-temperature district heating system to reduce the return temperature of the primary heating network in order to enhance the low-temperature geothermal utilization, and the results showed that the annual low-temperature geothermal utilization efficiency was increased by 27.69% and the carbon emissions were reduced by 89.14% in comparison with the conventional heating system [29]. Zhu et al. integrated compression-assisted thermo-chemical adsorption thermal storage into a district heating system and showed a reduction of 1697.94 tons of carbon emissions [30]. Mi et al. proposed a novel photovoltaic heat pump and applied it to an integrated energy system, and the results showed that the photovoltaic heat pump system has a significant overall energy efficiency [31]. Liu et al. demonstrated that scaling industrial waste heat recovery with air source or ground source heat pumps eliminates new CHP plant requirements, achieving 26% carbon reduction during 2020–2030 [32]. Laura et al. identified optimal energy and storage configurations for district heating networks, revealing CHP plants integrated with solar thermal collectors as optimal [33]. Mohamed et al. developed artificial neural network models to integrate heat pumps into solar-assisted district heating systems, demonstrating 82.5% environmental impact reduction compared to conventional boilers [34]. Sinha et al. established via case studies that CHP significantly enhances system flexibility in DHS. Dawid et al. implemented gas-fired CHP in central DHS, achieving 33% higher financial performance and 78% carbon reduction [35]. Anna et al. evaluated two modernization pathways for fossil-fueled heating plants: gas–steam CHP versus coal-fired CHP with condensing steam turbines, reducing heating costs with gas–steam systems [36]. Meng et al. developed an optimization framework for 100% renewable systems, employing multi-objective optimization to determine optimal shares of industrial waste heat recovery versus heat pumps [37]. Tian et al. established a two-stage model integrating capacity planning and operational strategy, with capacity optimization in the upper stage and operational dispatch in the lower stage, achieving 29% CO2 reduction and 17% life cycle cost reduction in PV-storage integrated energy stations [38].
Yet these studies focus on equipment retrofitting and coupling, neglecting DHS-IDN interaction mechanisms.
Lu et al. found that connecting a district heating network to a combined-cycle gas turbine plant as thermal energy storage can greatly increase the flexibility of a combined-cycle gas turbine [39]. Johannes et al. quantified the theoretical potential for integrating industrial waste heat and solar thermal into DHS, demonstrating high integration potential capable of fully supplying heating demand [40]. Lukas et al. modeled configurable industrial thermal systems via industrial heat exchange stations coupled to DHS, reducing operating costs by 14% and CO2 emissions by 39% [41]. Zhang et al. applied mixed-integer linear programming (MILP) to co-optimize component capacities and operation profiles in building energy systems, significantly enhancing grid flexibility through DHS-supplied heat [42]. Gabriele et al. evaluated the dual flexibility potential of heat pumps for heating and power systems, demonstrating enhanced flexibility for both systems [43]. Kubin et al. identified cost-optimal transition pathways for DHS, confirming flexible sector coupling as the most economical pathway [44].
Notably, existing research demonstrates DHS-IDN coupling enables energy efficiency enhancement, flexibility improvement, and more efficient renewable integration, yet neglects cross-sector coordinated optimization potential. This necessitates analysis of coordinated optimization potential to establish robust theoretical frameworks and quantitative benchmarks for implementation.

1.2. Motivation and Contribution

DHS transition is critical to carbon mitigation. Cross-sector IDN coupling offers significant advantages in energy efficiency and carbon reduction, yet faces critical challenges. Regarding data deficiencies and accuracy limitations in coupled systems, standardized compensation methods remain unavailable. Current DHS-IDN integration focuses solely on efficiency and flexibility enhancement, with no quantitative analysis of optimization potential. To quantify optimization potential enabling low-carbon and economically efficient transition, this study develops a multi-objective optimization framework for industrial park district heating systems (IPDHS) transition planning, establishing multi-level operational and investment planning scenarios to identify cross-sector optimization potential via multi-scenario analysis. Specifically, our work aims to provide optimization decision-making tools for the planning and operation of integrated energy stations connected to district heating networks and distribution grids. These tools can offer operation optimization schemes for intelligent control systems of integrated energy stations, guiding them to adjust real-time control strategies in response to changes in real-time supply and demand conditions. The contributions are:
(1)
Characterizing data with limited accuracy and gaps establishes quantitative references for operational optimization.
(2)
Multi-scenario assessment of economic–environmental feasibility for retrofit participation in energy supply, comparing the feasibility of equipment retrofitting and system deployment.
(3)
Multi-scenario sensitivity analysis of cross-sector optimization feasibility, identifying coordinated optimization potential and impacts of varying electric-heating/cooling load ratios.
The remainder is structured as follows. Section 2 details the multi-objective optimization model for industrial park district heating systems. Section 3 presents the case study configuration and scenario design. Section 4 discusses the case study results. Section 5 concludes and outlines future research directions.

2. Methods

The methodological framework is illustrated in Figure 1, comprising three core components: multi-scenario and sensitivity parameter inputs; campus-level multi-scenario adaptation model for energy system retrofitting; and comparative multi-scenario analysis and solution output. The multi-scenario adaptation modeling is detailed below.

2.1. Objectives Functions of IES Model

2.1.1. Economic Objectives

The expected net present value of cost (NPVC) over the project operating period is defined as the economic objective, which consists of four parts: capital expenditures (CAPEX), maintenance expenditures (MAEX), energy expenditures (EEXP), and energy revenues (EREV); all the above use CNY as their monetary units. The NPVC can be expressed as
N P V C = C A P E X + M A E X + E E X P E R E V
The capital expenditures (CAPEX) include the investment cost of all energy facilities, i.e.,
C A P E X = k C A P k × C I k + k R S k × R S I k
where the subscript k represents the type of equipment. C A P denotes the installed capacity in kW. C I is the unit installed cost in CNY/kW. R S is the binary decision variable of installation for each type of energy facility retrofit scheme and is dimensionless. R S I indicates the cost of equipment modification in CNY.
Maintenance expenditures (MAEX) can be calculated by multiplying the energy output of each device by the maintenance cost per unit of energy, i.e.,
M A E X = y s d t k C M y , s , d , t k × E l e y , s , d , t o u t , k + C o o l y , s , d , t o u t , k + H o t y , s , d , t o u t , k
where the subscripts y, s, d, and t represent different typical years, seasons, days, and different moments, and C M represents the maintenance cost per unit of energy output of each equipment in CNY/kWh. E l e o u t represents the power output of the device measured in kWh; the device includes PV and CHP. C o o l o u t represents the cold output of the device measured in kWh; the device includes ABHP, WSHP, and CST. H o t o u t represents the heat output of the device in kWh; the device includes ABHP, WSHP, GB, TACU, and HST. Since ABHP and WSHP can output different forms of energy at different times, they are represented in both C o o l o u t and H o t o u t while CHP can output different forms of energy at the same time. Here, the output power is used to calculate the maintenance cost.
Energy expenditures (EEXP) include the cost of fuel, e.g., natural gas, and the cost of electricity purchased from the utility grid and are given by
E E X P = y s d t k G P y , s , d , t × G a s y , s , d , t c o n , k + E P y , s , d , t × E l e y , s , d , t c o n , k
where G a s c o n represents the gas consumed by the device in Nm3; the device includes CHP, ABHP and GB. E l e represents the electricity consumed by the device in kWh; the device includes WTS, WSHP and TACU. G P and E P are the price of gas and the price of electricity; their units are CNY/Nm3 and CNY/KWh, respectively.
Energy revenue (EREV) is derived from the sale of electricity to utilities, which can be written as
E R E V = y s d t E l e y , s , d , t P G × S P y , s , d , t P G
where E l e P G represents the amount of electricity fed into the network in kWh and S P P G represents the feed-in tariffs in CNY/kWh.

2.1.2. Environmental Objectives

The expected total carbon emissions (TCE) over the project operating period are considered as the environmental objective and given by
T C E = y s d t k κ g a s × G a s y , s , d , t c o n , k + κ e l e × E l e y , s , d , t c o n , k
where κ g a s and κ e l e are the equivalent carbon emission factors of natural gas and electrical power in units of kgCO2e/Nm3 and kgCO2e/kWh, respectively. The equipment that consume natural gas include CHP, ABHP, and GB. The equipment that consume electricity include WTS, WSHP, and TACU.

2.2. Energy Balance Constraints of IES Model

2.2.1. Energy Flow Balance Within Hub

The hub energy flow balance includes the electrical balance, heating balance, and cooling balance. Their expression can be written as
E l e y , s , d , t P V + E l e y , s , d , t g r i d   b u y = E l e y , s , d , t c o n , k + E l e y , s , d , t E D + E l e y , s , d , t P G , y , s , d , t , k
H o t y , s , d , t o u t , k = H o t y , s , d , t c o n , k + H o t y , s , d , t H D , y , s , d , t , k
C o o l y , s , d , t o u t , k = C o o l y , s , d , t c o n , k + C o o l y , s , d , t C D , y , s , d , t , k
where E l e P V represents electricity generated by PV, and E l e g r i d   b u y represents the amount of electricity provided by municipal power. E l e c o n represents the electricity consumed by the device; the device includes WTS, WSHP, and TACU. H o t o u t represents the heat output of the device; the device includes ABHP, WSHP, CHP, GB, and HST. H o t c o n represents the heat consumed by the device; the device includes ABHP, WSHP, and HST. C o o l o u t represents the cold output of the device; the device includes ABHP, WSHP, and CST. C o o l c o n represents the cold consumed by the device; the device includes CST. E l e E D , H o t H D , and C o o l C D represent electricity demand, heat demand, and cold demand, respectively. All of the above are measured in kWh.

2.2.2. Energy Conversion Balance

The general energy conversion balance for most of the supply-side devices can be defined as
E O y , s , d , t k = E I y , s , d , t k × η k c o n v , y , s , d , t , k
where E O y , s , d , t k and E I y , s , d , t k represent the output and input energy of each energy conversion or storage device in units of kWh, respectively. η k c o n v is the energy conversion coefficient of input energy E I y , s , d , t k to output energy E O y , s , d , t k , which can represent the efficiency of power generation or coefficient of available waste heat for CHP units, conversion efficiency of gas boilers or the coefficient of performance for heat pumps, etc.

2.2.3. Energy Storage Balance

The energy storage balance of each device can be given by
E S y , s , d , t = E S y , s , d , t 1 + E I y , s , d , t × η i c h a r g e E O y , s , d , t η i d i s c h a r g e E L y , s , d , t s t o r t , y , s , d , t , i
E L y , s , d , t s t o r t = E S y , s , d , t + E S y , s , d , t 1 × ρ i s t o r t 2 , y , s , d , t , i
where i represents the type of energy, cold or hot, and E S y , s , d , t represents the storage quantity of each device at the end of the scheduling time period t , while the storage quantity at the beginning of that period and at the end of the previous period, t 1 is denoted by E S y , s , d , t 1 ; their units are kWh. η i c h a r g e and η i d i s c h a r g e express the charging and discharging efficiency, respectively, and they are dimensionless quantities. Stored energy loss, E L y , s , d , t s t o r t , in each scheduling time period can be calculated by Equation (12) in kWh, where ρ i s t o r t indicates the storage energy loss rate within the scheduling time period and is dimensionless.

2.3. Capacity Constraints

  E I y , s , d , t , k β i , k M a x , E I × φ i , k C A P , E I × C A P k × T , y , s , d , t , i , k
E O y , s , d , t , k β i , k M a x , E O × φ i , k C A P , E O × C A P k × T , y , s , d , t , i , k
E S y , s , d , t , k β i , k M a x , E S × φ i , k C A P , E I × C A P k × T , y , s , d , t , i , k
E I y , s , d , t , k β i , k M i n , E I × φ i , k C A P , E I × B I N y , s , d , t , k × C A P k U n i t × T , y , s , d , t , i , k
E O y , s , d , t , k β i , k M i n , E O × φ i , k C A P , E I × B I N y , s , d , t , k × C A P k U n i t × T , y , s , d , t , i , k
E S y , s , d , t , k β i , k M i n , E S × φ i , k C A P , E S × C A P k + 1 R S k × φ i , k C A P , E S × M k C A P × T , y , s , d , t , i , k
C A P k U n i t C A P k C A P k M a x , k
where β denotes the maximum β M a x or minimum β M i n partial load factor for energy input, output, and transmission, as well as the maximum or minimum state of capacity for the energy storage, and they are dimensionless quantities. φ C A P represents the capacity conversion factor and is dimensionless. B I N is the binary decision variable of on/off status and is dimensionless. C A P U n i t refers to the installed capacity of a single unit and is measured in kW. M k C A P means the “big M” which is constantly greater than the related C A P k and is measured in kW. T denotes the operating period in hours.

3. Case Study

3.1. Case Overview

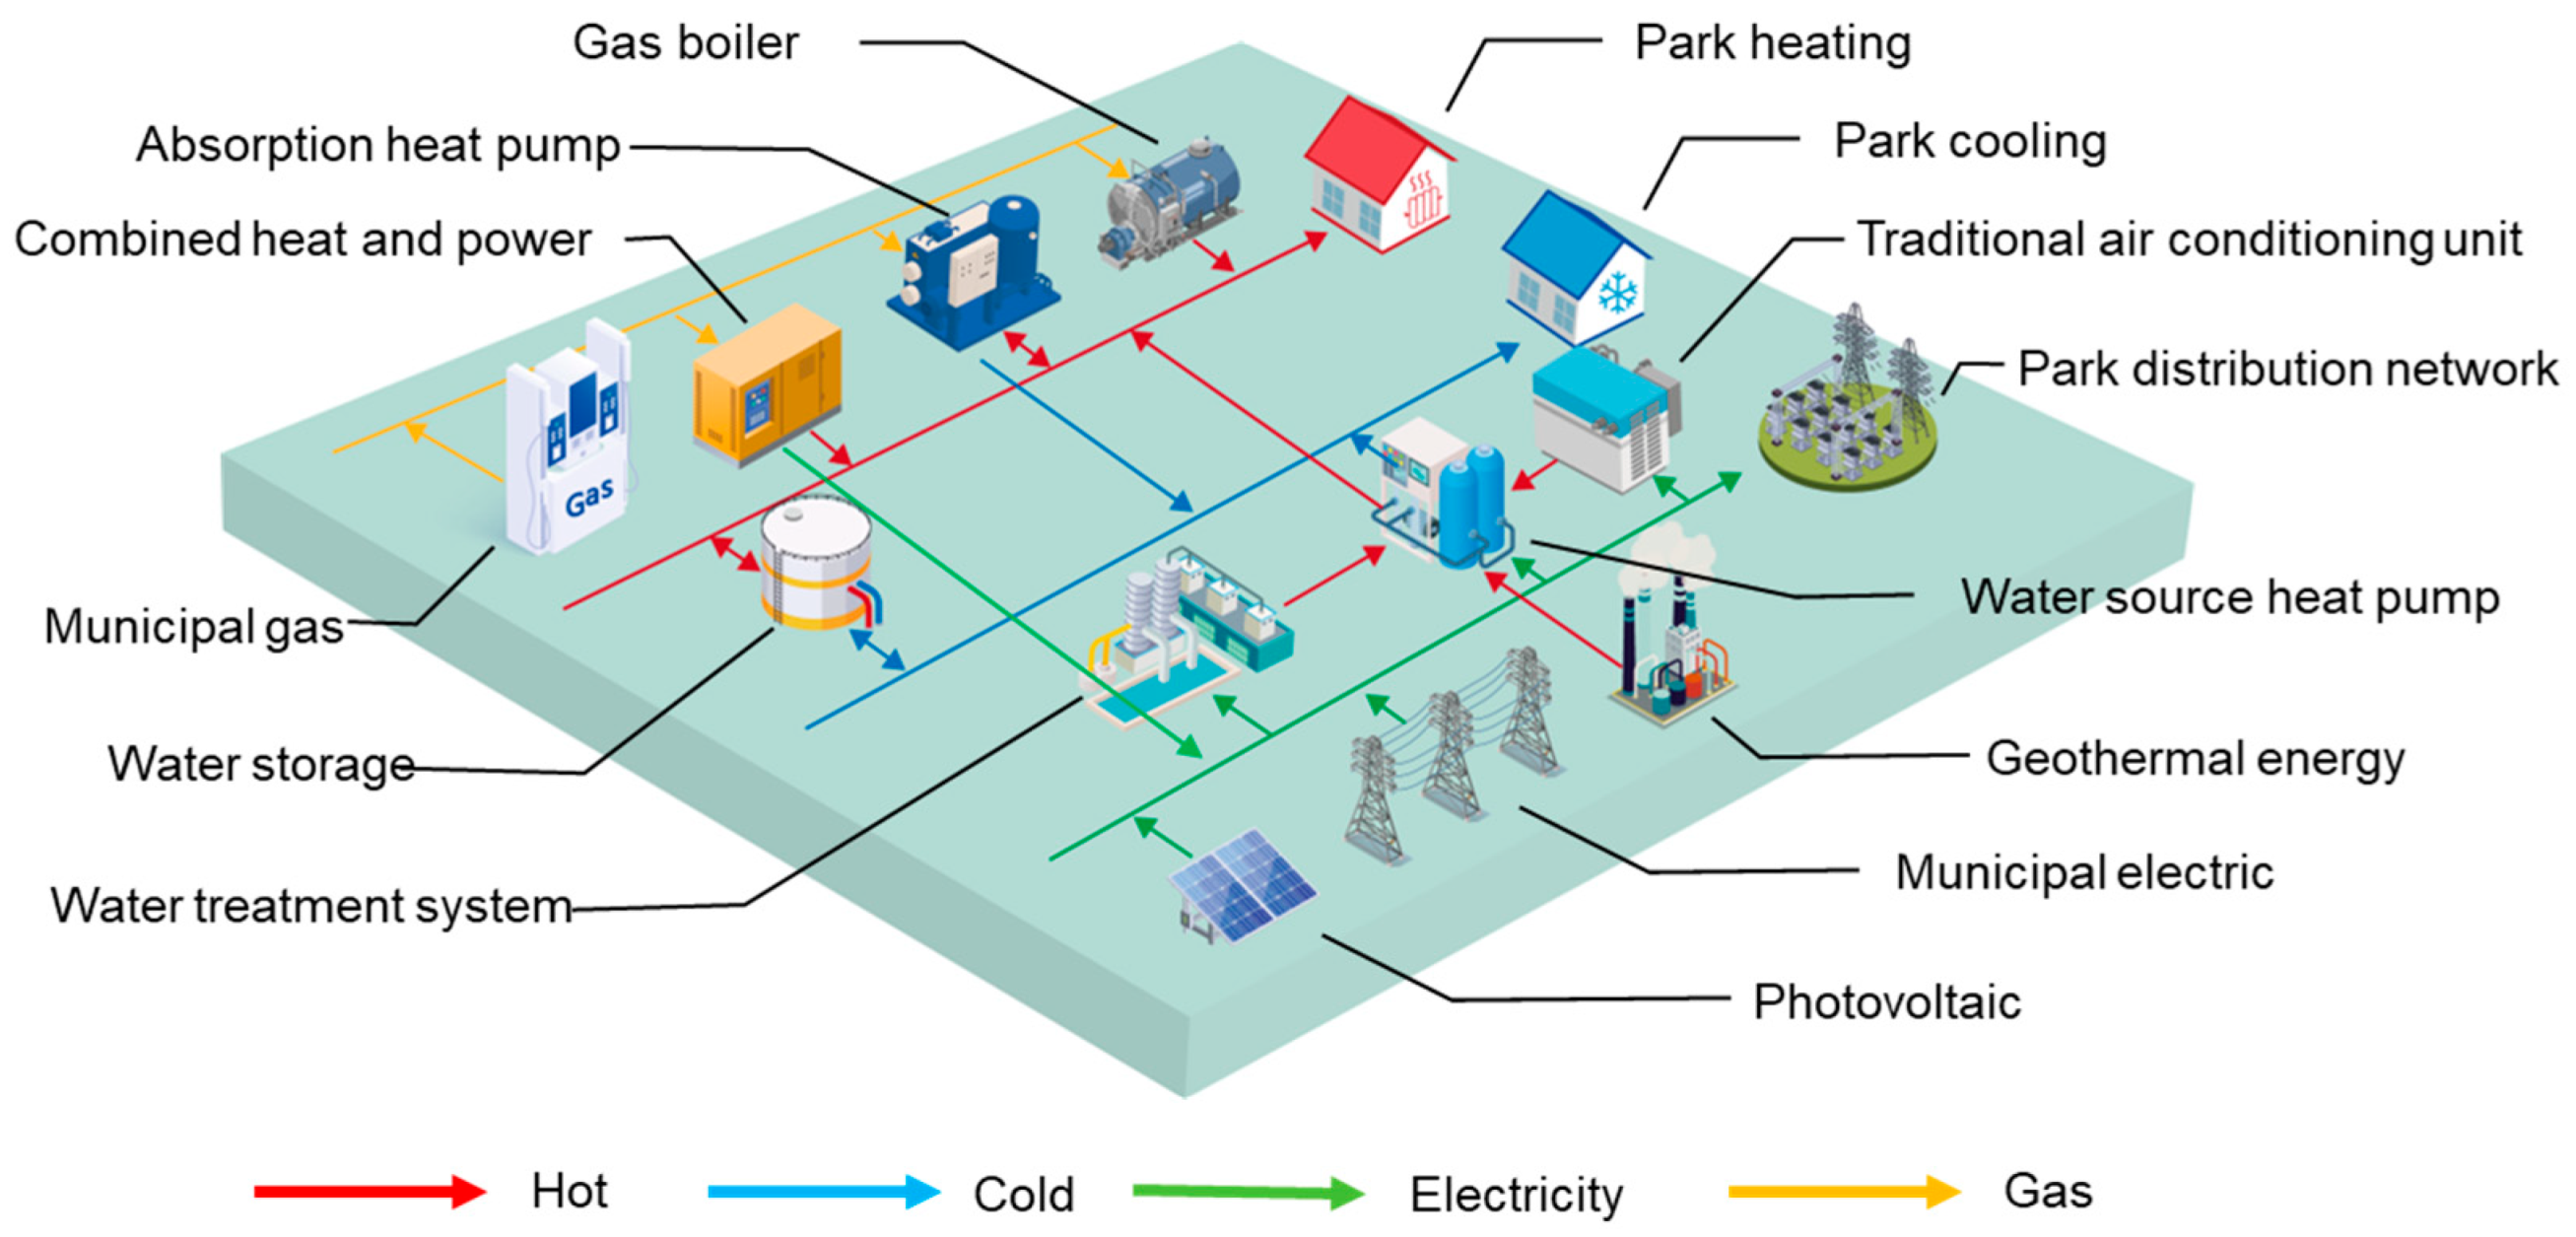
This study investigates a centralized district cooling and heating supply energy system that has been constructed and operationalized in an industrial park. The park-level energy system configuration is illustrated in Figure 2. Primarily designed for district heating and cooling service provision, the system’s electrical demand is exclusively supplied through municipal grid interconnection. Energy demand originates from manufacturing facilities, administrative complexes, and residential quarters. Thermal supply is predominantly delivered through condensing gas-fired boilers and water-source heat pump (WSHP) units, with WSHP systems integrating multiple heat sources: shallow geothermal reservoirs, wastewater streams, and air compressor residual thermal energy. District cooling is predominantly WSHP-driven, supplemented by integrated water-based thermal energy storage (TES) systems operated synergistically with WSHPs for thermal load peak-shaving and valley electricity optimization. Gas-fired CHP generation systems with flue gas/water heat recovery-driven lithium bromide absorption heat pumps are currently configured as standby systems. Auxiliary systems include water treatment infrastructure and compressed air supply units operationally managed according to predetermined water treatment protocols and industrial compressed air requirements. These components are classified as electrical loads and recoverable waste heat sources within the optimization-ready system.
In this case study, existing generation capacity allocations are primarily determined by in-station electrical load requirements, comprising PV systems and standby gas-fired generators. The park’s energy infrastructure procures external energy through grid electricity and natural gas supplies, while integrated renewable energy deployment incorporates solar PVs and shallow geothermal resources. Key energy system parameters are detailed in Table 1, with photovoltaic output profiles predicted using hourly generation coefficients extrapolated from 2019 to 2020 operational records.

3.2. Comparison Optimization Scenario Basic Condition Setting

Based on the case requirements, the two sets of analyses and comparison optimization scenarios are set up as follows.

3.2.1. Scenario Group (S1) for Comparison of System Operation Mode Analysis and Program Optimization Based on Different Equipment Conditions

Scenario group S1 is designed to evaluate historical operational performance patterns through comparative analysis of annual operational expenditures and carbon mitigation strategies across varied operational modes and optimization criteria. This framework benchmarks system performance against optimal metrics from conventional energy supply paradigms, enabling systematic assessment of energy conservation efficacy and operational optimization capacity. Derived enhancement recommendations for existing operational frameworks are based on focused evaluation of annual operational expenditures, energy utilization metrics, and carbon emission profiles, with capital investment expenditures explicitly excluded from analysis. The scenario group comprises sub-scenarios S1O, S1A, S1B, and S1C, as detailed below:
Scenario S1O establishes the baseline conventional energy supply paradigm predating energy system deployment, where thermal demands are met through gas-fired boilers and conventional vapor-compression chiller units. Boiler capacity is configured in line with existing system specifications, while chiller capacity allocation is aligned with operational cooling load requirements, incorporating performance degradation factors across varying ambient temperatures.
Scenario S1A focuses on operational data analytics, utilizing finite field-measured datasets to characterize energy station operations. Given constraints in data completeness, measurement accuracy, and temporal resolution, the analysis enables qualitative assessment of individual equipment interoperability characteristics. Statistical clustering methodologies are applied to identify representative diurnal patterns reflecting seasonal variations in energy supply characteristics. Quantification of station-level hourly load profiles establishes foundational datasets for subsequent optimization frameworks.
Scenario S1B focuses on operational enhancement conducted through existing equipment utilization constraints. This framework establishes optimal daily operational schemes for active equipment portfolios while benchmarking system-wide economic-environmental performance enhancements against baseline scenarios.
Scenario S1C investigates CCHP upgrade and optimization through operational improvements with integrated CCHP systems under S1B conditions, assessing the enhancement potential of upgraded gas-fired CCHP configurations. With upgrade specifications undefined, the economic analysis excludes retrofit costs while focusing on comparative system performance evaluation with/without equipment availability, providing critical references for retrofit decisions. The study incorporates feasibility assessment of self-generation integration into park-level grids through multi-level sensitivity analysis across power supply–demand gradients, where cost savings from coordinated electricity supply are systematically identified as cross-department optimization benefits.

3.2.2. Comparison of System Design Optimization Scenario Groups Based on Different Pre-Existing Equipment Situations and Planning Conditions (S2)

This study establishes reference planning scenarios based on standardized replication requirements for case studies. A 15-year economic and carbon mitigation potential analysis is conducted for energy systems under equipment capacity constraints and operational conditions. The research compares synergistic performance variations between district thermal systems and power incremental distribution networks across diversified park load levels. The scenario group comprises six sub-scenarios, S2O, S2B, S2C, S2D, S2E, and S2F, which are detailed as follows:
Scenario S2O replicates S1O equipment specifications while incorporating capital investment and maintenance expenditures.
Scenarios S2B/S2C maintain S1B/S1C equipment configurations with integrated lifecycle cost analysis, evaluating optimal investment planning strategies under equivalent capacity allocation frameworks.
Scenario S2D optimizes non-boiler technical capacities under fixed boiler specifications, with comparative analysis of optimal system configurations versus baseline configurations (S2B/S2C) under existing capacity constraints, assessing the residual economic–environmental optimization potential of existing technology portfolios.
Scenario S2E evaluates the economic and environmental optimization potential of current technology configurations under optimal capacity allocation without existing equipment limitations.
Scenario S2F addresses PV annual operating hours in the current system being notably lower than regional benchmarks, while considering potential installation and maintenance inadequacies (e.g., insufficient dust removal). To prevent generation potential underestimation, regionally adjusted PV output coefficients are applied, assessing the impacts of PV performance conditions on system optimization outcomes.

4. Results and Discussion

4.1. Characterization of the System’s Annual Operating Conditions and Typical Day’s Operation

This study utilizes annual operational datasets from the case energy system during 2019–2020, conducting a comprehensive analysis of energy supply characteristics. The research specifically examines temporal load characteristics and distribution patterns across operational modes, with semi-quantitative evaluation of subsystem coordination. Representative diurnal patterns are identified through clustering analysis, establishing reference benchmarks for comparative optimization studies.

4.1.1. Overview of the Overall Energy Supply in a Typical Operating Year

The energy station’s multi-energy supply comprises time-segmented electricity, heat, and cooling outputs recorded between November 2019 and November 2020. Cooling and heating outputs are derived from supply-return water thermal measurements. Given the energy station’s exclusive responsibility for district thermal services, its electricity output is solely utilized to meet partial demands of ancillary systems (water treatment and air compressors) and non-energy building facilities. Additionally, power consumption for core energy equipment and water circulation auxiliaries is operationally coupled with thermal service delivery, classified as internal system consumption, and excluded from external electricity demand requirements.
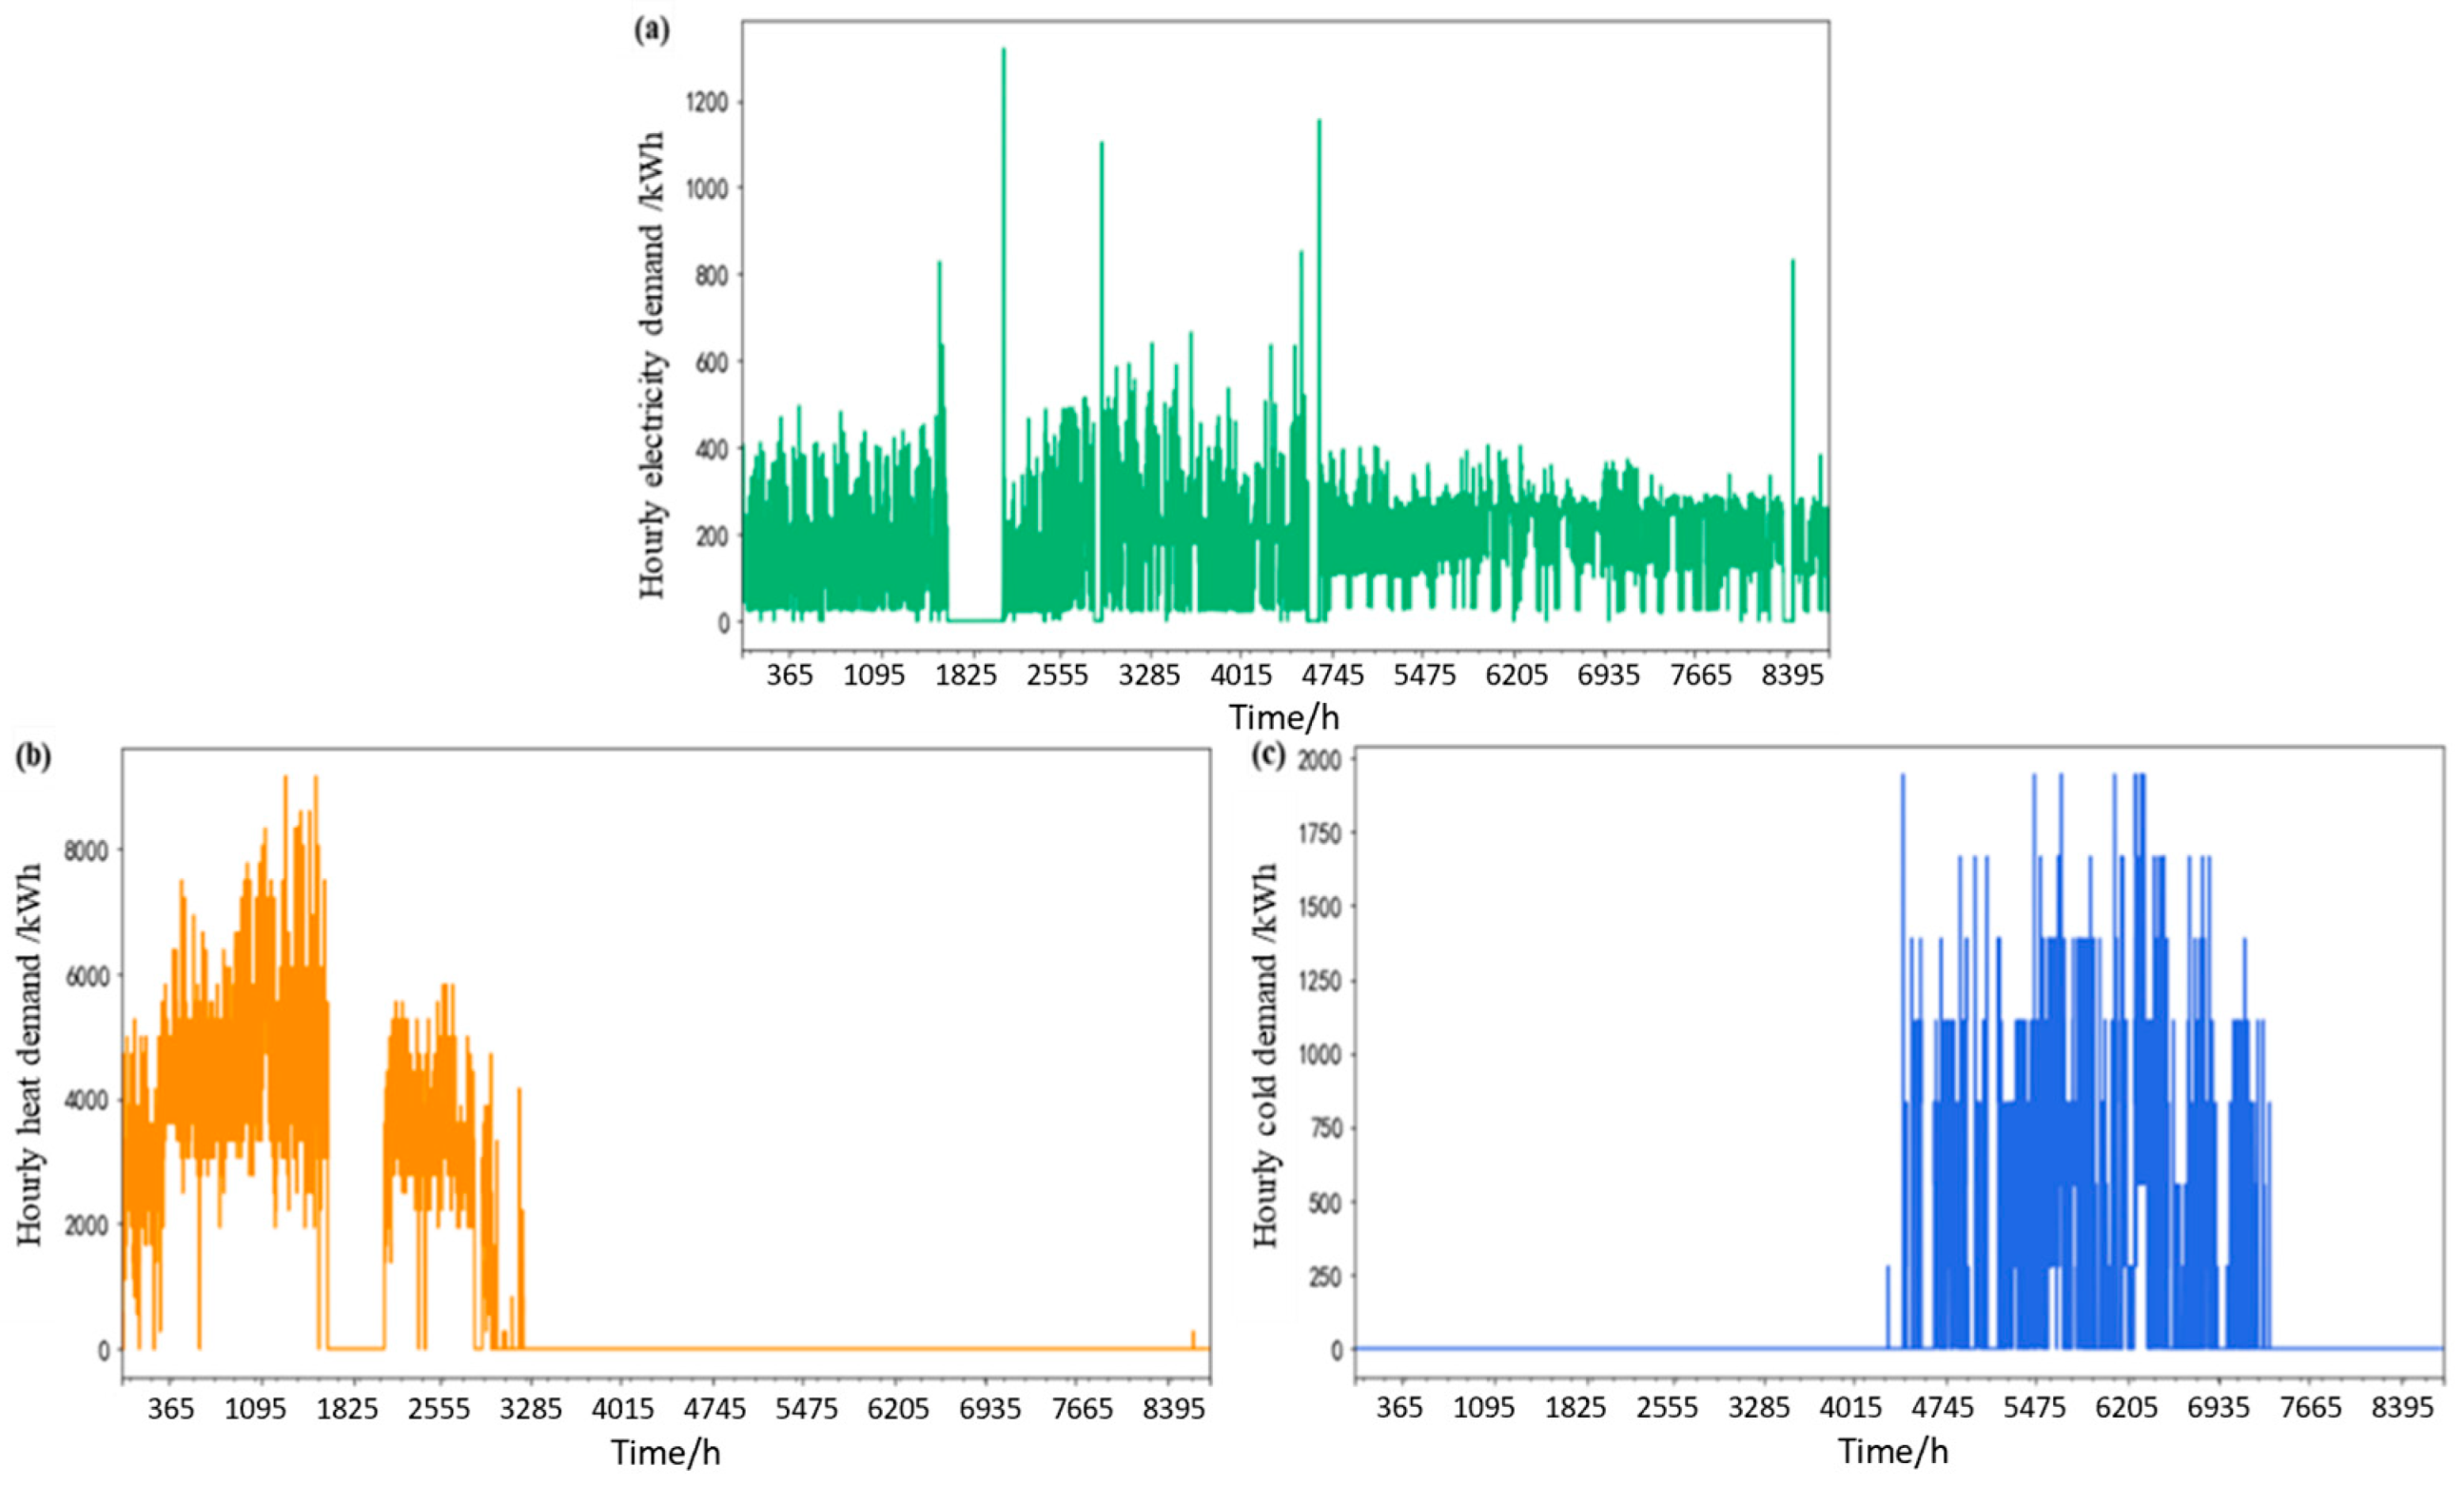
Under the specified conditions, the hourly electricity, heating, and cooling supply profiles of the case energy system throughout the year are presented in Figure 3. The figure reveals that electricity demand exhibits relatively uniform distribution throughout the year. In constrast heating demand is predominantly concentrated from mid-November to late March, and cooling demand mainly occurs between mid-May and mid-September. The original data indicate median hourly loads of 180.21 kWh (electricity), 3611.14 kWh (heating), and 277.78 kWh (cooling), with corresponding peak values reaching 1319.45 kWh, 9166.74 kWh, and 1944.46 kWh, respectively.
The integrated analysis of equipment parameters and data validity identified anomalous peaks at cumulative quantity step-change points and abrupt discontinuities (unrecorded data points) that deviated from equipment nominal specifications in the original dataset. These anomalous dates were processed as outliers in subsequent clustering analyses. Seasonal multi-parameter clustering was then performed using the remaining valid daily sampling data. For annual performance aggregation, piecewise interpolation was implemented by evaluating the similarity between valid intra-day segments of anomalous dates and environmental/energy supply profiles of valid typical days, combined with cumulative reference values at anomaly period boundaries. This methodology ensures annual energy supply totals remain within acceptable error thresholds, with anomalous days subsequently assigned equivalent corrected days according to clustered patterns.

4.1.2. Analysis of the Distribution of Multi-Energy Demand by Season

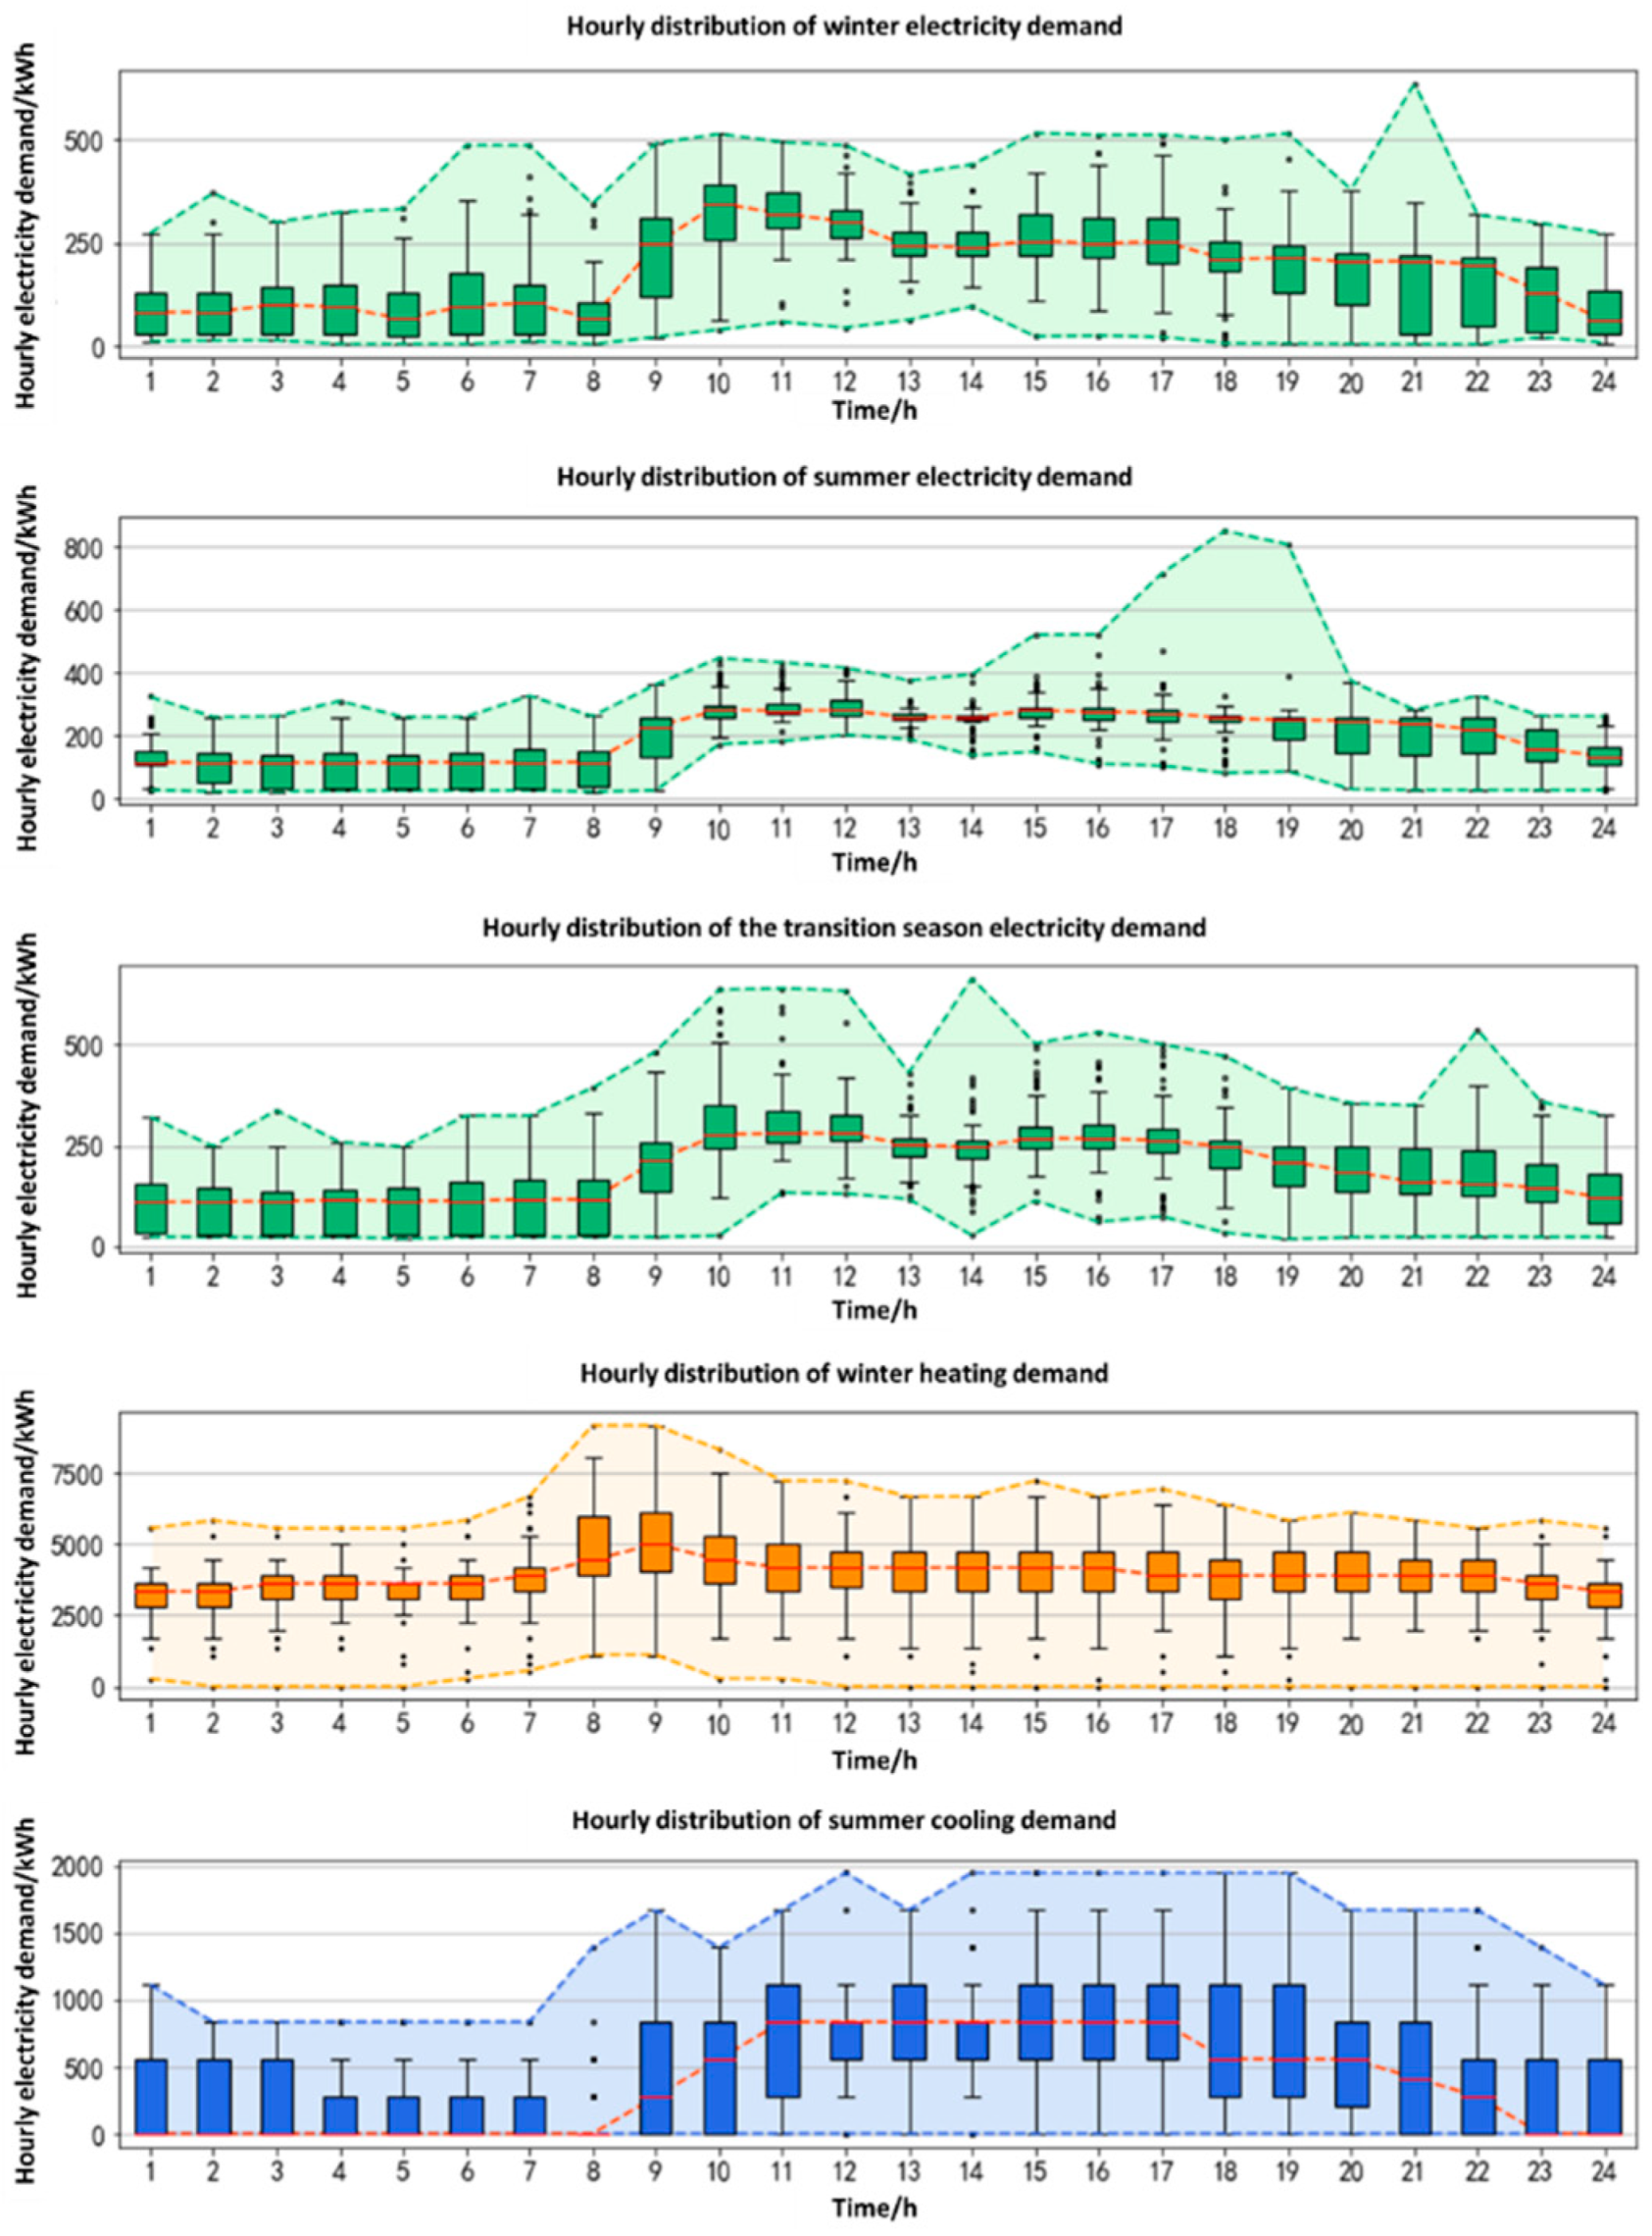
Figure 4 presents the hourly cooling, heating, and electricity demand profiles required by the energy system across different supply seasons. The shaded background bands delineate valid statistical distribution ranges with sampling outliers excluded. Data points deemed statistically insignificant through outlier analysis are omitted from the visual representation.
Horizontal red dashed lines spanning the box plots denote median values of energy demands, while the boxes themselves encapsulate the interquartile range (IQR) representing the central 50% of data distribution. Observations beyond the whiskers of box plots are identified as statistical outliers. These points reflect rare distribution extremities rather than actual system anomalies, representing infrequent operational occurrences that exert negligible influence on comprehensive performance evaluation.
The electricity demand profile at the energy station exhibits temporal concentration throughout the year. Daily load variations primarily correlate with compressor operations, showing close alignment with concurrent building facility and water treatment loads (typically within 15% deviation). The load profile synchronizes with production schedules, demonstrating concordance with the park grid’s demand patterns. With gas-fired cogeneration units remaining inactive, grid electricity constitutes the primary supply source. Rooftop photovoltaics provide auxiliary daytime power, but the photovoltaic potential is limited by available roof area. The contribution of photovoltaic power generation to the total supply is less than 10%.
Heating and cooling supply profiles exhibit higher variability across seasons, influenced by operational requirements and ambient temperature fluctuations within the industrial park. The heating season demonstrates marginal diurnal variation (daytime supply 12–18% higher than nighttime). Cooling demand shows pronounced diurnal patterns due to restricted service coverage: 83% of cooling days exhibit null demand between 22:00 and 08:00, with daytime loads exceeding nighttime values by 40–60% on average.

4.1.3. Characterization of Energy Supply and Multi-Equipment Operation on a Typical Day

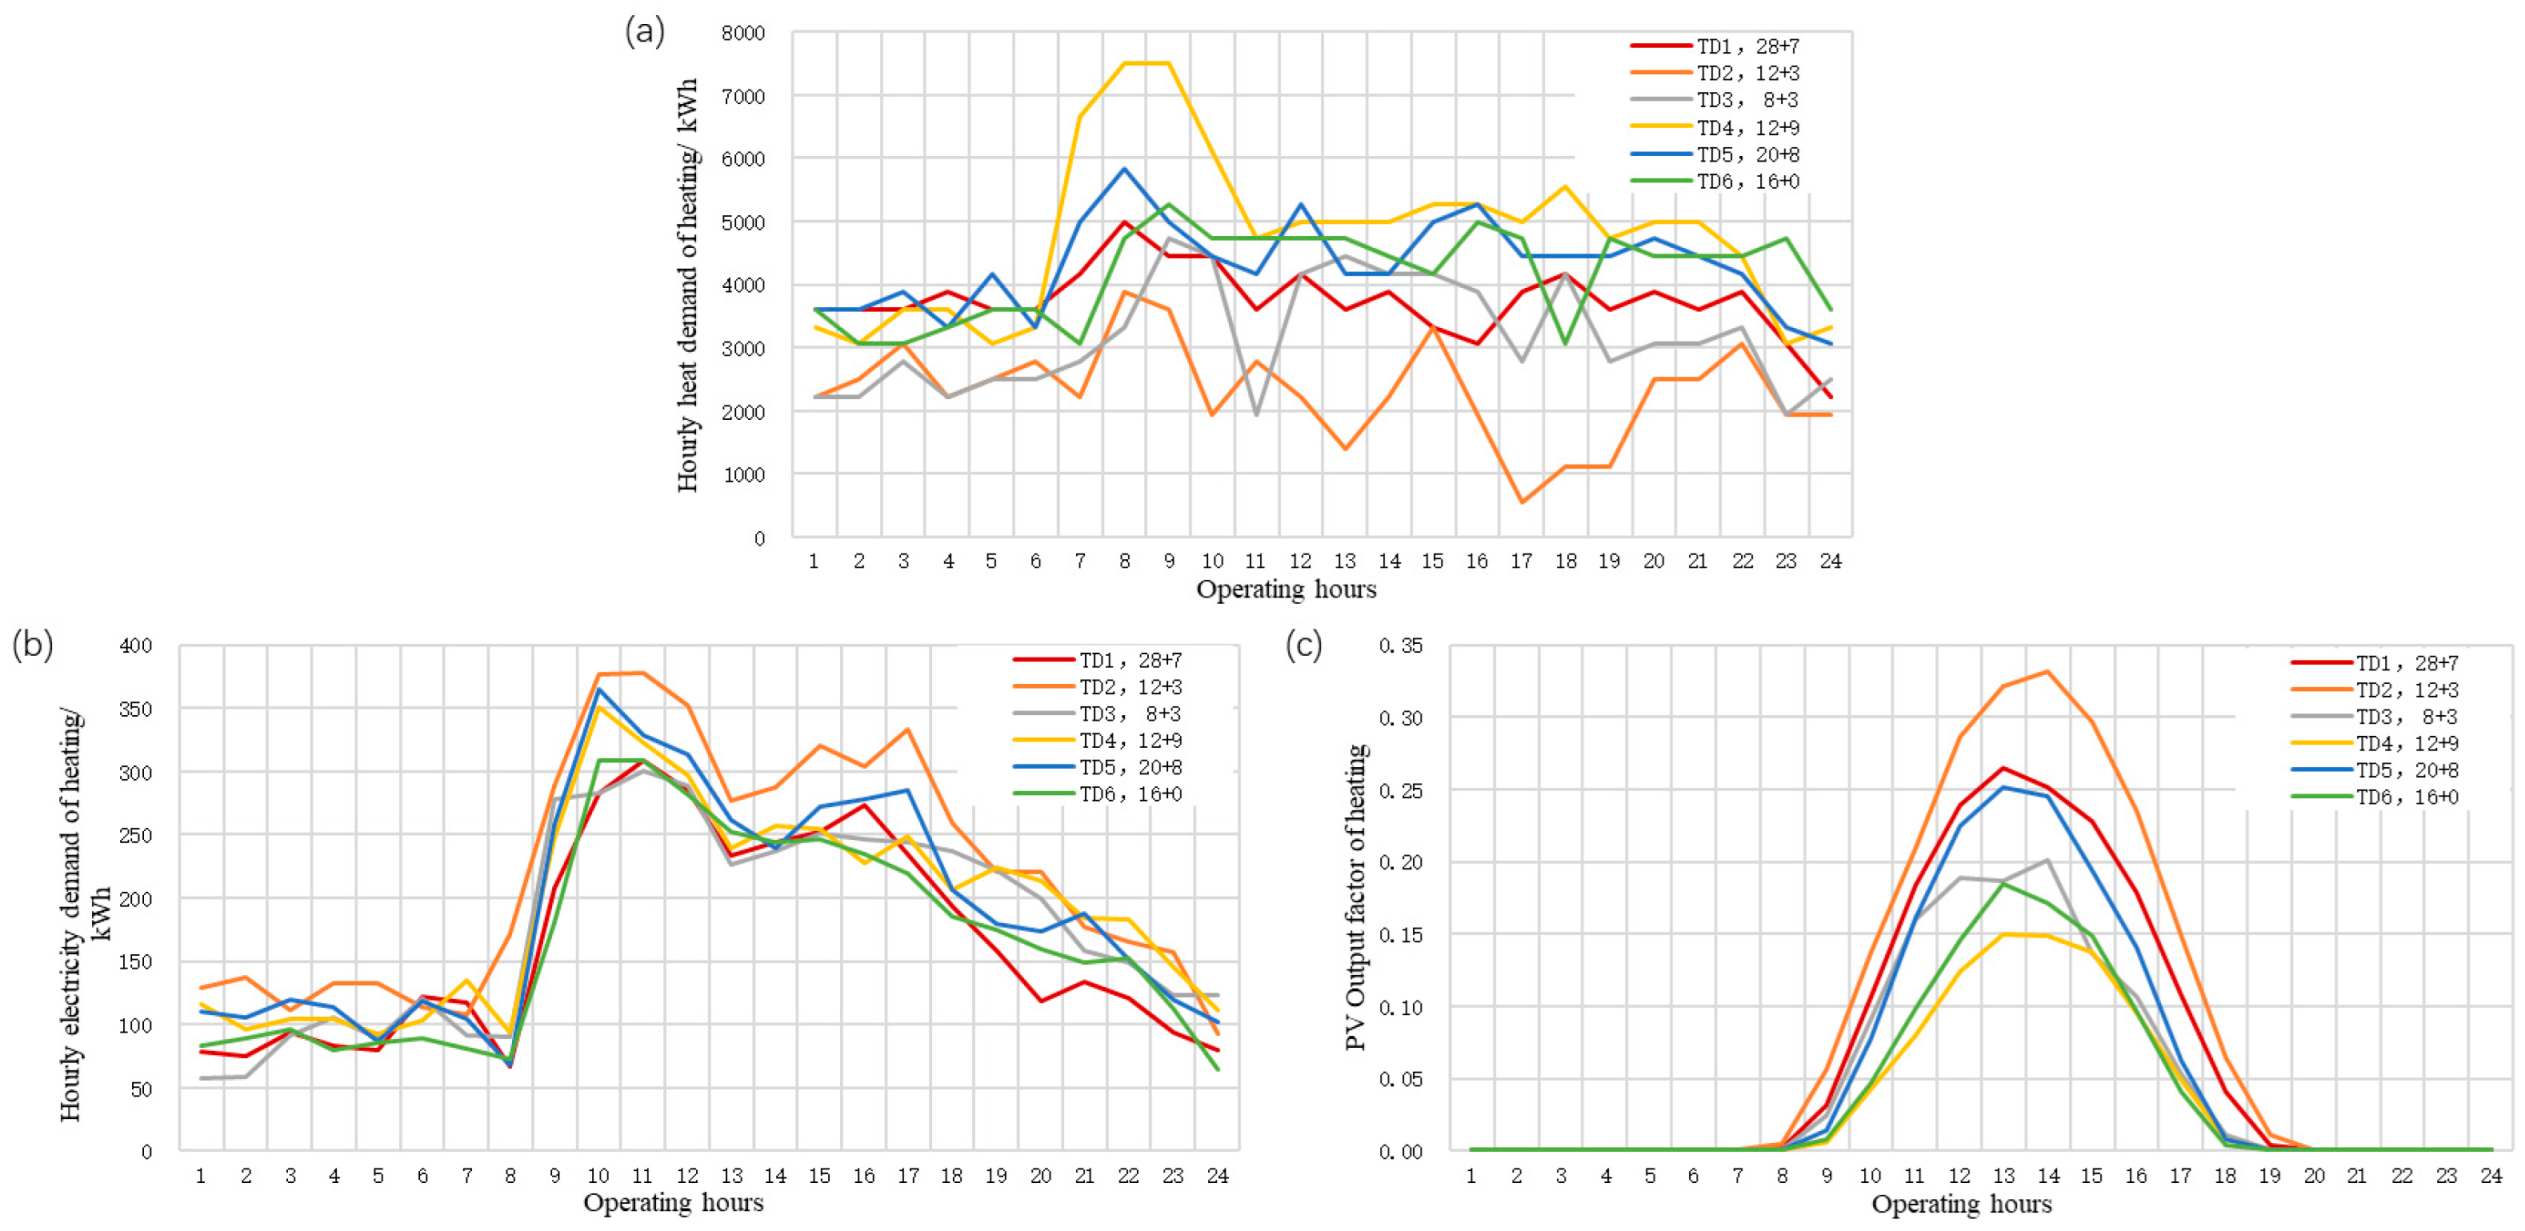
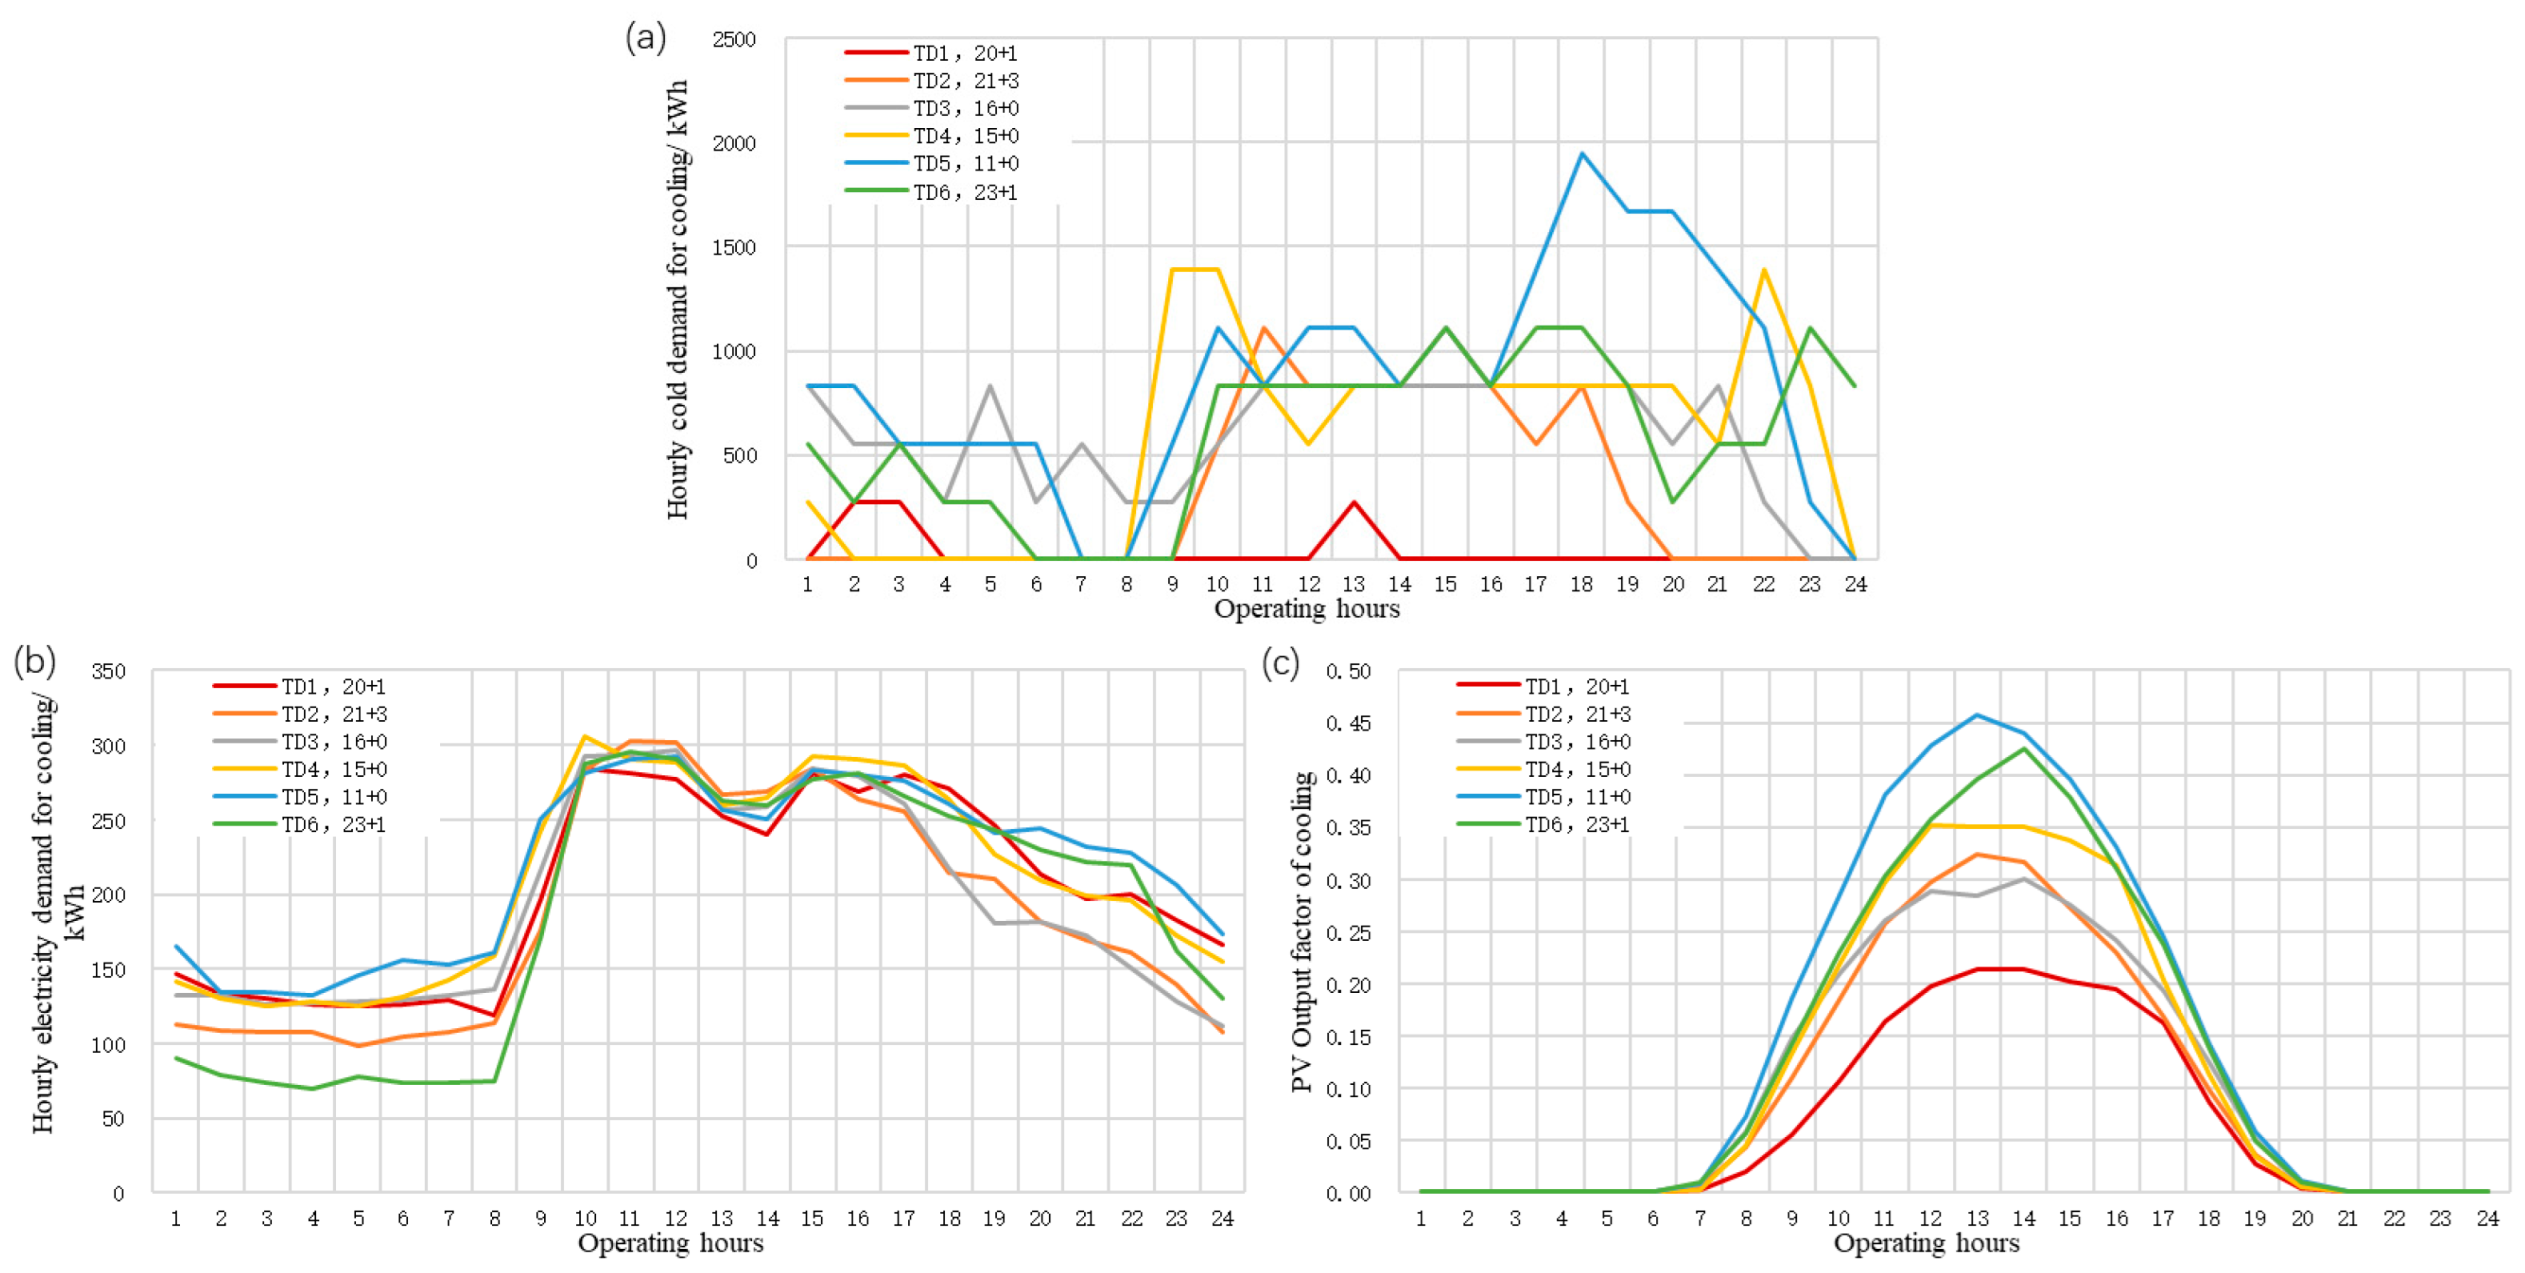
The analysis of intraday correlations among electricity, heating, and cooling demands across consecutive periods was conducted using typical daily clustering. Since the K-Means algorithm is concise, easy to implement, computationally efficient, and has good adaptability [45,46,47], we chose the K-Means algorithm to classify the valid load data according to hourly supply characteristics, generating distinct groups for heating season, cooling season, and transitional season energy supply patterns. Representative days were selected by matching intraday supply profiles with maximum similarity to cluster centroids (group-averaged values). The resultant typical demand characteristics are presented in Figure 5 (heating season), Figure 6 (cooling season), and Figure 7 (transitional season). Figure captions specify that values preceding the “+” symbol represent operational days from valid clustered samples processed by the algorithm, while values following the symbol denote anomaly-corrected days with repaired sampling data.
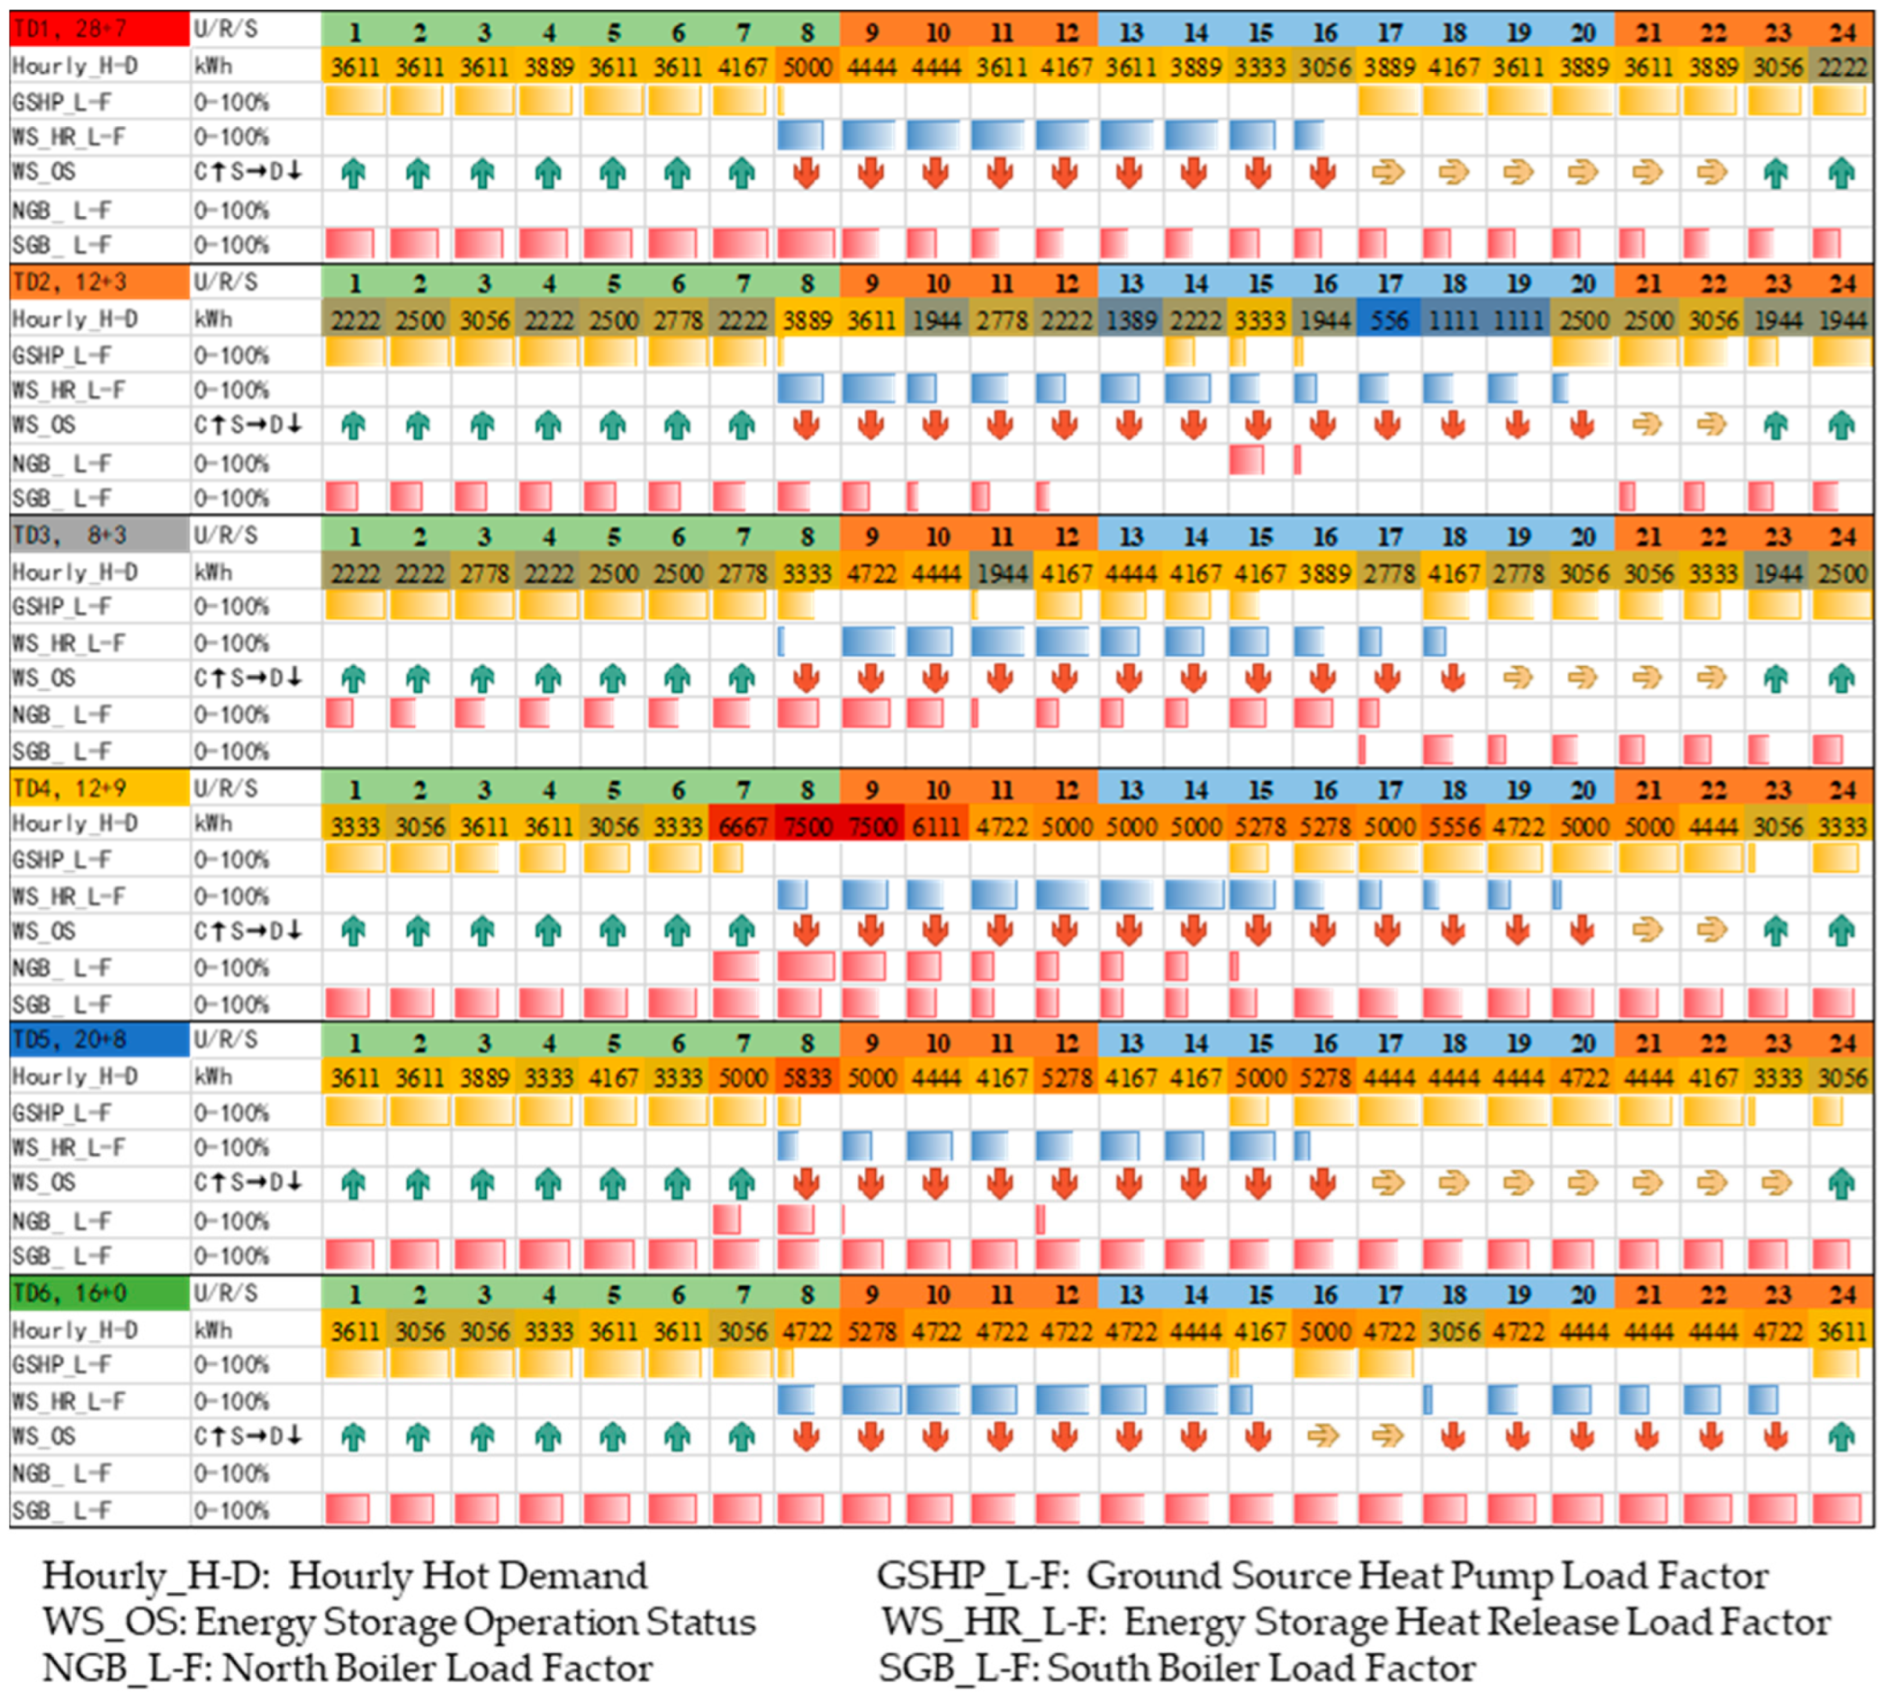
Figure 8 displays a semi-quantitative comparison of heating equipment operation states during typical heating season days, with temporal intervals color-coded: red (peak pricing), green (valley pricing), and blue (flat pricing). The heat demand row applies a red-to-yellow-to-green color gradient to visualize demand levels relative to seasonal data, with red indicating higher demand and green, lower demand. Equipment load ratios derive from comparisons between sampled data and rated conditions. Given data constraints, load levels are qualitatively divided into five 20% load ratio intervals: low, medium-low, medium, medium-high, and high load. Thermal storage states are represented by: ↑ (charging), → (idling with thermal retention), and ↓ (discharging). Non-integer-hour transitions allow multi-state occurrences within time bins. Charging states take display priority, with discharge modes identifiable through discharge load ratio analysis.
Typical day 1, representing the predominant operational pattern in heating season, exhibited median-range thermal demand with stable load distribution across periods. Maximum thermal demand occurred during standard operational commencement periods, with nighttime periods exhibiting the lowest demand levels. Intermediate periods remained at median demand ranges. Nighttime demand across multiple periods was entirely satisfied by a single boiler operating with load ratios modulated between medium and high levels. Simultaneously, ground source heat pumps operated at high capacity, integrated with thermal storage systems to optimize off-peak electricity utilization for heat storage. Evening operational periods involved high-capacity heat pump operation coordinated with boilers for direct heat supply. Water thermal storage systems discharged energy solely during daylight hours, primarily operating at high load levels. Heat pump operations were suspended during peak electricity pricing intervals. All operational patterns corresponded with established energy station dispatch strategies.
Typical heating day 2 demonstrated minimal aggregate heat demand accompanied by substantial peak-valley variations. Maximum demand aligned with operational commencement periods, and minimum demand manifested during evening transition periods, with secondary demand peaks observed in the afternoon and nighttime intervals. Ground source heat pump and thermal storage system maintained equivalent charging schedules to typical day 1. High-load operation predominated throughout most charging periods. Extended discharge operation coincided with low total demand and pronounced hourly variations. Discharge load ratios fluctuated between medium-low and high operational levels. During standard electricity pricing periods, the heat pump operated at low-to-medium load levels. Two boilers maintained low-medium load ratios during separate operational intervals.
The overall heat demand on typical day 3, which had the lowest specific gravity heating, was higher than on typical day 2 and lower than on the remaining typical days. Heat demand fluctuated more in the morning, with secondary peaks at midday and in the evening, respectively. Heat demand was higher during the rest of the day than at night, except for the all-day trough at midday. Ground source heat pumps operated for the highest number of hours during the day, still operated during peak tariff hours, operated briefly or at low loads during some hours, and operated at load factors above the mid to high range during more operating hours, with coupled heat storage operating at high load factors during all hours. The heat storage system fluctuated greatly in the daytime energy release load rate. In the evening hours of the day, both boilers operated at low load rates during the switching heating hours, and the boiler load rates were no higher than mid-range during more than 60% of the hours.
Typical day 4, which had the highest overall heat demand, had a much higher peak than the rest of the typical days. The operation of the water storage system was similar to typical day 2, but the load factor of the ground source heat pump during the storage period was lower than that of typical day 1. Typical day 4 was also the typical day with the highest heat release from water storage system and boiler utilization, with the two boilers maintaining a high load factor in the morning, and then reducing their loads in tandem until one of the boilers was shut down in the late afternoon, and all three appliances were used together to provide heat.
Typical heating days 5 and 6, which had moderately high overall heat demand, did not have a significant difference in overall heat demand (only 3.28% of the median for both), but the distribution of time-of-day demand was different, and the mode of equipment co-operation was also significantly different. In typical day 6, the amount and duration of heat release from the heat storage system were higher than in the rest of the typical days, while the utilization of the ground source heat pump was at its lowest level among the typical days. On typical day 5, heat storage utilization was significantly lower than on the rest of the typical days, and ground source heat pump utilization was second only to typical day 3.
In summary, the time-by-time heat demand and equipment operation characteristics of each typical day were different, which is generally in line with the synergistic energy supply model, but there are still unreasonable optimization points to be made. For example, on typical day 2, during the afternoon leveling time, both the ground source heat pump and the boiler were running at low loads, and at this time, the heat demand could have been fully satisfied by either of the two pieces of equipment, which would avoid the frequent starting and stopping of the equipment. Also reducing the number of starts and stops at too low a load rate was part of typical day 5. On some typical days, the ground source heat pump could have had further load shedding or even been shut down during the nighttime peak tariff hours to reduce the cost of electricity. Specific improved operation options are further discussed in the optimization analysis.
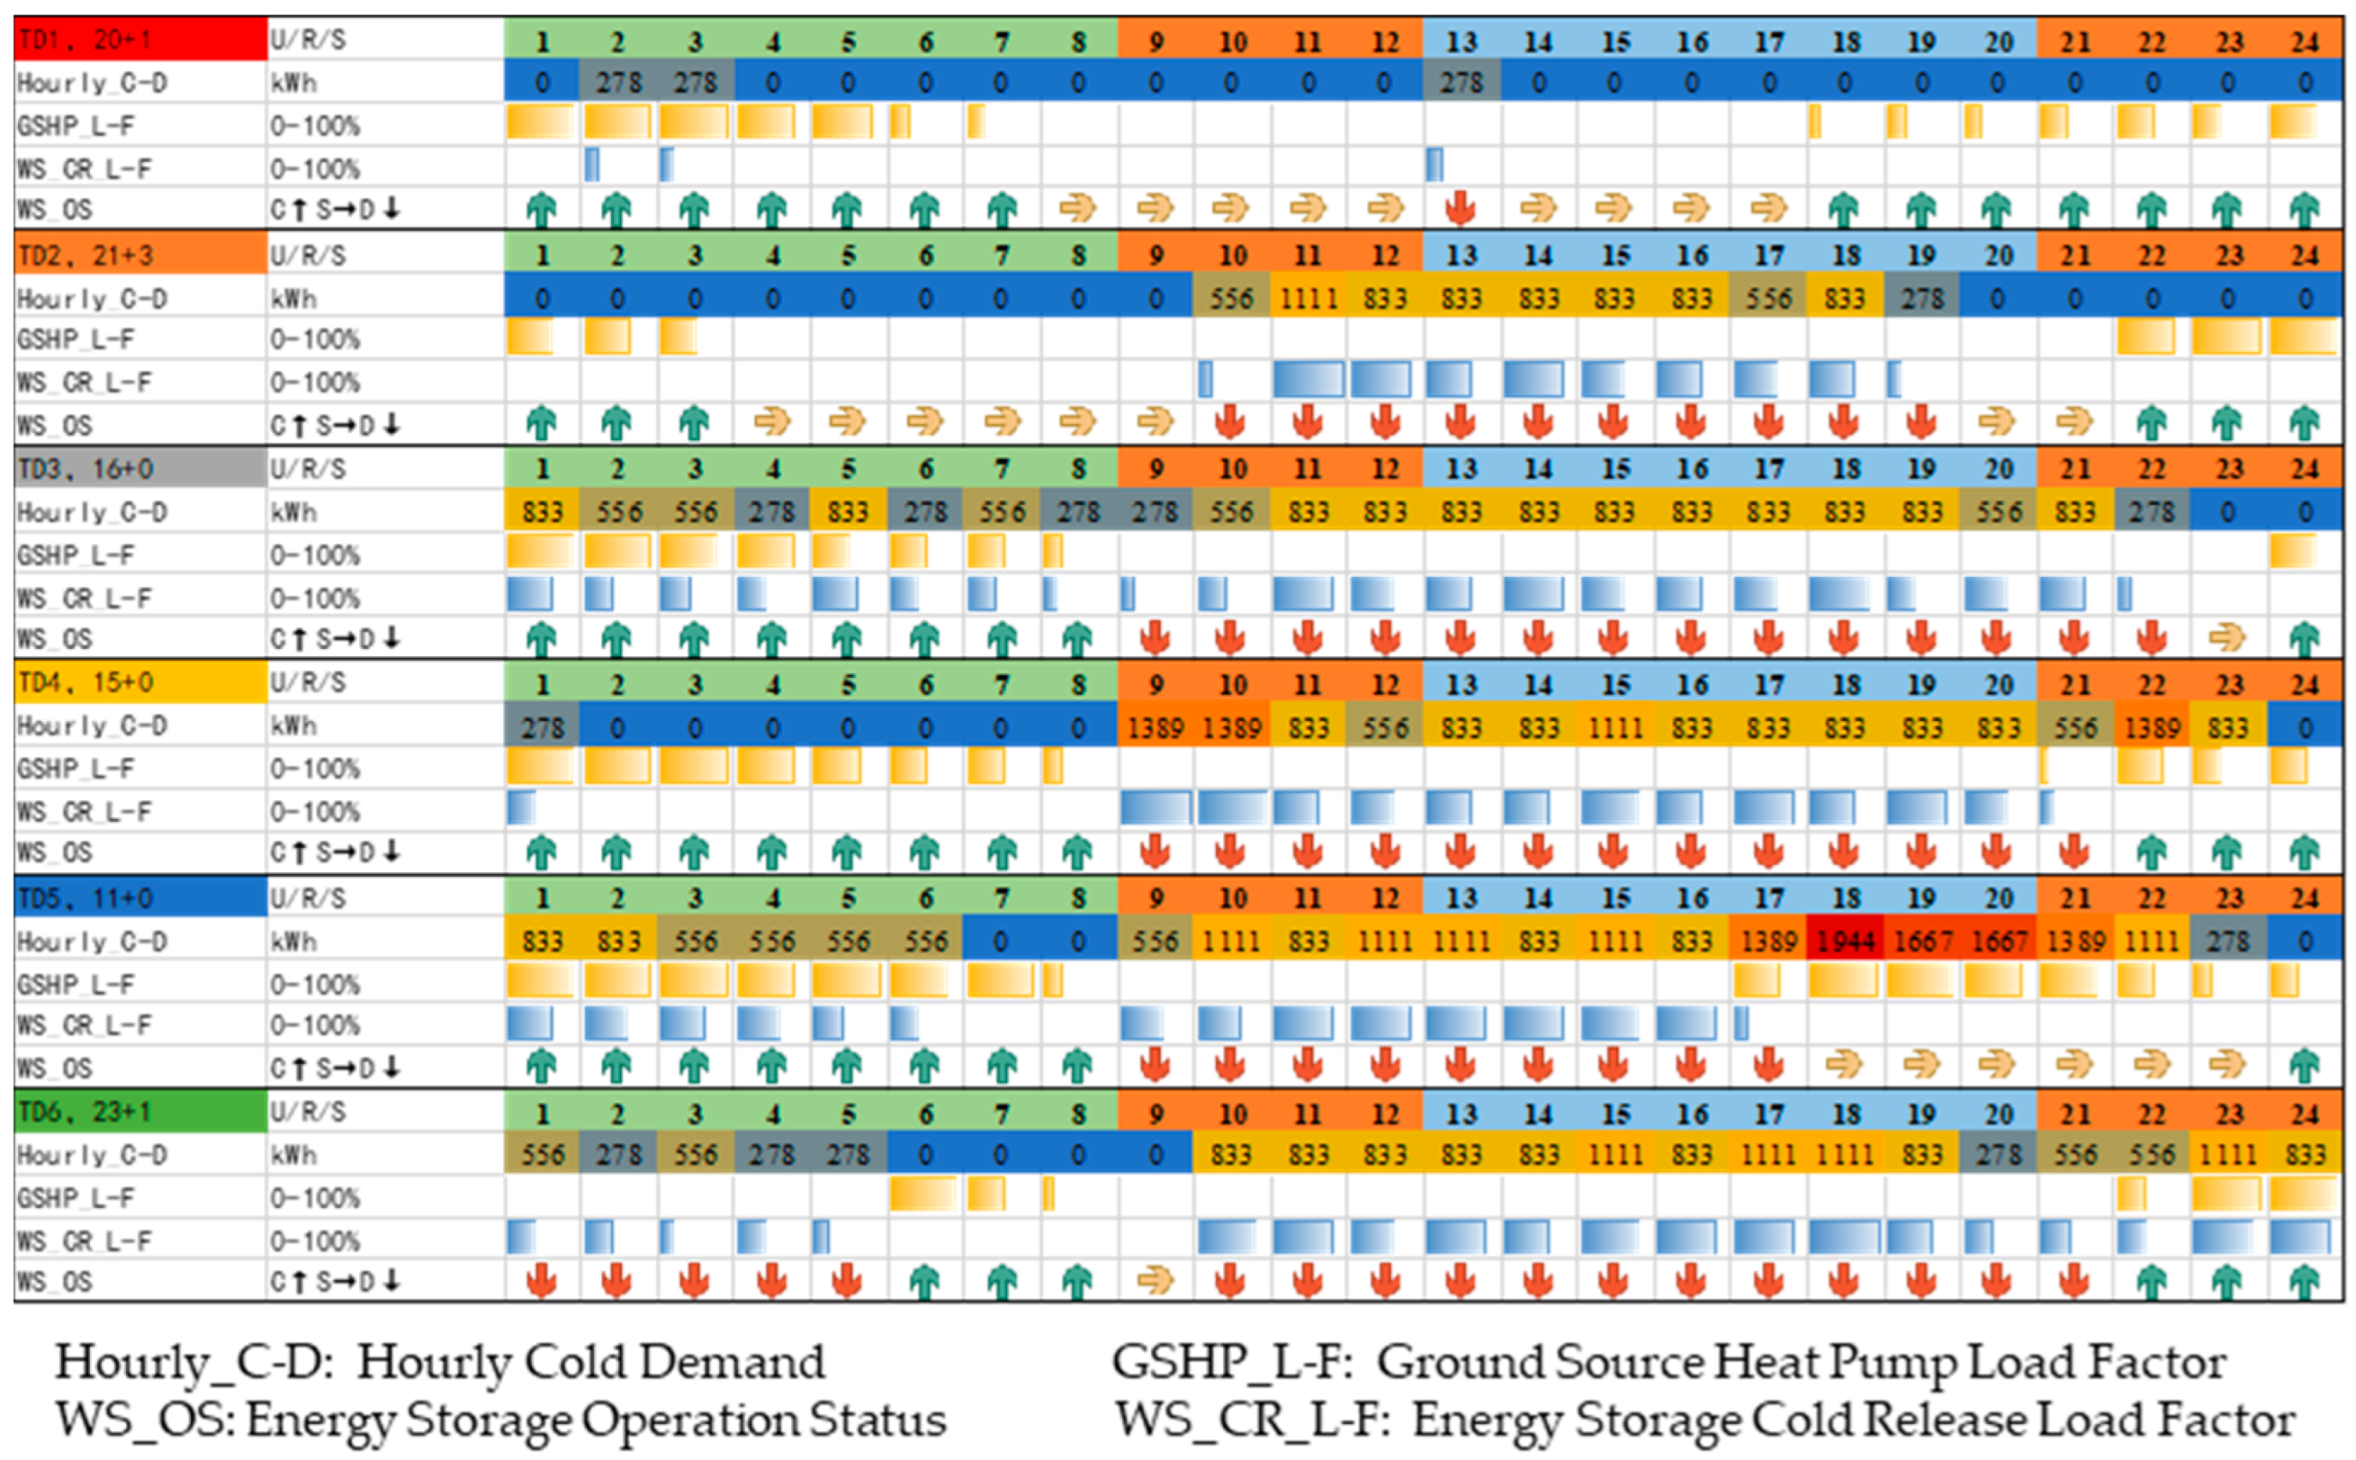
A semi-quantitative comparison of the synergistic operation status of the equipment for each typical day of the cooling season is shown in Figure 9, which is illustrated in the same way as Figure 6. Compared to the heating season, the cooling equipment consists of only a ground source heat pump and heat storage, with a relatively simple synergistic operation mode. In terms of data validity, there are more anomalies between the sampling data of single equipment in the cooling season, which may be related to the problem of data simultaneity at each measurement point. For the single equipment anomaly data with abnormal contradictions in the original records which affect the qualitative analysis, the overall energy supply (hourly cold demand), ground source heat pump, and energy storage records are taken as the benchmark in order of priority from high to low, i.e., when the data conflict, the high-priority data are retained and the low-priority data are corrected based on this.. Additionally, days with no energy supply during the cooling season, where all data related to the operation of the energy station and individual equipment show zero or very low values (indicating a suspected disturbance in the measurement data), are classified as transition days. Since only the PV output and the power consumption of non-energy equipment at the station should be considered within the day, the transition days of the cooling season are merged into the transition season, and the corresponding typical days are grouped according to the similarity of the electric loads, and the related days are counted into the number of merged days of the anomalous days of the data in the transition season.
In the cooling season, the differences in the weights (i.e., number of days) of typical days are more minor compared to the heating season. The typical day 1 with the smallest cold demand had only individual hours of cold supply throughout the day and the magnitude is small, the validity of the data is relatively poor, and the bias within the clustering group is significant. However, because of the small magnitude of the hour-by-hour and all-day cold demand in this dataset, it has a limited impact on the assessment of the overall cooling performance of the system. The small amount of cold demand at each moment of the typical day can be satisfied by the energy storage and release of cold temperatures, and the ground source heat pump can operate continuously at night coupled with energy storage and cold storage for subsequent cooling days.
Typical day 2, which had the highest weighting, represents a cooling day when the cold demand was low throughout the day but the difference between the morning and evening demand was more pronounced. Only daytime demand existed and was mainly around the median level, and the daytime demand was fully met by the energy storage and cooling, with the ground source heat pump also running at night, coupled with the energy storage.
The total cold demand on typical days 3, 4, and 6 was close to the median level, but the time-by-time distribution characteristics were different. Typical day 3 had a more balanced distribution of cold demand, with no obvious peaks and valleys, and only part of the nighttime had no cold demand, and half of the day’s cold demand stayed at the highest level of the whole day. Typical day 4 had the same total cold demand as typical day 3, but the peaks and valleys of the day were more obvious, and there was no cold demand during most of the nighttime hours. Peak cooling demand occurred in the morning and evening during the high tariff hours, and peak cooling demand was higher than that of typical days 3 and 6. Typical day 6 had no cooling demand for only part of the nighttime hours, and its cooling hours and peak cooling demand levels were both between those of typical days 3 and 4.
In terms of the equipment operation mode, the cooling demand on the three typical days during the flat tariff hours and the daytime peak tariff hours was fully met by energy storage and cooling, and the ground source heat pump was not operated during these hours. On typical days 3 and 4, the utilization of the ground source heat pump was higher during the valley hours, where the cold demand was fully met by energy storage and cooling during some of the hours, while the ground source heat pump operated at a high load rate to store cold. The above characteristics are related to the current system operation set up where there is no real-time diversion of the ground source heat pump output, i.e., when the ground source heat pump cold output is greater than the cooling demand, it operates only in the heat-pump–energy-storage–cooling cascade mode. In contrast, on typical day 6, the ground source heat pump operated only during some of the tariff trough hours, which was associated with a higher level of cold storage at the end of the previous day.
On typical day 5, which had a smaller specific gravity and the highest cold demand, both the total cold demand and the peak cold demand throughout the day were significantly higher than on the remaining typical days. In terms of equipment operation patterns, the utilization of the ground source heat pump was significantly higher on this day than on the rest of the typical days, but the total amount of cold released from storage was not as high as on typical day 6, which was related to the decrease in the amount of stored cold after a long period of cold release on the previous day.
In summary, the ground source heat pumps were operated coupled to energy storage and cold storage during the nighttime tariff trough during each typical cooling day. The cold demand during the peak daytime tariff hours was fully satisfied by energy storage and cooling. Cold storage and release could satisfy the cold demand during most of the typical daytime tariff hours, but when the cold demand was high, the ground source heat pumps still needed to operate in the tariff hours to satisfy part or all of the cold demand. There is still significant room for optimization of the above operation modes. Suppose ground source heat pumps are still operated during the nighttime peak tariff hours of the typical days mentioned above, given that the load rate and operating hours of ground source heat pumps do not reach the maximum during the low tariff hours of the day. In that case, the proportion of heat pumps operating in the nighttime peak tariff hours, when the cost of electricity for cold storage is highest, may be reduced significantly under the condition of a reasonable prediction of the weather conditions of the day after the next.
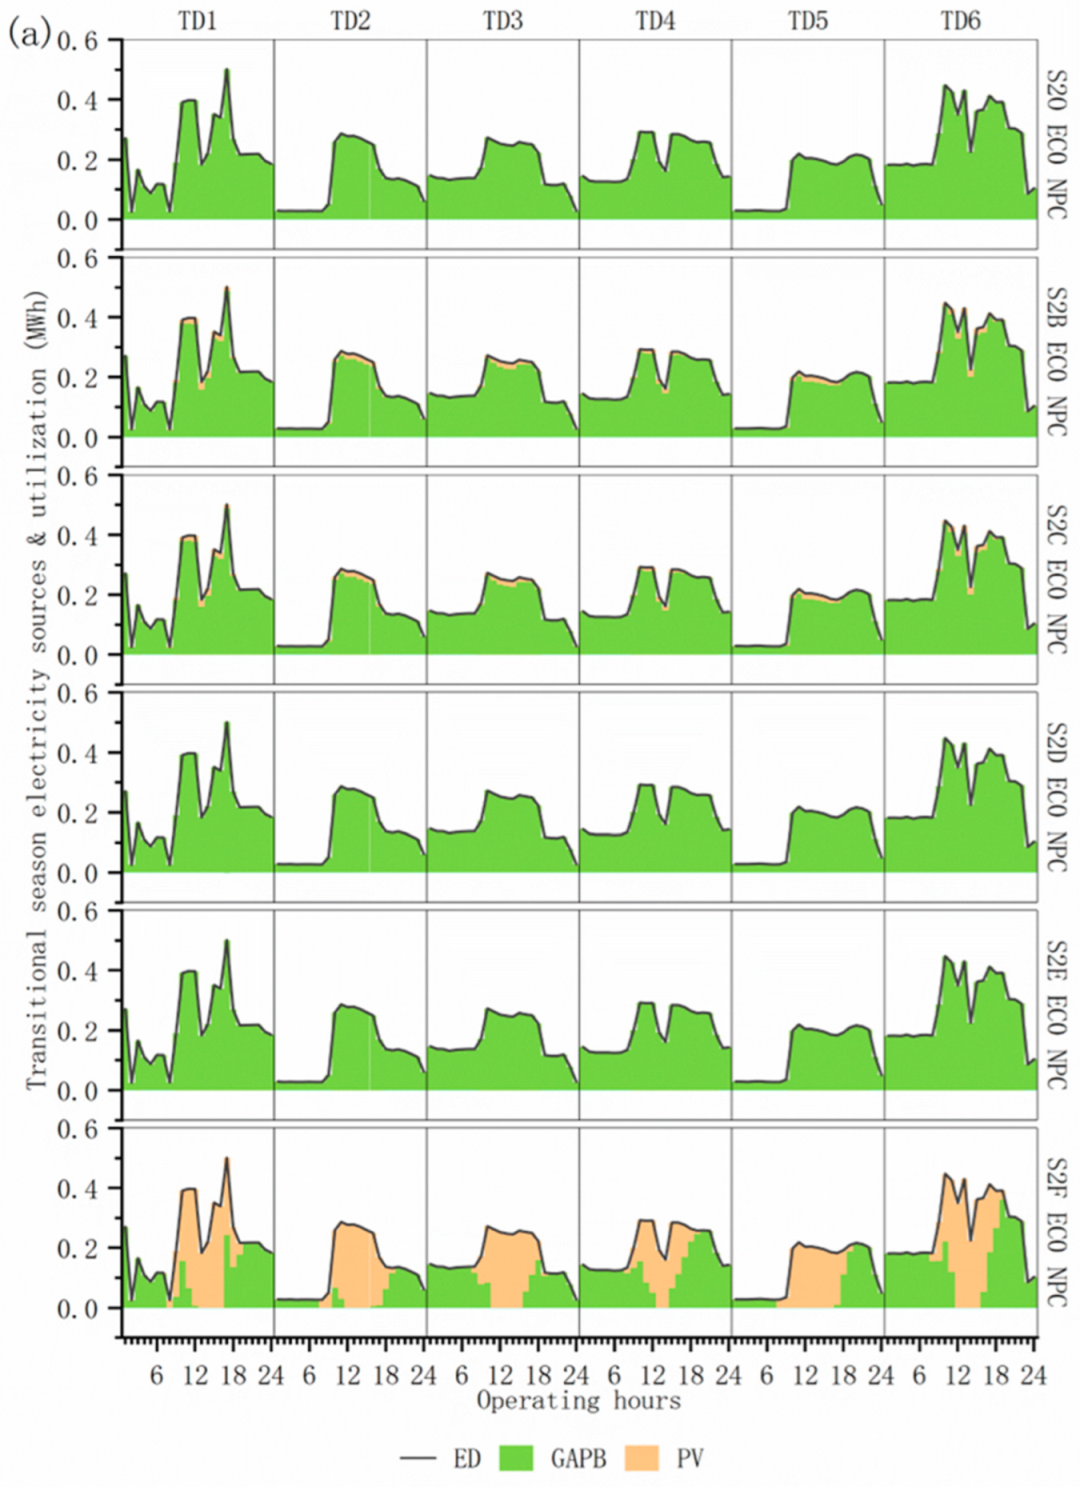
The results of clustering electricity demand on a typical day of the transition season are shown in Figure 7. All daytime electricity demand is generally higher than nighttime demand, and there is a relative trough period during the midday hours. The peak-to-valley difference in electricity demand is basically consistent with the production and living conditions in the park. The time-by-time PV output is related to daily solar irradiation changes throughout the day, and the distribution pattern is basically the same in all seasons. The overall level of PV output during the transition season is between the heating and cooling seasons and is related to seasonal climatic conditions.
According to the annual PV output record of the current project, there were only about 705.63 converted annual power generation hours, which is significantly lower than the regional average of 1029.41. This may be related to the poor installation and maintenance conditions of the PV system. The effect of low PV output on the optimized system performance is further discussed in the subsequent optimization comparison.

4.2. Optimization of Multi-Scenario Operating Scenarios with Differences in Equipment Usage Conditions

This section analyzes the energy-saving and emission reduction potential of the current system, exploring differences in its operation under various equipment usage limitations and distribution access conditions.It compares the multi-objective optimization performance of the energy system across multiple operation scenarios. It provides suggestions for operational improvements by combining existing problems in the current energy station operation mode.

4.2.1. Multi-Run Optimization Scenario Optimization Performance Analysis

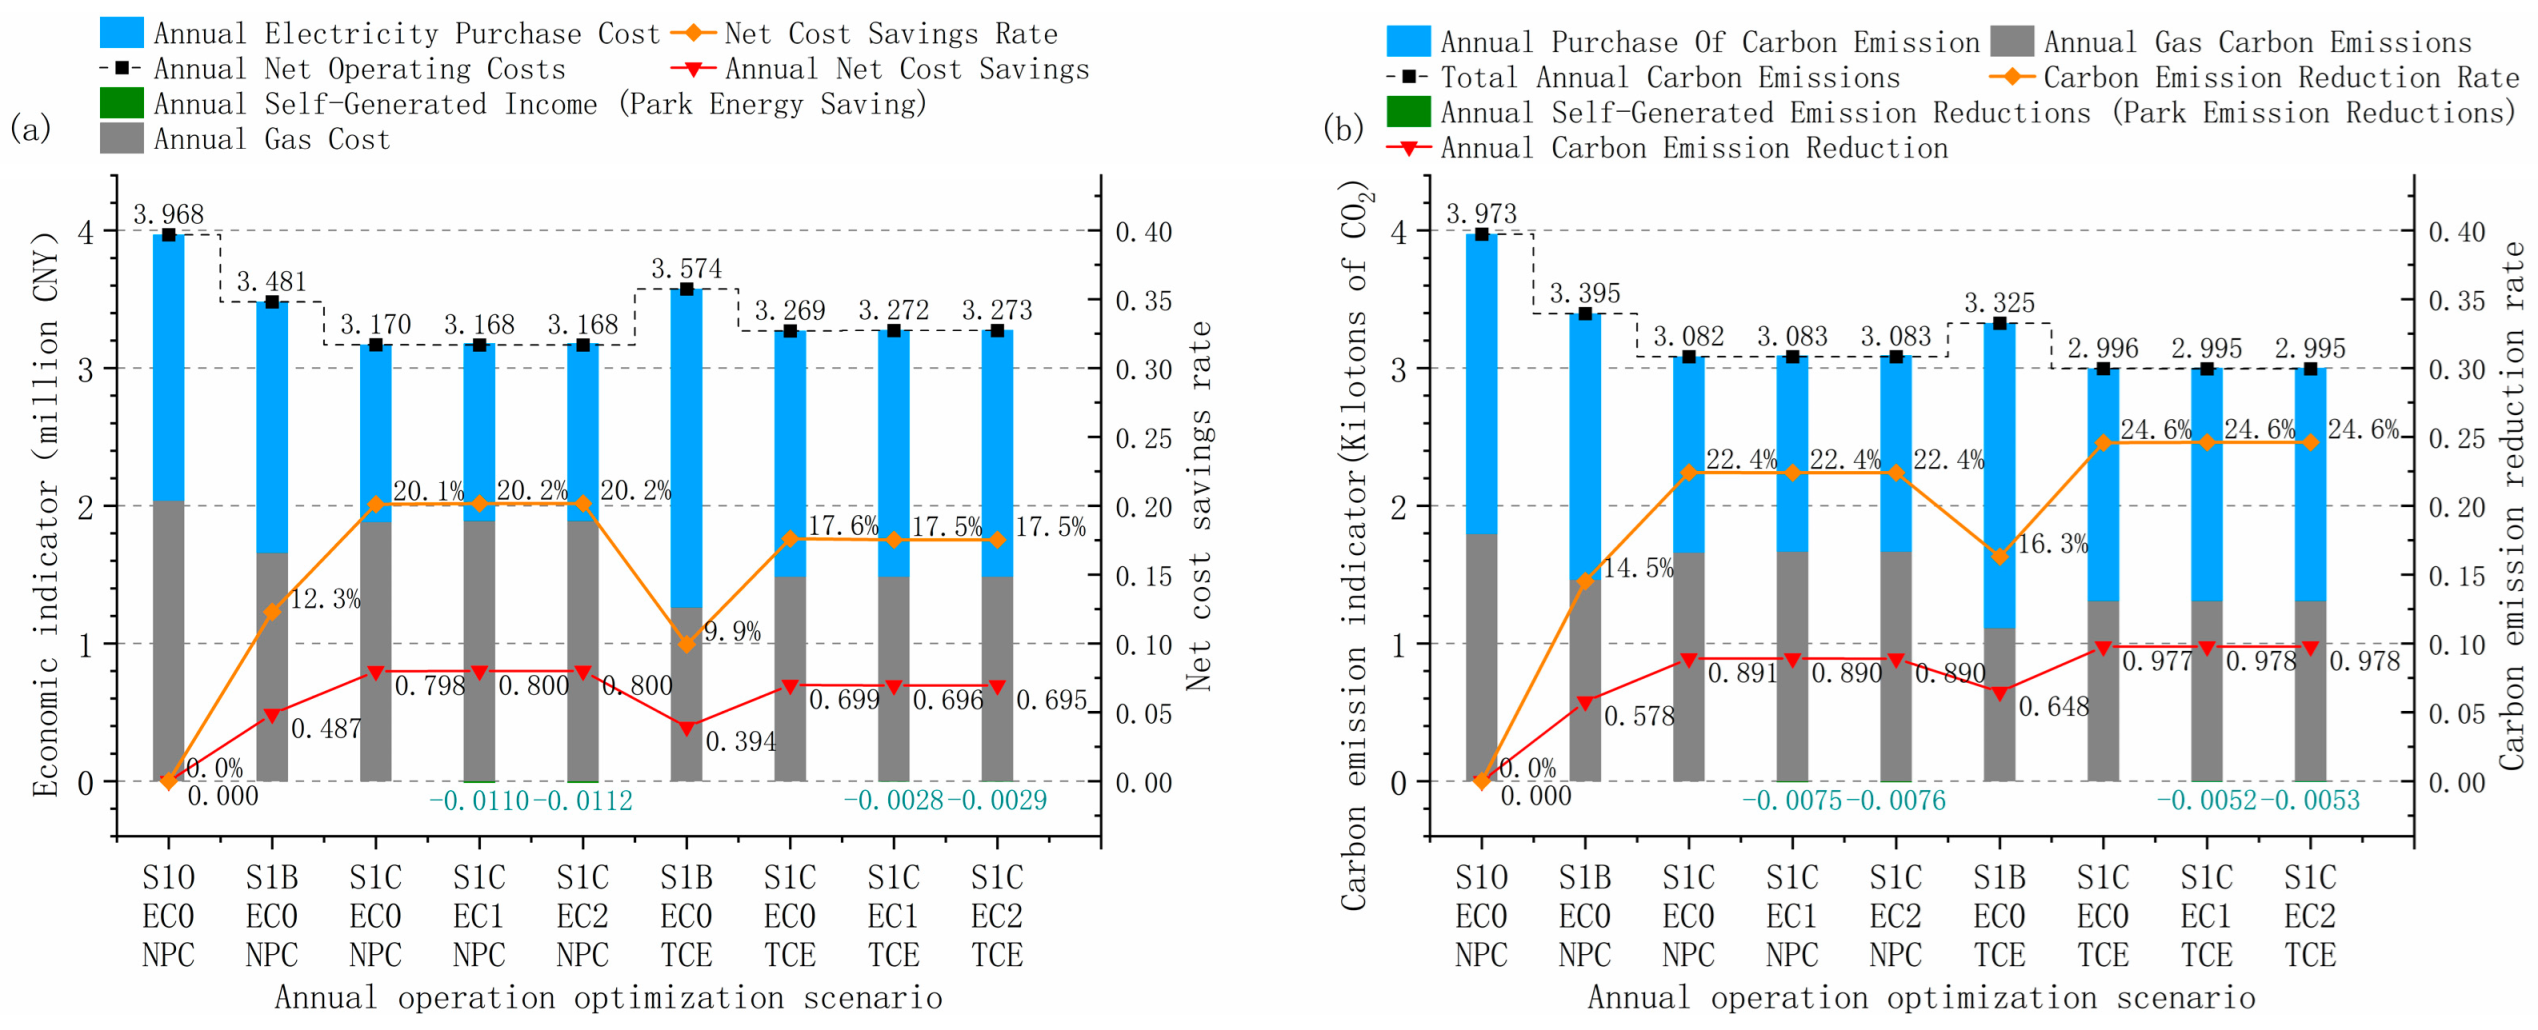
Based on the operational optimization of the energy system under the current equipment installation conditions, the differences in the annual operating costs and carbon emission levels of the system under different scenarios without gas-fired triple-heating (S1B) and with the assumption that the combustion engine-absorption heat pump unit will be enabled to participate in the supply of energy in the heat-to-electricity mode after the equipment is upgraded (S1C) are shown in Figure 10. The optimized operation scenario (S1O) using boilers with conventional central air-conditioning units for energy supply is used as the baseline to calculate the energy-saving and emission reduction potential of different optimized operation modes, where EC0, EC1, and EC2 represent different campus heating and distribution synergistic optimized operation scenarios, and the values 0 to 2 are the ratio of the synergistic distribution grid electrical load to the energy station’s building electrical load, representing different regional distribution grid load levels. In order to compare the co-optimization scenarios at the same system baseline level, the co-optimized energy station and the regional distribution grid are considered as two coupled systems. The former is considered as the central system. The utility cost savings and equivalent carbon emission reductions in the regional distribution grid under the co-optimization mode are regarded as the system’s energy-saving and emission reduction benefits, as evaluated from the central system’s perspective.
As shown in the figure, the system has good energy-saving and emission reduction performance in different operation modes. By comparison, the gas-fired cogeneration system contributes to the economy and emission reduction performance of the system, and the system under S1B scenario can achieve an annual energy cost reduction of more than CNY 487,000, corresponding to an annual average equivalent carbon dioxide emission reduction of about 578 tons, compared with the conventional system (S1O) under the economically optimal operation mode (NPC). Under the maximum carbon reduction operation mode (TCE), the system can achieve an annual equivalent CO2 emission reduction of about 648 tons, while the annual energy cost saving is close to CNY 394,000.
Comparing the performance difference between the S1B and S1C scenarios, the system still has an enormous potential for energy saving and emission reduction to be tapped under the current conditions of equipment use. Since the system is not connected to the grid, the self-generated electricity from the energy station is only used in the building where the energy station is located (EC0 scenario) or in the park’s distribution grid, which is operated in coordination (EC1 and EC2 scenarios). In the S1C scenario, the comprehensive performance of the system is correlated with the load level of the distribution grid, but due to the current low-capacity configuration of the gas generator, the impact of the regional distribution grid’s electric load level on the system is not apparent. As shown in Figure 10b, the economic and emission reduction performance of the system is maximized when the distribution grid load level is only twice the electrical load of the building where the energy station is located (EC2). In the economically optimal S2C EC2 scenario, the annual energy cost savings of the system are more than CNY 800,000. In contrast, the average annual carbon emission reduction is more than 890 tons, which is significantly better than the economically optimal S1C scenario. In the optimal carbon emission reduction plan of the S2C EC2 scenario, the system reduces carbon emissions by 977 tons per year. In contrast, the annual energy cost is reduced by CNY 695,000, which is more than 60% of the energy-saving and emission reduction performance compared with the traditional energy supply mode.
As shown in Figure 11, the energy savings of the system in the S1B scenario compared to the conventional system (S1O) are mainly in gas consumption reduction. Due to the partial replacement of boiler heating by ground source heat pumps, the heating energy efficiency is substantially improved, and gas consumption is reduced. On the other hand, the power consumption of the system is not significantly increased by the large number of ground source heat pumps because the COP of ground source heat pumps is larger than that of traditional air-conditioning units, and with the support of geothermal heat source and industrial waste heat source, the power consumption of heat pumps in both cooling and heating conditions is effectively reduced. In contrast, the gas-fired cogeneration system in the S1C scenario achieves a high integrated efficiency in the gradient utilization of electricity, heat, and cooling, and the system’s self-generated electricity can satisfy part of the heat pump’s electricity needs, especially in non-valley power hours. Asutility power consumption is significantly reduced and gas consumption is increased by only a relatively small amount, the overall energy cost and equivalent carbon emissions are reduced simultaneously.

4.2.2. Energy Supply–Demand Structure Under Multiple Operational Optimization Scenarios

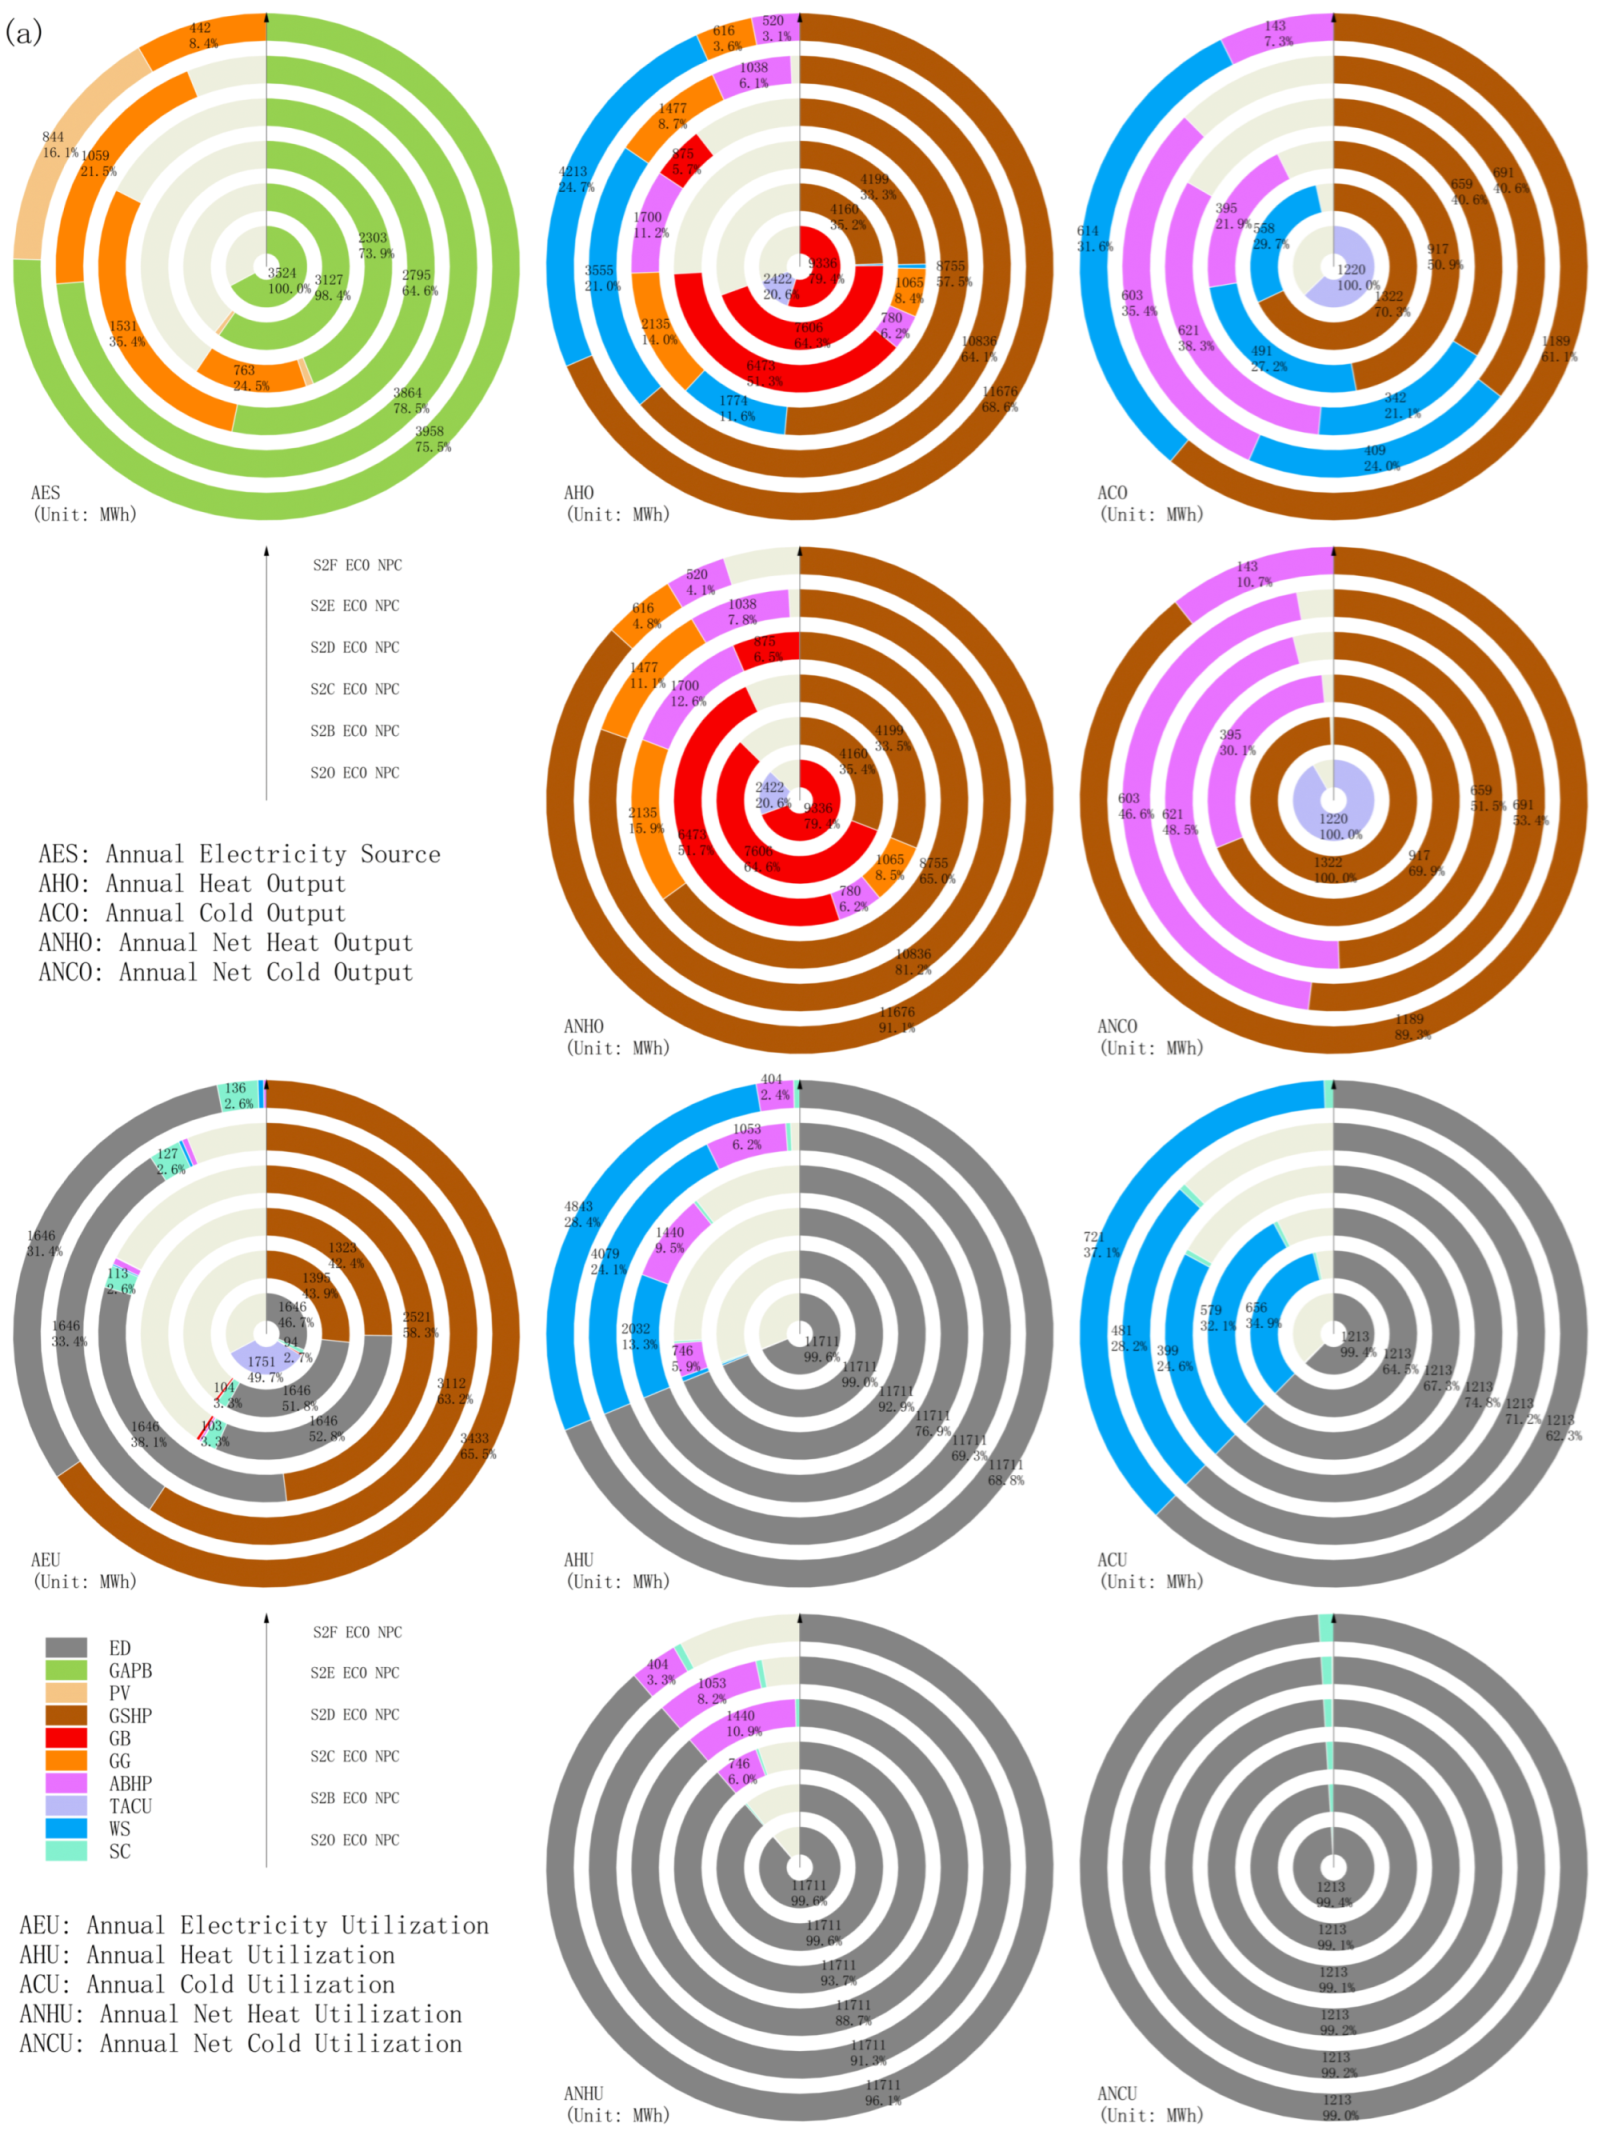
The structural differences in the energy supply–demand of the case study park’s system under various scenarios are illustrated in Figure 12. Analysis of annual energy output distribution reveals significant reductions in overall system power consumption (light gray section) within the electricity supply structure. Given the current low photovoltaic installed capacity, its generated power constitutes merely 1.6% of the system’s annual electricity supply portfolio. The integration of gas-fired power generation demonstrates nearly a one-quarter reduction in grid electricity consumption during operational participation. Regarding power consumption allocation, heat pumps dominate traditional systems with approximately 50% electricity demand, surpassing energy station supply, whereas integrated systems maintain heat pump consumption between 42% and 44%.
Figure 12 presents dual analytical diagrams: the annual thermal energy production/utilization diagram incorporates energy storage discharge/charge cycles, whereas the net production diagram delineates quantitative relationships between thermal output, utilization, and demand excluding storage systems. The thermal production structure demonstrates that ground source heat pumps achieve enhanced output with reduced electrical input, which is attributable not only to superior coefficient of performance (COP) ratings but also thermal source temperature stability—effectively preventing COP degradation observed in conventional air source heat pumps during extreme temperature conditions caused by ambient air temperature fluctuations.
Regarding thermal production and utilization, the S1B operational mode demonstrates comparable total output with S1O. The integration of ground source heat pumps reduces the boiler-dominated heat supply proportion from 79.4% (conventional mode) to 64.6%, while maintaining its primary heating status. The S1C configuration employing gas-fired combined cooling, heat, and power (CCHP) systems further decreases boiler dependency to approximately 50%, concurrently enhancing total thermal output. This surplus energy facilitates absorption heat pump operation and thermal energy storage charging.
The S1C scenario shows that absorption chillers constitute over 30% of annual net cooling production, with the combined cooling, heat, and power (CCHP) system achieving significant waste heat utilization. Comparative analysis reveals thermal storage systems actively function during cooling seasons across scenarios, with dispatched cooling storage approaching half of the total cooling demand. However, during heating seasons, storage discharge constitutes less than 1% of thermal output. This discrepancy correlates with time-dependent equipment coordination in energy supply modes.

4.2.3. Comparative Analysis of Multiple Operational Optimization Scenarios

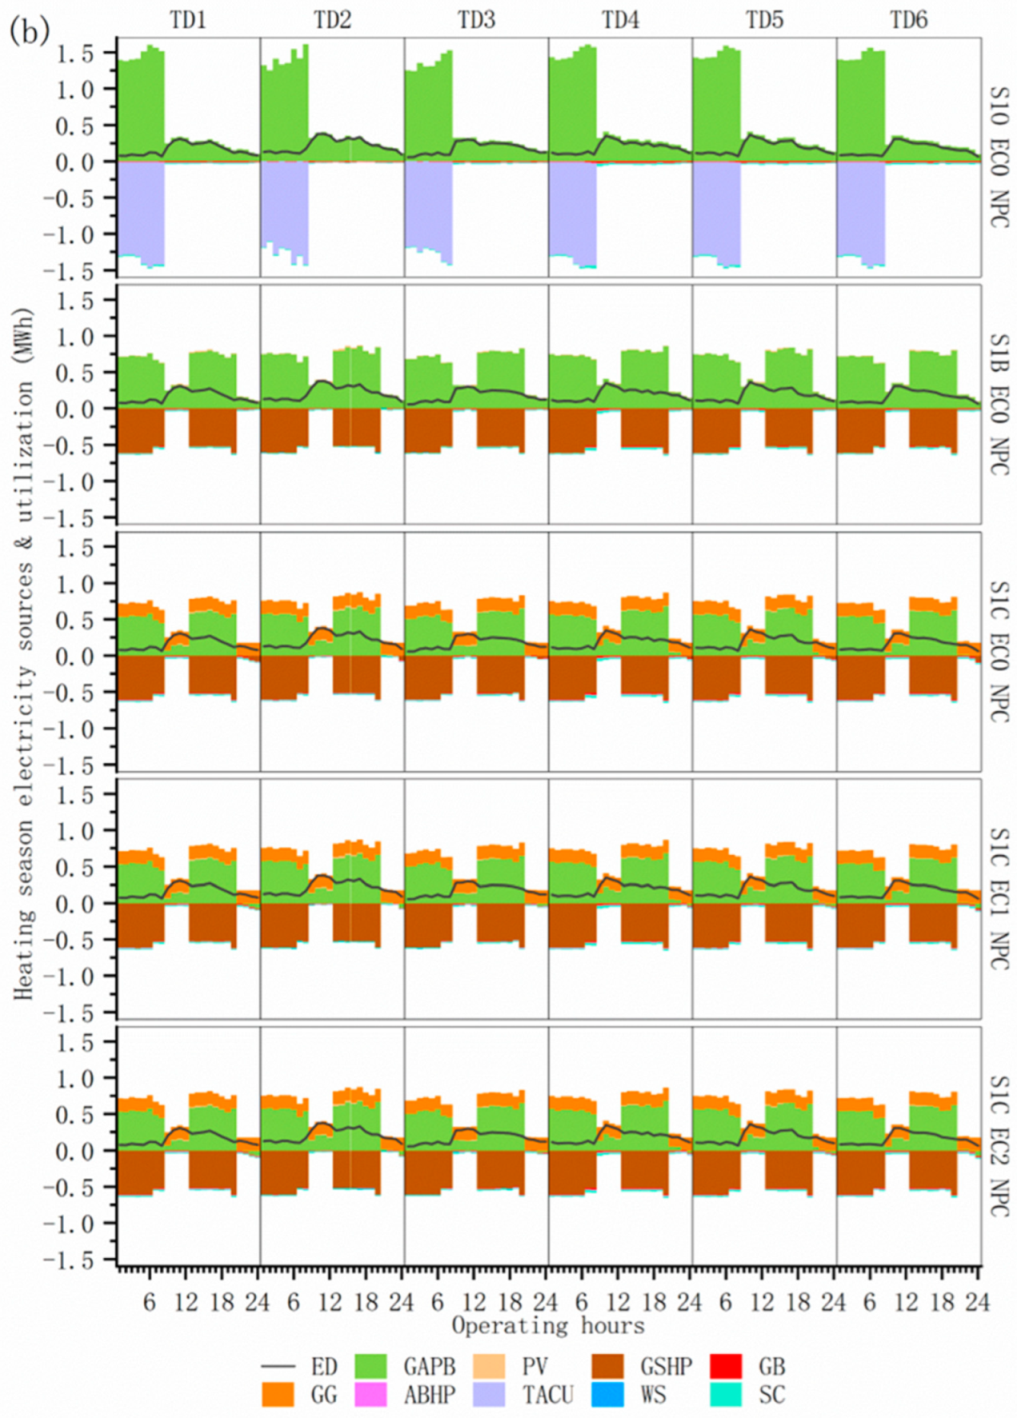
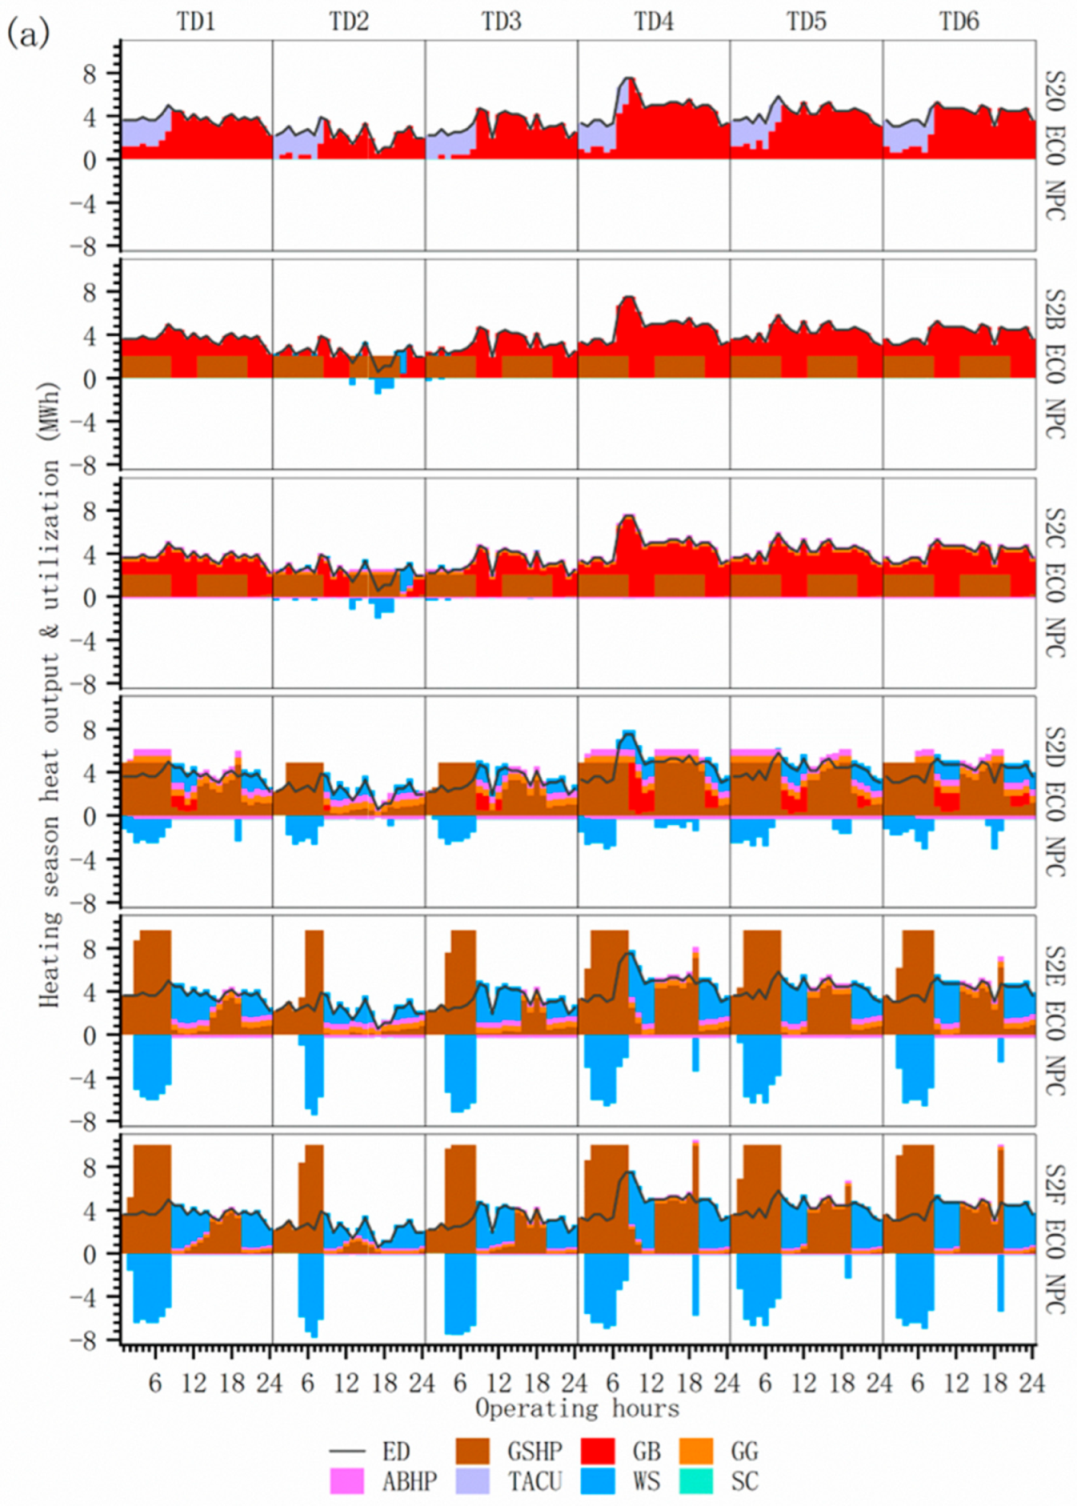
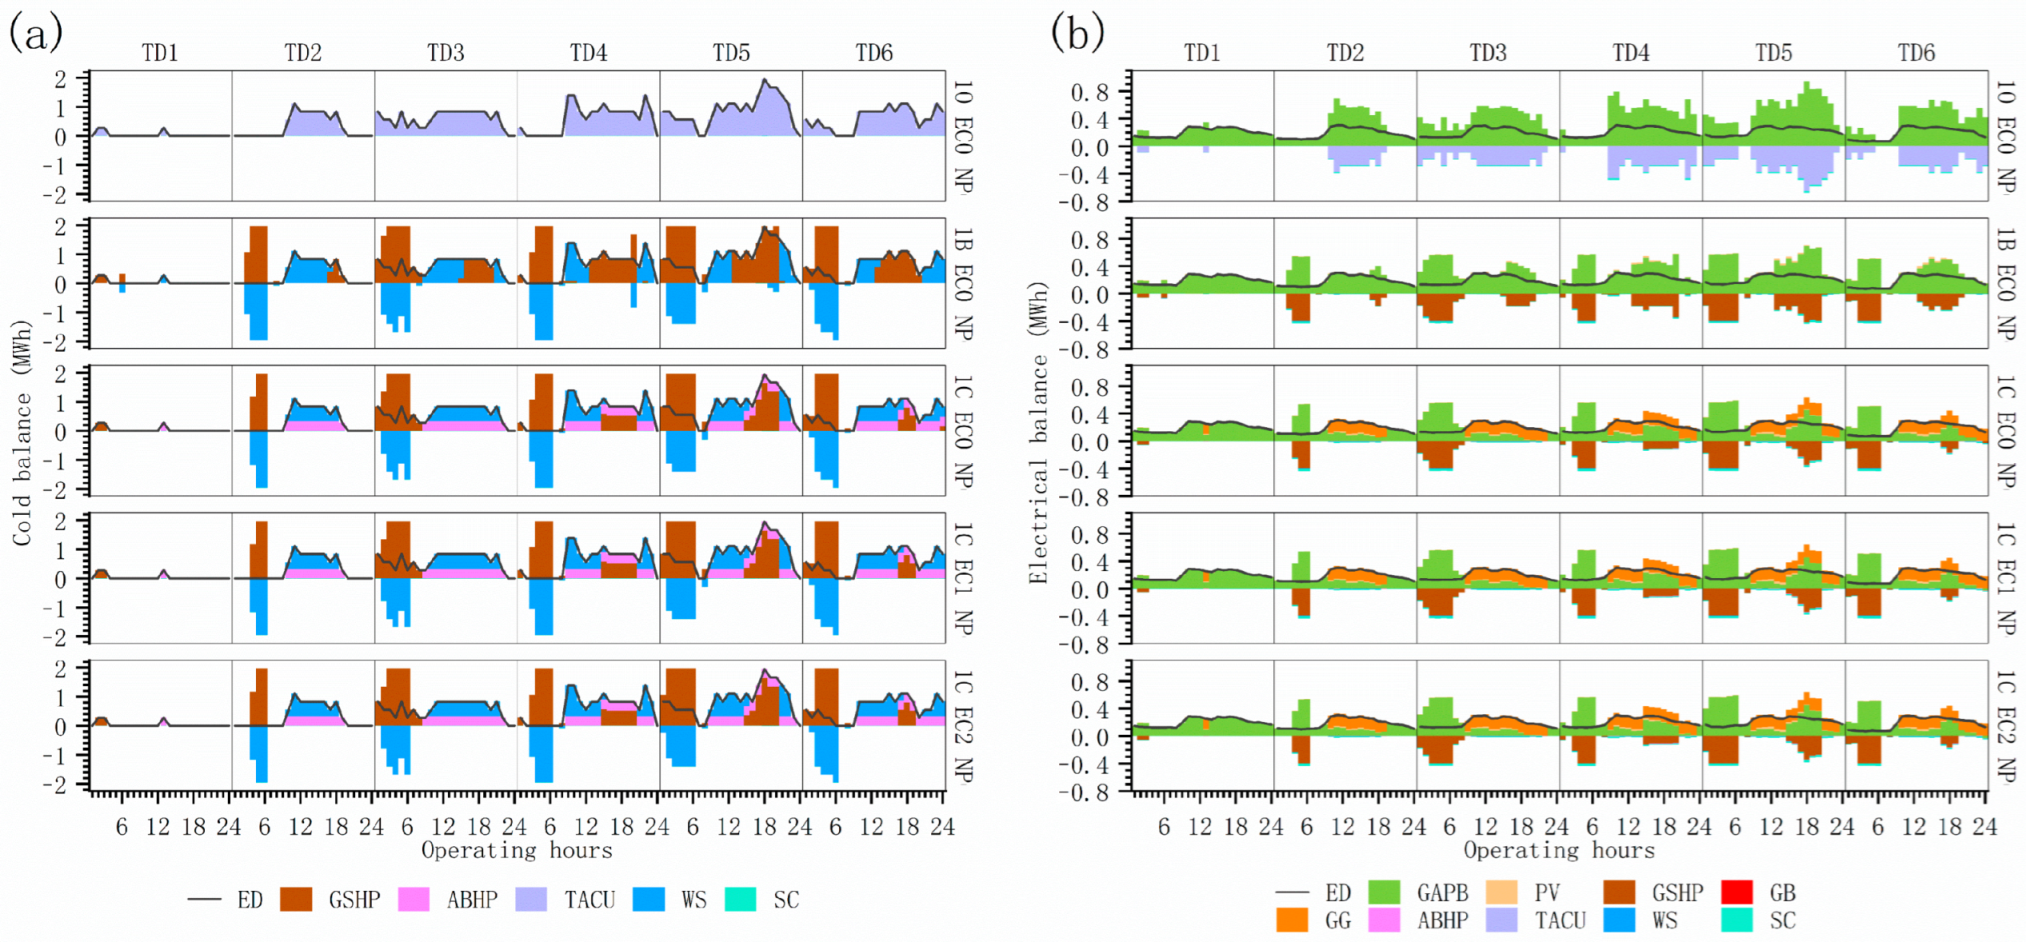
As shown in Figure 13a, see Figure A1a for details, in the optimization mode, the ground source heat pump operates exclusively during off-peak periods (night valley and afternoon flat electricity periods) across all typical days, remaining inactive during morning and evening peak electricity price periods to avoid high operational costs. Notably, the hourly thermal demand during heat pump operation consistently surpasses the unit’s maximum output capacity across multiple typical days. Considering the inherent energy losses during energy storage processes and the time-insensitive nature of gas prices (the primary cost factor for boiler heating), energy storage systems demonstrate neither economic viability nor carbon reduction potential under these supply–demand matching conditions. Comparative analysis of operational patterns reveals that energy storage systems only engage during (1) S1B scenarios on days 2–3 when heat pumps approached full-load operation, or (2) S1C scenarios where combined heat output from heat pumps and gas-fired cogeneration exceeded demand. Discharge occurs exclusively during heat pump shutdown periods or when thermal demand surpasses either heat pump output (S1B) or combined system output (S1C).
As shown in Figure 13b, see Figure A1b for details, the current capacity configuration demonstrates minimal operational variability in power supply and consumption systems across different typical days, with gas-fired generators maintaining near-full-load operation continuously. Under S1C EC0 conditions, surplus electricity from 21:00 to 24:00 is allocated to ground source heat pumps, whereas the S1C EC1/2 scenarios direct contemporaneous surplus power to fulfill campus grid electricity demands.
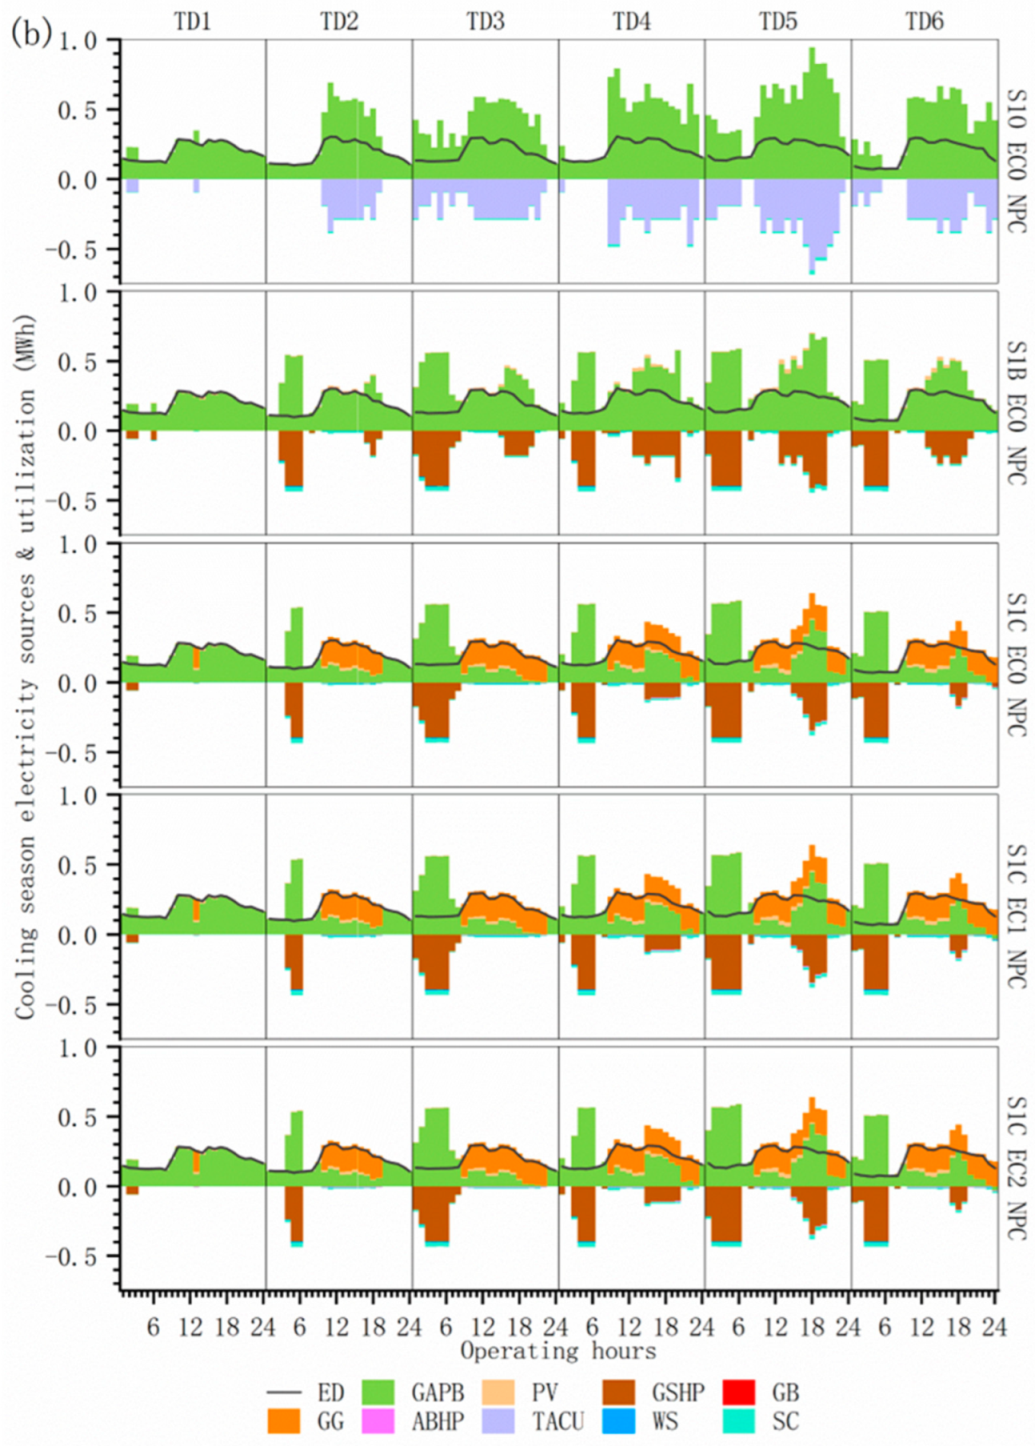
As shown in Figure 14a, see Figure A2a for details, energy storage systems actively engage in cooling load dispatch during the cooling season, which aligns with the characteristic load patterns of typical cooling season days featuring absent or low nighttime cooling demand. The synergistic operation of ground source heat pumps with energy storage concentrates on cold storage during off-peak periods, strategically scheduling charging processes toward the latter part of these intervals to minimize insulation losses by aligning with subsequent discharge cycles. During flat electricity price periods, the direct cooling supply by heat pumps reveals that a valley-electricity cooling schedule over extended time intervals proves less economical than immediate flat-rate electricity utilization when accounting for cumulative energy losses in the storage charging, retention, and discharging processes.
As evidenced by Figure 14b, see Figure A2b for details, the S1C scenario demonstrates gas-fired generators predominantly operate during daytime peak electricity pricing periods and select afternoon flat-rate intervals across all typical days. This integrated approach employs absorption heat pumps that utilize waste heat for cooling, effectively supplanting ground source heat pumps and thereby reducing their operational load during afternoon periods. Concurrently, the strategy of powering ground source heat pumps with gas-generated electricity substantially curtails grid power consumption during flat-rate pricing windows.
The tri-generation system’s heat-led operation mode in this case precludes non-essential waste of recoverable thermal energy, leading to gas-fired generator dormancy during transitional seasons. Furthermore, the undersized photovoltaic configuration exhibits minimal functional significance without surplus electricity for regional grid allocation. Figure 15 substantiates consistent operational performance across varied S1B and S1C scenario configurations.

4.3. Optimization of Multi-Scenario Investment Approaches with Differences in Investment Planning Conditions

This section conducts a comprehensive comparative analysis of multi-objective optimization performance in urban energy systems across diverse scenario-based configurations, encompassing equipment capacity configurations, operational constraints, coordinated campus grid load integration, and photovoltaic performance differentials. The investigation systematically evaluates scenario-specific optimization strategies and their performance variances, thereby offering critical references for system capacity expansion planning and analogous project design.

4.3.1. Multi-Investment Planning Scenario Optimization Performance Analysis

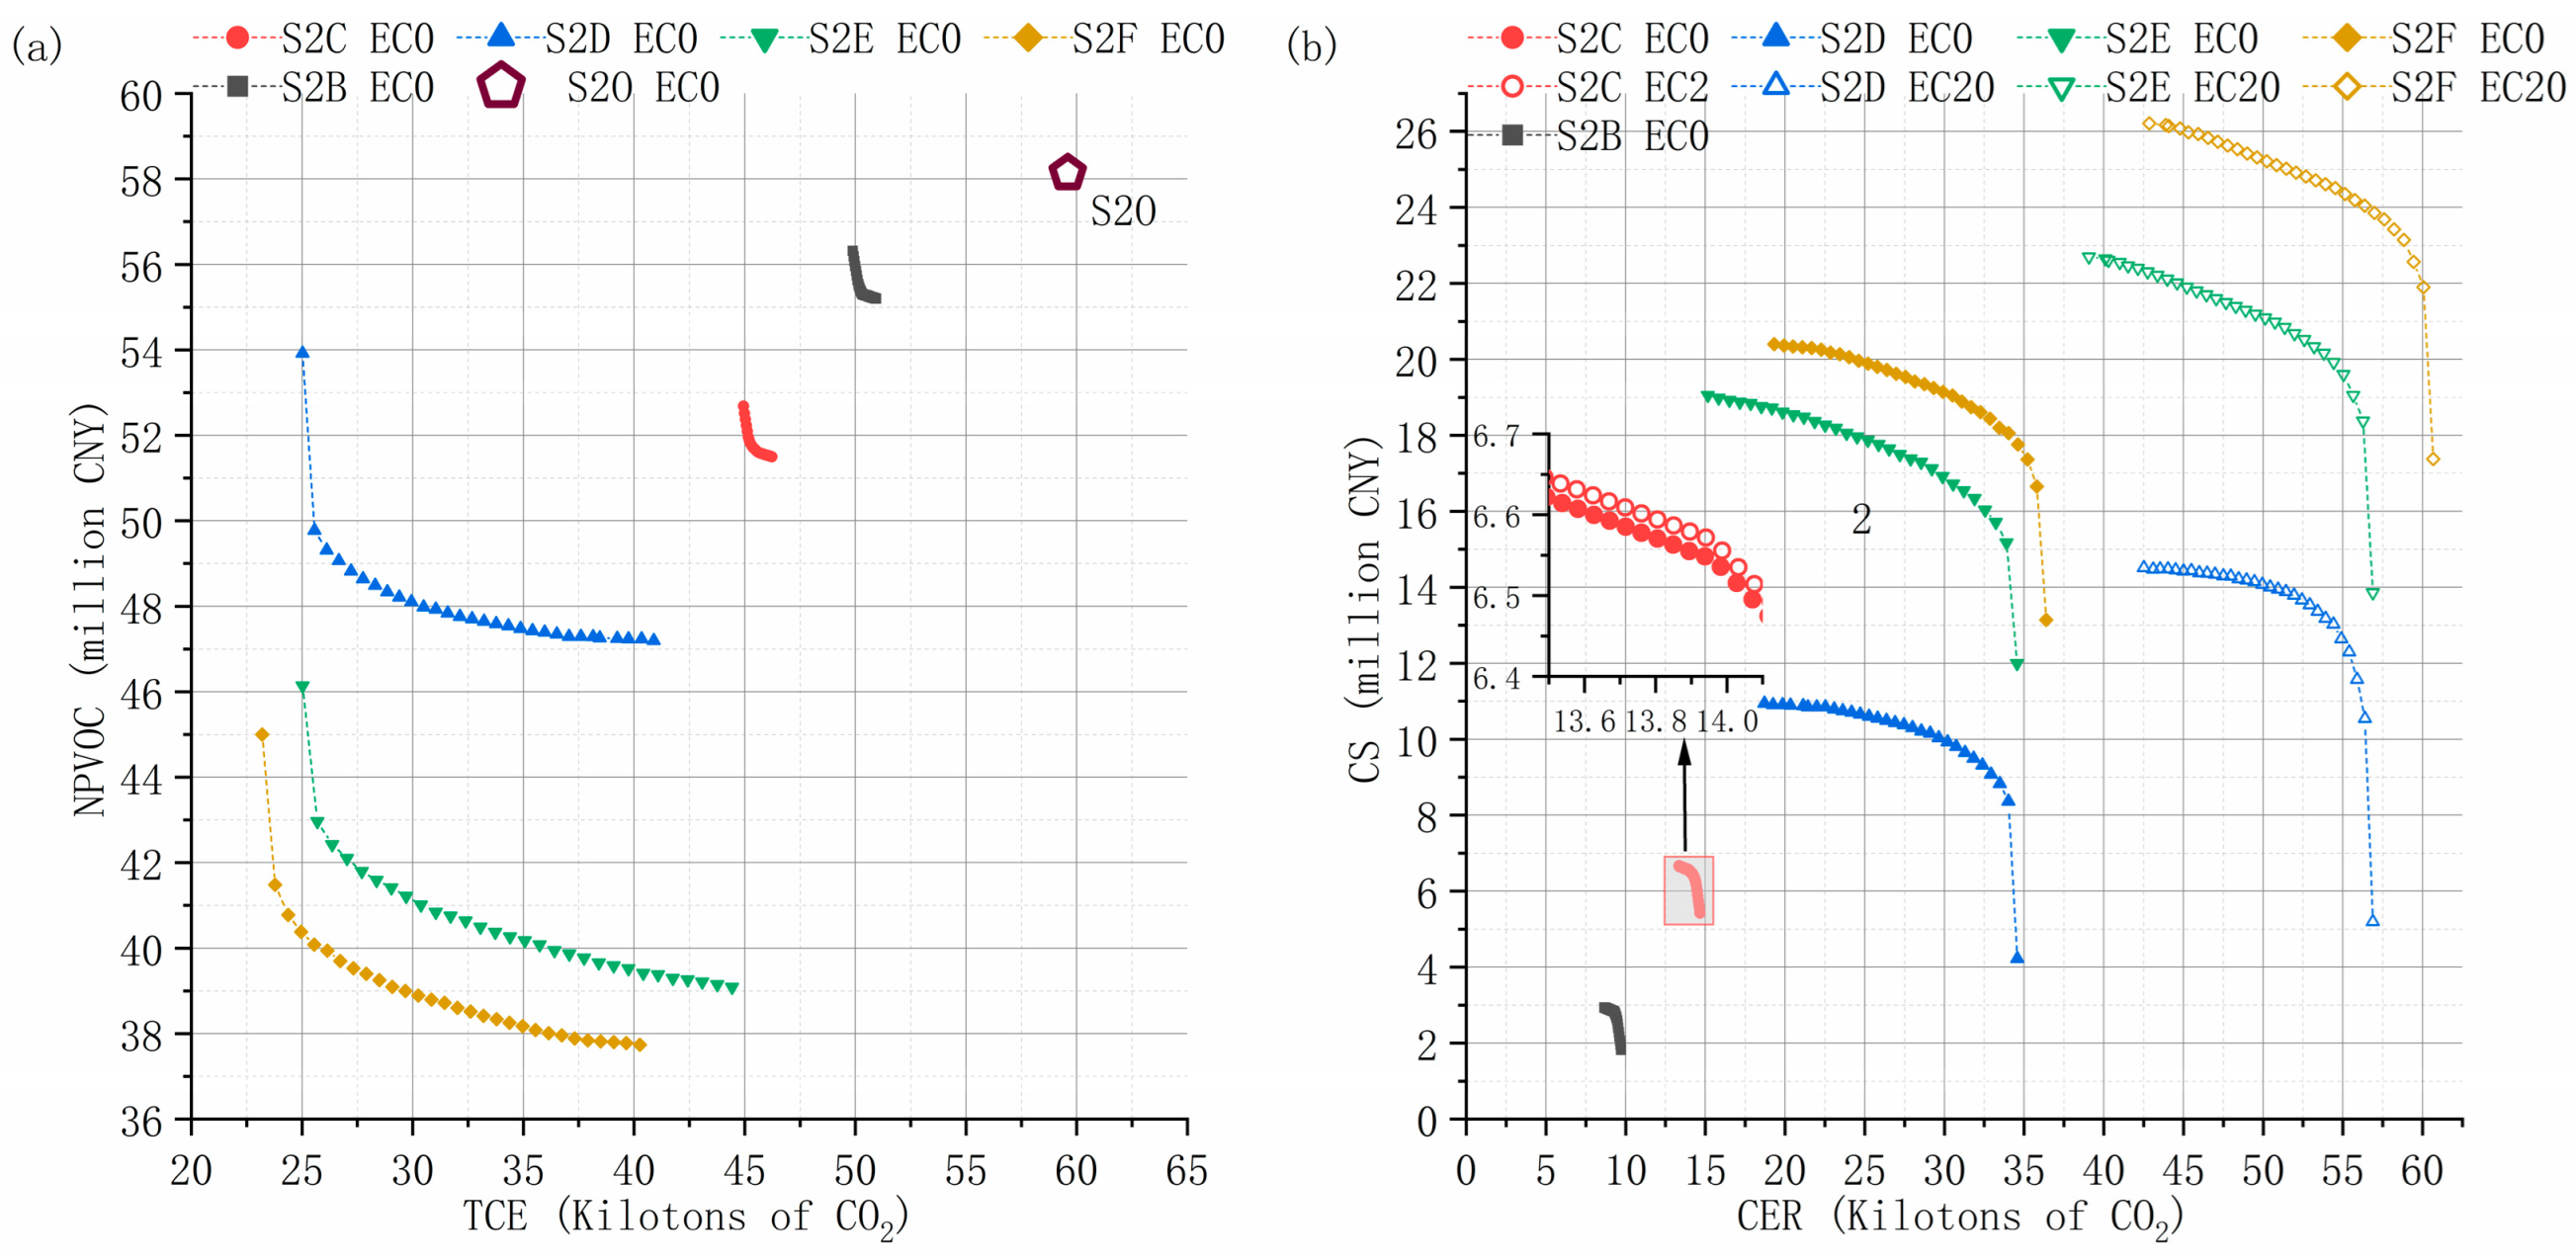
Figure 16 illustrates that, within the 15-year investment horizon, while the current system configuration under scenarios S2B/S2C achieves enhanced economic viability and carbon mitigation compared to baseline S2O, the control scenarios S2D/S2E reveal that integrated energy supply schemes can unlock further energy-saving potential for campuses with comparable energy demands and renewable resource availability. Comparative analysis with the gas boiler-restricted scenario S2D shows that optimization strategies targeting 15-year net present value costs and total carbon emissions yield significantly improved system configurations applicable to both EC0 (energy station building consumption) and EC20 (campus grid demand coverage) operational conditions. Scenario S2E, which eliminates gas boiler operational constraints, demonstrates enhanced long-term economic returns and environmental benefits through flexible system configuration optimization.
The substandard installation conditions result in photovoltaic output levels substantially below regional averages. Benchmarking against scenario S2F (using typical local PV generation hours) indicates that system optimization under actual output conditions (S2E) maintains unexploited performance potential.
Through operational optimization analysis, it is established that, constrained by the current capacity configurations of power generation equipment (gas-fired internal combustion engines and photovoltaic systems) in scenarios S2B/S2C, the energy station’s power generation capacity matches the electricity demand of the host building in terms of magnitude. Consequently, it shows limited effectiveness in reducing municipal grid dependency for the park’s power incremental distribution network, demonstrating insensitivity to load level variations (EC). In contrast, when considering the energy cascade utilization benefits of combined cooling, heating, and power (CCHP) systems and renewable energy generation potential, substantial optimization potential emerges. By enhancing self-generation capacity to cover more electrical demand in the park’s incremental distribution network, the system demonstrates progressive improvements in both economic efficiency and carbon emission reduction performance with increasing electrical load levels (EC).
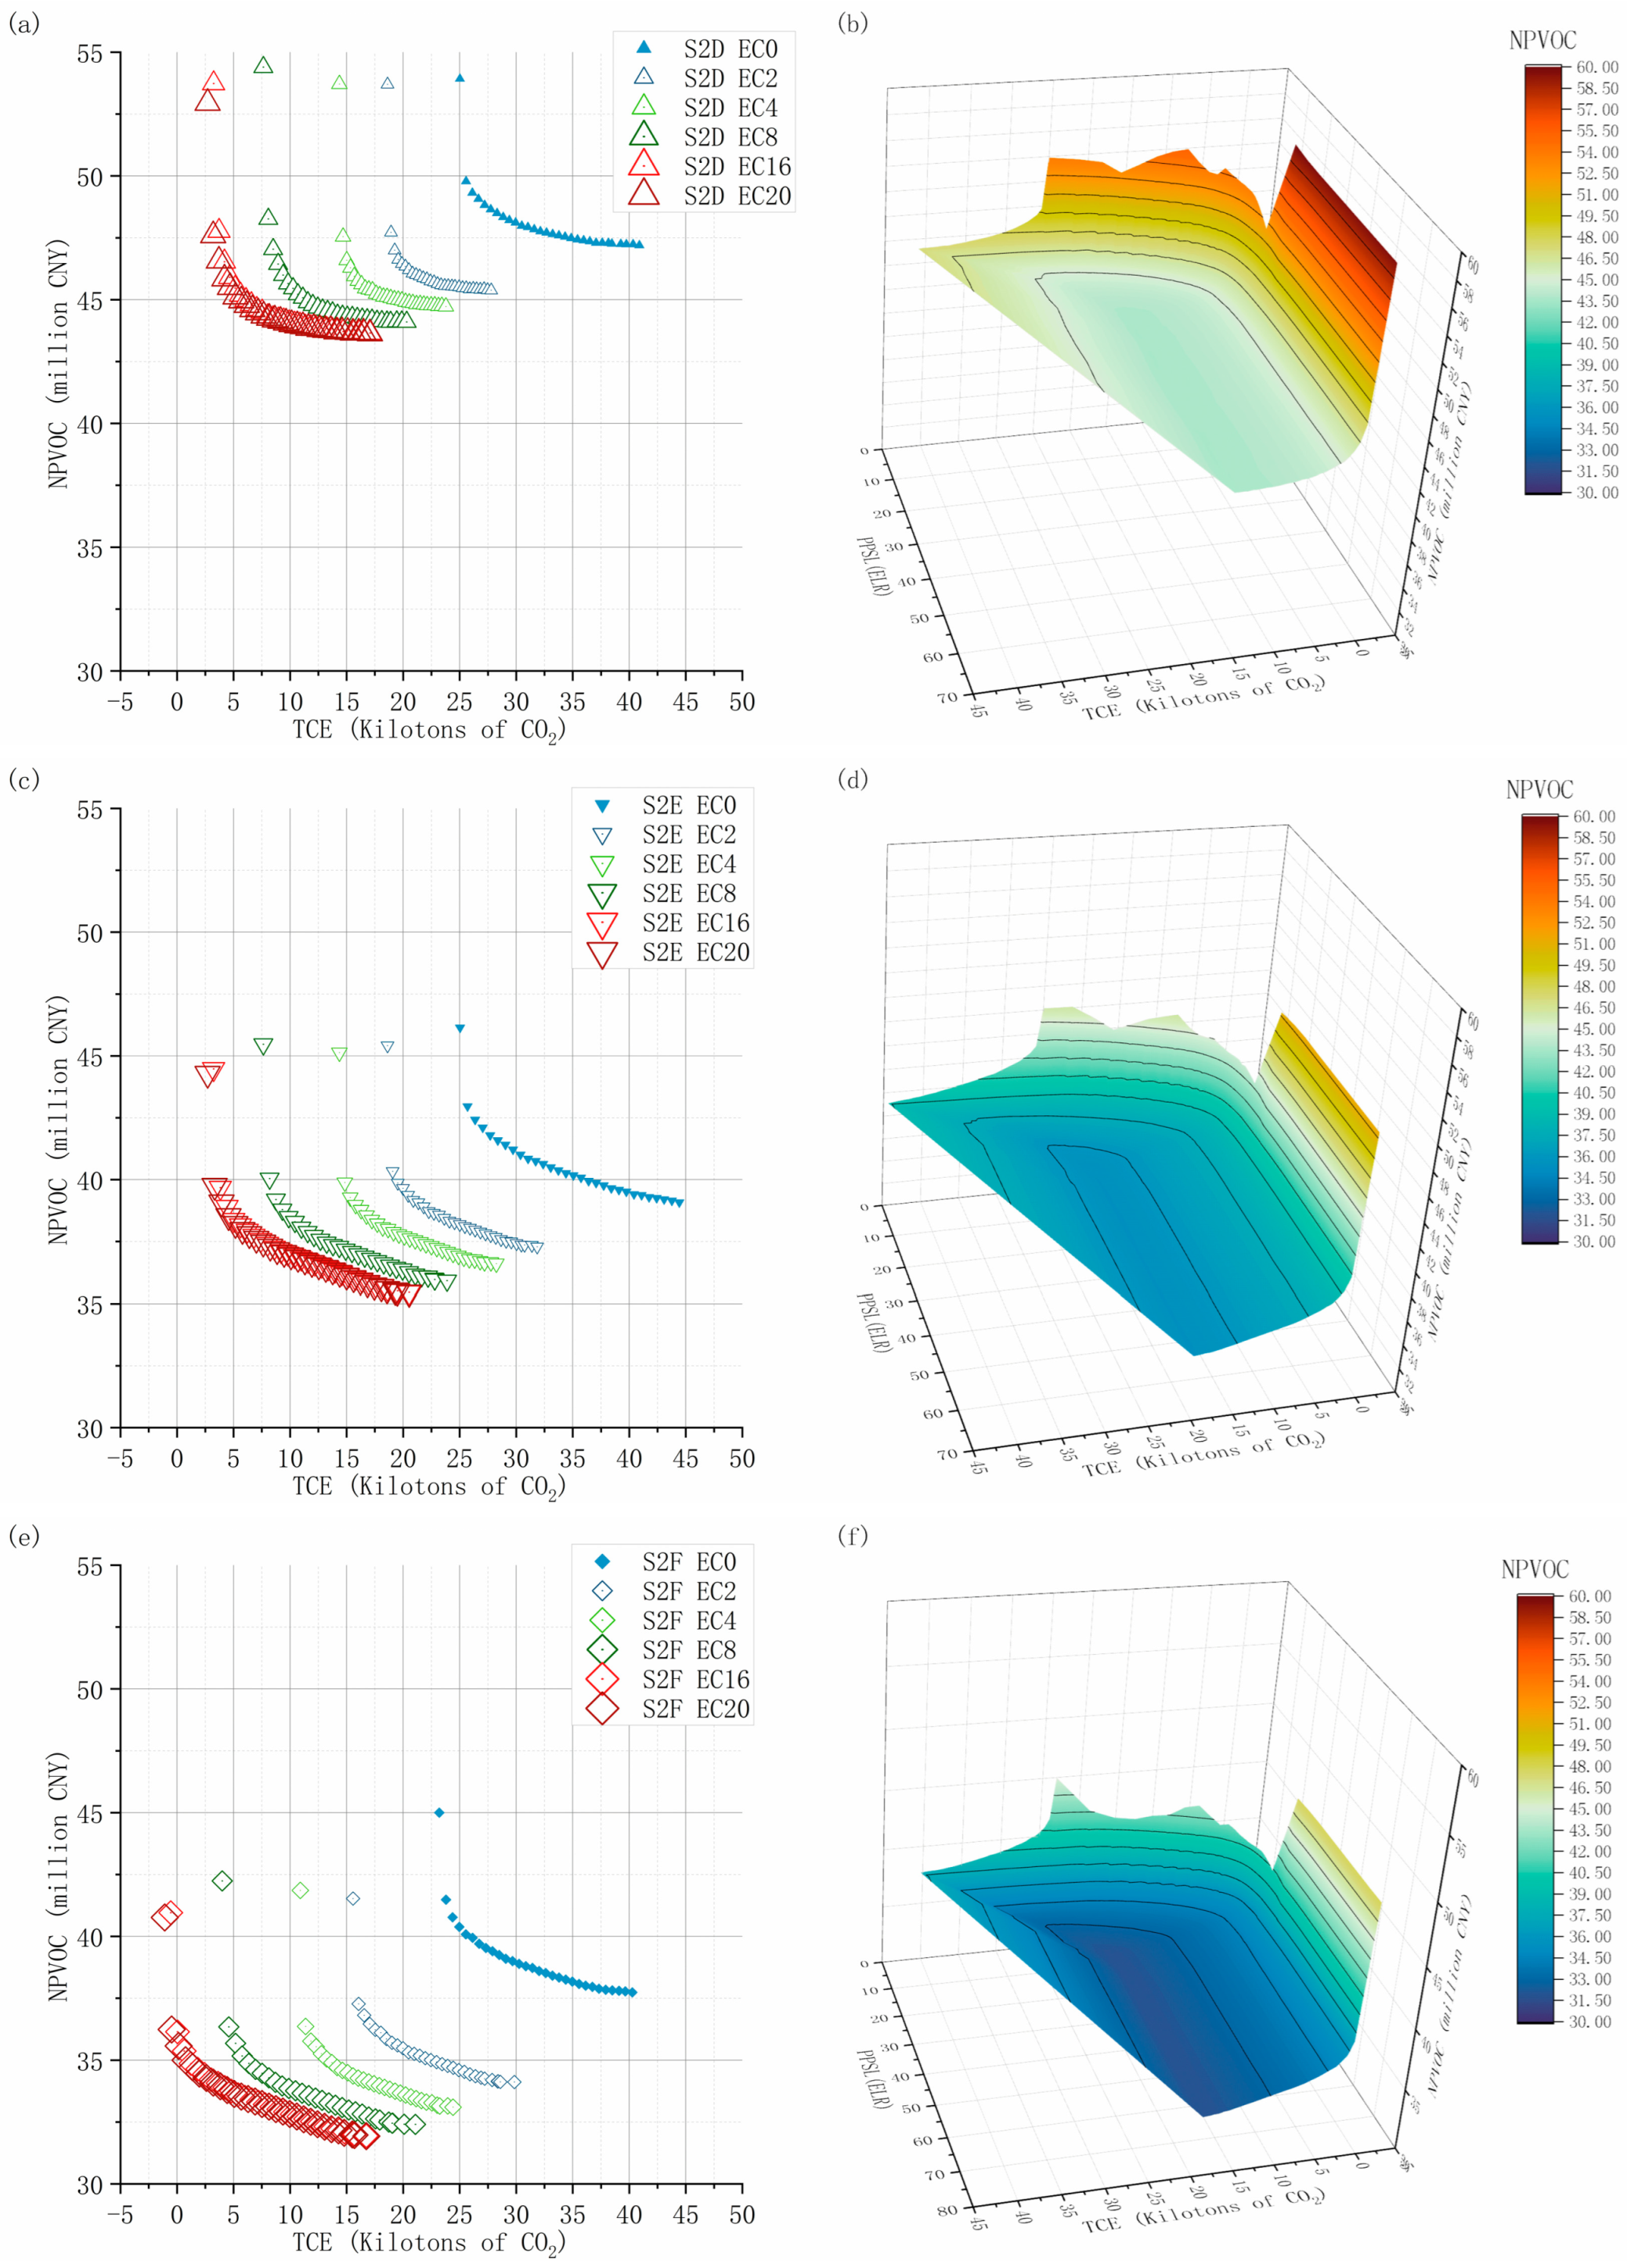
As shown in Figure 17, across three distinct planning scenarios (S2D, S2E, S2F), both economic performance and carbon emission reduction capabilities exhibit strong correlations with electrical load levels (EC) in the park’s incremental distribution network, demonstrating comparable sensitivity patterns. In the scatter plot on the left, we can see that, as the multiplier increases, the operating cost decreases for the same carbon emissions; or alternatively, the carbon emissions decrease for the same operating cost. This trend decreases as the multiplier increases, and when the multiplier exceeds 20 times, the system will no longer be economically and environmentally advantageous. Furthermore, within the same primary planning scenario (S2D/S2E/S2F), carbon emission reduction performance exhibits more pronounced variations with EC changes compared to economic indicators.
As is evident from the three-dimensional diagram, the system’s energy conservation and emission reduction performance improves progressively with EC elevation, albeit with diminishing growth rates. Beyond the threshold of 20 times the actual electrical loads under baseline conditions at existing energy stations (EC20), additional coverage of incremental distribution network demand demonstrates diminishing returns for system performance optimization. In the figure, when the magnification increases but is lower than 20 times, the color of the figure changes more significantly, and when it exceeds 20 times, the color of the bottom of the figure almost does not change. At elevated incremental distribution network load levels (EC > 20), while superior carbon emission reduction configurations are achievable, they entail prohibitively high marginal costs, as shown in the right part of the three-dimensional diagram, rendering them economically impractical for real-world implementations. Therefore, EC20 is established as the boundary condition for subsequent scenario analyses. Of course, EC20 is definitely affected by specific cases and models constraints, such as the load size in the case, the type of technology selected, etc. However, for the same type of cases, the optimal threshold may not be the same when performing capacity expansion and transformation, but there will be a threshold for optimal thermal load matching, and it is necessary to obtain sensitivity analysis for specific problems.
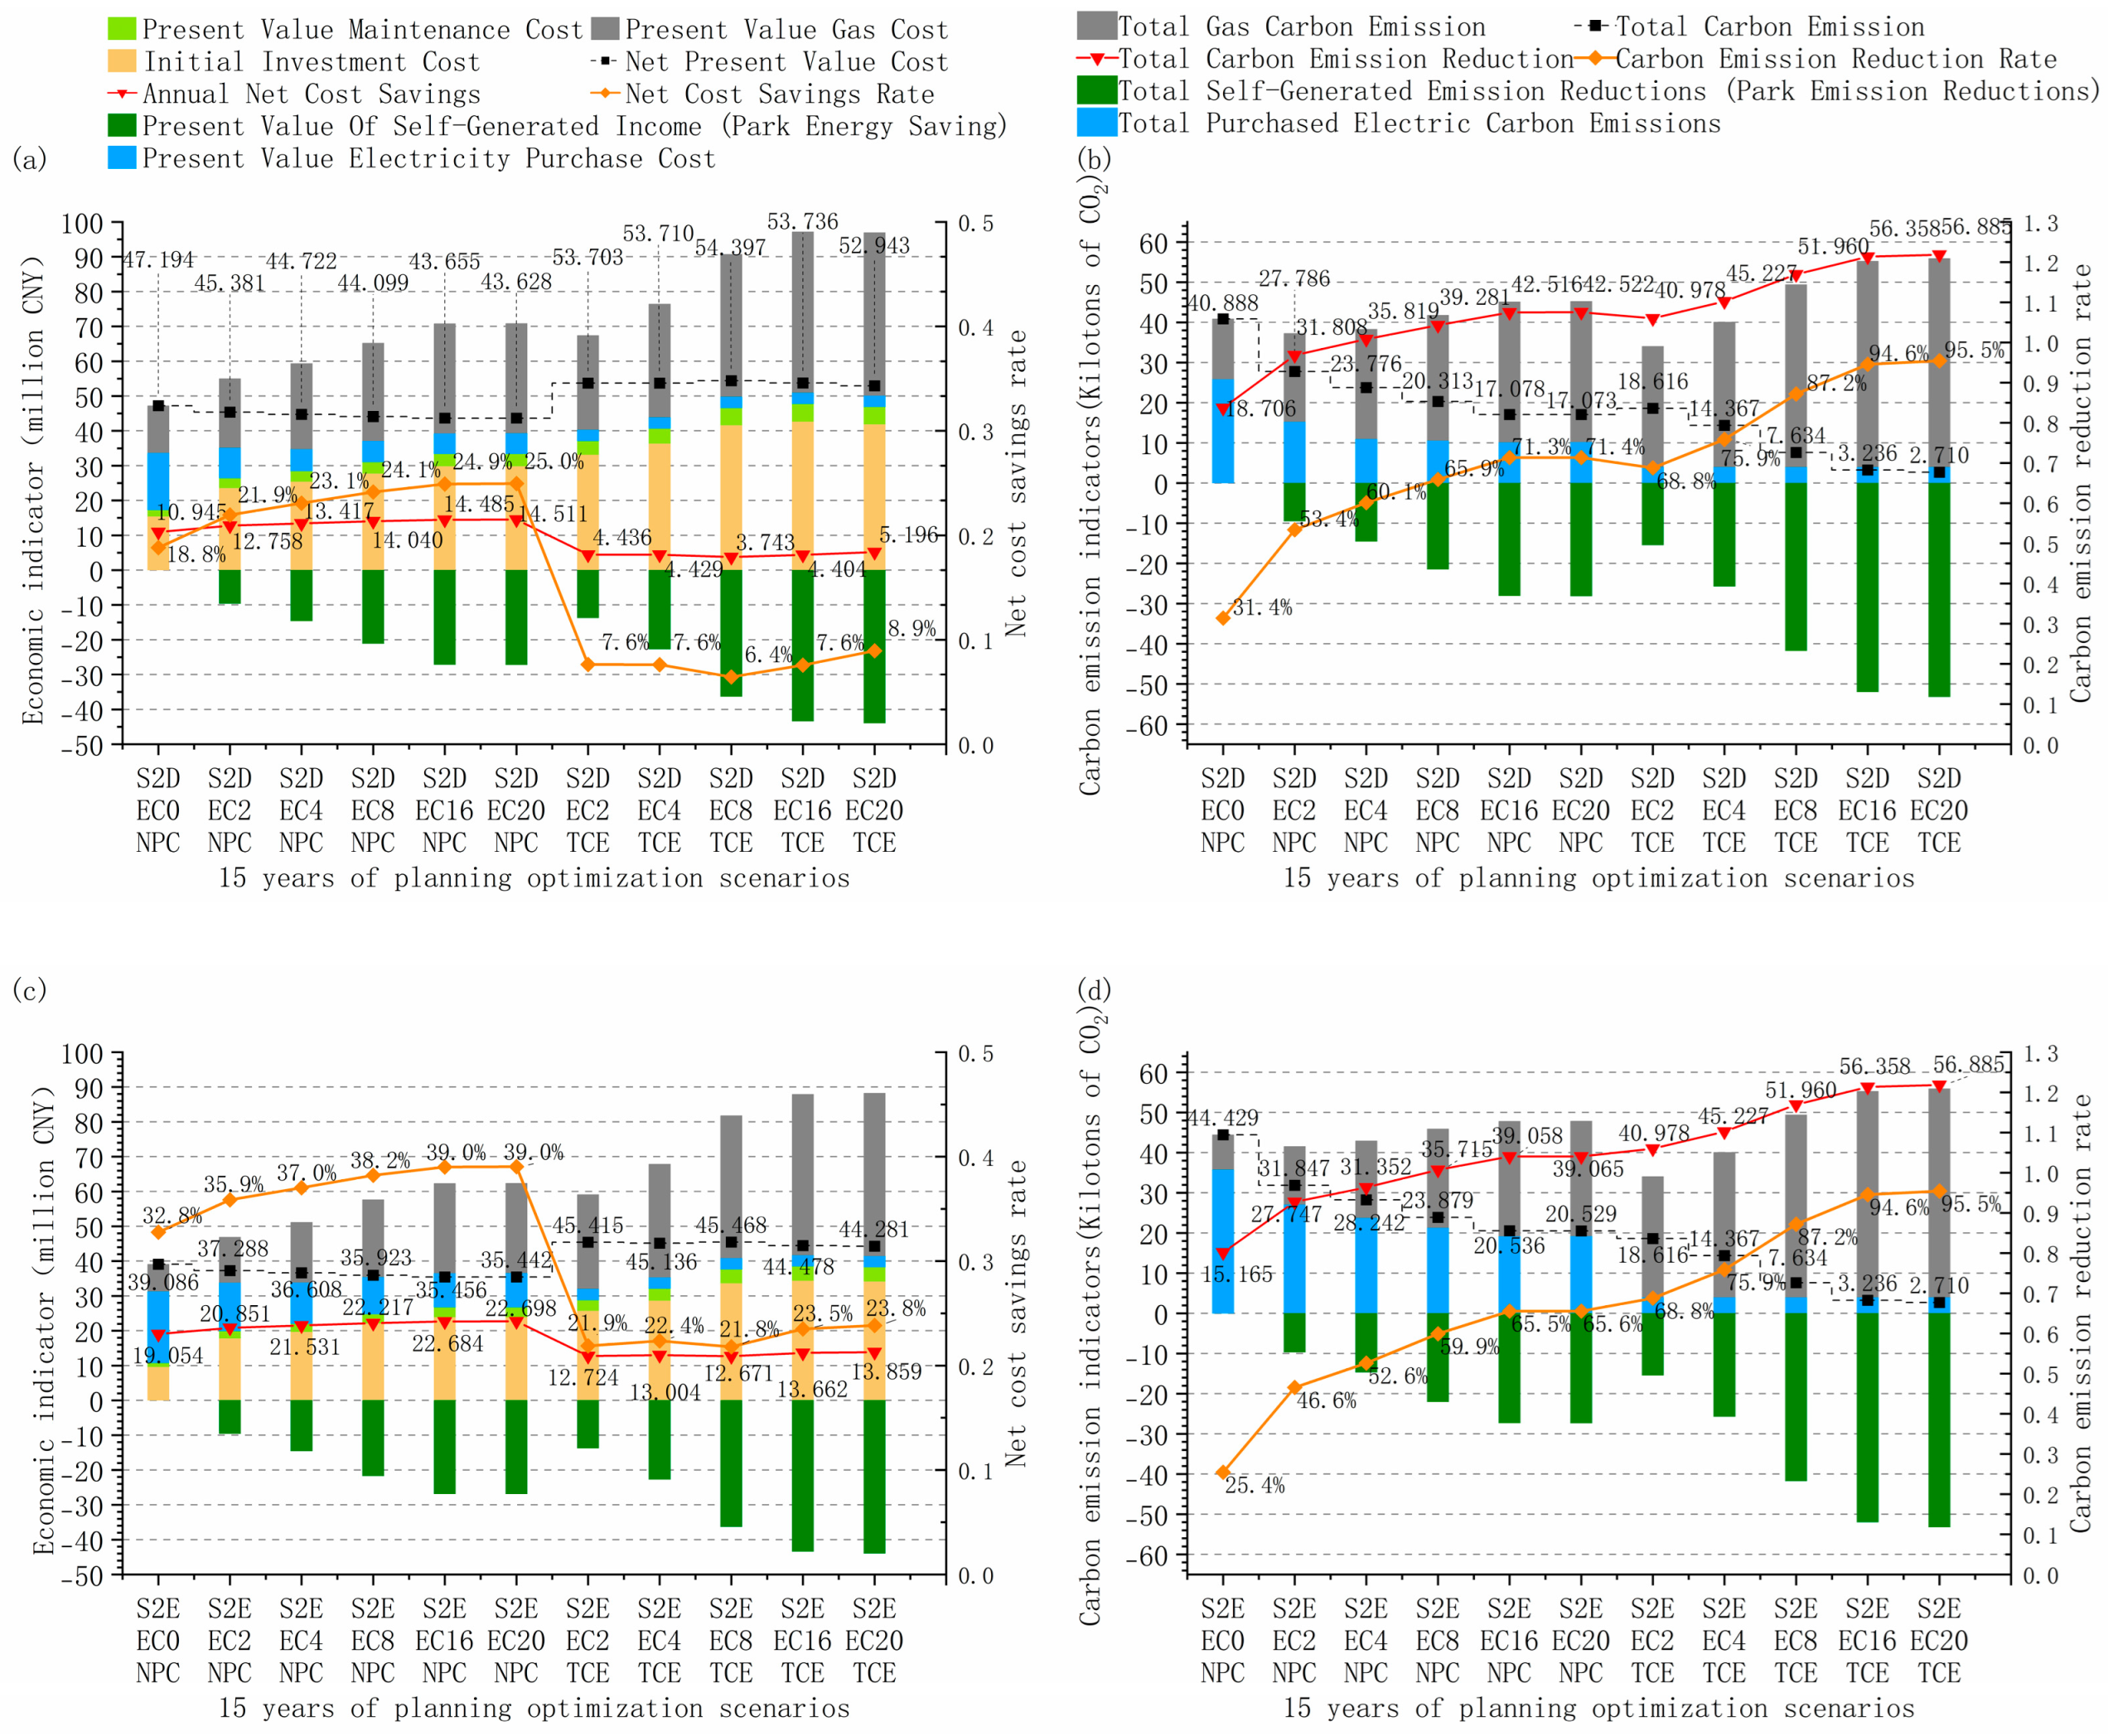
In contrast to electrical load levels (EC) in the incremental distribution network, existing equipment constraints and photovoltaic generation potential demonstrate more pronounced effects on the system’s long-term economic performance. Figure 18 reveals that, under EC0 conditions, the net present cost (NPC) reductions and carbon mitigation in the economically optimized planning scenarios (S2D/S2E/S2F) predominantly correlate with substantial reductions in gas consumption when compared to the current configuration. However, municipal grid electricity consumption shows an increase relative to scenario S2C, aligning closely with the current operational pattern (S2B). Under EC20 conditions, enhanced utilization of gas-fired cogeneration and renewable energy enables simultaneous power supply to both the energy station and the park’s incremental distribution network. This configuration substantially decreases municipal grid dependency for both the host building and the park’s distribution system through synergistic integration of renewable energy deployment and energy cascade utilization systems.
Under existing equipment configurations (S2B/S2C), the performance differential between carbon-optimized (TCE) and cost-optimized (NPC) strategies remains marginal. However, across scenarios S2D/S2E/S2F with varying EC levels, TCE-optimized configurations exhibit significant trade-offs between NPC savings and carbon mitigation when compared to NPC-optimized approaches. The TCE strategy demonstrates enhanced CCHP system utilization, achieving substantial municipal grid demand reduction that translates to equivalent carbon emission decreases at the expense of substantially increased capital expenditure for system upgrades.
Figure 19 illustrates the correlations between system economic parameters and carbon emission component indicators with electrical load levels (EC) in the park’s incremental distribution network across scenarios S2D/S2E and S2F. The municipal grid electricity demand exhibits negative correlations with self-generation utilization rates, while equipment capital costs, operational expenditures, and gas consumption demonstrate positive correlations. This pattern is attributed to the enhanced CCHP system capacity and generation output driven by improved self-generation utilization. CCHP systems substantially enhance long-term economic viability and carbon mitigation potential through coordinated optimization of the energy station and incremental distribution network at the cost of significant initial capital investment.

4.3.2. Economically Optimal System Configuration for Multiple Planning Scenarios

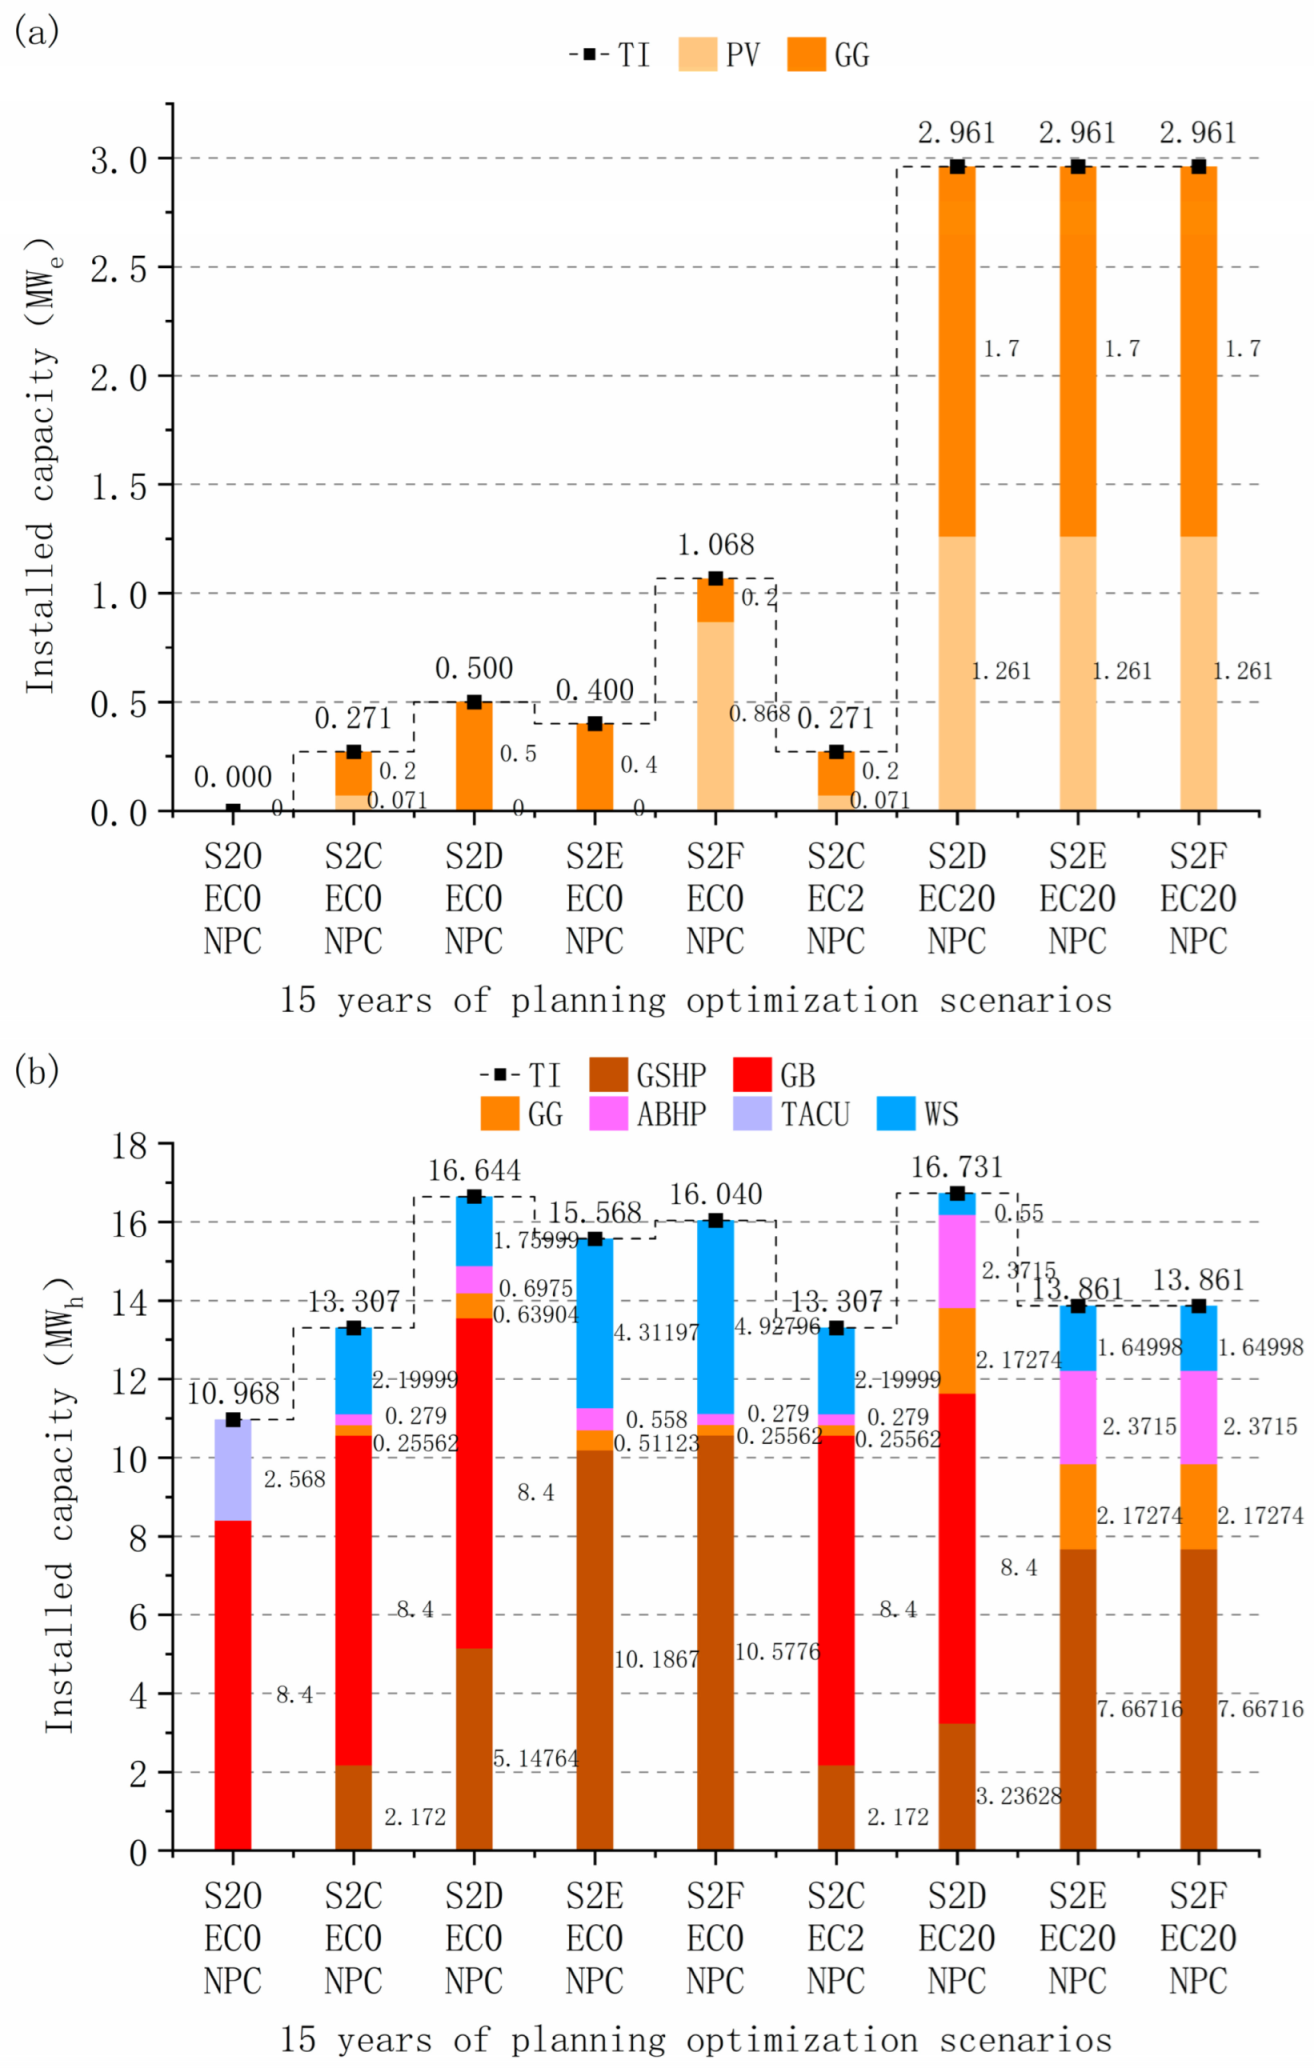
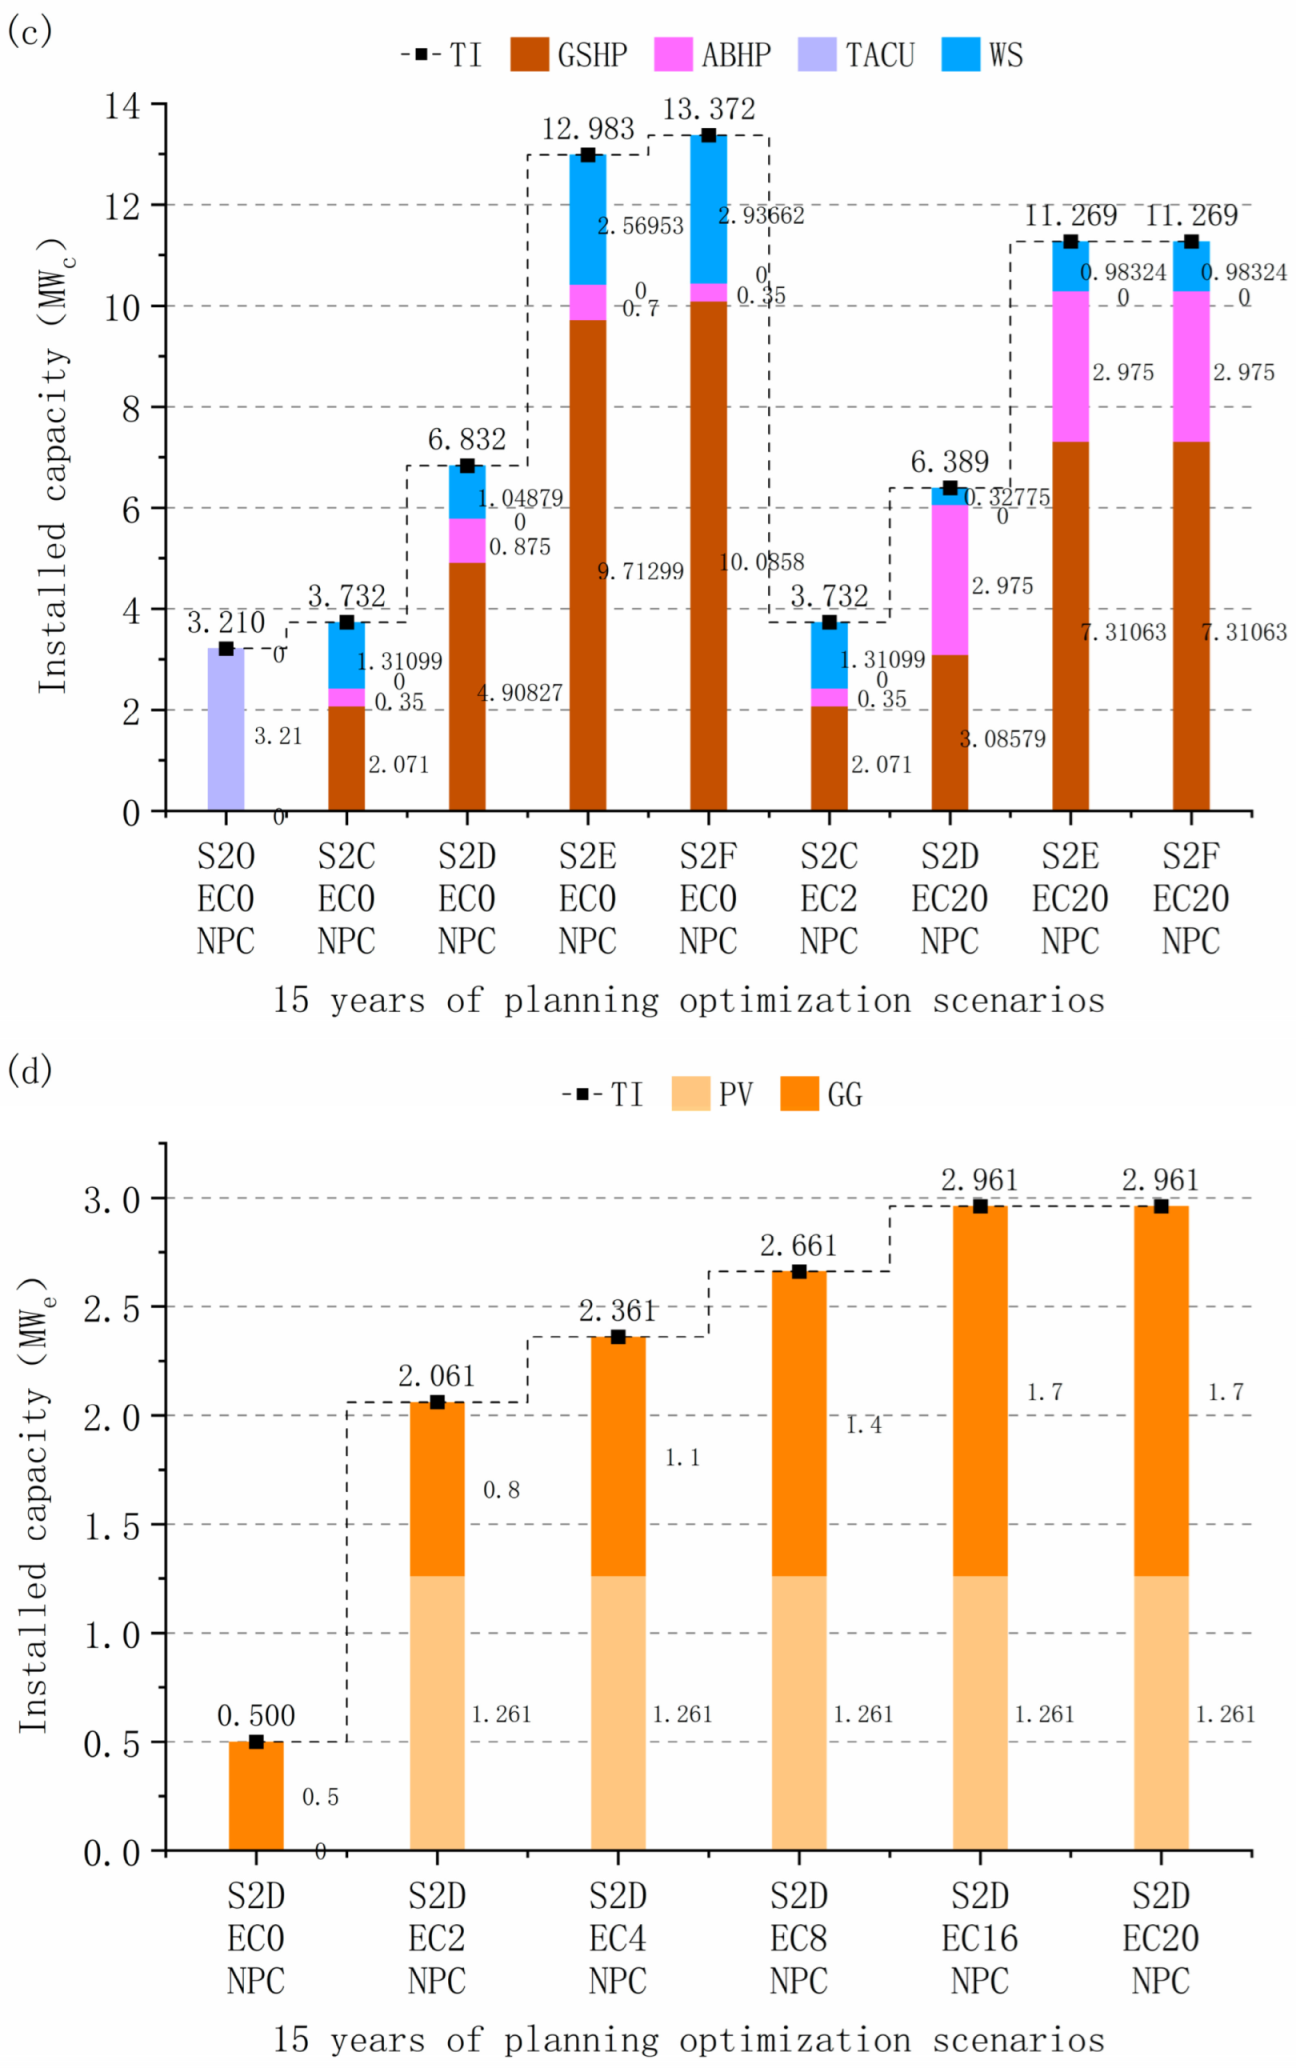
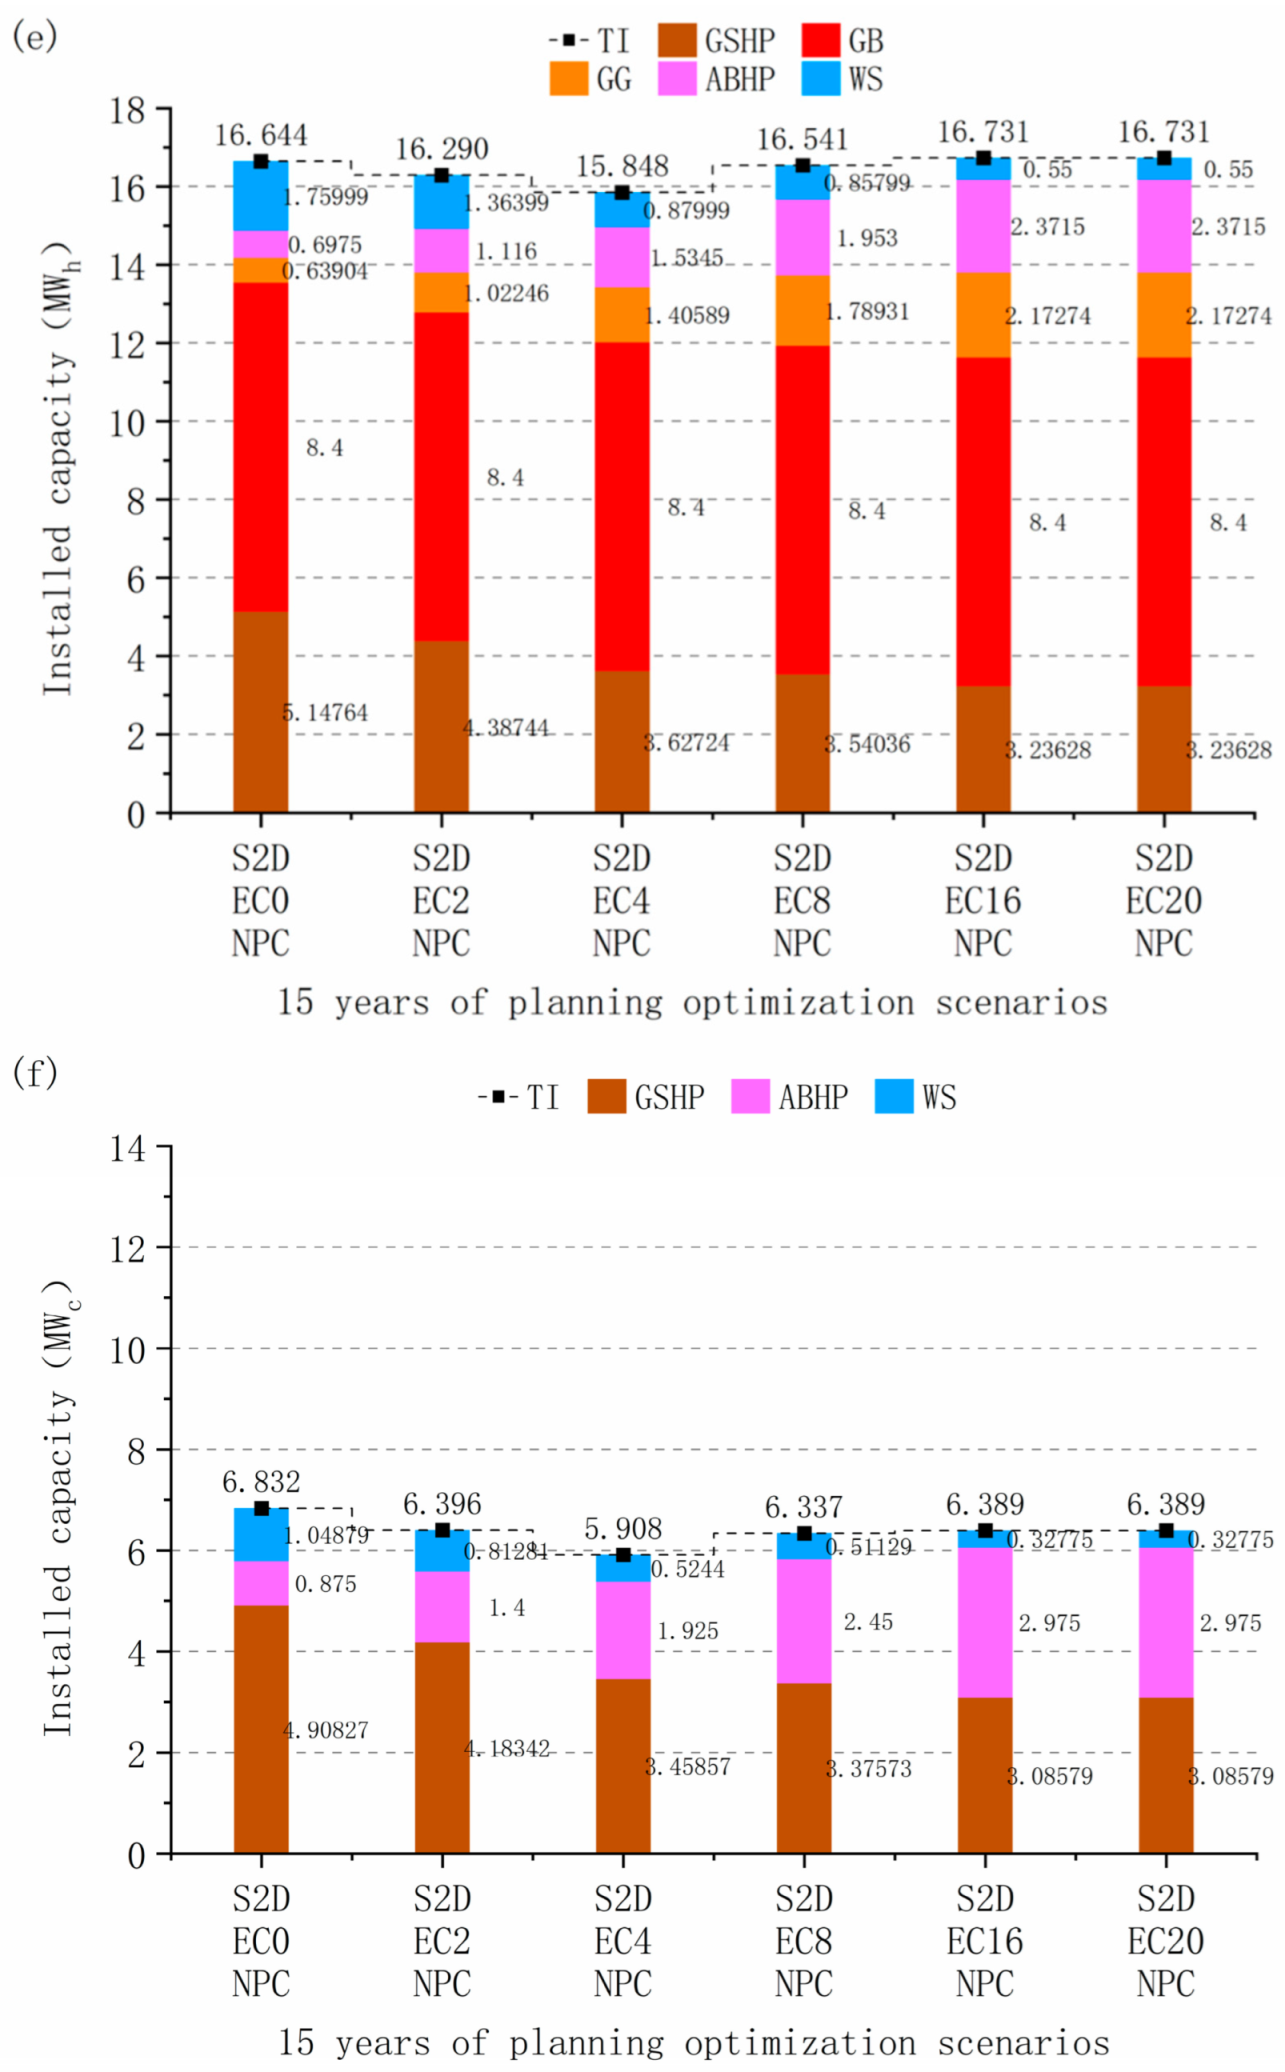
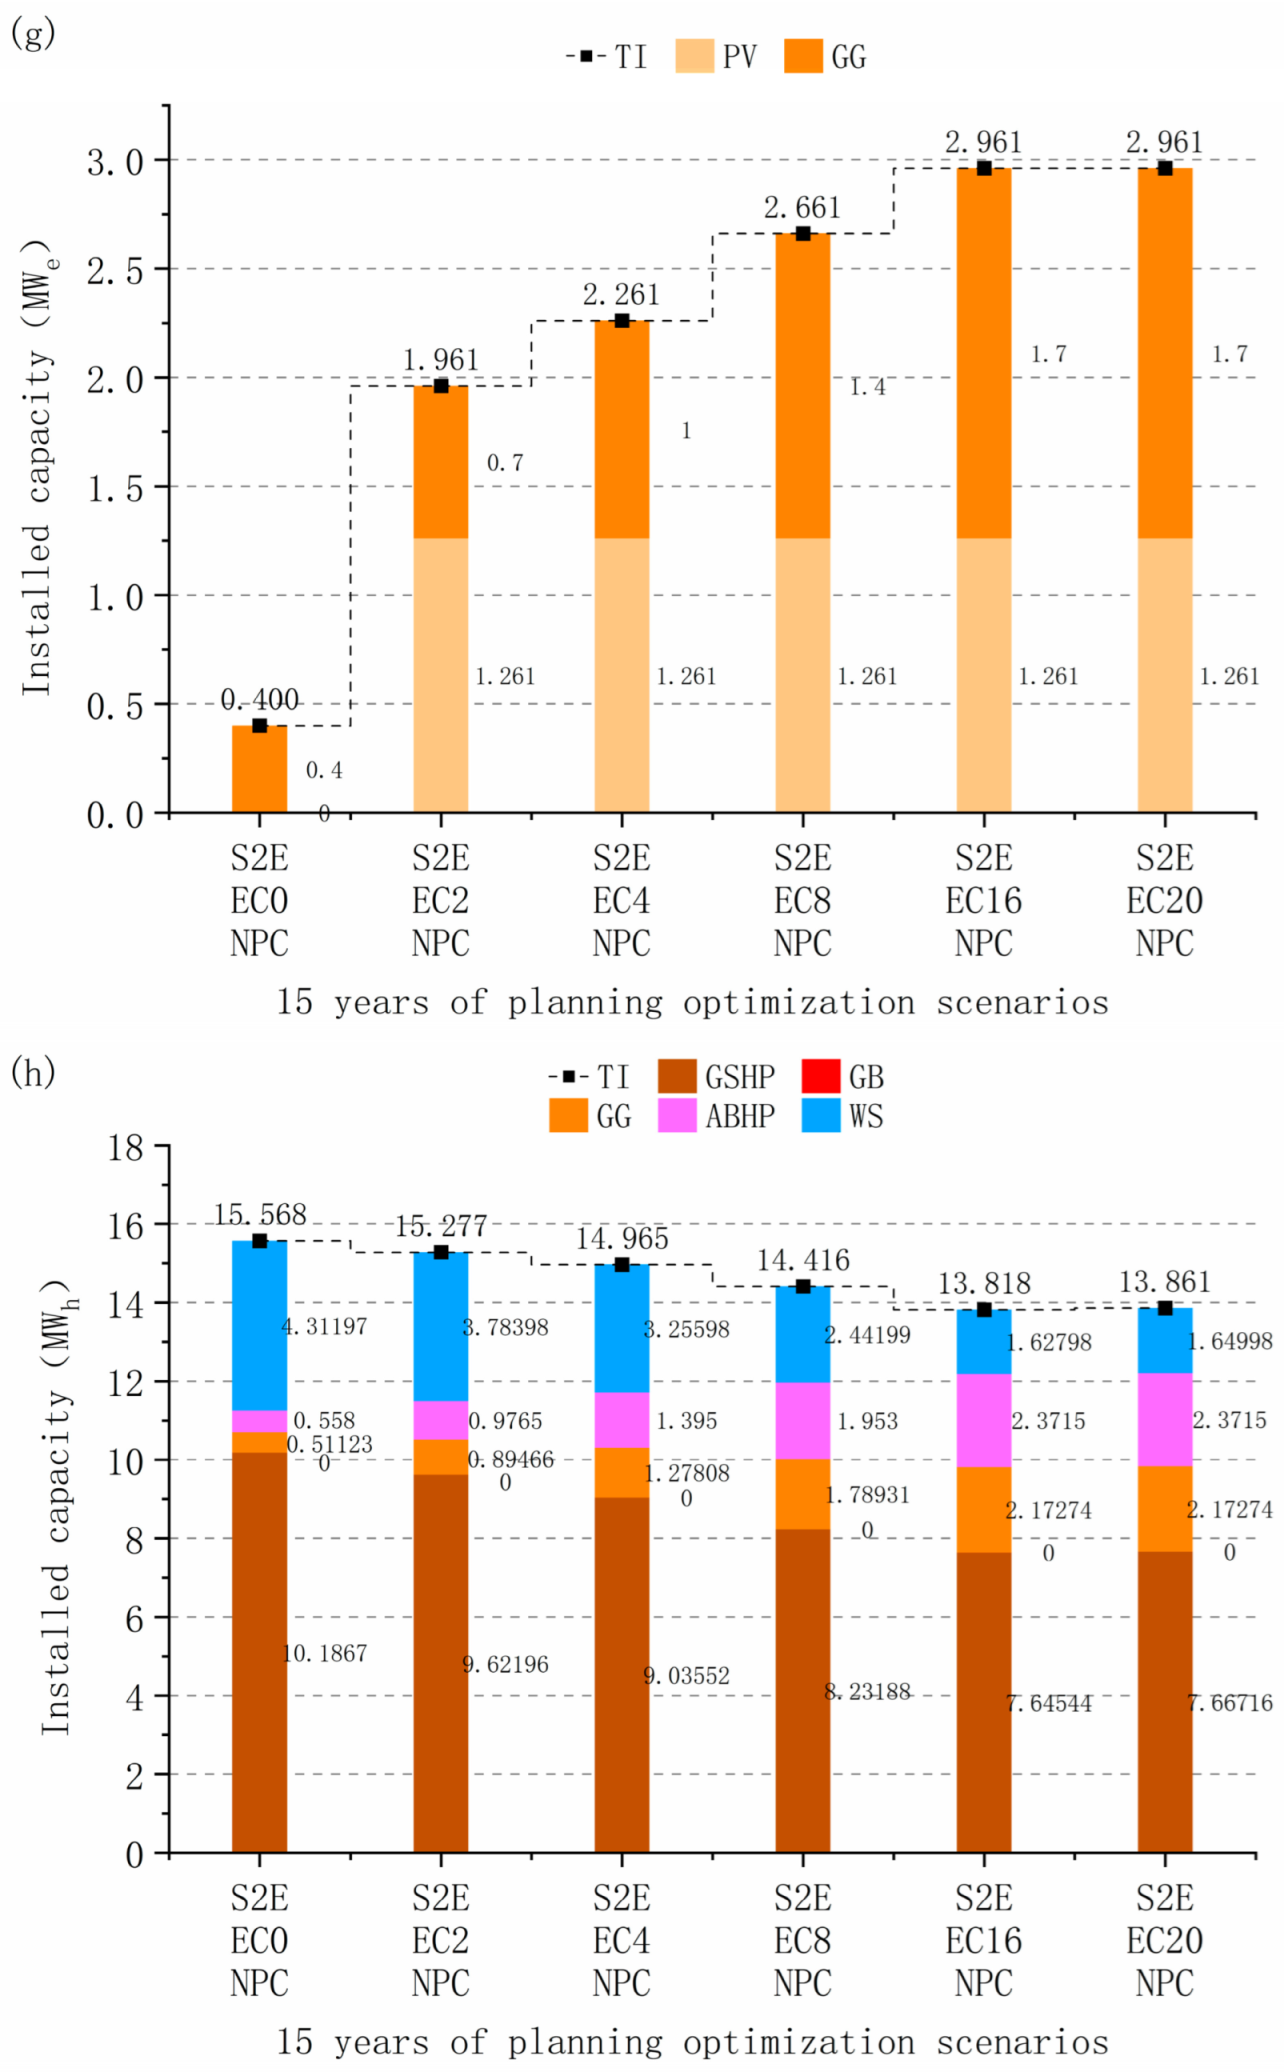
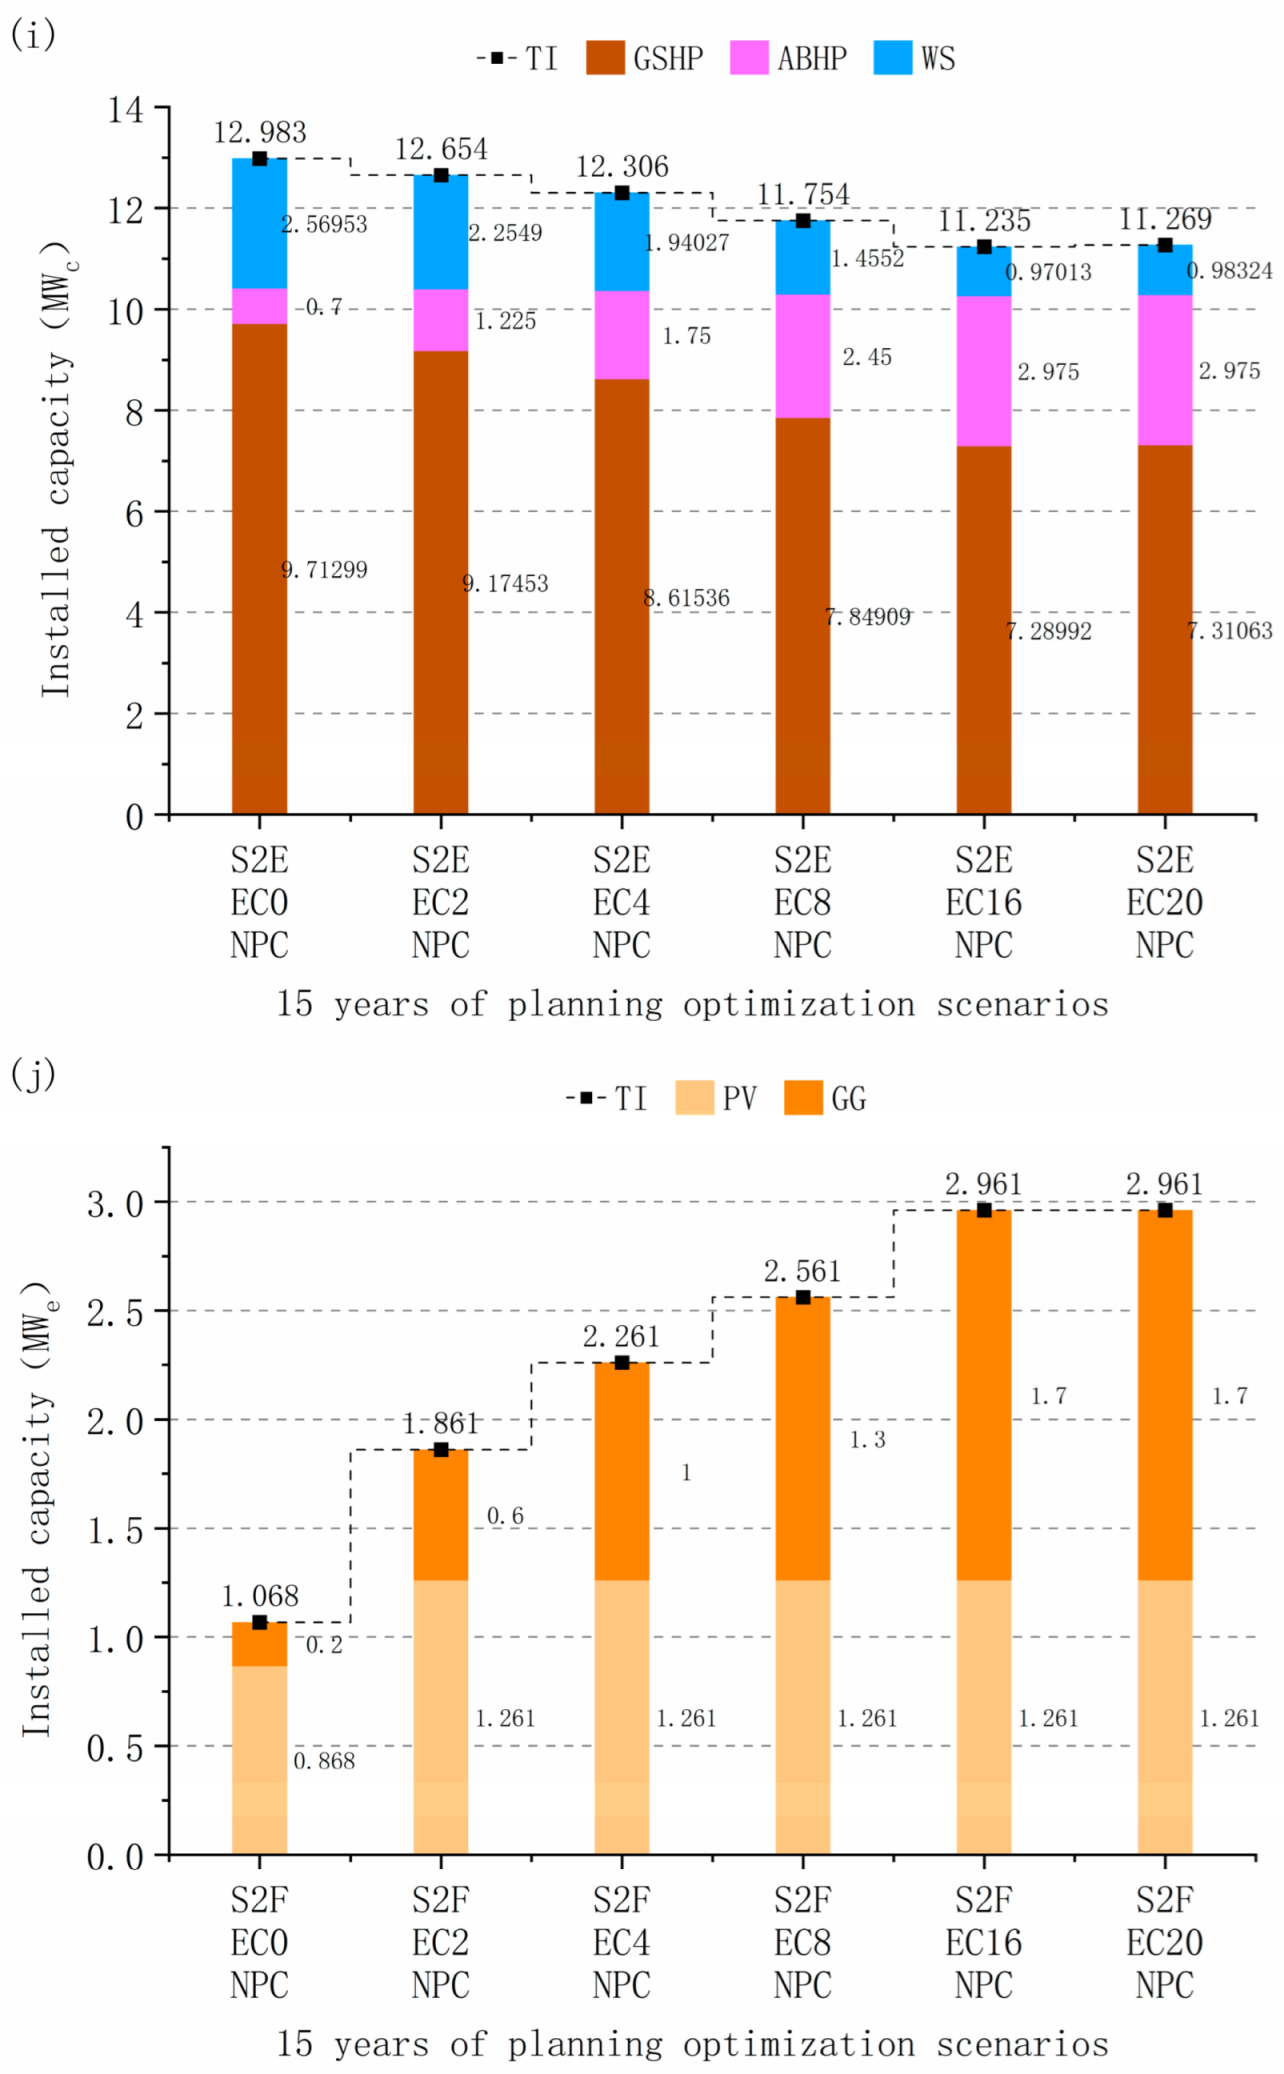
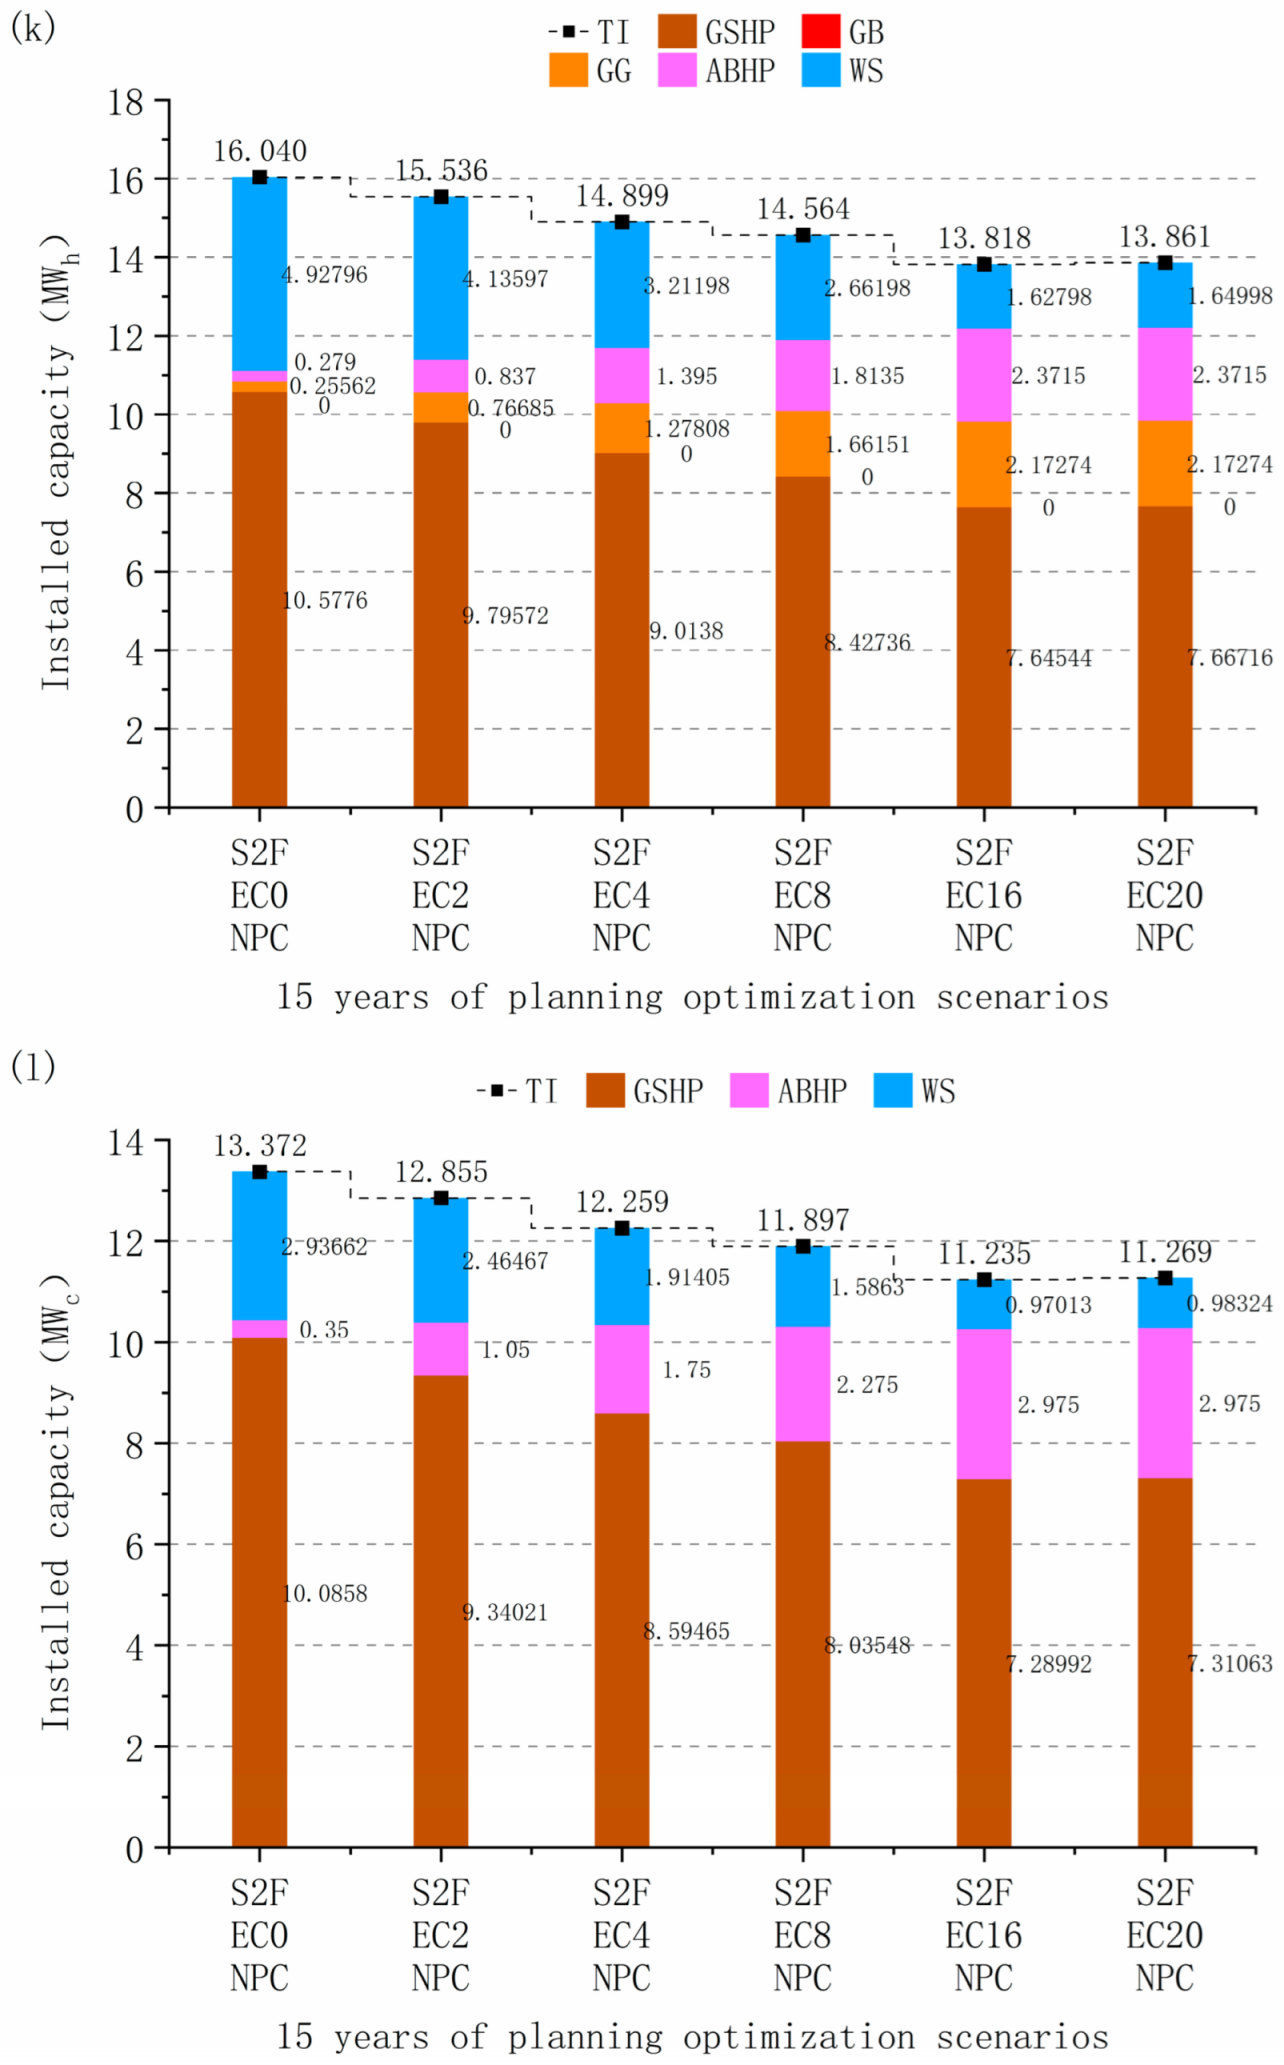
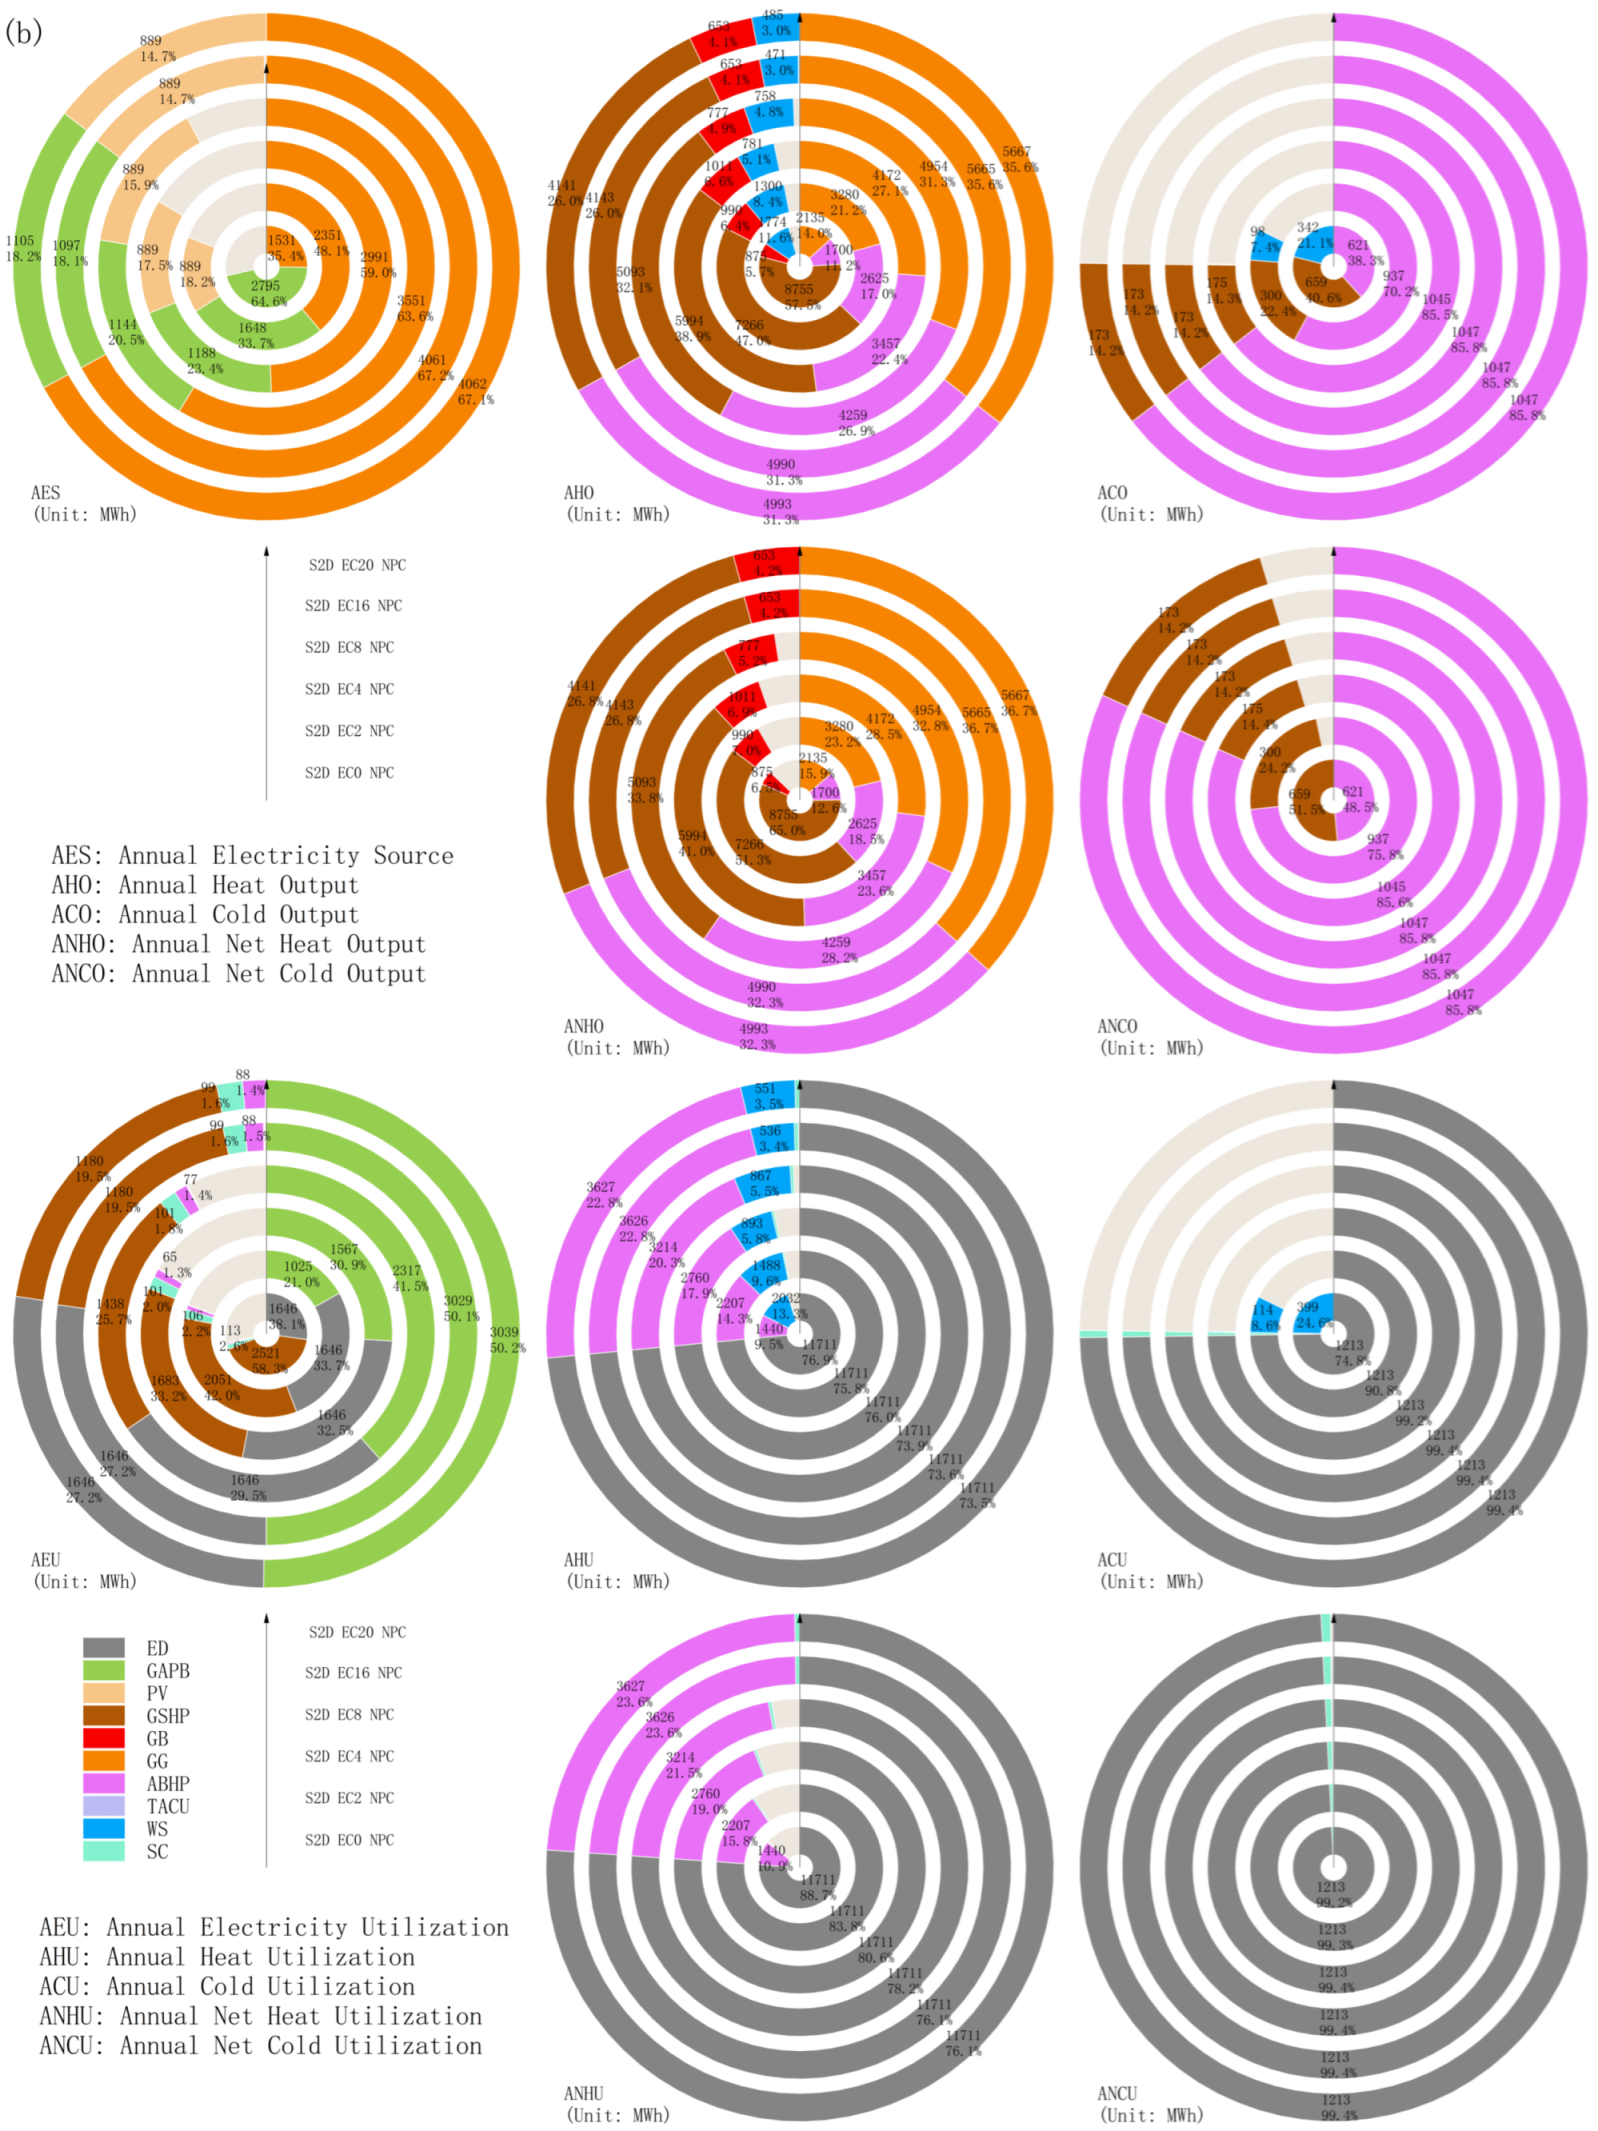
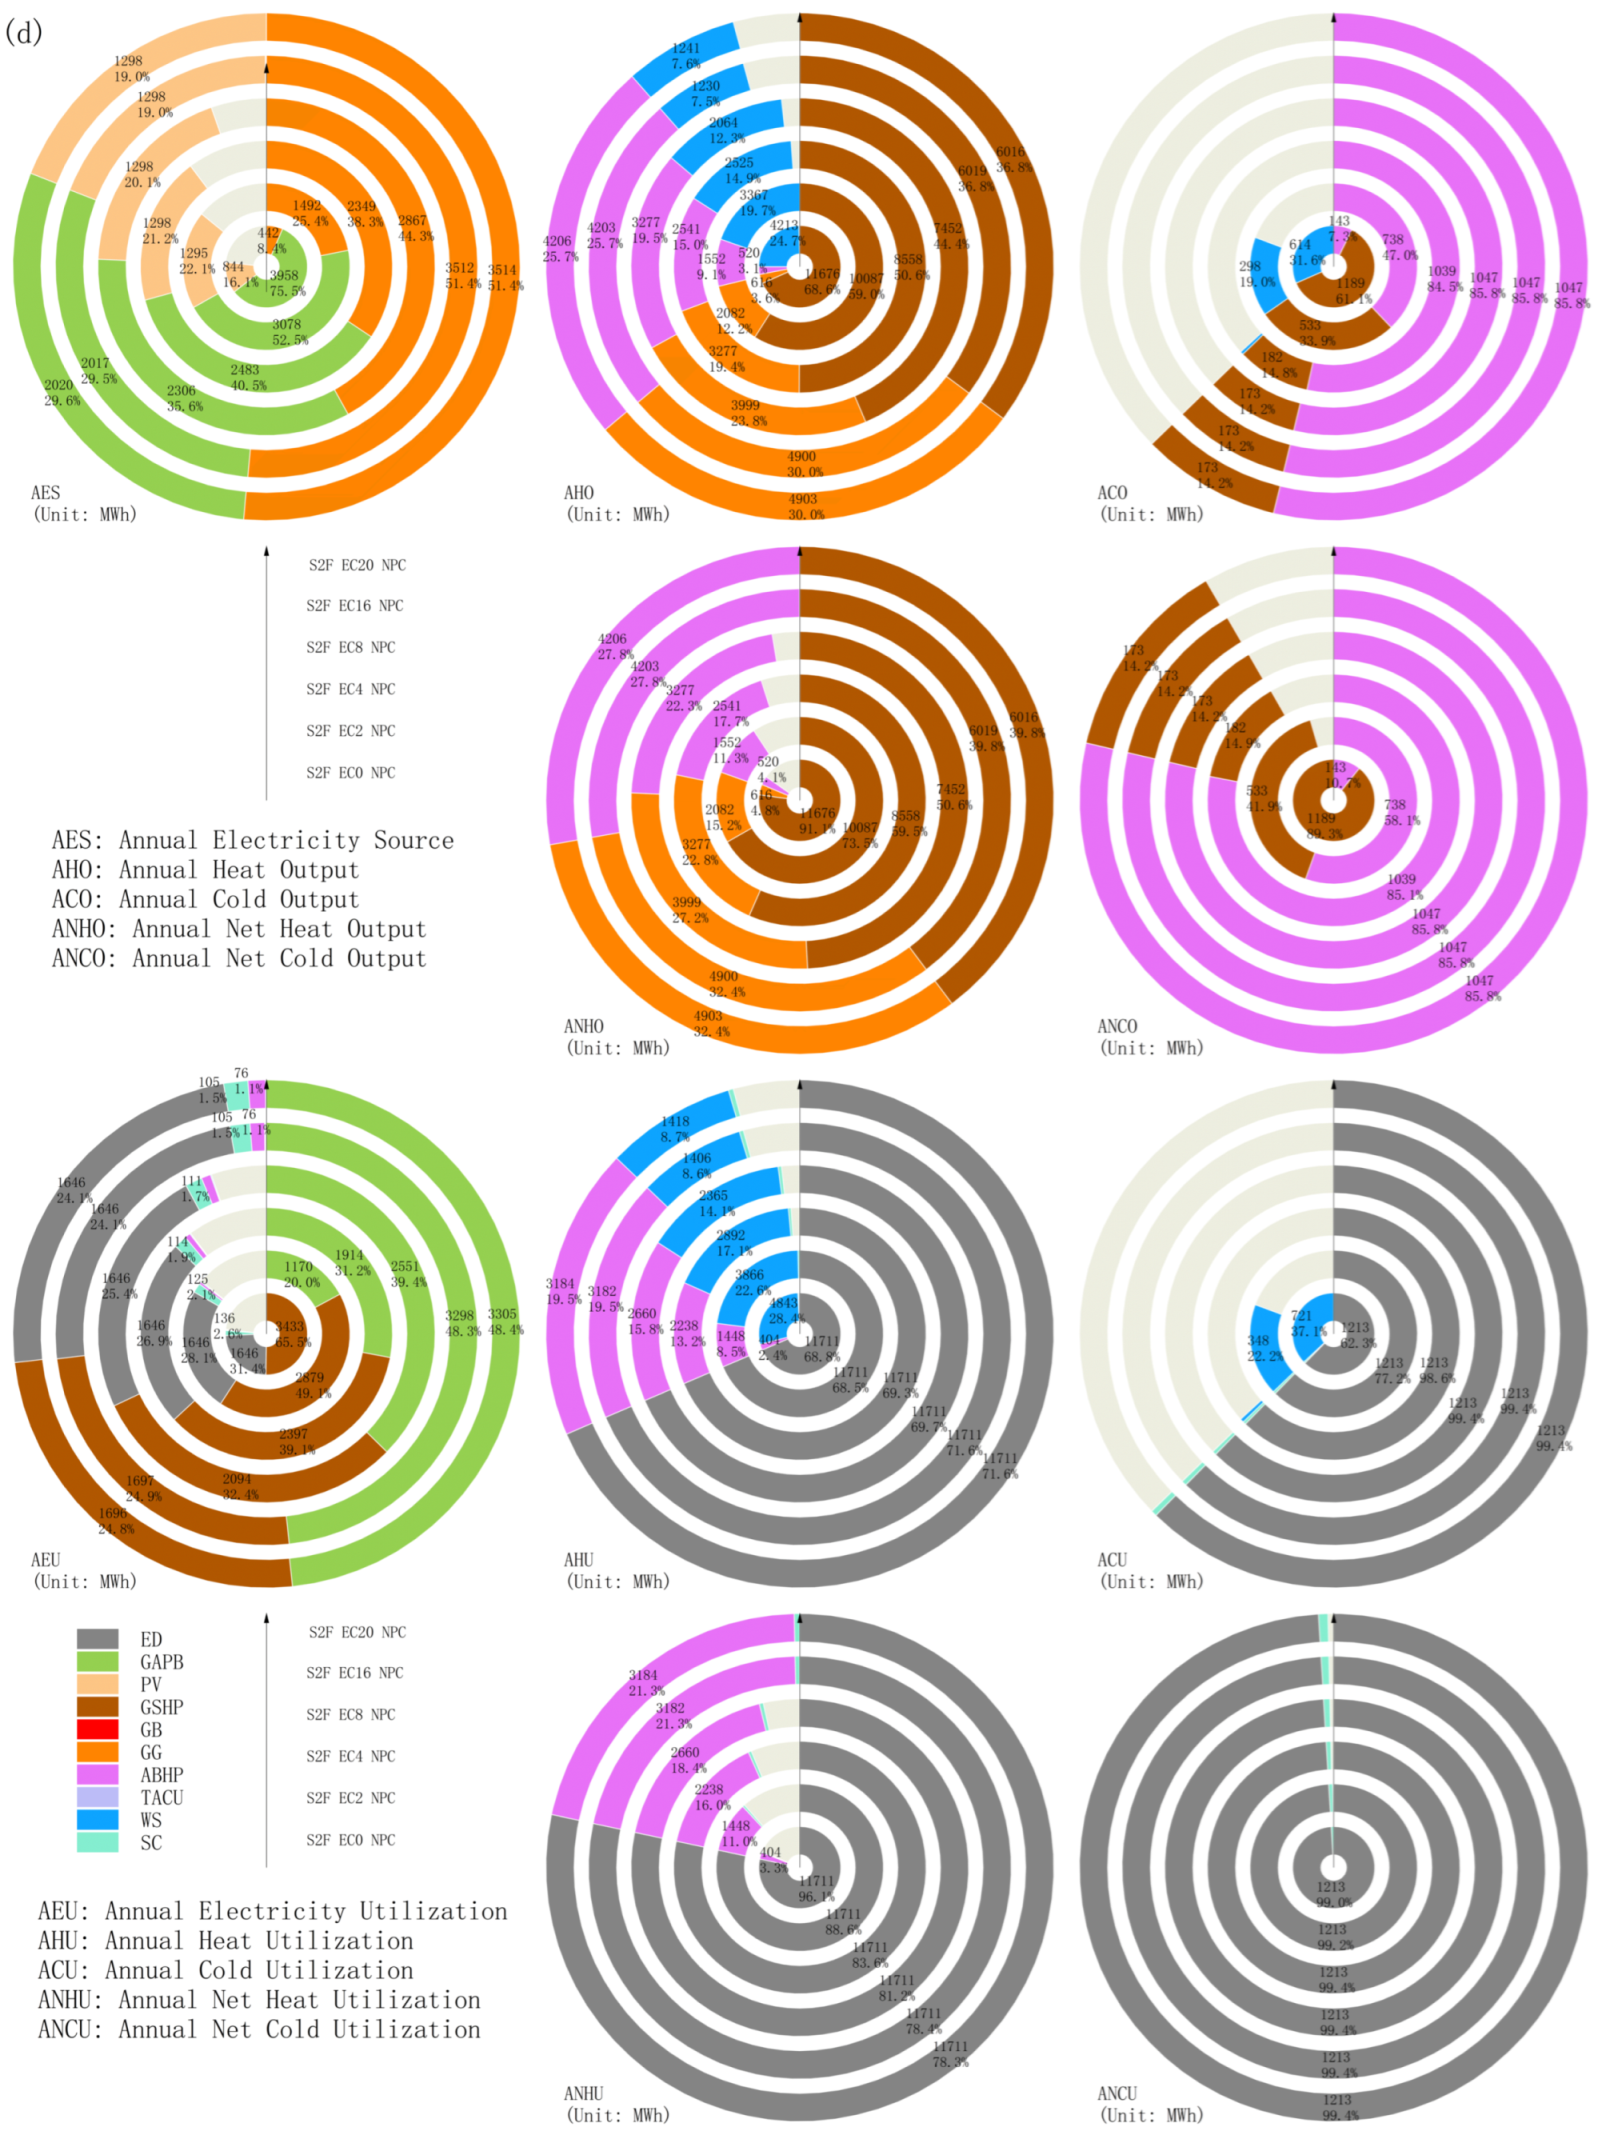
Figure 20 presents economically optimal equipment capacity configurations across multiple operational scenarios, revealing distinct capacity allocation ratios across scenarios along with EC-dependent capacity evolution patterns under equivalent planning constraints, see Figure A3 for details. Comparative analysis of S2C/S2D reveals that, given a fixed existing boiler capacity, while inducing substantial capacity redundancy, enhanced GSHP and CCHP capacity allocations yield improved long-term economic returns and carbon mitigation potential at the expense of elevated capital expenditures. In contrast, scenarios S2E/S2F without boiler capacity limitations demonstrate greater potential for synergistic energy conservation through optimized GSHP and thermal energy storage integration.
Figure 21 demonstrates the variations in total energy supply capacity and energy storage configurations across optimization scenarios. Figure 21a reveals that scenario S2D maintains substantial heating capacity redundancy within the hybrid energy system, stemming from predetermined boiler capacity constraints, yet necessitates supplementary CCHP and GSHP deployment to achieve cost-effectiveness, creating underutilized boiler assets that contribute to thermal redundancy. In contrast, scenarios S2E/SIIF demonstrate more pronounced cooling capacity redundancy, which is attributable to the district’s cooling load being 40–60% lower than thermal demand levels. The system-integrated GSHP and absorption heat pumps operate in dual heating-cooling modes, where, under the condition that the boiler capacity is not constrained, heat pump capacity optimization primarily aligns with heating requirements, creating excess cooling capacity potential. Energy storage capacity scales proportionally to heat pump deployment through synergistic operational strategies between the two systems, suggesting significant potential for expanding district cooling coverage under current configurations.
Figure 21b–d demonstrates that enhanced self-generation utilization drives increased economically optimal power generation capacity. Notably, with thermal/cooling capacity allocations remaining stable, optimal energy storage configurations exhibit progressive reduction. This phenomenon occurs because storage economics are largely influenced by the optimization of the synergy between ground source heat pumps (GSHP) and valley electricity.. Expanded generation capacity enables CCHP systems to satisfy thermal demands instantaneously, while self-generation-powered GSHP operations maintain cost stability regardless of time-of-use tariff fluctuations, collectively diminishing the system’s reliance on energy storage solutions.

4.3.3. Multi-Investment Planning Scenarios Energy Supply and Demand Structure

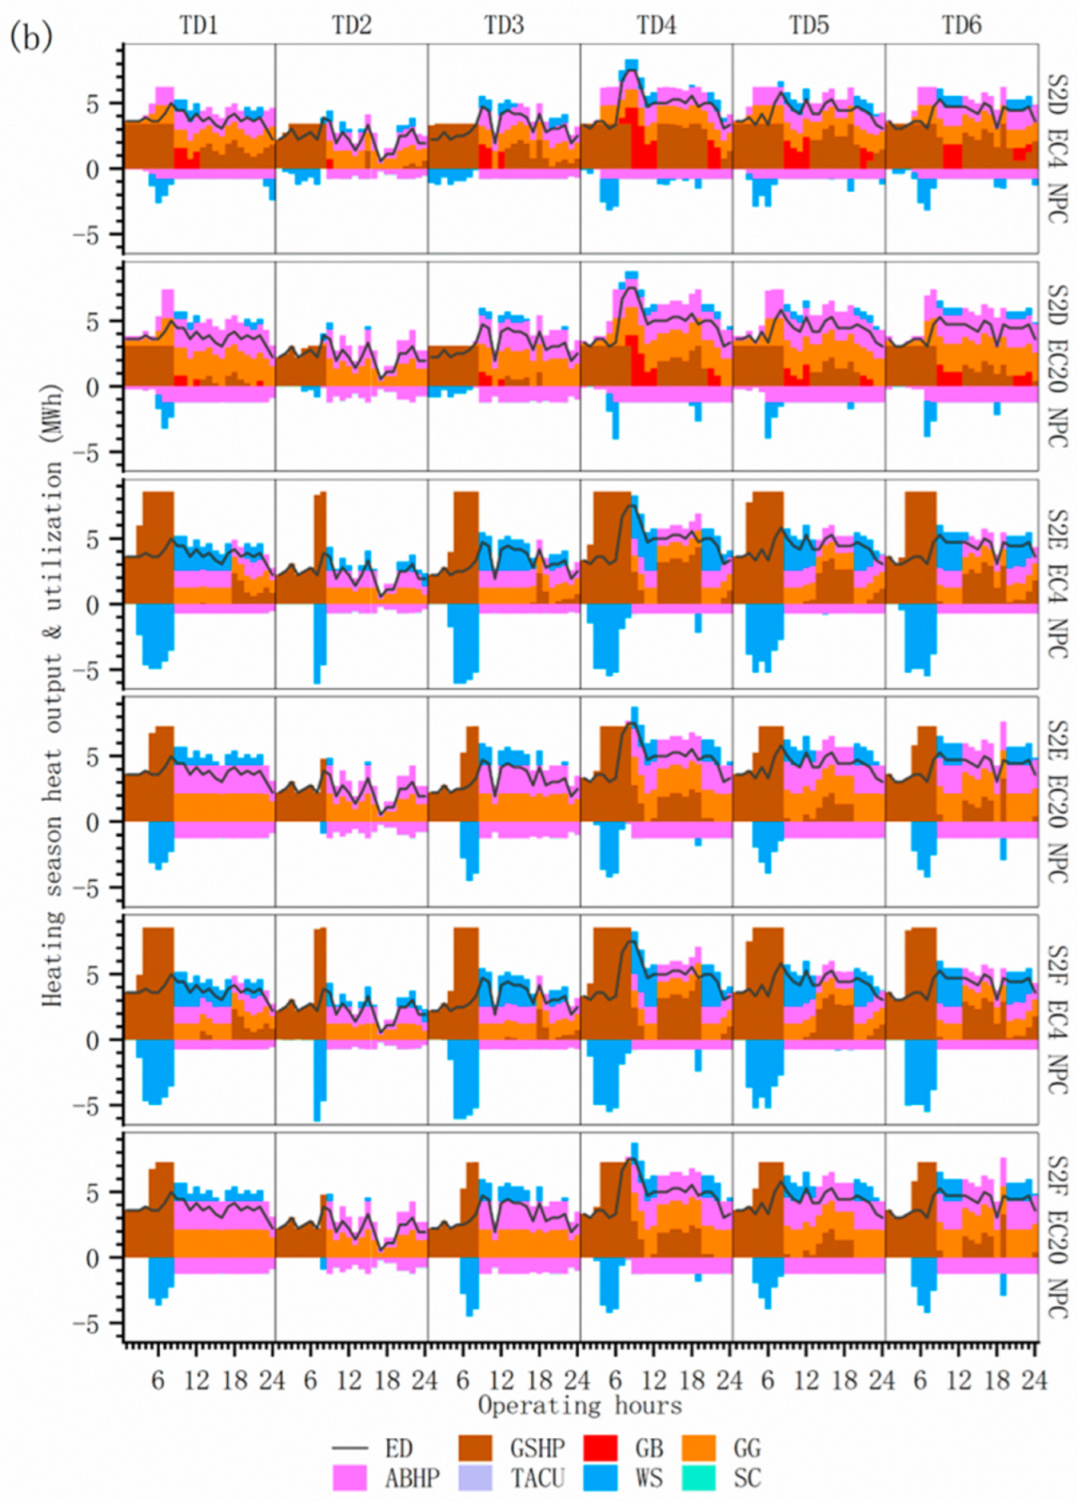
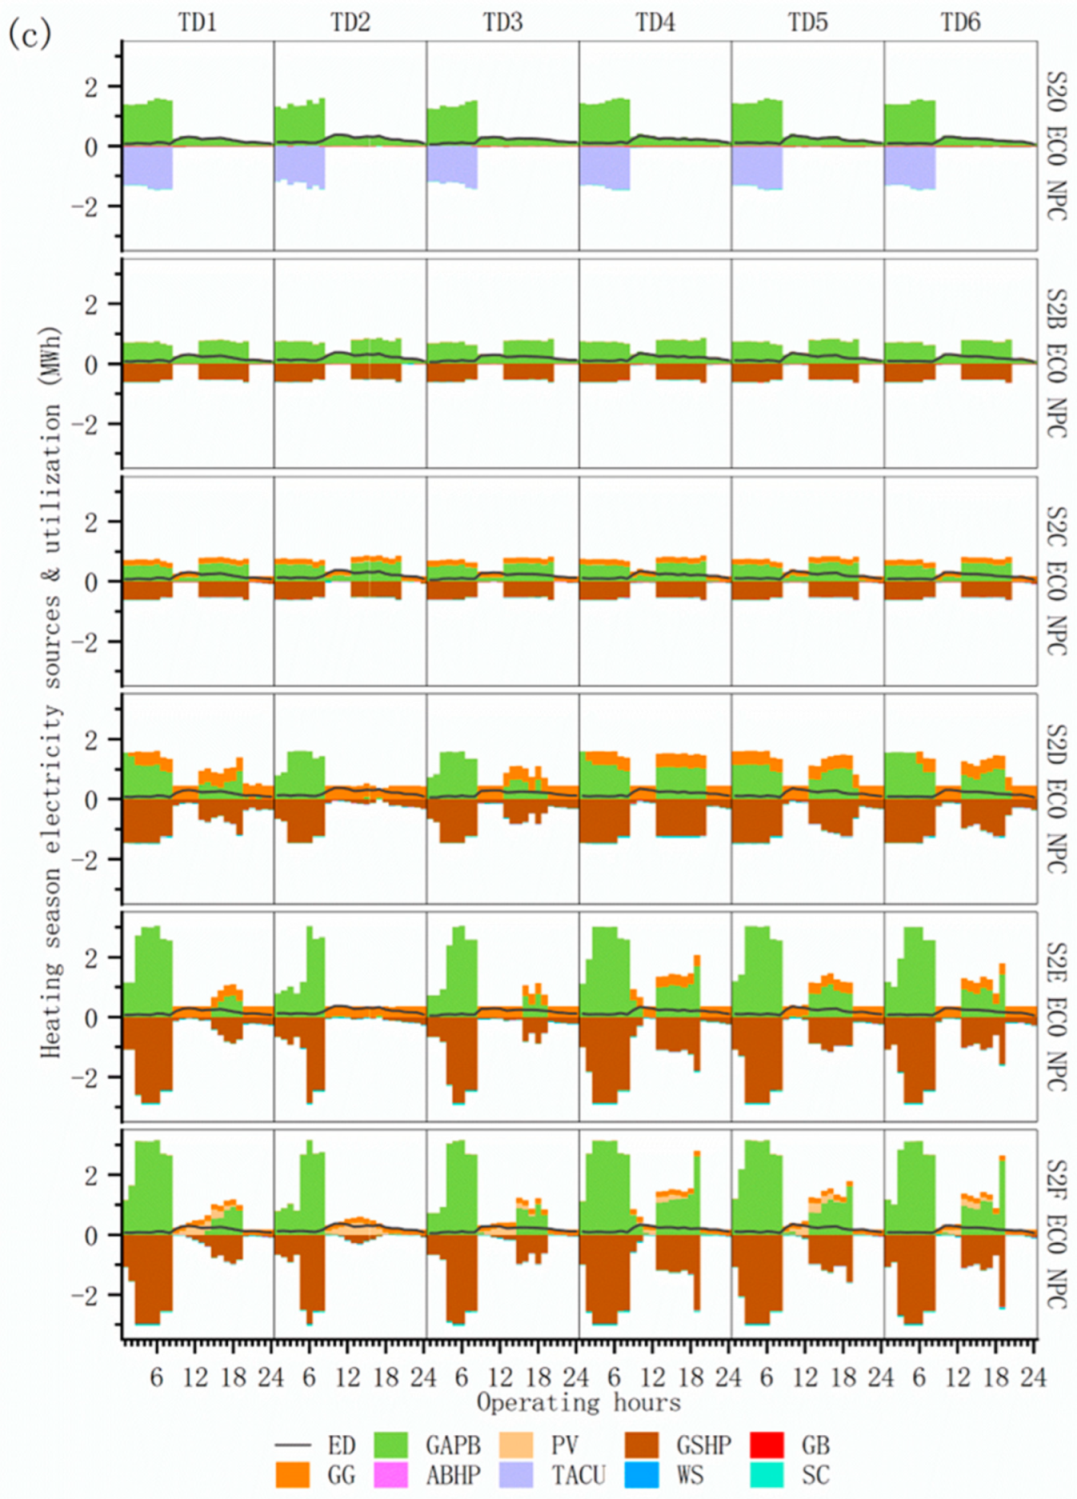
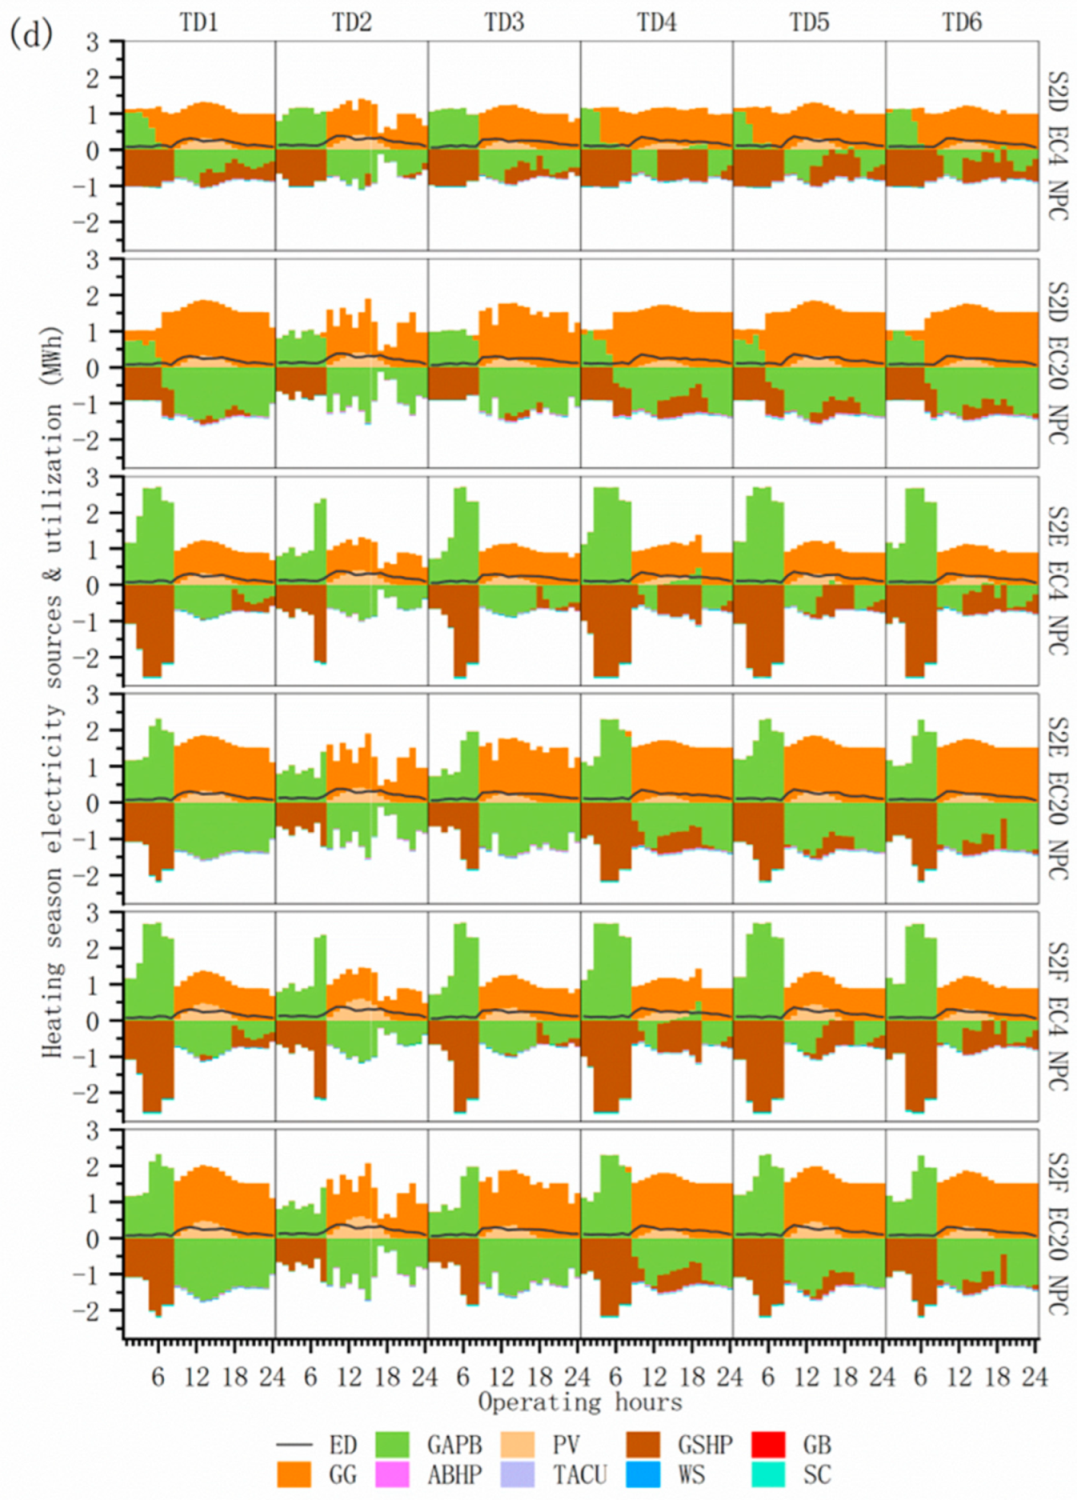
Figure 22 presents the annual energy dispatch patterns of cost-optimized configurations across planning scenarios, see Figure A4 for details. Compared to baseline configurations, scenarios S2D/S2E/S2F demonstrate enhanced thermal energy storage engagement in seasonal heat dispatch driven by elevated GSHP thermal output. GSHP serves as the primary thermal provider in EC0 sub-scenarios. Whereas in EC2 (EC ≥ 2) sub-scenarios, CCHP systems attain operational dominance in thermal supply, with contribution ratios scaling positively with EC elevation. This operational shift correspondingly reduces thermal energy storage dispatch volumes.
System-level coordinated thermal operation demonstrates PV generation-dependent variations exclusively in EC0 scenarios (S2E vs. S2F). Under EC0 constraints, elevated renewable penetration in S2F reduces CCHP generation requirements, while enhanced GSHP deployment fulfills thermal demands through renewable-powered operation. EC2 (EC ≥ 2) sub-scenarios show consistent annual thermal output distributions across S2E/S2F configurations, where self-generation capacity already satisfies on-site demands while feeding surplus to the distribution grid. Surplus PV generation displaces gas-based electricity production, achieving concurrent cost savings and carbon mitigation, without altering operational patterns of core equipment (e.g., GSHP power consumption profiles).

4.3.4. Comparison of Operational Options for Multi-Investment Planning Scenarios

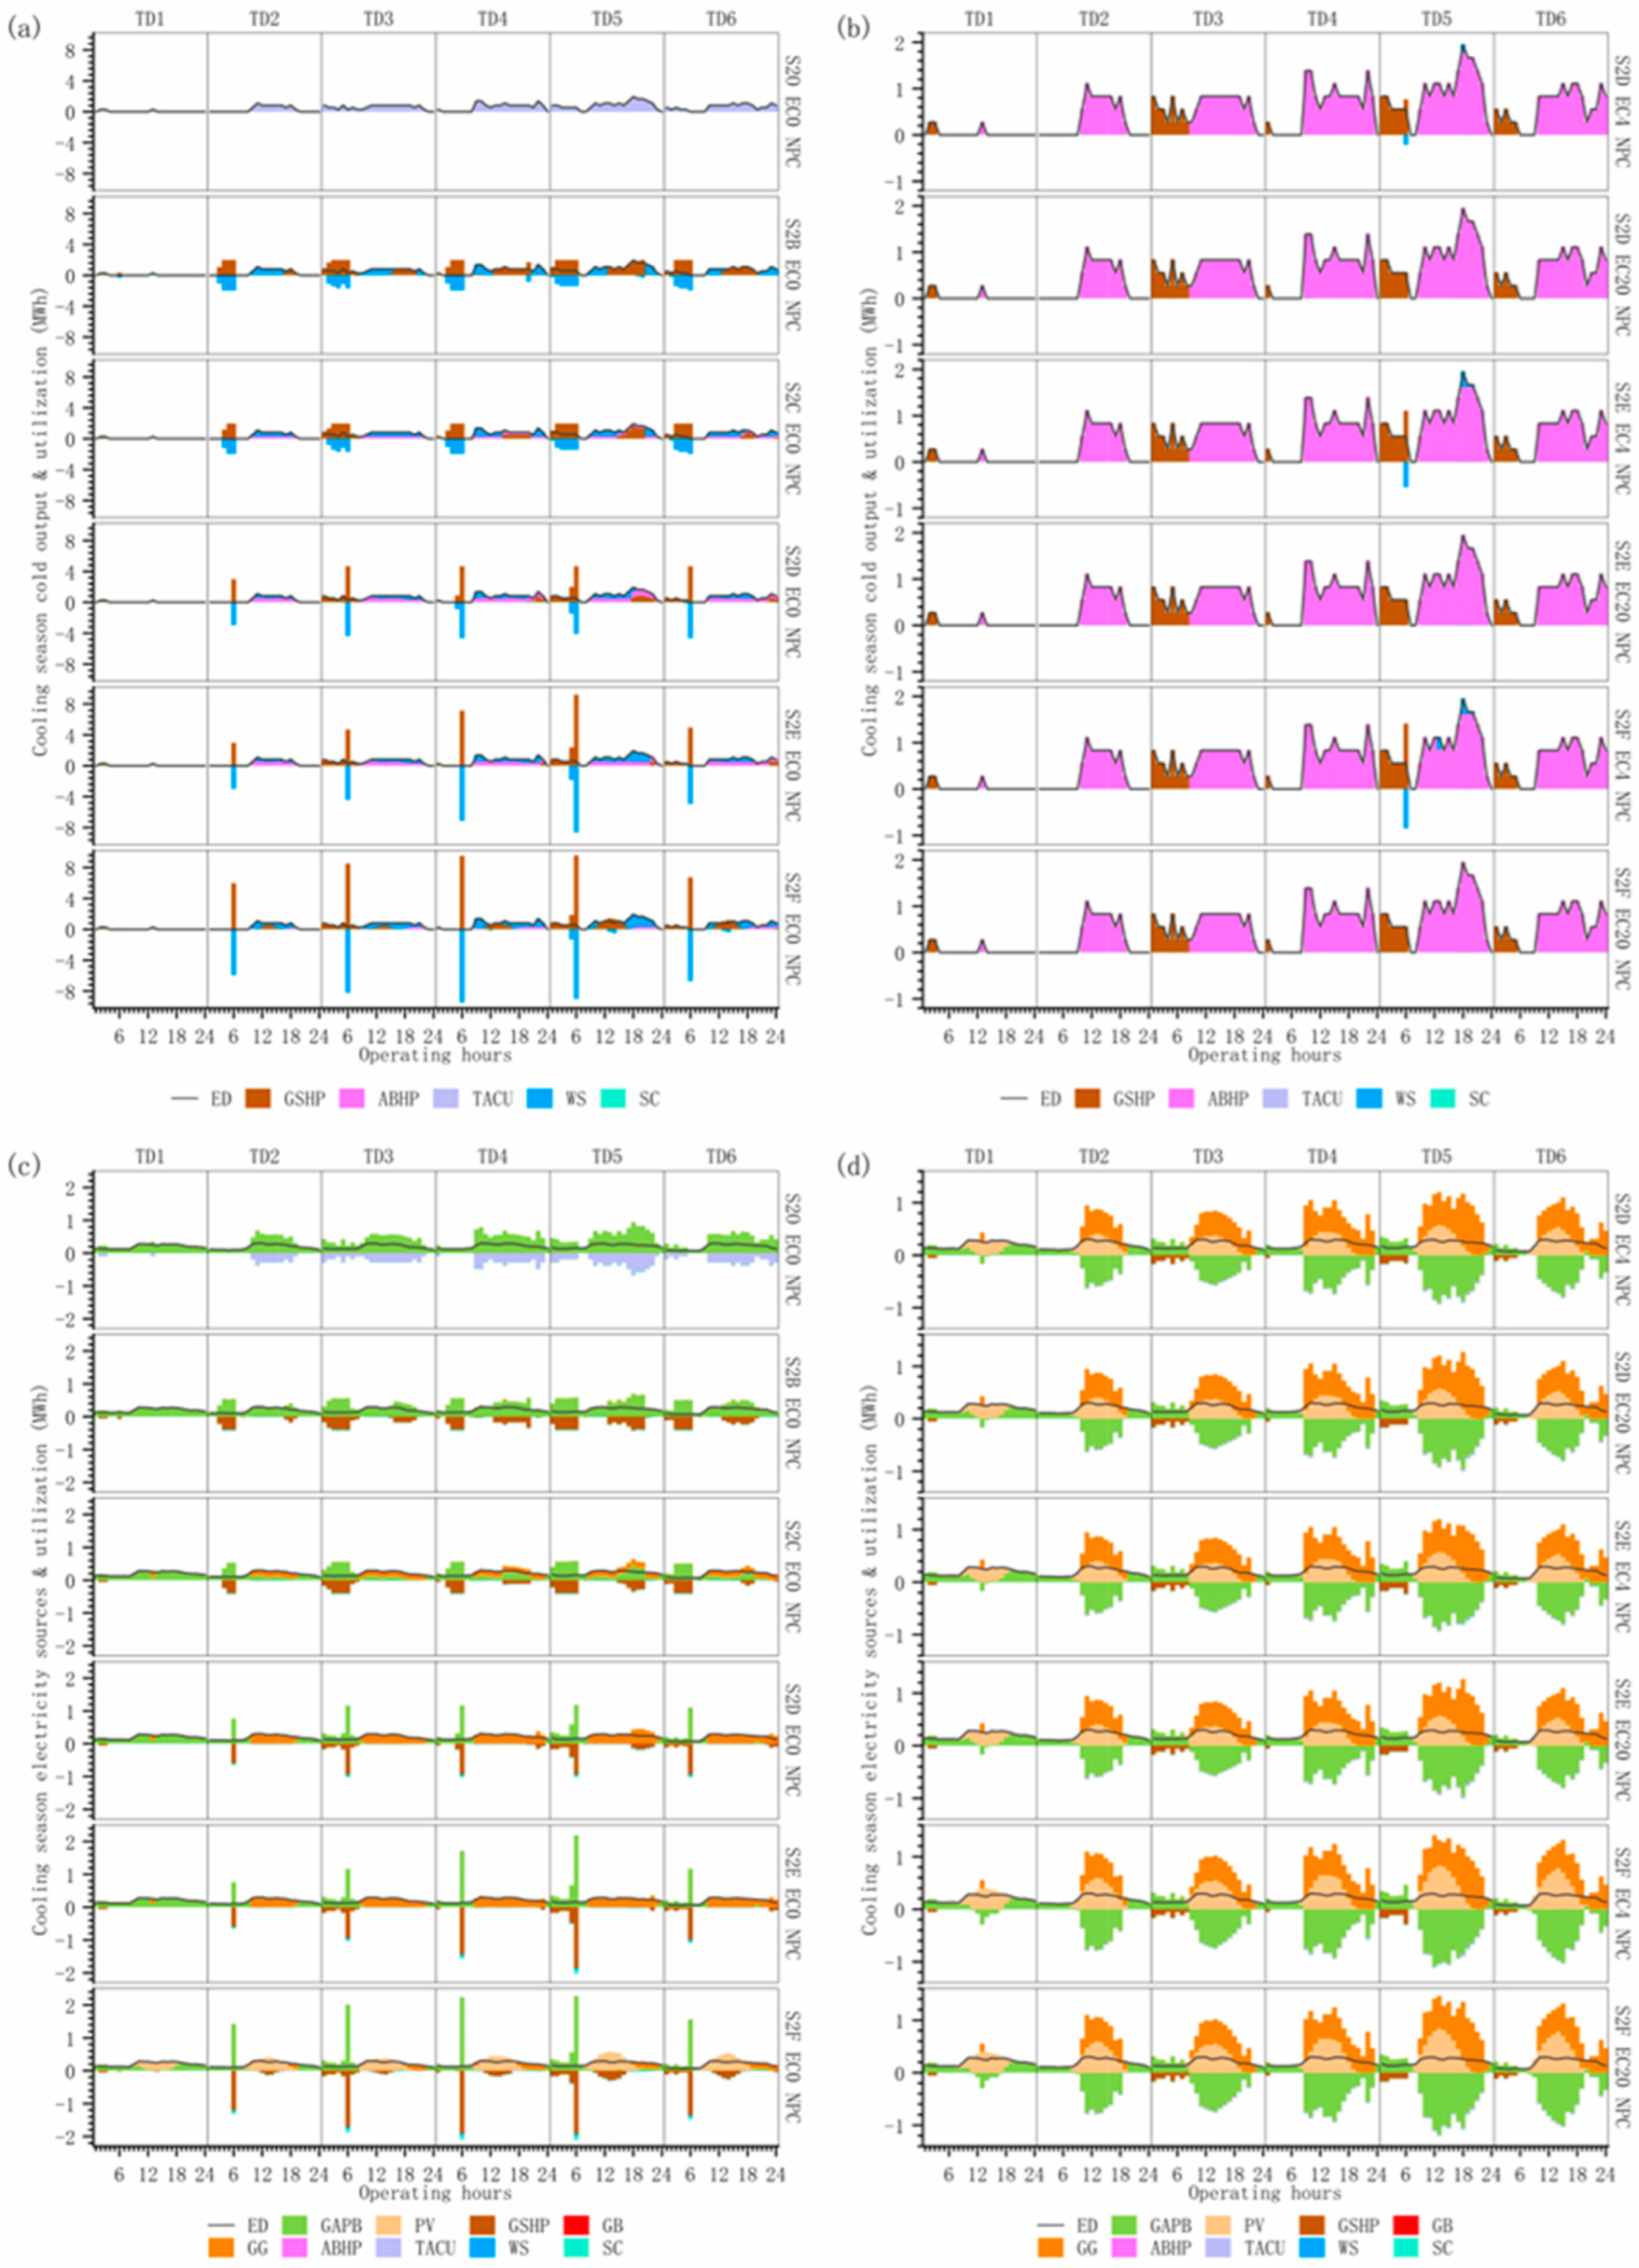
Figure 23 reveals consistent heating season operational patterns between current configurations (S2B/S2C) and optimized scenarios (S1B/S1C), see Figure A5 for details. Boilers maintain a substantial operational presence across the heating season typical days, serving as primary heating sources during specific periods. Under scenario S2D EC0, GSHP assumes heating dominance while boilers operate in supplementary mode, maintaining low-load operation (30–45%) during most periods and approaching standby status in selected typical days. Progressive transition from GSHP to CCHP-based heating dominance occurs with EC escalation across S2D/S2E/S2F scenarios, where GSHP operation becomes restricted to off-peak electricity periods on specific typical days. Enhanced GSHP redundancy in S2E/S2F drives coordinated reductions in thermal storage operating hours and heat retention periods, optimizing thermal efficiency through minimized energy dissipation.
Under EC0 conditions across S2D/S2E/S2F scenarios, the energy station employs municipal grid electricity exclusively during off-peak and standard tariff periods as an economic optimization strategy. Heat pump operation is suspended during non-optimized periods, while thermal supply is maintained through coordinated CCHP-storage operation, with peak-period power requirements for auxiliary equipment fulfilled through CCHP generation. In EC4/EC20 sub-scenarios, municipal grid electricity engagement is restricted to nocturnal off-peak windows. Station operations are sustained through integrated photovoltaic–gas generation systems during the remaining periods, concurrently fulfilling partial grid demand through surplus generation capacity.
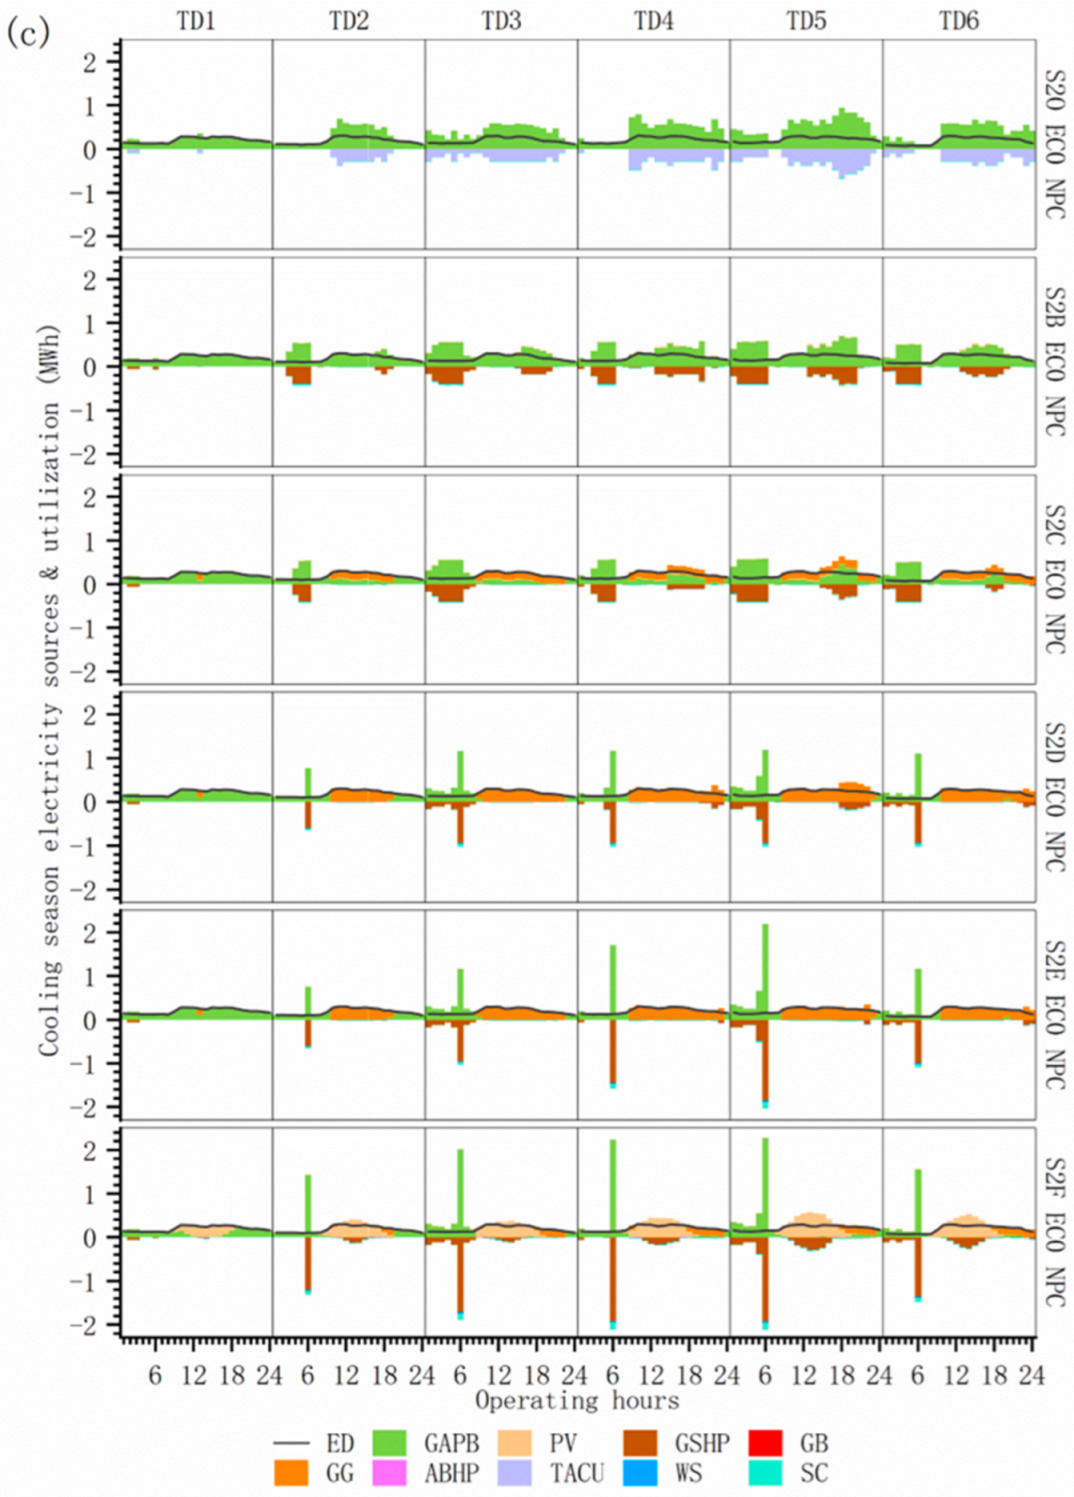
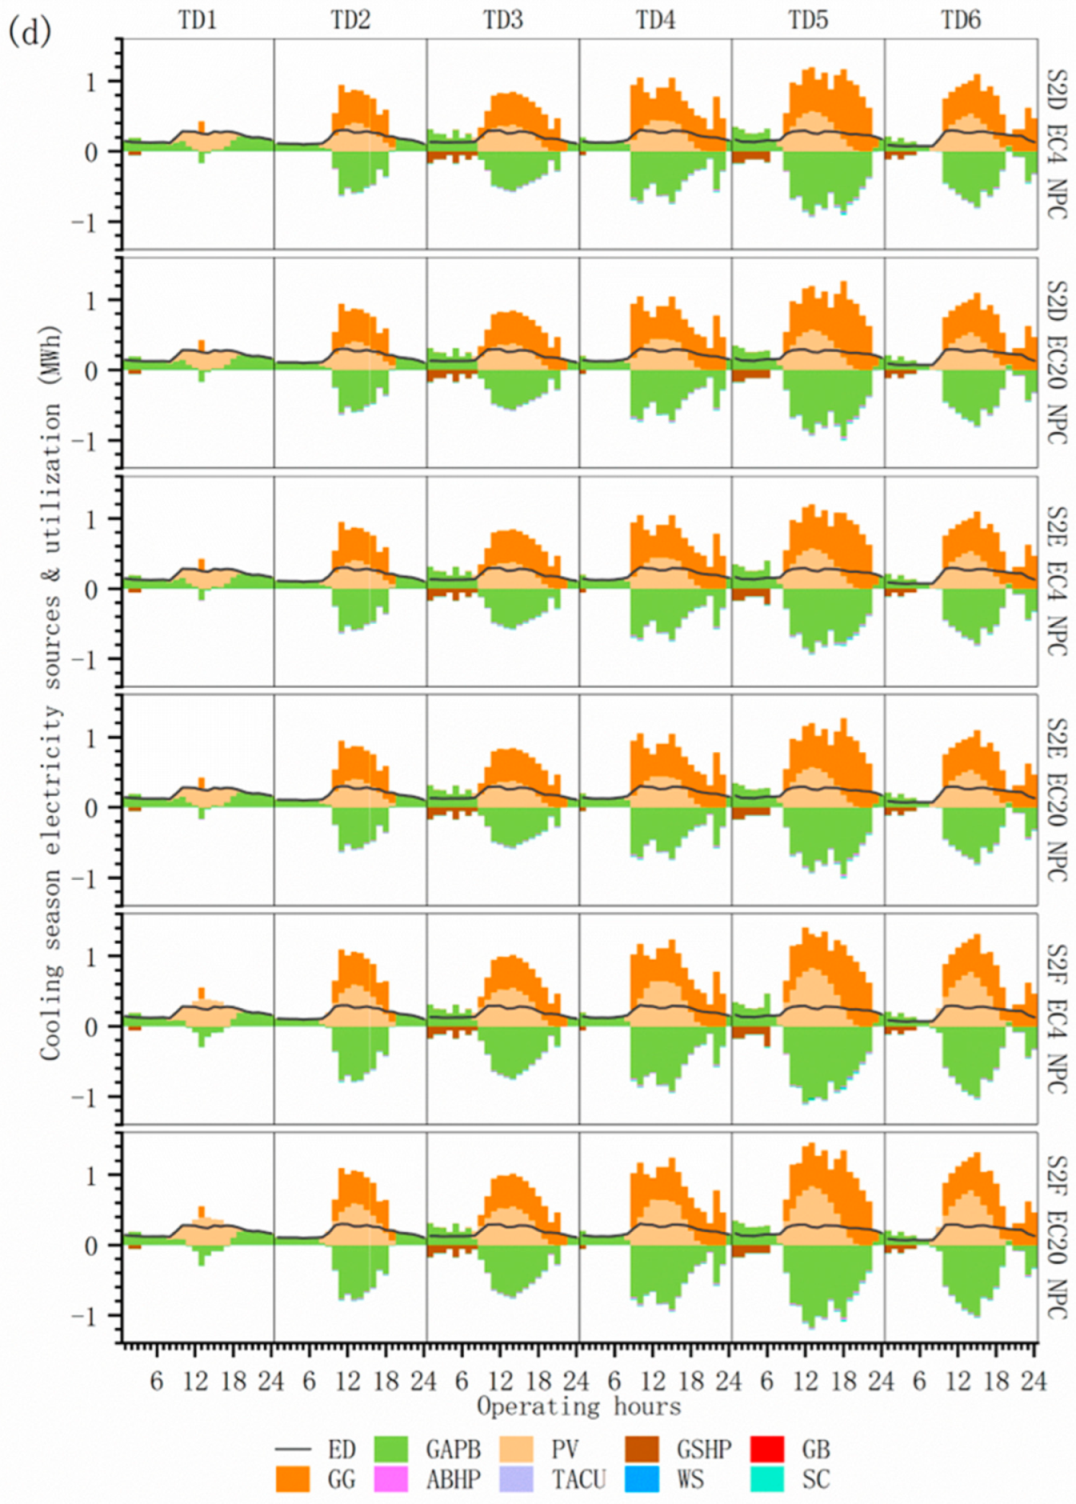
Figure 24 demonstrates that, under EC0 conditions in S2D/S2E/S2F scenarios, GSHP operation is limited to brief early-morning activation (06:00–08:00), with thermal energy storage satisfying 100% daily cooling demand due to excess capacity, see Figure A6 for details. Under EC4/EC20 conditions where CCHP leads daytime cooling supply, GSHP operation is confined to direct cooling mode during nocturnal periods of selected typical days, with thermal storage engagement restricted to peak cooling demand days (e.g., typical day 5). While achieving cost-optimal system performance, significant underutilization of installed capacity persists, attributable to the 65:35 cooling-to-heating load ratio in the district.
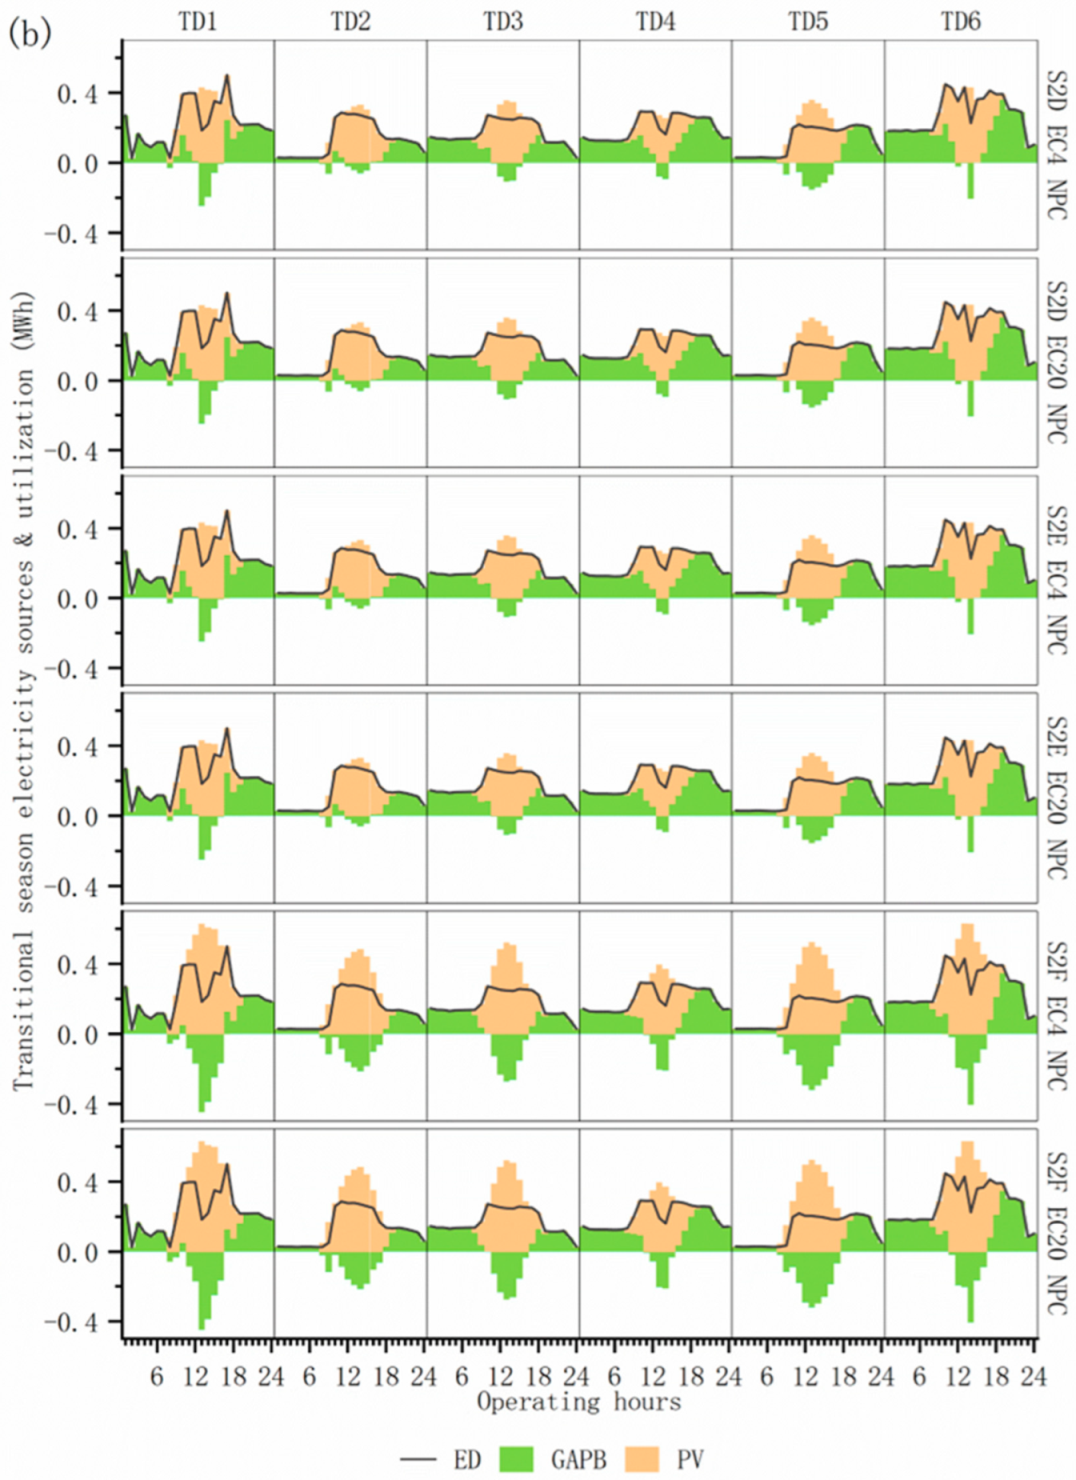
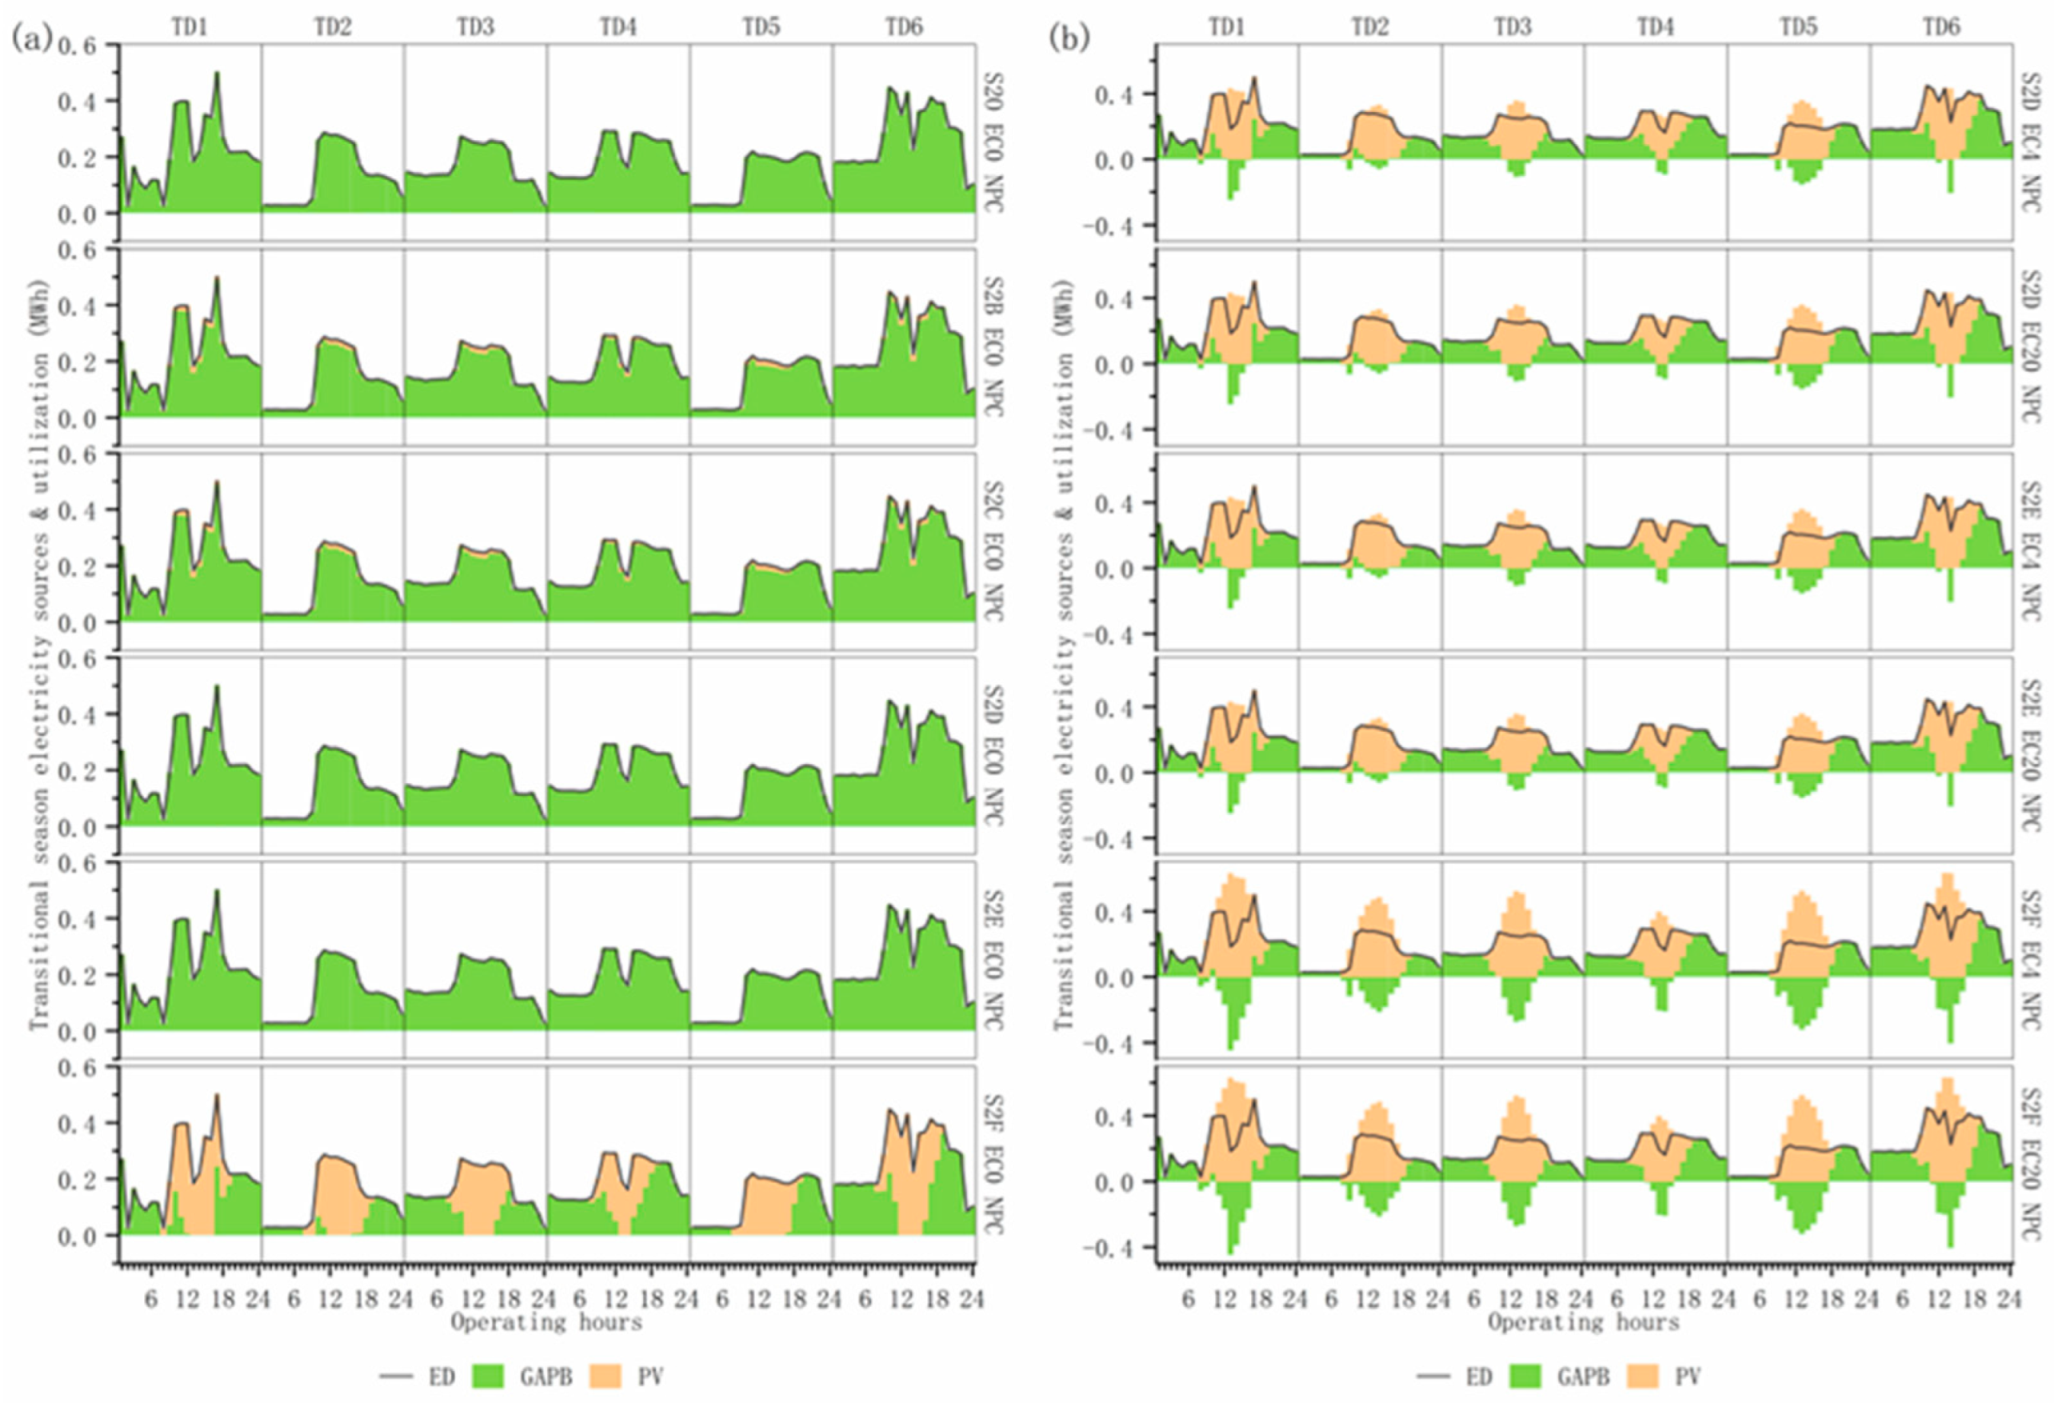
Figure 25a reveals minimal PV generation output during transitional season operations under EC0 non-coordinated conditions, see Figure A7a for details. Comparative analysis of current system configurations (S2B/S2C) with S2D/S2E scenarios reveals distinct photovoltaic capacity allocations and annual generation patterns. Under existing PV generation parameters, photovoltaic systems demonstrate limited economic viability when servicing single-building loads, leading optimization strategies to prioritize allocating initial capital to other system components. Only under S2F scenarios calibrated to local average PV output benchmarks do photovoltaic systems attain superior cost-effectiveness under equivalent load conditions.
Within the coordinated optimization framework, PVs emerges as the dominant power supply during transitional seasons at EC4 self-generation absorption levels. However, PV generation shows no incremental enhancement under EC20 benchmark conditions, constrained by district-level PV development ceilings and available rooftop installation capacity. The maximum economically viable PV capacity is already attained in the EC4 configuration.

5. Conclusions

This study performs semi-quantitative operational state analysis using district energy system runtime sampling data with constrained data quality. Through developing multi-scenario comparative frameworks and sensitivity analysis methodologies, this research systematically evaluates (1) energy efficiency and emission reduction potential, (2) operational optimization strategies, (3) equipment upgrade feasibility, (4) scalability of system paradigms, and (5) synergistic optimization potential between district heating/cooling systems and power incremental distribution networks. The derived conclusions regarding system optimization and paradigm scalability are structured as follows:
(1)
Under standard operating conditions, ground source heat pumps (GSHP) are contraindicated during nocturnal peak tariff windows. When nocturnal thermal loads surpass GSHP rated capacity while redundant demand is addressable by auxiliary systems, direct GSHP operation without thermal storage integration becomes feasible. In scenarios where nocturnal loads exceed GSHP capacity thresholds yet auxiliary systems maintain low-load operation with aggregate output surplus, integrated thermal storage operation becomes strategically viable.
(2)
Under extended thermal dispatch cycles, GSHP–storage integration utilizing off-peak electricity may not demonstrate superior economic performance compared to direct standard-rate electricity utilization. Therefore, thermal energy storage charging operations should be temporally proximal to discharge periods within cost-optimal charging windows, provided that storage capacity requirements are satisfied, to minimize thermal losses associated with prolonged storage duration. Optimal operational strategies require dynamic optimization based on forecasted diurnal demand profiles.
(3)
Annual operational optimization analyses demonstrate that retrofitted CCHP systems maintain significant economic viability and carbon mitigation potential even under current specific conditions characterized by low electricity and elevated gas pricing regimes, with energy cost savings potentially offsetting retrofit investments while yielding long-term operational benefits.
(4)
Comparative analyses between baseline operations (S2B/S2C) and optimized schemes reveal inherent inefficiencies in empirically derived operational strategies. Implementation of intelligent operation optimization becomes imperative for coordinated multi-device operations and maximization of energy conservation and emission mitigation potential in district energy systems.
(5)
Comparative assessments with multiple benchmark optimization schemes reveal suboptimal capacity allocations for GSHP and CCHP systems in current configurations. This suboptimal configuration results in partial realization of integrated energy system advantages, with substantial unexploited potential for long-term economic gains and carbon mitigation persisting.
(6)
Benchmarking against current installations under fixed boiler capacity constraints reveals that long-term economic-optimal configurations necessitate expanded GSHP and CCHP capacities. Strategic acceptance of equipment redundancy becomes economically justifiable within feasible capital expenditure frameworks, enabling enhanced economic returns and carbon mitigation benefits, rather than being constrained by legacy system capacities.
(7)
Systematic assessments of coordinated electrical load sensitivity reveal that grid-parallel non-export scenarios enable enhancement in energy cascade utilization efficiency through synergistic optimization of district thermal networks and power distribution systems compared to standalone energy station operations.
Nevertheless, this study exhibits several limitations. Missing data processing solely relied on feature analysis, while equipment retrofitting analysis excluded pipeline network impacts. Additionally, incremental distribution network demand response programs were not incorporated. Therefore, future work will incorporate advanced algorithms with explicit consideration of load-side demand response to create more detailed energy system models, such as network models, for a comprehensive analysis of district heating station retrofitting.

Author Contributions

Conceptualization, J.L. and Y.Z.; Methodology, G.L., X.L. and J.L.; Software, S.X., J.L. and Y.Z.; Validation, X.Z., F.Z., N.X., Y.H. and J.L.; Formal analysis, G.L., X.Z., X.L., H.Z., F.Z., N.X., Y.H., S.X. and J.L.; Investigation, G.L., X.Z., X.L., H.Z., F.Z., N.X., Y.H. and J.L.; Resources, X.Z., F.Z., N.X., Y.H., J.L. and Y.Z.; Data curation, X.L., S.X. and J.L.; Writing—original draft, G.L.; Writing—review & editing, Y.S., C.J., R.J. and J.L.; Visualization, G.L., X.L., H.Z. and J.L.; Supervision, J.L. and Y.Z.; Project administration, Y.Z.; Funding acquisition, R.J. and J.L. All authors have read and agreed to the published version of the manuscript.

Funding

This research was funded by National Natural Science Foundation of China No. 52576024, and National Natural Science Foundation of China No. 52306027. The work is also supported by Fujian Provincial Natural Science Foundation of China No. 2025J01039, the Fundamental Research Funds for the Central Universities No. 20720220081, the Guangdong Basic and Applied Basic Research Foundation No. 2023A1515240056, and the Fundamental Research Funds for the Central Universities No. 207202200101.

Data Availability Statement

The model formulation and data that support the findings of this study are available by reasonable request to authors.

Conflicts of Interest

Author Xiaoyi Zhong was employed by the State Grid Shanghai Electric Power Supply Company, Author Fuzheng Zhang was employed by the State Nuclear Electric Power Planning Design & Research Institute Co., Ltd., Author Ning Xiao was employed by the State Power Investment Corporation Limited, Author Yi He was employed by the State Power Investment Corporation Hebei Electric Power Co., Ltd. The remaining authors declare that the research was conducted in the absence of any commercial or financial relationships that could be construed as a potential conflict of interest.

Abbreviations

The following abbreviations are used in this manuscript:
ABHPAbsorption Heat Pump
ACERAnnual Carbon Emission Reduction
ACOAnnual Cold Output
ACUAnnual Cold Utilization
AEPCAnnual Electricity Purchase Cost
AESAnnual Electricity Source
AEUAnnual Electricity Utilization
AGCAnnual Gas Cost
AGCEAnnual Gas Carbon Emissions
AHOAnnual Heat Output
AHUAnnual Heat Utilization
ANCOAnnual Net Cold Output
ANCSAnnual Net Cost Savings
ANCUAnnual Net Cold Utilization
ANHOAnnual Net Heat Output
ANHUAnnual Net Heat Utilization
ANOCAnnual Net Operating Costs
APCEAnnual Purchase of Carbon Emission
ASGER(PER)Annual Self-Generated Emission Reductions (Park Emission Reductions)
ASGI(PES)Annual Self-Generated Income (Park Energy Saving)
CCHPCombined Cooling, Heating, and Power Systems
CERCarbon Emission Reduction
CERRCarbon Emission Reduction Rate
CHPCombined Heat and Power
CSCost Savings
CSTWater Cold Storage
DENDistrict Energy Network
DHSDistrict Heating Systems
EDEnergy Demand
GAPBGrid Power Purchase/Park Power Supply
GBGas Boiler
GGGas Generator
GSHPGround Source Heat Pump
GSHP_L-FGround Source Heat Pump Load Factor
H-DHot Demand
Hourly_C-DHourly Cold Demand
Hourly_H-DHourly Hot Demand
HSTWater Heat Storage
ICInstalled Capacity
IDNIncremental Distribution Network
IESIntegrated Energy Systems
IICInitial Investment Cost
IPDHSIndustrial Park District Heating Systems
IQRInterquartile Range
L-FLoad Factor
NCRNet Cost Ratio
NCSRNet Cost Savings Rate
NGB_L-FNorth Boiler Load Factor
NPVCNet Present Value Cost
NPVOCNet Present Value Operating Costs
PPSL(ELR)Park’S Power Supply Level (Electric Load Ratio)
PVPhotovoltaic
PVEPCPresent Value Electricity Purchase Cost
PVGCPresent Value Gas Cost
PVMCPresent Value Maintenance Cost
PVSGI(PES)Present Value of Self-Generated Income (Park Energy Saving)
RCERelative Carbon Emissions
RNCRRelative Net Cost Ratio
SCSystem Consumption
SGB_L-FSouth Boiler Load Factor
TACETotal Annual Carbon Emissions
TACUTraditional Air Conditioning Unit
TCETotal Carbon Emission
TCERTotal Carbon Emission Reduction
TDTypical Day
TGCETotal Gas Carbon Emission
TITotal Installed
TPECETotal Purchased Electric Carbon Emissions
TSGER(PER)Total Self-Generated Emission Reductions (Park Emission Reductions)
U/R/SUnit/Range/State
WTSWater Treatment System
WSWater Storage
WS_CR_L-FEnergy Storage Cold Release Load Factor
WS_HREnergy Storage Heat Release
WS_HR_L-FEnergy Storage Heat Release Load Factor
WS_OSEnergy Storage Operation Status
WSHPWater Source Heat Pump

Appendix A

The appendix provides a more detailed graphical display for this article.
Figure A1. Optimized operation of the system for a typical day of heating under a multi-operation optimization scenario. (a) heat balance; (b) electrical balance.
Energies 18 05206 g0a1aEnergies 18 05206 g0a1b
Figure A2. Typical day optimized operation of the system for cooling under a multi-operation optimization scenario. (a) cold balance; (b) electrical balance.
Energies 18 05206 g0a2aEnergies 18 05206 g0a2b
Figure A3. Collaborative optimization of installed capacity configuration of the system under multi-investment planning scenarios. (a) S2EC0&20 installed capacity of electricity supply; (b) S2EC0&20 installed capacity of heating supply; (c) S2EC0&20 installed capacity of cooling supply; (d) S2D installed capacity of electricity supply; (e) S2D installed capacity of heating supply; (f) S2D installed capacity of cooling supply; (g) S2E installed capacity of electricity supply; (h) S2E installed capacity of heating supply; (i) S2E installed capacity of cooling supply; (j) S2F installed capacity of electricity supply; (k) S2F installed capacity of heating supply; (l) S2F installed capacity of cooling supply.
Energies 18 05206 g0a3aEnergies 18 05206 g0a3bEnergies 18 05206 g0a3cEnergies 18 05206 g0a3dEnergies 18 05206 g0a3eEnergies 18 05206 g0a3f
Figure A4. Economically optimal annual total energy output utilization structure of the system under the multi-investment planning scenario. (a) EC0 annual energy input and output; (b) S2D annual energy input and output; (c) S2E annual energy input and output; (d) S2F annual energy input and output.
Energies 18 05206 g0a4aEnergies 18 05206 g0a4bEnergies 18 05206 g0a4cEnergies 18 05206 g0a4d
Figure A5. Multi-investment planning scenarios for optimizing the operation of a typical day of the park energy system for heating. (a) S2EC0 heat balance for the heating season; (b) S2DEF EC4&20 heat balance for the heating season; (c) S2EC0 electrical balance for the heating season; (d) S2DEF EC4&20 electrical balance for the heating season.
Energies 18 05206 g0a5aEnergies 18 05206 g0a5bEnergies 18 05206 g0a5cEnergies 18 05206 g0a5d
Figure A6. Optimized operation of a typical day of cooling for a system under a multi-investment planning scenario. (a) S2EC0 cold balance during the cooling season; (b) S2DEF EC4&20 cold balance during the cooling season; (c) S2EC0 electrical balance for the cooling season; (d) S2DEF EC4&20 electrical balance for the cooling season.
Energies 18 05206 g0a6aEnergies 18 05206 g0a6bEnergies 18 05206 g0a6cEnergies 18 05206 g0a6d
Figure A7. Optimized operation of the system on a typical day of the transition season under a multi-investment planning scenario. (a) S2EC0 electrical balance in transition season; (b) S2DEF EC4&20 electrical balance in transition season.
Energies 18 05206 g0a7aEnergies 18 05206 g0a7b

References

  1. Nan, J.; Feng, J.; Deng, X.; Guan, L.; Sun, K.; Zhou, H. A two-stage robust generation expansion planning framework for regional integrated energy systems with carbon growth constraints. Front. Energy Res. 2023, 11, 1106628. [Google Scholar] [CrossRef]
  2. Hast, A.; Syri, S.; Lekavičius, V.; Galinis, A. District heating in cities as a part of low-carbon energy system. Energy 2018, 152, 627–639. [Google Scholar] [CrossRef]
  3. Koohi-Fayegh, S.; Rosen, M.A. A Review of Renewable Energy Options, Applications, Facilitating Technologies and Recent Developments. Eur. J. Sustain. Dev. Res. 2020, 4, em0138. [Google Scholar] [CrossRef] [PubMed]
  4. Autelitano, K.; Famiglietti, J.; Aprile, M.; Motta, M. Towards Life Cycle Assessment for the Environmental Evaluation of District Heating and Cooling: A Critical Review. Standards 2024, 4, 102–132. [Google Scholar] [CrossRef]
  5. Gong, Y.; Ma, G.; Jiang, Y.; Wang, L. Research progress on the fifth-generation district heating system based on heat pump technology. J. Build. Eng. 2023, 71, 106533. [Google Scholar] [CrossRef]
  6. Jiao, X.; Wu, J.; Mao, Y.; Luo, W.; Yan, M. An Optimal Method of Energy Management for Regional Energy System with a Shared Energy Storage. Energies 2023, 16, 886. [Google Scholar] [CrossRef]
  7. Li, W.; Tang, M.; Zhang, X.; Gao, D.; Wang, J. Optimal Operation for Regional IES Considering the Demand- and Supply-Side Characteristics. Energies 2022, 15, 1594. [Google Scholar] [CrossRef]
  8. Feng, P.; Jiang, G.; Li, K.; Xu, J.; Shen, Y.; Xu, W.; Wang, S. Two-stage stochastic robust optimization scheduling of electric–thermal microgrid with solid electric thermal storage. AIP Adv. 2024, 14, 015018. [Google Scholar] [CrossRef]
  9. Abbaspour, A.; Yousefi, H.; Aslani, A.; Noorollahi, Y. Economic and Environmental Analysis of Incorporating Geothermal District Heating System Combined with Radiant Floor Heating for Building Heat Supply in Sarein, Iran Using Building Information Modeling (BIM). Energies 2022, 15, 8914. [Google Scholar] [CrossRef]
  10. Dromart, C.; Puthod, L.; Kämpf, J.H.; Gunten, D.V. District heating network modelling for future integration of solar thermal energy. J. Phys. Conf. Ser. 2021, 2042, 012089. [Google Scholar] [CrossRef]
  11. Schmidt, D. Low Temperature District Heating for Future Energy Systems. Energy Procedia 2018, 149, 595–604. [Google Scholar] [CrossRef]
  12. Wang, J.; Pan, Z.; Li, S.; Ge, H.; Yang, G.; Wang, B. Optimal Scheduling of Virtual Power Plant Considering Reconfiguration of District Heating Network. Electronics 2023, 12, 3409. [Google Scholar] [CrossRef]
  13. Bareiss, K. Potential of power-to-heat from excess wind energy on the city level. Energy Sources Part B Econ. Plan. Policy 2020, 15, 26–43. [Google Scholar] [CrossRef]
  14. Zhao, R.; Zheng, W. Efficient operation of combined residential and commercial energy hubs incorporating load management and two-point approximation for uncertainty modeling. Comput. Electr. Eng. 2024, 116, 109197. [Google Scholar] [CrossRef]
  15. Sai Pandraju, T.K.; Samal, S.; Saravanakumar, R.; Yaseen, S.M.; Nandal, R.; Dhabliya, D. Advanced metering infrastructure for low voltage distribution system in smart grid based monitoring applications. Sustain. Comput. Inform. Syst. 2022, 35, 100691. [Google Scholar] [CrossRef]
  16. Leitner, B.; Widl, E.; Gawlik, W.; Hofmann, R. A method for technical assessment of power-to-heat use cases to couple local district heating and electrical distribution grids. Energy 2019, 182, 729–738. [Google Scholar] [CrossRef]
  17. Zhang, S.; Zhang, X.; Zhang, R.; Gu, W.; Cao, G. N-1 Evaluation of Integrated Electricity and Gas System Considering Cyber-Physical Interdependence. IEEE Trans. Smart Grid 2025, 16, 3728–3742. [Google Scholar] [CrossRef]
  18. Lyu, J.; Zhang, S.; Cheng, H.; Yuan, K.; Song, Y.; Fang, S. Optimal Sizing of Energy Station in the Multienergy System Integrated With Data Center. IEEE Trans. Ind. Appl. 2021, 57, 1222–1234. [Google Scholar] [CrossRef]
  19. Raja Guru, R.; Kumar, P. Self-restrained energy grid with data analysis and blockchain techniques. Energy Sources Part A Recovery Util. Environ. Eff. 2025, 47, 3441–3459. [Google Scholar] [CrossRef]
  20. Ting, Y.; Guoliang, L.; Yong, W.; Siyuan, S.; Meiling, Z.; Zhenning, Y. A tensor completion algorithm for missing user data in spot trading of electricity market. Comput. Electr. Eng. 2025, 122, 109988. [Google Scholar] [CrossRef]
  21. Zhang, X.; Wu, Z.; Sun, Q.; Gu, W.; Zheng, S.; Zhao, J. Application and progress of artificial intelligence technology in the field of distribution network voltage Control: A review. Renew. Sustain. Energy Rev. 2024, 192, 114282. [Google Scholar] [CrossRef]
  22. Capone, M.; Guelpa, E.; Verda, V. Exploring opportunities for temperature reduction in existing district heating infrastructures. Energy 2024, 302, 131871. [Google Scholar] [CrossRef]
  23. Stock, J.; Schmidt, T.; Xhonneux, A.; Müller, D. Optimisation of district heating transformation for the efficient integration of a low-temperature heat source. Energy 2024, 308, 132461. [Google Scholar] [CrossRef]
  24. De Souza, R.; Casisi, M.; Micheli, D.; Reini, M. A Review of Small–Medium Combined Heat and Power (CHP) Technologies and Their Role within the 100% Renewable Energy Systems Scenario. Energies 2021, 14, 5338. [Google Scholar] [CrossRef]
  25. Naimaster, E.J.; Sleiti, A.K. Potential of SOFC CHP systems for energy-efficient commercial buildings. Energy Build. 2013, 61, 153–160. [Google Scholar] [CrossRef]
  26. Chew Hernandez, M.L.; Velazquez Hernandez, E.K.; Leon Dominguez, S. A Decision-Analytic Feasibility Study of Upgrading Machinery at a Tools Workshop. Eng. Technol. Appl. Sci. Res. 2012, 2, 182–189. [Google Scholar] [CrossRef]
  27. Yue, B.; Su, B.; Xiao, F.; Li, A.; Li, K.; Li, S.; Yan, R.; Lian, Q.; Li, A.; Li, Y.; et al. Energy-oriented control retrofit for existing HVAC system adopting data-driven MPC—Methodology, implementation and field test. Energy Build. 2023, 295, 113286. [Google Scholar] [CrossRef]
  28. Shcherbakova, N.A. Feasibility Analysis of Overhaul and Modernization of Equipment. In Proceedings of the International Scientific Conference “Far East Con” (ISCFEC 2018); Atlantis Press: Vladivostok, Russia, 2019. [Google Scholar] [CrossRef]
  29. Sun, F.; Wang, Z.; Xu, W.; Chen, B. Configuration optimization of a novel multi-energy coupled low temperature district heating system based on distributed absorption and compression heat pumps. Energy 2025, 330, 136997. [Google Scholar] [CrossRef]
  30. Zhu, Y.; Song, K.; Wu, J.; Zhang, Y.; Zhang, W.; Thinsurat, K.; Jiang, L. District heating system assisted by thermochemical sorption heat storage. Energy Built Environ. 2025, in press. [CrossRef]
  31. Mi, P.; Zhang, J.; Han, Y.; Guo, X. Study on energy efficiency and economic performance of district heating system of energy saving reconstruction with photovoltaic thermal heat pump. Energy Convers. Manag. 2021, 247, 114677. [Google Scholar] [CrossRef]
  32. Liu, S.; Guo, Y.; Wagner, F.; Liu, H.; Cui, R.; Mauzerall, D. Diversifying heat sources in China’s urban district heating systems will reduce risk of carbon lock-in. Nat. Energy 2024, 9, 1021–1031. [Google Scholar] [CrossRef]
  33. Pompei, L.; Nardecchia, F.; Miliozzi, A.; Groppi, D.; Astiaso Garcia, D.; De Santoli, L. Assessment of the Optimal Energy Generation and Storage Systems to Feed a Districting Heating Network. Buildings 2024, 14, 2370. [Google Scholar] [CrossRef]
  34. Abokersh, M.H.; Saikia, K.; Cabeza, L.F.; Boer, D.; Vallès, M. Flexible heat pump integration to improve sustainable transition toward 4th generation district heating. Energy Convers. Manag. 2020, 225, 113379. [Google Scholar] [CrossRef]
  35. Sinha, R.; Bak-Jensen, B.; Radhakrishna Pillai, J.; Zareipour, H. Flexibility from Electric Boiler and Thermal Storage for Multi Energy System Interaction. Energies 2019, 13, 98. [Google Scholar] [CrossRef]
  36. Hnydiuk-Stefan, A.; Otawa, A.; Stefan, K.; Zmarzły, D. Technical and Economic Analysis of Low-Emissions Modernization of Existing Heating Plants in Poland. Energies 2021, 14, 7426. [Google Scholar] [CrossRef]
  37. Yuan, M.; Thellufsen, J.Z.; Sorknæs, P.; Lund, H.; Liang, Y. District heating in 100% renewable energy systems: Combining industrial excess heat and heat pumps. Energy Convers. Manag. 2021, 244, 114527. [Google Scholar] [CrossRef]
  38. Tian, C.; Shao, Z.; Wang, R.; Yan, Y.; Wang, X.; Ren, A. Optimal Design of Integrated Energy Supply System for Continuous Greenhouse Effect: A Study on Carbon Emission and Operational Cost. Front. Energy Res. 2022, 10, 819420. [Google Scholar] [CrossRef]
  39. Lu, N.; Pan, L.; Arabkoohsar, A.; Liu, Z.; Wang, J.; Pedersen, S. Power-heat conversion coordinated control of combined-cycle gas turbine with thermal energy storage in district heating network. Appl. Therm. Eng. 2023, 220, 119664. [Google Scholar] [CrossRef]
  40. Pelda, J.; Stelter, F.; Holler, S. Potential of integrating industrial waste heat and solar thermal energy into district heating networks in Germany. Energy 2020, 203, 117812. [Google Scholar] [CrossRef]
  41. Theisinger, L.; Kohne, T.; Borst, F.; Weigold, M. Modeling approach and simulation study to assess the utilization potential of industrial waste heat in district heating systems. Procedia CIRP 2022, 105, 339–344. [Google Scholar] [CrossRef]
  42. Zhang, Y.; Campana, P.E.; Yang, Y.; Stridh, B.; Lundblad, A.; Yan, J. Energy flexibility from the consumer: Integrating local electricity and heat supplies in a building. Appl. Energy 2018, 223, 430–442. [Google Scholar] [CrossRef]
  43. Fambri, G.; Mazza, A.; Guelpa, E.; Verda, V.; Badami, M. Power-to-heat plants in district heating and electricity distribution systems: A techno-economic analysis. Energy Convers. Manag. 2023, 276, 116543. [Google Scholar] [CrossRef]
  44. Kubín, A.; Knápek, J.; Koltsaklis, N. A long-term energy transition planning model for a district heating and cooling sector incorporating sector coupling approach: A case study of the Czech district heating and cooling sector. Energy Convers. Manag. 2025, 341, 120058. [Google Scholar] [CrossRef]
  45. Guan, X.; Terada, Y. Sparse kernel k-means for high-dimensional data. Pattern Recognit. 2023, 144, 109873. [Google Scholar] [CrossRef]
  46. Naldi, M.C.; Campello, R.J.G.B. Comparison of distributed evolutionary k-means clustering algorithms. Neurocomputing 2015, 163, 78–93. [Google Scholar] [CrossRef]
  47. Yang, X.; Zhao, W.; Xu, Y.; Wang, C.; Li, B.; Nie, F. Sparse K-means clustering algorithm with anchor graph regularization. Inf. Sci. 2024, 667, 120504. [Google Scholar] [CrossRef]
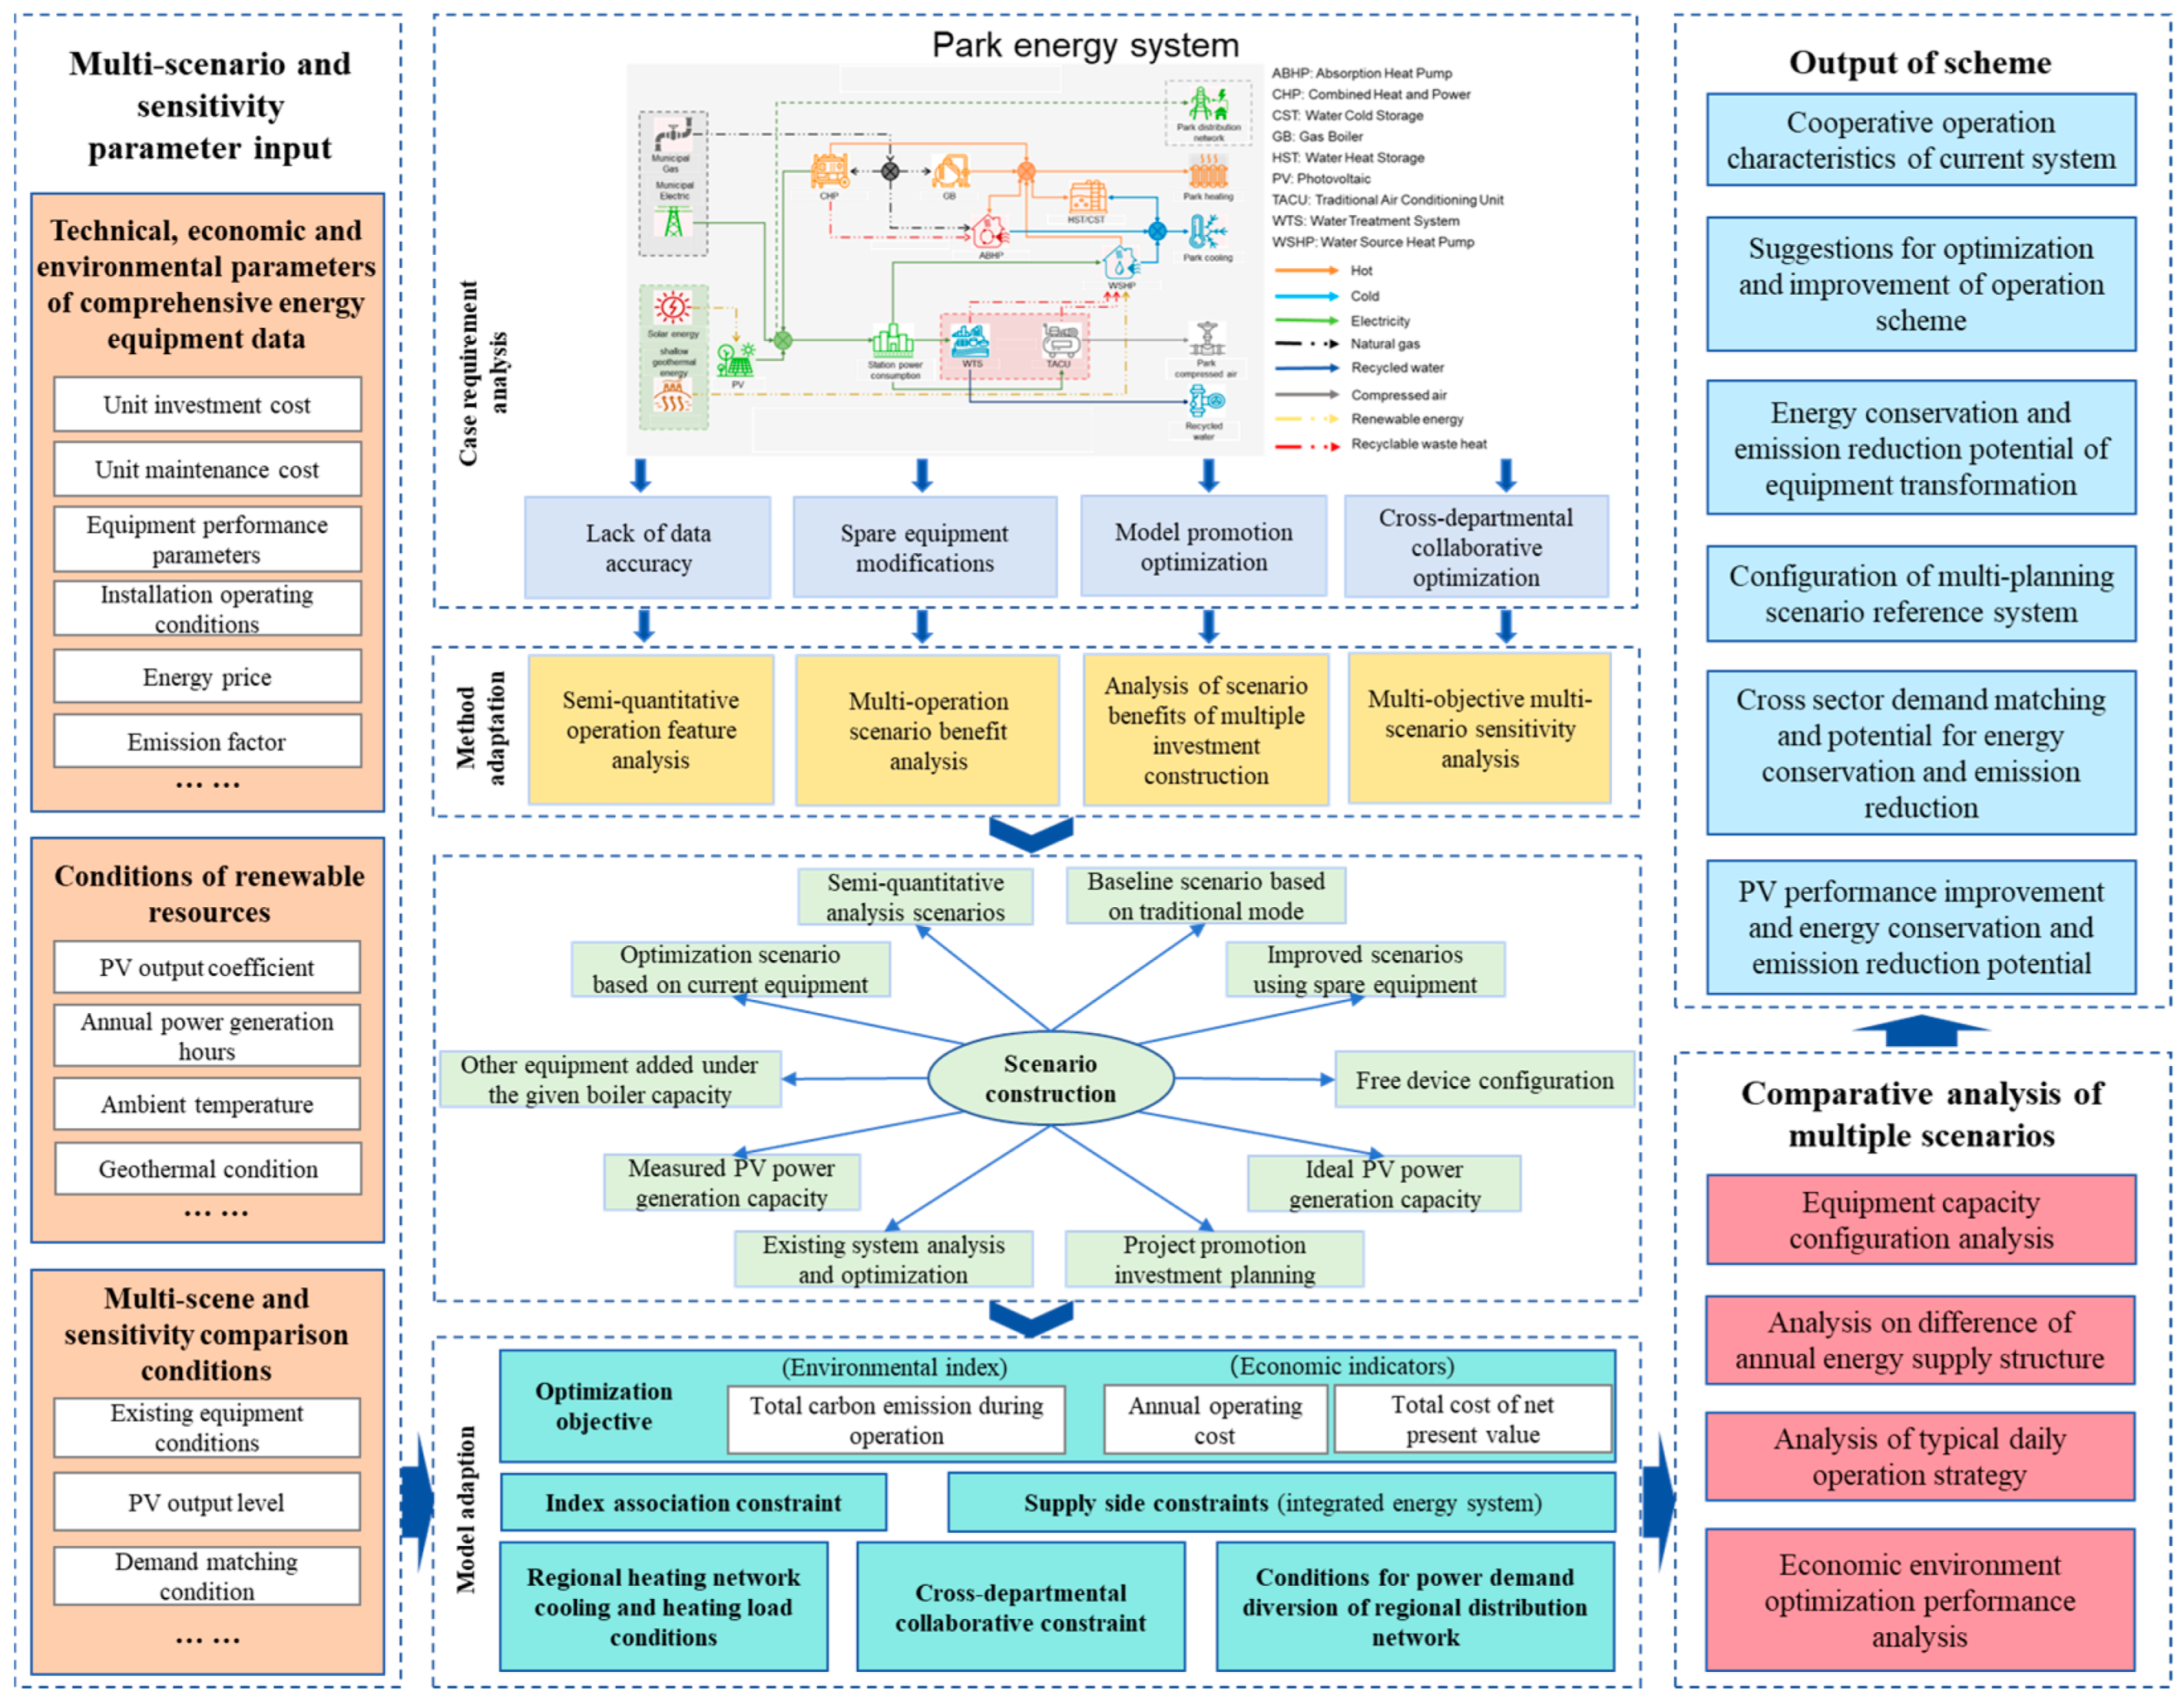
Figure 1. System framework.
Energies 18 05206 g001
Figure 2. Schematic diagram of the park energy system.
Energies 18 05206 g002
Figure 3. Overview of the overall supply of (a) electricity, (b) heat, and (c) cold energy at the energy station for 8760 h throughout the year.
Energies 18 05206 g003
Figure 4. Analysis of the distribution characteristics of energy demand for external supply in parks in each season.
Energies 18 05206 g004
Figure 5. The clustering results of (a) typical daily heating demands, (b) corresponding electricity demands and (c) PV output coefficients.
Energies 18 05206 g005
Figure 6. The clustering results of (a) typical daily cold demand, (b) corresponding electrical demand and (c) PV output coefficient.
Energies 18 05206 g006
Figure 7. The clustering results of the transition season (a) electricity demand, (b) PV output coefficient.
Energies 18 05206 g007
Figure 8. Collaborative operation mode of major energy equipment for typical heating day.
Energies 18 05206 g008
Figure 9. Cooperative operation mode of main energy equipment on typical cooling days.
Energies 18 05206 g009
Figure 10. Energy-saving and emission reduction potential of the system under multi-operation optimization scenarios. (a) energy saving and emission reduction; (b) cost carbon emissions.
Energies 18 05206 g010
Figure 11. (a) The economic indicator composition and (b) the carbon emission reduction indicator composition of the system under the multi-operation optimization scenario.
Energies 18 05206 g011
Figure 12. Economically optimal annual total energy output utilization structure of the system under multi-operation optimization scenarios. (a) Annual Electricity Source; (b) Annual Electricity Utilization; (c) Annual Heat Output; (d) Annual Net Heat Output; (e) Annual Heat Utilization; (f) Annual Net Heat Utilization; (g) Annual Cold Output; (h) Annual Net Cold Output; (i) Annual Cold Utilization; (j) Annual Net Cold Utilization.
Energies 18 05206 g012
Figure 13. Optimized operation of the system for a typical day of heating under a multi-operation optimization scenario. (a) heat balance; (b) electrical balance.
Energies 18 05206 g013
Figure 14. Typical day optimized operation of the system for cooling under a multi-operation optimization scenario. (a) cold balance; (b) electrical balance.
Energies 18 05206 g014
Figure 15. The typical daily operation scheme of the system in the transition season under multiple operation optimization scenarios.
Energies 18 05206 g015
Figure 16. Energy-saving and emission reduction potential of co-optimizing urban energy systems under multi-investment planning scenarios. (a) cost carbon emissions; (b) energy saving and emission reduction.
Energies 18 05206 g016
Figure 17. Electric load level sensitivity of incremental distribution networks with multi-investment planning scenarios co-optimization objectives. (a) S2D multi-objective two-dimensional cost carbon layout; (b) S2D multi-objective three-dimensional cost carbon layout; (c) S2E multi-objective two-dimensional cost carbon layout; (d) S2D multi-objective three-dimensional cost carbon layout; (e) S2F multi-objective two-dimensional cost carbon layout; (f) S2D multi-objective three-dimensional cost carbon layout.
Energies 18 05206 g017
Figure 18. Composition of systematic economic and environmental indicators for synergistic optimization under multi-investment planning scenarios; (a) S2EC0 economic indicators; (b) S2EC2 environment indicators; (c) S2EC20 economic indicators; (d) S2EC20 environment indicators. (a,c) share a legend; (b,d) share a legend.
Energies 18 05206 g018
Figure 19. Electric load level sensitivity of incremental distribution networks with multi-investment planning scenarios for co-optimization of performance metrics; (a) S2D economic indicators; (b) S2D environment indicators; (c) S2E economic indicators; (d) S2E environment indicators. (a,c) share a legend; (b,d) share a legend.
Energies 18 05206 g019
Figure 20. Collaborative optimization of installed capacity configuration of the system under multi-investment planning scenarios. (a) S2EC0&20 installed capacity of electricity supply; (b) S2EC0&20 installed capacity of heating supply; (c) S2EC0&20 installed capacity of cooling supply; (d) S2D installed capacity of electricity supply; (e) S2D installed capacity of heating supply; (f) S2D installed capacity of cooling supply; (g) S2E installed capacity of electricity supply; (h) S2E installed capacity of heating supply; (i) S2E installed capacity of cooling supply; (j) S2F installed capacity of electricity supply; (k) S2F installed capacity of heating supply; (l) S2F installed capacity of cooling supply.
Energies 18 05206 g020
Figure 21. Co-optimization of systems under multi-investment planning scenarios differences in total installed electricity, heat, and cooling capacity. (a) S2EC0 total installation comparison; (b) S2D total installation comparison; (c) S2E total installation comparison; (d) S2F total installation comparison.
Energies 18 05206 g021
Figure 22. Economically optimal annual total energy output utilization structure of the system under the multi-investment planning scenario. (a) EC0 annual energy input and output; (b) S2D annual energy input and output; (c) S2E annual energy input and output; (d) S2F annual energy input and output.
Energies 18 05206 g022
Figure 23. Multi-investment planning scenarios for optimizing the operation of a typical day of the park energy system for heating. (a) S2EC0 heat balance for the heating season; (b) S2DEF EC4&20 heat balance for the heating season; (c) S2EC0 electrical balance for the heating season; (d) S2DEF EC4&20 electrical balance for the heating season.
Energies 18 05206 g023
Figure 24. Optimized operation of a typical day of cooling for a system under a multi-investment planning scenario. (a) S2EC0 cold balance during the cooling season; (b) S2DEF EC4&20 cold balance during the cooling season; (c) S2EC0 electrical balance for the cooling season; (d) S2DEF EC4&20 electrical balance for the cooling season.
Energies 18 05206 g024
Figure 25. Optimized operation of the system on a typical day of the transition season under a multi-investment planning scenario. (a) S2EC0 electrical balance in transition season; (b) S2DEF EC4&20 electrical balance in transition season.
Energies 18 05206 g025
Table 1. Capacity and performance parameters of main energy equipment in energy stations.
No.NameQuantity (Sets)Unit Price (CNY)Main Equipment Parameters
1GG1985,000generating power (kW)200.0
gas consumption rate (Nm3/h)57.00
cylinder liner water heat transfer power (kW)114.0
gas flow (kg/s)0.3000
flue gas temperature (°C)570.0
parasitic electric power (kW)5.500
cooling power (kW)350.0
heating power (kW)279.0
hot water inlet and outlet water temperature (°C)40.00/60.00
2ABHP1809,090inlet and outlet water temperature of heat source (°C)80.00/70.00
cylinder liner water heat transfer power (kW)114.0
flue gas temperature (°C)570.0
gas flow (kg/s)0.3000
refueling gas consumption rate (Nm3/h)30.20
parasitic electric power (kW)3.000
heating power (kW)4200
3GB24,200,000gas consumption rate (Nm3/h)436.3
parasitic electric power (kW)15.00
cooling power (kW)2071
refrigeration daytime cold source heat transfer power (kW)1974
refrigeration daytime input power (kW)370.0
refrigeration night cold source heat transfer power (kW)1756
4WSHP1985,000refrigeration night input power (kW)350.0
heating power (kW)2172
heating daytime cold source heat transfer power (kW)1995
heating daytime input power (kW)480.0
heat exchange power of heating night cooling source (kW)1840
heating night input power (kW)575.0
effective volume (m3)950.0
cooling capacity (kWh)8141
5WS1930,000release cooling power (kW)1311
heat storage capacity (kWh)19,770
heat release power (kW)2200
Disclaimer/Publisher’s Note: The statements, opinions and data contained in all publications are solely those of the individual author(s) and contributor(s) and not of MDPI and/or the editor(s). MDPI and/or the editor(s) disclaim responsibility for any injury to people or property resulting from any ideas, methods, instructions or products referred to in the content.