Article

Hybrid Human–AI Collaboration for Optimized Fuel Delivery Management

1
University WSB Merito in Poznań, ul. Powstańców Wielkopolskich 5, 61-895 Poznań, Poland
2
The Royal Institution of Naval Architects, London WC2N 5DA, UK
3
Faculty of Transport, Warsaw University of Technology, 00-662 Warsaw, Poland
*
Author to whom correspondence should be addressed.
Energies 2025, 18(19), 5203; https://doi.org/10.3390/en18195203
Submission received: 30 August 2025 / Revised: 22 September 2025 / Accepted: 26 September 2025 / Published: 30 September 2025

Abstract

This article deals with the analysis and exploration of the concept of integrating human knowledge (HK) and artificial intelligence (AI) in the management process. The authors point out that the implementation of advanced AI technologies into already functioning and often complex systems, such as enterprise resource planning (ERP), presents significant technical challenges and requires a well-thought-out integration strategy. The complexity arises from the need to align new solutions with existing processes, resources, and data. Using the example of a fuel distribution system, the authors present the concept of integrating human knowledge (HK) and artificial intelligence (AI) in the management process. The article presents a comprehensive analysis of the smart upgrade of fuel delivery management (FDM) architecture by incorporating an AI app to solve complex problems, such as predicting demand or traffic flows, as well as correctly detecting near-miss events. Technological convergence enables the mutual pursuit of improving the management process by developing soft skills and expanding knowledge managers. The authors’ findings show that an important factor for successful convergence is horizontal and vertical matching of the human knowledge and artificial intelligence cooperation for archive max positive synergy. Some recommendations could be useful for tank truck operators as a starting point to predict demand patterns, smart route planning, etc., where an AI app could be very successful.

1. Introduction

The intensive development of AI technologies and the investment of increasing resources in the development of AI-based solutions by both central units and businesses make it necessary to identify the effects achieved through these investments [1,2]. The authors of the paper [3] point out that by using machine learning and predictive analytics, it is possible to significantly increase operational efficiency through artificial intelligence, both by automating processes and providing real-time information on data. Such an assessment can be the basis for identifying strategic areas for implementing new solutions, as well as research directions for new AI-based tools and their application in enterprise resource planning systems [4], for organizational behavior research [5], and to study the impact on organizational change and business performance [6]. This is especially true given that according to recent research [7] conducted as part of the NANDA (Networked Agents and Decentralized AI) project, as many as 95% of enterprises do not achieve measurable benefits from AI implementation (this research was conducted using 150 business leaders and an analysis of 300 generative AI implementations).
One of the areas of AI implementation, analyzed in this article, is fuel distribution management. AI-based solutions can be used in this area for [8,9,10,11] route optimization [12,13,14], delivery scheduling [15], distribution network configuration [16,17], and demand forecasting. At the same time, it should be noted that in many areas, logistics processes can also be effectively improved by implementing more traditional solutions [18]. However, it is crucial that the implementation of new solutions—both those based on AI and traditional computational methods—brings the appropriate benefits [19,20,21].
As research conducted by the authors of the paper [22] indicates, the application of artificial intelligence is very helpful in key processes of supply chain management. This includes not only customer relationship management, inventory management, etc., but also demand forecasting and risk management. This can significantly increase the resilience of supply chains in the framework of global emerging crises.
The global economy brings together various companies that are united by the need to have effective fuel delivery management (FDM). The primary tasks of such systems are employee management, incident reporting, inventory and maintenance organization, mileage tracking, route optimization, etc. [5]. Since the 1960s, FDM architecture upgrades have been directed towards smartly collecting and structuring information and decision making based on IT technologies, as described in Table 1.
The big success used DBs (databases) and a DBMS (Database Management System) in development, from hierarchical to cloud models [15,24].
In the 21st century, the following has occurred [1,25,26]:
  • The frequency of negative events affecting the service processes’ stability has increased;
  • The relationships’ complexity has grown, consuming more time and financial resources;
  • Nonlinear development trajectories have become less predictable, which contributes to mistakes in managerial decisions due to lack of appropriate knowledge.
Based on [27], the authors pose the following research questions (RQs):
  • RQ1: How can the SPOF (Single Point Of Failure) problem be solved for compound delivery systems supplying petrol filling stations (PFSs)?
  • RQ2: How can the mechanism integrating human knowledge (HK) and artificial intelligence (AI) be improved?
  • RQ3: How and how much can iterative adaptation techniques be successful?
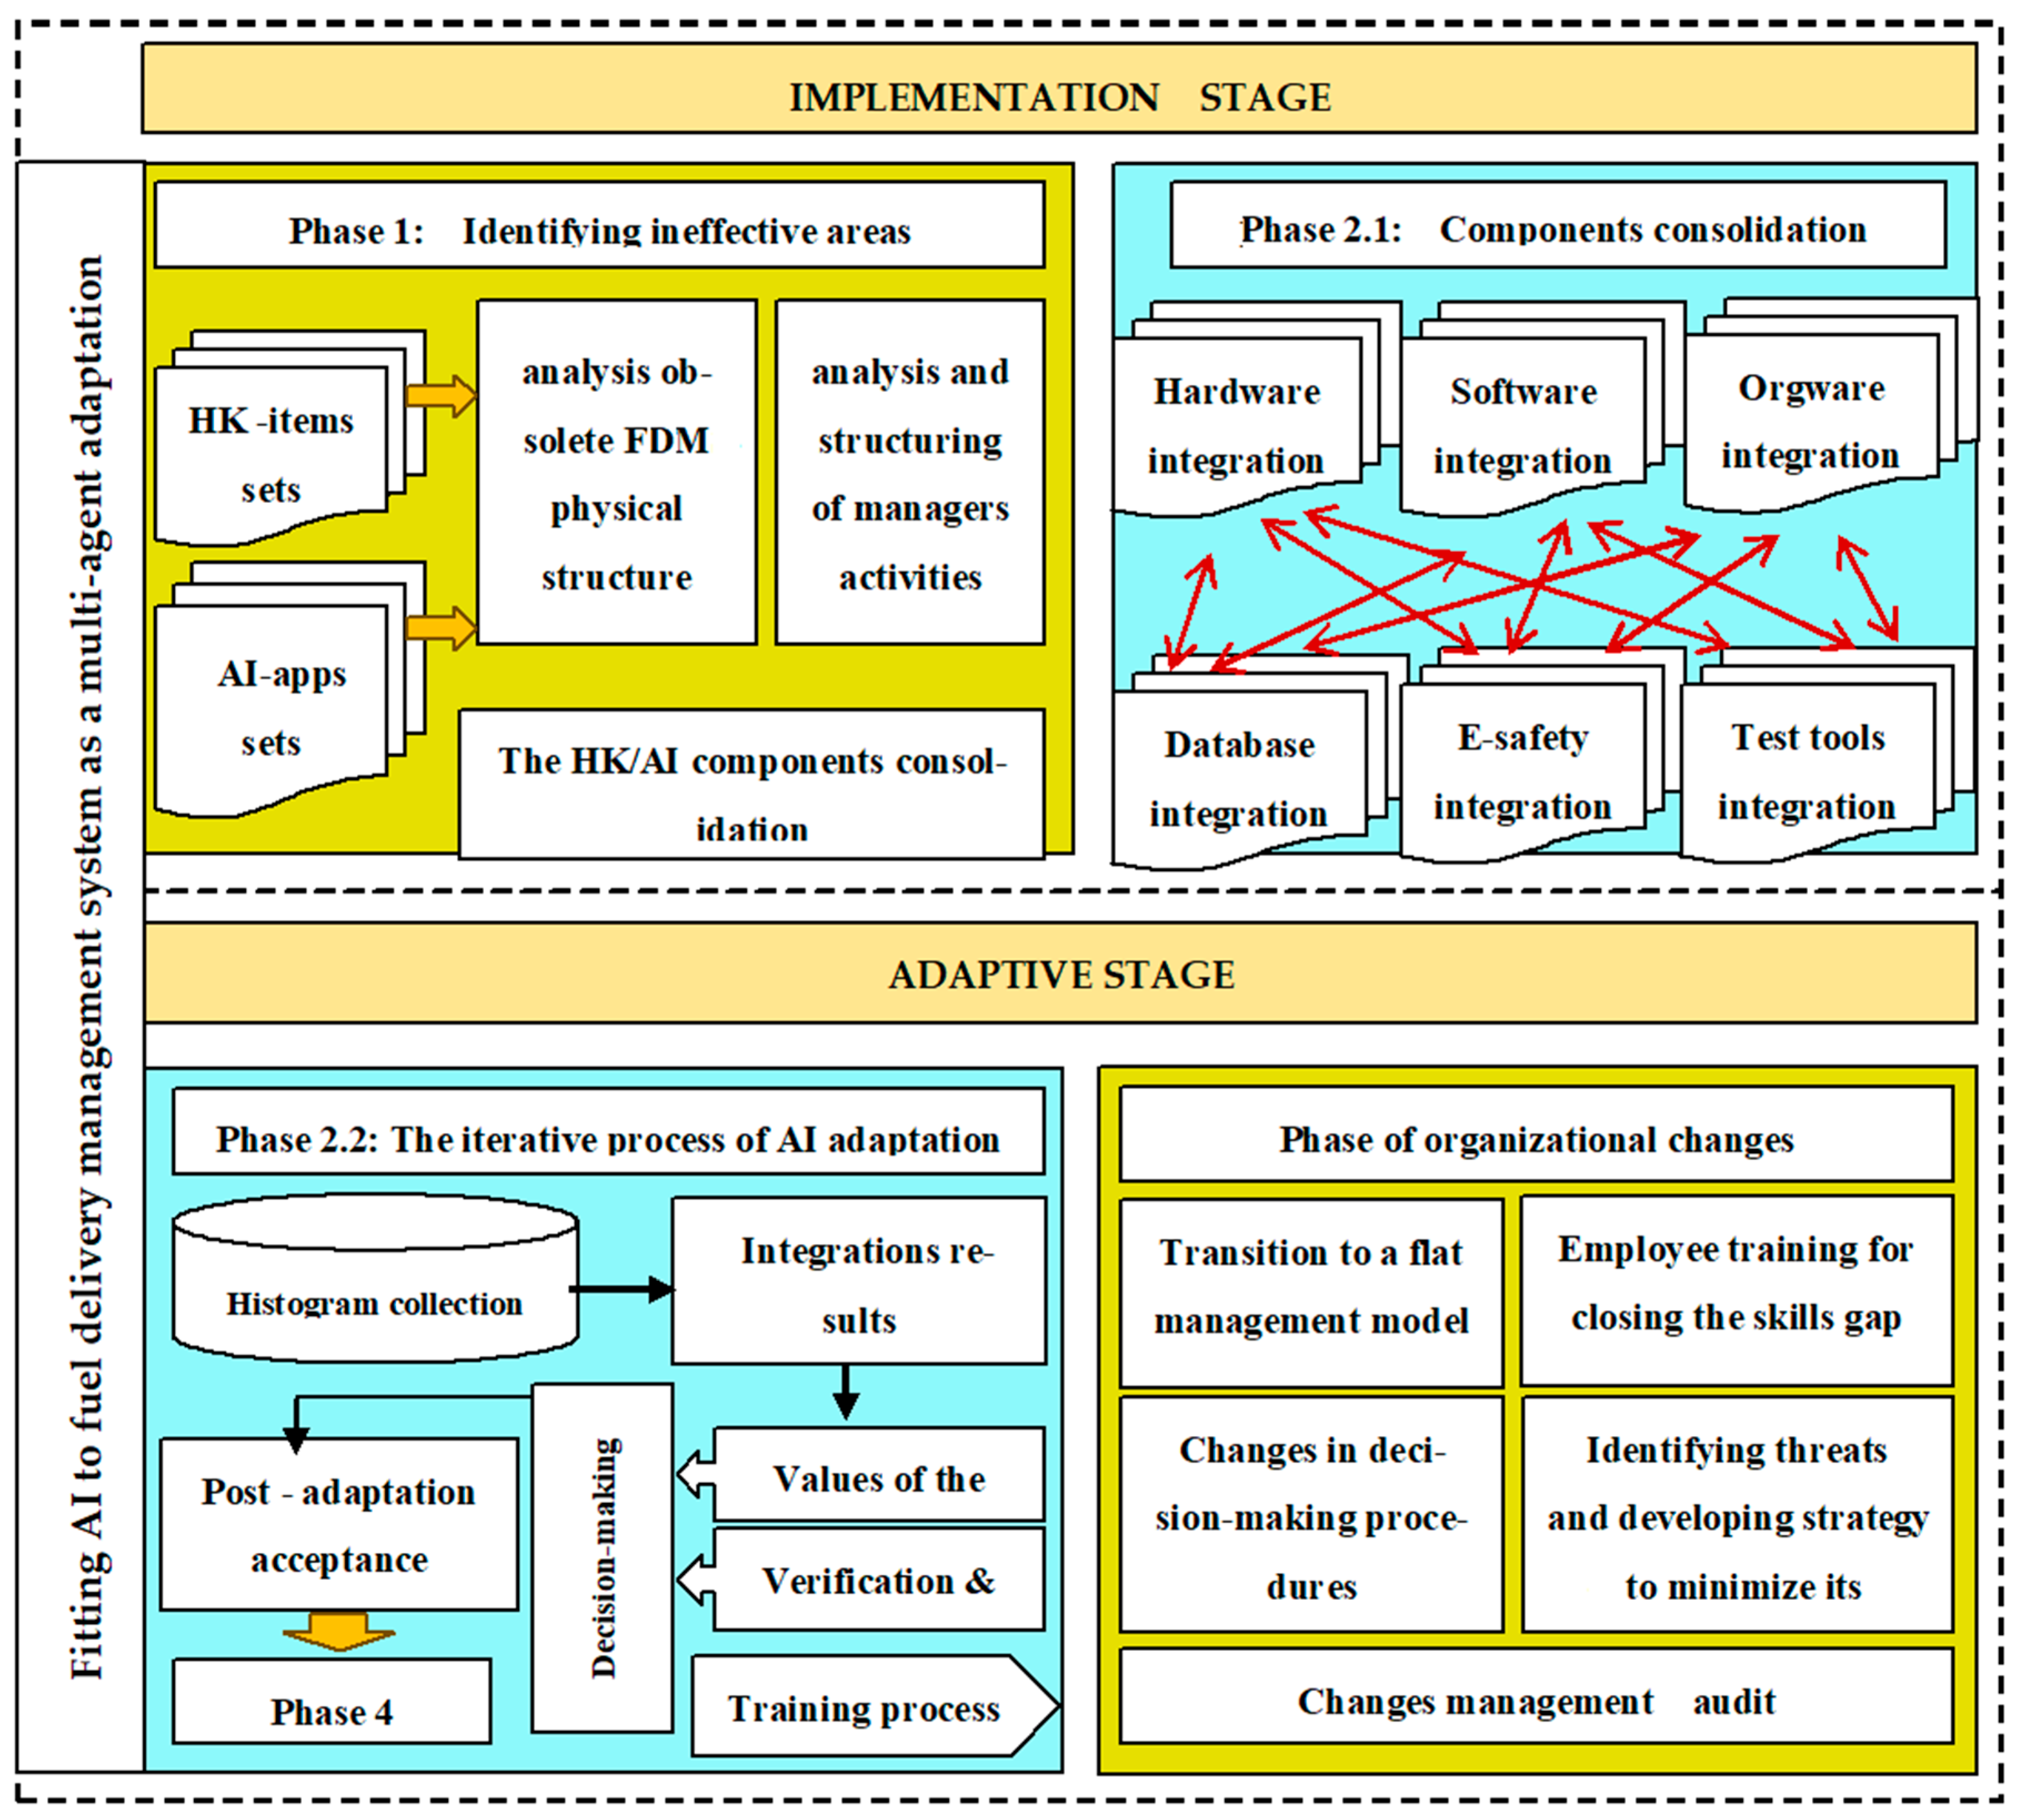
Figure 1 presents the research framework, outlining the key concept, relationships, and scope of this study.
The application of artificial intelligence (AI) and related methods, such as fuzzy logic or optimization algorithms, to fuel distribution systems, as well as to transportation in general, is associated with a number of challenges and problems. One of them is the complexity of optimization problems. For example, multi-objective nonlinear integer programming is difficult to solve and generates many potential solutions for decision makers [28]. These problems are often NP complex. Heuristic algorithms, such as NSGA-II, can be used to solve complex problems, but they do not always guarantee finding an optimal solution. Furthermore, increasing the number of considered routes or the population size in genetic algorithms (e.g., NSGA-II) increases computational complexity and processor time, and, even with improved solution quality, it does not always allow for determining the true optimal solution [28,29]. Additionally, it should be noted that in fuzzy-logic-based models, the minimum number of inference rules can exceed one million if multiple criteria are considered in a single inference module, which makes rule creation by experts extremely difficult [29]. This also increases the complexity of the knowledge base structure [30].
With these considerations in view, the structure of this article is divided into five parts. The first one includes an introduction, where the authors pointed out that conventional ERP enterprise process management systems are gradually lagging behind in a dynamic and complex market environment, which limits their ability to effectively support operations and strategic decision making. Furthermore, they lack the ability to process huge datasets, identify patterns, and autonomously optimize processes. The second part is an analysis of the literature on the application possibilities of artificial intelligence methods in different areas of transport and the potential for integrating AI with process planning systems in organizations. The next part of the article presents the theoretical basis of the problem of assessing the effects of implementing AI solutions in the area of fuel supply management, a formal approach to testing the effectiveness of AI implementations, as well as an assessment of the synergy effect resulting from the modernization and scalability of solutions. The last part details the recommendations and conclusions resulting from the research conducted.

2. The Literature Analysis

2.1. Human Collaboration with AI in Transport Management

Collaboration between artificial intelligence and humans can be seen in various branches of transport. The synergy between AI and humans aims to increase the level of safety in transport. For example, in air transport, the authors of the publication [31,32] presented new intelligent systems to assist air traffic controllers. The aim of the research was to design an automated system based on artificial intelligence (AI), machine learning (ML), and deep neural learning (DELA) to solve problems between flight crews and air traffic controllers. The work investigated the extent to which decisions made by AI are similar to those of controllers
In the research presented in the papers [33,34,35], AI algorithms were used to control the speed of automated electric vehicles based on Deep Strength Learning and a routing model for automated electric vehicles. Cooperation between the vehicles and the driver is not autonomous, as the human supervises the operation of the electric vehicle control systems, the battery performance, and the speed of the electric vehicles. Human assistance with AI algorithms in rail transport is observed in the following areas: minimizing energy expenditure [36], route optimization [37], or train speed control [38].
To determine the most efficient delivery routes, AI and machine learning (ML) algorithms analyze complex datasets, such as road conditions, weather forecasts, and supply constraints [39]. Generative neural networks (GANs) are also used in route planning to create realistic and efficient paths, and, for expert-level route planning, a combination of reinforcement learning (RL) algorithms with generative models is also used [40].
Managing data uncertainty and stochasticity, i.e., uncertainty about the duration of transport operations (e.g., weather conditions, accidents, traffic congestion), is a significant obstacle to route optimization and ensuring reliable delivery times [41]. As the authors point out, models based on Monte Carlo simulation, although capable of handling uncertainty, require large volumes of input data and can be unstable when there is variability in initial optimization conditions [42].
Data quality and availability are crucial for the correct preparation of a good model. In decision support systems, for the model to function, all projects must have complete sets of available information. Many databases (e.g., accidents) are collected for liability assessment purposes, not for forecasting, which requires the integration and verification of data from multiple sources [43]. Furthermore, large feature vectors in machine learning models can lead to longer training times and increased noise, which may also be a consequence of unreliable information provided.
Developing algorithms to solve problems presents many challenges related to training and calibration. As the authors of [43] point out, machine learning algorithms (e.g., kNN, ANN) are sensitive to initial values and parameter configuration, leading to variable convergence results, and there are no general guidelines for the best choice. Metaheuristic algorithms (e.g., simulated annealing), on the other hand, are very sensitive to calibration parameter values, which significantly impacts computational time and the quality of the resulting routes [44]. The aim of this article is to assess the likelihood of positive synergies resulting from the implementation of AI solutions supporting HK’s human resources in the area of fuel supply management. AI tools can be implemented here to predict demand or traffic flow, or, for example, to detect potentially dangerous events.

2.2. AI Technology Integration and the Challenges for Businesses

The integration of AI with ERP represents a breakthrough, offering unprecedented opportunities to improve operations, enhance decision making, and optimize resource utilization and real-time analytics. As AI becomes more ubiquitous, various uncertainties and risks also arise. For example, the authors, in their article [45], investigate the impact of integrating artificial intelligence (AI) with enterprise resource planning (ERP) systems. They point out that the implementation of advanced AI technologies into already functioning and often complex systems, such as ERP, presents significant technical challenges and requires a well-thought-out integration strategy. The complexity is driven by the need to make new solutions fit with existing processes and data.
As the authors of the paper [39] point out, the problem with the proper implementation of AI is the scarcity of data and the limited generalizability of AI models, including the training of robust AI models. Available data are often inconsistent, contain gaps, or lack standardization. Furthermore, models trained in one environment or city may perform poorly in other contexts due to differences in traffic patterns, infrastructure, or cultural factors.
The authors also point to ethical issues, including concerns about data privacy. Similar concerns about data privacy and security are cited by the authors in the paper [46]. In the paper, they point out that the integration of AI entails the processing of large datasets, which raises serious concerns about their protection, confidentiality, and compliance with existing regulations. Ensuring data security in AI-enabled systems is crucial for trust and avoiding breaches.
The integration of AI technologies, such as machine learning, natural language processing (NLP), predictive analytics, and cognitive computing, offers unlimited opportunities to change the judgement of the processes being implemented [4,15,44]. Machine learning algorithms enable ERP systems to analyze vast amounts of data, recognize patterns, and autonomously improve processes. This enables predictive insights, demand forecasting, optimization of inventory levels, and pre-emptive resolution of potential problems, increasing the flexibility and resilience of the organization.
In contrast, the integration of NLP in ERP systems goes beyond conventional user interfaces, enabling users to interact with the system in a more natural, conversational way. This improves the user experience, speeds up decision making, and democratizes access to key information, making ERP systems more intuitive and user-friendly [20,39]. The infusion of predictive analytics allows organizations to move from reactive to proactive decision making. Using historical data and real-time inputs, predictive analytics in AI-enabled ERP systems predicts future trends, risks, and opportunities, enabling companies to make informed decisions and develop strategies ahead of time.
The ability of (cognitive computing) cognitive processing to mimic human thought processes strengthens the potential of AI in ERP systems. By understanding unstructured data, analyzing information, and continuously learning from interactions, it supports decision making, drives innovation, and encourages a culture of continuous improvement in organizations [39,45].

3. Conceptual Framework

3.1. The Upgrade Concept for FDM Architecture

Modern fuel distribution management must offer sophisticated solutions that go far beyond tracking or scheduling. Therefore, such systems must be equipped with complete AI-powered tools to monitor market demand and prevent unplanned truck downtime [6,22].
As shown in our research, FDM architecture is based on mixtures of various SuSs (Subsystems) [47]. Its requires strengthening the enterprise’s ability to adopt new AI apps [2,48], including genetic ML algorithms or cloud services [15]. Finally, modern FDM architectures consist of four basic SuSs, as shown in Figure 2. SuS 1: RIKS (Raw Information and Knowledge Stores). SuS 2: ACE (Analytical and Computing Engines). SuS 3: NI (Network Infrastructure). SuS 4: RS (Relations Support).
Each of the a/m SuSs contains diverse hardware, software, and orgware according to the performed management mission, including computational and supporting tasks. Such items are connected by random (e.g., monitoring task) or fixed (e.g., supervisorial or transmission tasks) linkages in unidirectional or multidirectional information flows. Such a variety of FDM architectures generates a high probability of the SPOF problem occurring, when the failure of one item contributes to the shutdown of all others [49,50]. Another argument is the neglected problem of investigating the mechanism of formation of positive and negative synergy during management system upgrade. The research has proven that such a mechanism must be based on iterative adaptation techniques starting from the logistics department to the united platform level.
Two hypotheses were defined:
Hypothesis 1. 
The success of FDM architecture upgrading depends on efficiently achieving positive events and the elimination of negative events, such as the cascading effect mentioned earlier, an SPOF problem where the failure of one item (e.g., equipment destruction, data loss, and other casual events) can be the cause of damage to other connected items.
Hypothesis 2. 
An iterative process increases the chance of AI app adaption success. Each iteration should deliver concrete advances that can be evaluated using both technical metrics (on-time delivery, flexibility) and business outcomes (petrol station profits, cut operation costs).

3.2. Research Problem Statement

The tank trucking company (TTC) may make decisions to upgrade FDM by implementing a new AI app [19,51]. Given that such decisions may be ineffective, some assumptions and procedures should be considered based on adaptive structuration theory (AST):
  • Assumptions:
Assumption 1: 
FDM upgrade is successful if it fulfils its functions under changing business conditions without the need for secondary adjustments to its architecture.
Assumption 2: 
The level of effectiveness of an FDM architecture should be assessed in terms of the likelihood of increasing its purposeful characteristics.
Assumption 3: 
The choice of AI app must be evaluated in added value terms.
Assumption 4: 
An FDM upgrade based on unreliable information is not possible.
  • Procedures:
  • Procedure 1: Before starting the upgrade process, ensure that the FDM architecture is open to innovative AI app implementation.
  • Procedure 2: The upgrade’s effectiveness should be assessed for each embedded AI app.
  • Procedure 3: If the process is unsuccessful, adaptation should be resumed based on feedback.
There are different approaches to IT system integration [19,20,52]. Our pre-research study showed that the common denominator is the requirement for seamless HK&AI cooperation to achieve the desired result at four vertical levels: the logistics department, a single TTC, the local platform TTC, and the regional platform uniting various FDM architecture. The second result is a requirement to achieve an effective combination of HK&AI items (free from SPOF) at six horizontal levels in accordance with the principle of “ease-of-integration” (Figure 1), as follows:
  • A—Hardware status configuration [21]. This has an impact on such critical parameters as operation speed and memory, energy use and physical size of the FDM, etc. This level includes the development of a coherent structure of computers and network devices (servers, switches, etc.) working together via cabling and/or fiber optic cables to transfer information between users. It lays the groundwork for maximum positive synergies and its new upgrade.
  • B—Information integration [53]. It is implemented within the framework of the “Data-Centric Approach” in terms of consistency and accessibility of the collected information and knowledge. It is based on processes for linking structured information, ensuring that it is used for different operational and decision making purposes. This level is oriented towards the integration of various DBs into a united HK/AI dataset. This consolidation involves resolving format mismatches, merging datasets with common formats, and handling inconsistencies in data received from different sources.
  • C—Software status configuration [54]. It integrates the execution schedules of applications and services running within an FDM, enabling managers to share information and unconflicted collaboration. It is important because the used software may come from different producers, have separate purposes, and require special information support.
  • D—Orgware status configuration [51,55]. The orgware deals with different actors and their different working tasks, linking, e.g., transport and logistics departments. Process integration is the glue that binds together the functional capabilities of an integrated FDM architecture. It ensures the redundancy of the combined components managing information flows, indicates decision errors, and improves outcome efficiency.
  • E—Cybersecurity integration [56]. The increase in the number of cyber threats complicates the deployment and integration of an AI app into a conventional FDM, threatening to create gaps in their resilience, and it can be exploited for phishing or malware attacks. In addition, employees who face dismissal as a result of their replacement by AI-powered tools may try to discredit their effectiveness. Countering this process is possible through the use of security features, such as LANs (Local Area Networks) or WANs (Wide Area Networks), linking different FDMs within a unified platform, or using such software as ASPM (Application security posture management) [56].
  • F—Integration testing procedures [57]. Validating upgrades helps mitigate risks associated with deploying untested or faulty software, safeguarding against potential disruptions to business operations and petrol filling stations (PFSs). Testing plays a key role by identifying gaps in infrastructure and checking that tasks are performed correctly.
In the second step, the change types for the pairs “obsolete HK-item/new AI-app” are determined. Improvements to the AI app’s specifications as well as changes at lower FDM architecture levels are also taken into account. Lastly, the computed differences in provided and required traits are matched against the upgrade project. The result is a conclusion as to whether and how the AI items are compatible with the current FDM architecture.

3.3. Materials and Methods of Research Process Organization

This study analyzed the FDM upgrade to support fleet managers in making the right decisions concerning routing, fuel dispatching, and trunk maintenance. Several fleet managers of two TTC logistics departments took part in this study. Each of them participated in a few adaptation rounds (from 1 to 6) consisting of evaluating the positive and negative effects as a result of the use of AI technology. The first valuation was conducted immediately after the implementation of AI apps, and the second and next valuations were performed after subsequent cycles of adaptations carried out in an iterative pattern. Activities performed in static mode are marked in yellow, and those in adaptive mode are marked in blue (see Figure 3).
The process of constructing a design space for coupling HK/AI items is divided into two distinct phases:
Phase 1: Constructing design space. During this phase, the following were developed:
  • Analysis and structuring of activities performed by fleet managers during the development of fuel delivery schedules and solving random problems.
  • Research on the tuning principles of AP apps both in terms of the TTC development strategy and the techniques for achieving maximum compatibility parameters of HK/AI items, information databases, communication protocols, and cybersecurity procedures. Research during this phase led to the important conclusion that the tuning of implemented AI apps can be an important internal cognitive factor indicating both the fleet managers’ weaknesses (e.g., rapid fatigue or attachment to personal preferences) and their strengths (e.g., the ability to make non-standard decisions). The final conclusions of this phase of the study were as follows:
  • ESE’s “Expected Synergy Effects” function can be used to integrally measure the effectiveness of the AI app adaptation process:
    E S E = m a x P i S i P 1 * S i ,   i I
    where
  • P i S i —the probability of generating positive effects in the  i -iteration of the adaptation process;
  • P i * S i —the probability of generating negative effects in the  i -iteration of the adaptation process.
b.
Accepting the MDP theory (Markov Decision Process) as a mathematical framework for modeling adaptive processes based on both random and manual control actions.
c.
The accumulated experience makes it possible to identify the compatibility of implemented AI apps with fleet managers on a probability level of success achievement only.
Phase 2. Adaption actions space. This phase was divided into two subphases, 2.1 and 2.2.
  • The first part concerns adaptation activities in the design space and, in particular, AI learning to cooperate with fleet managers. Effective AI app learning requires the use of an interactive mode (in our experience, max 4–6 iterations) on such horizontal integration planes as hardware, software, orgware, etc. In the case of further use of AI apps, e.g., as an NPC (Non-Player Character) with the aim of vertical integration (TTC as whole, regional platforms, etc.), customizing the AI is based on early acquired abilities.
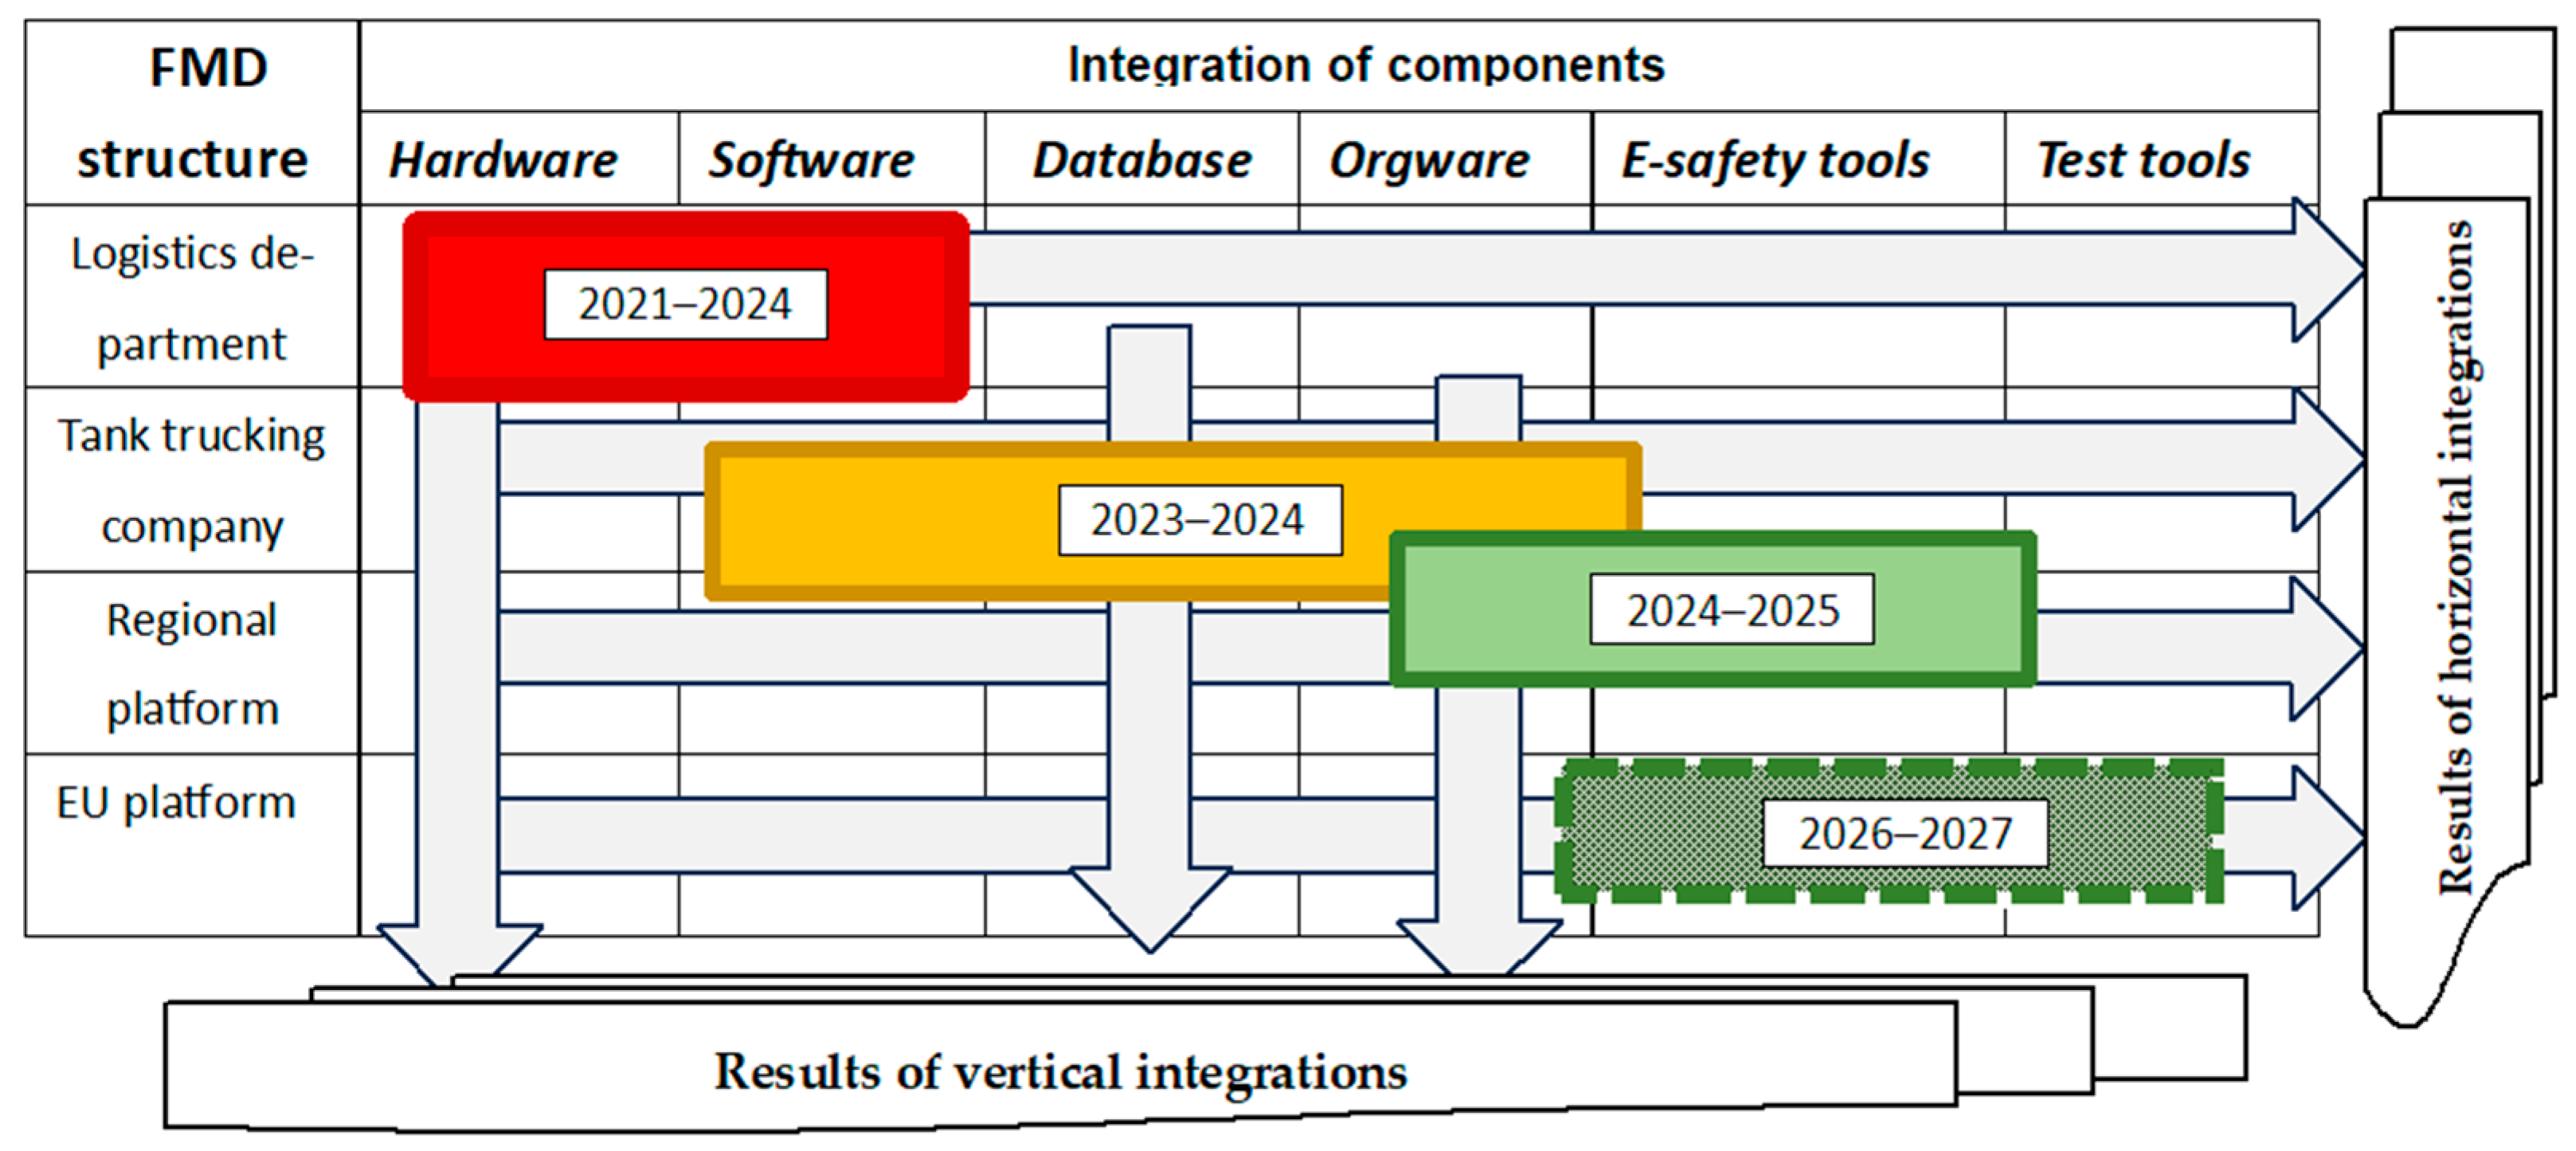
  • The second part concerns introducing a collaborative framework and engaging fleet managers in both subtasks that require “manual control action” and AI assistance in solving the computation of complicated computational subtasks, such as assessment of the ESE values or verification and validation. The integral upgrade schedule is shown in Figure 4.

3.4. Organization of Research Process

The organization of the upgrade process was based on solving two problems [58,59]:
  • Identifying Improvement Areas: A complete assessment of FDM architecture efficiencies is essential to identify zones that need updating and to understand the problem’s causes.
  • Data-Driven Analysis: It is essential to gain insights into process performance, identify bottlenecks, and measure key metrics.
Rotation is a fundamental part of an obsolete FDM architecture upgrade. This can be described in different ways, such as a rotation matrix or a graph technique [60]. Let us analyze the organization of the upgrade process involving the deployment of an AI app according to an algorithm of which the fragment is shown in Figure 5. We will assume that after each deployment, the upgrade cycle passes to a new state, and their sequence we will mark as
S = S 0 P 0 , t 0 S 1 P 1 , t 1 S i P i , t i S N P N , t N
whereby SuS 2 comprises ACE transitions from an  S i state to an  S j state with probability  P i j of generating positive or negative synergy effects. The aim of this study is to assess the probability of these effects. We will mark as  ξ ( t ) the changes occurring in SuS 2 ACE states over the time interval  t [ 0 , T ] .
When the implementation of the AI component into the SuS 2 ACE structure occurs, this FDM will enter the  S 1 state, reflecting the lowest level of interaction between HK and AI items at which positive synergy effects are unlikely to arise. After the first AI app adaptation cycle aimed at achieving positive synergies, the SuS 2 ACE will enter the state  S 2 . If the intended goal is not achieved or negative synergies occur, the adaptation cycles can continue. Once the SuS 2 ACE hits the  S N state, its cycles of planned transformation will come to an end, requiring new decisions. Let the   [ t 1 , t n ] time interval follow the sequence of   ω —BE changes, following (Equation (3)):
Ω t = ω t 1 , ω t 2 , , ω ( t n )
We will make the assumption that in the same timeframe there is the upgrade project involving the implementation of an AI app, resulting in the SuS 2 ACE moving to a new state described by the var Ξ (Equation (4)):
Ξ t = [ ξ t 1 , ξ t 2 , ξ t n ]
Equation (4) assumes that each aspect of the  ξ ( t n + 1 ) SuS 2 ACE state changes reflects some event (e.g., performing new or ceasing of unnecessary activities after deploying the AI app), with the probability of such events being evaluated using (Equation (5)):
P ξ t = P ξ ω t n + 1 = 1 = p P ξ ω t n + 1 = 0
Using Equation (2), we can assess the synergies’ probabilities arising as indirect TTC effects in response to BE changes, following Equation (5):
P ξ t = P [ ξ ( t 1 ) f [ ω t 1 ] = S i ] , P [ ξ t 2 f [ ω t 2 ] S i ] , P [ ξ t n f [ ω t n ] S 1 ]
Comment: From Equation (6), it follows that after upgrade activities, the SuS 2 ACE can transition to a state   S i burdened by negative synergy. In other states   [ S j S i ], the SuS 2 ACE achieves positive synergy after the upgrade. Therefore, two tasks have been defined:
  • Task 1: The results appraisal for horizontal integration using sets of negative and positive synergy effects. This problem is described in Section 4.1.
  • Task 2: Evaluation of the synergy effects as a result of the FDM’s scalability at three levels based on the logistics department, the TTC as a whole, and the local TTC platform. This problem is described in Section 4.2.

3.5. Data Collection and Preprocessing

3.5.1. Basic Input Information

The surveyed TTC is one of the leading Polish logistics companies that has become a pioneer in the use of AI apps in transport operations, especially fuel deliveries.
It was also important that the surveyed company proceeded to coordinate its activities within the framework of the regional platform being created. A quantitative method was used to collect data on this company, and the accumulated results of processing this information are shown in Figure 6.
The information obtained reflects the complex history of the implementation and adaptation of AI technology in the tasks of delivering fuel to service PFSs by road tank trucks. The analysis indicated a progressive increase in the awareness and skills of fleet managers in the changing business environment and with regard to AI development. During data collection, preference was given to information provided by employers who had experience in the use of AI apps from the beginning of AI implementation in solving different routing problems.

3.5.2. Road Infrastructure Datasets

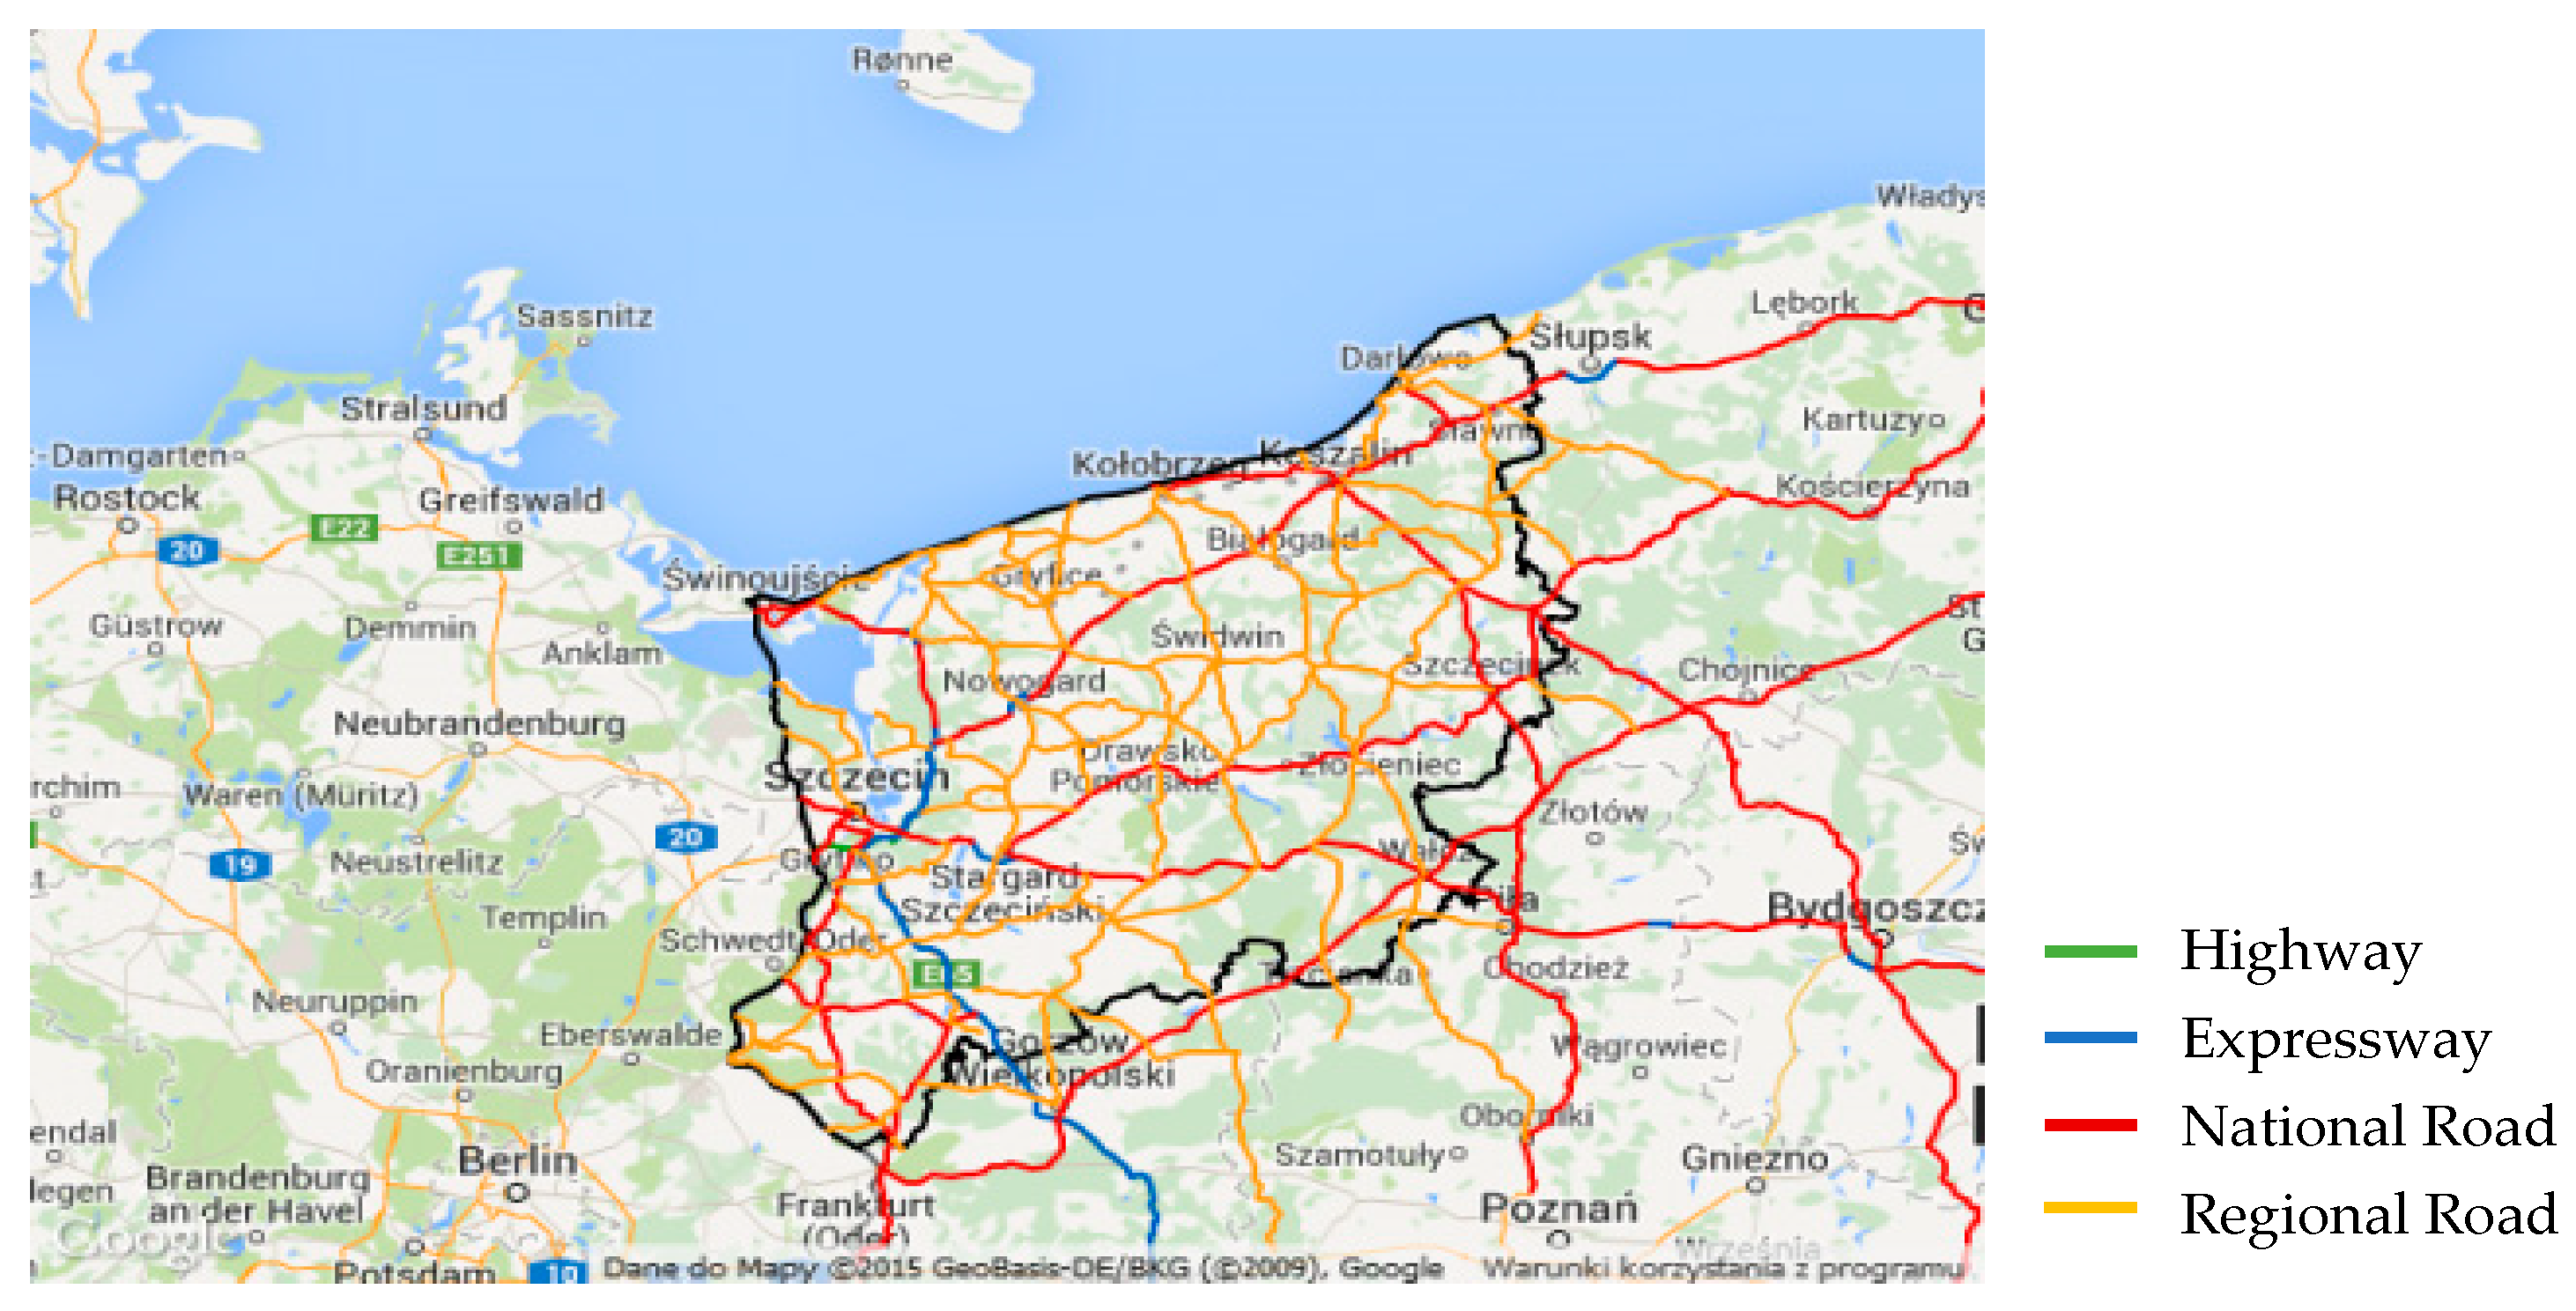
The current study is based on publicly available information at the Polish Central Statistical Office, publication “Transport of goods and passengers in 2024/Publication date: 2025-06-03/”–Table 3, National transport of goods by distance classes, p. 4/5 and publication “Road transport in Poland in the years 2022 and 2023/Publication date 2024-10-30”, General Directorate for National Roads and Motorways, CHART 32. Information on what distances goods are transported and the share of classes by weight of cargo carried was found on p.45 of CHART 38. Distribution of the number of transport companies with a community license by number of vehicles owned was found on p. 50. Modes of petrol delivery on SHRs (Short-Haul Routes) and other input information were taken from publications [61,62]. The research focuses on the A6, S3, S6, and no. 10, 13, and 31 expressway networks in north-western Poland within a radius of 95 to 350 km (as shown in Figure 7).

3.5.3. Additional Databases

The following electronic databases, widely recognized for their coverage of engineering, energy, transport, and logistics, were searched: Scopus; IEEE Xplore; and Web of Science, e.g., DB “Tc 406 Aluminum Trailers For The Transport Of Refined Petroleum Products” https://www.remtectank.com/en/category/134-tank-trailers.html (accessed on 2 July 2025) or DB “Tankmart International” Canada https://www.tankmart.com/petroleum-tank-trailers-for-sale.php (accessed on 2 July 2025). The selected trailer is shown in Figure 8.

3.5.4. Identifying Failed AI Deployments

Failed AI deployments in the SuS 2 ACE structure can have various causes:
  • Errors in planned adaptation activities in sensitive AI apps.
  • Absence of a proposition for adaptation measures based on relevant study results.
In analyzing this problem, let  D be a finite, non-empty upgrade decision set, whereby
  • Each decision  d i from the set  D can be assigned  d i 0,1 ;
  • Any correct decision  d i has a value equal to 1.0;
  • Any incorrect decision  d i * has a value equal to 0.
Introduce probability scales for successful/failed integration of HK&AI apps.
Scale 1. There are chance thresholds for effective integration [ P o / P 1 / P 2 ] such that for   P ξ ( t ) < P 0 the likelihood of generating positive synergies is negligible, for  P 0 P ξ ( t ) < P 1 the likelihood of generating a positive effect has a threshold value, and for   P 1 P ξ ( t ) P 2 the likelihood of generating a positive effect has a target value.
Scale 2. There are thresholds for the probability of the integration failing [ P 0 * / P 1 * / P 2 * ] such that for   P ξ ( t ) < P 0 * the likelihood of negative synergies being generated is negligible, for   P 0 * P ξ ( t ) < P 1 * the likelihood of generating a negative effect has a threshold value, and for   P 1 * P ξ ( t ) P 2 * there is a likelihood of generating a negative effect.
We will calculate the probability of the FDM architecture adapting to perform the new (improved) activities immediately after the implementation of the AI app   P ξ ( t )   following Equation (7):
P ξ t = P d 0 E x 1 [ S 11 t 1 ] × P S 11 t 1 + P d 0 E x 1 [ S 12 t 1 ] × P * S 12 t 1
where
  • d 0 —decision to implement the AI app, ensuring SuS 2 ACE transition; S 1 d 0 D ;
  • S 11 t 1 —compatibility status of the SuS 2 ACE immediately after implementation;
  • S 12 t 1 —component incompatibility status after implementation activities at moment  t 1 ;
  • E x 1 [ S 1 t 1 ]—the level of exposure to these events;
  • P S 11 ( t 1 ) —likelihood of generating positive synergies in the state  S 1 at moment  t 1 ;
  • P * S 12 t 1 —likelihood of generating negative synergies in the state  S 1 at moment  t 1 .
We will calculate the probability of the SuS 2 ACE adapting to perform new (streamlined) activities after the first AI app adaptation cycle   P ξ ( t )   following Equation (8):
P ξ t = P d 1 E x 2 [ S 21 t 2 ] × P S 21 t 2 + P d 1 E x 2 [ S 22 t 2 ] × P * S 22 t 2
where
  • d 1 —decision to adapt the deployed AI app transition to state  S 2 d 1 D ;
  • S 21 t 2 —state of compatibility of the SuS 2 ACE at moment t 2 after adaptation activities;
  • S 22 t 2 —the state of incompatibility of the SuS 2 ACE at moment  t 2 after adaptation starting;
  • E x 2 [ S 2 t 2 ]—the level of exposure to these events;
  • P S 21 t 2 —likelihood of generating positive synergy after SuS 2 ACE transition to state  S 2 ;
  • P * S 22 t 2 —likelihood of generating negative synergy after the SuS 2 ACE has moved on to  S 2 .
Conclusion: the  S j state of the SuS 2 ACE is called reachable from the  S i   s t a t e :
if   k i j > 0 , that   P i j > 0
where
  • P i j —probability of the SuS 2 transition from  S i state to  S j state.
The specific reasons for failed implementations are presented in Section 4.2.

4. Method

In our research, the stochastic approach was used to assess the degree of AI app adaptation to achieve positive synergy effects. Simultaneously, the adaptivity of the embedded AI app was defined by the probability of cooperating in each interaction with coupled HK items,  P [ 0.0 ,   1.0 ] . After a few considerations, authors of the manuscript adopted the so-called One-Shot Collective Risk Dilemma (CRD) method to assess the degree of AI app adaptation [64]. A group of  N -fleet managers must decide whether to cooperate (C-oriented) with AI apps by contributing a fraction  c of their knowledge  b or to defect (D-unoriented) from collaboration with AI apps and contribute nothing. If in the company’s logistics department there is a group of at least  M C-oriented fleet managers  M N that contributes to the FDM upgrade success, then other managers may keep their knowledge to themselves. Otherwise, there is a probability  P that TTC as whole will lose all competitiveness in the fuel deliveries market, which creates a dilemma for the FDM upgrade problem. This can be defined in functions of the number of C-oriented fleet managers in the j-group:
π D j = [ b 1 p + p θ x ]
π C j = π D c b
where
  • θ x —the Heaviside unit step function the value of which is zero for negative arguments and one for positive arguments [with  θ x 0 , if  x < 0 and  θ x = 1 otherwise];
  • c —involved part of the knowledge (treated as part of tasks solved with AI support);
  • b —knowledge (treated as all tasks solved by C-fleet managers).
We consider  Z -set of adaptive agents, which are randomly sampled in groups of size  N a   with  a AI apps from  A sets (items with similar features). The state of the population is then defined by the cooperation number  k 0 ,   Z . In each  k -group, we can calculate the number of  D -fleet managers and  C -fleet managers making pairs of HK/AI apps acceding to cooperation. Following this, the fitness equations for cooperative  C and defective  D strategies are as follows [64]:
f C = Z 1 N a 1 1 i = 0 N a 1 k 1 i Z k N a 1 i C i + 1 ,   a ,   p
f D = Z 1 N a 1 1 i = 0 N a 1 k i Z k 1 N a 1 i D i ,   a ,   p
where
  • P —probability that TTC could lose competitiveness in the fuel deliveries market;
  • Z —number of all AI apps randomly sampled in groups of size  N a ;
  • a —number of adaptive AI apps (has the consent of C-fleet managers to cooperate);
  • k —number of positive cooperations.
Each fleet manager may change their initial  D -strategy by choosing a  C -strategy from set planned tasks in line with the FDM upgrade project. With probability  P D C , it will mutate into a  C D strategy, causing positive synergy effects; otherwise, with probability  1 P D C . In case of fit with the upgrade project, a  D C strategy will turn into a  C D   with a probability described like the Fermi function:
P D C = 1 1 + e β f C f D
where
  • f C     f D —measure of selection strength for the adaptation process;
  • β —the so-called degeneracy factor goes back to the Fermi function.
In the opposite case, the effort of the fleet manager will only be an imitation of the C (D) strategy and will cause negative synergy effects.

4.1. Task 1: Evaluating Synergies as Upgrade Success

Synergistic effects are nonlinear cumulative effects of HK items and AI app cooperation with similar or related sequential or supplemental activities, analyzed in accordance with (Equation (15)):
S y n e r g y = C V   C u r r e n t   V a l u e ± P V   ( P r e m i u m   V a l u e )
where
  • C V —the current FDM value (before the upgrade);
  • P V —the additional FDM value (after the upgrade; can be positive or negative).
The cooperation of HK items and the AI app is realized via integration links, which can be permanent and used for, e.g., information gathering and structuring, as well as random and used for, e.g., data correction [60]. The assessment of synergistic effects was performed on the oriented binary graph   G depicting the SuS 2 ACE structure upgrade.
Assume that each upgrade task   L p generates a combination of   k -th AI app with   m -th HK items, which is described as   n k ,   n m ,     n k N ,   n m M . So, all upgrade tasks form the sequence
Z = L 1 n k 1 , n m 1 ,   , L p n k i , n m j ,   i I ;   j J
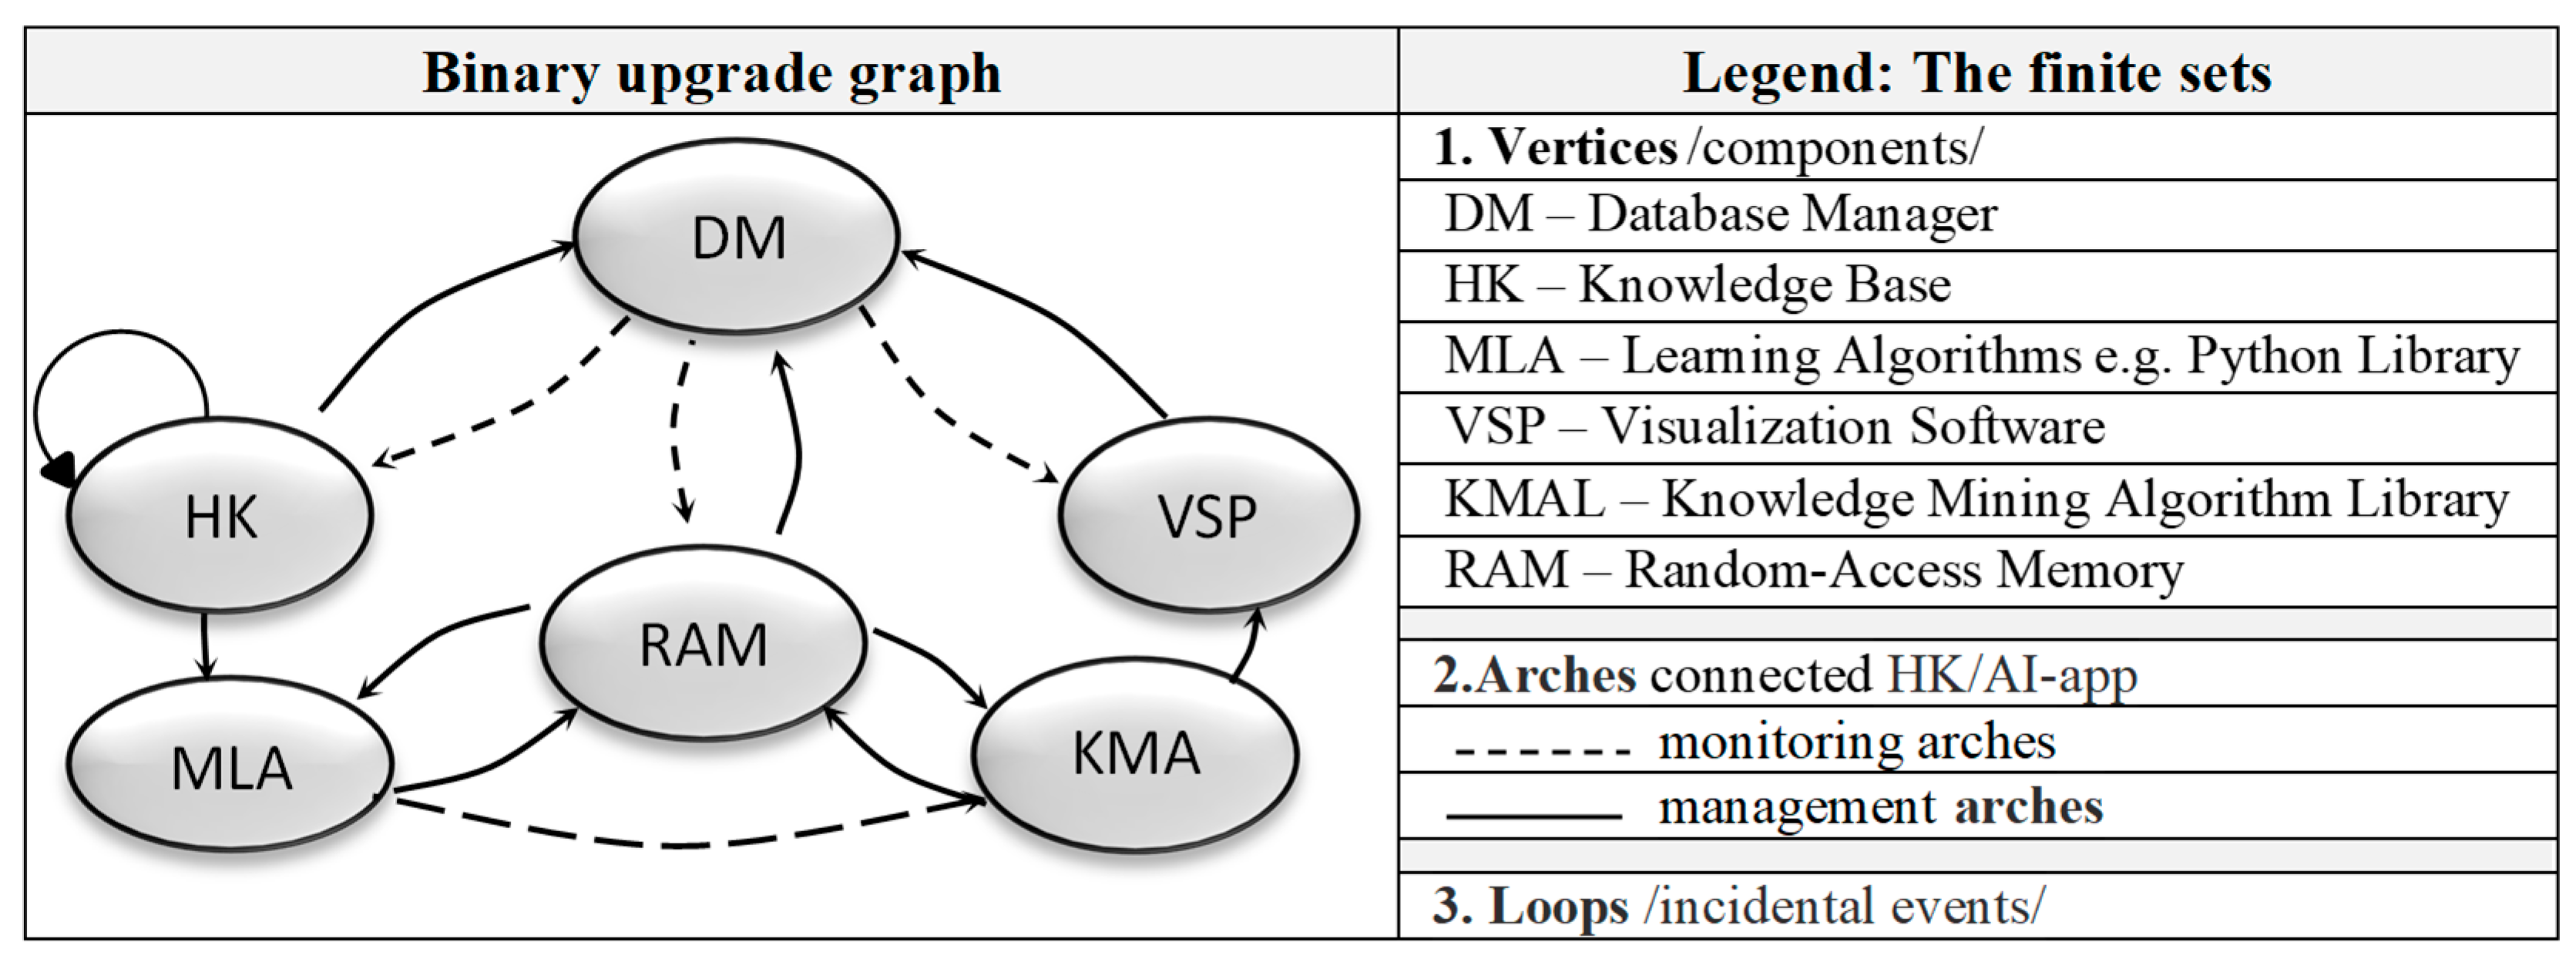
Let us assume that the SuS 2 ACE structure represents a multilayer block of conventional items, the tested graph G, for which the topology is shown in Figure 9. According to [61,65], each topology of the IT system can be described by a vector   q B l , where  l is the maximum set of integration connections between   n k ,   n m nodes.
The topological SuS 2 ACE upgrade model is considered to solve the task of creating a conflict-free set of AI component alternatives. The problem defined in this way boils down to a graph–theoretic task of covering the vertices of a directed graph while taking into account the compatibility condition of the implemented components.
In the second step, a coherence analysis of the HK item and the AI app was performed. This was an assessment of the positive synergy ( q i = 1 , i.e., full compatibility) or the negative synergy ( q i = 0 , i.e., full incompatibility), where (i∈I). At last, we enabled adaptation history collection of the deployed AI app after FDM architecture implementation. Results for beginning the upgrade are shown in Table 2, and results after two adaptation steps are provided in Table 3.
However, for the purposes of expert analysis, managers of TTC can use the graphical presentation of the obtained results, as shown in Figure 10 and Figure 11.
In the next step, we carried out analyzing and indicating the relevance or mistakenness of the upgrade made. Therefore, two concurrent processes were distinguished in the research, i.e., building and analyzing the topology of the FDM architecture as well as indicating upgrade effectiveness by assessing the achieved synergy effects.
The research was performed on a graphical model in which, according to [3], an approach was developed for initial decision making about the type of embedded AI app, as well as an added ejection procedure based on an action sequence leading to replacement of the early selected AI app with another AI app in case of fiasco.

4.2. Task 2: Evaluating Synergies as Scalability Success

Fleet optimization should ensure usefulness by minimizing empty miles and improving payload efficiency, increasing chances for additional trips, cutting operation risk, and maintaining clients’ satisfaction [9,10,13]. Existing techniques for selecting the mode of petrol delivery in LHR (Long-Haul Route) or SHR (Short-Haul Route) modes require large amounts of input information [62]. The research focuses on SHR deliveries on the A6, S3, S6, and no. 10, 13, and 31 expressway networks in north-western Poland within a radius of 95 to 350 km.
For research purposes, the authors analyzed the tanker trucks manufactured as computerized vehicles, equipped with electromechanical systems and installations, moving at a speed up to 90 km/h (Figure 7). The next step was to determine the best routes to PFS supply operating from 80 K km/month to 200 K km/month in unpredicted conditions (traffic jams, accidents, etc.) [66,67]. According to adaptive structuration theory, the research process was realized on a few levels, namely, the logistics department, the TTC, the local TTC platform, and the united FDM platform. The study’s aim was to assess the factors affecting the scalability effects arising after the vertical integration of the above-mentioned FDM levels. A positive synergy effect is created when there is additional value (extra results) through managers’ relationships on various management levels. Detailed information is provided in Table 4.
The study of the vehicle routing problem (VRP) was conducted as a directed graph [12,70,71]:
G = [ V ,   E ]
where
  • V —the set of  n + 1 vertices corresponding to  n (number of PFSs);
  • E —the set of edges corresponding to fuel delivery routes.
A nonnegative time dij is associated with each edge  i ,   j E . The  k i tanker truck is supplied from refinery  0 , but a set of  m identical trucks is stationed at this refinery and must be used for PFS supply [72]. A route is defined as a least-time cycle of graph  G passing through refinery  0 and such that the total demand of the vertices visited does not exceed the tanker’s capacity. The VRP consists of designing a set of least-time vehicle routes such that the following holds:
  • Each PFS is visited exactly once by exactly one road tanker;
  • All tanker routes start and end at the refinery;
  • All constraints are satisfied.
In this problem, there is a single refinery node indexed by  0 , and all fuel tank trucks have the same capacity  Q . Consider two groups of decision variables:
  • x ( i ,   j ,   k ) : The binary variable indicates a tanker  k active arc from node  n i to node  n j .
  • y ( i , k ) : The binary variable indicates synergy effects.
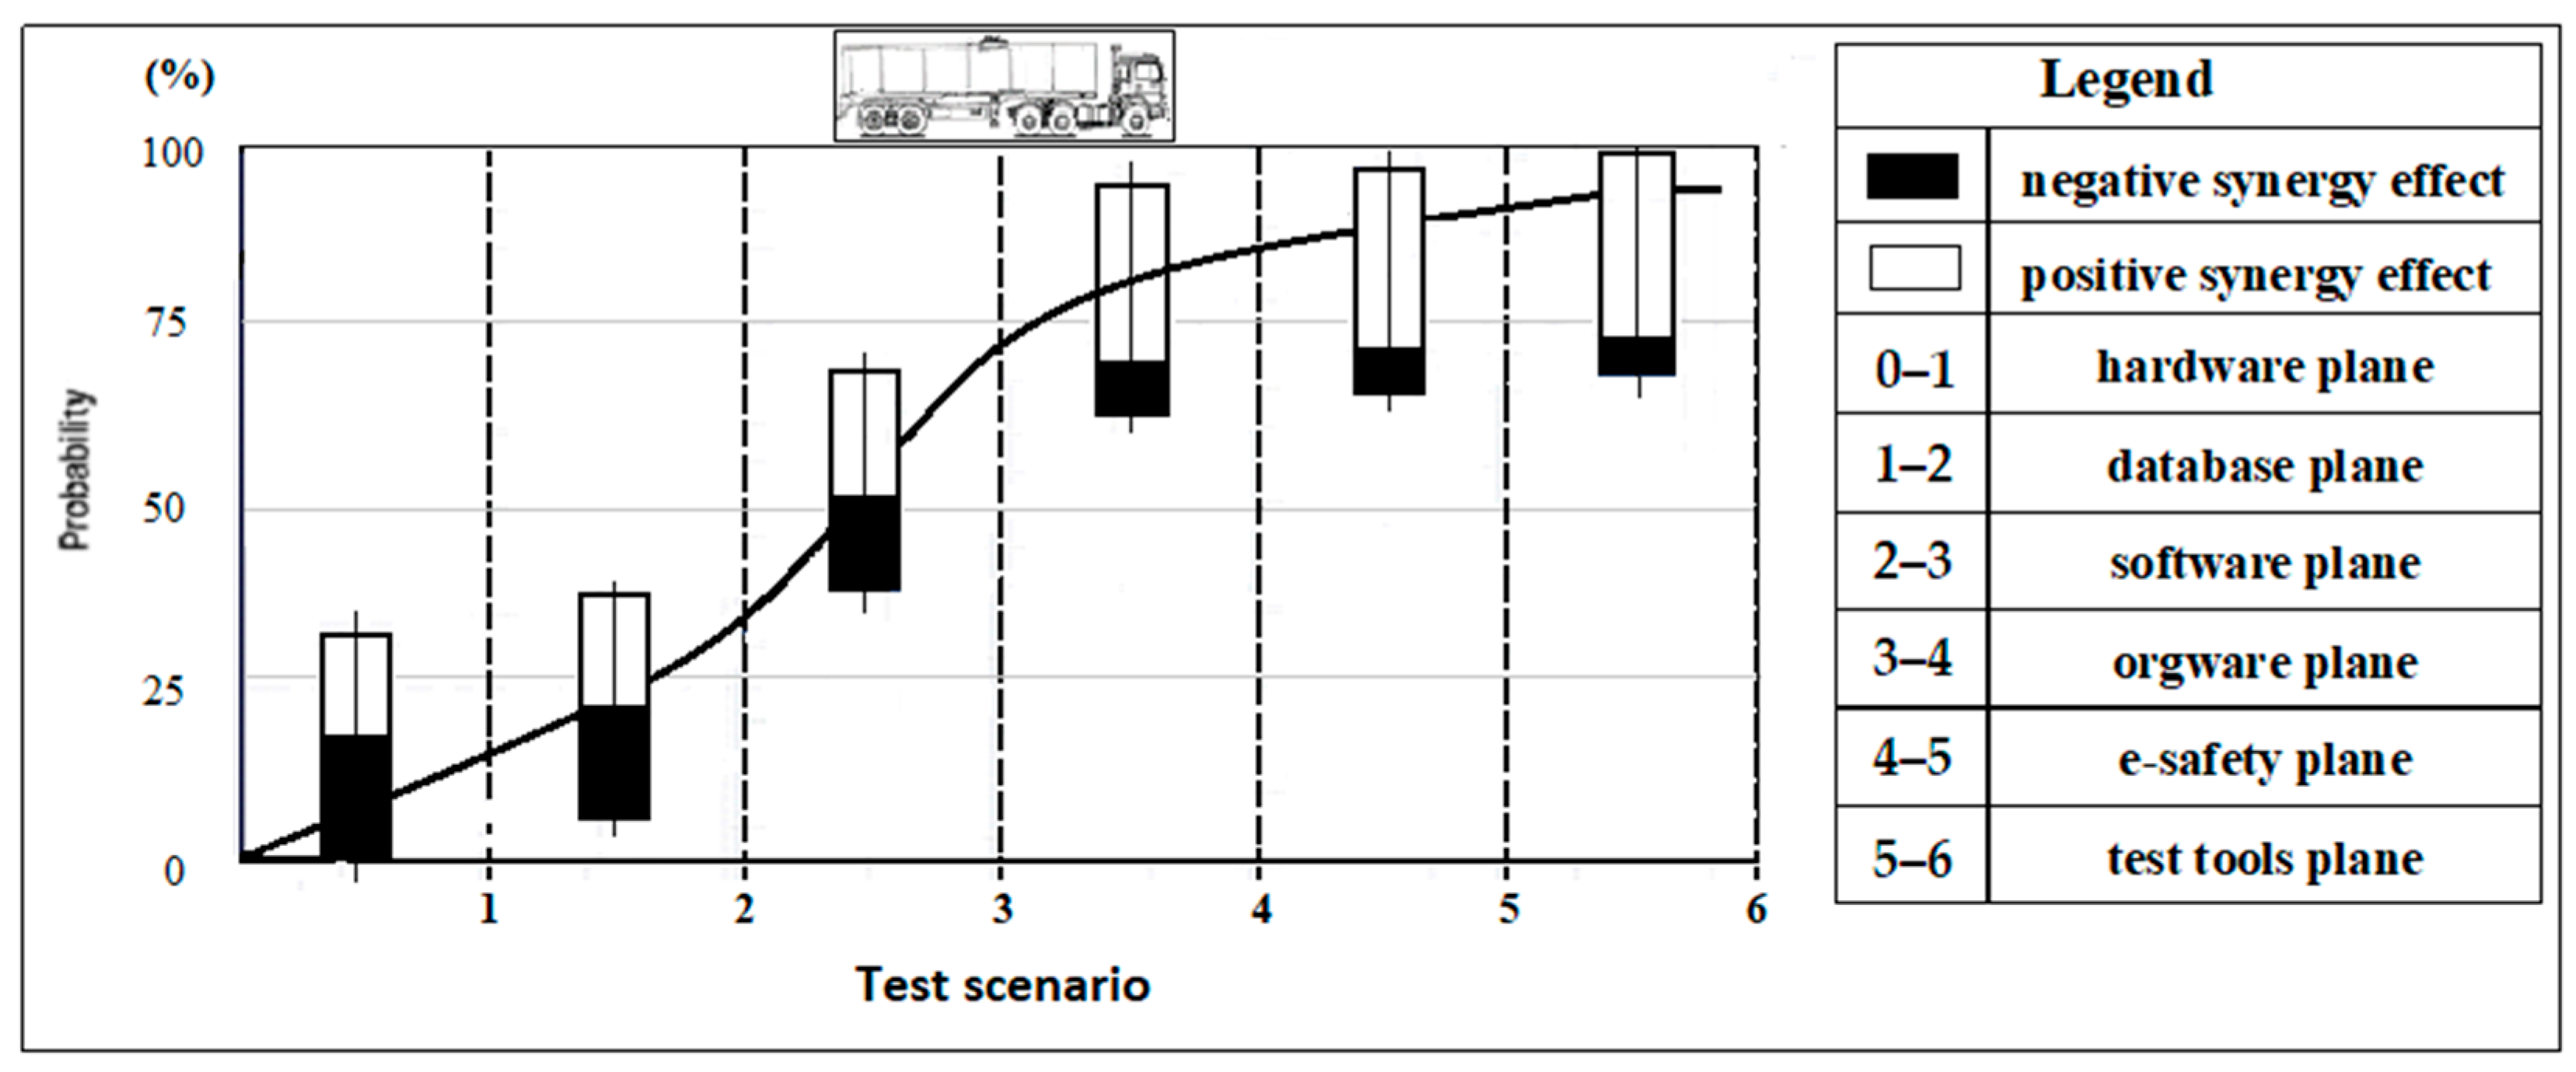
The synergy assessment was based on the three databases, including fuel supply schemes, delivery distances, and waiting times, and two sets of construction heuristics viz double-ended nearest neighbor and shortest arc hybridizing (probabilistic version). At each level, possible synergy effects as the additional/reduced orders handled yearly were analyzed. The results are shown in Figure 12. Similarly, it can maximize the strengths and minimize the weaknesses of HK and AI app cooperation, such as operation speed, problem solving capabilities, etc. [11].
During the study under task 2, we find the following:
  • The synergy effect is marginal when the value of the HK item depends on the value of the AI item, but the HK item’s value has no influence on the value of the AI item. This assumption was confirmed by the study results when the FDM upgrade (starting point) at the department and at the TTC level resulted in negative synergy effects, thus decreasing the number of serviced orders to (10–12)/(1–3) per year.
  • Such a situation required additional adaptation work caused by inconclusive goal setting, an attempt to implement an overcomplicated AI app, using the principle of a one-size-fits-all AI app, poor change management, and employees’ reluctance or refusal to accept changes.
  • Most synergy effects occurred when using regional platforms.

5. Discussion

As our research has shown, AI as a revolutionary tool for controlling fuel distribution provides the following:
  • Route optimization through an analysis of historical databases, optimizing traffic modes and schedules, and dynamically planning fuel delivery routes. By considering factors like delivery windows, vehicle capacities, and customer preferences, AI apps can reduce operation costs and improve on-time fuel distribution. For this, one of the surveyed TTCs uses the EasyRoutes AI app as an advanced HK/AI-driven tool to integrate route optimization.
  • Predictive analytics for fuel demand forecasting by analyzing weather patterns and market trends to predict future fuel demand. By combining state-of-the-art sequence modeling and machine learning techniques, a TTC can anticipate demand fluctuations, adjust inventory levels accordingly, and optimize supply chain operations. For this, one of the surveyed TTCs updated the RapidMiner AI app to easily integrate it with a wide range of data sources, including historical databases, cloud storage, and big data platforms, providing fleet managers with easy access and comfortable use of needed information.
  • AI technologies provide last mile visibility, giving both logistics teams and consumers real-time access to delivery progress, including inventory level assessment, fleet status evaluation, and traffic mode. By integrating data from sensors and GPS tracking devices, AI systems enable a TTC to monitor fuel distribution more effectively, reducing downtime risks and improving responses to unsafe events.
AI-driven development plays a crucial role in the surveyed TTC as it drives its competitive ability by creating intelligent control systems that assist fleet managers in optimizing fuel distribution. By leveraging the expertise of these TTCs and embracing AI technologies, other companies can enhance the efficiency, reliability, and sustainability of fuel distribution activities, ultimately leading to improved customer service and operational excellence.

6. Conclusions and Recommendations

  • The obtained findings indicate that a key factor inhibiting the improvement of the management process and increasing the associated risks is the incompatibility of innovative AI apps and traditional FDM architectures. Therefore, the integration of human capital with AI emerges as a company efficiency driver to the extent that the impact is also tied to organizational characteristics. This supports the fusion of human creativity with AI technology’s accuracy to foster resource-efficient and human-centric development.
  • The paper highlights the various ways in which ineffective FDM architecture can be integrated with pioneering AI apps to achieve maximum productivity. The research provided proof using the example of implementing an AI app in an FDM architecture.
  • The obtained findings show that immediately after the upgrade activities, positive effects are possible at the TTC level, and the probability of achieving them varies by 0.423 ± 0.05 to 0.893 ± 0.02. On the other hand, when the update concerns the logistics department level, the probability of achieving positive synergy effects is much lower, i.e., from 0.296 ± 0.07 to 0.629 ± 0.03. The relatively low value for achieving positive synergy effects is due to the high probability of an SPOF problem, poor changes in management, as well as employees’ reluctance or refusal to accept upgrade plans.
  • Reduction of the aforementioned risks is possible by eliminating barriers to upgrade success by using a strategy of incremental deployment of AI apps supported by adaptive techniques. In this case, the probability of achieving positive synergy within the FDM platforms ranges from 0.708 ± 0.03 to 0.964 ± 0.01 and has a range of up to 0.538 ± 0.03 to 0.809 ± 0.01 at the logistics department level.

7. Future Research

Looking forward, three areas need to be explored:
  • Further mining and structuring of knowledge about cooperation between humans and rapidly developing AI apps, which could have intertwined influences on the co-learning process.
  • Improving the decision making process based on familiarizing managers with AI’s possibilities, bridging the gap between real-world problems and management practice.
  • Ensuring both the dynamics and continuity of business development.

Author Contributions

Conceptualization, M.J. and I.S.; methodology, M.J. and I.S.; validation, I.A.; formal analysis, I.S. and I.A.; investigation, I.S.; resources, M.J., I.S., I.A., and M.W.; data curation, I.A.; writing—original draft preparation, I.S.; review and editing, M.J. and M.W.; visualization, I.A.; supervision, M.J.; project administration, M.J.; funding acquisition, M.J. and M.W. All authors have read and agreed to the published version of the manuscript.

Funding

This research received no specific grant from any funding agency in the public, commercial, or not-for-profit sectors. This article was prepared within the framework of research funded by the Excellence Initiative—Research University (IDUB) program at the Warsaw University of Technology.

Data Availability Statement

The datasets analyzed in the current study are publicly available at the Polish Central Statistical Office, publications “Transport of goods and passengers in 2024/Publication date: 2025-06-03/” and “Road transport in Poland in the years 2022 and 2023/Publication date 2024-10-30”, General Directorate for National Roads and Motorways, and were cited accordingly in the manuscript. Additional data are available upon request by contacting the corresponding author.

Conflicts of Interest

The authors declare that there are no conflicts of interest regarding the publication of this paper.

References

  1. Haenlein, M.; Kaplan, A. A Brief History of Artificial Intelligence: On the Past, Present, and Future of Artificial Intelligence. Calif. Manag. Rev. 2019, 61, 5–14. [Google Scholar] [CrossRef]
  2. Semenov, I.; Auguściak, I. Building the Enterprises Capacity Through Specialized-Self-Learning Knowledge Platforms (SLKP) Connected to Omnichannel Networks. In Emerging Challenges in Intelligent Management Information Systems; Hernes, M., Wątróbski, J., Rot, A., Eds.; ECAI 2024; Lecture Notes in Networks and Systems; Springer: Cham, Switzerland, 2024; Volume 1218, pp. 16–29. [Google Scholar] [CrossRef]
  3. Dashaputre, T. Enhancing Logistics Efficiency through a Hybrid AI-Human Collaboration Model: A Case for Operational Optimization. 2024. Available online: https://papers.ssrn.com/sol3/papers.cfm?abstract_id=4993111 (accessed on 9 August 2025).
  4. Aktürk, C. Artificial Intelligence in Enterprise Resource Planning Systems: A Bibliometric Study. J. Int. Logist. Trade 2021, 19, 69–82. [Google Scholar] [CrossRef]
  5. Bankins, S.; Ocampo, A.C.; Marrone, M.; Restubog, S.L.D.; Woo, S.E. A multilevel review of artificial intelligence in organizations: Implications for organizational behavior research and practice. J. Organ. Behav. 2024, 45, 159–182. [Google Scholar] [CrossRef]
  6. Mikalef, P.; Gupta, M. Artificial intelligence capability: Conceptualization, measurement calibration, and empirical study on its impact on organizational creativity and firm performance. Inf. Manag. 2021, 58, 103434. [Google Scholar] [CrossRef]
  7. Challapally, A.; Pease, C.; Raskar, R.; Chari, P. The GenAI Divide: State of AI in Business 2025. MIT NANDA, July 2025. Available online: https://mlq.ai/media/quarterly_decks/v0.1_State_of_AI_in_Business_2025_Report.pdf (accessed on 27 August 2025).
  8. Abduljabbar, R.; Dia, H.; Liyanage, S.; Bagloee, S.A. Applications of Artificial Intelligence in Transport: An Overview. Sustainability 2019, 11, 189. [Google Scholar] [CrossRef]
  9. Arinze, C.A.; Agho, M.O.; Eyo-Udo, N.L.; Abbey, A.B.N.; Onukwulu, E.C. AI-Driven Transport and Distribution Optimization Model (TDOM) for the downstream petroleum sector: Enhancing sme supply chains and sustainability. Magna Sci. Adv. Res. Rev. 2025, 13, 137–153. [Google Scholar] [CrossRef]
  10. Chen, W.; Men, Y.; Fuster, N.; Osorio, C.; Juan, A.A. Artificial Intelligence in Logistics Optimization with Sustainable Criteria: A Review. Sustainability 2024, 16, 9145. [Google Scholar] [CrossRef]
  11. Kolbjørnsrud, V. Designing the Intelligent Organization: Six Principles for Human-AI Collaboration. Calif. Manag. Rev. 2023, 66, 44–64. [Google Scholar] [CrossRef]
  12. Fernández Gil, A.; Lalla-Ruiz, E.; Gómez Sanchez, M.; Castro, C. The cumulative vehicle routing problem with time windows: Models and algorithm. Ann. Oper. Res. 2025, 350, 325–353. [Google Scholar] [CrossRef]
  13. Izdebski, M.; Jacyna-Gołda, I.; Gołda, P. Minimisation of the probability of serious road accidents in the transport of dangerous goods. Reliab. Eng. Syst. Saf. 2022, 217, 108093. [Google Scholar] [CrossRef]
  14. Jepsen, M.; Petersen, B.; Spoorendonk, S.; Pisinger, D. Subset-Row Inequalities Applied to the Vehicle-Routing Problem with Time Windows. Oper. Res. 2008, 56, 497–511. [Google Scholar] [CrossRef]
  15. Godbole, M.V. Revolutionizing Enterprise Resource Planning (ERP) Systems through Artificial Intelligence. Int. Numer. J. Mach. Learn. Robot. 2023, 7, 1–15. Available online: https://injmr.com/index.php/fewfewf/article/view/31 (accessed on 9 August 2025).
  16. Izdebski, M.; Jacyna-Gołda, I.; Wasiak, M. The application of genetic algorithm for warehouse location in logistic network. J. Kones Powertrain Transp. 2016, 23, 201–208. Available online: https://scispace.com/pdf/the-application-of-genetic-algorithm-for-warehouse-location-4f43sa63it.pdf (accessed on 28 July 2025).
  17. Izdebski, M.; Jacyna-Gołda, I.; Wasiak, M.; Jachimowski, R.; Kłodawski, M.; Pyza, D.; Żak, J. The application of the genetic algorithm to multi-criteria warehouses location problems on the logistics network. Transport 2018, 33, 741–750. [Google Scholar] [CrossRef]
  18. Wasiak, M.; Zdanowicz, P.; Nivette, M. Research on the effectiveness of alternative propulsion sources in high-tonnage cargo transport. Arch. Transp. 2021, 60, 259–273. [Google Scholar] [CrossRef]
  19. Pattnaik, S.; Liew, N.; Kures, A.O.; Pinsky, E.; Park, K. Catalyzing Supply Chain Evolution: A Comprehensive Examination of Artificial Intelligence Integration in Supply Chain Management. Eng. Process. 2024, 68, 57. [Google Scholar] [CrossRef]
  20. Perifanis, N.A.; Kitsios, F. Investigating the Influence of Artificial Intelligence on Business Value in the Digital Era of Strategy: A Literature Review. Information 2023, 14, 85. [Google Scholar] [CrossRef]
  21. Sun, X.; Song, Y. Unlocking the Synergy: Increasing productivity through Human-AI collaboration in the industry 5.0 Era. Comput. Ind. Eng. 2025, 200, 110657. [Google Scholar] [CrossRef]
  22. Daios, A.; Kladovasilakis, N.; Kelemis, A.; Kostavelis, I. AI Applications in Supply Chain Management: A Survey. Appl. Sci. 2025, 15, 2775. [Google Scholar] [CrossRef]
  23. Fahnenstich, H.; Rieger, T.; Roesler, E. Trusting under risk—Comparing human to AI decision support agents. Comput. Hum. Behav. 2024, 153, 108107. [Google Scholar] [CrossRef]
  24. Goundar, S. Introduction to Enterprise Systems and Technological Convergence. In Enterprise Systems and Technological Convergence: Research and Practice; Information Age Publishing Inc.: Charlotte, NC, USA, 2021; Chapter 1; pp. 1–21. Available online: https://www.researchgate.net/publication/353430514_Introduction_to_Enterprise_Systems_and_Technological_Convergence_Research_and_Practice (accessed on 15 July 2025).
  25. Borges, A.F.S.; Laurindo, F.J.B.; Spínola, M.M.; Gonçalves, R.F.; Mattos, C.A. The strategic use of artificial intelligence in the digital era: Systematic literature review and future research directions. Int. J. Inf. Manag. 2021, 57, 102225. [Google Scholar] [CrossRef]
  26. Farrow, E. Determining the human to AI workforce ratio—Exploring future organisational scenarios and the implications for anticipatory workforce planning. Technol. Soc. 2022, 68, 101879. [Google Scholar] [CrossRef]
  27. Regulation (EU) 2024/1689 of the European Parliament and of the Council, of 13 June 2024, Laying Down Harmonised Rules on Artificial Intelligence and Amending Regulations (EC) No 300/2008, (EU) No 167/2013, (EU) No 168/2013, (EU) 2018/858, (EU) 2018/1139 and (EU) 2019/2144 and Directives 2014/90/EU, (EU) 2016/797 and (EU) 2020/1828 (Artificial Intelligence Act). Available online: https://eur-lex.europa.eu/eli/reg/2024/1689/oj/eng (accessed on 30 July 2025).
  28. Chai, H.; He, R.; Jia, X.; Ma, C.; Dai, C. Generalized route planning approach for hazardous materials transportation with equity consideration. Arch. Transp. 2018, 46, 33–46. [Google Scholar] [CrossRef]
  29. Kaczorek, M.; Jacyna, M. Fuzzy logic as a decision-making support tool in planning transport development. Arch. Transp. 2022, 61, 51–70. [Google Scholar] [CrossRef]
  30. Gorobchenko, O.; Holub, H.; Zaika, D. Theoretical basics of the self-learning system of intelligent locomotive decision support systems. Arch. Transp. 2024, 71, 169–186. [Google Scholar] [CrossRef]
  31. Monteiro Nunes, T.M.; Borst, C.; van Kampen, E.-J.; Hillburn, B.; Westin, C. Human-interpretable input for Machine Learning in Tactical Air Traffic Control 2021. In Proceedings of the 11th SESAR Innovation Days, Online, 7–9 December 2021. [Google Scholar] [CrossRef]
  32. Bonelli, S.; Borst, C.; Brambati, F.; Cocchioni, M.; Hilburn, B.; Monteiro-Nunes, T. Transparent and Personalised AI Support in Air Traffic Control: First Empirical Results 2022. In Proceedings of the International Conference on Cognitive Aircraft Systems ICCAS 2022, Toulouse, France, 1–2 June 2022. [Google Scholar] [CrossRef]
  33. Li, S.; Liu, Y.; Qu, X. Model Controlled Prediction: A Reciprocal Alternative of Model Predictive Control. IEEE/CAA J. Autom. Sin. 2022, 9, 1107–1110. [Google Scholar] [CrossRef]
  34. Jia, R.; Chamoun, R.; Wallenbring, A.; Advand, M.; Yu, S.; Liu, Y.; Gao, K. A spatio-temporal deep learning model for short-term bike-sharing demand prediction. Electron. Res. Arch. 2023, 31, 1031–1047. [Google Scholar] [CrossRef]
  35. Wu, F.; Lyu, C.; Liu, Y. A personalized recommendation system for multi-modal transportation systems. Multimodal Transp. 2022, 1, 100016. [Google Scholar] [CrossRef]
  36. Pan, Z.; Chen, M.; Lu, S.; Tian, Z.; Liu, Y. Integrated Timetable Optimization for Minimum Total Energy Consumption of an AC Railway System. IEEE Trans. Veh. Technol. 2020, 69, 3641–3653. [Google Scholar] [CrossRef]
  37. Liang, Y.; Liu, H.; Qian, C.; Wang, G. A Modified Genetic Algorithm for Multi-Objective Optimization on Running Curve of Automatic Train Operation System Using Penalty Function Method. Int. J. Intell. Transp. Syst. Res. 2019, 17, 74–87. [Google Scholar] [CrossRef]
  38. Yang, J.; Jia, L.; Fu, Y.; Lu, S. Speed Tracking Based Energy-Efficient Freight Train Control Through Multi-Algorithms Combination. IEEE Intell. Transp. Syst. Mag. 2017, 9, 76–90. [Google Scholar] [CrossRef]
  39. Saki, S.; Soori, M. Artificial Intelligence, Machine Learning and Deep Learning in. Advanced Transportation Systems, A Review. Multimodal Transp. 2025; in press. [Google Scholar] [CrossRef]
  40. Yan, H.; Li, Y. Generative AI for Intelligent Transportation Systems: Road Transportation Perspective. ACM Comput. Surv. 2025, 57, 315. [Google Scholar] [CrossRef]
  41. Taran, I.; Olzhabayeva, R.; Oliskevych, M.; Danchuk, V. Structural optimization of multimodal routes for cargo delivery. Arch. Transp. 2023, 67, 49–70. [Google Scholar] [CrossRef]
  42. Peng, Y.; Mo, Z.; Liu, S. Passenger’s routes planning in stochastic common-lines’ multi-modal transportation network through integrating Genetic Algorithm and Monte Carlo simulation. Arch. Transp. 2021, 59, 73–92. [Google Scholar] [CrossRef]
  43. Lee, Y.; Wei, C.-H.; Chao, K.-C. Non-parametric machine learning methods for evaluating the effects of traffic accident duration on freeways. Arch. Transp. 2017, 43, 91–104. [Google Scholar] [CrossRef]
  44. Tarapata, Z.; Kulas, W.; Antkiewicz, R. Machine learning algorithms for the problem of optimizing the distribution of parcels in time-dependent networks: The case study. Arch. Transp. 2022, 61, 133–147. [Google Scholar] [CrossRef]
  45. Vaze Kadam, S. Leveraging Artificial Intelligence to Reinvent Enterprise Resource Planning (ERP) Functionality. Voice Creat. Res. 2025, 7, 266–272. [Google Scholar] [CrossRef]
  46. Attaluri, V. Real-Time Monitoring and Auditing of Role Changes in Databases. Int. Numer. J. Mach. Learn. Robot. 2023, 7. Available online: https://injmr.com/index.php/fewfewf/article/view/184/43 (accessed on 25 August 2025).
  47. Qu, C.; Kim, E. Reviewing the Roles of AI-Integrated Technologies in Sustainable Supply Chain Management: Research Propositions and a Framework for Future Directions. Sustainability 2024, 16, 6186. [Google Scholar] [CrossRef]
  48. Kunduru, A.R. Effective Usage of Artificial Intelligence in Enterprise Resource Planning Applications. Int. J. Comput. Trends Technol. 2023, 71, 73–80. [Google Scholar] [CrossRef]
  49. Panek, A.; Jacyna, M.; Jachimowski, R.; Szczepański, E. Reliability and efficiency in technology selection in logistics facilities—Multi-criteria decision support using the AHP method. Maint. Reliab. 2025, 27, 21. [Google Scholar] [CrossRef]
  50. Sedera, D.; Zakaria, N.H. Adaptive structuration theory view of post implementation knowledge management for enterprise systems. In Proceedings of the Pacific Asia Conference on Information System PACIS 2008 Proceedings: AIS, Suzhou, China, 3–7 July 2008; p. 179. Available online: https://aisel.aisnet.org/pacis2008/179 (accessed on 25 September 2025).
  51. Jarrahi, M.H. Artificial intelligence and the future of work: Human-AI symbiosis in organizational decision making. Bus. Horiz. 2018, 61, 577–586. [Google Scholar] [CrossRef]
  52. Shao, Z.; Li, X.; Wang, Q. From ambidextrous learning to digital creativity: An integrative theoretical framework. Inf. Syst. J. 2022, 32, 544–572. [Google Scholar] [CrossRef]
  53. Rangineni, S.; Marupaka, D.; Bhardwaj, A.K. An Examination of Machine Learning in the Process of Data Integration. Int. J. Comput. Trends Technol. 2023, 71, 79–85. [Google Scholar] [CrossRef]
  54. Venugopal, M.; Nanda, M.; Anand, G.; Voora, H.C. An integrated Hardware/Software Verification and Validation methodology for Signal Processing Systems. ITM Web Conf. 2022, 50, 02001. [Google Scholar] [CrossRef]
  55. Wang, J.; Nie, Y. Managing the dynamic change of organizational knowledge base in collaboration networks. Balt. J. Manag. 2022, 17, 321–337. [Google Scholar] [CrossRef]
  56. Stine, K.; Quinn, S.; Witte, G.; Gardner, R.K. Integrating Cybersecurity and Enterprise Risk Management (ERM); NISTIR 8286; National Institute of Standards and Technology: Gaithersburg, MD, USA, 2020; p. 64. [Google Scholar] [CrossRef]
  57. Wilson, H.J.; Daugherty, P.R. Collaborative Intelligence: Humans and AI Are Joining Forces. Harv. Bus. Rev. 2018, 114–123. Available online: https://hometownhealthonline.com/wp-content/uploads/2019/02/ai2-R1804J-PDF-ENG.pdf (accessed on 18 August 2025).
  58. Lasota, M.; Jacyna, M.; Wasiak, M.; Zabielska, A. The Use of Multi-criteria Methods in the Problem of Selecting Vehicles for Oversize Cargo Transport. In Challenges and Solutions for Present Transport Systems; Sierpiński, G., Masoumi, H., Macioszek, E., Eds.; TSTP 2022; Lecture Notes in Networks and Systems; Springer: Cham, Switzerland, 2023; Volume 609, pp. 22–47. [Google Scholar] [CrossRef]
  59. Wei, Q.; Zhang, Q.; Yan, R.; Wu, X. A Theoretical Framework for the Inter-Organizational Knowledge Collaboration of Knowledge Network. In Proceedings of the Thirteenth International Conference on Management Science and Engineering Management, St. Catharines, ON, Canada, 5–8 August 2019; Xu, J., Ahmed, S., Cooke, F., Duca, G., Eds.; ICMSEM 2019; Advances in Intelligent Systems and Computing. Springer: Cham, Switzerland, 2020; Volume 1001, pp. 772–782. [Google Scholar] [CrossRef]
  60. Szabó, G.; Fáth, G. Evolutionary games on graphs. Phys. Rep. 2007, 446, 97–216. [Google Scholar] [CrossRef]
  61. Semenov, I.N.; Filina-Davidovich, L. Topology-based approach to the modernization of transport and logistics systems with hybrid architecture. Part 1. Proof-of-concept study. Arch. Transp. 2017, 43, 105–124. [Google Scholar] [CrossRef]
  62. Pani, A.; Mishra, S.; Sahu, P. Developing multi-vehicle freight trip generation models quantifying the relationship between logistics outsourcing and insourcing decisions. Transp. Res. Part E Logist. Transp. Rev. 2022, 159, 102632. [Google Scholar] [CrossRef]
  63. Available online: https://conadrogach.pl/wojewodztwo/zachodniopomorskie/#goog_rewarded (accessed on 10 May 2025).
  64. Terrucha, I.; Fernández Domingos, E.; Santos, F.C.; Simoens, P.; Lenaerts, T. The art of compensation: How hybrid teams solve collective-risk dilemmas. PLoS ONE 2024, 19, e0297213. [Google Scholar] [CrossRef] [PubMed]
  65. Mai, Z.; Wang, W.; Liu, X.; Feng, X.; Wang, J.; Fu, W. A Reinforcement Learning Approach for Graph Rule Learning. Big Data Min. Anal. 2025, 8, 31–44. [Google Scholar] [CrossRef]
  66. Lasota, M.; Zabielska, A.; Jacyna, M.; Gołębiowski, P.; Żochowska, R.; Wasiak, M. Method for Delivery Planning in Urban Areas with Environmental Aspects. Sustainability 2024, 16, 1571. [Google Scholar] [CrossRef]
  67. Nehring, K.; Lasota, M.; Zabielska, A.; Jachimowski, R. A multifaceted approach to assessing intermodal transport. Sci. J. Silesian Univ. Technol. 2023, 121, 141–165. [Google Scholar] [CrossRef]
  68. Cho, W.; Shaw, M.J.; Kwon, H.D. The effect of synergy enhancement on information technology portfolio selection. Inf. Technol. Manag. 2013, 14, 125–142. [Google Scholar] [CrossRef]
  69. Skačkauskienė, I.; Hrušecká, D.; Katinienė, A.; Čepel, M. Evaluation of knowledge synergy components. Ekon. A Manag. 2018, 21, 144–158. [Google Scholar] [CrossRef]
  70. Eglese, R.; Zambirinis, S. Disruption management in vehicle routing and scheduling for road freight transport: A review. TOP 2018, 26, 1–17. [Google Scholar] [CrossRef]
  71. Eliiyi, U. Artificial Intelligence for Smart Cities: Locational Planning and Dynamic Routing of Emergency Vehicles. In The Impact of Artificial Intelligence on Governance, Economics and Finance; Bozkuş Kahyaoğlu, S., Ed.; Accounting, Finance, Sustainability, Governance & Fraud: Theory and Application; Springer: Singapore, 2022; Volume 2, pp. 41–63. [Google Scholar] [CrossRef]
  72. Semenov, I.; Jacyna, M.; Milewska, B. Maximizing uptime of the aging road tanker fleets in labor shortages and economic uncertainty by implementing preventive maintenance practices. Maint. Reliab. 2026, 28, 205976. [Google Scholar] [CrossRef]
Figure 1. The research concept. Source: authors’ own elaboration.
Energies 18 05203 g001
Figure 2. The concept of FDM architecture upgrade. Source: authors’ own elaboration.
Energies 18 05203 g002
Figure 3. Design space for adaptation HK/AI items. Source: authors’ own elaboration.
Energies 18 05203 g003
Figure 4. The schedule of changes made. Source: authors’ own elaboration.
Energies 18 05203 g004
Figure 5. The algorithm fragment of the upgrade process. Source: authors’ own elaboration.
Energies 18 05203 g005
Figure 6. Number of adaptation sessions by category. Source: authors’ own elaboration.
Energies 18 05203 g006
Figure 7. Public road network of the West Pomeranian Province (Poland) included in fuel deliveries research. Source: [63].
Energies 18 05203 g007
Figure 9. The research flowchart for the FDM upgrade. Source: authors’ own elaboration.
Energies 18 05203 g009
Figure 10. Horizontal integration: comparison of synergy effects’ probability at initial upgrade point. Source: authors’ own elaboration.
Energies 18 05203 g010
Figure 11. Horizontal integration: comparison of synergy effects’ probability after post-adaptation test. Source: authors’ own elaboration.
Energies 18 05203 g011
Figure 12. Vertical integration: comparison of the probability of extra serviced PFSs as a result of HK/AI collaboration. Source: authors’ own elaboration.
Energies 18 05203 g012
Table 1. The comprehensive overview of AI applications.
SectorApplication AreasNumber of Implementations
XX CenturyXXI Century
1Industrial production
  • Support for the design process of innovative products
  • Production streamlining via optimized resources
  • Improving the servicing quality/diagnostics/repairs
5–874–82
2Transport and logistics
services
  • Improving the timeliness of order processing
  • Optimization of supply and routing schedules
  • Reduction of excess/shortage stocks
3–461–72
3Financial
institutions
  • Client service via KYC (Know Your Customer) value
  • Credit risk assessment and client verification
  • Access controls, cyberthreat prevention
2–356–69
4Retail
trade
  • Personalization of advertising information
  • Optimization of the range for goods ordered
  • Predictive demands via use of chatbots as HR advisors
2–337–41
Source: authors’ own elaboration based on [4,8,23].
Table 2. Horizontal integration: The synergy likelihoods after start FDM upgrade (initial point).
Integration
Plane
Integration Levels
Management Subsystem
/Logistics Department
Management System
/Tank Trucking Company
Multiple Managing Systems
/Regional Platform
P 1 S 1 P 1 * S 1 P 1 S 1 P 1 * S 1 P 1 S 1 P 1 * S 1
Hardware0.462 ± 0.050.537 ± 0.040.416 ± 0.050.584 ± 0.030.493 ± 0.040.507 ± 0.04
Database0.524 ± 0.040.476 ± 0.050.496 ± 0.040.504 ± 0.050.575 ± 0.030.425 ± 0.05
Software0.395 ± 0.070.605 ± 0.030.308 ± 0.060.692 ± 0.040.428 ± 0.050.572 ± 0.03
Orgware0.386 ± 0.090.614 ± 0.030.289 ± 0.080.711 ± 0.030.423 ± 0.050.577 ± 0.04
E-safety0.629 ± 0.030.371 ± 0.080.579 ± 0.060.421 ± 0.050.814 ± 0.030.186 ± 0.09
Test tools0.296 ± 0.070.704 ± 0.020.278 ± 0.070.722 ± 0.040.893 ± 0.020.107 ± 0.09
Source: authors’ own elaboration.
Table 3. Horizontal integration: the synergy likelihoods after two steps of AI-app adaptation.
Integration
Plane
Integration Levels
Management Subsystem
/Logistics Department
Management System
/Tank Trucking Company
Multiple Managing Systems
/Regional Platform
P 3 S 3 P 3 * S 3 P 3 S 3 P 3 * S 3 P 3 S 3 P 3 * S 3
Hardware0.672 ± 0.020.328 ± 0.050.792 ± 0.040.208 ± 0.080.708 ± 0.030.292 ± 0.06
Database0.756 ± 0.010.244 ± 0.060.831 ± 0.050.169 ± 0.080.822 ± 0.020.178 ± 0.08
Software0.568 ± 0.030.432 ± 0.040.902 ± 0.050.098 ± 0.090.943 ± 0.020.057 ± 0.09
Orgware0.538 ± 0.030.462 ± 0.040.936 ± 0.050.064 ± 0.080.929 ± 0.010.071 ± 0.08
E-safety0.809 ± 0.010.191 ± 0.070.893 ± 0.050.107 ± 0.080.964 ± 0.010.036 ± 0.10
Test tools0.758 ± 0.030.242 ± 0.060.951 ± 0.040.049 ± 0.080.902 ± 0.010.098 ± 0.08
Pi(Si)—probability of generating positive synergies in FDM after two adaptation steps;
Pi*(Si)—probability of generating negative synergies in FDM after two adaptation steps.
Source: authors’ own elaboration.
Table 4. Description of relevant levels for fuel delivery management system.
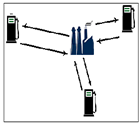
Energies 18 05203 i001Basic
Supply Patterns
Scalability
Index
Synergy
Effects
Department level:
one refinery—one petrol station
Energies 18 05203 i002 S I 1 = n n 1 2 Negative synergy
Incompatible operation, resulting in wasted time and resources
Positive synergy
Decreased delivery times
Tank trucking company level:
shuttle delivery
Energies 18 05203 i003 S I 2 = n n 1 Negative synergy
Conflicting priorities—a lack of alignment and cooperation
Positive Synergy
Increased demand and servicing quality
Local platform level:
one refinery—several petrol stations
Energies 18 05203 i004 S I 3 = 2 n 2 n 2 + 1 Negative synergy
Lack of collaboration and, as a result, duplicated efforts, conflicting goals, and ineffective resource use
Positive synergy
-
Minimized downtime
-
Maximized number of served PDS in particular time period
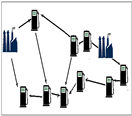
Regional platform level:
few refineries—numerous petrol stations
Energies 18 05203 i005 S I 4 = 2 n 1 m S I 1 Negative synergy
Incompatibility of usability and, as a result, wastefulness and reduced overall effectiveness
Positive synergy
-
Support future grown
-
Significant adaptation to business changes
Source: authors’ own elaboration based on [14,68,69].
Disclaimer/Publisher’s Note: The statements, opinions and data contained in all publications are solely those of the individual author(s) and contributor(s) and not of MDPI and/or the editor(s). MDPI and/or the editor(s) disclaim responsibility for any injury to people or property resulting from any ideas, methods, instructions or products referred to in the content.