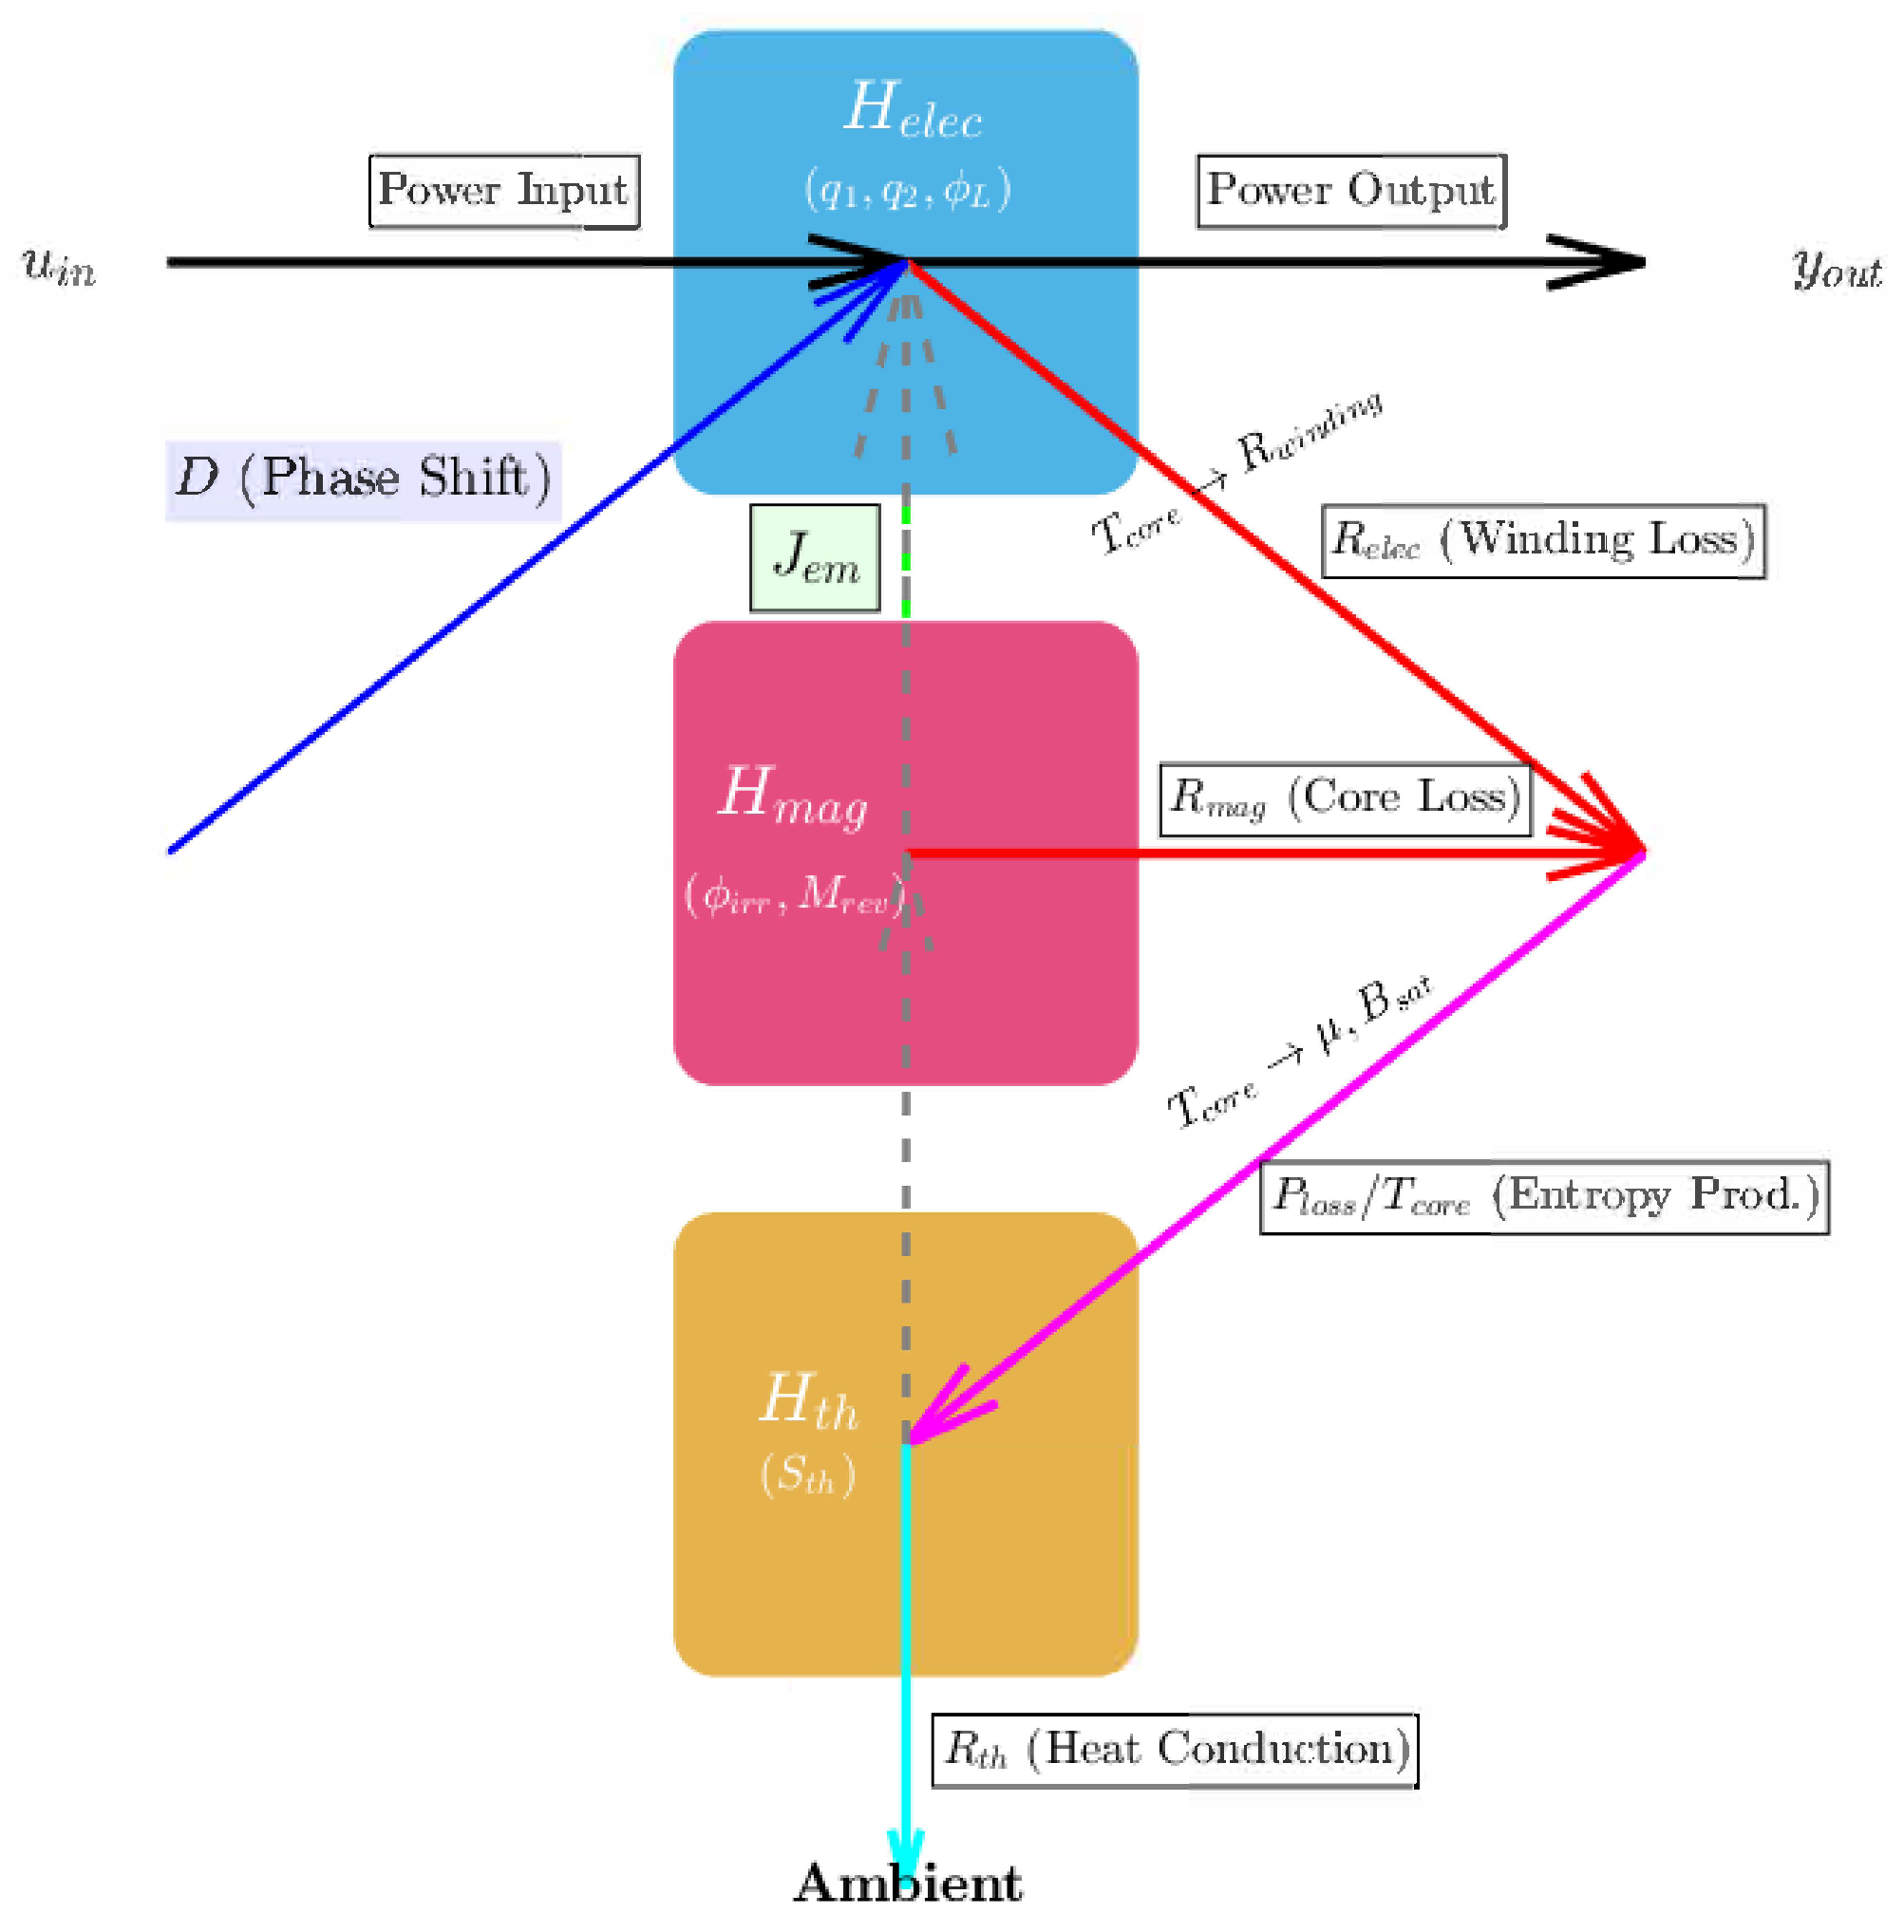
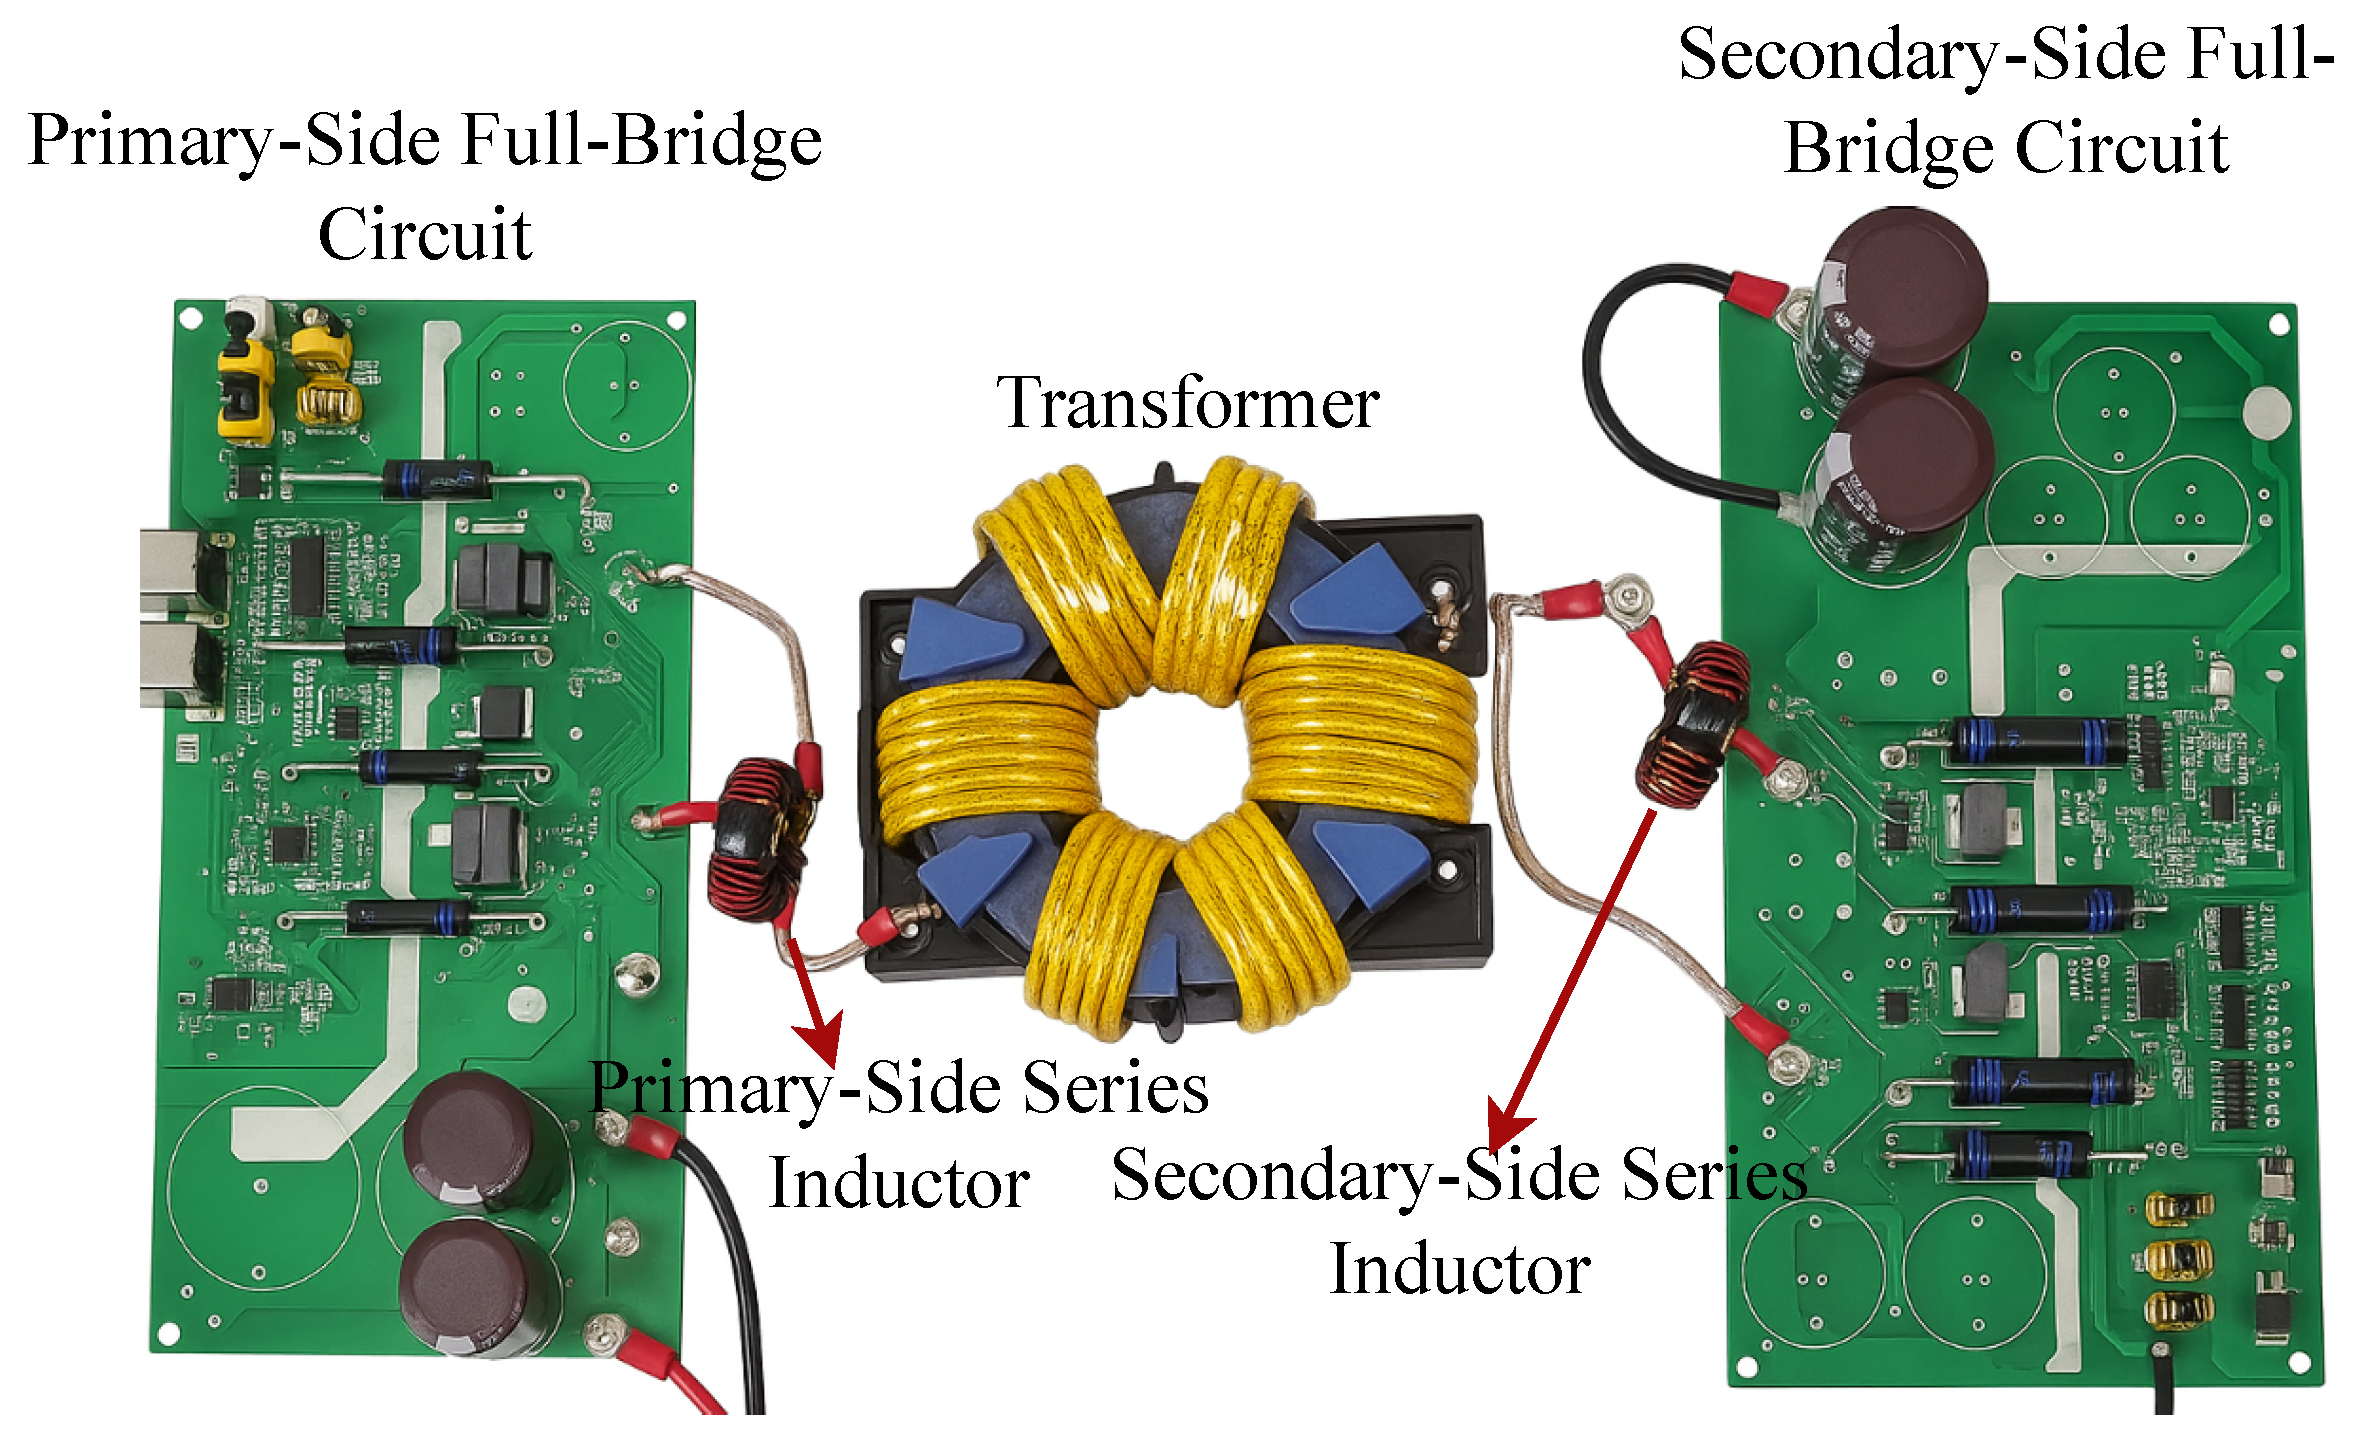
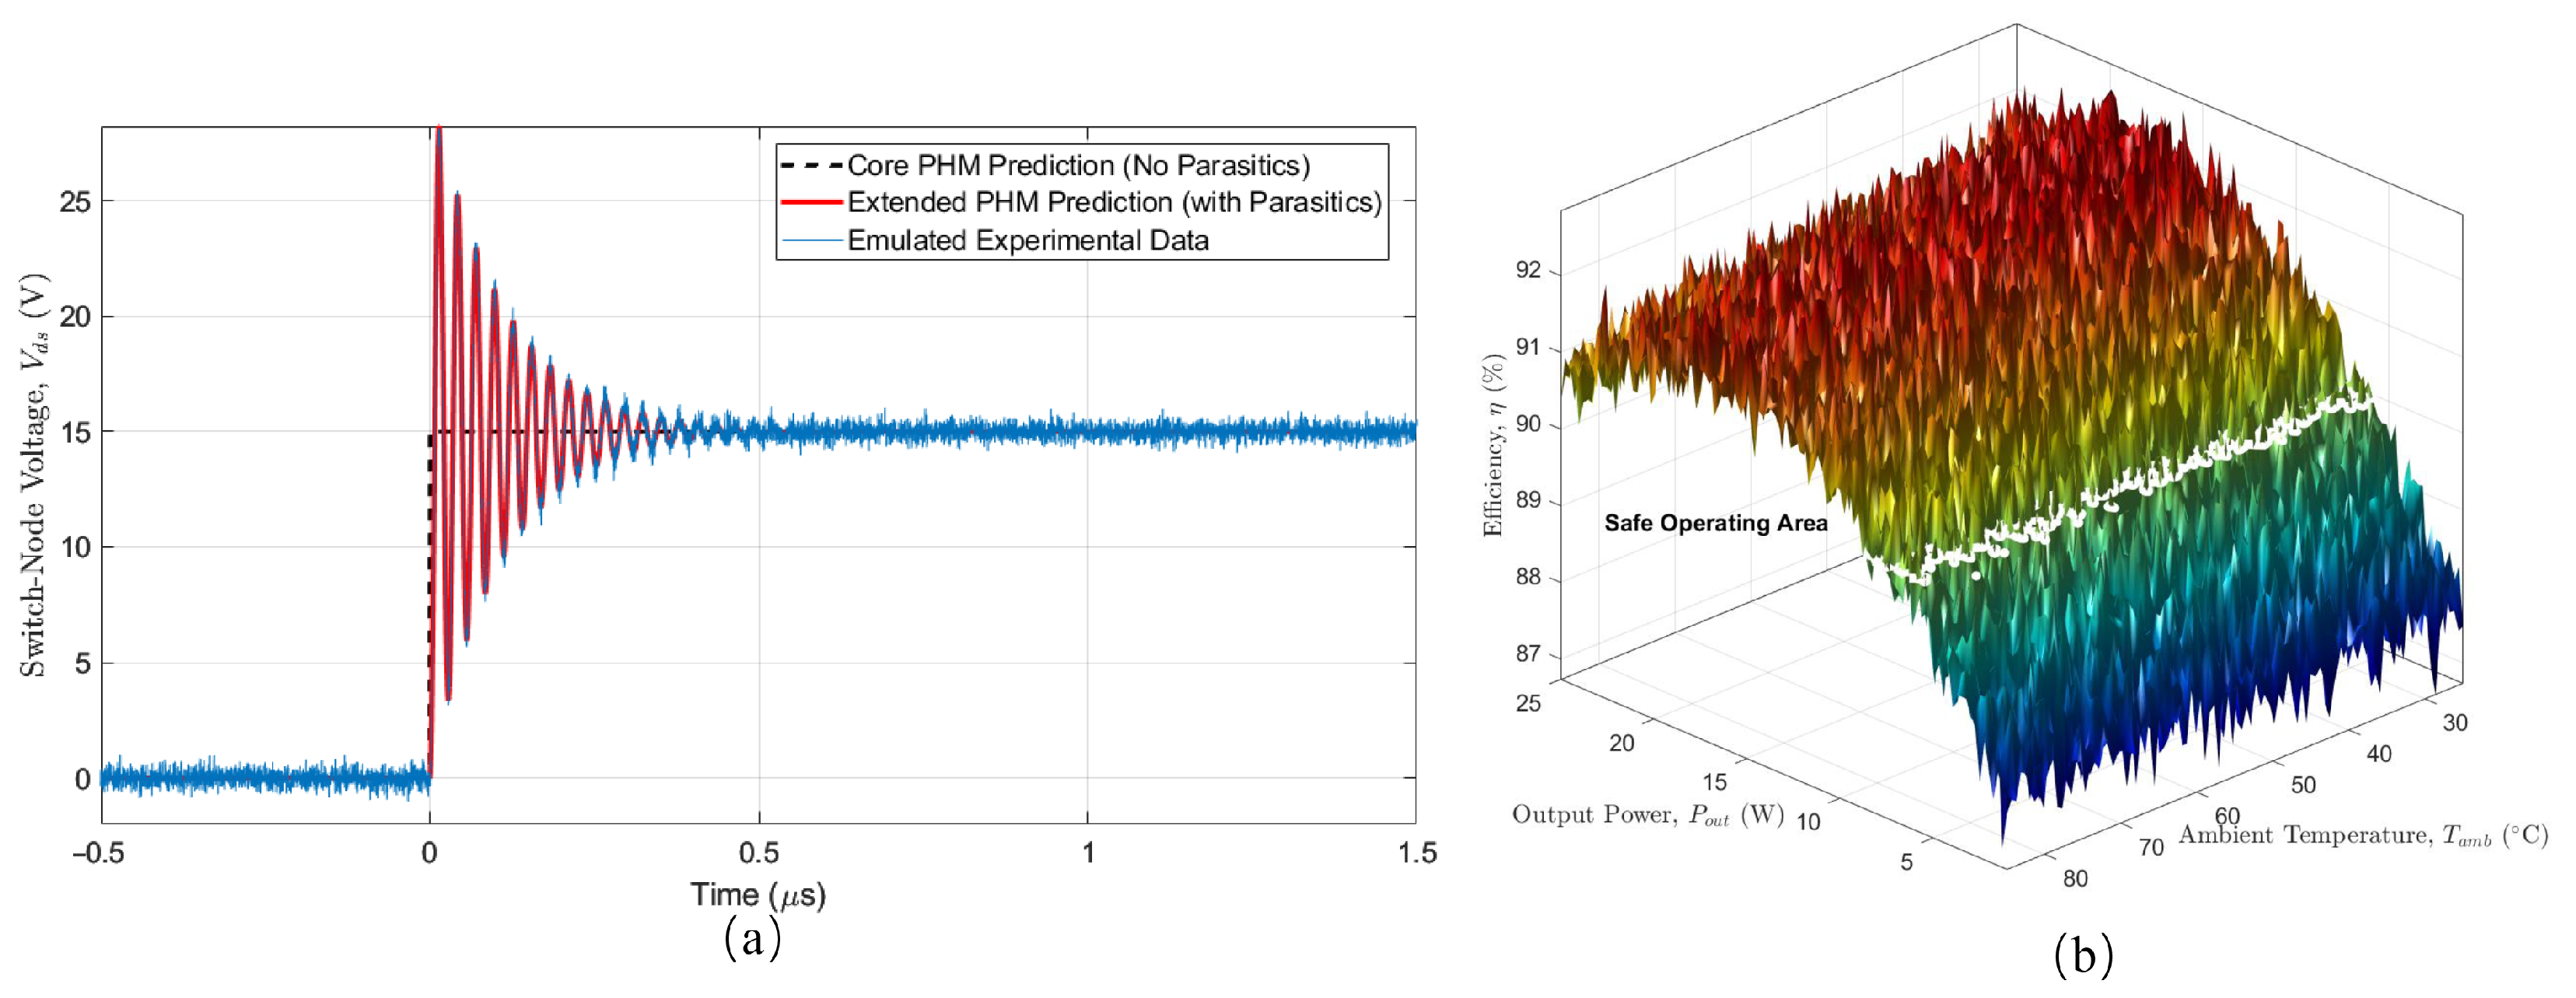
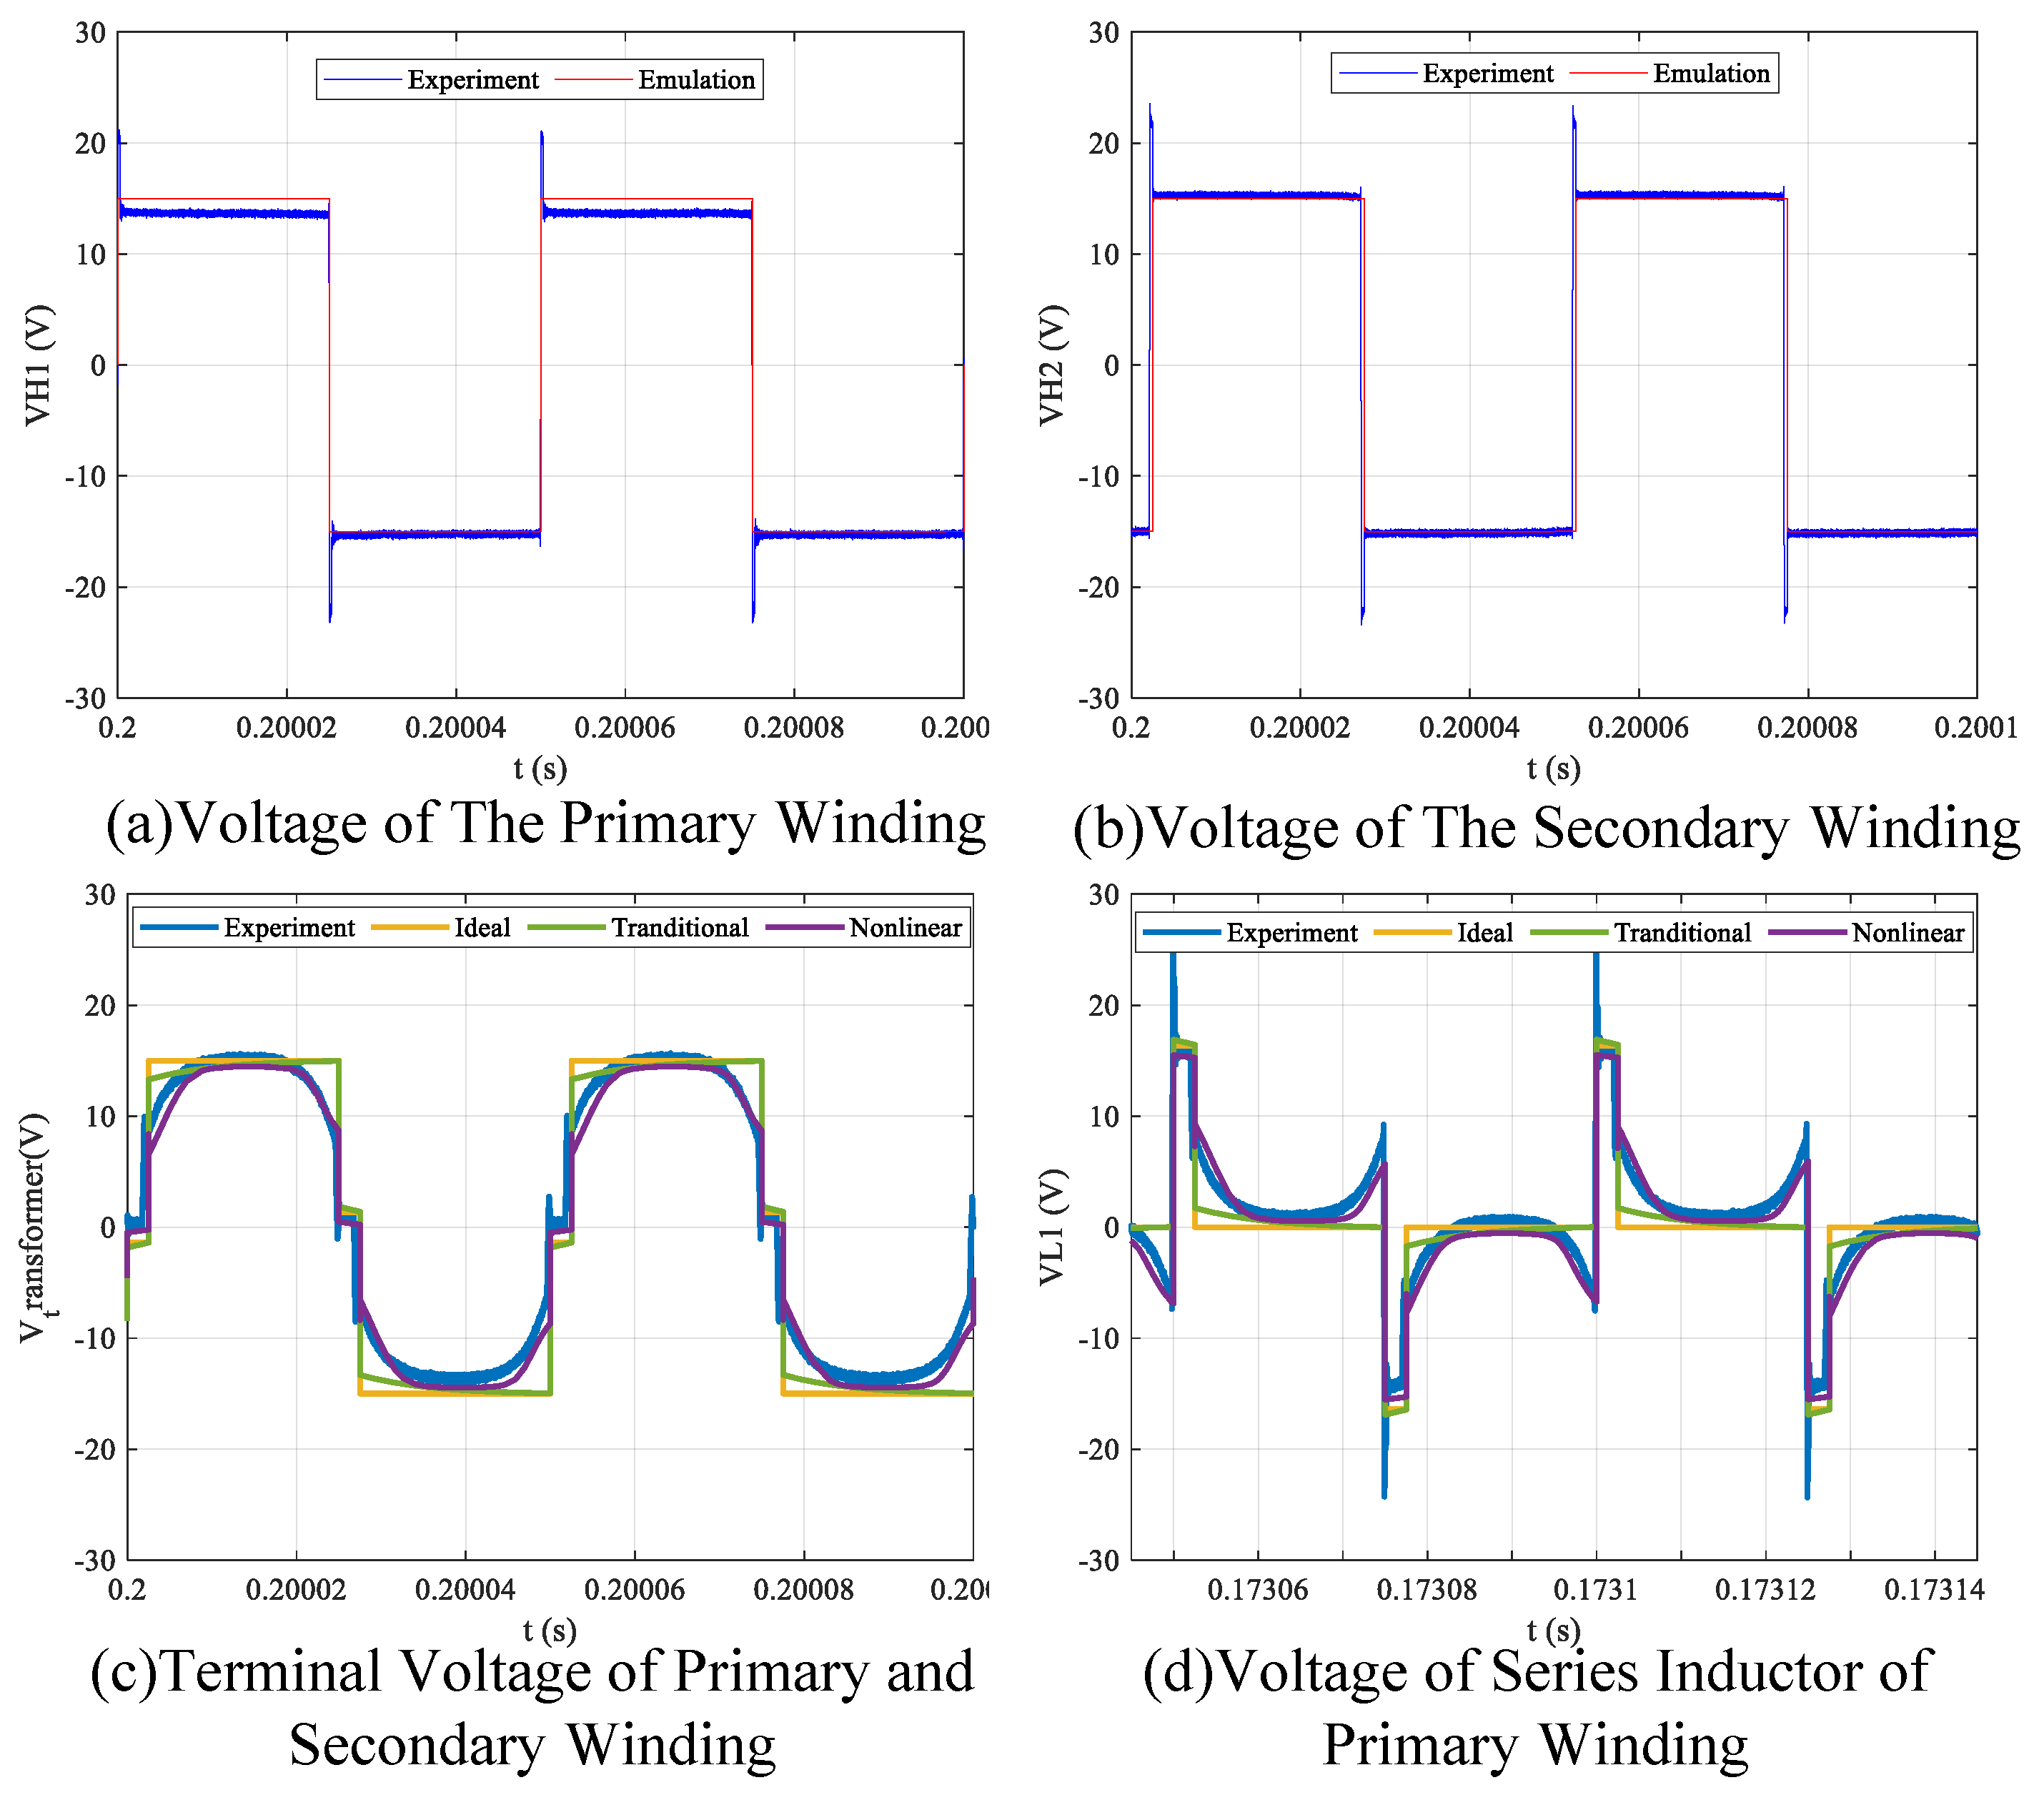
Figure 2 illustrates the proposed PHM of the DAB converter, which couples its electrical, magnetic, and thermal dynamics. The framework decomposes the system into three interconnected physical domains, each defined by its respective Hamiltonian and energy-based state variables. The multi-physics interactions at the core of the model are captured through structured energy-conserving and dissipative pathways. The electrical and magnetic domains are interconnected via a power-conserving gyrator matrix,
, which represents the ideal energy conversion between magnetomotive force and magnetic flux, forming the basis of transformer action. Irreversible energy losses are explicitly modeled as dissipative pathways governed by
R. Electrical energy is dissipated as
, while magnetic energy is dissipated as
. These loss powers converge to generate entropy, represented by
flow, which serves as the input to the thermal domain
. The thermal energy is defined by entropy
, which is ultimately dissipated to the ambient environment through the thermal resistance
. The core temperature
directly influences the parameters of both the magnetic and electrical domains.
3.1. Derivation of the Thermo-Magnetically Coupled Permeability
The magnetic permeability of ferromagnetic materials is inherently nonlinear with respect to the applied magnetic field strength due to saturation and simultaneously exhibits strong temperature dependence, particularly as the material approaches its Curie temperature. Consequently, to maintain thermodynamic consistency within an energy-based framework and to enable dynamic simulation under thermal drift, the permeability must be modeled as a smooth, continuously differentiable function of both magnetic field and temperature.
The saturation flux density
, a key descriptor of the material’s nonlinear behavior, diminishes monotonically with temperature and asymptotically approaches zero as the core temperature approaches the Curie point
:
where
is the reference saturation flux at ambient temperature. In the low-field regime, the material responds linearly with an initial permeability
, where
is interpolated from manufacturer data using a smooth polynomial fit to ensure differentiability, typically expressed as
The initial permeability defines the slope of the
curve at infinitesimal fields and captures the material’s softening under thermal excitation. The temperature derivative
holds across the operational range for most soft magnetic materials, ensuring that the magnetic energy function is thermodynamically consistent. To account for saturation effects, the flux density as a function of magnetic field strength and temperature is modeled using an arctangent function:
Differentiating (
7) with respect to
H yields the instantaneous, or differential, permeability:
To integrate this material-level nonlinearity into the circuit-level model of the DAB transformer, the magnetic field strength is mapped to the magnetizing current
. The corresponding dynamic magnetizing inductance is then given by
Equation (
9) reveals that the inductance softens as the core saturates under high excitation and as it heats toward
. The quadratic term in the denominator ensures a smooth degradation of inductance, a mathematically robust feature that prevents numerical instability and guarantees physical consistency in the presence of thermal demagnetization. To complete the constitutive characterization, the stored magnetic co-energy is derived by integrating the
function with respect to
H, yielding the temperature- and field-dependent energy density:
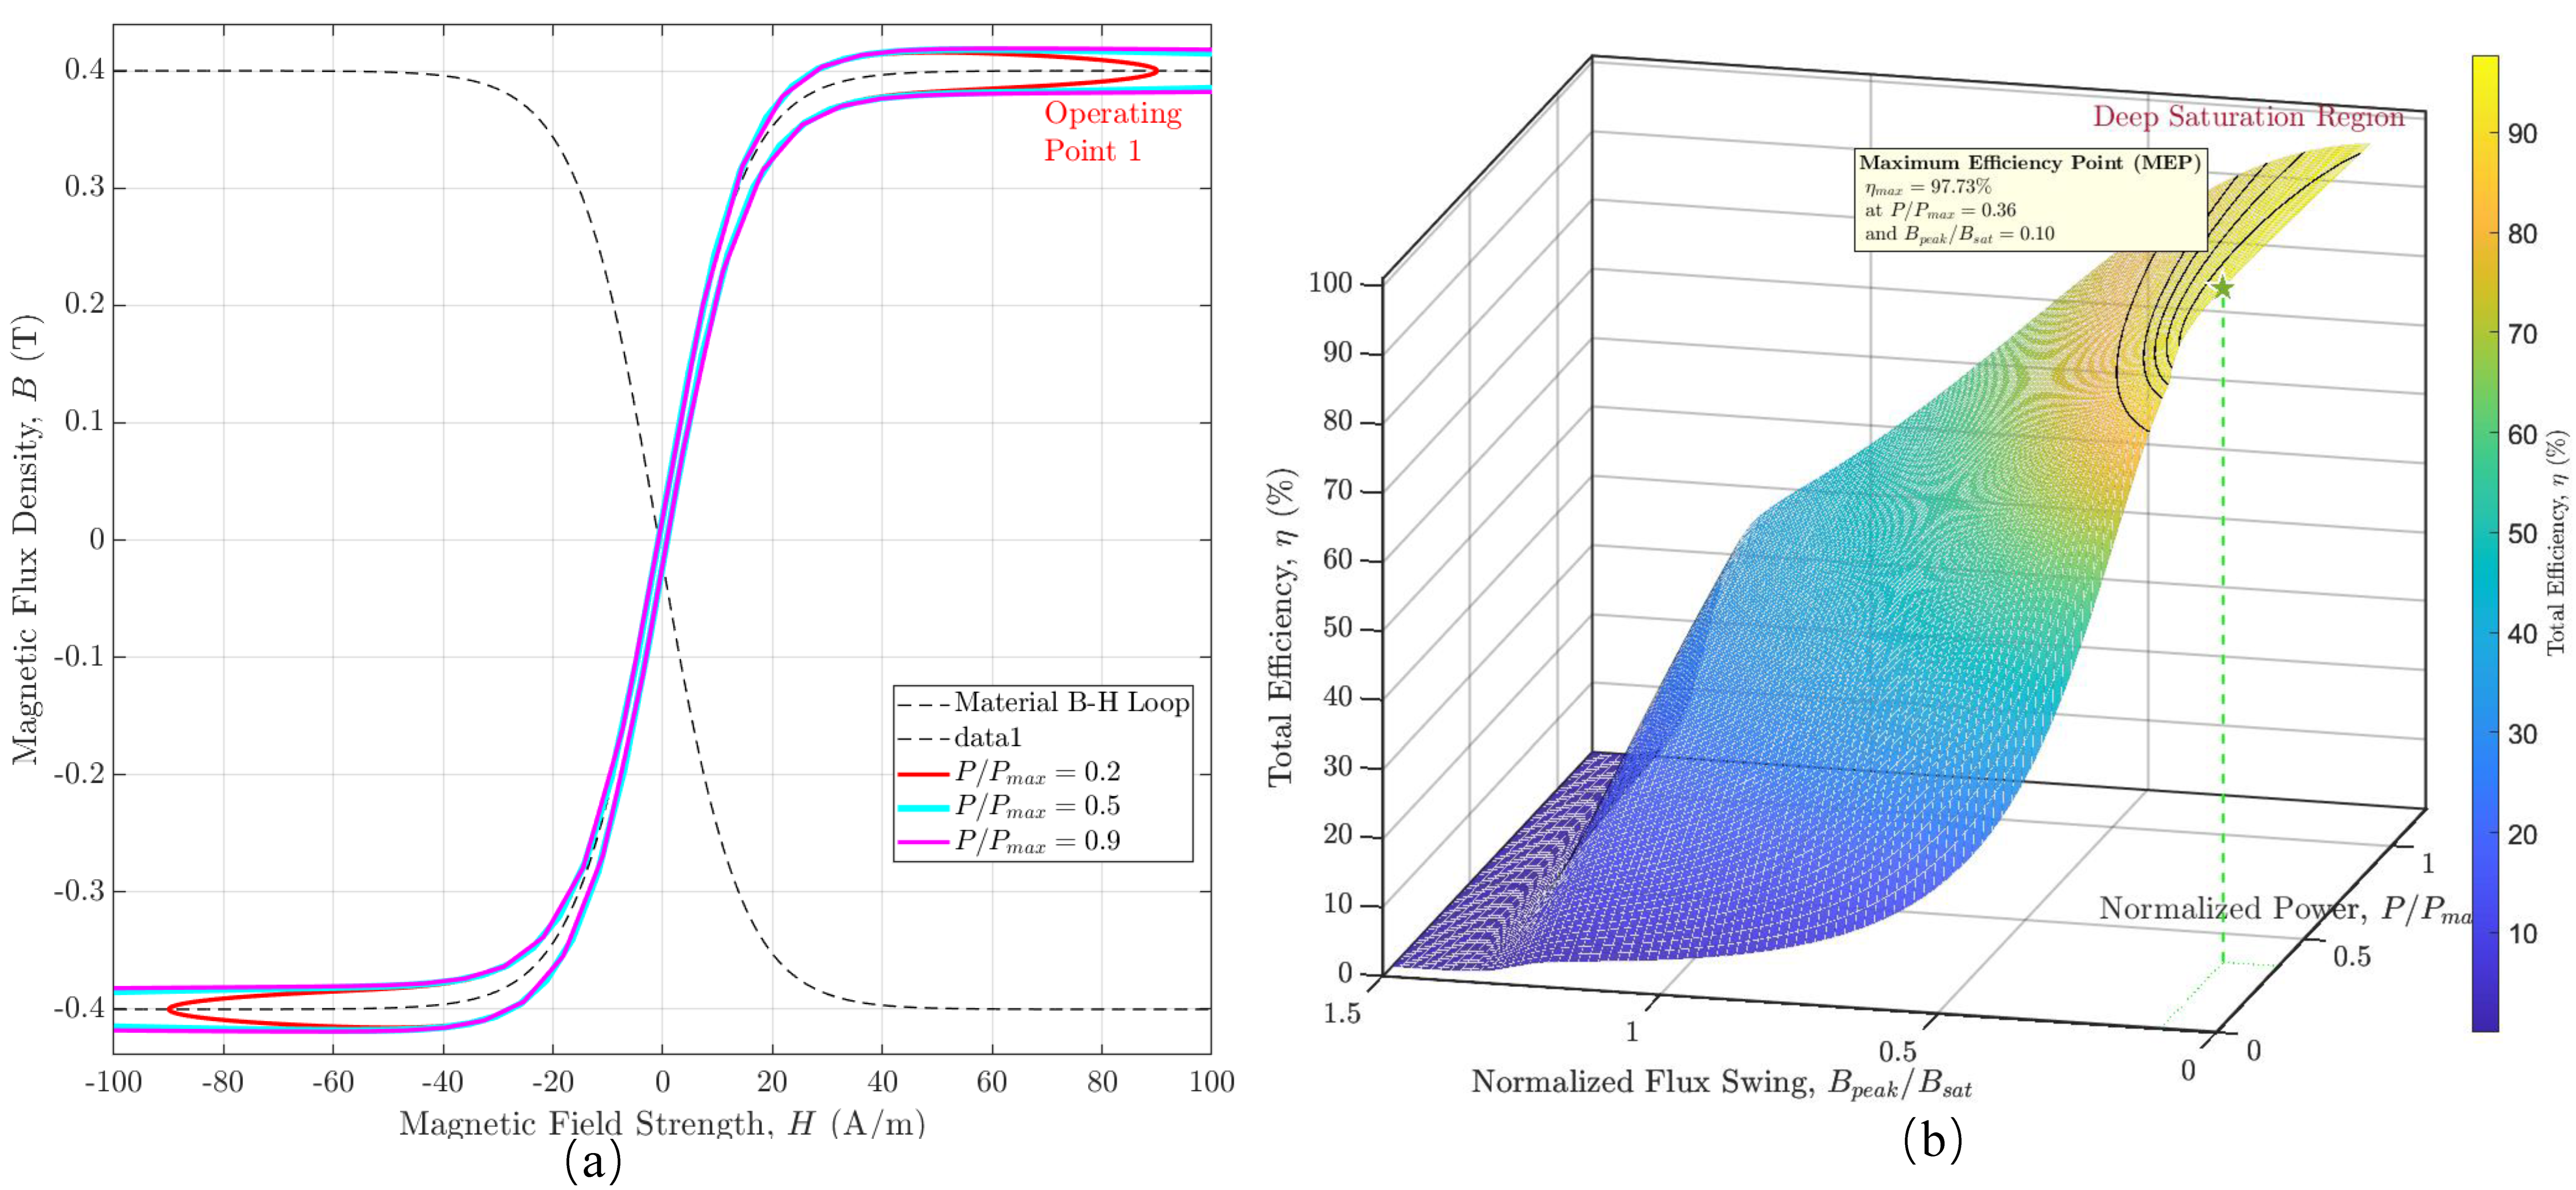
Figure 3 presents a compelling visualization of the operational dichotomy governed by the nonlinear physics of the magnetic core. In
Figure 3a, each colored trajectory represents the magnetic core’s state evolution over a single switching cycle at a specific power level. At low power (
), the operational loop is small and confined to the linear region of the B-H curve, indicating minimal core losses and low magnetizing currents. As the power demand increases (
), the trajectory is forced to expand, encompassing a significantly larger area. The geometric expansion is a direct visual analog to increased hysteretic and eddy-current losses. Critically, at high power levels, the loop’s apices extend into the knee of the B-H curve, signaling the onset of magnetic saturation. This visualization transforms the abstract concept of power transfer into a tangible magnetic stress test, where the area enclosed by the operational loop serves as a direct proxy for the per-cycle energy dissipated within the core.
Figure 3b shows the systemic level by charting the converter’s total efficiency
as a function of both normalized power throughput and the normalized magnetic flux swing, which serves as a direct indicator of core saturation. In the region of low-to-moderate flux swing, the efficiency surface forms a gentle plateau, peaking at a maximum efficiency point where conduction and core losses are optimally balanced. However, as the operating point is pushed beyond this region, forcing the flux swing toward and beyond saturation, the efficiency plummets precipitously. The cliff is a manifestation of catastrophic loss escalation, where deep saturation causes the magnetizing inductance to collapse, leading to large spikes in magnetizing current. The overlaid iso-efficiency contours serve as design guides, defining the safe operating area for high-efficiency performance. The model provides an intuitive tool for co-designing the DAB’s control strategy and magnetic components, enabling engineers to maximize power density by operating near the performance peak without falling off the efficiency cliff into the abyss of thermal runaway.
3.2. The Coupled Electrical Subsystem with an RL Load
To model a realistic application, such as a downstream converter or motor drive, an RL load is considered at the output. This introduces a new energy storage element, the load inductor , which fundamentally alters the system’s dynamics. The PHM accommodates this change through a systematic augmentation of the electrical subsystem model.
The original energy coordinates are augmented with a new state variable, the flux linkage of the load inductor,
. The augmented electrical state vector is thus defined as
. Consequently, the electrical subsystem Hamiltonian must be expanded to include the energy stored in this new element:
The gradient of this augmented Hamiltonian, , yields the co-energy variables, which now include the load current, . The dynamics of this new state, governed by Kirchhoff’s voltage law for the load circuit, (), are integrated into the system’s structural matrices.
The switching functions are defined as
and
. Then the interconnection matrix must be expanded to a 5 × 5 dimension to capture the power-conserving energy transfer from the output capacitor (
) to the load inductor. The augmented skew-symmetric interconnection matrix,
, is given by
The dissipation matrix,
, is also augmented to model the irreversible energy losses, which now include the load resistance,
. The original resistive load term (
) is removed, as the load’s dissipative and energy-storing aspects are now modeled explicitly.
Note that the magnetizing branch is assumed to be lossless within this electrical subsystem; its associated core losses are accounted for as a dissipative output from the magnetic domain. This augmented formulation provides a physically robust and structurally insightful foundation for analyzing the converter’s interaction with dynamic, realistic loads.
The external power supplied by the input DC source is represented by the input port . For an ideal voltage source providing a current , this port vector is defined as in the augmented 5 × 5 system. The resulting model, now structurally incorporating the RL load dynamics, is fully coupled with the nonlinear, thermo-sensitive magnetic characteristics, providing a physically robust foundation for advanced stability and control co-design.
The augmented PHM enables a parametric analysis of the converter’s performance under RL load conditions.
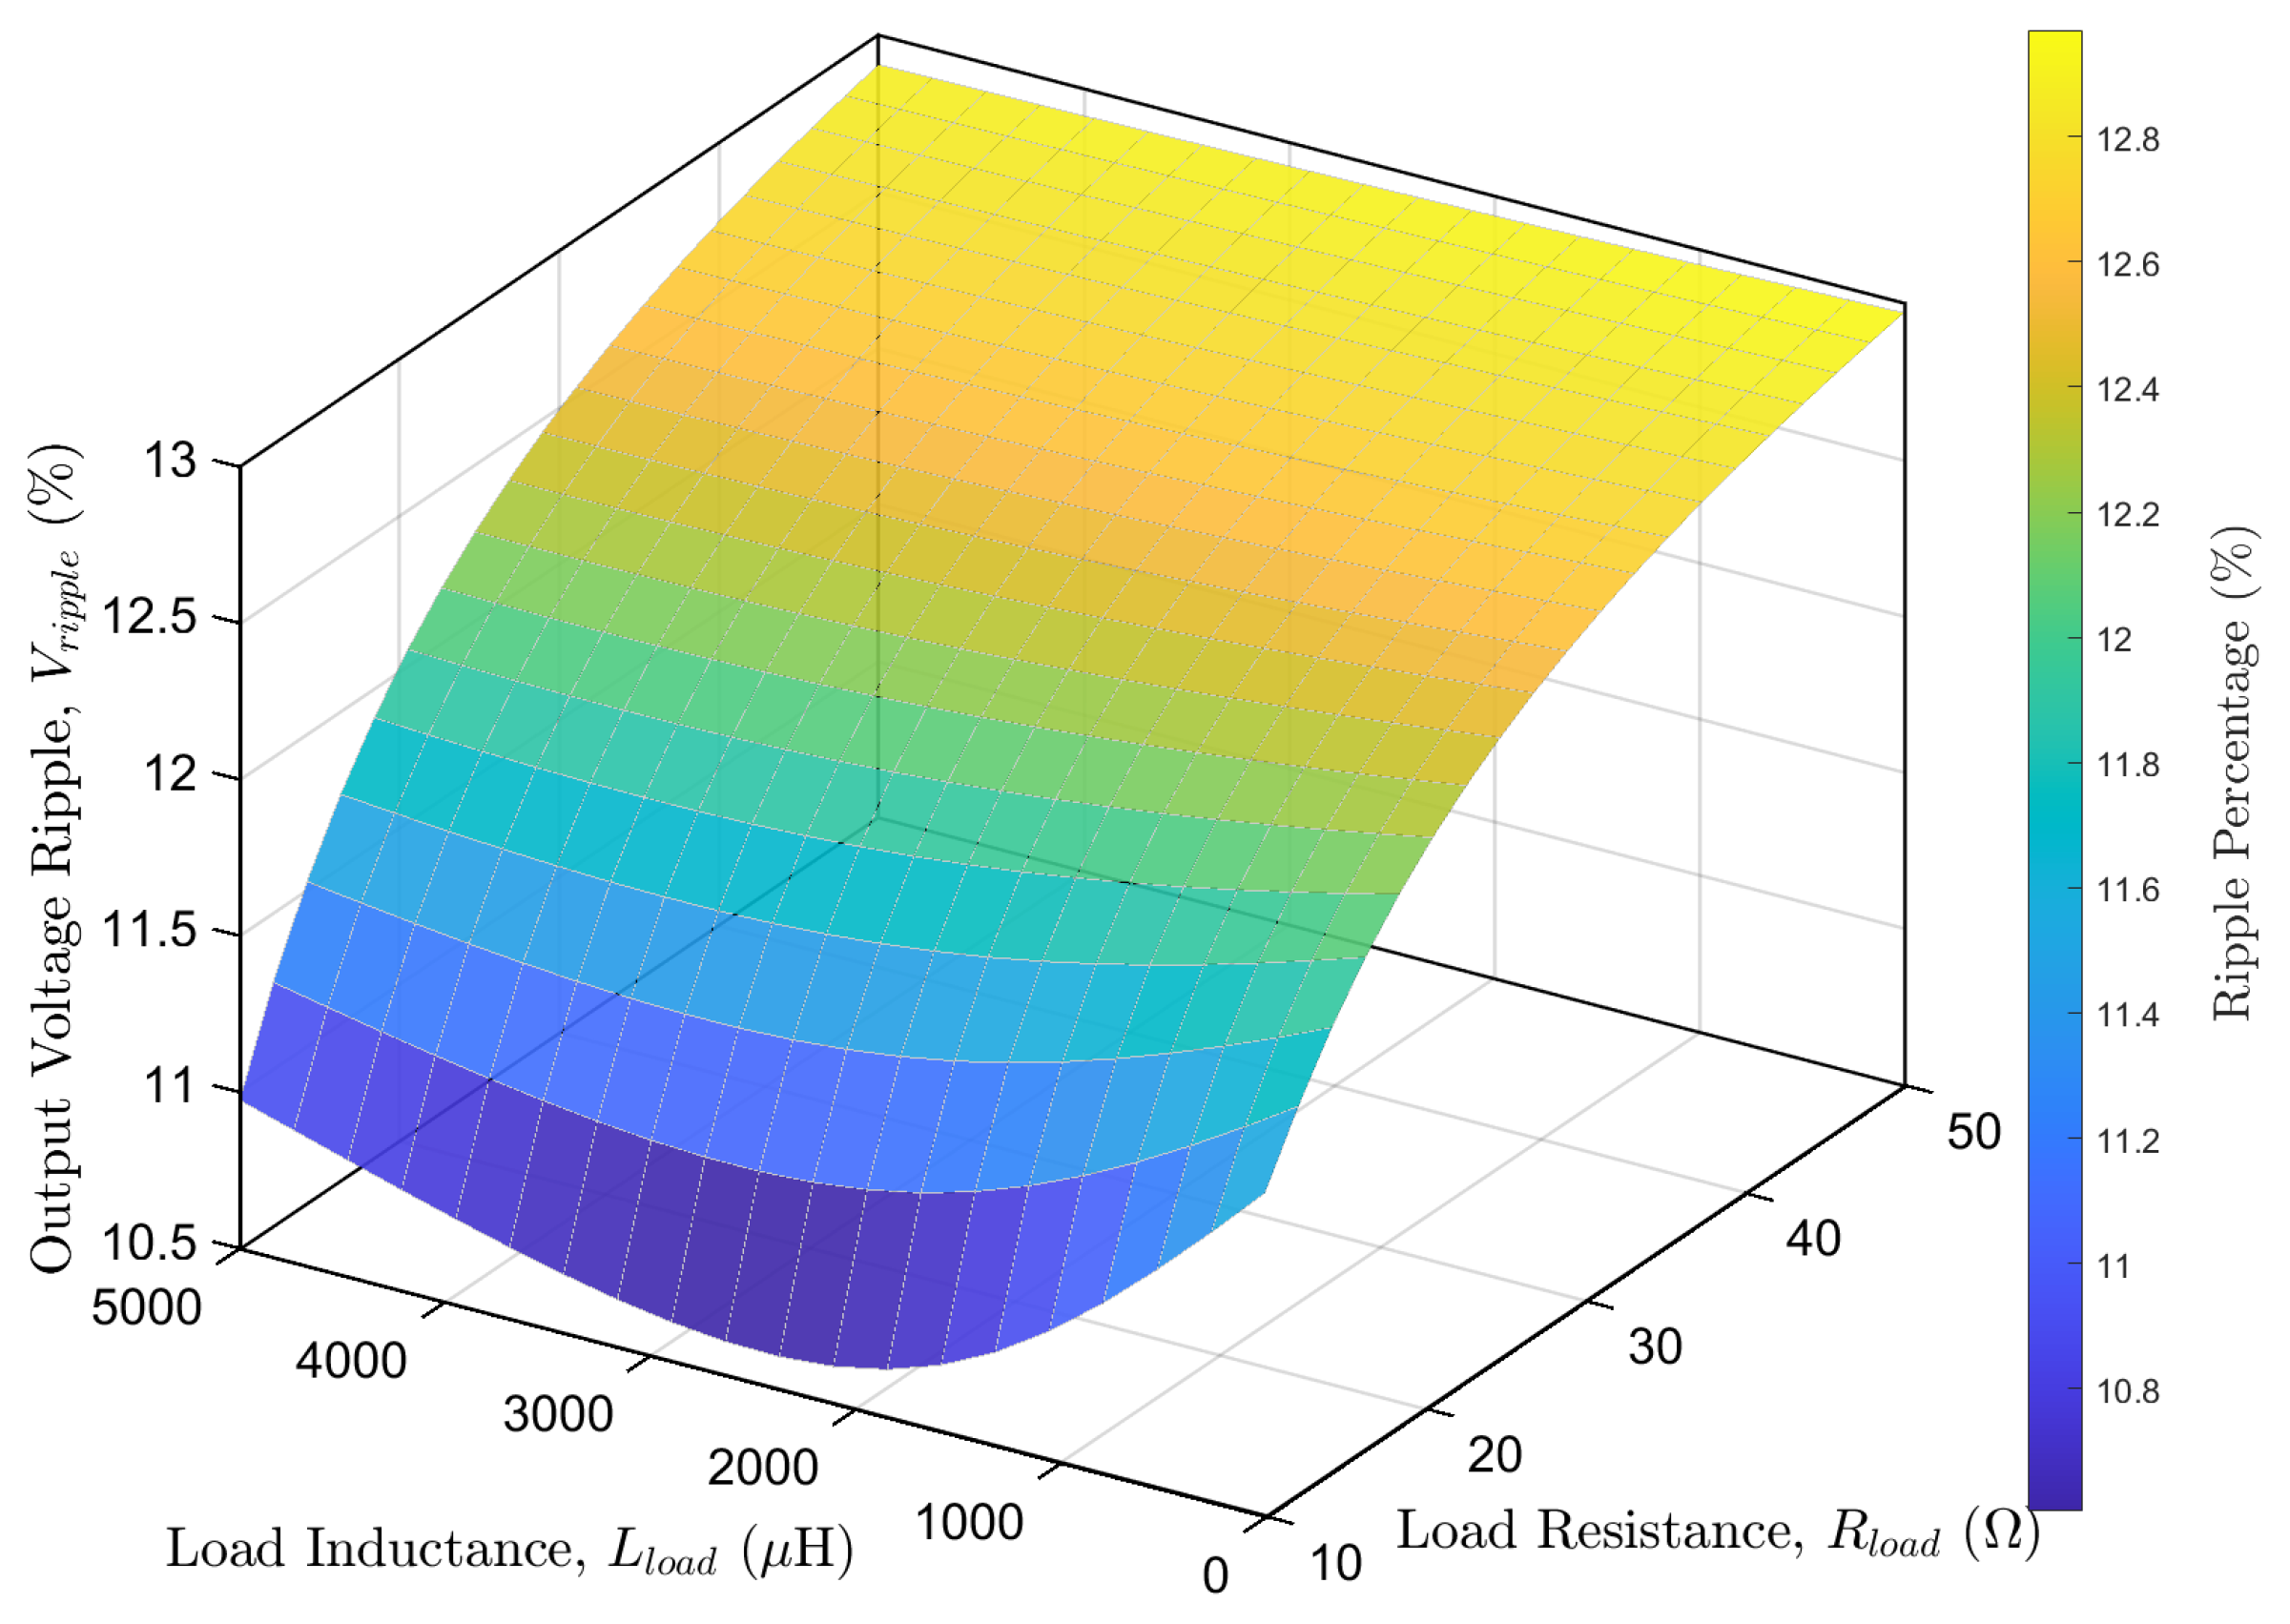
Figure 4 presents a performance manifold derived from the model, which maps a critical key performance indicator, the output voltage ripple (
), as a function of the load’s constitutive parameters, its resistance,
, and its inductance,
. The map provides a tool for the co-design of the converter’s control strategy, allowing for the systematic optimization of the power stage to meet specific application requirements, such as minimizing voltage ripple for sensitive loads, thus ensuring robust performance across the desired operational envelope.
Based on the Eeectrical model,
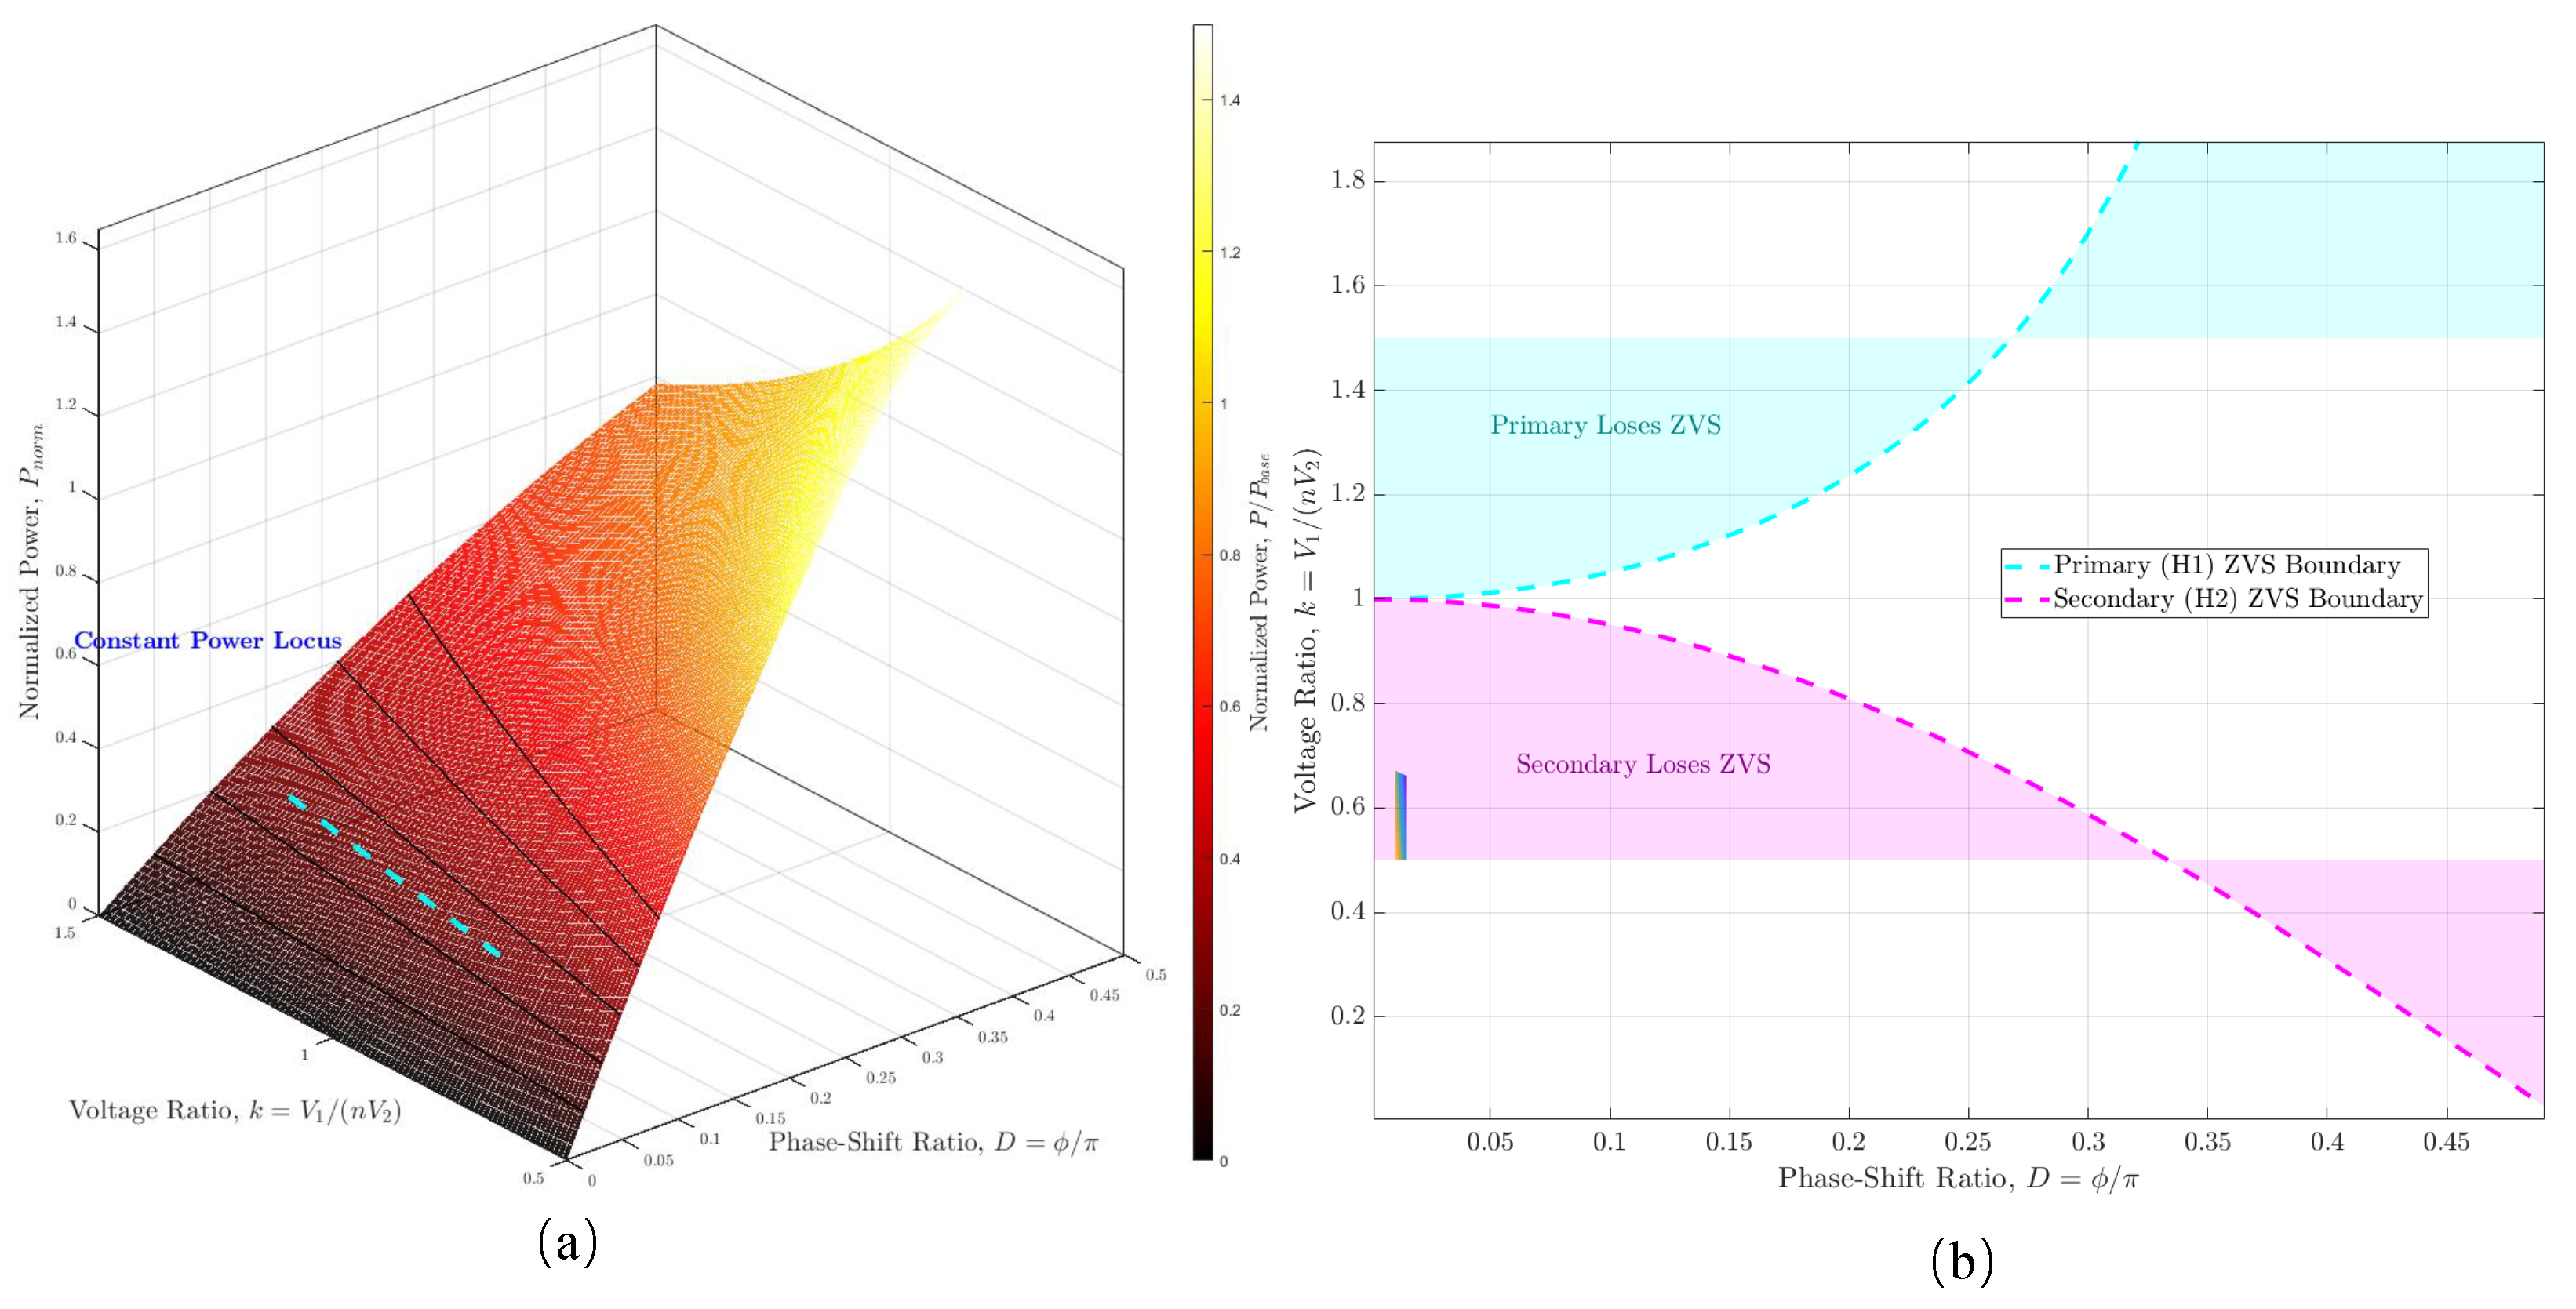
Figure 5a depicts the power manifold, a three-dimensional surface illustrating the normalized power throughput
as a function of D and the voltage conversion ratio k. This geometric representation, derived directly from the system’s PHM, reveals the fundamental control-to-output mapping. The surface’s topology delineates the achievable power for any given operating condition, while overlaid iso-power contours define the control trajectories necessary for regulation. The highlighted constant power locus exemplifies a practical control law, tracing the path the controller must navigate in the
space to maintain a constant output power despite variations in the voltage ratio.
Figure 5b translates this parametric understanding into a practical design map by projecting the performance onto ZVS operational plane. The dashed lines represent the critical boundaries for achieving soft switching, a prerequisite for high-efficiency operation. The cyan boundary delineates the region where the
maintains ZVS, while the magenta boundary does the same for
. The shaded areas thus represent hard-switching regions, where switching losses increase dramatically. The intersection of the two ZVS-enabled regions defines the optimal operating corridor. The figure illustrates the inherent design trade-off: maximizing power throughput, which often requires larger values of
D, can push the operating point across the ZVS boundaries, thereby compromising efficiency.
Therefore, PHM provides a constructive ZVS map (
Figure 5b) and power manifold (
Figure 5a), enabling co-design of
,
D, and
k to stay within the soft-switching envelope while meeting power targets, whereas classical maps require post hoc correction factors under nonlinearity.
3.3. The Unified Coupled PHM Model
The unified model is constructed from three fundamental subsystems, each representing a distinct physical domain with its own energy storage (Hamiltonian), internal structure, and dissipative properties.
The electrical subsystem (): As previously derived, the subsystem describes the energy stored in the electric fields of capacitors and the magnetic fields of leakage inductors. Its state vector is . The Hamiltonian is . Its dynamics are governed by a PHM equation with a state-dependent interconnection matrix representing the switching action, and a dissipation matrix for winding and load losses.
The magnetic subsystem (): The subsystem models the energy dynamics within the magnetic core. The state vector, , encapsulates the internal magnetic states, including the magnetizing flux linkage and any states required for hysteresis modeling. Its dynamics are governed by the Hamiltonian and a dissipation matrix that models core losses.
The thermal Ssubsystem (): The subsystem describes the thermal energy of the core. The natural state variable is the entropy, . The Hamiltonian is simply the core temperature, . Its dynamics are governed by the second law of thermodynamics, describing entropy production from internal losses and entropy transfer to the ambient environment.
The essence of the unified model lies in the formulation of the inter-domain coupling structure. These couplings are not ad hoc but are derived from fundamental physical laws of energy conversion and power balance. The state vector of the unified system is the concatenation of the subsystem states:
Therefore, the dynamics of the full system can be written in a partitioned PHM form:
The electro-magnetic coupling is power-conserving and is modeled by the off-diagonal gyrator block . The magnetizing current, a component of the primary current, generates a magnetomotive force , which acts as the effort variable for the magnetic domain. Conversely, the rate of change of the magnetizing flux, , induces a voltage that acts as a co-energy source upon the electrical domain. This reciprocal relationship, captured by the skew-symmetry , mathematically guarantees that the net power exchanged between the domains is identically zero.
The electro-magneto-thermal coupling is dissipative and represents the irreversible conversion of electromagnetic energy into heat. The power dissipated in the electrical and magnetic subsystems,
, becomes the source of entropy generation for the thermal subsystem:
The resulting entropy production rate,
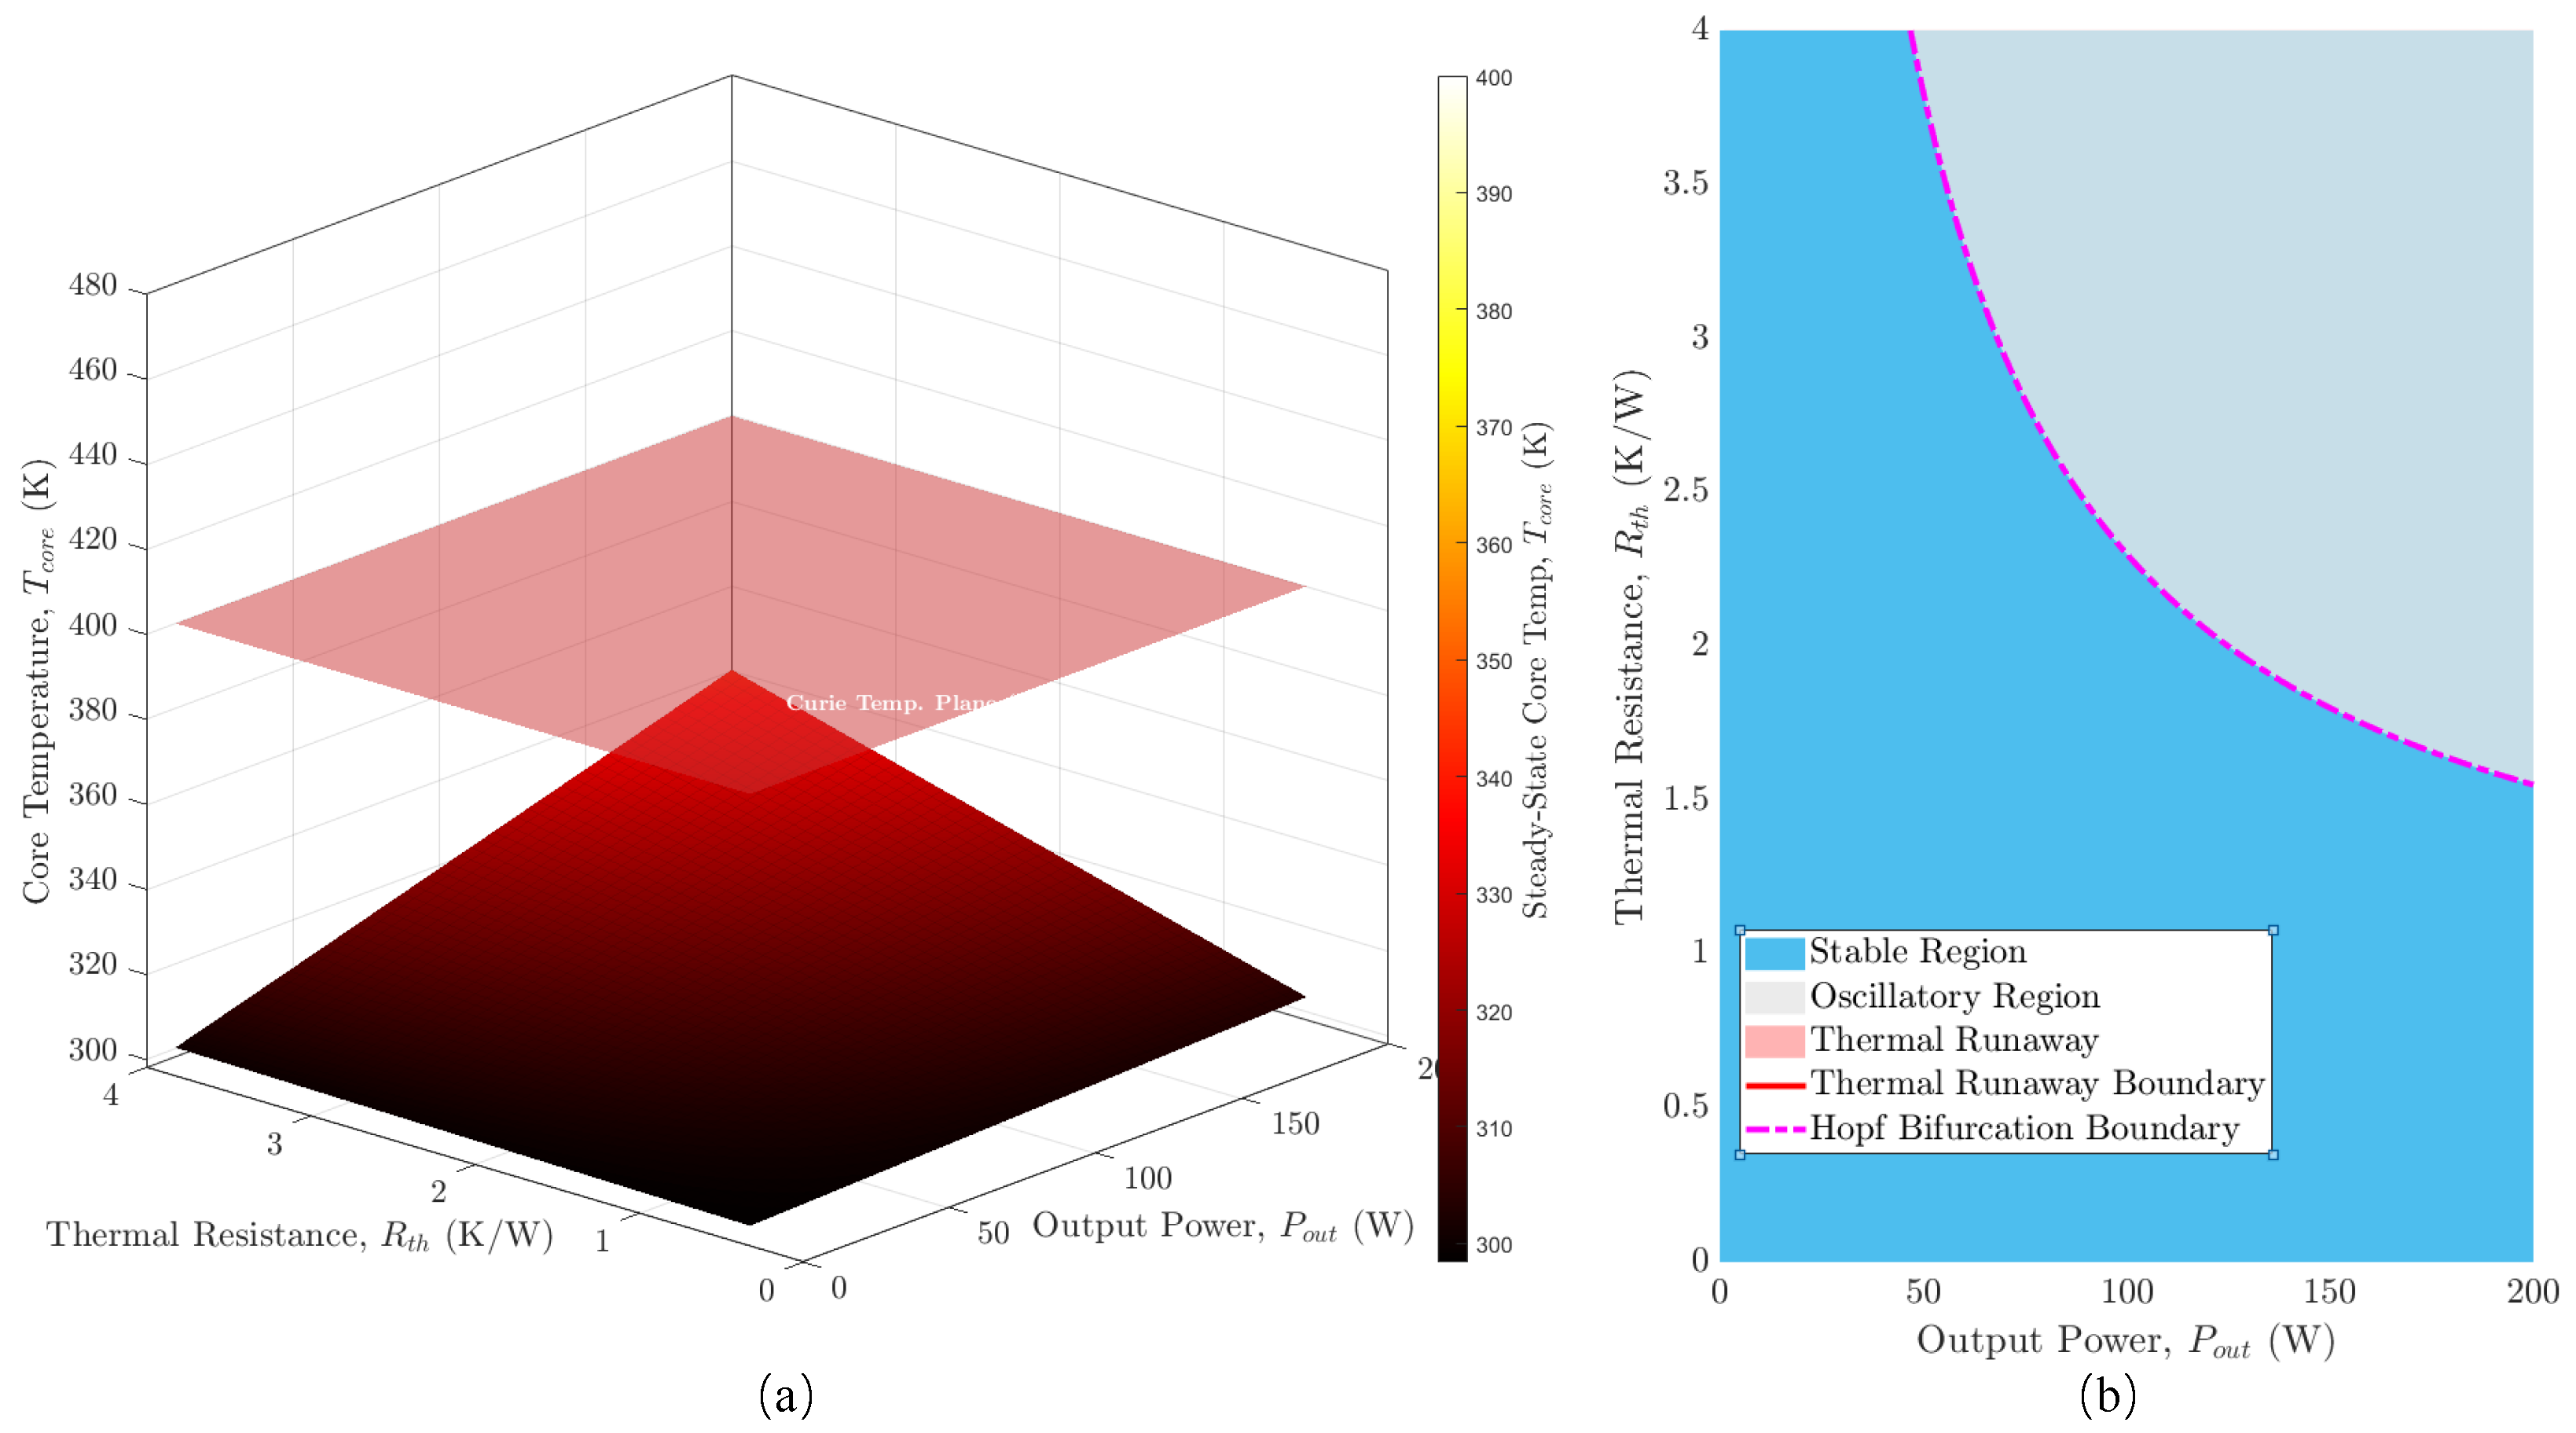
, serves as a state-dependent input to the thermal domain, forming the forward path of the multi-physics feedback loop. The steady-state temperature surface shown in
Figure 6a is the locus of points where this entropy generation is exactly balanced by heat conduction to the ambient environment, i.e.,
.
The thermo-to-electromagnetic coupling constitutes the critical feedback path, where the thermal state modulates the properties of the electrical and magnetic domains. As captured in the formulation of the total Hamiltonian
, parameters within the matrices
and
and within the magnetic Hamiltonian
are all functions of
. The parametric dependence means that the system’s Jacobian matrix, used for stability analysis, will contain non-zero off-diagonal terms,
, which are responsible for the complex stability behavior visualized in the phase map in
Figure 6. The strength of this feedback determines whether the system converges to a stable equilibrium, crosses a Hopf bifurcation boundary into a sustained oscillation, or surpasses a static thermal runaway boundary.
Figure 6a illustrates the thermal equilibrium surface, which defines the steady-state core temperature
as a function of
and
. This manifold represents the locus of points where heat generated from internal losses is precisely balanced by heat dissipation to the ambient environemnt. The superimposed Curie temperature plane represents a critical physical threshold. The intersection of these two surfaces defines the thermal runaway boundary, beyond which no stable thermal equilibrium exists, leading to catastrophic failure of the magnetic component. Therefore, the unified PHM model provides a complete and physically consistent mathematical foundation for the observed macroscopic stability characteristics.
Figure 6b translates this analysis into a comprehensive system stability phase map, classifying the converter’s long-term dynamic behavior across the operational space defined by output power and thermal resistance. The map reveals three distinct regions. The stable region guarantees convergence to a unique, steady operating point. The thermal runaway boundary demarcates the zone of static instability. Most significantly, the analysis reveals a Hopf bifurcation boundary. Crossing this boundary drives the system into an oscillatory region, where it no longer settles to a steady state but instead enters a sustained electro-thermal limit cycle. The map provides a critical design tool, demonstrating that system stability is not merely a static thermal limit but a complex dynamic property and that robust operation requires remaining within a more constrained region than thermal considerations alone would suggest.
Considering classical isolated power stages(PSFB/LLC), PSFB offers simplicity but narrower ZVS range at light load; LLC attains wide soft-switching but is sensitive to tank tolerances. The DAB with PHM-based synthesis provides a geometric design law in
with explicit multi-physics stability limits (
Figure 6). Complexity increases modestly for two bridges with isolation, but the operating corridor is transparent and robust under saturation and temperature variations.
