Article

A Capacity Expansion Model of Hydrogen Energy Storage for Urban-Scale Power Systems: A Case Study in Shanghai

by
Chen Fu
1,
Ruihong Suo
1,
Lan Li
1,
Mingxing Guo
1,
Jiyuan Liu
2,* and
Chuanbo Xu
2,3
1
State Grid Shanghai Economic Research Institute, Shanghai 200235, China
2
School of Economics and Management, North China Electric Power University, Beijing 102206, China
3
Beijing Key Laboratory of New Energy and Low-Carbon Development, Beijing 102206, China
*
Author to whom correspondence should be addressed.
Energies 2025, 18(19), 5183; https://doi.org/10.3390/en18195183
Submission received: 25 July 2025 / Revised: 12 September 2025 / Accepted: 15 September 2025 / Published: 29 September 2025

Abstract

With the increasing maturity of renewable energy technologies and the pressing need to address climate change, urban power systems are striving to integrate a higher proportion of low-carbon renewable energy sources. However, the inherent variability and intermittency of wind and solar power pose significant challenges to the stability and reliability of urban power grids. Existing research has primarily focused on short-term energy storage solutions or small-scale integrated energy systems, which are insufficient to address the long-term, large-scale energy storage needs of urban areas with high renewable energy penetration. This paper proposes a mid-to-long-term capacity expansion model for hydrogen energy storage in urban-scale power systems, using Shanghai as a case study. The model employs mixed-integer linear programming (MILP) to optimize the generation portfolios from the present to 2060 under two scenarios: with and without hydrogen storage. The results demonstrate that by 2060, the installed capacity of hydrogen electrolyzers could reach 21.5 GW, and the installed capacity of hydrogen power generators could reach 27.5 GW, accounting for 30% of the total installed capacity excluding their own. Compared to the base scenario, the electricity–hydrogen collaborative energy supply system increases renewable penetration by 11.6% and utilization by 12.9% while reducing the levelized cost of urban comprehensive electricity (LCOUCE) by 2.514 cents/kWh. These findings highlight the technical feasibility and economic advantages of deploying long-term hydrogen storage in urban grids, providing a scalable solution to enhance the stability and efficiency of high-renewable urban power systems.

1. Introduction

The research on urban power system planning has been increasingly improved [1,2,3,4]. However, with the continuous changes in global climate and the development of renewable energy technology, urban areas are seeking to integrate the highest possible installed scale of low-carbon renewable energy into their power systems. However, wind power, photovoltaic (PV), and other renewable energy power generation have the characteristics of randomness and volatility [5]. The disorderly expansion of renewable energy installations may lead to challenges to the operational stability of urban power supply [6].
Current research on urban energy system operation and management is advancing toward digitalization and intelligence. Operation methodologies are becoming digitally real time, underpinned by cutting-edge tools such as digital twins and intelligent algorithms [7,8,9]. The grid models studied have evolved from simple generation–load planning to integrated energy systems that couple electricity, heat, gas, hydrogen, and transportation [10,11]. In response to the pronounced uncertainties in renewable generation and demand, the research focus has shifted from deterministic optimization to robust and uncertainty-aware optimization across multiple scenarios [12,13]. Control strategies now achieve millisecond-level closed-loop responses through “cloud–edge–end” architectures empowered by reinforcement learning and other advanced techniques [14,15].
The Shanghai urban power system is one of the largest power grids with the highest load density in the world, reaching 6 MW/km2. The annual electricity consumption in Shanghai in 2024 was about 200 TWh, with the highest electricity load reaching 40 GW. From the perspective of energy structure, the installed capacity of renewable energy in Shanghai has increased from almost no growth in the past decade to 5 GW, accounting for 23% of the total installed capacity [16]. However, a large part of the electricity supply still comes from traditional energy generation and external regional power purchase. The proportion of renewable energy installed and the power supply installation structure in Shanghai is shown in Figure 1. The current coal-fired installed capacity is 14.4 GW, accounting for 46%, and the proportion of installed renewable capacity is only 22.3%.
From the perspective of urban energy storage, there is currently no large-scale long-term energy storage technology deployed in the Shanghai power system. In order to realize the low-carbon transformation of urban energy utilization, in the future, the installed capacity of power generation in Shanghai will turn to wind power and PV power generation, and the gradual decommissioning of coal and natural gas power generation will be realized [17].
Research on long-term energy storage has been carried out as early as 2001. Long-term energy storage can stably store and release electric energy for a long period [18]. Usually, the discharge time can reach several hours to several days, even across seasons. Compared with short-term energy storage, long-term energy storage has the characteristics of a long time scale and a large energy storage capacity. Albertus [19] believes that when the penetration rate of renewable energy power generation reaches more than 40%, it needs more than 4 h of long-term energy storage to meet the reliable supply of electricity. Typical long-term energy storage types include hydrogen energy storage [20], pumped storage [21], vanadium flow energy storage [22], and compressed air energy storage [23].
Among the various long-term energy storage methods, hydrogen energy storage has the characteristics of a long discharge time, a large energy storage scale, relatively low cost, and flexible station location. Meanwhile, hydrogen can be stored and transported in various forms, including gas, liquid, ammonia, and methanol. It is not only connected to the grid for peak shaving but also directly supplied to transportation and the chemical industry. In contrast, pumped storage is limited by storage capacity and water source, all vanadium flow is limited by electrolyte volume and cost, and compressed air is restricted by cave resources and efficiency, which have difficulty meeting the energy storage demands of long-term, large-scale, and geographical constraints at the same time. So, hydrogen is an ideal long-term energy storage method that can be deployed on a large scale.
Today, leading global urban areas such as Hamburg, Rotterdam, and Melbourne have launched large-scale hydrogen storage initiatives at the metropolitan or port scale. Hamburg is investing EUR 1.1 billion to create a public liquid hydrogen refueling hub and leverages local salt cavern storage, positioning itself as Germany’s gateway for renewable hydrogen imports [24]. Rotterdam is constructing Europe’s largest port-based, cross-seasonal storage system—2 GW of electrolysis capacity coupled with 1200 t of above-ground high-pressure tanks and underground salt caverns—while legislating open-access rules that oblige the port authority to provide non-discriminatory use of storage and transport infrastructure [25]. Melbourne uses depleted gas fields and the existing natural gas network to inject 10% renewable hydrogen, delivering 40 MWh of daily peak-shaving capacity and progressively increasing the blending quota through a state-level Renewable Hydrogen Target. Together, these three urban areas demonstrate distinct, scalable pathways for large-scale urban hydrogen storage and utilization [26]. The above cases provide a reference for the deployment and application of hydrogen energy storage in Shanghai.
Currently, the construction of extended hydrogen energy storage planning models extends the traditional capacity-sizing problem to encompass the full hydrogen chain—production, storage, transport, and end-use—within an integrated electricity–heat–gas–transport network. It employs multi-stage, bi-level stochastic mixed-integer programming to co-optimize investment and operation while simultaneously balancing economic, resilience, and environmental objectives, enabling cross-sector, cross-season planning from microgrids to national scales under uncertainty. At present, more and more studies have attempted to deploy hydrogen energy storage in power system planning with a high proportion of renewable energy access [27,28,29,30,31]. Planning for hydrogen-integrated power systems can be categorized into the macroscopic and microscopic levels. Macro-level studies typically focus on the long-term pathway of hydrogen storage capacity and the hydrogen-based generation scale. For example, Laghlimi et al. [27] reviewed the methods of realization and the advantages of hydrogen in energy storage. Bounitsis et al. [28], combined with the strategic planning of the UK’s deep decarbonization coupling power and thermal system, planned the national power system by using hydrogen ammonia energy storage technology. Micro-level planning, by contrast, concentrates on the operational dynamics of integrated energy systems that incorporate hydrogen storage. Wang et al. [29] constructed an optimal configuration model of a double-layer hybrid HTP system considering planning and operation and conducted planning research on integrated energy systems, including wind power generation.
Unlike the above-mentioned power planning at the national level or integrated energy system planning within the scope of the microgrid level, urban power system planning is between the two in terms of power system scale and timespan. Urban power planning not only includes strategic layout and overall planning at the macro-level but also involves specific operation and technical details at the micro-level [32,33,34,35]. In recent urban-scale power system studies aimed at a low-carbon future, researchers still foreground classical planning metrics—installed capacity, demand growth, and cost. However, these yardsticks fail to capture the broader value of urban storage, particularly long-term hydrogen systems, in advancing environmental protection and accelerating the clean energy transition.
Conventional assessments of hydrogen’s value in electrolytic hydrogen synergies have concentrated on its marginal contributions to renewable energy accommodation, grid flexibility, and regional green energy benefits while evaluating the resulting cost reductions and economic gains within integrated energy systems [36,37]. Techno-economic analyses, in turn, have centered on the capital and operating expenditures of hydrogen production, storage, transport, and fuel cell generation [38,39,40,41]. However, these studies seldom incorporate the long-term evolution of an urban area’s generation mix, offering limited insights into how long-term hydrogen storage can accelerate the retirement of legacy plants and spur additional renewable installations at the urban scale.
Based on the above analysis, in the current research, it is common to integrate hydrogen production and hydrogen storage technology into the operation of a comprehensive energy system with new energy as the main generator of energy supply. However, the power generation and load scale of its operation and planning is basically limited from the 100 kW level to the 100 MW level, which is equivalent to the power load scale of the industrial plant level to the industrial park level [42,43,44]. There is a lack of long-term and more macroscopic capacity allocation planning for hydrogen storage systems at the urban level, which could reach the 10 GW level in future decades. Similarly, the current planning of urban power systems also presently lacks the consideration of long-term hydrogen energy storage as an energy storage technology.
Accordingly, this paper aims to construct an urban hydrogen energy storage capacity expansion model to explore how to integrate large-scale hydrogen energy assets into a high proportion of renewable power in large urban areas like Shanghai. It also aims to evaluate its performance in terms of technical feasibility and economic advantages. To achieve this purpose, this paper proposes a long-term urban power system planning method involving electricity and hydrogen collaborative energy supply. The innovations of this paper are as follows.
(1) A capacity expansion model of hydrogen energy storage at the urban level is constructed, and an hourly simulation of the power system installation scale and sequential operation characteristics is realized. Unlike with conventional micro-scale integrated energy planning, this paper presents the first long-term capacity expansion model for hydrogen storage tailored to a 10 GW urban power grid, covering the entire planning horizon from 2030 to 2060. Unlike previous studies confined to microgrid or industrial park scales (100 kW–100 MW), the proposed model addresses the city-level demand of Shanghai—an annual load of about 100 TWh—thereby filling the gap in macroscopic, multi-decade hydrogen storage planning for megacities (R2#3).
(2) An enhanced metric—LCOUCE—is proposed based on the conventional LCOE framework. Traditional LCOE calculations for power system planning only account for the investment and operating costs of generation assets. Because an urban-scale system must also carry the time-varying capital and investment and operation cost expenditures of long-term hydrogen storage, this paper proposes an improved metric—LCOUCE—that captures these additional costs when assessing the economic impact of new generation and hydrogen equipment on the urban grid.

2. Framework of Electricity–Hydrogen Collaborative Power System

2.1. Urban Power Architecture Under High Proportion of Renewable Energy

Building on the foregoing analysis, this study selects Shanghai—China’s largest metropolis—as a case study to explore how integrating long-term hydrogen storage can expand renewable energy uptake in urban grids while maintaining reliability, targeting carbon neutrality by 2060 [45].
Shanghai aims for economy-wide carbon neutrality by 2060, cutting CO2 by at least 70% below 2005 levels and raising non-fossil energy to >80% [46]. A 2022 policy package mandates coal phase down, offshore wind and hydrogen scale up, green manufacturing, and an international green finance hub. A 2025 regulation establishes dual carbon caps, a city-wide emissions registry, and third-party verification [47].
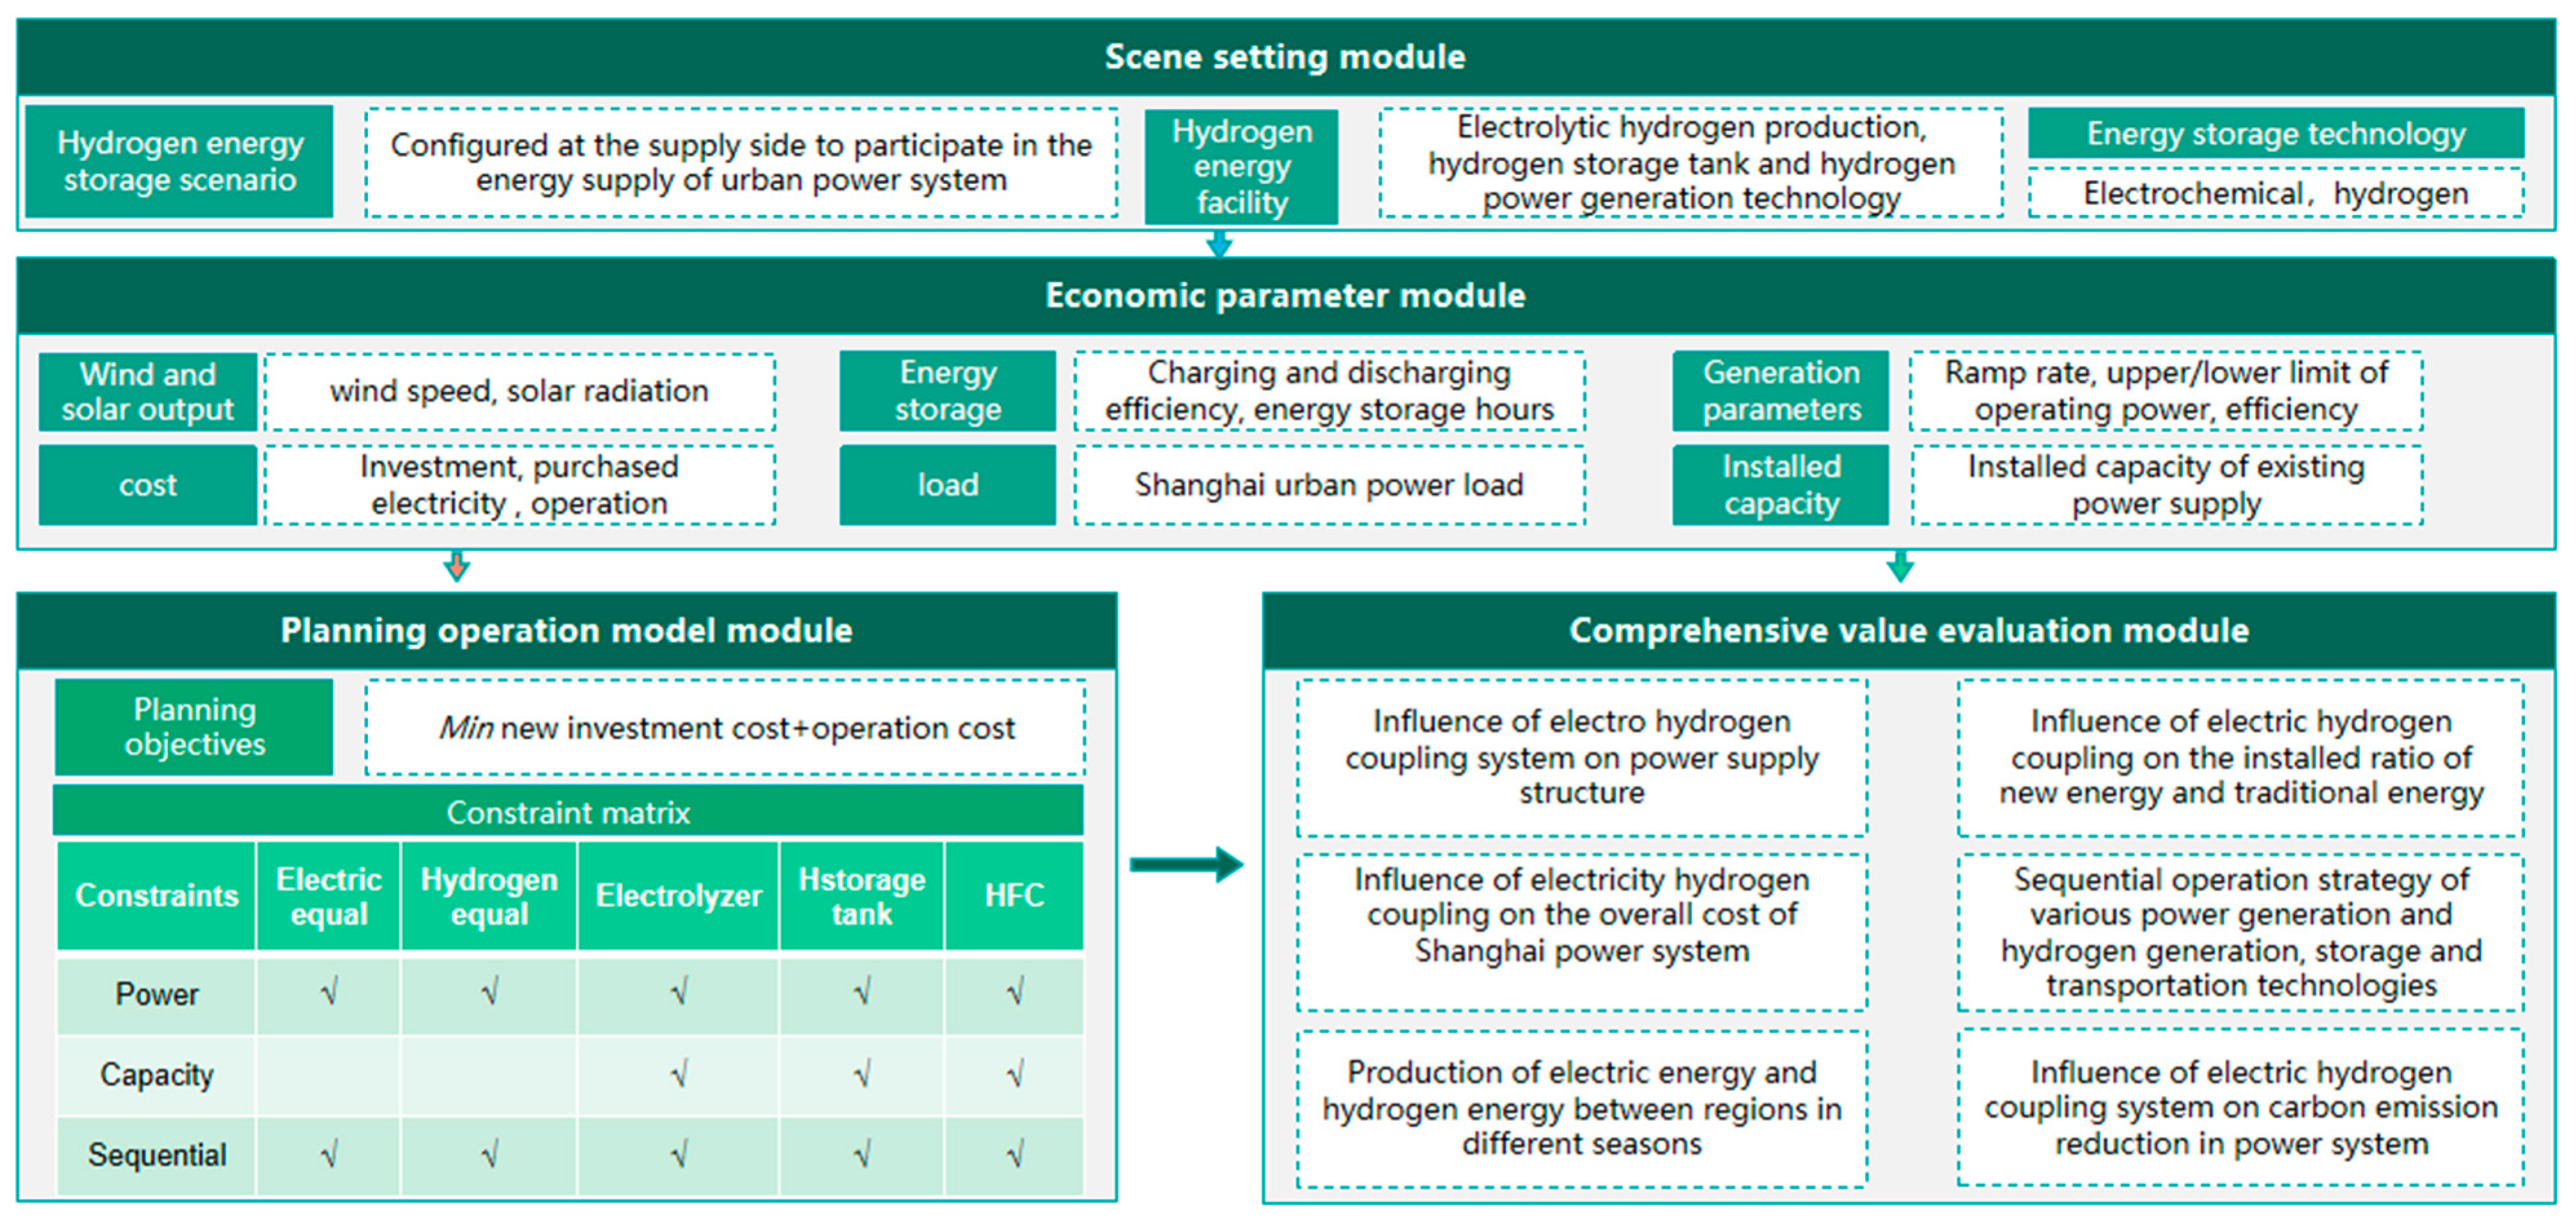
Guided by projected power demand and the anticipated expansion of renewables, this paper designs a capacity mix for Shanghai that embeds long-term hydrogen storage and benchmarks it against a reference scenario lacking such storage. Key performance indicators include installed renewable capacity, share, penetration, accommodation rates of renewable generation, and LCOUCE. The overall framework is depicted in Figure 2. The √ in the figure indicates that the constraint conditions of this part are considered in the model.
In the Shanghai urban power system, there are traditional energy power generation methods, including coal power generation and natural gas power generation; renewable energy power generation methods, including photovoltaic power generation; onshore wind power generation; and offshore wind power generation, as well as small-scale deployment of renewable energy power generation methods and power purchases from the external power grid, with a total of seven power generators. Surplus wind and solar electricity drives electrolyzers to produce hydrogen, which is stored in tanks. When renewable output falls, the stored hydrogen is re-electrified via dedicated generators. This electrolytic hydrogen collaboration system is illustrated in Figure 3.
Compared with existing urban power system models, the system uniquely can operate at a 10 GW urban scale over 30 years; integrates electricity, hydrogen, and energy storage in a single optimization loop; explicitly co-optimizes decarbonization; retains full-year chronological simulation to capture real ramping and self-discharge effects; and delivers year-by-year build-out pathways that translate directly into bankable projects and policy milestones.

2.2. Urban Traditional Energy Generation System

Traditional energy generation includes coal-fired power generation and gas-fired power generation. Coal-fired power generation generates high-temperature and high-pressure steam by burning coal, which drives the turbine to rotate and drives the generator to generate electricity; gas turbine power generation uses the high-temperature and high-pressure gas generated by burning natural gas to directly drive the turbine to rotate and drive the generator to generate electricity. Traditional energy generation is relatively flexible, and its power generation is determined by the input of raw materials into the generator set, as well as its calorific value and efficiency. The traditional energy generation model is shown in Equations (1) and (2)
  P c o a l = q c o a l N c o a l η c o a l
P g a s = q g a s N g a s η g a s
where P is the power of the traditional generator set, kW; q is the calorific value of the fuel, kWh/kg; N is the amount of fuel input into the generator set, kg; and η is the power generation efficiency [48].

2.3. Urban Renewable Energy Generation System

Renewable energy generation includes onshore wind power, offshore wind power, PVs, and other renewable energy generators. Among them, wind power and PVs have relatively poor flexibility and are determined by natural wind and lighting conditions. Urban wind and PV plants tend to exhibit correlated output profiles, both in magnitude and timing. Wind power generation and PV power generation are shown in Equations (3) and (4), respectively.
    P w t = {       0 ,               v ( t ) < v i n   o r     v ( t ) > v o u t P r · v ( t ) v i n v r v i n   ,                     v i n < v ( t ) < v r P r ,                                               v r < v ( t ) v o u t
where P w t is the actual power output of the turbine, kW; v ( t ) is the rated power of the turbine, m/s; P r is the real-time wind speed at the height of the wind turbine hub, kW; v r ,   v i n , and v o u t ,   respectively, represent the rated wind speed, inlet wind speed, and outlet wind speed of the turbine, m/s.
  P p v = d X 3 · 6 d t S η
where P p v is the output power of the PV panel, kW; d X is the intensity of sunlight per unit time, kW/m2; S is the area of the PV array, m2; η is the photoelectric efficiency; and d t is the unit sunshine time [48].
Although urban waste-to-energy, biomass, and geothermal plants can be dispatched flexibly, their individual capacities are modest; therefore, they are aggregated into a single renewable category in this study, assuming no additional biomass or other new energy units are added. Other renewable energy generators are represented by the variable P o t h e r .

2.4. Electric Hydrogen Energy Conversion System

Hydrogen production from electrolytic water is a chemical reaction process in which water molecules generate hydrogen and oxygen under energized conditions. In an electric hydrogen production device, the power from wind power and PV is consumed and converted into hydrogen. The calculation method for the hydrogen production capacity of an electric hydrogen production device is shown in Equation (5):
  H e = t 0.0252 η H P H t
where   H e is the hydrogen production capacity of the electrolyzer, kg; P H is the power consumption of the electrolyzer at time t; and η H is the electricity hydrogen conversion efficiency of the electrolyzer. In theory, 0.0252 kg of hydrogen can be produced from electric energy per kilowatt hour [49].

2.5. Urban Energy Storage Systems Involving Long-Term Hydrogen Storage

The urban energy storage system in which hydrogen storage is involved for a long time in this paper includes two forms, electrochemical energy storage and hydrogen electricity energy conversion, which are implemented through two technical paths: electrochemical energy storage and hydrogen production, hydrogen storage, and hydrogen combustion power generation. The operation model of electrochemical energy storage is shown in Formula (6).
  S O C e l , t = S O C e l , t 1 1 Ω e l + W i n e l φ e l + W o u t e l / φ e l
where S O C e l , t is the state of the battery at time t, kWh. Ω e l is the battery self-loss rate. W i n e l and W o u t e l are the charging power and discharging power of the storage battery, respectively, kW. φ e l is the charging and discharging efficiency of the battery [49].
The operation model of the hydrogen storage tank is shown in Formula (7):
  S O C s h , t = S O C s h , t 1 1 Ω s h + H i n s h φ s h + H o u t s h / φ s h
where S O C s h , t is the charging and discharging state of the hydrogen storage tank at time t, kg. Ω s h is the self-loss rate of the hydrogen storage tank. W i n s h and W o u t s h are the hydrogen charging power and hydrogen discharging power of the hydrogen storage tank, kg. φ s h is the hydrogen charging and discharging efficiency of the hydrogen storage tank [49].
The standard calorific value of 1 kg of hydrogen is about 1.4 × 10⁸ J/kg, which is equivalent to 33.6 kwh of electric energy. The hydrogen-to-electric energy conversion formula based on this is shown in (8):
  W o u t f c = 33.6 H i n f c μ f c  
where H i n f c is the hydrogen charging capacity of the hydrogen fuel cell; W o u t f c is the discharge power of the hydrogen generator, kW; and μ f c is the power generation efficiency of the hydrogen fuel cell.

3. Model, Method, and Materials

3.1. Objective Function of Urban Power System Operation

This paper aims to minimize additional investment and operating costs throughout the life cycle of a high proportion of a renewable energy urban power system involving hydrogen storage. The mixed-integer linear programming (MILP) method is used to configure and optimize the capacity of various power generation and energy storage equipment in the urban power system. The MILP model takes the Shanghai global power grid as the object, integrating 10 years of wind–solar and load data and reducing it to 4 typical weeks, establishing a system covering coal, gas, wind power, photovoltaic, electrochemical energy storage, and hydrogen energy storage. This paper sets the design lifespan of each device to 20 years. The objective function is shown in Equation (9):
  m i n P = C I + C O
where C I represents the additional investment cost of the power supply, and C O represents the operating cost.
The components of the objective function are shown in Equations (10) and (11).
  C I = n C a p n n e w u c
where C a p n e w represents the newly installed capacity of various power generators; u c represents the unit investment and construction cost of various power generators.
  C O = t , n P t , n c n + T = t , n P t , n c n + ( t d t R s e l l C I δ I ) δ T
where T is the taxes and fees; P t , n is the power generation capacity of this type of power generation equipment at time t; c n is the unit price of the power generation cost of this type of power generation equipment; d t is the load of urban electricity at time t; R s e l l is the unit price of electricity sold on the grid; and δ I and δ T are the operating cost coefficient and tax rate, respectively.

3.2. Urban Power System Constraint

From the perspective of constraint types, the constraints on the urban power system model include three types: sequential operation, capacity constraints, and start–stop constraints. For the characteristics of the power system, constraints include supply–demand balance constraints, equipment ramp-up constraints, and capacity expansion constraints. The following text will establish a constraint system for the operation and expansion of urban power systems from different devices.
At each interval, t, total generation plus storage discharge must equal the city load, electrolyzer demand, curtailed energy, and storage charging. The constraint of the urban power balance is shown in Equation (12)
  P c o a l + P g a s + P w t + P p v + P b u y + W o u t e l + W o u t f c = d t + P H + W i n e l + P c u r t
where P b u y represents external power purchase, kW. d t is the urban load in Shanghai, kW. P c u r t is the abandoned power of the power system, kW.
Hydrogen balance requires that the electrolytic cells and hydrogen produced in urban power systems meet the hydrogen consumption requirements of hydrogen fuel cells, as well as the hydrogen flow balance of hydrogen storage tanks. The hydrogen equilibrium constraint is shown in Equation (13):
  H e + H o u t s h = H i n f c + H i n s h
For all power generation equipment in the urban area, its operating power must meet the constraints of the installed capacity, and the power generation cannot exceed the upper limit of this installed capacity. Due to the high start-up and shutdown costs of traditional power generation installations, the power generation of some equipment in the urban power system must not be lower than the lower limit of the installed capacity. The power supply operating capacity constraint is shown in Equation (14):
  C a p n m a x μ n m i n P n C a p n m a x
where P n represents the real-time operating power of this type of power generation equipment, kW; C a p n m a x is the installed capacity of this type of power generation equipment in the urban power system; and μ n m i n is the minimum operating power coefficient of this type of power generation equipment, kW.
For traditional power generation equipment, the rate of change in its generated power needs to meet the power ramp constraint, which includes both upward and downward ramp constraints, as shown in Equation (15):
  C a p n m a x β e n , d o w n P n ( t ) P n ( t 1 ) C a p n m a x β e n , u p
where P n ( t ) is the power generation of the power generation equipment at time t, kW, and β e , d o w n and β e , u p are the limit coefficients for the power down ramp and power up ramp of the power generation equipment, respectively [49].
To avoid the disorderly expansion and retirement of generator assembly capacity during a certain period, this paper sets upper limits for newly installed capacity and retired installed capacity, as shown in Equation (16).
C a p n , y [ ( 1 + σ d e c , n ) ^ ( y 1 y ) 1 ] C a p n , y 1 n e w C a p n , y [ ( 1 + σ i n c , n ) ^ ( y 1 y ) 1 ]
where σ d e c and σ i n c , respectively, represent the retirement rate and growth rate of the installed capacity of this type of power generation equipment during the period of y to y 1 , which are decided by land use constraints in dense urban areas, safety regulations for hydrogen, government planning, and integration with existing infrastructure. C a p n , y 1 n e w represents the newly added installed capacity.
The electrolytic hydrogen production system needs to meet capacity constraints and electrolytic cell power ramp constraints, as shown in Equations (17) to (18).
  0 P H C a p H N
where C a p H N is the rated installed capacity of the electrolytic cell, kW.
C a p H N β h , d o w n P H , t P H , t 1 C a p H N β h , u p
Urban power system energy storage includes two types of energy storage methods: short-term electrochemical energy storage and long-term hydrogen energy storage. Electrochemical energy storage operation constraints are as shown in Equations (19) to (24):
  0 W i n e l B I N E V o n , t M s e t
0 W i n e l S O C e l m a x τ e l
B I N E V o f f , t M s e t W o u t e l 0
S O C e l m a x τ e l W o u t e l 0
0 S O C e l , t S O C e l m a x
B I N E V o n , t + B I N E V o f f , t = 1
where it is specified that the battery cannot be charged and discharged at the same time. We set B I N E V o n , t and B I N E V o f f , t as 0–1 integer variables to mark the current charging and discharging state of the battery. τ e l   is the limiting factor of the electrochemical energy storage operation; M s e t is a large enough constant. S O C e l m a x is the maximum capacity of the battery, kWh.
The operation constraints of the hydrogen storage tank are shown in Equations (25) to (29):
  0 W i n S H B I N S H o n , t M s e t
0 W i n S H S O C S H m a x τ s h
B I N S H o f f , t M s e t W o u t S H 0
S O C S H m a x τ s h W o u t S H 0
0 S O C S H , t S O C S H m a x
where B I N S H o n , t and B I N S H o f f , t are 0–1 integer variables, marking the hydrogen charging and discharging status of the hydrogen storage tank at the current time. τ s h is the power limit for hydrogen energy storage operation. S O C S H m a x is the maximum capacity of the hydrogen storage tank, kg.

3.3. Levelized Cost of Urban Comprehensive Energy

Traditional LCOE calculations for power system planning only account for the investment and operating costs of generation assets. Because an urban-scale system must also carry the time-varying capital and investment and operation cost expenditures of long-term hydrogen storage, this paper proposes an improved metric—LCOUCE.
Compared to the traditional LCOE calculation method, LCOUCE is the first metric that folds the time-varying investment cost and operation cost of long-duration hydrogen storage (electrolyzers, storage tanks, generators, and hydrogen pipelines) into a single ¢/kWh index, thus enabling a like-for-like comparison between generation-only and generation + storage pathways.
  L C O U C E = C I + C O d t
LCOUCE does not include the charging and discharging power of a hydrogen energy storage system, only the final power consumption of urban areas. This study computes the urban electricity cost on a five-year rolling basis from 2030 to 2060.
The optimization runs were performed using MATLAB 2022b in conjunction with the CPLEX 12.0.0 linear programming solver.

3.4. Shanghai’s Urban Wind–Solar Resource Condition

The natural resource endowment of Shanghai’s wind and solar resources has significant regional characteristics and development potential, providing the basic conditions for the construction of future high-proportion renewable energy power systems in terms of natural resources. Shanghai is located at the mouth of the Yangtze River, facing the East China Sea. The coastal areas have abundant wind energy resources and favorable conditions for developing offshore wind power. The annual average sunshine hours of Shanghai can reach 1700–2100 h, and it still has certain value to be developed. The wind data is from the National Meteorological Administration, and the photovoltaic data is from the National Photovoltaic Geographic Information Center.
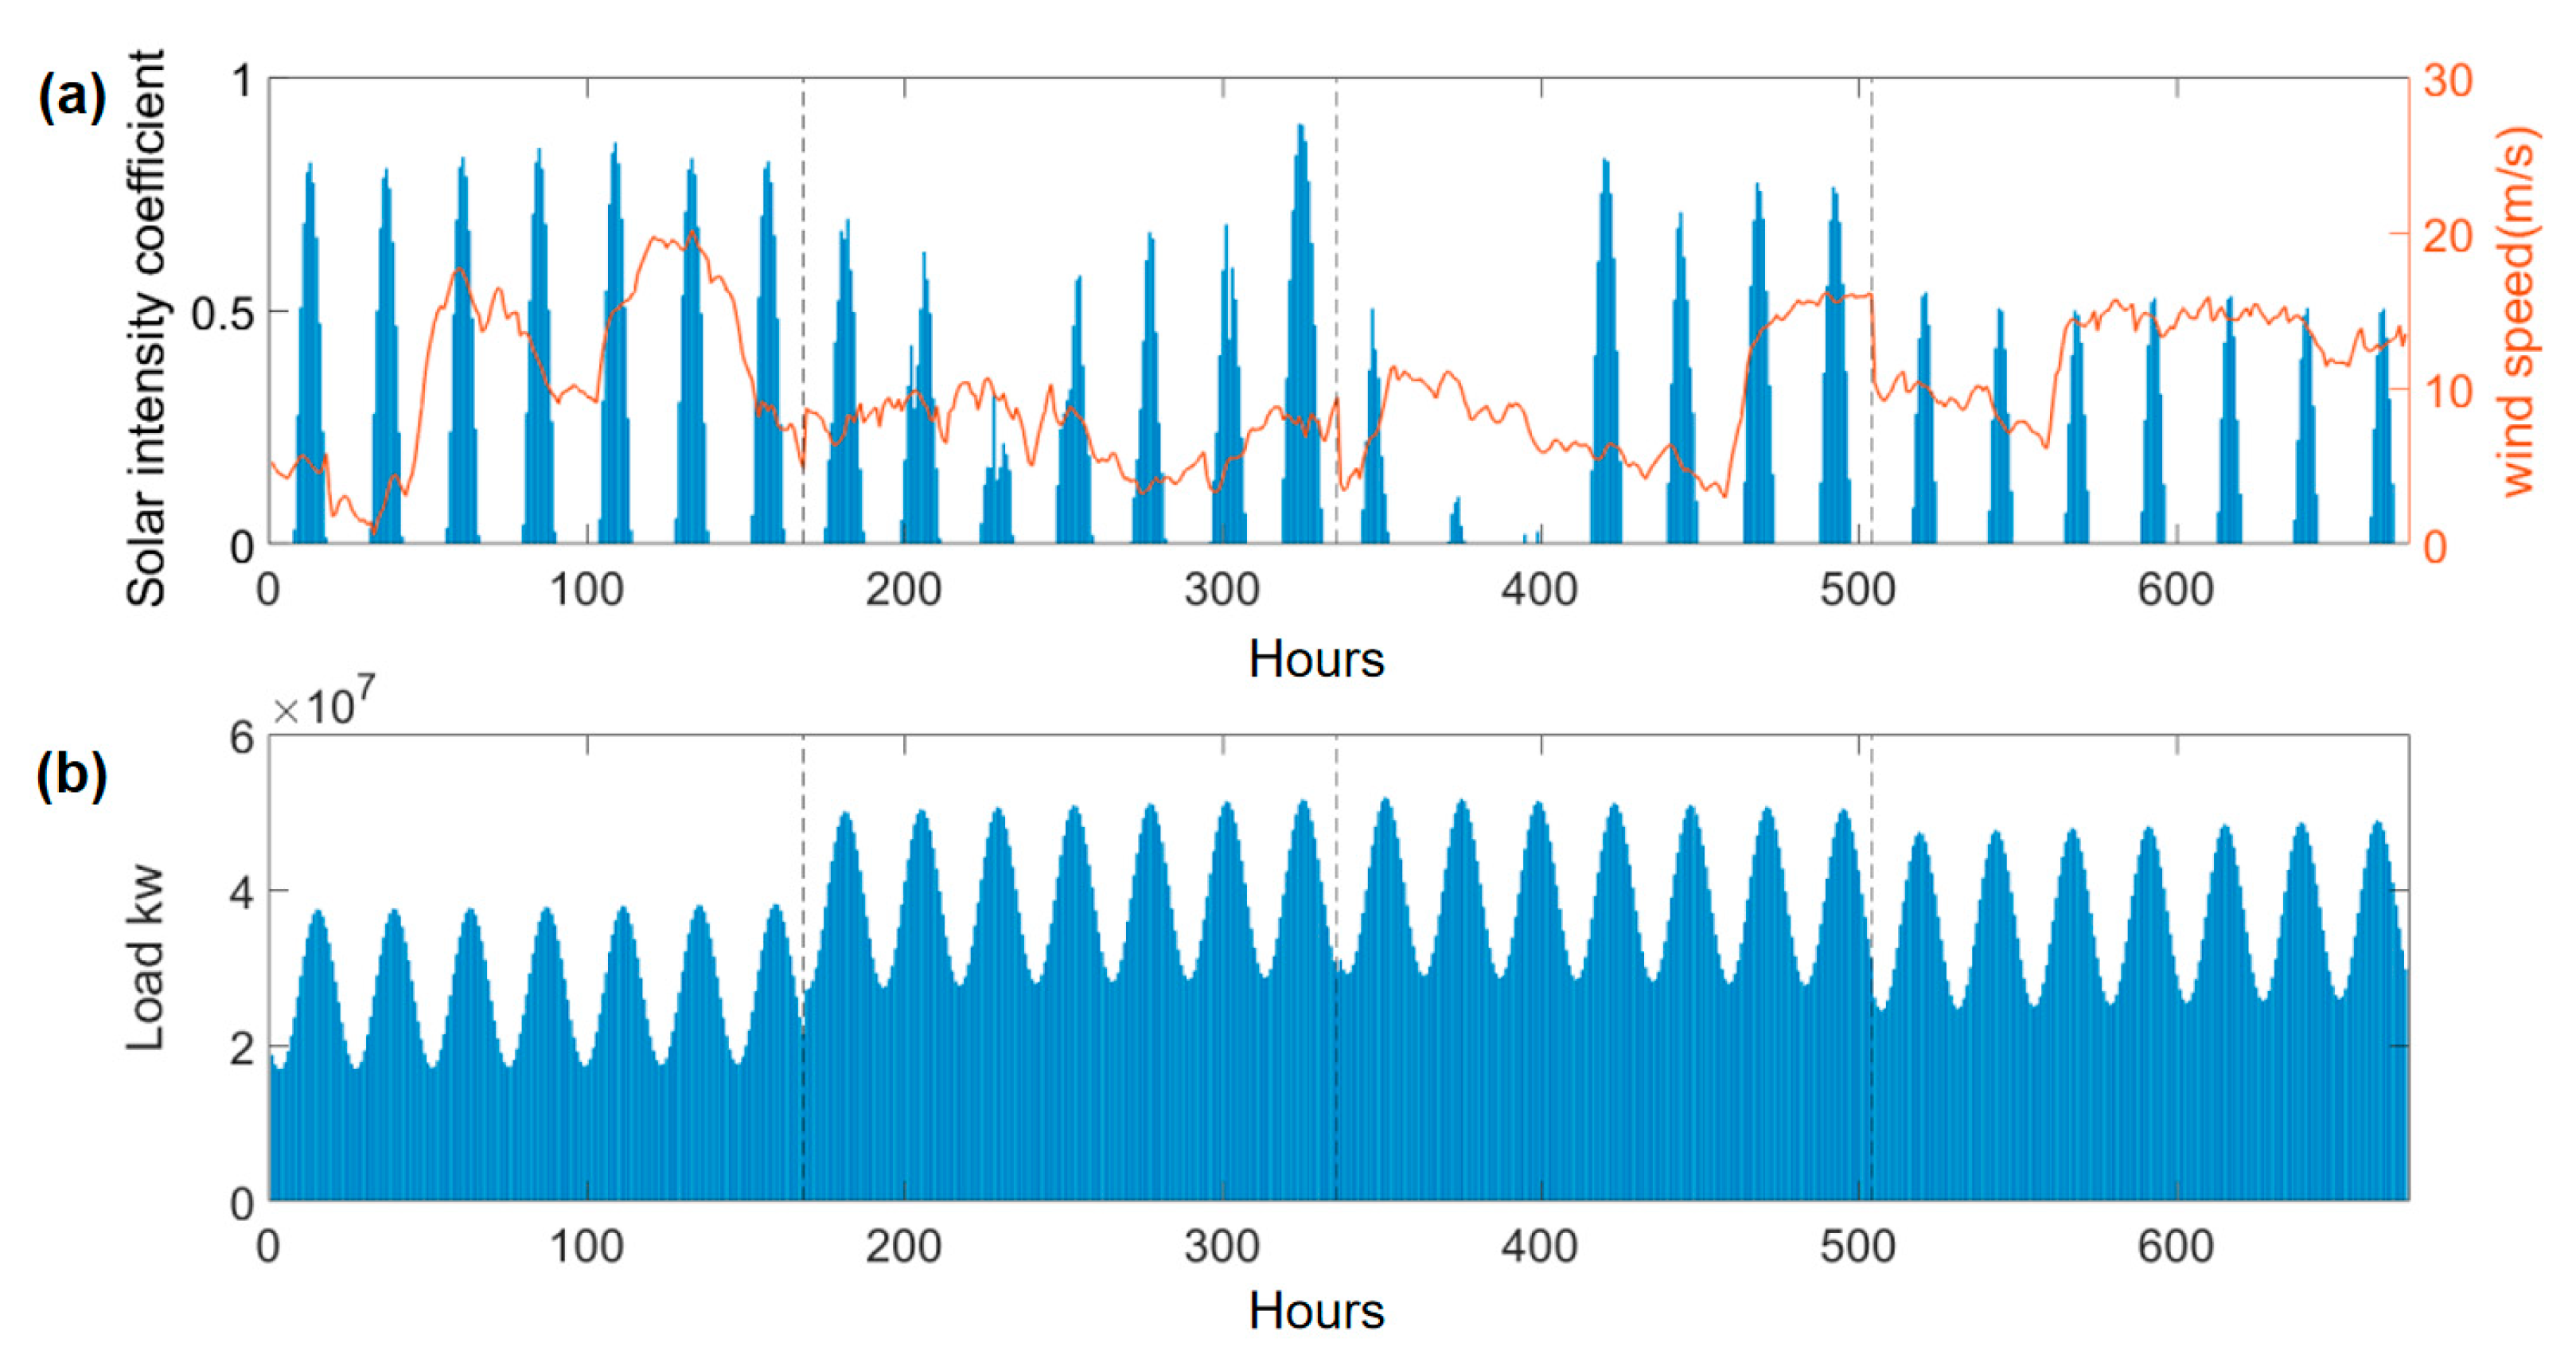
To improve the efficiency of planning and operation optimization, this paper selects the wind speed conditions of one typical week in March, July, October, and December each year to represent the wind and solar radiation conditions throughout the year. The typical weekly average wind speed and solar radiation resource endowment in Shanghai are shown in Figure 4.

3.5. Shanghai Urban Power System Planning Scenarios

Based on the overview of Shanghai’s urban power system and the high proportion of renewable energy urban power architecture constructed in the previous text, this paper designs two planning schemes for Shanghai’s urban power system, as follows:
(1) Base Scenario (BAS): Without considering long-term hydrogen energy storage, electrochemical energy storage will grow at a fixed growth rate, and traditional and renewable energy installations will be planned.
(2) Hydrogen Energy Storage (HES): We consider equipping electrolytic hydrogen production, hydrogen storage, and hydrogen power generation systems; assisting with electrochemical energy storage; and planning the hydrogen energy storage system, electrochemical energy storage, and urban power installation.
This paper compares two Shanghai power system plans—one with and one without long-term hydrogen storage—to quantify their impact on renewable capacity, penetration, utilization, and overall cost. The BAS for Shanghai’s urban power system is shown in Appendix A, Table A1, and various cost parameters are shown in Appendix A, Table A2. The operating parameters and financial coefficients of the various equipment are shown in Appendix A, Table A3.

4. Results and Analysis

4.1. The Results of Shanghai Urban Power Planning

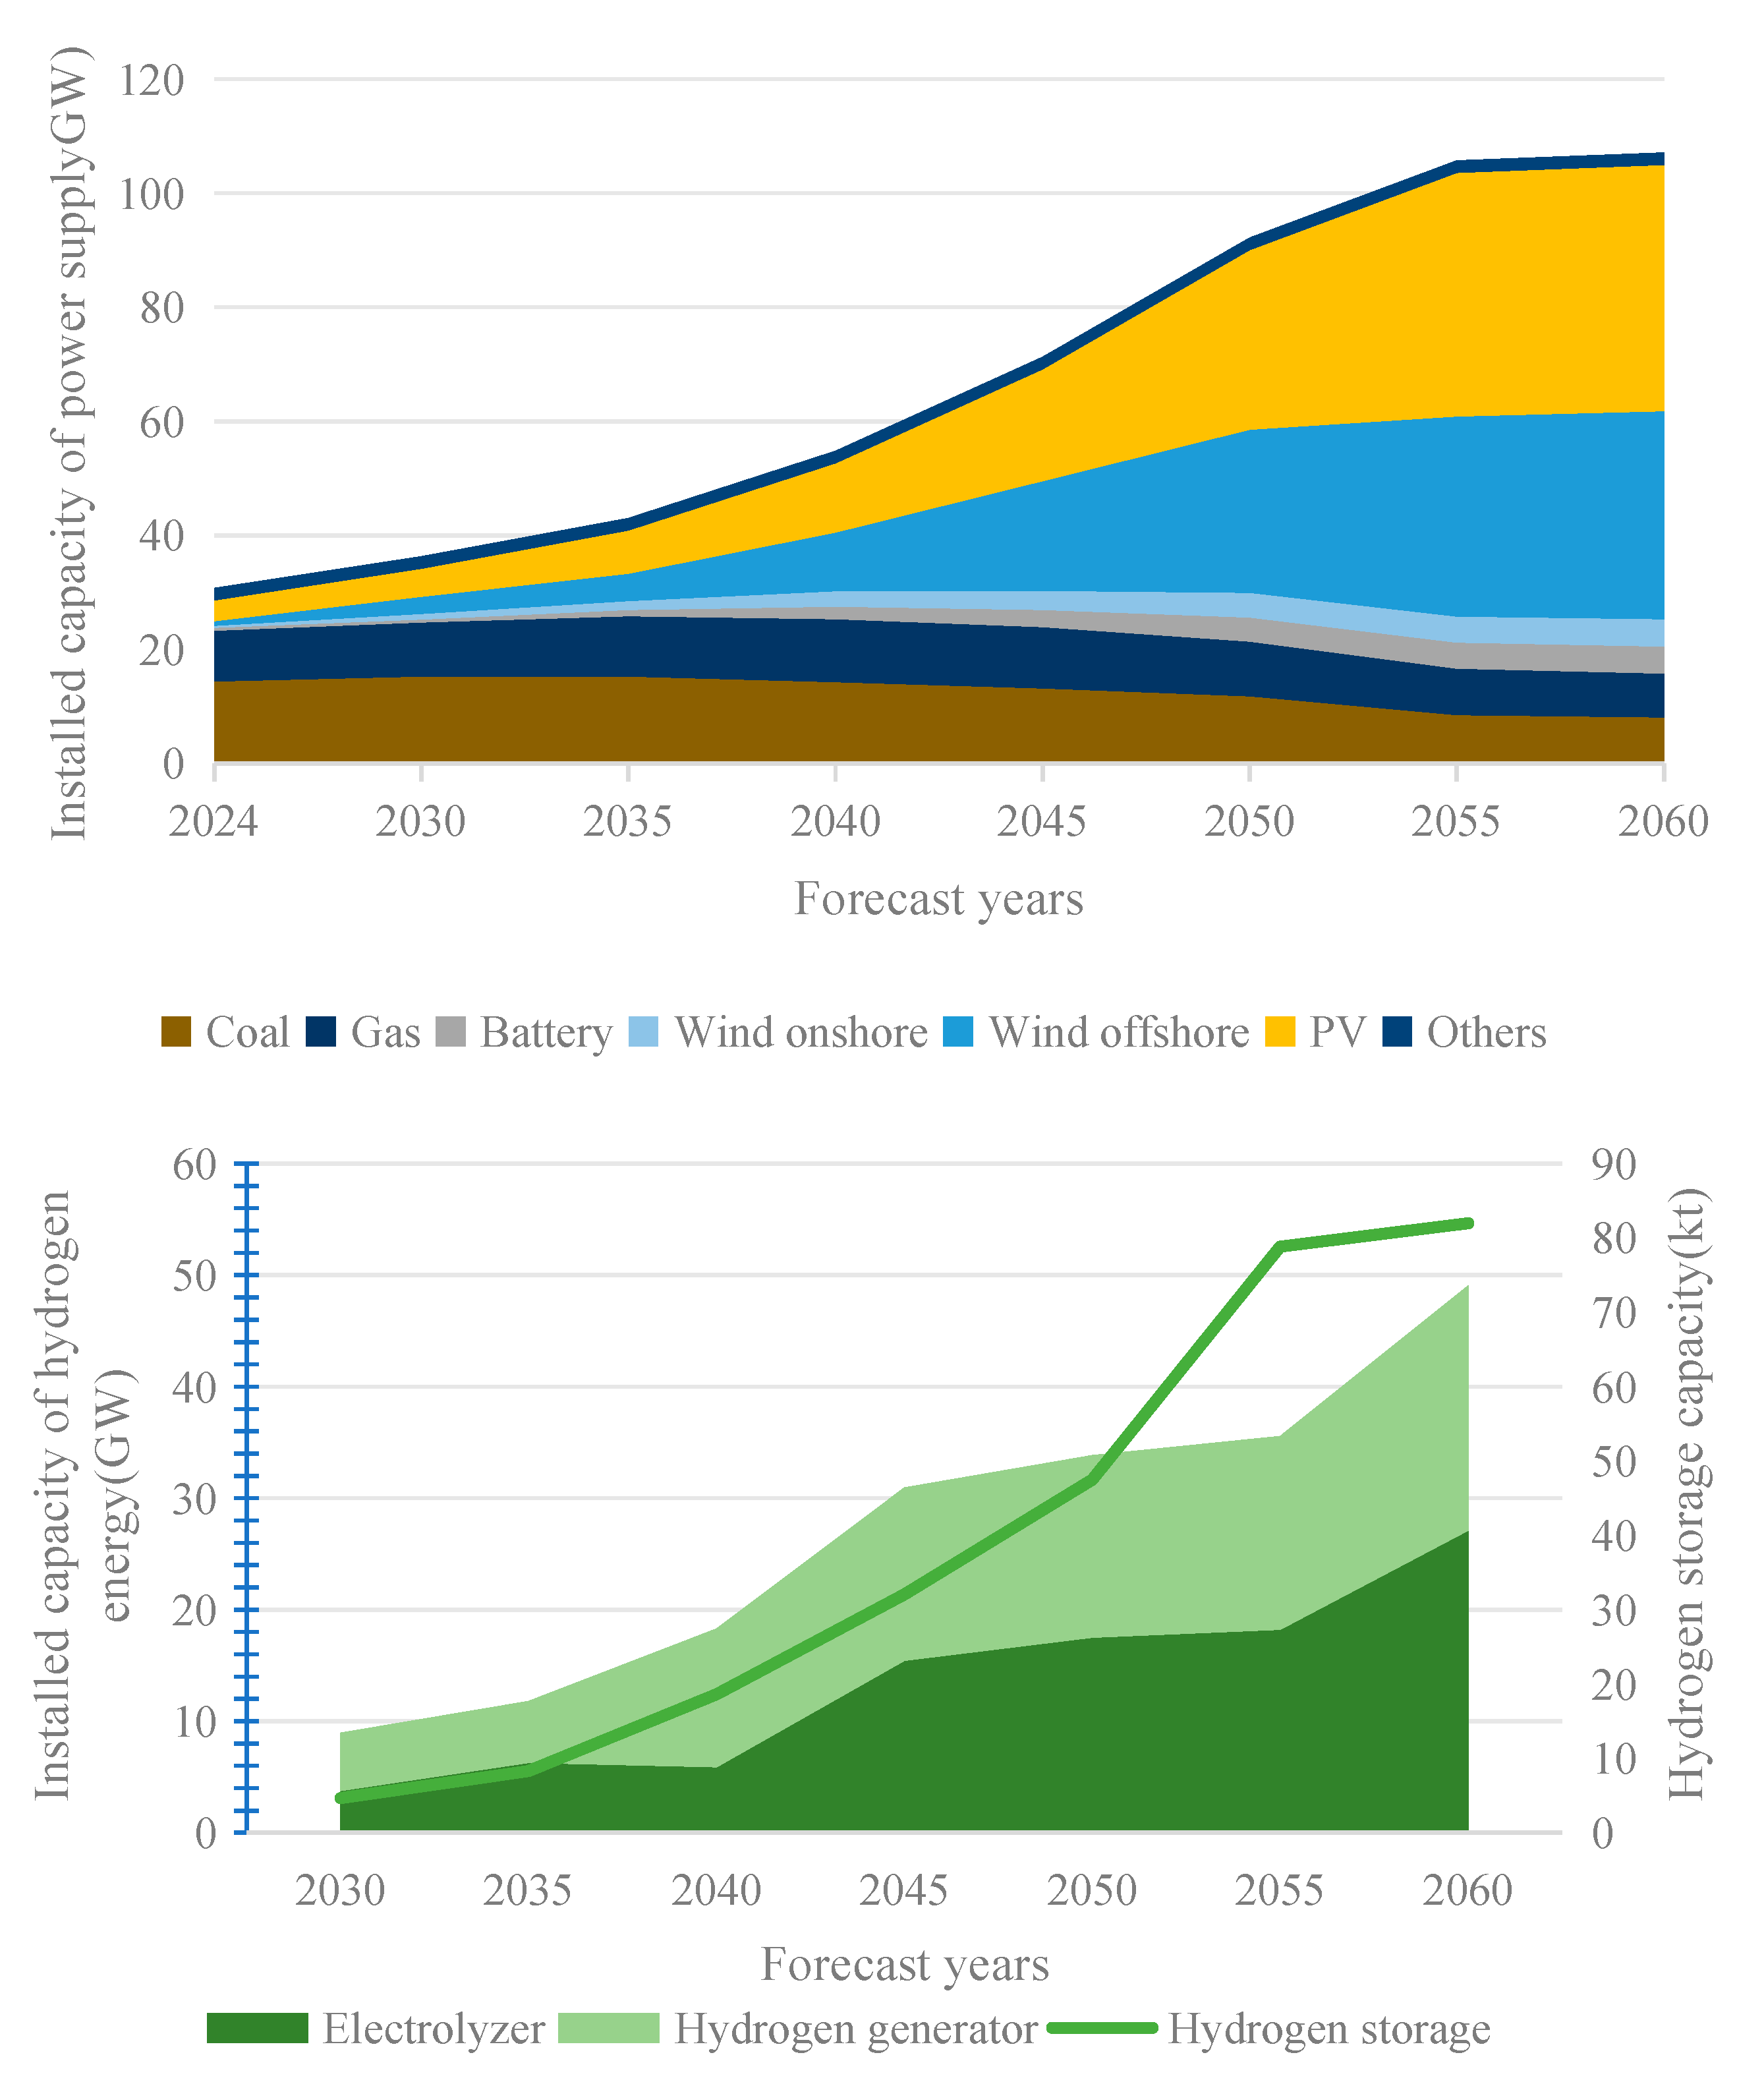
According to the planning model, combined with Shanghai’s urban load data and the conditions of the wind and solar resources, the optimized hydrogen energy storage capacity results are shown in Figure 5.
The evolution of Shanghai’s urban power system installation planning involving long-term hydrogen storage can be divided into three stages:
(1)
Early stage of industrial development (2030–2040): Due to the high cost of hydrogen energy storage, the deployment scale of electrolytic cells and hydrogen power generation is relatively small. By 2035, they will account for 8% of the installed power supply and 10% of the annual average electricity load.
(2)
Large-scale development period (2040–2050): With the further reduction in hydrogen storage costs and the increase in renewable energy installed capacity, by 2050, electrolytic cells and hydrogen power generation installed capacity will account for 24% and 22%, respectively.
(3)
High-quality development period (2050–2060): The scale of long-term hydrogen storage deployment will have slowed down. By 2060, the installed capacity of electrolytic cells could reach 27.1 GW, the installed capacity of hydrogen power generation equipment could reach 21.9 GW, and the deployed hydrogen storage system scale will be 72 kt.
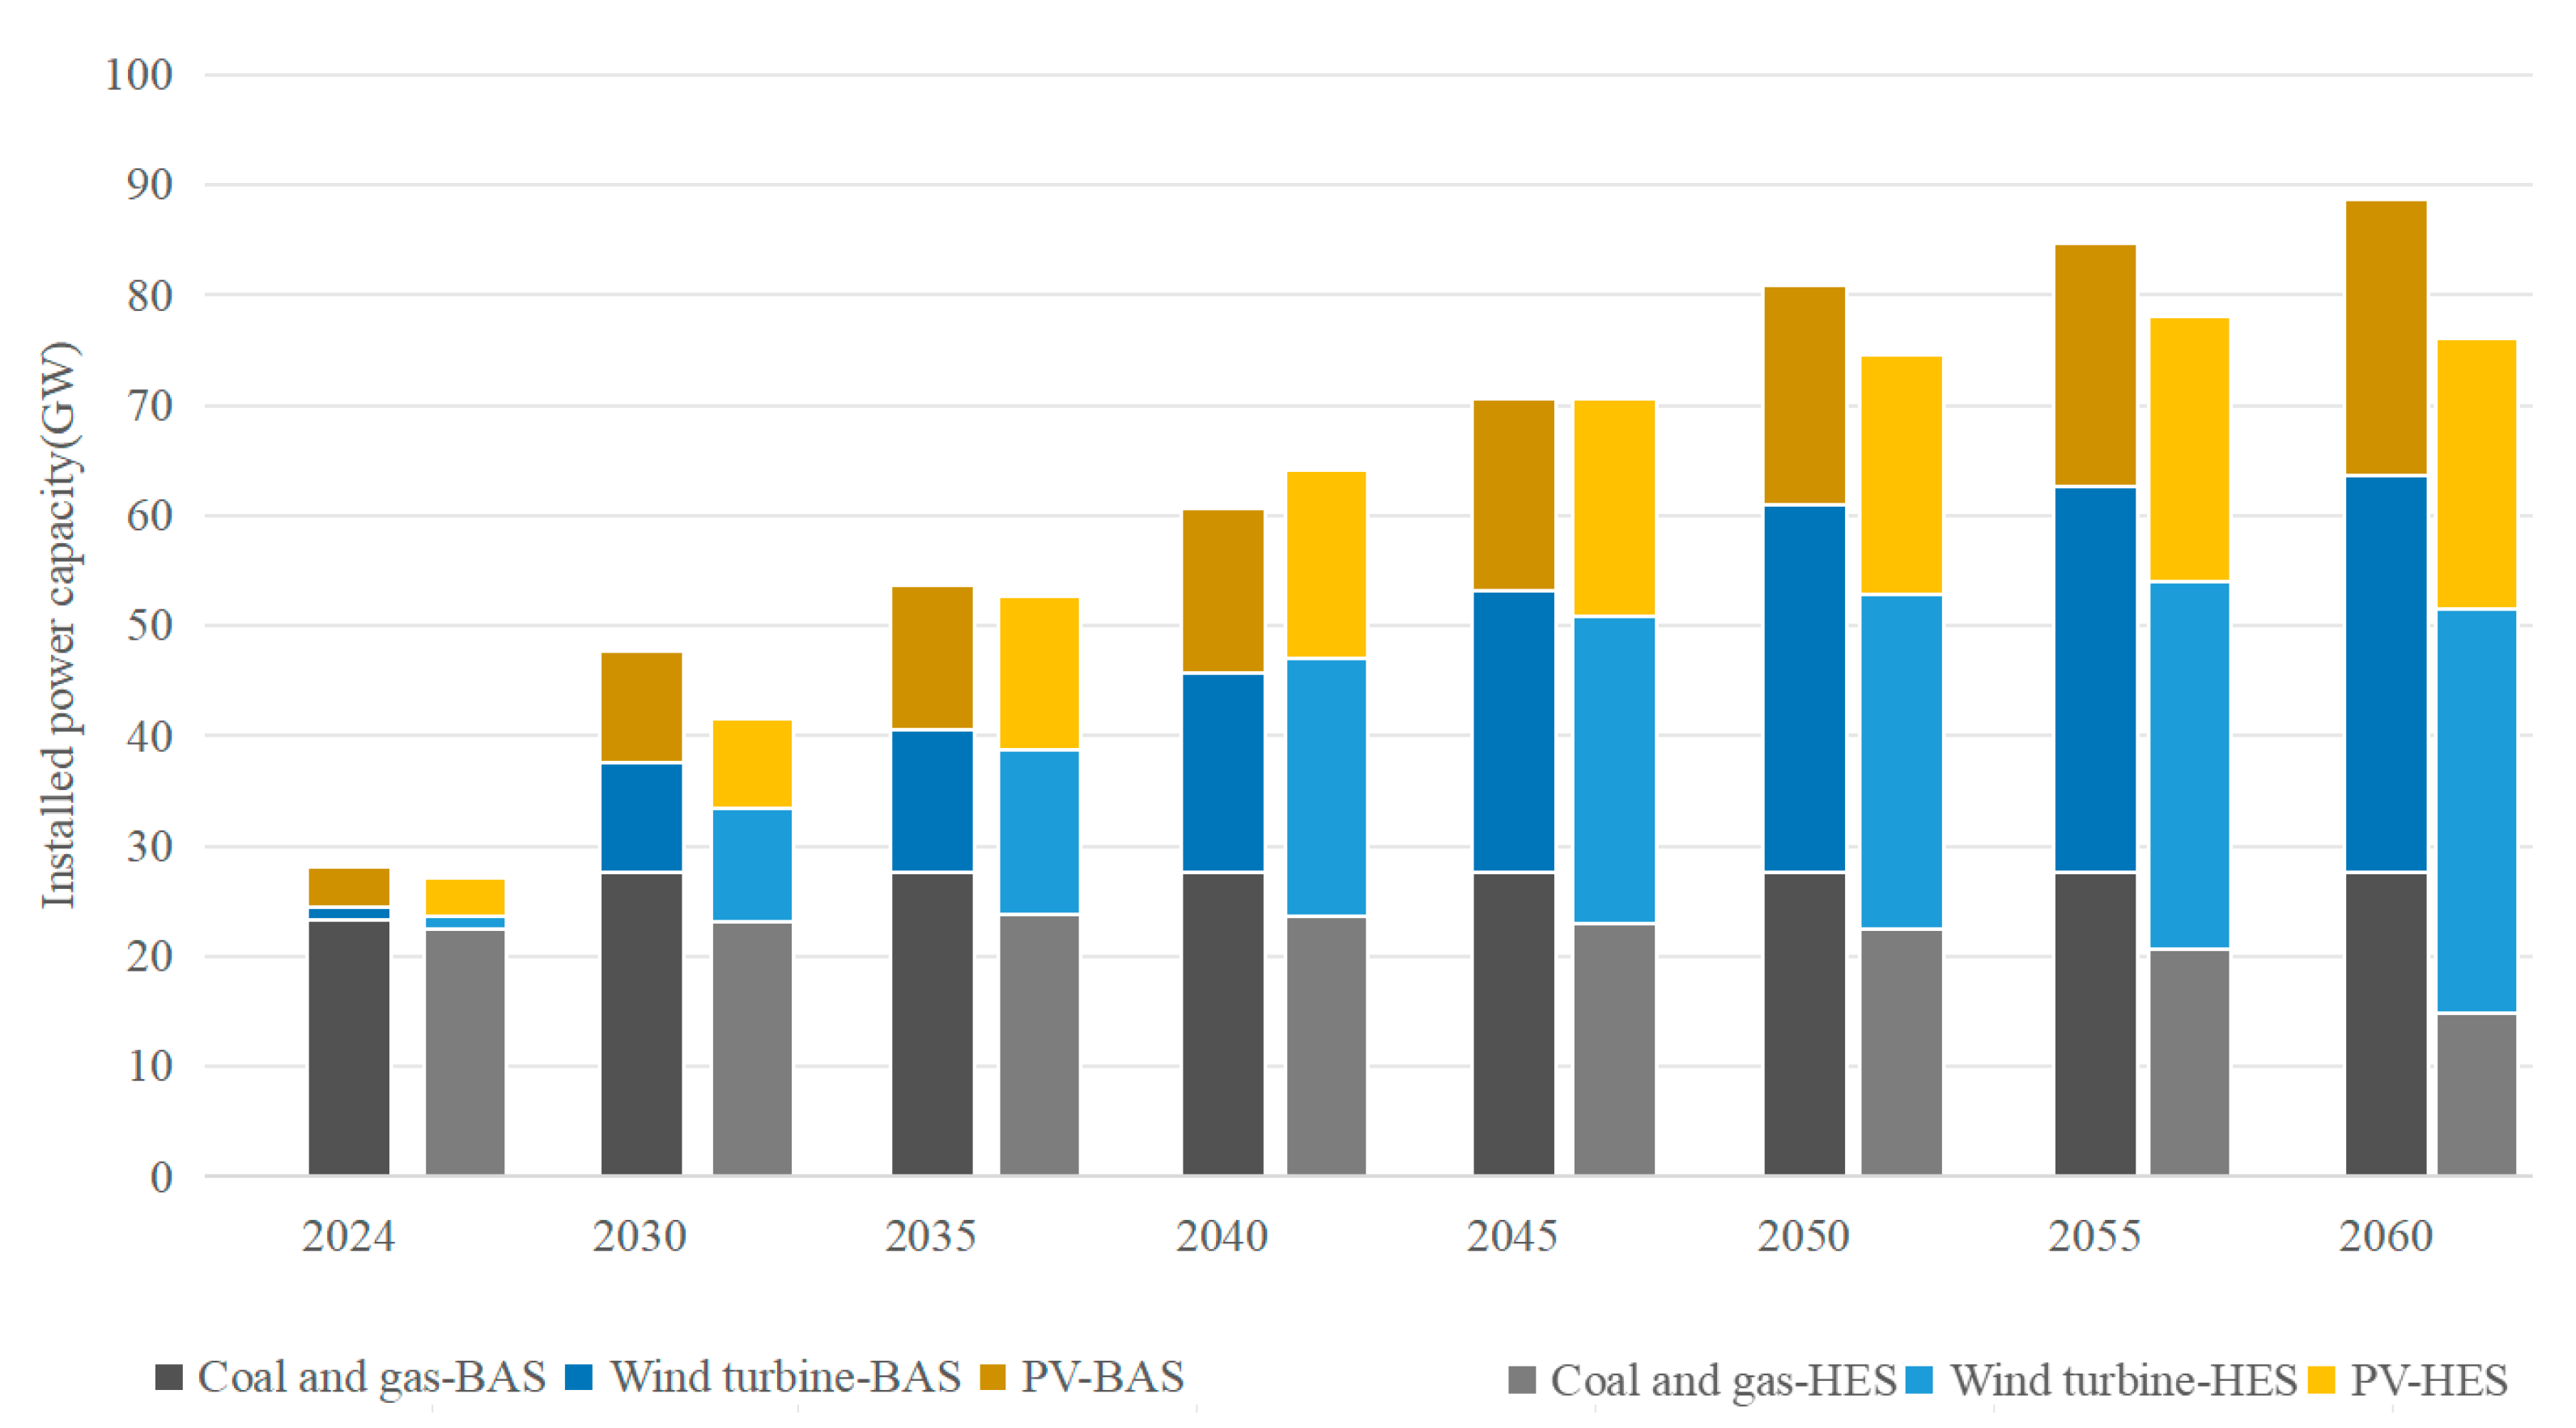
By 2060, the planned total installed capacity of coal-fired power plants in Shanghai, which are equipped with long-term hydrogen energy storage, can gradually retire, reducing by 9.5 GW compared to the BAS. The planned electrochemical energy storage capacity is 4.3 GW less than that of the BAS. The configuration of long-term hydrogen energy storage can promote an increase in the proportion of renewable energy installed in the power system. In 2060, under the BAS, the proportion of renewable energy installed capacity in Shanghai will be 64.6%, with an average annual growth rate of 8.3%.
Meanwhile, the deployment of long-term hydrogen energy storage will promote an increase in wind power and PV installed capacity to 40 GW and 25 GW, respectively, and increase the proportion of renewable energy installed capacity to 75.4% (excluding the installation of the hydrogen power generation equipment itself). The comparison of structural changes of urban power system with and without hydrogen energy storage configuration is shown in Figure 6.

4.2. The Operation Results of Long-Term Hydrogen Energy Storage

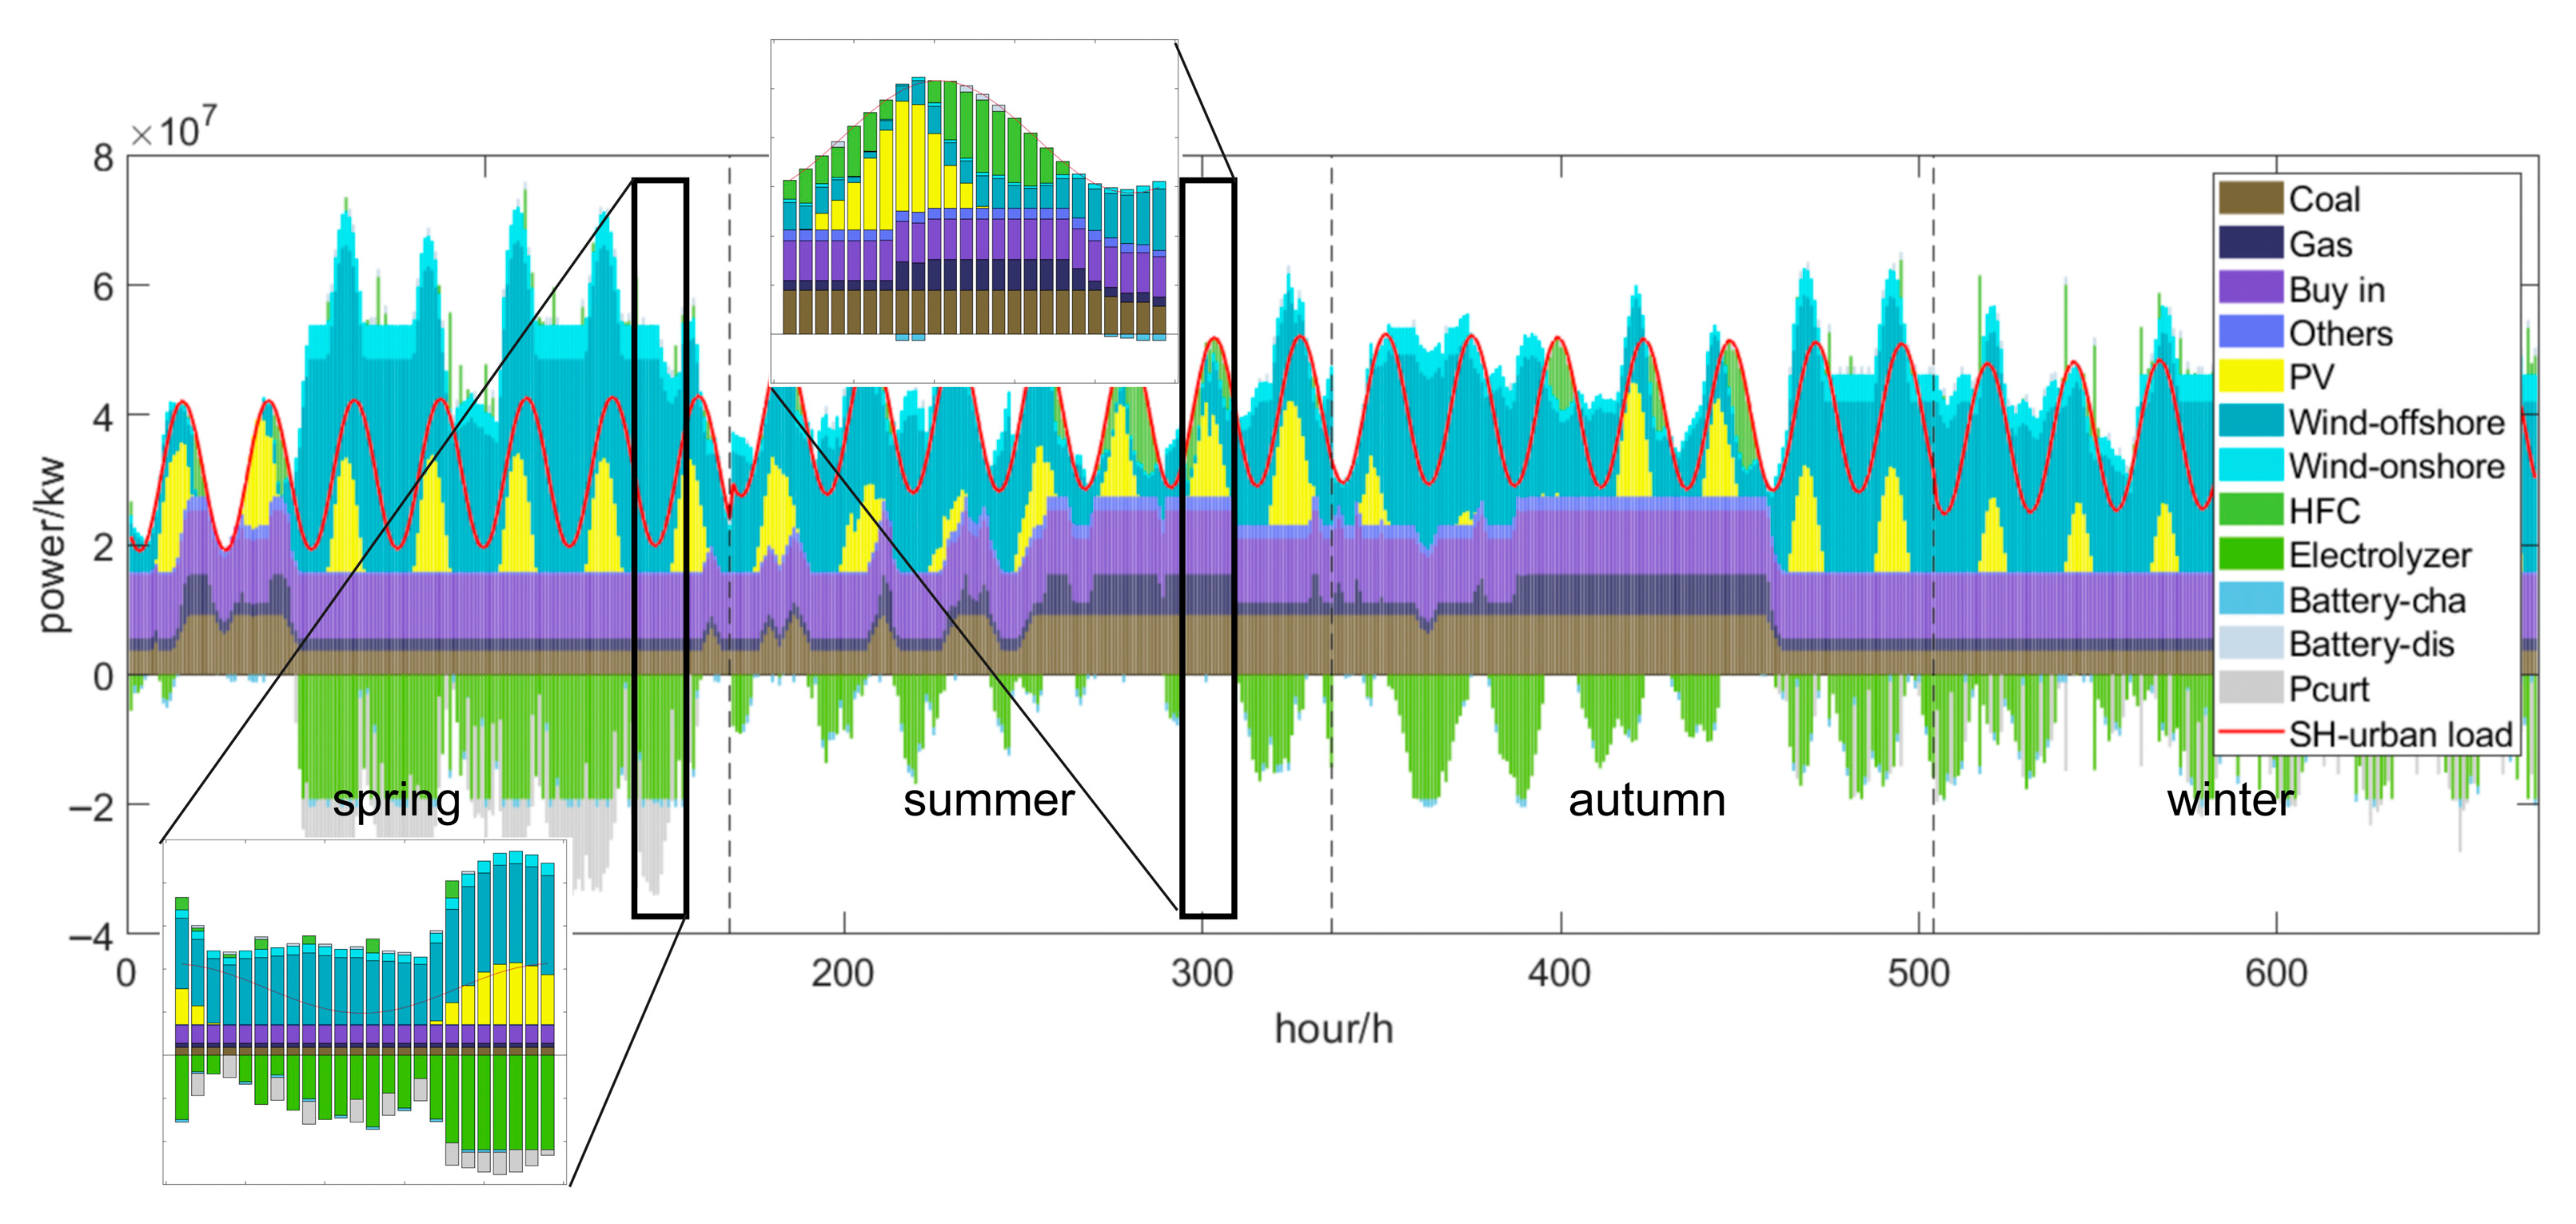
Hydrogen energy storage can maintain the stable operation of the power system under low renewable energy output. The operation of the Shanghai urban-scale power system in different typical weeks is shown in Figure 7. In the figure, the renewable energy output near 96–120 h is higher than the urban power load, and the excess renewable energy generation is consumed by the electrolytic hydrogen production system. In addition, the output of renewable energy near 260–284 h cannot meet the power load of Shanghai. In the scenario where electrochemical energy storage has no remaining electricity and cannot be charged, hydrogen energy generation can maintain the load supply.
Long-term hydrogen energy storage can play a seasonal role in peak shaving and valley filling. In the 2060 cross-quarter typical weekly power balance chart, there is insufficient renewable energy output near 280 h (summer), and hydrogen energy generation is used to ensure peak power load operation; renewable energy is booming near 168 h (spring) and 480 h (autumn), and electrolytic cells absorb excess electricity to produce hydrogen.
Planning a long-term hydrogen storage configuration can increase the penetration rate of renewable energy output. During the period of 2030–2040, the penetration rate of renewable energy with HES is expected to increase significantly faster than BAS. During the period of 2040–2050, due to the advanced deployment of renewable energy installations, the penetration rate of renewable energy generation using HES will have slowed down. With the retirement of traditional energy generation installations in 2050–2060, the growth rate will have re-increased and reached 63.99% in 2060, which is 11.61% higher than that of the BAS. The penetration rate of renewable energy in two scenarios from 2030 to 2040 is shown in Table 1.
Planning long-term hydrogen storage configuration can significantly improve the power system’s ability to absorb renewable energy. With the continuous expansion of the installed capacity of renewable energy, the intermittency and volatility of its power generation have led to a decrease in the consumption rate of the power system, and planning a long-term hydrogen storage power system can slow down this trend. From 2030 to 2040, due to the growing scale of renewable energy installed capacity and the advanced configuration of long-term hydrogen storage systems, the consumption rate of urban electricity will be above 97%. After 2040, with the large-scale deployment of renewable energy installations, the average electricity consumption rate of power systems equipped with long-term hydrogen storage will be more than 10% higher than that of the BAS scenario. The evolution trend of the renewable energy consumption rate is shown in Table 2.

4.3. Economic Analysis of Shanghai’s Urban Power Supply with the Participation of Long-Term Hydrogen Energy Storage

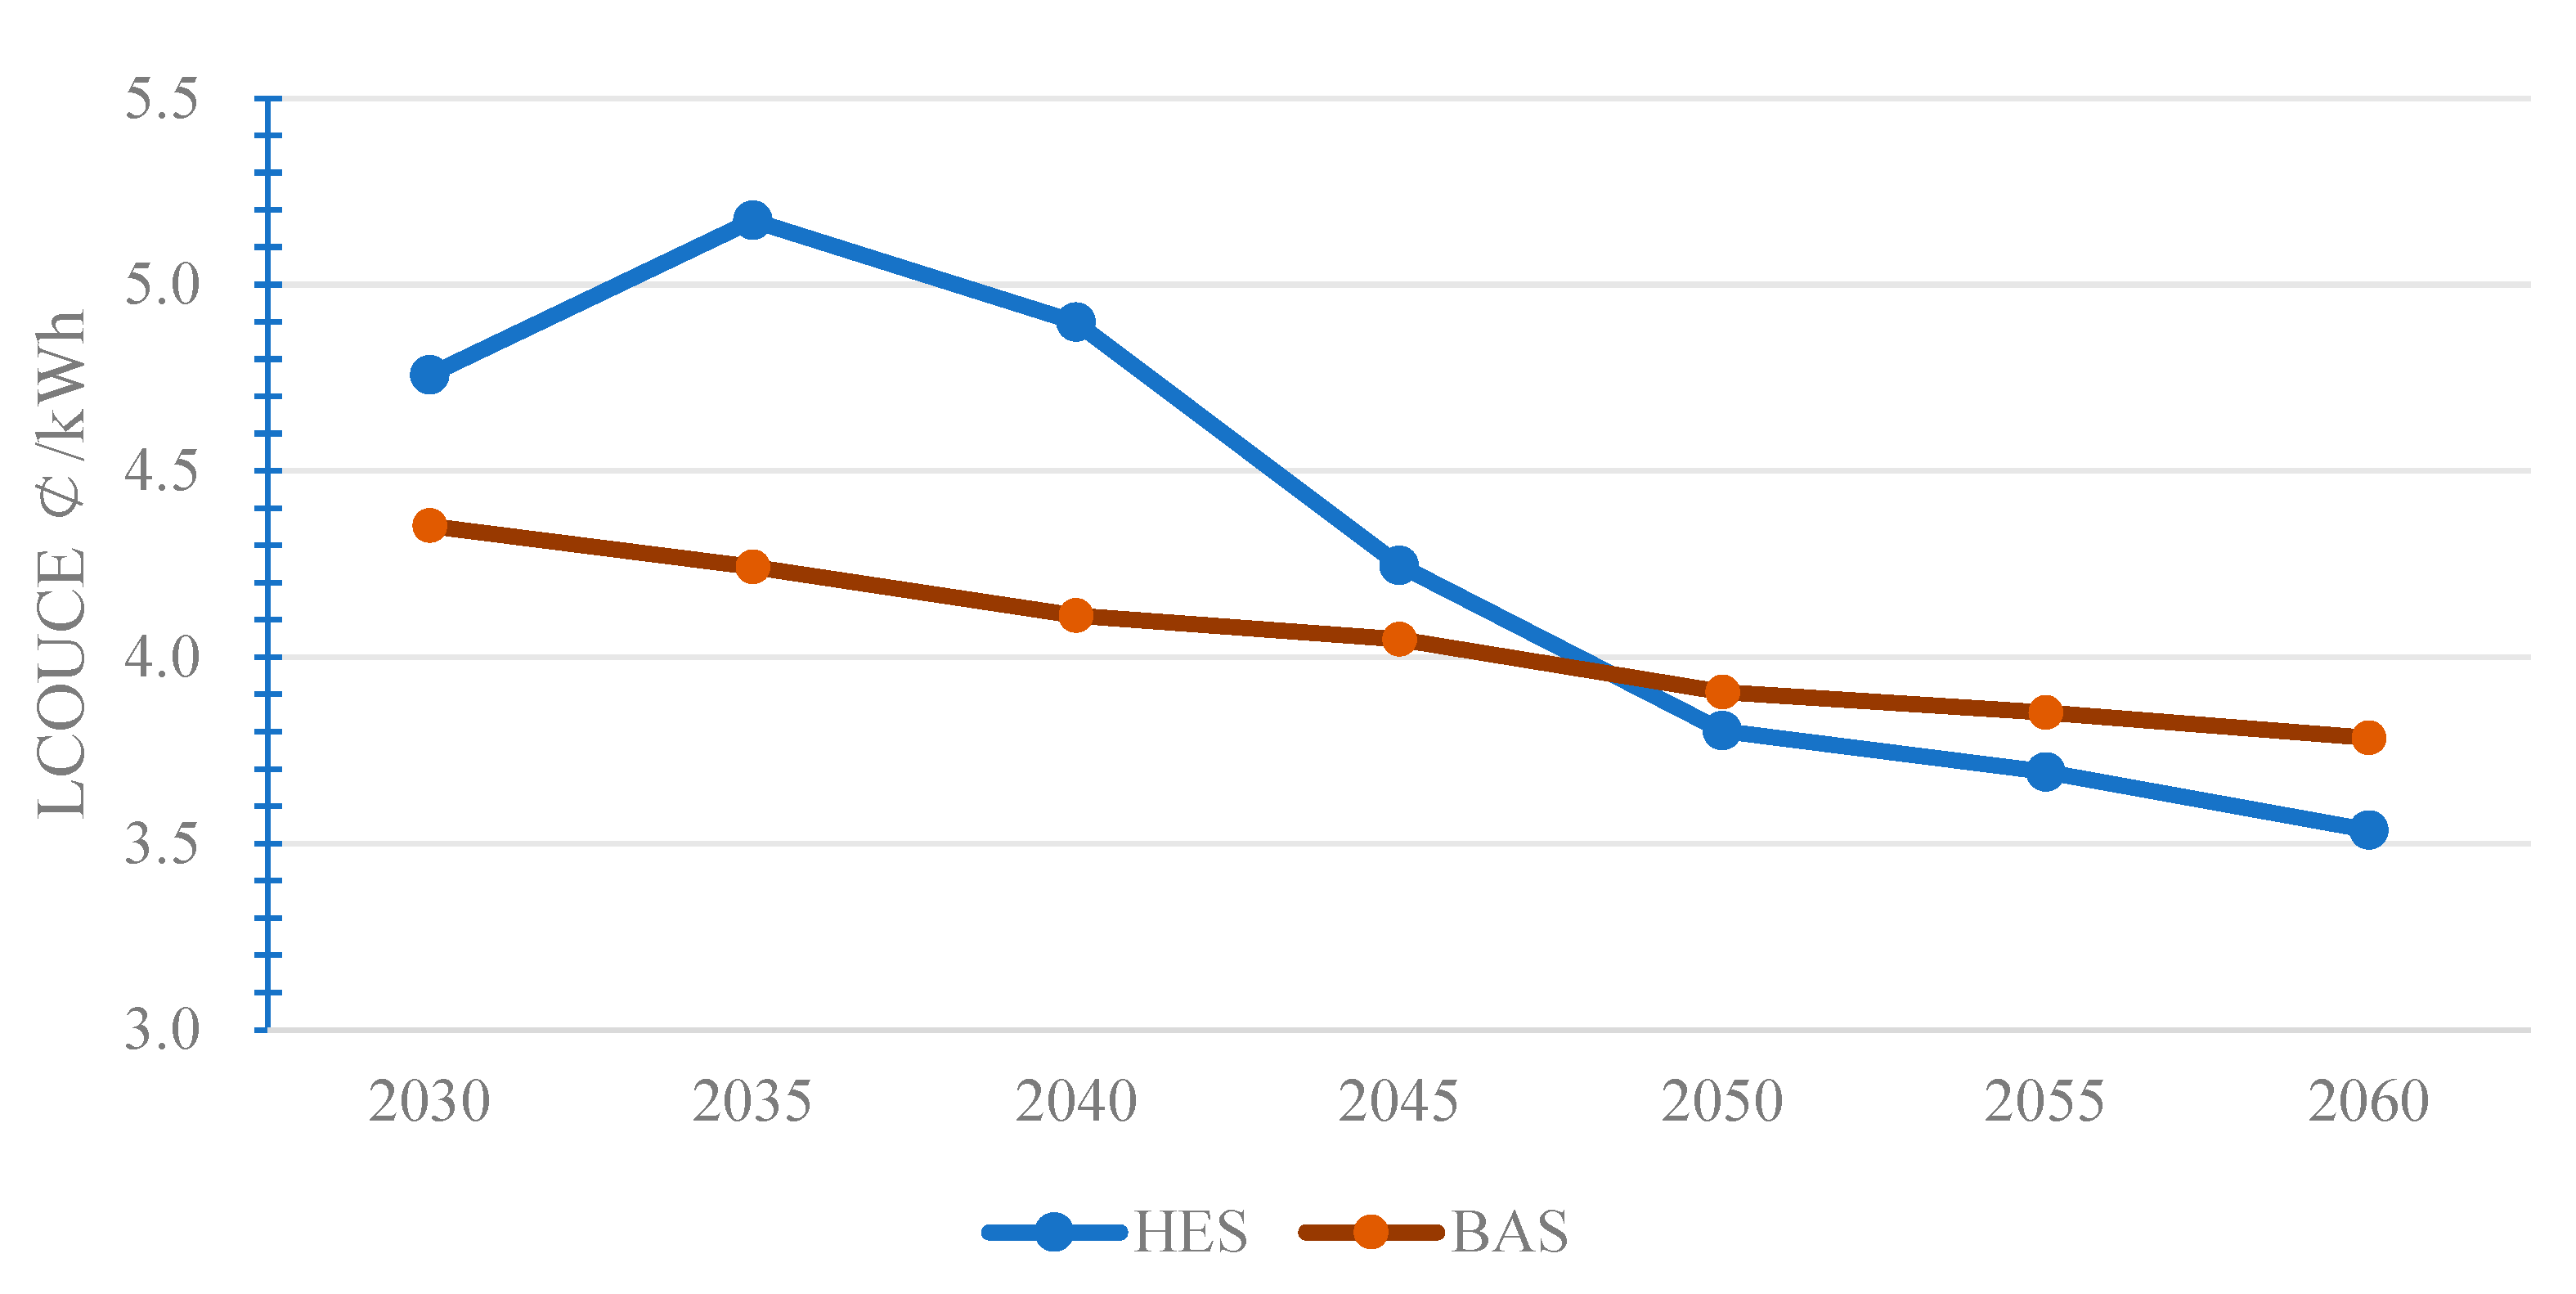
The LCOUCE of HES shows a trend of first increasing and then decreasing. In the early stages of hydrogen energy storage deployment (2030–2035), the costs of electrolyzers, hydrogen storage tanks, and hydrogen-fired power generators are relatively high. These technologies are still in the nascent stages of commercialization, leading to higher capital expenditures for their installation and integration into the urban power system. Accordingly, LCOUCE will continue to increase.
Long-term hydrogen storage can promote a reduction in power generation costs in power systems with a high proportion of renewable energy integration. As the deployment of hydrogen technologies scales up, economies of scale begin to take effect. Larger production volumes lead to cost reductions in manufacturing, procurement, and installation. This reduces the per-unit investment and operation cost, making hydrogen energy storage more economically competitive over time. By 2060, the proportion of renewable energy installed capacity under the BAS scenario will reach 68.5%, while the LCOUCE will only decrease by 16.31% compared to 2030. The LCOUCE of HES can decrease by 35.55% when the proportion of renewable energy installed capacity reaches 75.4%. The evolution trend of LCOUCE is shown in Figure 8.
In the long term, power systems equipped with long-term hydrogen storage are more economical to operate. From 2030 to 2040, the LCOUCE of HES will be higher than BAS, but around 2047, the LCOUCE of HES will begin to be lower than that of BAS, which will begin to demonstrate economic viability. By 2060, the LCOUCE of the HES scenario could be as low as 3.536 cents/kWh, 6.5% lower than that of the BAS scenario (R3#10).

5. Discussions

5.1. Discussion on the Installed Capacity of Hydrogen Energy Storage Under Uncertainty of Power Demand

A deterministic, single-track demand projection risks either over-building or under-building generation and hydrogen storage assets: excess capacity inflates life cycle costs, while insufficient capacity jeopardizes supply security. Therefore, annual electricity demand uncertainty must be explicitly modeled to ensure that the resulting plan remains technically robust and economically optimal under any realized demand level.
Taking Shanghai as an example, this study adopts three peak load equivalents for the required installed capacity scenarios from 2025 to 2060, as shown in Figure 9:
(1)
General Forecast Scenario (GFS): This rises smoothly from 200 TWh (2025) to 330 TWh (2060), which is applied to the planning scenario in Section 4.
(2)
High Growth Scenario (HGS): This reflects rapid electrification, reaching 231.25 TWh by 2030 and 362.5 TWh by 2060. The annual growth is 15% higher than the GFS scenario.
(3)
Low Growth Scenario (LGS): This assumes aggressive efficiency gains and industrial relocation, peaking at only 218.75 TWh in 2030 and 297.5 TWh in 2060. The annual growth is 15% lower than the GFS scenario.
Together, these scenarios span a 2060 demand range of 297.5–362.5 TWh, enabling a quantitative assessment of how hydrogen storage sizing and cost-effectiveness respond to demand uncertainty.
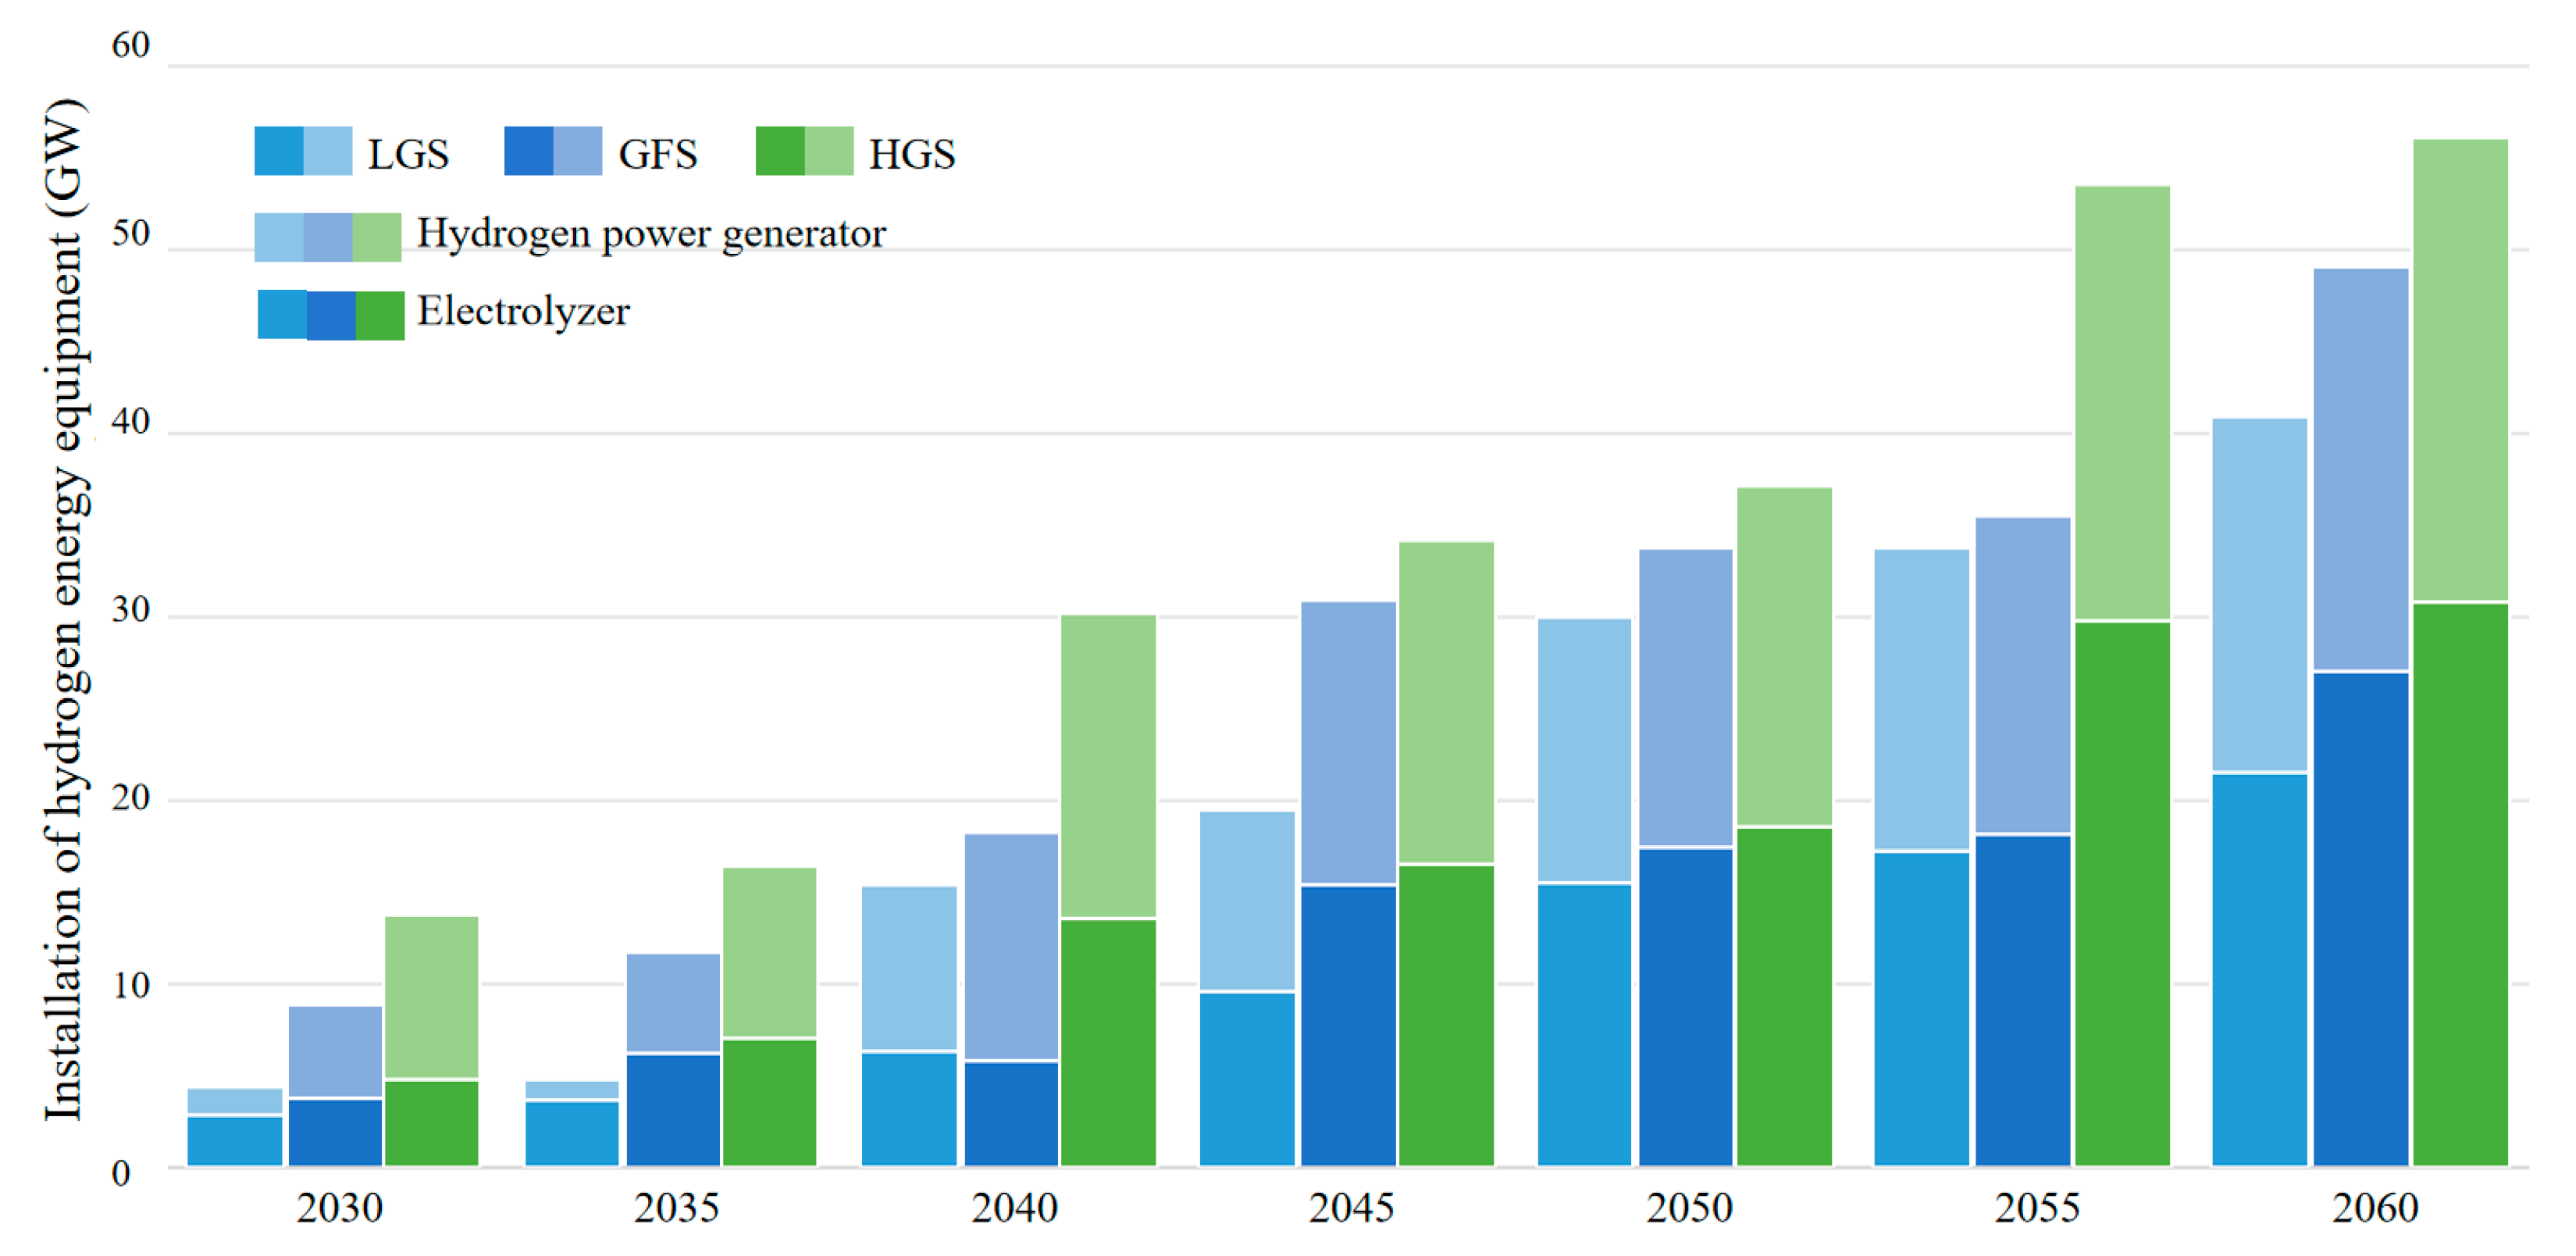
The overall deployment scale of hydrogen storage is positively correlated with electricity demand: under the high-demand scenario, electrolyzer and hydrogen power generation capacities will reach 30.3 GW and 24.9 GW by 2060, respectively, representing increases of about 12% and 14% over the regular scenario (27.1 GW and 21.9 GW), whereas the low-demand scenario sees only 21.0 GW and 19.0 GW—drops of 22% and 13%. The gap in hydrogen storage volume is even more pronounced, with 83.3 kt in the high-demand case, being 1.4 times that of the low-demand case (60 kt), underscoring the much stronger dependence of high electricity demand on long-duration, cross-seasonal energy storage. The installed capacity of hydrogen energy equipment in 2035–2060 under various power demand scenarios is shown in Figure 10.
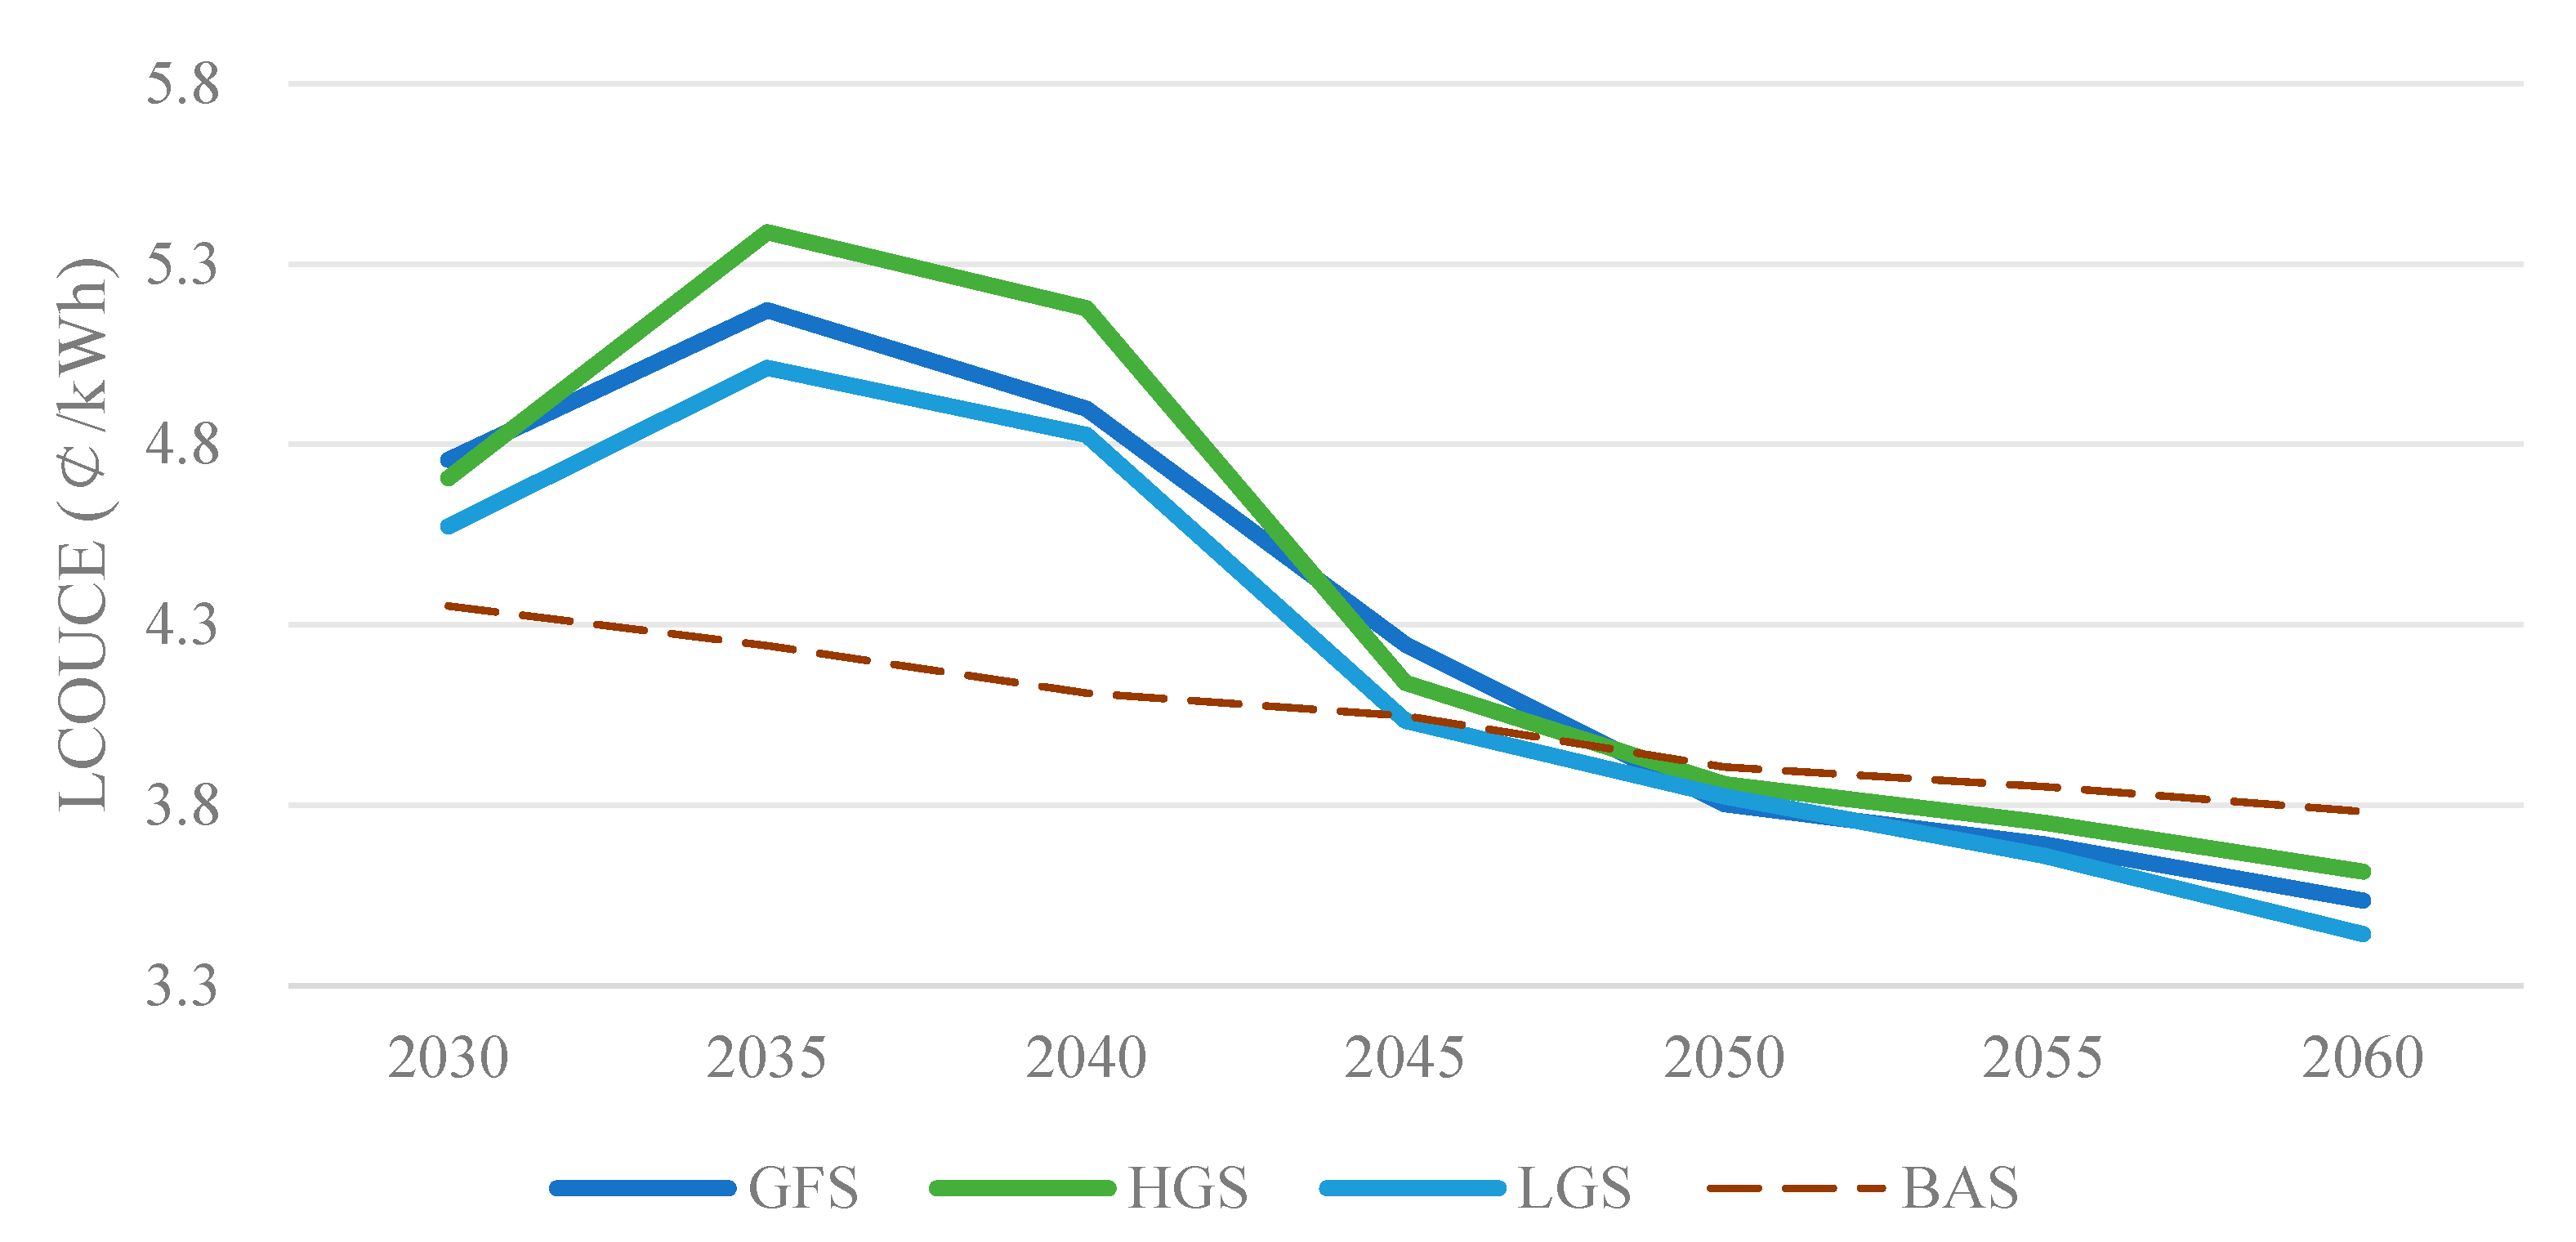
From 2030 to 2060, all scenarios exhibit an initial rise followed by a decline in LCOUCE, yet the peak height and convergence speed are dictated by demand intensity. Owing to the early, large-scale deployment of hydrogen storage, the high-demand scenario peaks at 5.389 ¢/kWh in 2035, 27% above the baseline of 4.242 ¢/kWh—the highest among all cases. The regular scenario registers a slightly lower peak of 5.172 ¢/kWh, still 22% higher than baseline, while the low-demand scenario records the gentlest peak at 5.012 ¢/kWh, an 18% premium. From 2035 onward, all three curves descend in unison, and by 2060, the gap narrows sharply: high, regular, and low demand reach 3.616 ¢/kWh, 3.536 ¢/kWh, and 3.443 ¢/kWh, respectively, with the largest deviation from the 3.783 ¢/kWh baseline only 0.17 ¢/kWh. This demonstrates that technological learning ultimately erases demand-driven differences, yet the high-demand trajectory still calls for stronger early-stage subsidies or capacity remuneration. LCOUCE evolution under different scenarios is shown in Figure 11.

5.2. Discussion on Cost Sensitivity of Hydrogen Energy Equipment

To assess the robustness of the optimal capacity expansion results, we conduct a one-at-a-time (OAT) sensitivity analysis of the capital costs of three key hydrogen components: electrolyzers, hydrogen storage tanks, and hydrogen-fired generators. Each cost parameter is varied from −40% to +40% in 20% increments while keeping all other parameters unchanged. Figure 12 reports the impact of hydrogen energy storage costs on LCOUCE by 2060.
Over time, the sensitivity of LCOUCE to CAPEX declines markedly: a ±20% cost change alters LCOUCE by roughly 0.2–0.3 ¢/kWh−1 initially, shrinking to only minor fluctuations by 2055–2060. When equipment costs drop to 60% of baseline, hydrogen storage outperforms the traditional BAS as early as 2040; at 120% of baseline, the economic crossover is delayed to 2050, and only an extreme 140% increase fully erodes competitiveness—thereby confirming the robustness of the hydrogen pathway amid economic and policy uncertainties.

6. Conclusions

This paper takes Shanghai as a research case and establishes a medium-to-long-term planning model for the hydrogen storage power system in Shanghai. Based on the urban electricity load and the growth of renewable energy installed capacity, the urban power capacity and structure of Shanghai under the participation of long-term hydrogen storage are planned and compared with the BAS without long-term hydrogen storage configuration in terms of renewable energy installed capacity and proportion, renewable energy generation penetration rate, and consumption rate, as well as LCOUCE and other indicators. The specific conclusions are as follows:
(1) The evolution of Shanghai’s urban power system installation planning involving long-term hydrogen storage can be divided into three stages: the initial stage of industrial development (2030–2040), the stage of large-scale development (2040–2050), and the stage of high-quality development (2050–2060). In the initial stage of industrial development, the deployment capacity of electrolytic cells and hydrogen power generation installation is relatively small, while in the stage of large-scale development, the installed capacity and growth rate of hydrogen storage are relatively high. In the stage of high-quality development, the deployment scale of long-term hydrogen storage has slowed down, but the scale continues to grow. By 2060, the installed capacity of electrolytic cells can reach 27.1 GW, the installed capacity of hydrogen power generation equipment can reach 21.9 GW, and the amount of deployed hydrogen storage is 72 kt.
(2) Hydrogen energy storage can play a supporting role in the balance of urban electricity and quantity in the context of future high-proportion renewable energy integration into urban power grids. Hydrogen energy storage can maintain the stable operation of the power system under low renewable energy output while also playing a seasonal role in peak shaving and valley filling. Compared with the BAS, urban power systems equipped with hydrogen storage have more advantages in terms of renewable energy generation penetration rate and consumption rate. The average electricity consumption rate of power systems equipped with long-term hydrogen storage will be more than 10% higher than that of the BAS scenario.
(3) From an economic perspective, the LCOUCE of urban power systems equipped with hydrogen storage has gone through a process of first increasing and then rapidly decreasing. From a long-term perspective, long-term hydrogen storage can promote a reduction in power generation costs for power systems with a high proportion of renewable energy access. In 2030, the LCOUCE of HES can decrease by 26% when the proportion of renewable energy installed capacity reaches 75% (R4#19). Around 2047, the LCOUCE of HES will begin to be lower than the baseline situation, and LCOUCE under power systems equipped with long-term hydrogen storage will begin to demonstrate economic viability.
However, there are still limitations in this study that involve a lack of detailed geographical modeling within Shanghai, which treats the city as a single node and ignores urban transmission constraints, land-use zoning, and site-specific wind–solar resources. Additionally, this study does not account for regulatory uncertainties, such as future carbon prices and hydrogen safety codes, which could impact build-out rates. Social-acceptance factors, including public opposition to electrolyzer stations or onshore wind farms that may raise costs or restrict siting, are also not captured.
In summary, hydrogen energy is a method to achieve long-term energy storage with both economic applicability and technical feasibility. Urban power systems equipped with long-term hydrogen energy storage will more effectively face the new situation of a high proportion of renewable energy integration in future power grid operations. At the same time, there are still some shortcomings in this study, such as only macro-planning the overall installed capacity of power generation equipment, without detailed research on the deployment of various power plants within the Shanghai urban area based on geographical conditions. Future research will conduct concrete studies on the distribution and deployment of urban power generators in Shanghai.

Author Contributions

Conceptualization, C.F., L.L. and C.X.; Methodology, J.L. and L.L.; Data curation, M.G. and R.S.; Writing—original draft, C.F. and J.L.; Writing—review and editing, C.X. and C.F.; Visualization, J.L. and M.G.; Supervision, C.X. All authors have read and agreed to the published version of the manuscript.

Funding

This research is supported by the Science and Technology Project of the State Grid Corporation of China (B3090R240001).

Data Availability Statement

The original contributions presented in this study are included in the article; further inquiries can be directed to the corresponding author.

Conflicts of Interest

The authors declare no conflicts of interest.

Appendix A. Relevant Parameters, Such as Cost Data Used in Supplementary Measurements

Table A1. Shanghai electric power system planning capacity of BAS.
Shanghai’s Power Installation
Planning of BAS(GW)
20242030203520402045205020552060
Coal14.4 17.6 17.6 17.6 17.6 17.6 17.6 17.6
Gas8.9 10.1 10.1 10.1 10.1 10.1 10.1 10.1
Electrochemical energy storage1.0 2.0 2.5 3.0 4.0 5.5 7.0 9.0
Onshore wind power0.4 1.2 1.8 2.8 3.5 43. 5.0 6.0
Offshore wind power0.8 8.8 11.2 15.2 22.0 29.0 30.0 30.0
PV3.7 100 13.0 15.0 17.7 20.2 22.0 25.0
Other REs2.1 2.1 2.1 2.1 2.1 2.1 2.1 2.1
Proportion of RE capacity (%)22.2 42.7 48.2 53.4 58.8 62.6 63.0 63.2
Table A2. Unit investment parameters of the power system in Shanghai [50,51,52].
Device Type (¥/kw)20252030203520402045205020552060
Coal42004500480050005200550058006000
Gas38003900400042004400460048005000
Other REs12,00011,50011,00010,50010,000950090008500
Onshore wind power55004800420038003500320030002800
Offshore wind power68006600600053004600400034003200
PV32002600220019001700150014001300
Electrolyzer2000160013001000850700600500
Hydrogen storage tank12001000800650500400350300
Hydrogen-fired power generation80006000450035002800220018001500
The unit cost of different devices is obtained by querying data or converted based on exchange rates, and the data evolved by year are based on literature sources.
Table A3. Operating parameters and financial coefficients [50,51,52].
Variable Parameters20252030203520402045205020552060
Hydrogen production efficiency, η H -0.650.700.750.780.810.830.85
Hydrogen power generation efficiency, μ f c -0.330.350.40.50.550.60.65
Lower limit of coal power output, μ c o a l m i n 0.40.380.360.320.30.280.260.25
Lower limit of gas power output, μ g a s m i n 0.30.280.260.220.20.180.160.15
Unit cost of coal power, c c o a l 0.30.40.450.50.550.60.650.7
Unit cost of gas power, c g a s 0.350.450.50.60.750.80.850.9
Unit cost of onshore wind power, c w i n d o n s h o r e 0.150.120.10.090.080.070.060.05
Unit cost of offshore wind power, c w i n d o f f s h o r e 0.250.20.180.160.140.110.080.06
Photovoltaic unit cost, c p v 0.10.080.070.060.050.050.040.03
Unit cost of other power, c o t h e r s 0.30.40.450.50.550.60.650.7
Invariant parameters
v r (m/s)13 v i n (m/s)3 v o u t (m/s)21
Charge discharge constraint, τ e l 0.25Charge discharge efficiency φ e l 0.95Hydrogen storage/release coefficient τ s h 0.025
Hydrogen storage/release efficiency, φ s h 0.98Hydrogen production ramp β h , u p 0.5Hydrogen production downward β h , d o w n 1
Coal generation ramp, β c o a l , d o w n 0.25Coal generation downward β c o a l , u p 0.125Gas generation downward β g a s , d o w n 0.6
Gas generation ramp, β g a s , u p 0.3
Table A4. Shanghai electric power system planning capacity of HES.
Shanghai’s Power Installation Planning of HES(GW)20242030203520402045205020552060
Coal14.4 16.2 16.3 15.7 13.2 11.1 10.5 10.4
Gas8.9 9.5 10.0 9.0 8.0 7.6 7.6 7.5
Electrochemical energy storage0.0 0.7 1.0 2.8 4.3 5.0 7.4 7.3
Onshore wind power0.4 1.8 3.0 3.8 4.4 4.8 5.2 5.2
Offshore wind power0.8 8.8 12.5 15.2 24.5 29.6 31.5 34.8
PV3.7 4.9 10.3 14.5 19.4 22.4 27.3 33.2
Other REs2.1 2.1 2.1 2.1 2.1 2.1 2.1 2.1
Proportion of RE capacity (%)22.3 46.3 55.6 62.5 65.9 67.9 70.4 75.4
Electrolyzer-3.8 6.3 5.9 15.4 17.5 18.2 27.1
Hydrogen power generator-5.2 5.5 12.4 15.5 16.3 17.4 21.9
Hydrogen storage tank (kt)-0.47 0.83 1.86 3.2 2.7 7.9 7.2

References

  1. Cowell, R. Wind power, landscape and strategic, spatial planning—The construction of ‘acceptable locations’ in Wales. Land Use Policy 2010, 27, 222–232. [Google Scholar] [CrossRef]
  2. Yi, B.W.; Xu, J.H.; Fan, Y. Inter-regional power grid planning up to 2030 in China considering renewable energy development and regional pollutant control: A multi-region bottom-up optimization model. Appl. Energy 2016, 184, 641–658. [Google Scholar] [CrossRef]
  3. Sager, F. Planning, power, and policy change in the networked city: The politics of a new tramway in the city of Bern. In The Social Fabric of the Networked City; Polish Review; EPFL Press: Lausanne, Switzerland; Routledge: Abingdon-on-Thames, UK, 2008. [Google Scholar]
  4. Kam Ng, M. From a Special Economic Zone to a Smart Sustainable City: The Power of Strategic Spatial Planning in Shenzhen. Built Environ. 2022, 48, 581–593. [Google Scholar] [CrossRef]
  5. Wang, C.; Liu, C.; Chen, J.; Zhang, G. Cooperative planning of renewable energy generation and multi-timescale flexible resources in active distribution networks. Appl. Energy 2024, 356, 122429. [Google Scholar] [CrossRef]
  6. Chu, C.-C.; Wu, Y.-K.; Lian, K.-L.; Liu, J.-H. Guest Editorial Towards Resilient Power Grids Integrated With High-Penetrated Renewable Energy Sources: Challenges, Opportunities, Implementation Strategies, and Future Perspectives. IEEE Trans. Ind. Appl. 2024, 60, 1960–1962. [Google Scholar] [CrossRef]
  7. Arboleya, P.; Méndez, A. Real-Time Grid Digital Twins: The backbone of the next generation of network technology for distribution system operators. IEEE Electrif. Mag. 2024, 12, 39–49. [Google Scholar] [CrossRef]
  8. Mehta, Y.; Lo, V.; Mehta, V.; Agrawal, K.; Madabathula, C.T.; Chang, E.; Gao, J. Renewable Electricity Management Cloud System for Smart Communities Using Advanced Machine Learning. Energies 2025, 18, 1418. [Google Scholar] [CrossRef]
  9. Zhang, H.; Liao, K.; Yang, J.; Zheng, S.; He, Z. Frequency-constrained expansion planning for wind and photovoltaic power in wind-photovoltaic-hydro-thermal multi-power system. Appl. Energy 2024, 356, 122401. [Google Scholar] [CrossRef]
  10. Zhao, Z.; Yang, K. Suitability matching evaluation of the low-carbon regional integrated energy system based on the ‘resource-demand’ balance. Sustain. Energy Technol. Assess. 2024, 72, 104099. [Google Scholar] [CrossRef]
  11. Dong, Y.; Wang, C.; Zhang, H.; Zhou, X. A novel multi-objective optimization framework for optimal integrated energy system planning with demand response under multiple uncertainties. Inf. Sci. 2024, 663, 120252. [Google Scholar] [CrossRef]
  12. Liu, Y.; Lv, M.; Sun, K. Comprehensive tradeoff and utilization of airborne renewable energy and uncertain stratospheric wind potential based on reinforcement learning. Energy 2025, 324, 135932. [Google Scholar] [CrossRef]
  13. Memarzadeh, G.; Keynia, F.; Amirteimoury, F.; Memarzadeh, R.; Noori, H. A New Hybrid Intelligent Method for Accurate Short Term Electric Power Production Forecasting from Uncertain Renewable Energy Resources. Int. J. Ind. Electron. Control Optim. 2025, 8, 45–55. [Google Scholar]
  14. Fakhry, A.E.; Gomaa, M.; Metwaly, A.A.; Abdelhafeez, A. Machine Learning Models with Neutrosophic Numbers for Cloud Security Analysis and Smart Grid Control of Renewable Energy. Neutrosophic Sets Syst. 2025, 85, 960–973. [Google Scholar]
  15. Liu, M.; Zhu, J.; Liu, M. Optimal AC Power Flow with Energy Storage and Renewable Energy: An Efficient RL Algorithm Capable of Handling Equality Constraints. Int. J. Comput. Intell. Syst. 2025, 18, 27. [Google Scholar] [CrossRef]
  16. Zhou, Z. Self-Sustainability for green energy in megacities: A case Study of Shanghai towards Net-Zero Goal. E3S Web Conf. 2024, 527, 03016. [Google Scholar] [CrossRef]
  17. Shanghai Municipal Commission of Economy and Information Technology. Key Performance Indicators Report on Environmental Sustainability of Shanghai Power Supply (2024). 2024, Shanghai. Available online: https://www.sheitc.sh.gov.cn/cmsres/b0/b09cd80f5b1c4a45828ebb85e70c9ace/5bf5394163353f25d4db20ff92ba286f.pdf (accessed on 7 September 2025).
  18. Schoenung, S.M.; Hassenzahl, W. Characteristics and Technologies for Long- vs. Short-Term Energy Storage: A Study by the DOE Energy Storage Systems Program; United States Department of Energy: Livermore, CA, USA, 2001. [Google Scholar]
  19. Albertus, P.; Manser, J.S.; Litzelman, S. Long-term Electricity Storage Applications, Economics, and Technologies. Joule 2020, 4, 21–32. [Google Scholar] [CrossRef]
  20. Sander, M.; Gehring, R. LIQHYSMES—A Novel Energy Storage Concept for Variable Renewable Energy Sources Using Hydrogen and SMES. IEEE Trans. Appl. Supercond. A Publ. IEEE Supercond. Comm. 2011, 21, 1362–1366. [Google Scholar] [CrossRef]
  21. Dabade, D.; Dudhe, V.; Dambhare, S. A review on modelling of stator of pumped storage synchronous generator for protection schemes against stator earth fault. AIP Conf. Proc. 2024, 3188, 060009. [Google Scholar]
  22. Ye, L.; Qi, S.; Cheng, T.; Jiang, Y.; Feng, Z.; Wang, M.; Liu, Y.; Dai, L.; Wang, L.; He, Z. Vanadium Redox Flow Battery: Review and Perspective of 3D Electrodes. ACS Nano 2024, 18, 18852–18869. [Google Scholar] [CrossRef]
  23. Wang, K.; Chen, L.; Li, X.; Zhu, C. Research on compressed air energy storage systems using cascade phase-change technology for matching fluctuating wind power generation. Front. Energy Res. 2024, 12, 1352540. [Google Scholar] [CrossRef]
  24. Hamburg Green Hydrogen Hub (HGHH) Consortium. Green Hydrogen Hub Europe—Hamburg; Hamburg Ministry of Economy: Hamburg, Germany, 2021. [Google Scholar]
  25. Port of Rotterdam Authority. Hydrogen Vision for the Port of Rotterdam. Rotterdam, May 2020. Available online: https://www.portofrotterdam.com/sites/default/files/2021-06/hydrogen-vision-port-of-rotterdam-authority-may-2020.pdf (accessed on 7 September 2025).
  26. Australian Renewable Energy Agency (ARENA). Hydrogen Park Murray Valley (HyP Murray Valley) Project. ARENA Project Factsheet, 2023. Available online: https://arena.gov.au/projects/hydrogen-park-murray-valley/ (accessed on 7 September 2025).
  27. Laghlimi, C.; Moutcine, A.; Ziat, Y.; Belkhanchi, H.; Koufi, A.; Bouyassan, S. Hydrogen, Chronology and Electrochemical Production. Sol. Energy Sustain. Dev. J. 2024, 14, 22–37. [Google Scholar] [CrossRef]
  28. Bounitsis, G.L.; Charitopoulos, V.M. Power system planning integrating hydrogen and ammonia pathways under uncertainty. Comput. Aided Chem. Eng. 2024, 53, 2191–2196. [Google Scholar]
  29. Wang, H.; Qin, B.; Ding, T.L.F. Optimal configuration of hybrid hydrogen-to-power system for power systems with high wind energy penetration. IET Gener. Transm. Distrib. 2024, 18, 2171–2183. [Google Scholar] [CrossRef]
  30. He, X.; Lu, T.; Li, J.; Sheng, W.; Li, R. Power System Capacity Planning Considering Seasonal Hydrogen Storage by Salt Caverns. arXiv 2023, arXiv:2311.12525. [Google Scholar] [CrossRef]
  31. Yi, Y.; Komiyama, R.; Fujii, Y. Development of Chinese Dynamic Optimal Power Expansion Planning Model Integrated with Hydrogen and Fuel Cell System. IEEJ Trans. Electr. Electron. Eng. 2023, 18, 834–848. [Google Scholar] [CrossRef]
  32. Nguyen, Q.M.; Nguyen, D.L.; Nguyen, Q.A.; Pham, T.N.; Phan, Q.T.; Tran, M.H. A Bi-level optimization for the planning of microgrid with the integration of hydrogen energy storage. Int. J. Hydrogen Energy 2024, 63, 967–974. [Google Scholar] [CrossRef]
  33. Zhang, W.; Han, Q.; Shang, W.L.; Xu, C. Seismic resilience assessment of interdependent urban transportation-electric power system under uncertainty. Transp. Res. Part A Policy Pract. 2024, 183, 19. [Google Scholar] [CrossRef]
  34. Maghami, M.R.; Pasupuleti, J.; Sundaram, S. Impact of time of use program on widely distribution generation interconnection in urban power network. J. Energy Storage 2024, 101 Pt A, 113789. [Google Scholar] [CrossRef]
  35. Kosmopoulos, P.; Dhake, H.; Kartoudi, D.; Tsavalos, A.; Koutsantoni, P.; Katranitsas, A.; Lavdakis, N.; Mengou, E.; Kashyap, Y. Ray-Tracing modeling for urban PV energy planning and management. Appl. Energy 2024, 369, 24. [Google Scholar] [CrossRef]
  36. Wang, C.; Lu, Z.; Zhang, J.; Guo, X.; Li, Y.; Zhang, J. Planning and economic analysis of low-carbon transition of East China power system considering electricity-hydrogen coupling. Renew. Energy 2025, 249, 123244. [Google Scholar] [CrossRef]
  37. Asghari, M.; Afshari, H.; Jaber, M.Y.; Searcy, C. Strategic analysis of hydrogen market dynamics across collaboration models. Renew. Sustain. Energy Rev. 2025, 208, 115001. [Google Scholar] [CrossRef]
  38. Cheng, A.; Xiao, W.; Ban, Y.; Shang, L.; Ruan, X.; Jiang, X.; He, G. Optimization and 4E analysis of a distributed methanol reforming trigeneration system of electricity, hydrogen, and heat enhancement by high temperature electrically driven hydrogen separation. Int. J. Hydrogen Energy 2025, 118, 373–393. [Google Scholar] [CrossRef]
  39. Rong, F.; Liang, W.; Yuan, X.; Wang, Q.; Ma, Q.; Zuo, J. Thermo-economic feasibility analysis of a novel integrated energy system based on solar hydrogen production. Energy 2025, 332, 137230. [Google Scholar] [CrossRef]
  40. Kennedy, K.M.; Borrero, M.A.; Edwards, M.R.; O’ROurke, P.; Hultman, N.E.; Surana, K. Advancing equitable value chains for the global hydrogen economy. Energy Clim. Change 2024, 5, 100166. [Google Scholar] [CrossRef]
  41. Xie, T.; Wang, Q.; Zhang, G.; Zhang, K.; Li, H. Low-Carbon Economic Dispatch of Virtual Power Plant Considering Hydrogen Energy Storage and Tiered Carbon Trading in Multiple Scenarios. Processes 2024, 12, 27. [Google Scholar] [CrossRef]
  42. Chen, X.; Yang, L.; Dong, W.; Yang, Q. Net-zero carbon emission oriented Bi-level optimal capacity planning of integrated energy system considering carbon capture and hydrogen facilities. Renew. Energy 2024, 237, 121624. [Google Scholar] [CrossRef]
  43. Nicoli, M.; Faria, V.A.D.; de Queiroz, A.R.; Savoldi, L. Modeling energy storage in long-term capacity expansion energy planning: An analysis of the Italian system. J. Energy Storage 2024, 101 Pt A, 113814. [Google Scholar] [CrossRef]
  44. Xia, Q.; Zou, Y.; Wang, Q. Optimal Capacity Planning of Green Electricity-Based Industrial Electricity-Hydrogen Multi-Energy System Considering Variable Unit Cost Sequence. Sustainability 2024, 16, 3684. [Google Scholar] [CrossRef]
  45. Gao, X.; Zhang, G.; Nie, Y.; Xi, X.; Feng, Y. The social network perspective on power system co-evolution: Responses to “double carbon target” realization in China. Environ. Sci. Pollut. Res. 2024, 31, 57114–57128. [Google Scholar] [CrossRef]
  46. Shanghai Municipal Government. Shanghai Carbon-Peaking Implementation Plan. 2022. Available online: https://www.ndrc.gov.cn/fggz/hjyzy/tdftzh/202208/t20220808_1332758_ext.html (accessed on 7 September 2025).
  47. Shanghai Municipal Government. Shanghai Municipal Carbon Emission Management Regulation. 2025. Available online: https://www.shanghai.gov.cn/xxzfgzwj/20250401/7dab726f8b55468c87eb920c49c0be89.html (accessed on 7 September 2025).
  48. Du, Y.; Yu, Y. Optimization Operation Strategy of Integrated Energy System Considering Load Flexibility and Energy Conversion Device. In Proceedings of the 2024 International Conference of Electrical, Electronic and Networked Energy Systems, Xi’an, China, 20–22 September 2024; Lecture Notes in Electrical Engineering. pp. 359–369. [Google Scholar]
  49. Xiao, Z.; Liu, Q.; Liang, Q.; Wu, D.; Ruan, Y.; Qian, F.; Xu, T.; Meng, H.; Yao, Y. Optimization of integrated energy systems with hydrogen storage: Incorporating experimentally validated partial load characteristics for enhanced renewable energy utilization. J. Phys. Conf. Ser. 2025, 3018, 012013. [Google Scholar] [CrossRef]
  50. IRENA. Green Hydrogen Cost Reduction: Scaling Up Electrolysers to Meet the 1.5 °C Climate Goal; International Renewable Energy Agency: Abu Dhabi, United Arab Emirates, 2020; ISBN 978-92-9260-295-6. [Google Scholar]
  51. IRENA. Making the Breakthrough: Green Hydrogen Policies and Technology Costs; International Renewable Energy Agency: Abu Dhabi, United Arab Emirates, 2021; ISBN 978-92-9260-314-4. [Google Scholar]
  52. Hydrogen Council. Global Hydrogen Flows; Hydrogen Council: Brussels, Belgium, 2021. [Google Scholar]
Figure 1. (a) Proportion of renewable energy installed in Shanghai. (b) Power supply installation structure in Shanghai in 2024 [7,8].
Energies 18 05183 g001
Figure 2. Research framework for power planning involving hydrogen storage in Shanghai.
Energies 18 05183 g002
Figure 3. The framework and operation mode of Shanghai’s electrolytic hydrogen collaboration system.
Energies 18 05183 g003
Figure 4. (a) Typical urban wind–solar resource endowment in Shanghai. (b) Four typical weekly load patterns throughout the year in Shanghai.
Energies 18 05183 g004
Figure 5. Results of Shanghai’s power installation structure planning under HES.
Energies 18 05183 g005
Figure 6. Comparison of installed capacity between the HES and BAS scenarios up to 2060.
Energies 18 05183 g006
Figure 7. Load operation of Shanghai urban power system—comparison under different renewable energy conditions.
Energies 18 05183 g007
Figure 8. LCOUCE comparison between HES and BAS.
Energies 18 05183 g008
Figure 9. Comparison of annual electricity demand scenarios.
Energies 18 05183 g009
Figure 10. Installation of hydrogen energy equipment in different scenarios.
Energies 18 05183 g010
Figure 11. LCOUCE evolution under different scenarios.
Energies 18 05183 g011
Figure 12. The impact of hydrogen energy storage costs on LCOUCE by 2060.
Energies 18 05183 g012
Table 1. Comparison of penetration rates of renewable energy generation.
Penetration Rates of RE%2030203520402045205020552060
BAS28.834.937.542.448.552.352.4
HES29.839.347.750.353.656.664.0
Table 2. Comparison of renewable energy consumption rates.
Consumption Rates of RE%2030203520402045205020552060
BAS92.489.588.7 86.4 82.682.3 82.0
HES98.699.6 97.0 96.2 96.2 96.0 96.0
Disclaimer/Publisher’s Note: The statements, opinions and data contained in all publications are solely those of the individual author(s) and contributor(s) and not of MDPI and/or the editor(s). MDPI and/or the editor(s) disclaim responsibility for any injury to people or property resulting from any ideas, methods, instructions or products referred to in the content.