Article

Capacity Configuration and Benefit Assessment of Deep-Sea Wind–Hydrogen System Considering Dynamic Hydrogen Price

1
State Grid Shanghai Economic Research Institute, Shanghai 200235, China
2
School of Economics and Management, North China Electric Power University, Beijing 102206, China
3
Beiqi Foton Motor Co., Ltd., Beijing 102206, China
*
Author to whom correspondence should be addressed.
Energies 2025, 18(19), 5175; https://doi.org/10.3390/en18195175
Submission received: 15 August 2025 / Revised: 15 September 2025 / Accepted: 22 September 2025 / Published: 29 September 2025

Abstract

Against the backdrop of the global transition towards clean energy, deep-sea wind-power hydrogen production integrates offshore wind with green hydrogen technology. Addressing the technical coupling complexity and the impact of uncertain hydrogen prices, this paper develops a capacity optimization model. The model incorporates floating wind turbine output, the technical distinctions between alkaline (ALK) electrolyzers and proton exchange membrane (PEM) electrolyzers, and the synergy with energy storage. Under three hydrogen price scenarios, the results demonstrate that as the price increases from 26 CNY/kg to 30 CNY/kg, the optimal ALK capacity decreases from 2.92 MW to 0.29 MW, while the PEM capacity increases from 3.51 MW to 5.51 MW. Correspondingly, the system’s Net Present Value (NPV) exhibits an upward trend. To address the limitations of traditional methods in handling multi-dimensional benefit correlations and information ambiguity, a comprehensive benefit evaluation framework encompassing economic, technical, environmental, and social synergies was constructed. Sensitivity analysis indicates that the comprehensive benefit level falls within a relatively high-efficiency interval. The numerical characteristics, an entropy value of 3.29 and a hyper-entropy of 0.85, demonstrate compact result distribution and robust stability, validating the applicability and stability of the proposed offshore wind–hydrogen benefit assessment model.

1. Introduction

The global energy system is currently undergoing a transformative shift unprecedented in the past century. The increasingly evident environmental degradation caused by pollutants from fossil fuel consumption, coupled with escalating climate challenges such as global warming and extreme weather events, underscores the urgent need for a global transition towards green and low-carbon energy sources. Consequently, countries worldwide are prioritizing renewable energy as a cornerstone of their energy transformation strategies and actively exploring alternative energy solutions [1,2]. This urgency has accelerated the pace of the global energy transition and spurred extensive research into sustainable energy systems [3]. According to the report of the International Energy Agency (IEA), China remains the world’s largest emitter of carbon dioxide [4]. To fulfill commitments under the Paris Agreement and achieve the carbon peak and carbon neutrality announced in 2020, China is actively restructuring its energy mix, intensifying efforts to develop clean energy, and implementing a new national strategy for energy system development.
Among various renewable energy sources, wind power has been extensively developed globally due to its advantages of cleanliness, environmental friendliness, and resource abundance. Its deployment has expanded rapidly both nationally and internationally. As highlighted in the Energy Transitions Commission (ETC)’s 2025 report, wind-dominated power systems represent a critical pathway towards achieving carbon neutrality, exhibiting a life-cycle carbon intensity of less than 50 g CO2/kWh—merely 1/50th of that from fossil fuel-based systems [5]. Within this accelerated development of wind power, offshore wind energy presents distinct advantages: it minimizes interference with terrestrial activities and harnesses abundant maritime wind resources. Consequently, offshore wind farms can accommodate turbines of significantly higher capacity and larger dimensions, with fewer constraints related to size and noise pollution. These factors have established offshore wind power as a major development focus in the wind energy sector in recent years [6,7].
Hydrogen energy, recognized as a clean and efficient energy carrier, demonstrates substantial potential for both energy storage and fossil fuel substitution. Its combustion yields only water vapor, and it possesses an exceptional energy density of 142 MJ/kg—approximately 3.1 times that of gasoline (46 MJ/kg) and 2.6 times that of natural gas (54 MJ/kg) [8]. The integration of offshore wind power with hydrogen production generates green hydrogen while utilizing this clean electricity source. Offshore locations offer superior wind resource conditions, greater development potential, and fewer spatial and environmental constraints. Therefore, offshore wind-to-hydrogen production is emerging as a pivotal direction for future renewable energy development.
The life-cycle carbon emissions of offshore wind-to-hydrogen production are significantly lower than those of other energy sources. Studies based on the Life Cycle Assessment (LCA) methodology indicate that carbon emissions from offshore wind-to-hydrogen primarily originate from equipment manufacturing, installation, maintenance, and transportation processes while the operational phase contributes almost zero emissions. Research [9] highlights that by 2060, offshore wind power in China could reduce greenhouse gas emissions by 2.9–9.7 gigatons—equivalent to 6–20% of the current annual emissions from the global energy sector—playing a critical role in achieving carbon neutrality goals.
However, deep-sea wind–hydrogen projects face significant challenges in benefit assessment and risk analysis. Among these, the uncertainty surrounding hydrogen prices directly impacts project feasibility, scale, and the associated economic and technical viability [10]. To enable a more accurate evaluation of the comprehensive benefits of deep-sea wind-to-hydrogen systems, it is essential to incorporate potential construction plans under diverse hydrogen price scenarios and analyze corresponding changes in comprehensive benefits before the evaluation process begins.
The remainder of this paper is structured as follows. Section 2 details the system framework and methodology underpinning this paper. Section 3 proposes a capacity configuration model for deep-sea wind-to-hydrogen systems under hydrogen price uncertainty. Section 4 constitutes a comprehensive benefit evaluation model for these systems. Section 5 presents and discusses numerical experiments. Finally, Section 6 summarizes the key findings and contributions of this work.

2. Literature Review

In this section, we introduce the development status, capacity configuration, and comprehensive benefit evaluation of deep-sea wind-power hydrogen production.

2.1. Capacity Optimization

The intermittent and volatile nature of wind power generation poses a huge challenge to the power system’s consumption. The diversified use of hydrogen energy provides a new approach and method for solving the problem of wind power consumption, especially offshore wind power consumption. In order to solve the problem of offshore wind power consumption, it is necessary to configure a hydrogen production system with a reasonable capacity to enhance the local load of the wind farm and promote the consumption of wind power. However, most of the research on the capacity optimization of offshore wind-power hydrogen production systems is still in the early stages. The goal of capacity configuration optimization is mainly economic efficiency. Before optimizing capacity configuration, we should have a deep understanding of the economic calculation and analysis of deep-sea wind-power hydrogen production.
Recent research has systematically evaluated the techno-economic feasibility of offshore wind-powered hydrogen production. Reference [11] established a globally applicable LCOH framework and applied NPV analysis, projecting significant cost reductions by 2035. Reference [12] compared alkaline, PEM, and solid oxide electrolysis, indicating that ongoing technological advances will further improve feasibility. Reference [13] developed an integrated model assessing distributed, centralized, and onshore production strategies, concluding that distributed systems are more viable due to the avoidance of high-voltage DC cables and offshore substations.
In terms of optimization, Reference [14] introduced a capacity configuration model considering equipment costs, residual values, curtailment penalties, transport expenses, and environmental benefits, validated through wind data from Guangdong Province. Reference [15] expanded the analysis with a multi-level market optimization framework incorporating curtailment penalties and demand response costs to enhance efficiency and stability. Reference [16] explored off-grid and grid-connected scenarios using an improved NSGA-II algorithm, showing grid-connected systems to be more economical. Finally, Reference [17] proposed a two-stage multi-objective distributed robust optimization model that integrated electricity, carbon, hydrogen, and ancillary service markets, offering a comprehensive planning tool. On the basis of pursuing economy, it also ensures energy stability and user satisfaction and can handle uncertainty to avoid the problem of poor robustness. Reference [18] proposed a method for improving the efficiency of electrolyzer arrays based on segmented fuzzy control, constructed an optimal scheduling model for the wind–hydrogen system considering the efficiency of wind-power hydrogen production, and used the artificial bee colony algorithm to solve the optimal hydrogen production power. The effectiveness of the model was verified through sensitivity analysis and simulation analysis.
In view of the uncertainty of hydrogen prices, some papers use the degree of hydrogen price change as the optimization target for analysis. References [19,20] established a wind-power hydrogen production system model, studied the impact of electrolyzer power and hydrogen price on the payback period, and verified the economic feasibility of water-electrolysis hydrogen production. Reference [21] analyzed the demand for wind-power hydrogen production in Texas, the U.S., and studied the impact of the marginal electricity price and marginal hydrogen price on hydrogen production. Reference [22] conducted research on offshore wind power resources, optimized the scale and conducted technical and economic evaluations of offshore wind-power hydrogen production, established an opportunity constrained programming model for scale optimization, adopted information gap decision theory, took the maximum hydrogen price uncertainty as the upper target and the minimum acceptable NPV as the lower target, evaluated the acceptable hydrogen price range from the perspective of investors, and used random simulation particle swarm optimization to solve the model. Reference [23] proposed a two-level optimization model for a shared hybrid hydrogen energy storage system to jointly optimize capacity configuration decisions and pricing strategies. The upper layer determines the capacity and dynamic price of the hydrogen energy storage system to maximize profits while the lower layer obtains the optimal operation of the integrated energy system to minimize the total operating cost. The proposed model is solved by the improved PSO-GA algorithm and CPLEX solver.

2.2. Comprehensive Benefits

The social and environmental implications of offshore wind–hydrogen projects are gaining increasing attention. Studies have begun to evaluate job creation, energy security enhancement, and community impacts. Environmentally, Life Cycle Assessment (LCA) studies highlight significant CO2 reduction potential but also call attention to other impacts like marine ecosystem effects. However, a systematic framework integrating these socio-environmental metrics with techno-economic analysis for deep-sea systems is still lacking. Reference [24] designed and developed a new wind–solar hybrid hydrogen production system based on CPVT devices and wind turbines and evaluated the system’s performance from the perspectives of energy, energy, environment, and economy to ensure a comprehensive understanding of its feasibility and sustainability. Reference [25] developed a new TOPSIS evaluation model in the process of evaluating the risk of offshore wind-power hydrogen production. It used spherical fuzzy sets to consider the ambiguity and uncertainty of information in the evaluation process and the risk attitude of decision makers and combined these with CRITIC to objectively calculate weights. The reliability and optimization of the model were verified through sensitivity analysis and comparative analysis. Reference [26] used hierarchical analysis and fuzzy hierarchical analysis to analyze the cost-effectiveness of eight hydrogen production technologies but lacked a comprehensive evaluation of the entire system. Reference [27] established a standard system including economic, resource, environmental, and support conditions; introduced fuzzy elements to describe indicators; constructed a weighted model combining probabilistic linguistics–DEMATEL with the maximum deviation method to calculate the standard weights; and proposed a PROMETHEE method based on S-shaped utility to determine the best investment plan. Reference [28] proposed an improved fuzzy synthesis evaluation method based on cloud model to calculate the overall risk levels of wind, solar, and hydrogen storage projects and provided a Chinese case study to illustrate the validation of the proposed framework. Reference [29] provided a comprehensive review of the U.S. wind power market and discussed the development of offshore wind energy. The study examined factors including policy challenges, technological advancements, and economic conditions while also identifying barriers to the expansion of offshore wind power in the United States. Reference [30] employed a Monte Carlo–Markov chain simulation approach to analyze the availability and operational maintenance (O&M) costs of offshore wind-to-hydrogen systems. The study quantitatively assessed the impacts of factors such as downtime, failure rates, repair time, and maintenance personnel requirements on the system from an O&M perspective.
The selection of model methods for comprehensive benefit evaluation of deep-sea wind-power hydrogen production can refer to the model of wind-farm-site-selection decision-making. For example, in Reference [31], a comprehensive evaluation index system including economic, environmental, and social aspects was established for the comprehensive evaluation of wind farm site selection and an ideal-physical-element evaluation model and a grey-clustering evaluation model for wind farm site selection were proposed. Reference [32] established a comprehensive evaluation index system covering four aspects: economy, social impact, ecological environment, and natural resources, creatively integrated triangular intuitionistic fuzzy numbers into the index weight determination system, scientifically allocated weights, and combined these with the TODIM model to rank the alternative plans. The weight determination and comprehensive evaluation methods provided in the above literature can be used as references in comprehensive benefit evaluation research on deep-sea wind-power hydrogen production in this paper.
Therefore, in the current research on coping with the uncertainty of hydrogen prices, the impact of hydrogen price fluctuations on the economic efficiency of hydrogen production systems has been preliminarily explored through opportunity constrained programming, two-level optimization models, and dynamic pricing strategies, but several limitations persist.
Firstly, most existing studies have focused on single-electrolyzer configurations or fixed-capacity scenarios, failing to conduct granular co-design optimization for hybrid electrolyzer systems under dynamic hydrogen price conditions. Secondly, for emerging offshore wind–hydrogen systems, standardized multi-dimensional benefit assessment frameworks remain under-developed, with critical indicators inadequately incorporated. Consequently, future research must prioritize breakthroughs in establishing synergistic allocation mechanisms between diverse hydrogen price scenarios and hybrid electrolyzer capacity configurations. This necessitates holistically leveraging the rapid-response capability of PEM electrolyzers and the cost-efficiency of alkaline units to dynamically optimize capacity ratios and operational strategies. Concurrently, the integration of market variables—such as hydrogen trading platforms—is essential to achieve the dual objectives of price risk hedging and system profit maximization. Furthermore, it is imperative to develop multi-dimensional evaluation frameworks encompassing core metrics including energy efficiency, economic cost, carbon emission reduction benefits, and industrial chain synergy. We can draw on the hybrid evaluation paradigm of existing research; combine fuzzy mathematics, cloud models, and dynamic simulation technology; balance decision maker preferences and data objectivity through the subjective and objective weighted fusion method; and use multi-criteria decision-making models to process multi-source heterogeneous data, ultimately forming a full life cycle assessment framework that includes static benefit quantification and dynamic risk evolution.
In summary, this paper aims to consider various configuration schemes of deep-sea wind-power hydrogen production under different hydrogen price scenarios, and comprehensively evaluate the benefits of deep-sea wind-power hydrogen production systems based on the configuration results under different scenarios and the comprehensive consideration of multi-dimensional benefits. By optimizing the configuration and power of deep-sea wind-power hydrogen production systems under different hydrogen price scenarios, a more comprehensive evaluation object is provided for the comprehensive benefit evaluation of the full text, a reference for research and practice in related fields, and a basis for decision-making and investment, and the development of deep-sea wind-power hydrogen production projects and the realization of sustainable energy transformation are promoted.

3. Capacity Configuration Model

This paper constructs a system capacity configuration optimization model that takes into account the uncertainty of future hydrogen prices. The model takes the net present value of economic benefits as the objective function, considers the uncertainty scenarios of possible changes in hydrogen prices during the future construction period, and optimizes the capacity of alkaline electrolyzers and proton exchange membrane electrolyzers under different hydrogen price scenarios, as well as the capacity of electrochemical energy storage devices that need to be equipped, to ensure the adaptability of the configuration plan within the preset price change range.

3.1. Optimization Objectives

Considering the time value of cash flow over the entire life cycle of the project, taking the net present value of the deep-sea wind-power hydrogen production system as the optimization target, and comprehensively considering the system cost and benefits of the deep-sea wind-power hydrogen production project, the objective function is established. The formula is as follows:
max N P V = t = 1 T I H ( t ) C H O M C H r e + R 0 ( 1 + r ) t C invest  
where I H ( t ) is the hydrogen sales revenue of the deep-sea wind power C H O M hydrogen production system in the C H r e ; R 0 is the system residual value; C invest   is the initial investment cost of the deep-sea wind-power hydrogen production system; T is the deep-sea wind-power hydrogen production project cycle; r is the discount rate.
The cost of deep-sea wind-power hydrogen production system includes the construction and operation and maintenance costs of offshore wind farms, submarine cables, offshore converter stations and electrolyzers. All cost variables are scaled in units of 10,000 CNY (Chinese Yuan).
(1)
Initial investment cost:
C invest   = C farm   + C cable   + C con   + C st   + C p f + C alk   + C P E M + C omp + C ship
where C invest   is the total initial investment cost for the construction of wind-power hydrogen production system;   C farm   , C cable   , C con ,   C st   C p f , C alk   , C P E M , C omp , and C ship are the initial construction costs of offshore wind farms, submarine cables, offshore converter stations, electrochemical energy storage, offshore hydrogen production platforms, alkaline electrolyzers, proton exchange membrane electrolyzers, hydrogen compressors, and hydrogen transport ships, respectively.
(2)
System operation and maintenance costs:
C H O M = K farm   × C farm   + K cable   × C cable   + K con   × C con   + K p f × C p f + K alk   × C alk   + K P E M × C P E M + K b s t × C b s t + K o m p × C o m p + K s h i p × C s h i p
where C H O M is the operation and maintenance cost of a wind-power hydrogen production system project, ten thousand CNY; K farm   , K cable   , K con   , K p f , K alk   , K P E M , K b s t , and K o m p , K s h i p are the proportions of operation and maintenance costs of offshore wind farms, submarine cables, offshore converter stations, offshore hydrogen production platforms, alkaline electrolyzers, proton exchange membrane electrolyzers, electrochemical energy storage devices, hydrogen compression devices, and hydrogen transport ships, respectively.
(3)
Cost of replacing electrolytic cell:
During the project cycle, the electrolyzer needs to be replaced when its service life is shorter than the project operation cycle. The cost of each replacement is as follows:
C H r e = r a l k × Q a l k + r P E M × Q P E M
where r a l k is the unit replacement cost of alkaline electrolyzer; r P E M is the unit replacement cost of a proton exchange membrane electrolyzer; Q a l k and Q P E M are the configuration capacities of an alkaline electrolyzer and proton exchange membrane electrolyzer, kW, respectively.
(4)
Profits from deep-sea wind-power hydrogen production system:
The revenue of deep-sea wind-power hydrogen production system is the revenue from hydrogen sales, which is determined by the hydrogen price and the hydrogen production of the system.
The annual hydrogen production of the system is calculated as follows:
Q H = η a l k × P a l k , t × Δ t L a l k + η P E M × P P E M , t × Δ t L P E M
where Q H is the hydrogen production of deep-sea wind power system; η a l k   and η P E M are the working efficiency values of alkaline and PEM electrolyzers; P a l k , t   and P P E M , t   are the power values of the two electrolyzers; L a l k and L P E M are the electricity-to-hydrogen conversion coefficients of the electrolyzers.
The annual revenue from hydrogen sales is calculated as follows:
I H = Q H × P H
where I H is the hydrogen sales revenue of the wind-power hydrogen production system, CNY; P H is the hydrogen sales price, CNY/kg.

3.2. Constraints

(1)
Electrolyzer power constraints:
In order to ensure that the electrolyzer power remains in the optimal period during system operation, the electrolyzer power needs to be constrained. The constraint range is as follows:
P a l k , m i n P a l k , t P a l k , m a x
P P E M , m i n P P E M , t P P E M , m a x
where P alk , min , P alk , max , P PEM , min , and P PEM , max are the upper and lower power limits of the alkaline electrolyzer and proton exchange membrane electrolyzer, respectively, which limit the output range of the electrolyzer.
(2)
Wind power balance constraints:
P w , t + P bat _ d h , t P l o s s A V = P bat _ c h , t + P a l k , t + P P E M , t + P q f , t
where P w , t     is the total wind power at the t hour; P l o s s A V   is the submarine cable loss power; P a l k , t   and P pem , t   are the operating powers of the alkaline electrolyzer and proton exchange membrane electrolyzer at the t hour respectively; P bat _ c h , t and P bat _ d h , t are the charge and discharge powers of the electrochemical energy storage device at the t hour.
(3)
Capacity constraints of deep-sea wind-power hydrogen production systems:
The capacity of the alkaline electrolyzer, the capacity of the proton exchange membrane electrolyzer, and the capacity of the electrochemical energy storage device are decision variables and must meet the capacity constraints as shown below. The capacity of the electrolyzer must not exceed the maximum configuration capacity:
0 Q a l k Q a l k , m a x 0 Q P E M Q P E M , m a x 0 Q b s t Q b s t , m a x
where Q a l k and Q a l k , m a x are the capacity of the alkaline electrolyzer and its maximum value;   Q P E M and Q P E M , m a x   are the capacity of the proton exchange membrane electrolyzer and its maximum value; Q b s t and   Q b s t , m a x   are the capacity of the electrochemical energy storage device and its maximum value.
(4)
Power constraints of electrochemical energy storage:
S O C b s t , t = S O C bst , t 1 ( 1 ω b s t ) + P b a t _ c h × φ b s t P b a t _ d h / φ b s t S O C b s t m i n S O C b s t , t S O C b s t m a x
where P b a t _ c h and P b a t _ d h represent the charge and discharge power values of electrochemical energy storage, respectively; S O C b s t , t represents the charge state of electrochemical energy in storage at the t-th moment; φ b s t is the self-loss rate of electrochemical energy storage; P b a t _ c h is the charge and φ b s t the discharge efficiency of electrochemical energy storage; S O C b s t m i n and S O C b s t m a x represent the minimum and maximum charge states of electrochemical energy storage, respectively [33].
With regard to hydrogen utilization, it is generally acknowledged that distinct application scenarios may necessitate hydrogen to exist in alternative physical or chemical forms. Consequently, hydrogen is often subjected to conversion into carriers such as liquid hydrogen, liquid ammonia, liquid organic hydrogen carriers (LOHCs), or methanol. Through these conversion processes—whether chemical or physical—the storage density can be enhanced and the efficiency of large-scale transportation improved as hydrogen is transformed into states more suitable for handling, storage, and delivery.

4. Comprehensive Benefit Evaluation Model

In order to consider the comprehensive benefits of deep-sea wind-power hydrogen production systems more comprehensively and completely, this section establishes a comprehensive benefit index system. The indicators are based on four dimensions: economic benefits, technical benefits, environmental benefits, and social benefits. The capacity configuration results in Section 3 are used as the evaluation benchmark for deep-sea wind-power hydrogen production. The index weights are determined based on the combined weighting method under triangular fuzzy numbers, and a comprehensive benefit evaluation cloud model is constructed to analyze and evaluate the comprehensive benefits of deep-sea wind-power hydrogen production and the impact of indicators in each dimension on the comprehensive benefits.

4.1. Calculation of Comprehensive Benefit Evaluation Index Weights

The subjective weight determination method and the objective weight determination method are commonly used weight calculation methods in the field of multi-criteria decision-making. Considering the advantages and disadvantages of these two methods, this paper adopts the combination of SWARA method and entropy weight method to calculate the weights of the comprehensive benefit evaluation indicators of deep-sea wind-power hydrogen production.

4.1.1. Calculation of Subjective Weights of Indicators Based on Fuzzy SWARA Method

In an uncertain environment, the traditional SWARA method cannot completely collect decision makers’ evaluation information, resulting in information loss in the decision-making process. Therefore, this paper constructs a SWARA method based on triangular intuitionistic fuzzy numbers to solve this problem. The calculation steps are as follows:
Step 1: Collect the opinions of the expert committee on the ranking of the importance of the proposed indicators. The indicators should be arranged from the most important to the least important from top to bottom. At the same time, the importance of adjacent indicators can be equal.
Step 2: The expert committee re-evaluates the ranking results of the indicator importance. The experts use fuzzy language to evaluate the importance differences between adjacent indicators (such as “completely important” and “particularly important”) and convert them into triangular intuitionistic fuzzy numbers. The evaluation language used and its corresponding triangular intuitionistic fuzzy number are shown in Table 1.
Step 3: Starting from the second most important indicator, calculate the fuzzy importance ratio of each indicator relative to the previous indicator S j .
Step 4: Determine through fuzzy operation and calculate the fuzzy weight coefficient step by step K j . The calculation formula is as follows:
K j = ( 1,1 , 1 ) j = 1 S j K j 1 1 j 2
where is the fuzzy multiplication; K j 1 1 is the reciprocal of K j 1 .
Step 5: Calculate the subjective weight of the deep-sea wind-power hydrogen production evaluation index; the calculation formula is as follows:
ω j 1 = K j j = 1 n K j , j = 1,2 , 3 n

4.1.2. Calculation of Objective Weights of Indicators Based on Fuzzy Entropy Weight Method

In order to consider the uncertainty of hydrogen prices, this paper takes the configuration results of the deep-sea wind-power hydrogen production system in Section 3 as the evaluation object and establishes the entropy weight method based on triangular fuzzy numbers, and the objective weight calculation process of the comprehensive benefit evaluation index of deep-sea wind-power hydrogen production is as follows:
Step 1: Data preparation and standardization.
Assuming there are n indicators, c j the triangular fuzzy number of each indicator is x ~ j = a j , b j , c j , which represents the value of the indicator under different hydrogen price scenarios. The data is standardized to eliminate the dimension effect while retaining the fuzzy characteristics. The formula is as follows:
Profitable indicators:
Z jk = x j k min ( x j ) max ( x j ) min ( x j )
Cost indicators:
Z jk = max ( x j ) x j k max ( x j ) min ( x j )
Step 2: Calculate the fuzzy probability distribution.
The standardized triangular fuzzy number z ~ j = ( z j 1 , z j 2 , z j 3 ) is regarded as three independent sample points, and the probability distribution of each indicator is calculated. The calculation formula is as follows:
P j k = z j k j = 1 n k = 1 3 z j k k = 1 , 2 , 3
Step 3: Calculate the fuzzy entropy value of the indicator.
The fuzzy entropy value is used to measure the uncertainty of the indicator. The smaller the value, the greater the amount of information provided by the indicator. The calculation formula is as follows:
E j = 1 ln 3 k = 1 3 P j k ln P j k
Step 4: Calculate the objective weight of the indicator.
After normalizing the entropy value, the calculation weight is obtained, and the calculation formula is as follows:
ω j 2 = 1 E j j = 1 n 1 E j , j = 1,2 , , n

4.2. Construction of Comprehensive Benefit Evaluation Model for Deep-Sea Wind-Power Hydrogen Production

The cloud model is a mathematical model used to deal with uncertainty problems, mainly used for bidirectional conversion between qualitative and quantitative data. This paper will apply the cloud model to represent and deal with the uncertainty of qualitative concepts.
The cloud-model building steps are as follows:
(1)
Determine the rating level and evaluation criteria
The benefits of deep-sea wind-power hydrogen production can be divided into five intervals in the range of [0, 100] according to their benefit levels. Each interval corresponds to five levels: “low benefit”, “relatively low benefit”, “benchmark benefit”, “relatively high benefit”, and “high benefit”. The comment set can be determined according to the above-mentioned levels J = { I , II , III , IV , V } . i is the standard cloud digital eigenvalue corresponding to ( E x i , E n i , H e ) ; the comment set [ x i max , x i min ] is calculated as follows:
E x i = x i max + x i min / 2 E n i = x i max + x i min / 2 2 ln 2 H e = k
where x i m a x is the maximum value of the interval of the comment set i ; x i m i n is the minimum value of the interval k of the comment set; i is a constant, represents the degree of discreteness of the indicator data, can be adjusted according to the degree of fuzziness required by the evaluation object, and is taken as 0.5 here.
(2)
Determine the indicator evaluation cloud model
We collect questionnaires on expert evaluations of indicators; each column corresponds to an indicator and each row corresponds to an expert, and we obtain the evaluation matrix. Assuming there are n experts and m indicators, Z the dimension of the evaluation matrix is m × n . The evaluation matrix is expressed as follows:
Z = z 11 z 12 z 1 n z 21 z 22 z 2 n z m 1 z m 2 z m n
where Z i j represents the expert’s evaluation value i of the indicator j .
Then, the reverse cloud generator is used to calculate the numerical features of all expert scoring results under each indicator E x j , E n j , H e j . The calculation formula is as follows:
E x j = 1 n i = 1 n z i j E n j = π 2 × 1 n i = 1 n z i j E x j S j 2 = 1 n 1 i = 1 n z i j E x j 2 H e j = S j 2 E n j 2
where z i j represents the expert’s i evaluation value of S j 2 the indicator; j represents the sample variance.
(3)
Computing comprehensive evaluation cloud
The comprehensive evaluation cloud is determined by combining the indicator evaluation clouds at each level with the weights of each indicator. After determining the digital characteristics of the indicator cloud in the previous step, the digital characteristics of the comprehensive evaluation cloud can be calculated. The calculation formula is as shown in Formula (22). When the comprehensive evaluation cloud is compared with the evaluation standard cloud, the comprehensive evaluation result is more intuitive and clear.
E x = j = 1 n E x j w j E n = j = 1 n E n j 2 w j H e = j = 1 n H e j w j
where E x j , E n j , and H e j represents the digital characteristics of the secondary indicator cloud model; ω j represents the indicator weight corresponding to the secondary indicator.
(4)
Determine the evaluation results
When determining the results through the cloud model, it is necessary to calculate the cloud similarity between the comprehensive evaluation cloud and the standard clouds of each level. The greater the similarity is, the closer the efficiency level of deep-sea wind-power hydrogen production is to the evaluation level.

5. Numerical Experiments

According to data from the China Hydrogen Alliance, the price of hydrogen dropped to CNY 27.8/kg by January 2025. As the levelized cost of hydrogen production declines alongside fluctuations in the carbon market, hydrogen prices are expected to decrease further. As an emerging clean energy source, hydrogen currently operates in an immature market where price volatility is influenced by multiple complex factors. In the short term, hydrogen prices are primarily driven by production costs, fossil energy prices, and policy subsidies. However, in the long run, hydrogen end-use applications hold significant potential across the transportation, industrial, and building sectors. Total hydrogen demand is projected to grow annually, potentially reaching between 8328 and 14,196 tons by 2060 [34]. Should breakthroughs occur in end-use hydrogen technologies leading to rapidly increasing demand, hydrogen prices may rise in response to supply–demand dynamics. Consequently, the paper considers the uncertainty of hydrogen price fluctuations and sets three hydrogen price scenarios, as shown in Table 2. The relevant equipment parameters are shown in Table 3 [35,36,37,38,39,40].

5.1. Capacity Configuration Results

Considering different hydrogen price scenarios, MATLAB 2018a software was used for programming, and the model configuration results were solved by ceplx solver as shown in Table 4 and Figure 1. The configuration results include the capacity ratio of the alkaline electrolyzer and proton exchange membrane electrolyzer under three different hydrogen price scenarios. The changing trends of the capacity of the alkaline electrolyzer and PEM electrolyzer and the corresponding hydrogen production and net present value under three hydrogen price scenarios are shown in the figure. As the hydrogen price increases, the capacity of alkaline electrolyzer decreases while the capacity of PEM electrolyzer increases. This difference is mainly attributed to the higher unit capacity cost of the PEM electrolyzer than that of the alkaline electrolyzer. In the scenario of poor hydrogen prices, in order to make up for the loss of benefits caused by low hydrogen price, the proportion of the PEM electrolyzer can only be reduced. On the other hand, as the proportion of the PEM electrolyzer in mixed hydrogen production increases, the hydrogen production increases. This is because PEM has higher hydrogen production efficiency and stronger response ability to fluctuating wind power. The net present value of the objective function is reflected in the increase of hydrogen price. The net present value increases, which is due to the increase in hydrogen prices and the increase in hydrogen production.
As shown in Figure 1, as the hydrogen price rises from 26 CNY/kg to 30 CNY/kg, the optimal configuration capacity of the alkaline (ALK) electrolyzer significantly decreases from 2.92 MW to 0.29 MW, while the capacity of the proton exchange membrane (PEM) electrolyzer increases from 3.51 MW to 5.51 MW. This phenomenon can be attributed to the different technical and economic characteristics of the two types of electrolyzers: ALK electrolyzers have a lower cost per unit capacity and are the preferred choice to maintain economic efficiency in low-hydrogen-price scenarios; although PEM electrolyzers have a high investment cost, they have a fast response speed, high efficiency, and good operational flexibility. In high-hydrogen-price scenarios, they can bring higher marginal benefits by increasing the number of operating hours and producing more high-value hydrogen, thus becoming a better choice. This result verifies the dynamic optimization capability of the hybrid electrolyzer configuration model in coping with hydrogen price uncertainty.

5.2. Comprehensive Benefit Evaluation Results

The data in this section is based on the capacity configuration optimization scheme under different hydrogen price scenarios and specifically evaluates the comprehensive benefits of deep-sea wind-power hydrogen production. The collection of quantitative indicators is based on the capacity configuration results under different hydrogen price scenarios, and the data of quantitative indicators is calculated through the indicator formula in the previous article; the collection of qualitative indicators adopts the form of expert scoring. The expert group uses the correspondence between triangular fuzzy numbers and evaluation language to score the performance of deep-sea wind-power hydrogen production projects under various qualitative indicators, integrate the scoring results, and obtain the evaluation information on qualitative indicators. The overall indicator evaluation data is shown in Table 5. Before determining the subjective weight of the indicators, it is also necessary to collect and organize the relative importance of the indicators and convert the qualitative language into quantitative language. According to the SWARA method shown in the previous article, the expert’s evaluation information on the relative importance of 11 indicators, both quantitative and qualitative, is quantitatively converted according to the correspondence between the evaluation language of the relative importance of the indicators and the triangular fuzzy number. The conversion results are shown in Table 6.
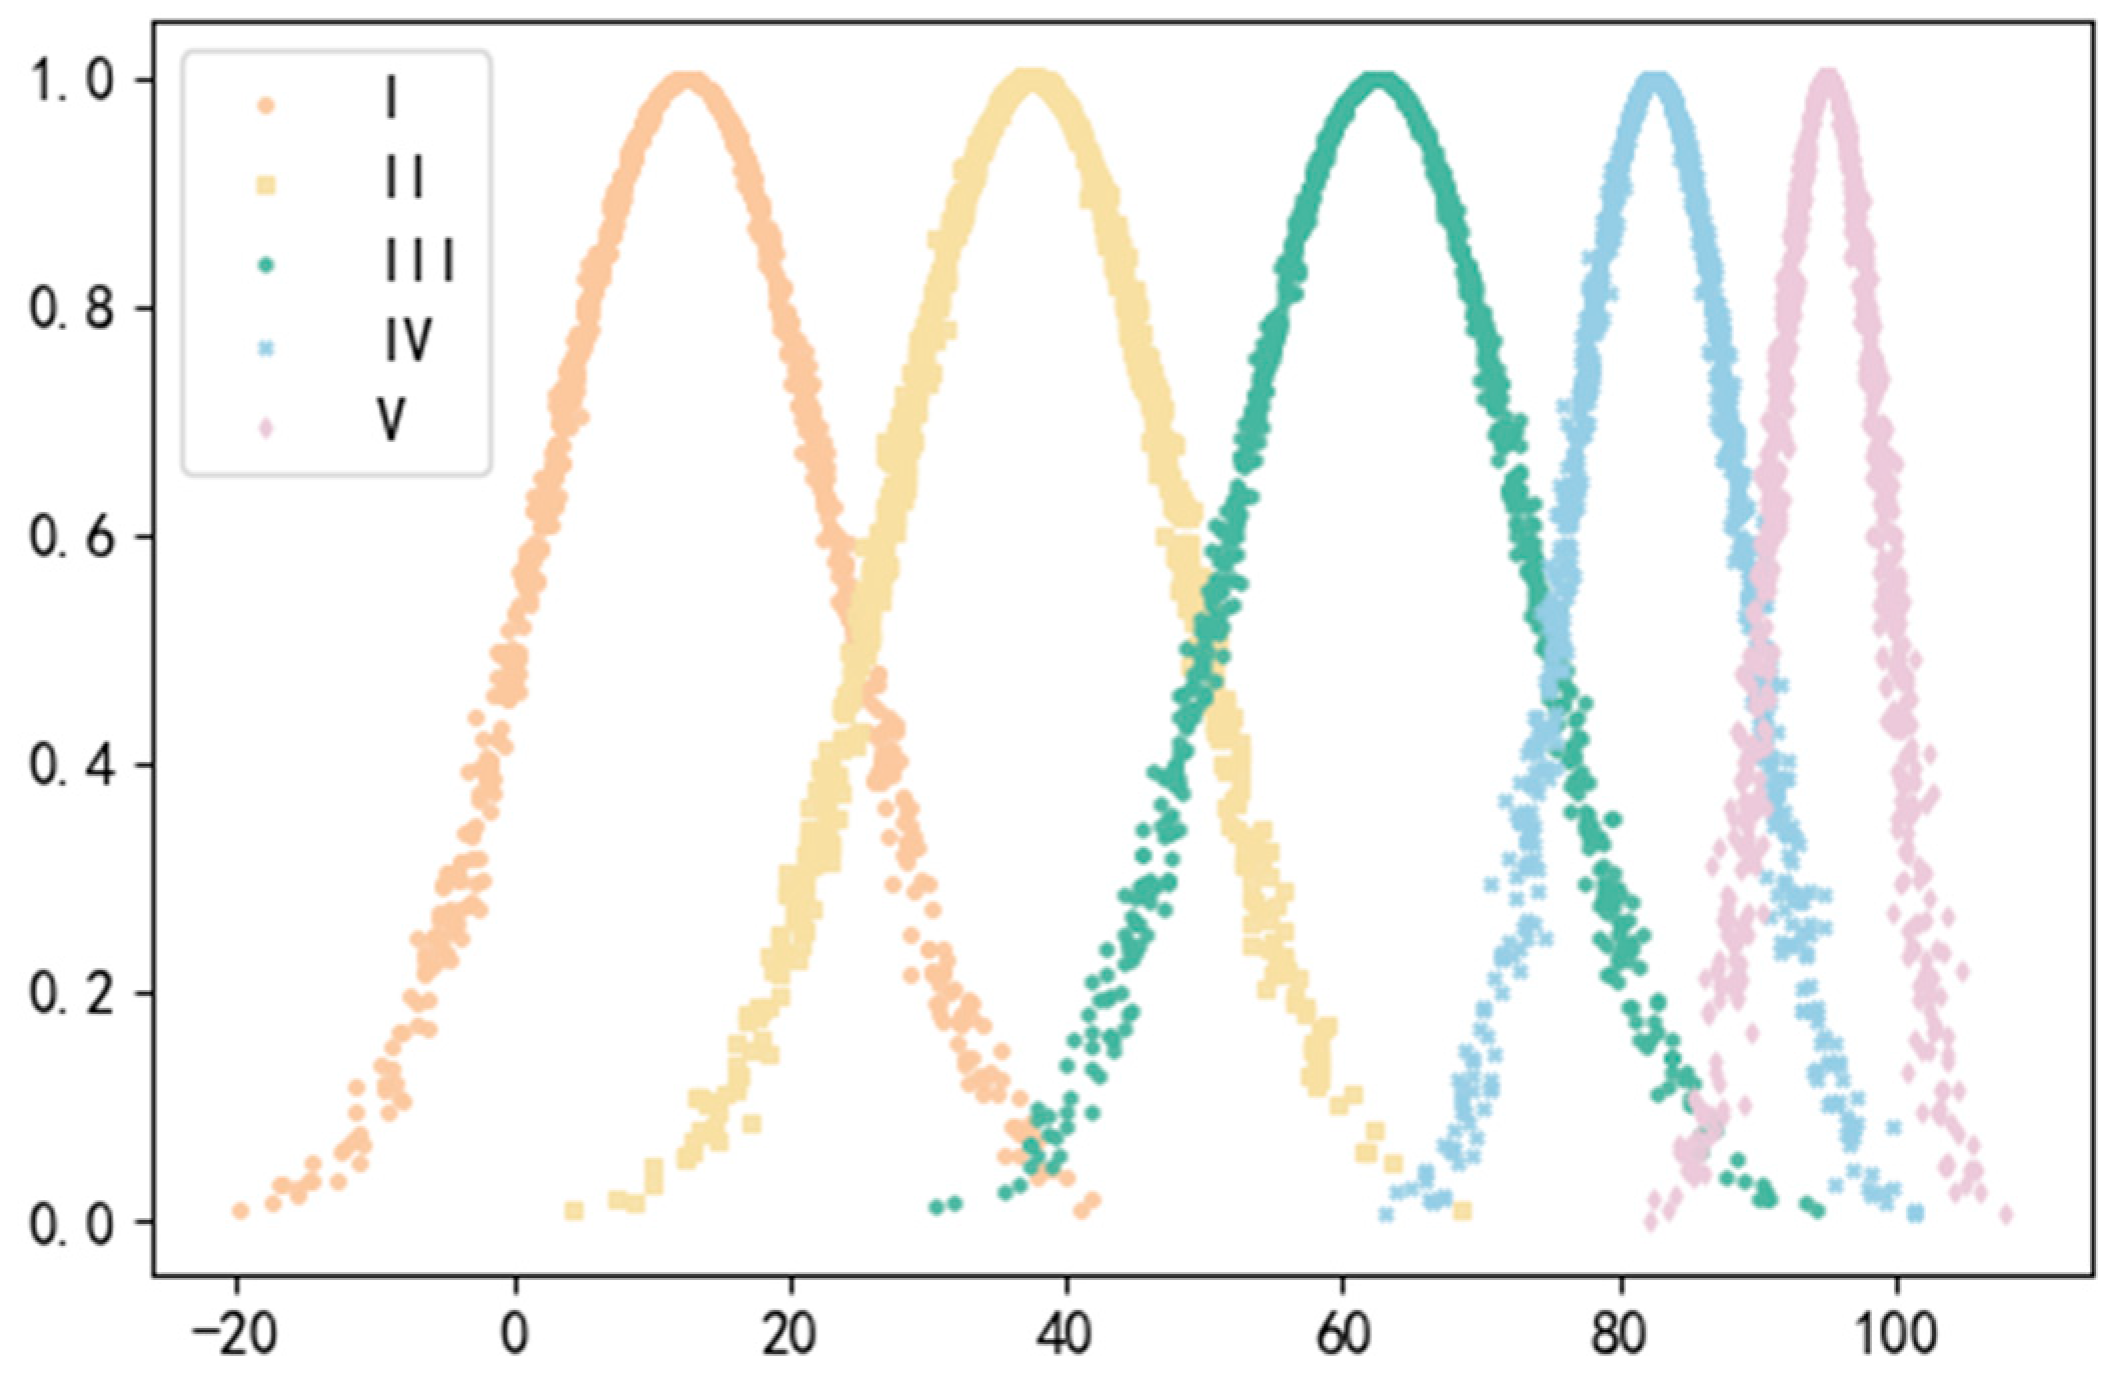
In order to describe the comprehensive benefit level of deep-sea wind-power hydrogen production, this paper has established five levels based on expert opinions and divided the comprehensive benefits of deep-sea wind-power hydrogen production into five levels: “low benefit”, “relatively low benefit”, “benchmark benefit”, “relatively high benefit”, and “high benefit”. The level division and numerical characteristics are shown in Table 7, and the comprehensive benefit evaluation standard cloud is shown in Figure 2.
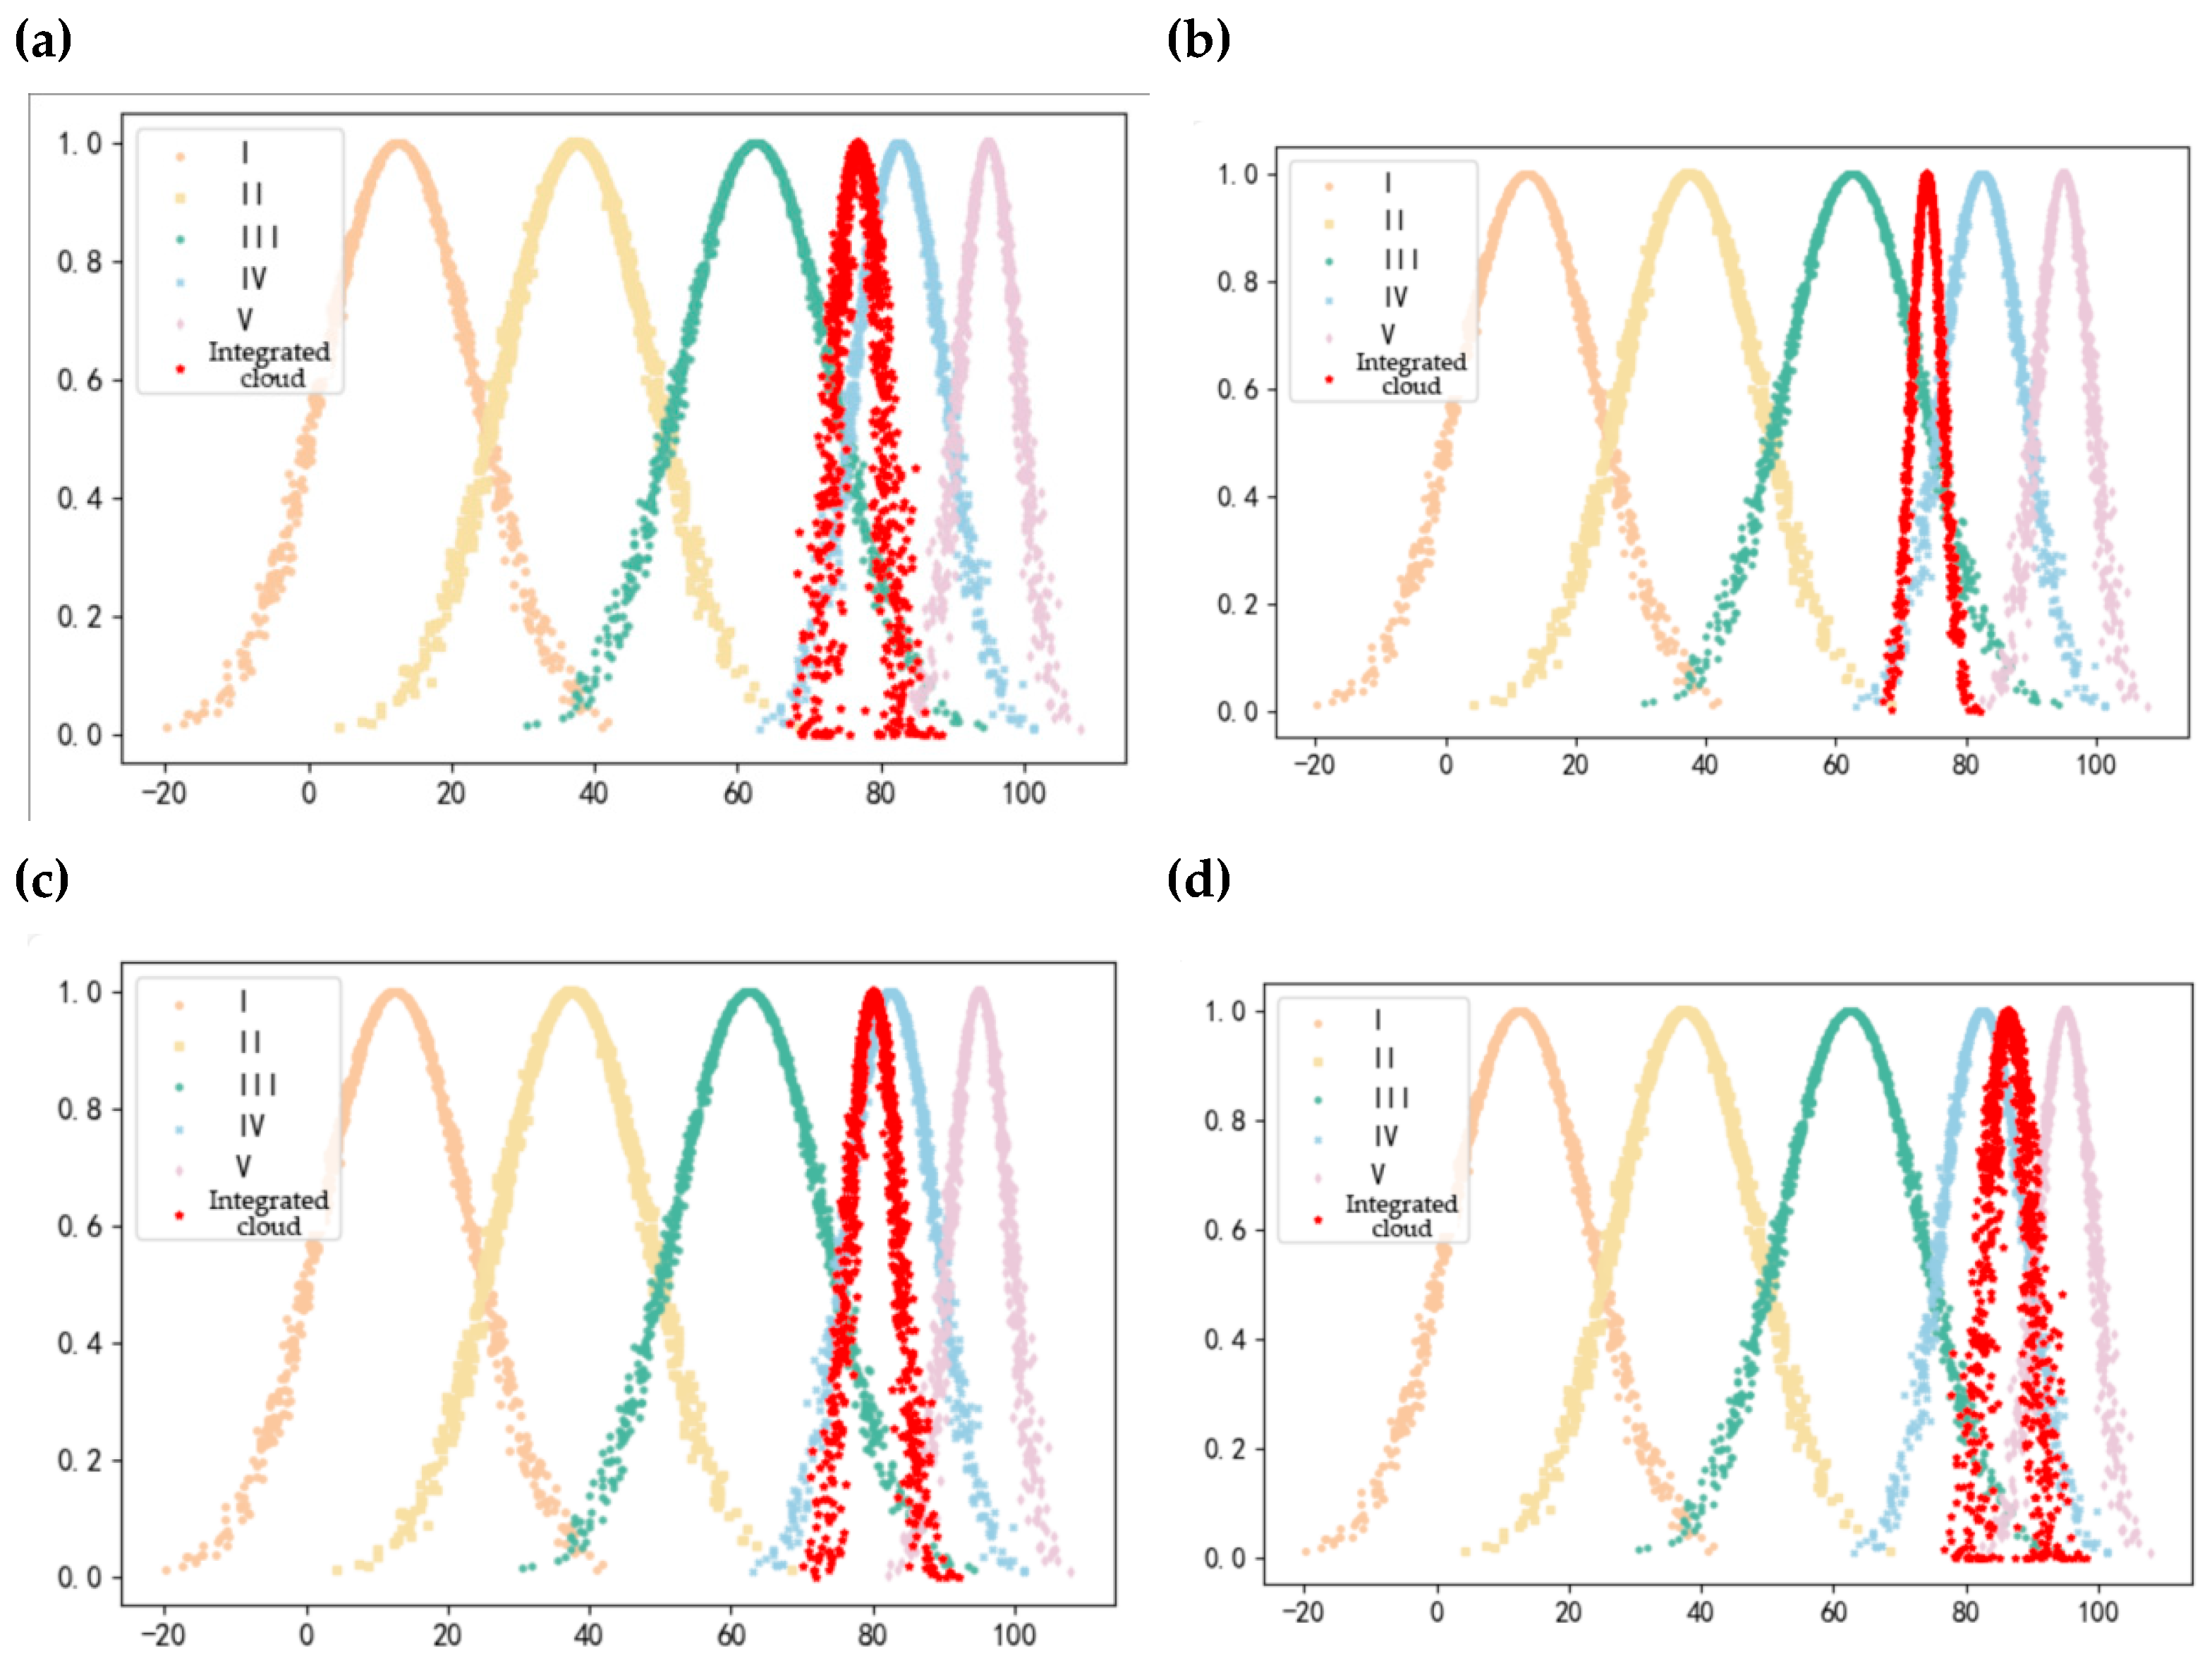
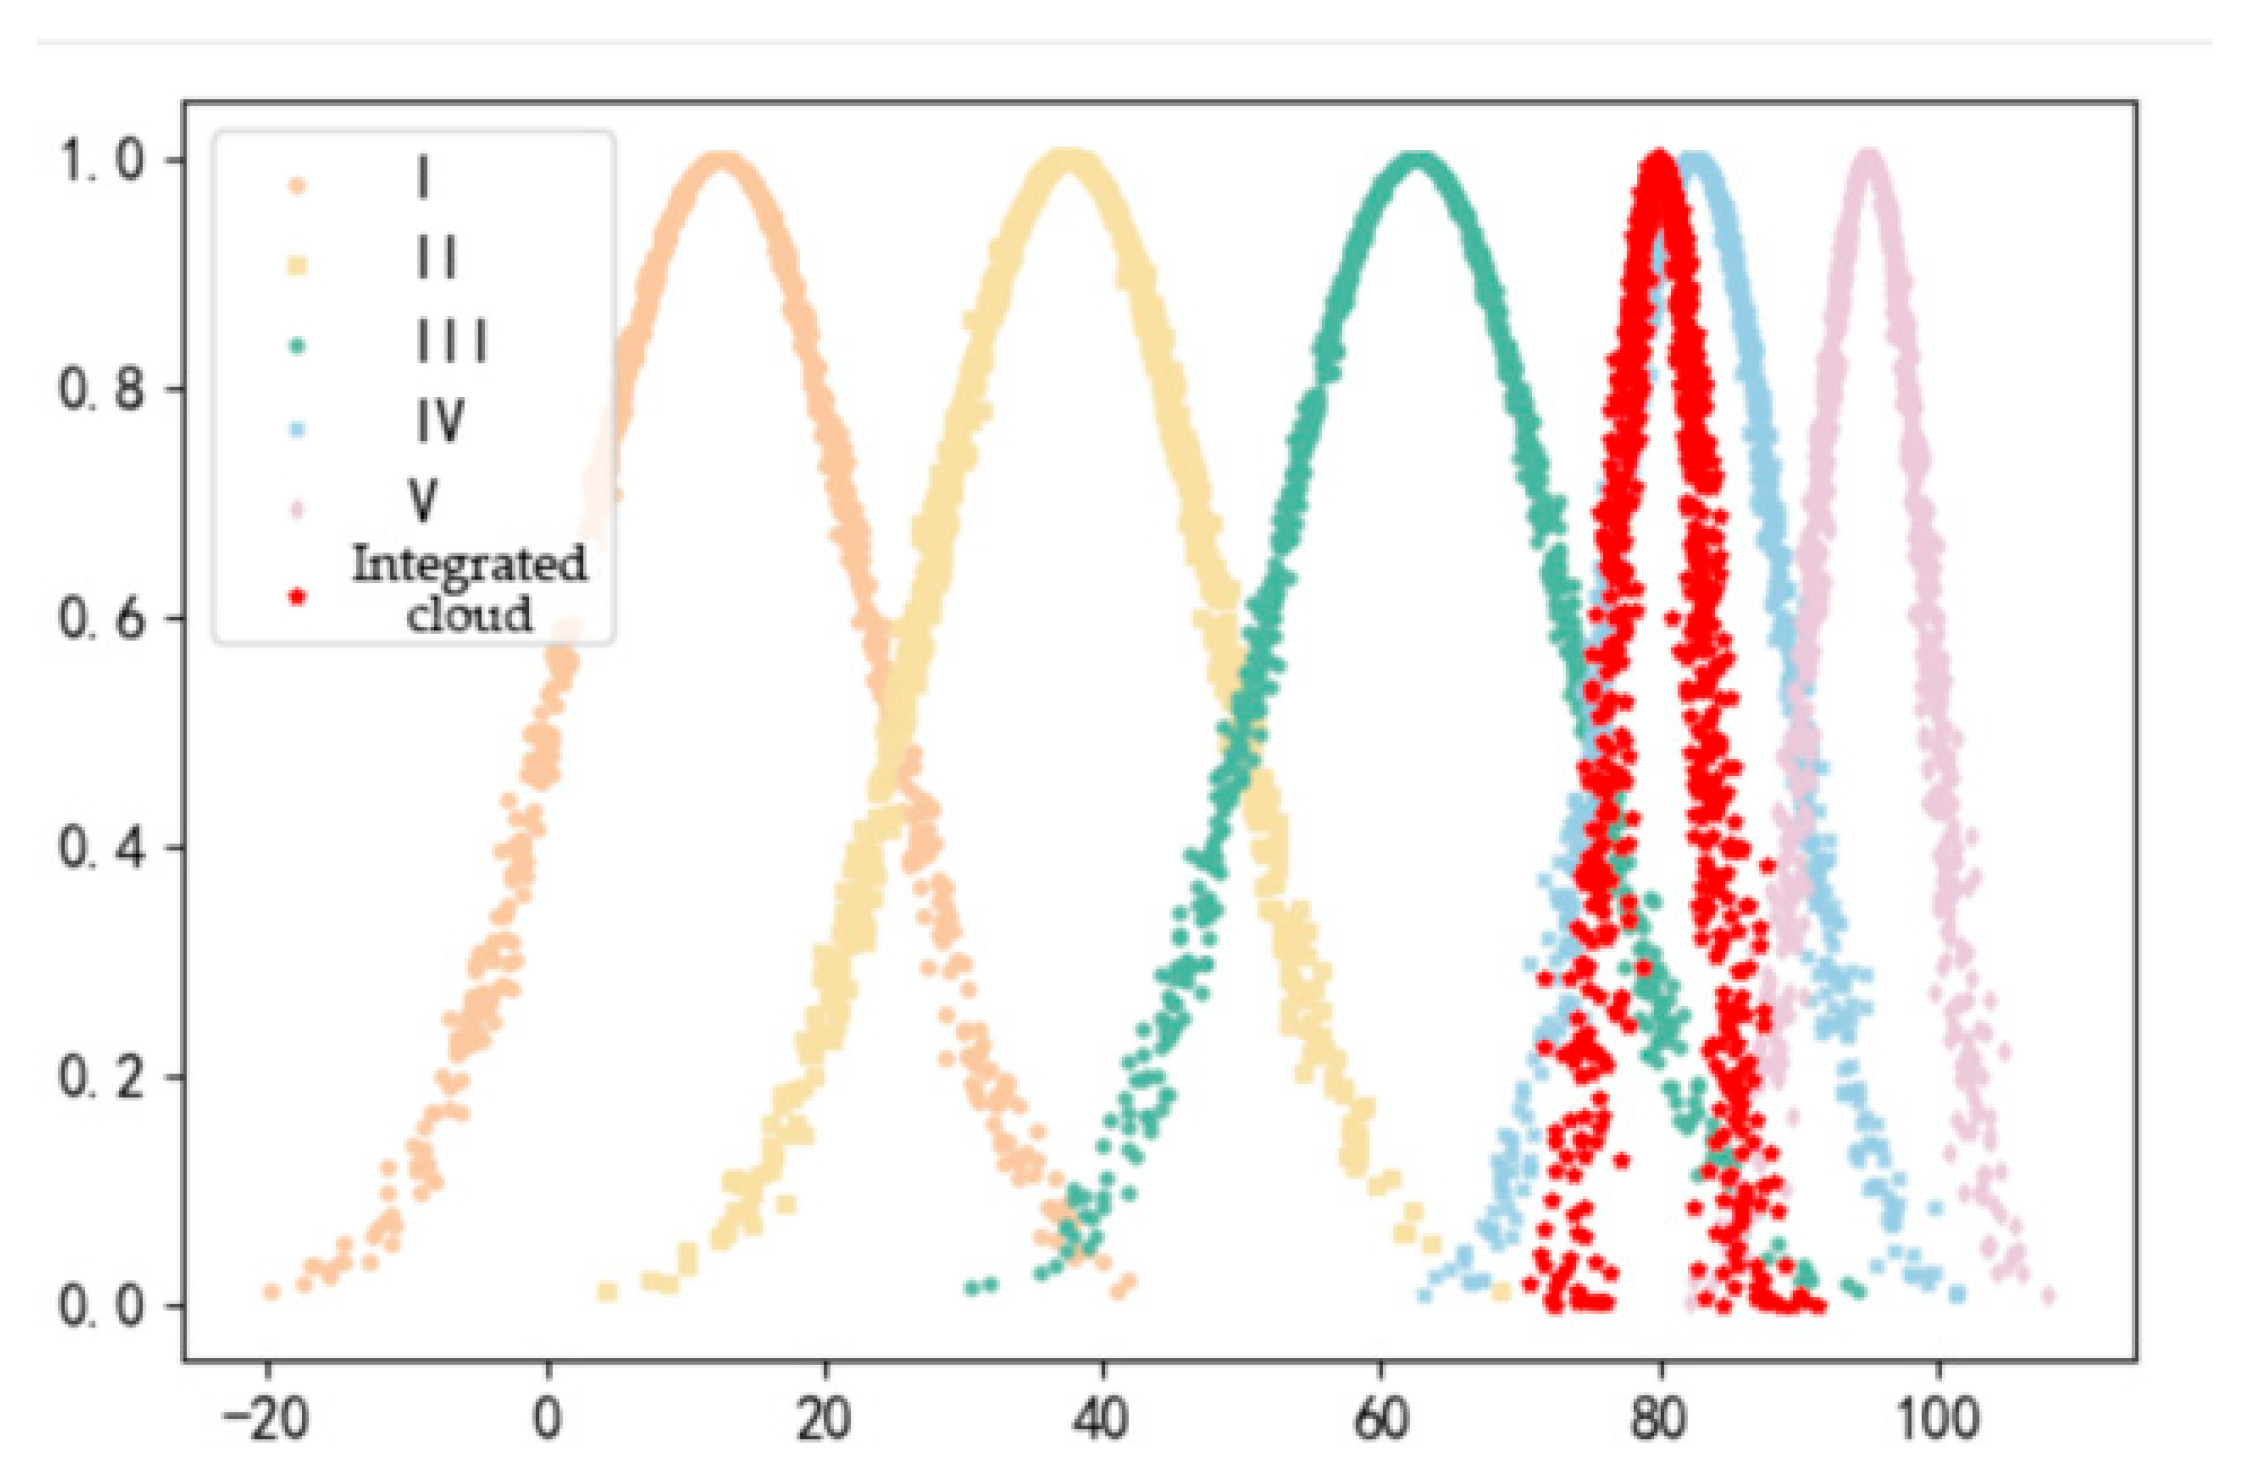
The indicator scoring data is solved using the reverse cloud generator to obtain the three cloud model digital features of indicators at all levels, as shown in Table 8. The comprehensive evaluation cloud and the comprehensive evaluation clouds of each first-level indicator are generated as shown in Figure 3 and Figure 4.
The integrated benefit evaluation results of deep-sea wind-power hydrogen production show that the digital characteristics of the overall system integrated benefit cloud model are (79.94, 3.29, 0.85). The similarity calculation results are shown in Table 9. The integrated benefit level belongs to the relatively high benefit range. The entropy value of 3.29 and the super entropy of 0.85 in the digital characteristics indicate that the evaluation results have a high degree of concentration and stability. Among the primary indicators, the social benefit performance is outstanding, reflecting the outstanding contribution of the project in social dimensions such as regional economic promotion, industrial coordinated development, and policy support. The technical benefit verifies the key supporting role of equipment performance to system benefits through the high scores of operating efficiency and the conversion level, but the benchmark benefit level of technical stability suggests that reliability optimization needs to be strengthened in actual operation.
The differentiation characteristics of the secondary indicators further reveal the performance level of the system: the net present value under economic benefits is close to the upper limit of “relatively high benefits” while the internal rate of return is slightly lower, indicating that the sustainability of long-term benefits may have potential fluctuations; the clean energy substitution rate in environmental benefits is better than the pollutant emission reduction, indicating that the technical path has a stronger effect on promoting the transformation of energy structure than the direct emission reduction capacity. It is worth noting that although the policy support under social benefits has a high score, its super entropy value and the super entropy of the first-level indicator C4 jointly point to the uncertainty of the evaluation results, which may be limited by the dynamic changes in policies or the limitations of quantitative methods.
In summary, deep-sea wind-power hydrogen production has shown a relatively high level of efficiency overall, and is above the benchmark benefits in economic, technical, environmental, and social dimensions. The multi-dimensional evaluation system established in this paper provides decision-making support with both robustness and adaptability for the deep integration of renewable energy and hydrogen energy industries.

5.3. Sensitivity Analysis

From the above calculation process, it can be seen that the weight of the evaluation index directly affects the evaluation result of the comprehensive benefit of deep-sea wind-power hydrogen production. However, in the actual comprehensive benefit evaluation, the weight determination process may produce certain inaccuracies due to errors in expert opinions or abnormal calculation of individual quantitative indicator data. Therefore, the sensitivity analysis of the weights of each indicator is crucial in the analysis of evaluation results. This section makes a small modification to the final combined weights of each indicator, observes the comprehensive benefit evaluation results after the weight modification, and compares and analyzes the degree of change and trend to verify the stability of the deep-sea wind-power hydrogen production comprehensive benefit evaluation model constructed above. At the same time, the sensitivity of the comprehensive benefit to each evaluation indicator is analyzed, and relevant suggestions are put forward. Based on the combined weights of the 11 evaluation indicators obtained above, each indicator weight is floated by ±10% and ±20%, and the weights of other indicators are adjusted so that the sum of all indicator weights is still equal to 1.
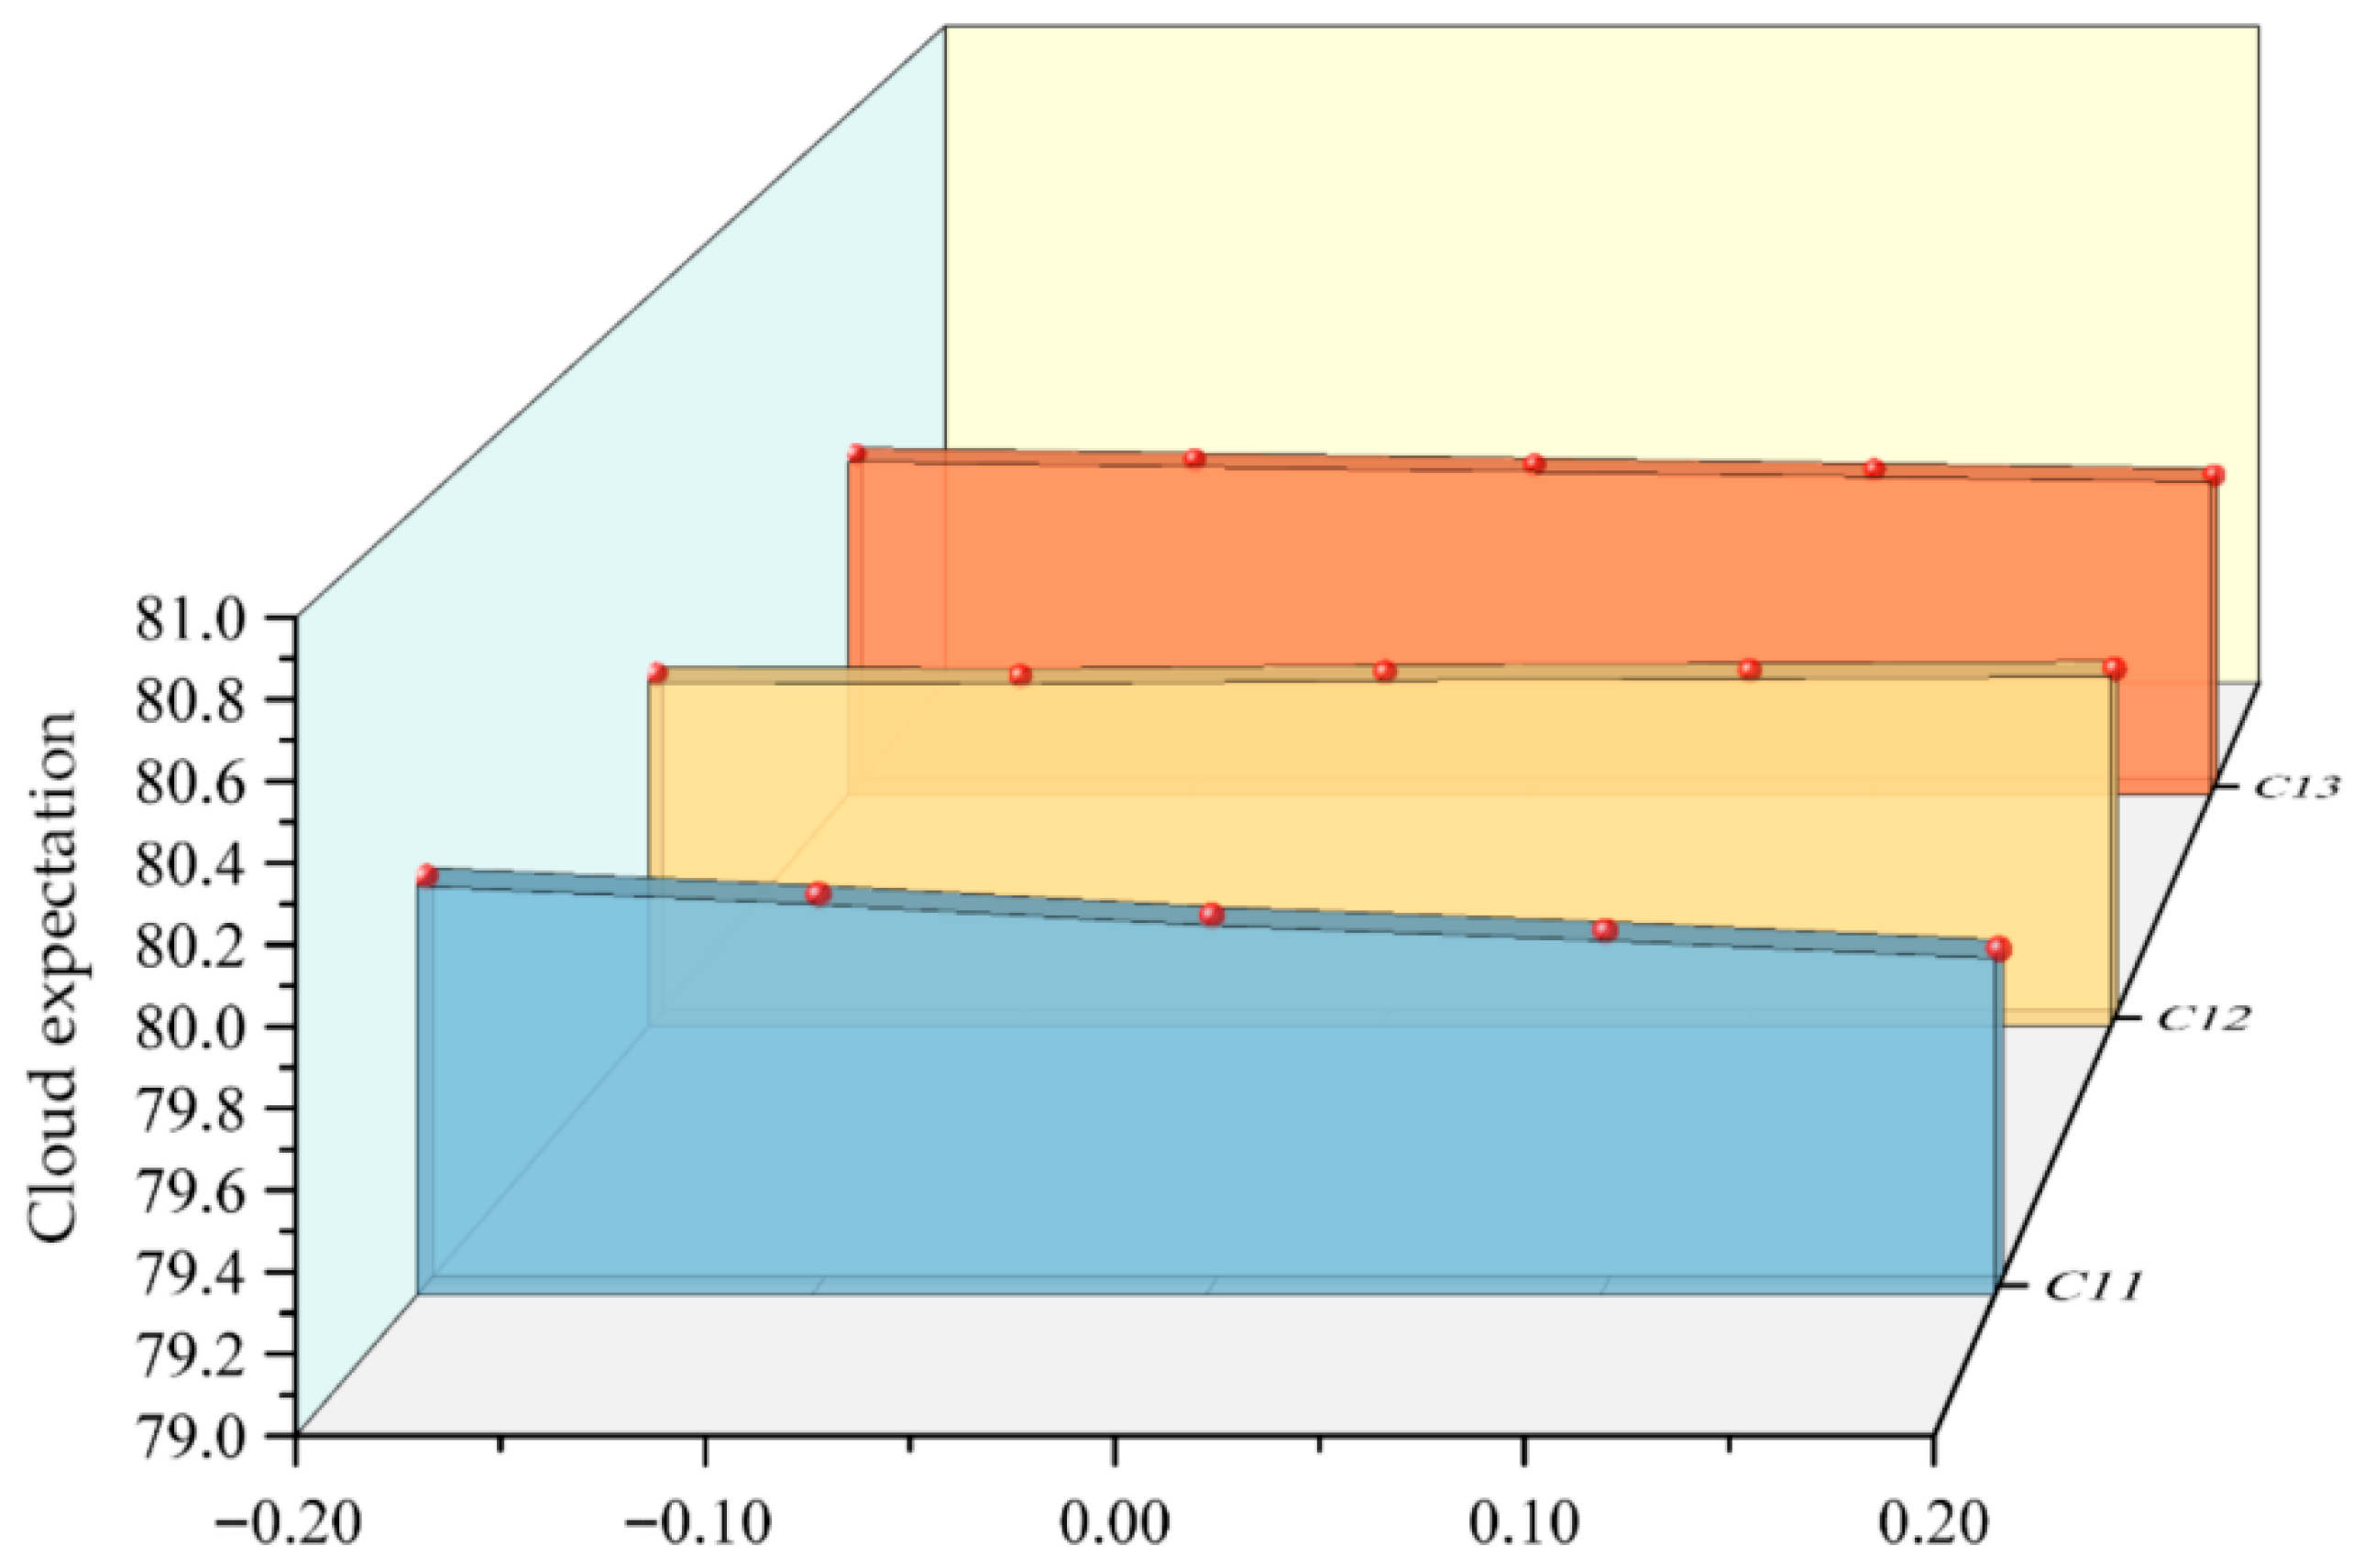
First, a weight sensitivity analysis of the economic benefit indicators is conducted. After adjusting the weights, respectively, the sensitivity analysis results are shown in Figure 5. As can be seen from Figure 5, when the weight of indicator C11 is adjusted, the comprehensive benefit score of deep-sea wind-power hydrogen production changes the most, which means that in the economic benefit dimension, the comprehensive benefit of deep-sea wind-power hydrogen production is most sensitive to indicator C11, i.e., the levelized cost of the hydrogen production system, and responds most to its changes, indicating that when the levelized cost of deep-sea wind-power hydrogen production is reduced, the comprehensive benefit of the system can be significantly improved. Therefore, if the relevant stakeholders want to improve the comprehensive benefits of the deep-sea wind-power hydrogen production system, they should focus on the study of the levelized cost of hydrogen production. In addition, when the weight of the economic indicators is slightly adjusted, the comprehensive benefit evaluation results do not change, indicating that the constructed rating model has a certain stability.
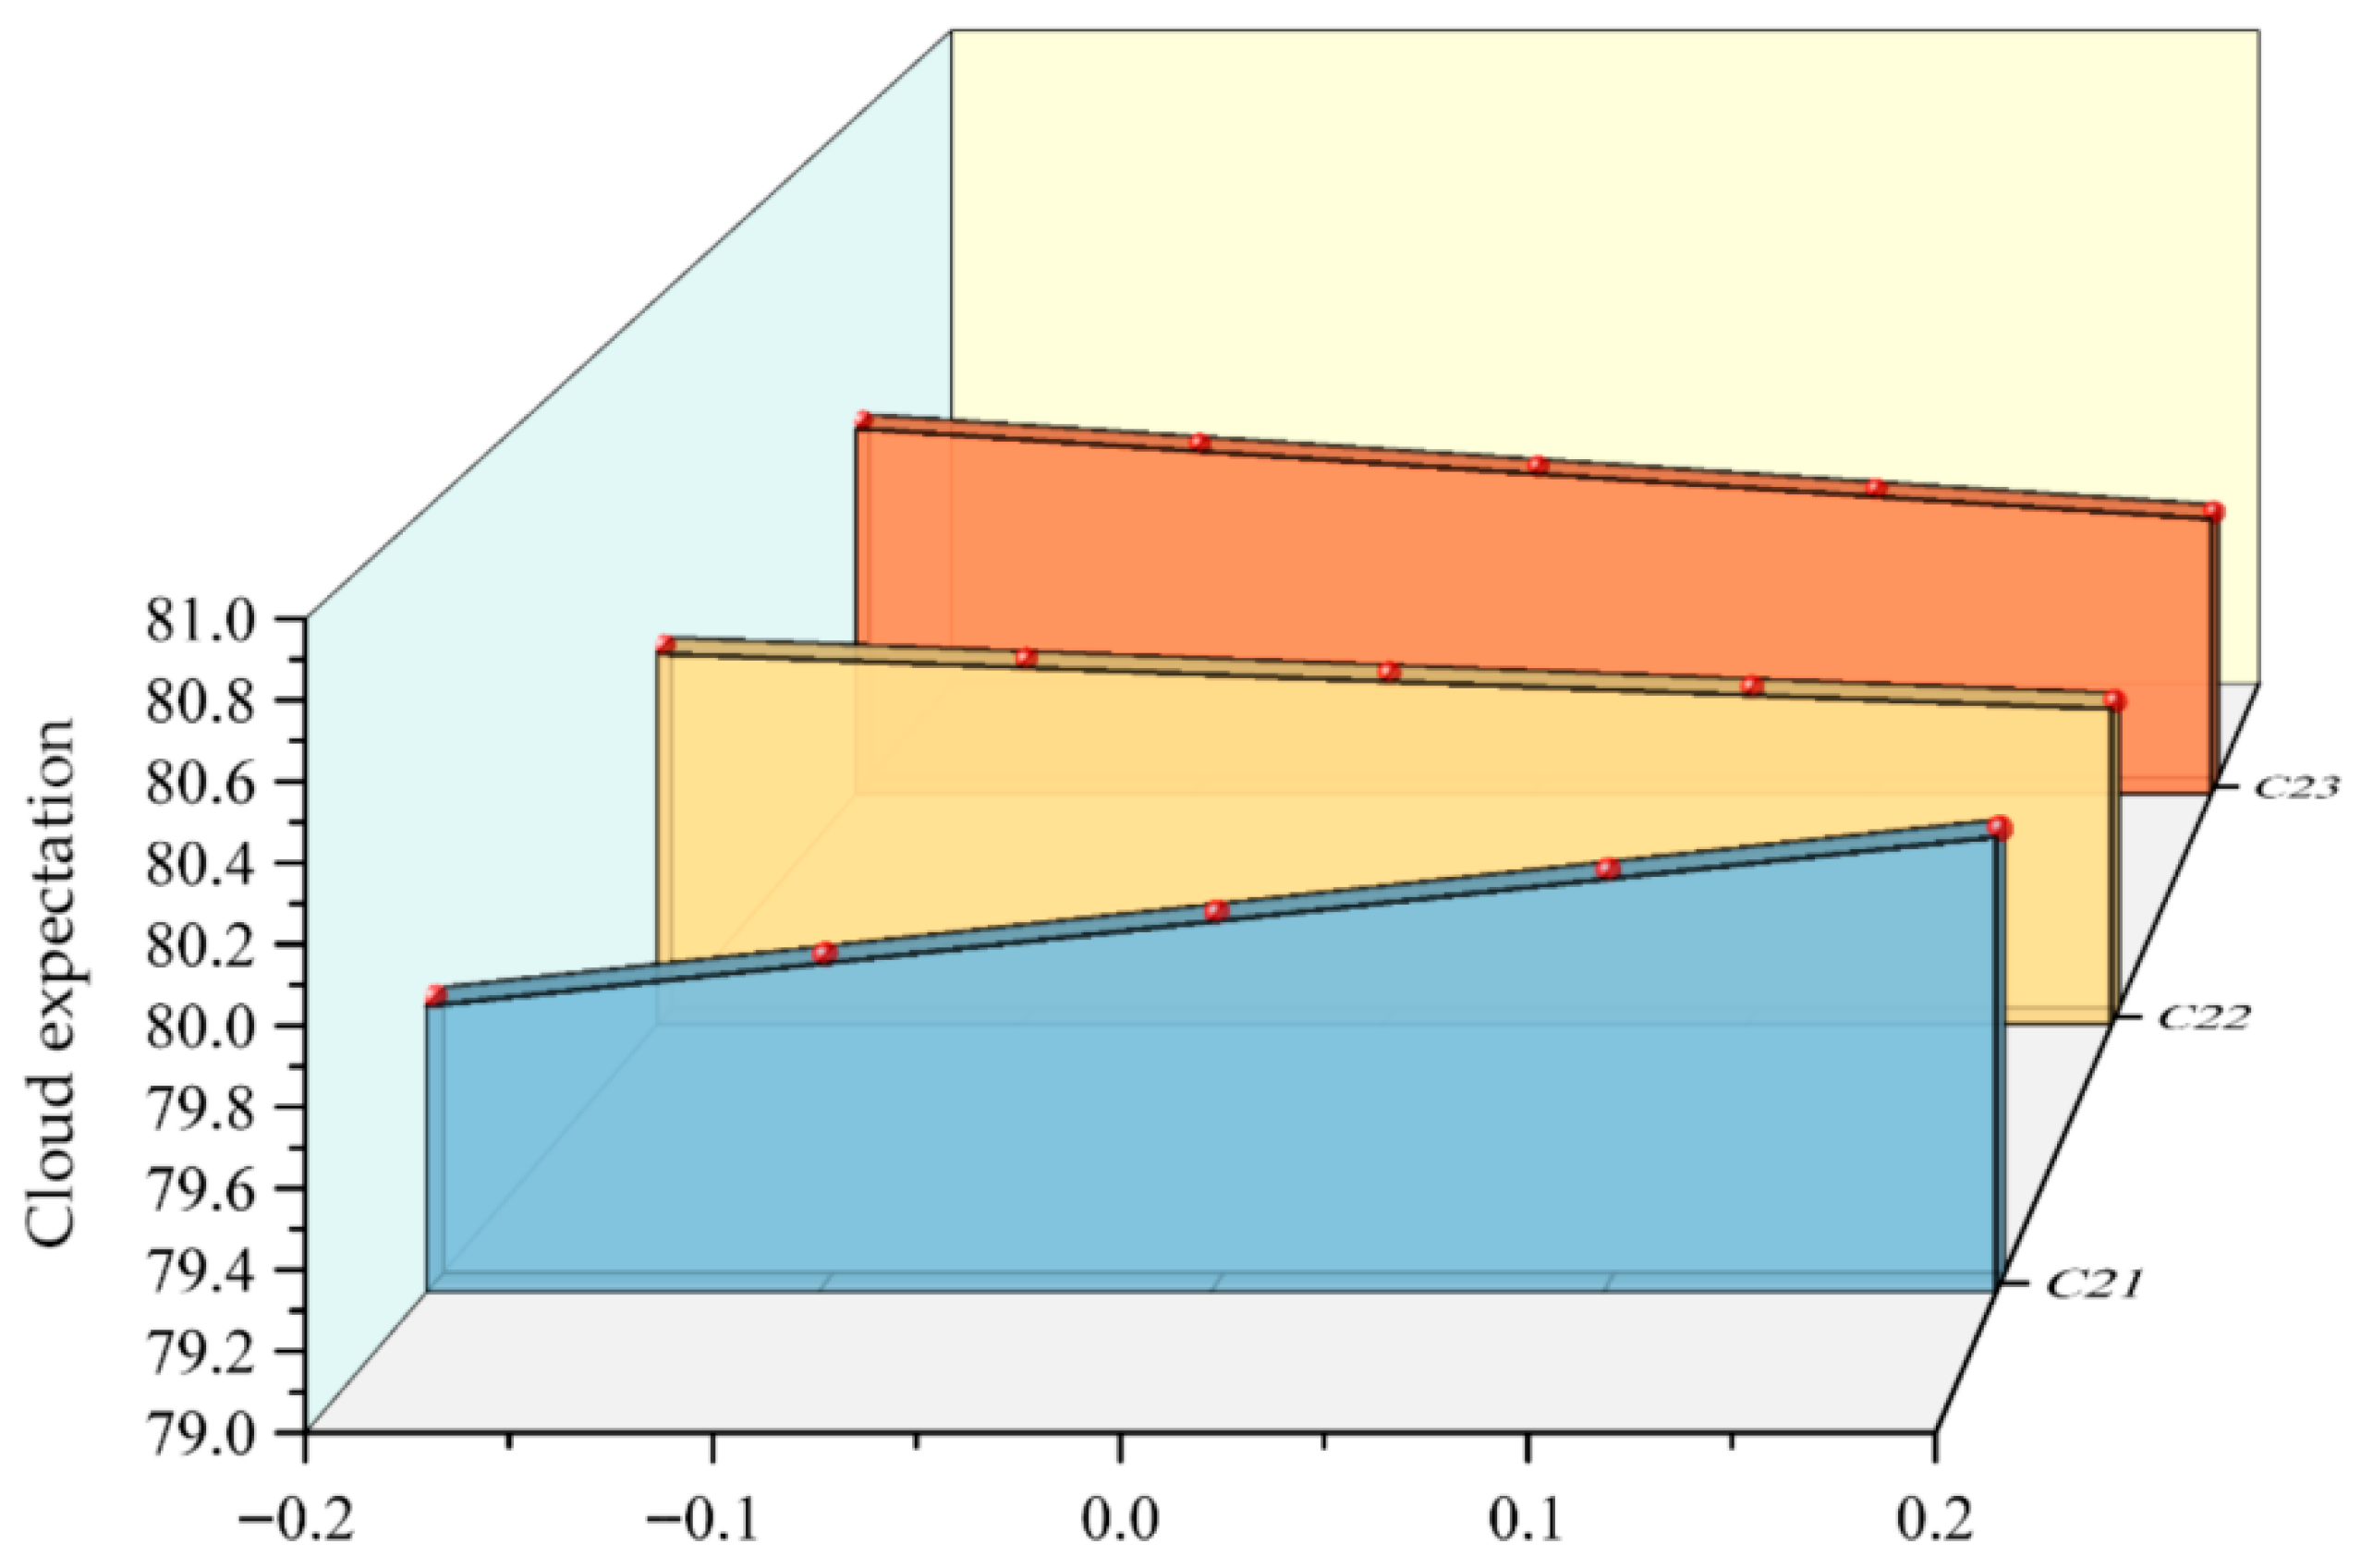
Secondly, the sensitivity analysis of the indicator weights was carried out on the technical benefit dimension, and the results of the sensitivity analysis of each technical benefit indicator are shown in Figure 6. Observing Figure 6, the sensitivity of C21 system operation efficiency, the C22 system conversion level, and C23 system technical stability to the comprehensive benefit evaluation results showed significant differences. When the weight of C21 shifted positively, the comprehensive benefit score of the deep-sea wind-power hydrogen production system showed an upward trend due to the good system operation efficiency; on the contrary, the increase in the weights of C22 and C23 would reduce the score of the comprehensive benefit. The weight adjustment of C22 was less sensitive to the comprehensive benefit score of deep-sea wind-power hydrogen production, and the fluctuation range was always lower than 0.05, indicating that the marginal contribution of the system conversion level to the comprehensive benefit tended to be stable under the existing technical conditions. It is worth noting that the change in the weights of each technical benefit indicator did not change the evaluation result level of the comprehensive benefit of deep-sea wind-power hydrogen production but revealed the dynamic game relationship between the system operation efficiency and the system conversion level and system stability, which provided a basis for the elastic optimization of the technical path of the deep-sea wind-power hydrogen production system.
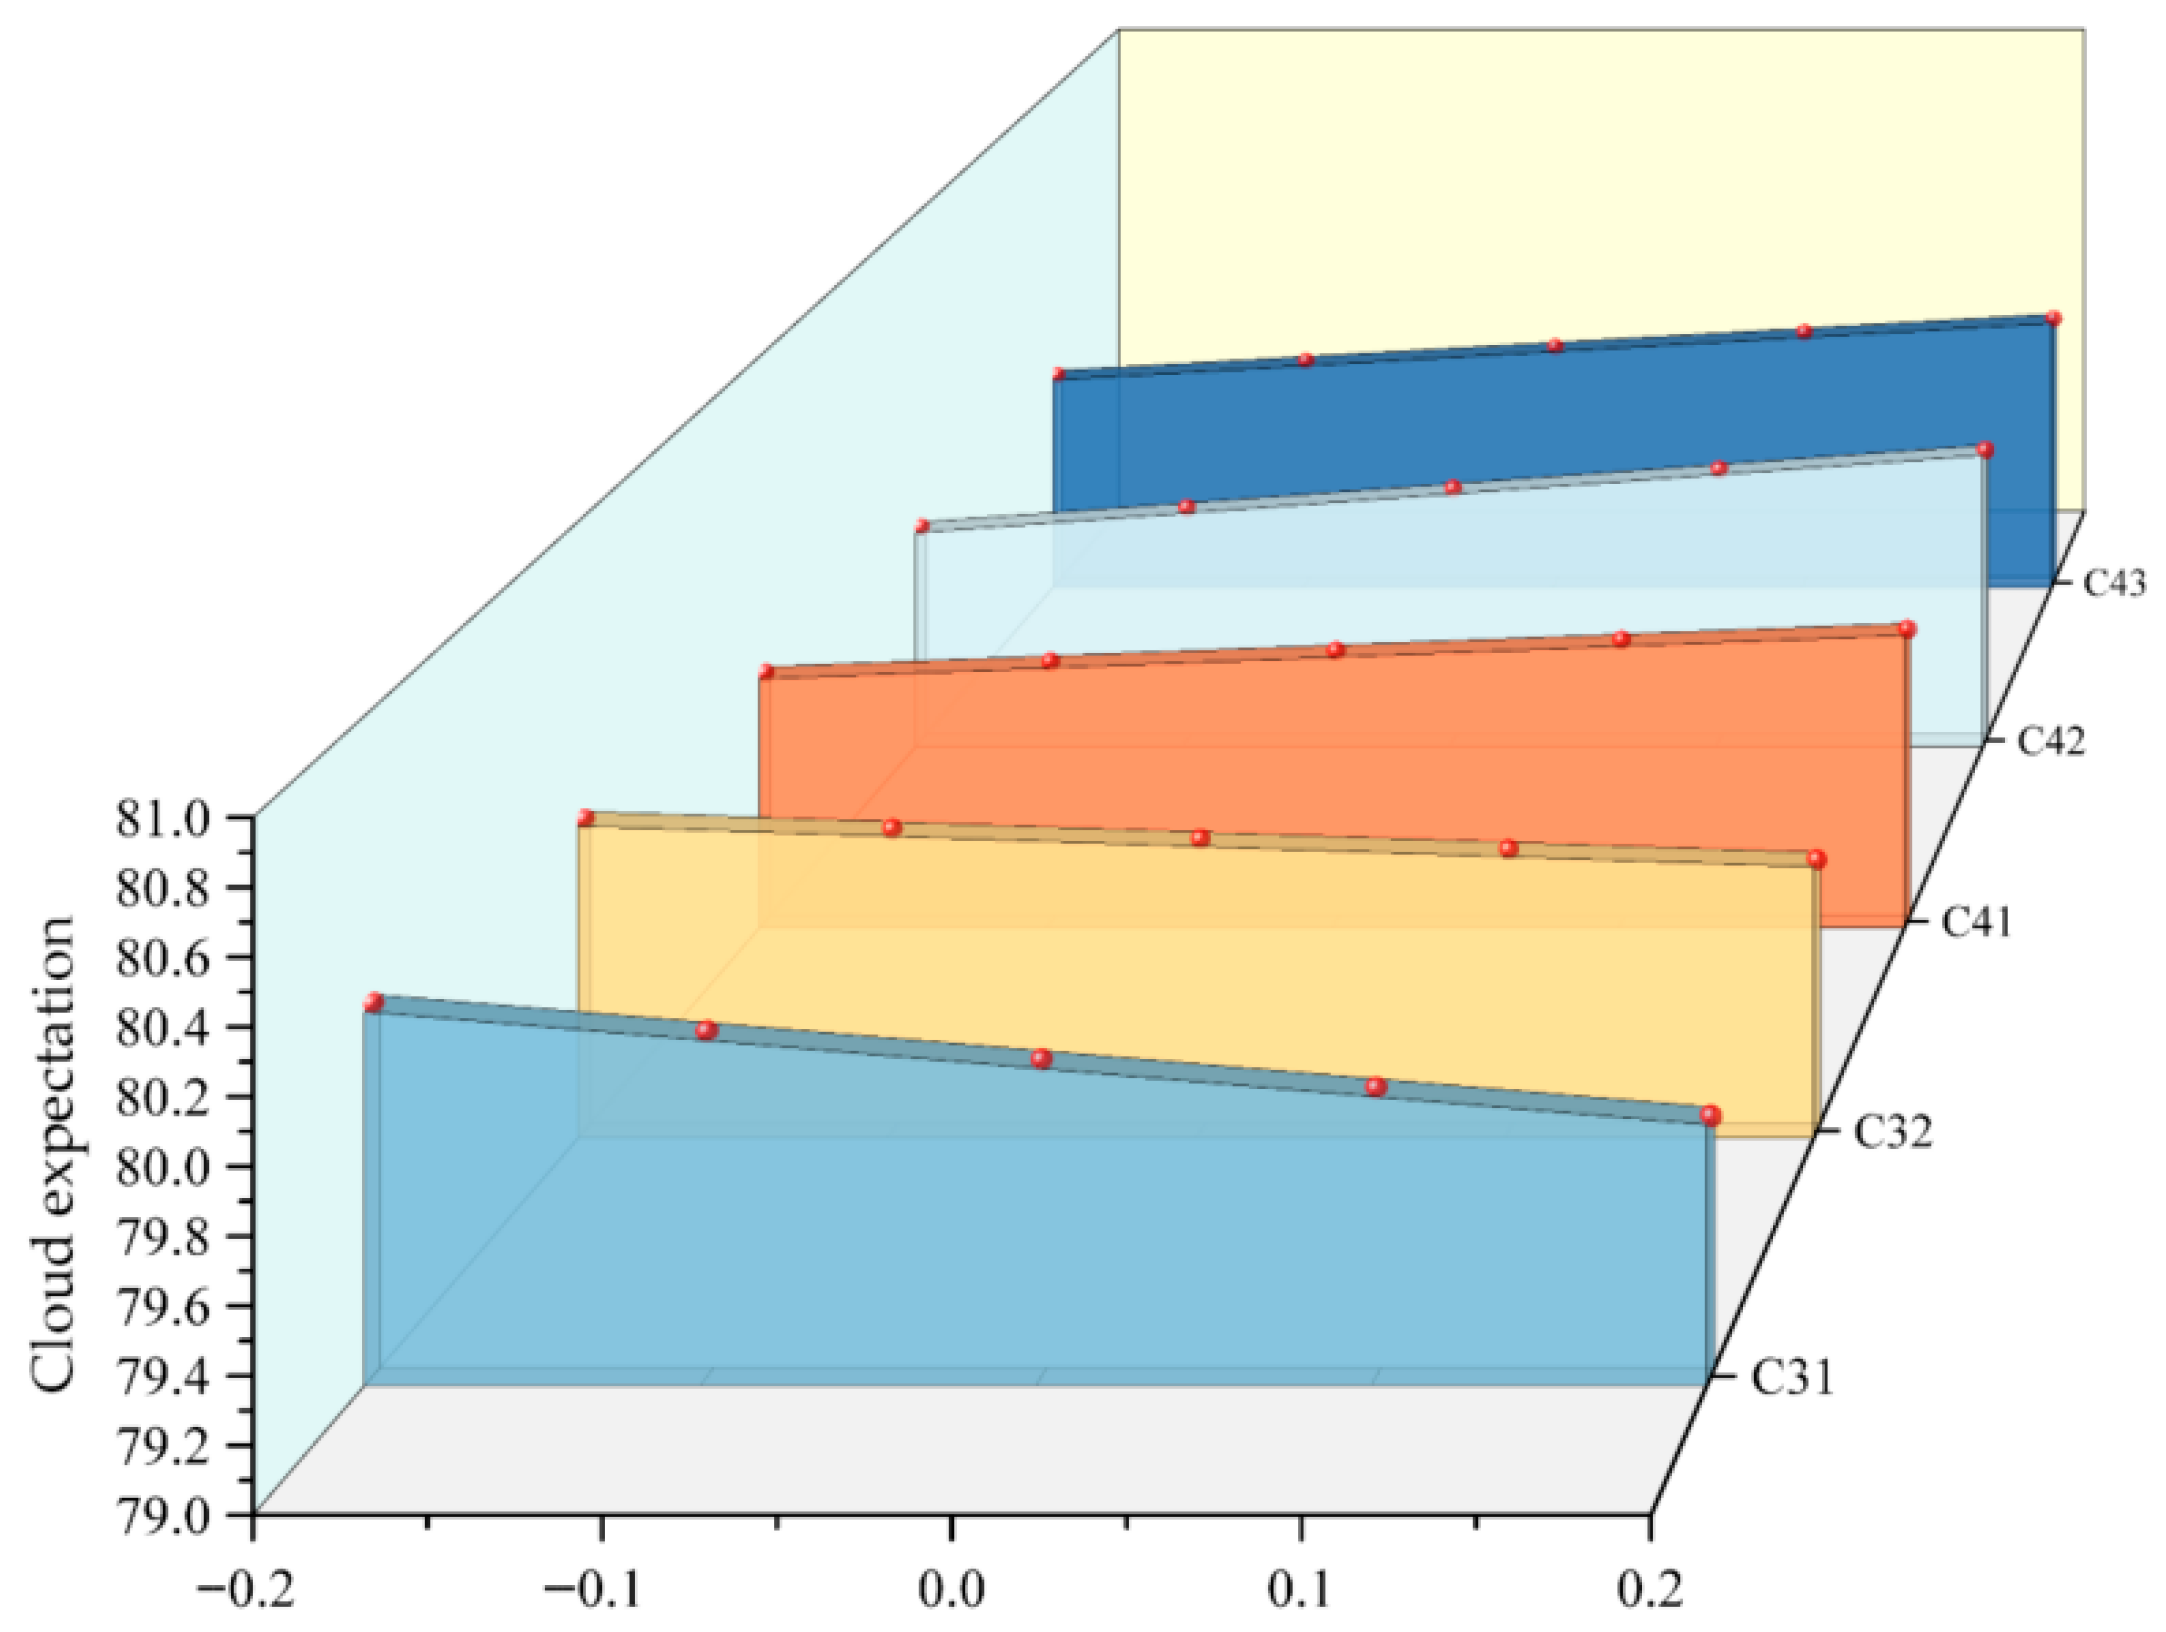
Finally, the sensitivity analysis of the indicator weights was carried out on the environmental benefit dimension and the social benefit dimension, and the analysis results are shown in Figure 7. As can be seen from Figure 7, C31 (pollutant emission reduction) and C42 (promoting the development of related industries) are most sensitive to changes in the comprehensive benefit score, and the cloud expectation value changes significantly. When the weight of the environmental benefit indicator increases, the cloud expectation value of the comprehensive benefit evaluation of deep-sea wind-power hydrogen production decreases, indicating that there is still room for improvement in the system performance in terms of environmental benefits, and its low-carbon characteristics have not been fully exerted; when the weight of the social benefit indicator increases, the cloud expectation value of the comprehensive benefit evaluation increases, indicating that the deep-sea wind-power hydrogen production project performs well in the social benefit dimension. Among them, the two indicators C32 (clean energy substitution rate) and C41 (regional economic driving effect) are less sensitive to the comprehensive benefit evaluation of deep-sea wind-power hydrogen production, indicating that the marginal impact of clean energy substitution rate and regional economic driving effect on comprehensive benefits is low, but at the same time, the weight changes of environmental benefit indicators and social benefit indicators within a certain range do not affect the grade results of the comprehensive evaluation of deep-sea wind-power hydrogen production projects.

6. Conclusions

This paper aims to solve the problem of dynamic evaluation of the comprehensive benefits of deep-sea wind-power hydrogen production systems under the uncertainty of hydrogen prices and has constructed a multi-scenario driven capacity configuration optimization and multi-dimensional benefit coupling analysis framework. By analyzing the technical complementarity of alkaline electrolyzers and proton exchange membrane electrolyzers, a dynamic response mechanism under the hybrid hydrogen production mode has been proposed; the subjective and objective combined weighting method and cloud model evaluation technology have been integrated to break through the bottleneck of insufficient quantification of fuzzy information in traditional evaluation; a four-dimensional evaluation system covering economy, technology, environment, and society has been established to achieve the accurate transmission of hydrogen price fluctuation risks to comprehensive benefit values. The following main conclusions are drawn.
A multi-scenario-driven capacity optimization and multi-dimensional benefit coupling analysis framework was constructed. By analyzing the technical complementarity between alkaline (ALK) and proton exchange membrane (PEM) electrolyzers, a dynamic response mechanism under a hybrid hydrogen production mode was proposed. The integration of a combined subjective-objective weighting method and cloud model evaluation technique overcame the bottleneck of the insufficient quantification of fuzzy information in traditional assessments. An evaluation system encompassing economic, technical, environmental, and social dimensions was established, enabling the precise transmission of hydrogen price fluctuation risks into comprehensive benefit values.
Sensitivity analysis indicates that reducing the levelized cost of hydrogen (LCOH) production, enhancing system operational efficiency (C21), and strengthening collaborative pollutant control (C31) are the most effective pathways for improving the system’s comprehensive benefits. This provides clear decision-making priorities for project investors and policymakers: short-term efforts should focus on technological innovation and cost control while medium-to-long-term strategies should emphasize refined environmental management and the sustainability of social benefits.
Future research could be deepened in the following aspects: firstly, introducing more sophisticated stochastic process models for hydrogen prices; secondly, quantifying social benefits using methods such as Social Life Cycle Assessment (SLCA); and thirdly, applying the proposed framework to more specific scenarios, such as coupling with offshore oil and gas platforms, and multi-conversion pathways (e.g., hydrogen-to-ammonia, hydrogen-to-methanol), to further test and expand its applicability.

7. Discussion

By comparing the results of this paper with the existing literature, its contributions and limitations can be further highlighted. In terms of capacity configuration, this paper found that the ALK and PEM capacities show a trade-off relationship with changes in hydrogen prices, which was consistent with the conclusion proposed in Reference [22] that ‘PEM has more advantages in high-value scenarios’. However, this paper has provided a more refined capacity ratio decision-making scheme through hybrid configuration optimization. In terms of benefit evaluation, this paper found that social benefits are the most prominent, which was consistent with the research conclusion on the social impact of offshore wind power projects in [25]. Nevertheless, this paper quantified the uncertainty of such benefits through a cloud model (He = 0.85).
Compared with the single economic evaluation in [27], the comprehensive benefit evaluation framework proposed in this paper covers more comprehensive dimensions, especially incorporating social benefits, which is often overlooked. However, this paper still has limitations. Firstly, the hydrogen price scenarios were set based on assumptions; in the future, stochastic programming or real options theory can be introduced to more accurately depict price uncertainty. Secondly, social benefit indicators rely heavily on expert scoring; in the future, quantitative data based on case studies can be used for supplementation. Finally, the reliability of the model still needs to be verified through more actual cases.

Author Contributions

Conceptualization, C.F. and L.L.; methodology, Z.S., X.Z. and C.X.; data curation, Y.Q.; writing—original draft, C.F. and R.D.; writing—review and editing, R.D.; visualization, P.C.; supervision, C.X. and R.D. All authors have read and agreed to the published version of the manuscript.

Funding

This work was funded by the Science and Technology Project of the State Grid Corporation of China (52090R24000H).

Data Availability Statement

The original contributions presented in the study have been included in the article; further inquiries can be directed to the corresponding author.

Conflicts of Interest

Authors Chen Fu, Li Lan, Yanyuan Qian and Peng Chen were employed by the company State Grid Shanghai Economic Research Institute. Author Ruoyi Dong was employed by the company Beiqi Foton Motor Co., Ltd. The remaining authors declare that the research was conducted in the absence of any commercial or financial relationships that could be construed as a potential conflict of interest.

References

  1. Rathi, T.; Pinto, J.; Zhang, Q. Strategic low-carbon hydrogen supply chain planning under market price uncertainty. Comput. Aided Chem. Eng. 2023, 52, 3357–3362. [Google Scholar]
  2. Liu, W.; Wan, Y.; Zhang, Y.; Liu, Q. Design and implementation of China Hydrogen Price Index system. Clean Energy 2023, 7, 148–156. [Google Scholar] [CrossRef]
  3. Yang, X.; Dong, X.; Kong, Z.; Jiang, Q.; Wang, T. Research on the construction of a natural gas price index in China. Energy Strategy Rev. 2020, 30, 100521. [Google Scholar] [CrossRef]
  4. Wen, Y.; Zhang, J.; Yu, X.; Wang, Q. Current situation and trend of global carbon emission and carbon market and its impact on my country. China Invest. 2024, Z5, 70–74. [Google Scholar]
  5. Energy Transitions Commission. Energy and economic assessment of LH2, NH3, TOL/MCH and H0-DBT/H18-DBT for large-scale hydrogen transport. Mater. Today Sustain. 2025, 7, 101187. [Google Scholar]
  6. Jin, Z.; Wang, Z.; Li, Y.; Wang, Y.; Zhang, Y. Development Status, Challenges and Prospects of Offshore Wind Power Hydrogen Production Industry in China. South. Energy Constr. 2025, 12, 33–41. [Google Scholar]
  7. Xu, C.; Li, P.; Zhang, W.; Li, Q.; Wei, Y. Planning for Offshore Integrated Energy Islands with Electricity-Carbon-Hydrogen-Methanol Synergy. South. Energy Constr. 2025, 12, 52–66. [Google Scholar]
  8. Jiang, D.; Jia, Y.; Lu, Q.; Hong, W.; Shen, R. Application Prospects of Hydrogen Energy in Integrated Energy Systems. Electr. Power 2020, 53, 135–142. [Google Scholar]
  9. Zhou, Z.; Cai, G.; Huang, Y.; Bai, R.; Nie, S.; Chen, X. Spatial and temporal evolution of cost-competitive offshore hydrogen in China: A techno-economic analysis. Renew. Sustain. Energy Rev. 2024, 203, 1.1–1.15. [Google Scholar] [CrossRef]
  10. Zhang, W.; Xu, C. Capacity configuration optimization of photovoltaic-battery-electrolysis hybrid system for hydrogen generation considering dynamic efficiency and cost learning. Energy Convers. Econ. 2024, 5, 78–92. [Google Scholar] [CrossRef]
  11. Zhang, G.; Gwan, X. A wind-hydrogen energy storage system model for massive wind energy curtailment. Int. J. Hydrogen Energy 2014, 39, 1243–1252. [Google Scholar] [CrossRef]
  12. Nagasawa, K.; Davidson, F.T.; Lloyd, A.C.; Webber, M.E. Impacts of renewable hydrogen production from wind energy in electricity markets on potential hydrogen demand for light-duty vehicles. Appl. Energy 2019, 235, 1001–1016. [Google Scholar] [CrossRef]
  13. Jiang, Y.; Huang, W.; Yang, G. Electrolysis plant size optimization and benefit analysis of a far offshore wind-hydrogen system based on information gap decision theory and chance constraints programming. Int. J. Hydrogen Energy 2022, 47, 5720–5732. [Google Scholar] [CrossRef]
  14. Xu, F.; Li, X.; Jin, C. Optimal capacity configuration and dynamic pricing strategy of a shared hybrid hydrogen energy storage system for integrated energy system alliance: A bi-level programming approach. Int. J. Hydrogen Energy 2024, 69, 331–346. [Google Scholar] [CrossRef]
  15. Yang, B.; Zhang, Z.; Su, S.; Li, J.; Wang, J.; Zhang, R.; Shu, H.; Ren, Y.; Jiang, L.; Sang, Y. Optimal scheduling of wind-photovoltaic-hydrogen system with alkaline and proton exchange membrane electrolyzer. J. Power Sources 2024, 614, 235010. [Google Scholar] [CrossRef]
  16. Gonçalo, C.; Rui, C. Hydrogen production from offshore wind parks: Current situation and future perspectives. Appl. Sci. 2021, 11, 5561. [Google Scholar] [CrossRef]
  17. Guo, Y.; Qi, P.; Zhang, Q.; Li, M.; Liu, J.; Sun, H. Control strategy for hydrogen production system using HTO-based hybrid electrolyzers. Energy Rep. 2025, 13, 2354–2364. [Google Scholar] [CrossRef]
  18. Zhou, Z.; Zhang, S.; Zhong, Y.; Sun, Z.; Peng, Y. A predictive control method for multi-electrolyzer off-grid hybrid hydrogen production systems with photovoltaic power prediction. Int. J. Hydrogen Energy 2024, 84, 383–393. [Google Scholar] [CrossRef]
  19. Zhang, Y.; Li, L.; Liu, X. Comprehensive evaluation method of operation benefits of integrated energy system considering uncertainty. Renew. Energy 2019, 37, 1671–1678. [Google Scholar]
  20. Li, J. Evaluation of the socio-economic and environmental benefits of hydrogen energy storage technology under the dual carbon model. China New Technol. New Prod. 2023, 16, 142–145. [Google Scholar]
  21. Li, C.; Gao, Y.; Liu, H.; Zhai, R. Energy, exergy, environmental, and economic analysis of a novel hydrogen production system integrating concentrated photovoltaic thermal collectors and wind turbines. Energy 2025, 322, 135670. [Google Scholar] [CrossRef]
  22. Zhao, H.; Xiang, H. Risk assessment of offshore wind power hydrogen production based on spherical fuzzy set and cumulative prospect theory-TOPSIS. Int. J. Hydrogen Energy 2024, 73, 475–489. [Google Scholar] [CrossRef]
  23. Thengane, S.K.; Hoadley, A.; Bhattacharya, S.; Mitra, S.; Bandyopadhyay, S. Cost-benefit analysis of different hydrogen production technologies using AHP and Fuzzy AHP. Int. J. Hydrogen Energy 2014, 39, 15293–15306. [Google Scholar] [CrossRef]
  24. Yu, H.; Shao, Z.; Hou, M.; Yi, B.; Duan, F. Research progress and development suggestions for hydrogen production by water electrolysis. China Eng. Sci. 2021, 23, 146–152. [Google Scholar] [CrossRef]
  25. Ma, X.; Zhang, S.; He, Y.; Zhu, Y.; Wang, Z. Research status and application prospects of PEM water electrolysis hydrogen production technology. Acta Energiae Solaris Sin. 2022, 43, 420–427. [Google Scholar]
  26. Zhang, H. Review of research on alkaline water electrolysis hydrogen production device model. Sol. Energy 2024, 5, 34–41. [Google Scholar]
  27. Song, J.; Gao, J.; Liang, D.; Li, G.; Deng, Z. Review of modeling research on proton exchange membrane electrolysis hydrogen production system. Electr. Power Constr. 2024, 45, 58–78. [Google Scholar]
  28. Chen, B.; Xie, H.; Liu, T.; Lan, C.; Lin, W. Research progress on advanced hydrogen production principles and technologies under the background of carbon neutrality. Eng. Sci. Technol. 2022, 54, 106–116. [Google Scholar]
  29. Zupok, S.; Chomać-Pierzecka, E.; Dmowski, A.; Dyrka, S.; Hordyj, A. A Review of Key Factors Shaping the Development of the US Wind Energy Market in the Context of Contemporary Challenges. Energies 2025, 18, 4224. [Google Scholar] [CrossRef]
  30. Lochhead, R.; Donnelly, O.; Carroll, J. System-Level Offshore Wind Energy and Hydrogen Generation Availability and Operations and Maintenance Costs. Wind 2024, 4, 135–154. [Google Scholar] [CrossRef]
  31. Kumar, S.; Himabindu, V. Hydrogen production by PEM water electrolysis-A review. Mater. Sci. Energy Technol. 2019, 2, 442–454. [Google Scholar]
  32. Li, D.; Sun, T.; Yi, C.; Gao, W.; Li, S. Research on the development of deep sea floating wind power technology. China Eng. Science 2025, 27, 108–122. [Google Scholar]
  33. Rahn, C.D.; Wang, C.Y. Battery Systems Engineering; John Wiley & Son: Chichester, UK, 2013. [Google Scholar]
  34. Xu, C.; Wang, L.; Shi, C.; Qin, G.; Liu, J.; Liu, Q.; Liu, C. Medium-to long-term hydrogen supply-demand structure and carbon emissions simulation in China under multiple scenarios. Adv. Clim. Chang. Res. 2025, 21, 1–14. [Google Scholar]
  35. Jang, D.; Kim, K.; Kim, K.H.; Kang, S. Techno-economic analysis and Monte Carlo simulation for green hydrogen production using offshore wind power plant. Energy Convers. Manag. 2022, 263, 115695. [Google Scholar] [CrossRef]
  36. Wang, X.; Zhao, B.; Huang, M.; Ye, R. Comparison of large-scale long-distance offshore wind power transmission schemes and key technologies for integrated design. Glob. Energy Interconnect. 2019, 2, 138–145. [Google Scholar]
  37. Cheng, B.; Xu, Z.; Xing, Y.; Xinlong, Z. Economic comparison of submarine AC/DC cable transmission systems. Electr. Power Constr. 2014, 35, 131–136. [Google Scholar]
  38. Zhu, X.; Hu, X.; Shi, N.; Zhang, Y.; Zhong, W. Long-term capacity optimization of electricity-hydrogen coupled microgrid considering dynamic efficiency of hydrogen storage. High Volt. Eng. 2023, 49, 1128–1139. [Google Scholar]
  39. Huang, J.; Balcombe, P.; Feng, Z. Technical and economic analysis of different colours of producing hydrogen in China. Fuel 2023, 337, 127227. [Google Scholar] [CrossRef]
  40. Ministry of Finance and National Oceanic Administration. Notice on issuing the Adjustment of standards for levying use fees of sea areas and uninhabited islands. Gaz. Minist. Financ. People’s Repub. China 2018, 4, 14–15. [Google Scholar]
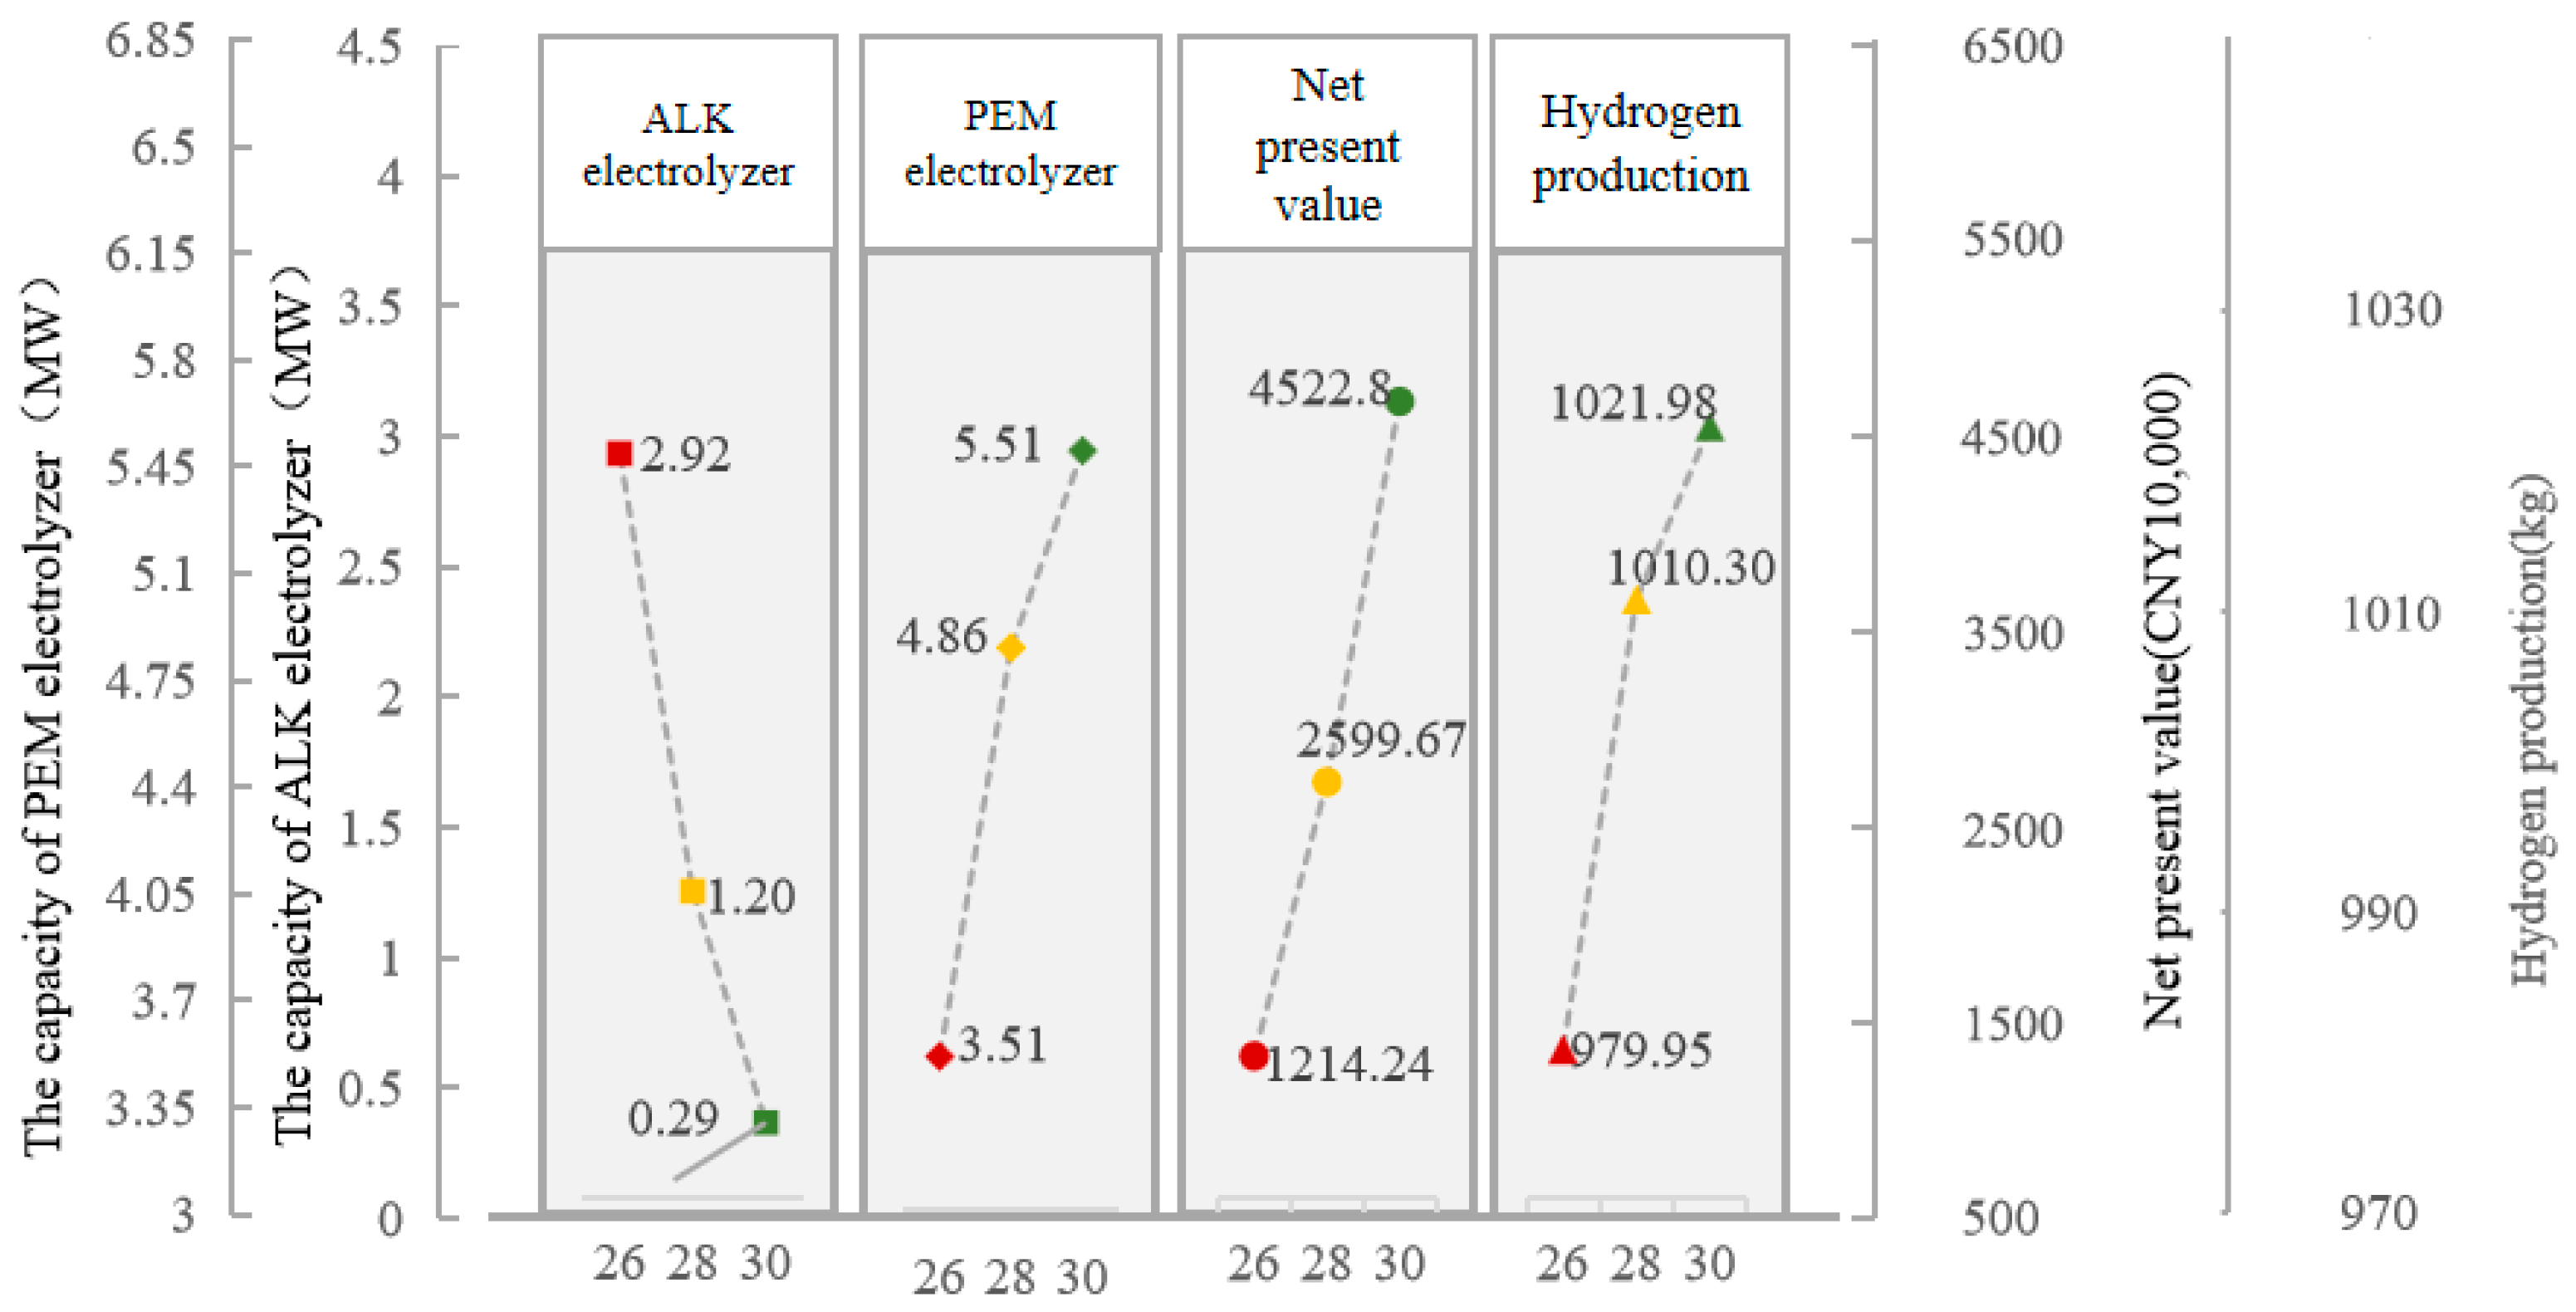
Figure 1. Configuration results of hydrogen production capacity from deep-sea wind power.
Energies 18 05175 g001
Figure 2. Comprehensive benefit evaluation standards for deep-sea wind-power hydrogen production.
Energies 18 05175 g002
Figure 3. Evaluation cloud diagram of the first-level index of deep-sea wind-power hydrogen production: (a) economic benefit evaluation cloud; (b) technical benefit evaluation cloud; (c) environmental benefit evaluation cloud; (d) social benefit evaluation cloud.
Energies 18 05175 g003
Figure 4. Comprehensive cloud chart of comprehensive benefit rating of deep-sea wind-power hydrogen production.
Energies 18 05175 g004
Figure 5. Results of sensitivity analysis of economic benefit indicators.
Energies 18 05175 g005
Figure 6. Results of sensitivity analysis of technical benefit indicators.
Energies 18 05175 g006
Figure 7. Results of sensitivity analysis of environmental and social benefit indicators.
Energies 18 05175 g007
Table 1. Evaluation language of relative importance between indicators and its triangular intuitionistic fuzzy number representation.
Evaluation LanguageTriangular Intuitionistic Fuzzy Numbers
<(a, b, c); µ, v>
Relatively important(2.0, 2.2, 2.4; 0.05, 0.9)
Relatively important(1.8,2.0,2.2;0.1, 0.8)
Relatively important(1.6,1.8,2.0; 0.2, 0.6)
Relatively important(1.4,1.6,1.8; 0.6, 0.2)
Slightly more important(1.2,1.4,1.6; 0.8, 0.1)
Relatively minor(1.0,1.2,1.4; 0.9, 0.05)
Relatively equally important(1.0,1.0,1.0; 1,0)
Table 2. Hydrogen price scenario settings.
ScenarioHydrogen Price
(CNY/kg)
Scenario Description
Optimism30The hydrogen energy industry is developing rapidly, hydrogen energy terminal application technology is advanced and mature, and the demand for hydrogen is increasing rapidly. Affected by market supply and demand, the price of hydrogen has increased slightly from the current benchmark price.
Benchmarks28We maintain the hydrogen price under the current policy subsidies.
Pessimistic26The development of hydrogen energy terminal industry is limited. As the cost of hydrogen production decreases, the price of hydrogen continues to decline.
Table 3. Equipment-related parameters.
ParameterData
Fan installed capacity/kW10,000
Floating wind turbine/CNY/kW)16,000
Offshore platform/(CNY/kW)815
35 kv array cable/(10,000 CNY/km)50
220 kv high voltage cable/(10,000 CNY/km)450
675 v–1035 v rectifier/(CNY/kW)476
Offshore booster station/(CNY/kW)500
Converter station/(CNY/kW)2000
Seawater lifting pump/(10,000 CNY/unit)5
Seawater desalination container/(10,000 CNY/set)150
Fresh water purification system/(10,000 CNY/set)150
Electrochemical energy storage/(CNY/kWh)1000
Electrolyzer unit scale/MW1
Alkaline electrolyzer/(CNY/kW)2100 nn
Proton exchange membrane electrolyzer/(CNY/kW)5000
Hydrogen purification system/(10,000 CNY/set)50
Hydrogen buffer tank/(10,000 CNY/m3)2
Sea area use fee/(10,000 CNY/hectare)300
Table 4. Optimization results of capacity configuration.
Hydrogen PriceWind Power
Installed Capacity (MW)
Alkaline
Electrolyzer
Capacity (MW)
PEM
Electrolyzer
Capacity (MW)
Annual
Hydrogen Production (kg)
Net Present Value
(10,000 CNY)
30100.295.511,021,980.344522.80
28101.24.861,010,304.072599.67
26102.923.51979,949.401214.42
Table 5. Comprehensive benefit evaluation indicators.
First Level IndicatorSecondary IndicatorsUnitNatureData
Economic Benefit C1C11CNY/kgCost Type(30.94, 31.27, 32.13)
C12CNY100,000Income(1214.24, 2599.67, 4522.8)
C13%Income(19%, 30%, 39%)
Technical Benefit C2C21%Income(90%, 90%, 90%)
C22%Income(63%, 66%, 67%)
C23pointIncome(5.67, 7.33, 8.67; 0.8, 0.1)
Environmental Benefit C3C31tonIncome(55,716, 55,720, 55,723)
C32tonIncome(2783.07, 2869.26, 2902.42)
Social Benefits C4C41pointIncome(6.67, 7.67, 8.33; 0.6, 0.3)
C42pointIncome(7.67, 8.33, 9.33; 0.6, 0.3)
C43pointIncome(8.00, 8.67, 9.67; 0.6, 0.3)
Table 6. Quantitative conversion results of subjective evaluation of relative importance.
IndexExpert 1Expert 2Expert 3Expert 4
C11(1.0, 1.2, 1.4; 0.9, 0.05)(1.0, 1.2, 1.4; 0.9, 0.05)(1.0, 1.2, 1.4; 0.9, 0.05)(1.0, 1.2, 1.4; 0.9, 0.05)
C12(1.0, 1.0, 1.0; 1, 0)(1.0, 1.0, 1.0; 1, 0)(1.0, 1.0, 1.0; 1, 0)(1.2, 1.4, 1.6; 0.8, 0.1)
C13(1.6, 1.8, 2.0; 0.2, 0.6)(1.2, 1.4, 1.6; 0.8, 0.1)(1.2, 1.4, 1.6; 0.8, 0.1)(1.6, 1.8, 2.0; 0.2, 0.6)
C21(1.2, 1.4, 1.6; 0.8, 0.1)(1.2, 1.4, 1.6; 0.8, 0.1)(1.2, 1.4, 1.6; 0.8, 0.1)(1.0, 1.0, 1.0; 1, 0)
C22(1.2, 1.4, 1.6; 0.8, 0.1)(1.2, 1.4, 1.6; 0.8, 0.1)(1.0, 1.2, 1.4; 0.9, 0.05)(1.0, 1.2, 1.4; 0.9, 0.05)
C23(1.2, 1.4, 1.6; 0.8, 0.1)(1.6, 1.8, 2.0; 0.2, 0.6)(1.0, 1.2, 1.4; 0.9, 0.05)(1.2, 1.4, 1.6; 0.8, 0.1)
C31(1.2, 1.4, 1.6; 0.8, 0.1)(1.8, 2.0, 2.2; 0.1, 0.8)(1.2, 1.4, 1.6; 0.8, 0.1)(1.2, 1.4, 1.6; 0.8, 0.1)
C32(1.0, 1.2, 1.4; 0.9, 0.05)(1.2, 1.4, 1.6; 0.8, 0.1)(1.0, 1.2, 1.4; 0.9, 0.05)(1.0, 1.2, 1.4; 0.9, 0.05)
C41(1.0, 1.2, 1.4; 0.9, 0.05)(1.0, 1.2, 1.4; 0.9, 0.05)(1.0, 1.2, 1.4; 0.9, 0.05)(1.0, 1.2, 1.4; 0.9, 0.05)
C42(1.4, 1.6, 1.8; 0.6, 0.2)(1.4, 1.6, 1.8; 0.6, 0.2)(1.2, 1.4, 1.6; 0.8, 0.1)(1.2, 1.4, 1.6; 0.8, 0.1)
C43(1.0, 1.0, 1.0; 1, 0)(1.0, 1.0, 1.0; 1, 0)(1.0, 1.0, 1.0; 1, 0)(2.0, 2.2, 2.4; 0.05, 0.9)
Table 7. Comprehensive benefit evaluation level of deep-sea wind-power hydrogen production.
RatingValue RangeDigital Features
Low efficiency[0, 25)(12.50, 10.62, 0.50)
Relatively low efficiency[25, 50)(37.50, 10.62, 0.50)
Benchmark benefits[50, 75)(62.50, 10.62, 0.50)
Relatively high efficiency[75, 90)(82.50, 6.37, 0.50)
High efficiency[90, 100](95.00, 4.25, 0.50)
Table 8. Digital characteristics of comprehensive benefit evaluation.
Primary Indicators and Their Numerical CharacteristicsSecondary Indicators and Their
Numerical Characteristics
Comprehensive benefits of deep-sea wind-power hydrogen production
(79.94, 3.29, 0.85)
C1 (76.76, 3.36, 1.06)C11 (76.1, 2.90, 1.10)
C12 (80.4, 3.60, 0.99)
C13 (78.6, 78.6, 1.16)
C2 (80.03, 3.51, 0.66)C21 (90.7, 2.31, 0.44)
C22 (76.5, 4.76, 0.64)
C23 (72.5, 2.75, 0.94)
Comprehensive benefits of deep-sea wind-power hydrogen production
(79.94, 3.29, 0.85)
C3 (73.94, 2.41, 0.24)C31 (70.7, 2.31, 0.16)
C32 (76.8, 2.51, 0.32)
C4 (86.38, 3.43, 1.19)C31 (84.0, 3.51, 1.10)
C32 (88.3, 3.13, 1.42)
C33 (87.1, 3.63, 1.05)
Table 9. Similarity calculation results.
SimilarityLow EfficiencyRelatively Low EfficiencyBenchmark BenefitsRelatively High EfficiencyHigh Efficiency
Integrated Benefits0.00000.00060.27180.83950.0181
Economic Benefits0.00000.00180.41150.65420.0034
Technical Benefits0.00000.00060.27070.83190.0224
Environmental Benefits0.00000.00340.55420.43490.0001
Social Benefits0.00000.00010.092 70.75380.2352
Disclaimer/Publisher’s Note: The statements, opinions and data contained in all publications are solely those of the individual author(s) and contributor(s) and not of MDPI and/or the editor(s). MDPI and/or the editor(s) disclaim responsibility for any injury to people or property resulting from any ideas, methods, instructions or products referred to in the content.