Abstract
The operational risks of equipment in coalbed methane (CBM) gathering stations exhibit dynamic characteristics. To address this, a dynamic risk assessment method based on Dynamic Bayesian Networks (DBNs) is proposed for CBM station equipment. Additionally, a comprehensive safety management evaluation model is established for gathering station equipment. This approach enables accurate risk assessment and effective implementation of safety management in CBM gathering stations. This method primarily consists of three core components: risk factor identification, dynamic risk analysis, and comprehensive safety management evaluation. First, the Bow-tie model is applied to comprehensively identify risk factors associated with station equipment. Next, a DBN is constructed based on the identified risks, and Markov theory is employed to determine the state transition matrix. Finally, a Comprehensive Safety Management (CSM) evaluation model for gathering station equipment is established. The feasibility of the proposed method is validated through case study applications. The results indicate that during the operation of equipment at CBM gathering stations, priority should be given to strengthening maintenance for medium-hole and enhancing prevention and emergency measures for jet fires. Temperature-controlled spiral-wound heat exchangers, skid-mounted circulating pumps, and pipelines have been identified as critical factors affecting accident occurrence at CBM gathering stations. Enhanced daily inspection and maintenance of this equipment should be implemented. Furthermore, compared to other safety evaluation indicators, the Emergency Preparedness and Response indicator has the most significant impact on the operational safety of CBM gathering station equipment. It requires high-priority attention, thorough implementation of relevant measures, and continuous improvement through targeted actions.
1. Introduction
Coalbed methane (CBM), also known as “gas,” primarily consists of methane. As a hydrocarbon gas in coal seams, it offers advantages such as high calorific value and clean combustion products, and is now widely developed and utilized [1]. With growing national policy support and market demand, China’s CBM industry has flourished, with exploration and development technologies reaching international advanced levels [2]. CBM gathering stations serve as critical facilities for CBM processing, performing collection, treatment, storage, and transportation to ensure efficient utilization and sustainable development [3]. These stations operate numerous pieces of equipment over extended periods, with CBM typically maintained at high temperatures and pressures. The gas exhibits hazardous properties, including flammability, explosiveness, and toxicity. Leakage incidents can severely threaten personnel and equipment safety. For example, in 2019, a CBM leakage incident at Shanxi Tongyu CBM Transmission & Distribution Co., Ltd. caused an explosion and fire covering over 8000 m2, resulting in direct economic losses of approximately RMB 815,962. Dynamic risk assessment of CBM gathering station equipment is therefore crucial to prevent casualties and property damage.
Recent studies on risk assessment of coalbed methane (CBM) primarily focus on two aspects: industry-wide risk analysis and project-specific risk evaluation, covering socio-environmental impacts, geological hazards, and economic factors. Wang Wanqing et al. established a risk index system for coalbed methane development projects, determined the index weights by using the structural entropy weight method, and completed the risk assessment combined with the gray clustering analysis method [4]. Barbara Uliasz-Misiak et al. established an environmental risk assessment framework for coalbed methane exploration and exploitation, determined the likelihood and consequence weightings based on expert knowledge and literature, and completed the risk assessment by using a modified hazard/probability matrix method [5]. Jiang Qiuxia established a risk assessment system for CBM development by combining subjective and objective weighting methods, and designed a decision support system for risk evaluation [6]. Runzhi Li et al. established an explosion risk assessment framework for low-concentration oxygen-bearing coalbed methane in low-temperature environments, determined the key risk factors by combining experimental analysis and numerical simulation, and completed the risk evaluation by using the cusp catastrophe theory [7].
Most existing studies focus on qualitative risk assessments of the coalbed methane (CBM) industry as a whole. Research on risk assessment for the operation of equipment in CBM gathering stations remains relatively insufficient. Furthermore, the risks faced by the equipment are not fixed; instead, they evolve continuously with factors such as the passage of time, fluctuations in operating conditions, changes in the environment, equipment aging, and operational behaviors. These risks exhibit dynamic characteristics of “uncertainty, timeliness, and correlation”—in other words, the risks are dynamic in nature. Dynamic Bayesian Network (DBN) offers an effective solution to this problem by combining static network structures with temporal information, creating a stochastic model capable of processing time-series data. This method has been widely applied in the petrochemical industry for scenario simulation and countermeasure evaluation of fire accidents in oil and gas storage and transportation [8]. Qingqing Xu et al. established a dynamic risk assessment index system for underground gas storage facilities, determined the prior probability of basic events by using fuzzy numbers, and completed the risk evaluation by combining the dynamic DBN and failure tree analysis [9]; Ming Liu et al. established a risk index system for the gasifier system, determined the weights of each risk index by using the entropy weight method, and completed the risk prediction evaluation by combining the dynamic cloud DBN and the cloud model [10]; Jing Wen et al. established a risk index system for submarine pipeline stoppers, determined the failure probability of basic events by using the fuzzy comprehensive evaluation method, and completed the reliability and safety evaluation by combining the dynamic Bayesian network (DBN) and fault tree analysis [11].
This study addresses the dynamic characteristics of equipment operation in coalbed methane (CBM) gathering stations by establishing a dynamic risk assessment model based on Dynamic Bayesian Network (DBN). It predicts risk evolution trends to provide a scientific reference for the safe operation and risk management of CBM gathering stations.
2. Material and Methods
The spatial layout of a CBM gathering station consists of multiple functional zones and equipment arrangements. Based on functional characteristics, it can be divided into four operational units: separation unit, dehydration unit, Boosting Unit, and pipelines/auxiliary equipment. A field photo of the CBM gathering station is shown in Figure 1.
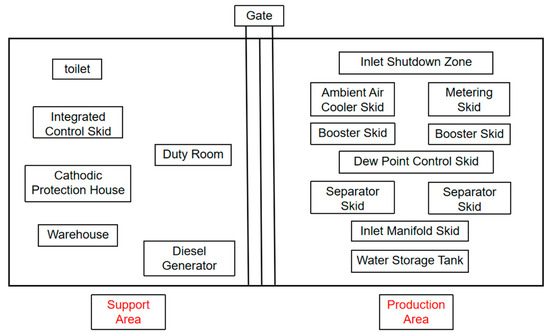
Figure 1.
Diagram of individual components of the CBM gathering station.
The separation unit functions to remove impurities carried in the CBM, thereby improving gas purity; The Boosting Unit increases the transmission pressure to ensure stable gas supply. The dehydration unit removes water content from the CBM to lower its water dew point, preventing water condensation during transportation or processing that could negatively impact gas quality and transmission efficiency. Pipelines and other auxiliary equipment serve as supporting facilities for the production process units.
A comprehensive identification of risk factors and potential accident consequences during the operation of equipment and facilities in CBM gathering stations was conducted. Based on this analysis, a bow-tie(BT) model for CBM station accidents was established. Subsequently, a Dynamic Bayesian Network (DBN) model for the CBM gathering station was developed by integrating Markov theory. Finally, a comprehensive safety management evaluation model was constructed to calculate and assess safety management performance scores. Through case study applications, this research investigates the temporal evolution patterns of equipment risks under different operational states. The overall framework is illustrated in Figure 2.
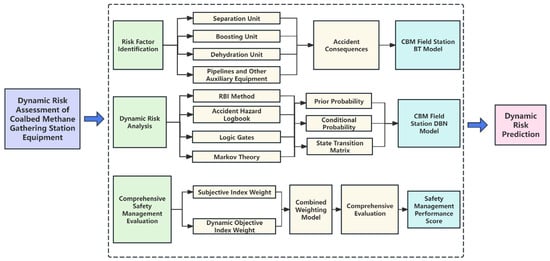
Figure 2.
Research Framework Diagram.
2.1. Establishing the BT Model for CBM Gathering Stations
Field investigations at the CBM gathering station revealed a high degree of equipment automation. Consequently, the risk factors and accident consequences of CBM leakage were analyzed and categorized primarily from the perspective of equipment systems, leading to the establishment of a BT model for CBM leakage accidents. The bow-tie analysis method, also known as the cause-consequence diagram method—Cause-and-Effect Diagram Method (Ishikawa Diagram Method), is a qualitative risk assessment technique that visually represents the causes, pathways, and consequences of hazardous events along with their logical relationships during the evolution process [12,13]. As shown in Figure 3, the left side of the BT model illustrates the potential causes of CBM leakage, while the right side displays the possible accident consequences under different conditions.
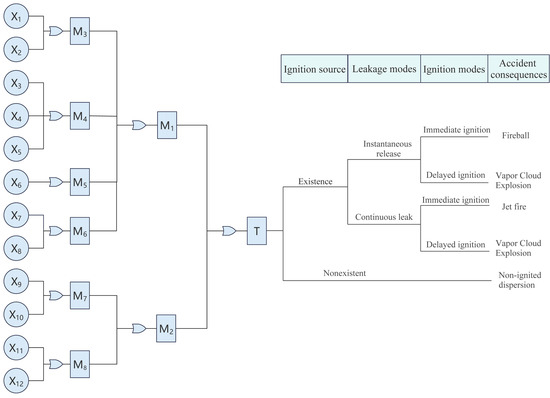
Figure 3.
BT model of CBM leakage.
The BT model diagram comprises 8 intermediate events, 12 basic events, and 4 types of accident consequences. The event node information is presented in Table 1.

Table 1.
Events of BT model.
2.2. DBN Model for CBM Gathering Station Accidents
Bayesian Network (BN) are probabilistic graphical models that represent complex variable relationships using sample data and domain knowledge to support uncertainty reasoning and predictive inference [14,15]. Dynamic Bayesian Network (DBN) extend BN by incorporating temporal dynamics, enabling the analysis of time-series data and making them particularly suitable for industrial applications [16,17,18].
Given the dynamic risk characteristics of equipment in CBM gathering stations, DBN effectively capture real-time risk evolution. Based on the BT model for CBM leakage, a corresponding DBN model is constructed, as shown in Figure 4. The boxes in the figure represent events and results, and the arrows indicate the causal relationships among the events.
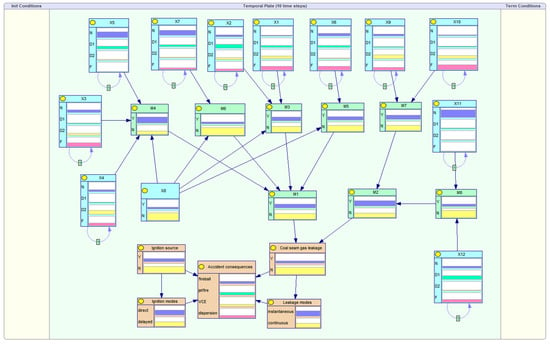
Figure 4.
DBN model of CBM station.
2.2.1. Determination of Bayesian Network Parameters
Determination of Node Prior Probabilities
The RBI methodology is adopted to determine prior probabilities for equipment failure nodes. The generic failure frequencies for various equipment under different failure modes are obtained from API RP 581. These frequencies are then adjusted by both equipment-specific and management system modification factors based on actual operating conditions to determine the final equipment failure probability. For other nodes, prior probabilities can be determined based on the station’s hazard registry and relevant statistical records. The failure rates and repair rates for event nodes under small-bore leakage conditions are presented in Table 2.

Table 2.
Failure rate and repair rate of each node.
Determination of Conditional Probabilities
The establishment of node conditional probabilities follows two principal methodologies. The first approach derives probabilities through the logical relationships of AND-gates and OR-gates in fault tree analysis(FTA). The second method combines expert experience with fuzzy set theory, where invited experts provide scores represented by fuzzy numbers that are converted into fuzzy linguistic terms, ultimately determining the conditional probabilities through computation. The conditional probabilities for nodes associated with equipment and device failures all adhere to the logical “OR-gate” rule. The conditional probabilities for “accident consequence” nodes are provided in Table 3.

Table 3.
Conditional probability of the “accident consequence” node.
2.2.2. Determination of State Transition Matrices
To determine the probability of accidents at different time steps in a DBN structure, it is necessary to establish the state transition probabilities of nodes from one time step to the next, i.e., the transition matrix. Markov models have characteristic to handle uncertainty by modeling the probabilities of transitioning from current state to next state [19,20].
The root nodes corresponding to equipment and device failures in the DBN model are defined with four operational states: Fully Operational (N), Degraded but Functional (D1), Severely Damaged (D2), and Failed (F). The transitions between these states are depicted in Figure 5, with λ representing the equipment failure rate and μ denoting the repair rate.
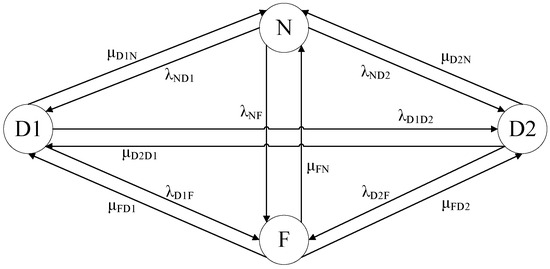
Figure 5.
The transition relationship between states.
A complete repair restores the system to the N state from the F state, while an incomplete repair improves the condition but only achieves the D1 state.
To establish the state transition matrix, probabilistic assumptions are made regarding the transitions between the four states (N, D1, D2, F), as formalized in Equation (1.1) [21].
To enable precise assessment of dynamic risks in CBM gathering station equipment across time sequences, time slices are incorporated into the DBN model. The transition probabilities between adjacent time slices under varying maintenance levels are provided in Table 4, Table 5 and Table 6. The parameter T denotes the initial time of equipment or device states, while T + ΔT marks the time of state transition completion. In this study, the time slice interval (ΔT) is standardized as one month, with all tabulated probabilities representing the likelihood of state transitions occurring within this monthly timeframe.

Table 4.
State transition probability without maintenance.

Table 5.
State transition probability under incomplete maintenance condition.

Table 6.
State transition probability under complete maintenance condition.
2.3. Comprehensive Safety Management Evaluation Model for CBM Gathering Station Equipment Operations
2.3.1. Establishment of a Comprehensive Safety Management Evaluation Index System for CBM Gathering Station Equipment Operations
The safety management assessment system for CBM gathering station equipment is a multi-level framework, structured into four tiers: Group Company—Company—Subsidiary—Field Operators, which incorporates diverse data sources across multiple elements. Based on the operational and structural features of the equipment, along with relevant regulations and standards, the evaluation index system is organized into 4 primary and 11 secondary indicators, as shown in Table 7.

Table 7.
Comprehensive evaluation system of operation safety management of CBM plant and station equipment.
2.3.2. Determination of Subjective Weighting Factors for Indicators Using AHP
AHP is one of the common methods used in multi-criteria decision-making processes, which is considered to be a decision method that decomposes a complex multi-criteria decision problem into a hierarchy using experts as the objects of a questionnaire survey [22,23]. In this study, three university experts were specially invited to form an evaluation panel. All of these experts have long been committed to scientific research and teaching in the field of oil and gas safety, with an average of more than ten years of professional experience. They possess profound theoretical foundations and rich academic accumulations in this field, which ensures the reliability and scientificity of this study.
The procedural steps for determining subjective weights of indicators using the AHP are as follows:
- (1)
- Construct the judgment matrix
Experts construct an judgment matrix through pairwise comparisons of evaluation indicators.
The element represents the importance score of element relative to element .
- (2)
- Calculate the weight vector
Normalization processing:
The calculation formula for the weight is:
- (3)
- Consistency verification
The formula for calculating the Consistency Index (CI) is shown below, where is the judgment matrix, is the weight vector, is the order of the matrix, and is the maximum eigenvalue of the judgment matrix.
2.3.3. Determination of Objective Weighting Factors for Indicators Using Entropy Method
The entropy method is an objective weighting technique that assigns weights based on the information entropy derived from data distributions. It ranks indicators by relative importance, measures ranking uncertainty using entropy, and computes weights through deviation analysis.
The procedural steps for determining objective weights of indicators using the entropy method are as follows:
- (1)
- The evaluation of operational safety management indicators for CBM field station equipment was conducted using the expert scoring method, with corresponding assessment sets as shown in the Table 8:
 Table 8. Evaluation set correspondence table.
This study quantifies the evaluation results of each factor using the median values of assessment intervals from the evaluation set.
- (2)
- Normalization of indicators
The entropy method requires maximizing positive indicators and minimizing negative indicators.
Normalization formula for positive indicators:
Normalization formula for negative indicators:
- (3)
- Non-negative Data Translation
The adjustment formula is as follows:
To avoid altering the original data, the value of a should be kept as small as possible.
- (4)
- Calculate the proportion
To calculate the proportion of the -th sample under the -th indicator, the following formula is applied:
where denotes the sample size.
- (5)
- Compute the entropy value
- (6)
- Determine the redundancy degree
- (7)
- Derive the weight vector
2.3.4. Game Theory-Based Determination of Combined Weights
In the indicator weighting process, weights can be assigned based on either correlation or difficulty. To balance the influence of both approaches, game theory-based combined weighting is applied to integrate them. This method minimizes weight deviation as its optimization objective, resulting in optimal combined weights that overcome the limitations of single-method weighting. The specific calculation steps are as follows.
- (1)
- Assuming L distinct weighting methods are applied to the indicators, yielding L sets of weight vectors:
Any linear combination of the L weights is as follows, where is the linear combination coefficient, 0.
- (2)
- By minimizing the deviations between and each , the L weight combination coefficients in Equation (2.15) are optimized to obtain the most ideal weight values in . The objective function is defined as:
Based on the properties of matrix differentiation, the system of linear equations for the first-order derivative condition of Equation (2.15) optimization is:
- (3)
- Combined Weight Calculation.
After normalizing , the combined weights for operational indicators of CBM field station equipment are determined as follows:
2.3.5. Fuzzy Comprehensive Evaluation
- (1)
- Constructing Fuzzy Evaluation Matrices for Secondary Indicators
After obtaining the combined weight vector through combined weighting, the fuzzy evaluation matrix is constructed as follows:
where denotes the membership degree of the -th indicator under the -th evaluation grade.
- (2)
- Deriving Fuzzy Comprehensive Evaluation Results
The fuzzy comprehensive evaluation result is calculated using the weighted average fuzzy operator , where the membership degrees are derived and subsequently normalized.
- (3)
- Composite Score Calculation
The composite score is obtained by multiplying the membership degrees with their corresponding evaluation grade scores, as expressed in the following formula:
where and represent the normalized membership degree of the -th evaluation grade and its assigned numerical score, respectively.
3. Case Application
3.1. Case Overview
Taking a CBM gathering station in Shanxi Province as a case study, we applied the proposed methodology to perform dynamic risk analysis. The gas gathering station is part of a pilot production project for tight gas exploration and development with 200 million cubic meters of geological reserves. It adopts a fully skid-mounted design, with a design capacity of 4.9 × 10⁴ Nm3/d, an operational flexibility range of 10–120%, and an automation level classified as “attended operation with centralized monitoring.” The process flow primarily consists of separation, pressurization, dehydration, and metering and export units, which treat incoming wellhead gas through separation and dehydration processes. The processed tight gas complies with Type II commercial natural gas standards and is sold to downstream users after custody transfer metering within the station.
3.2. Dynamic Risk Outcome Analysis
The relevant parameters were input into the dynamic Bayesian network (DBN) for updating, and the time slice was set to 240 (corresponding to 20 years). The relevant results obtained are as follows. For different failure types, the probability of CBM leakage under different maintenance states varies over time, as shown in Figure 6. As shown in the figure, medium-hole leaks exhibit the highest probability, followed by small-hole leaks, with large-hole leaks being the least probable. Both partial repair and complete repair effectively reduce the probability of coalbed methane (CBM) leakage, achieving a maximum reduction of 6.44 × 10⁻⁴. For small-hole leaks, complete repair demonstrates more significant risk mitigation. Compared with other studies in this field, the results of this study focus on CBM collection stations, with an emphasis on leak aperture and the probability of accident types. In contrast, other studies concentrate on the laws of gas loss [24]. Although the two differ in their focuses, both are important components of research on coalbed methane leakage prevention and control.

Figure 6.
Changes in the probability of CBM leakage with different pore sizes under different maintenance states.
Under the no-repair condition, the evolution of probabilities for jet fires, fireballs, and vapor cloud explosions (VCE) triggered by CBM leakage over a 20-year period is illustrated in Figure 7, with quantitative data provided in Table 9. As shown in the figure, jet fires exhibit the highest probability of occurrence, followed by fireballs, with VCE being the least probable. As equipment service life increases, the probabilities of these incidents rise correspondingly. After 20 years, the maximum probability increase reaches 1.77 × 10⁻⁵.

Figure 7.
Changes in probabilities of different accident consequences under different failure types.

Table 9.
Probabilities of different accident consequences under different failure types.
Figure 8 presents the probability variations in coalbed methane (CBM) leakage, jet fires, fireballs, and vapor cloud explosions (VCEs) under different failure types and maintenance states. As shown in the figure, complete repair demonstrates significantly greater effectiveness in reducing accident probabilities for small-hole leaks compared to partial repair, while the difference between the two repair strategies is marginal for other failure types. Compared with other studies, this research obtains the probability of CBM accidents by modifying maintenance methods and infers the relationship between them, while some other studies in this field link the correlation of corrosion defects with failure probability to deduce their relationship [25]. Although both methods involve research on gas facility leakage risks, the former is a comparative analysis of post-maintenance effects, and the latter is a modeling study of pre-failure causes; they differ in research dimensions and focus elements, but both contribute to the study of accident failures in this field.
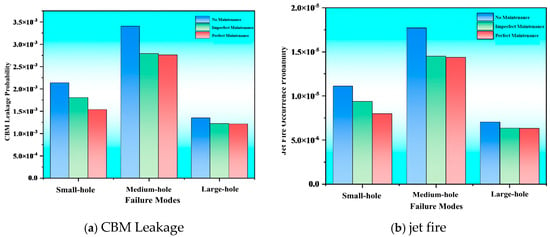
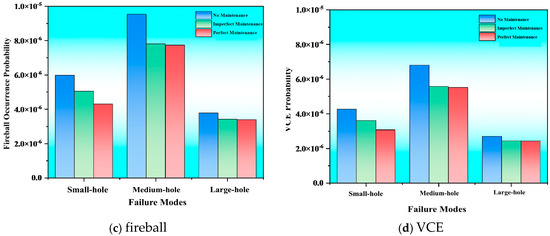
Figure 8.
The probability changes in each accident under different conditions.
Under the no-repair condition, with the “accident consequence” set as the evidence node and the jet fire probability fixed at 1 for T = 240, Bayesian network reverse reasoning was performed to derive the posterior probabilities of basic events, as shown in Figure 9. As shown in the figure, X3 is the most critical factor influencing accidents at the CBM gathering station, exhibiting the highest contribution rate. This is followed by X5 and X7, which are also key contributing factors that cannot be overlooked.
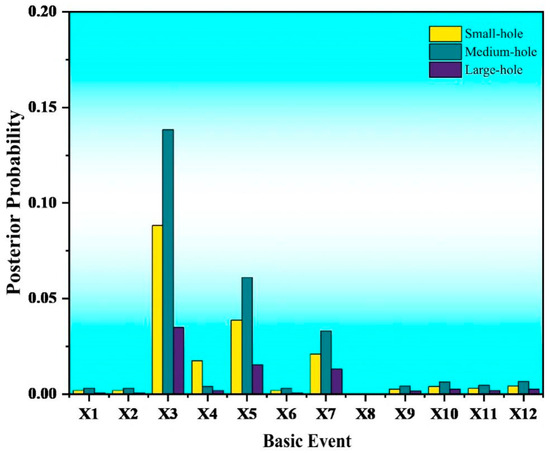
Figure 9.
Posterior probability of each basic event.
3.3. Comprehensive Evaluation Results of Equipment Operational Safety Management
Based on the established safety management evaluation index system, the 1–9 ratio scale method and random consistency index (RI) were applied to conduct pairwise comparisons of all Tier-1 and Tier-2 indicators. Separate judgment matrices were constructed, and the consistency ratio (CR) was calculated for both Tier-1 and Tier-2 indicators. Among them, the work environment data forms a second-order matrix, for which the CR cannot be calculated. However, all second-order matrices inherently satisfy consistency tests, and the derived weights are consistent. Analysis confirms that all judgment matrices meet the consistency requirements. Table 10 presents the CR values for the primary indicators and their respective secondary indicators.

Table 10.
The CR values of each indicator.
The subjective weight allocation results for the operational safety management of CBM gathering station equipment are presented in Table 11. Among the tier-1 indicators, Emergency Preparedness and Response holds the highest weight (0.50), while Work Environment ranks lowest (0.09), demonstrating a significant disparity. The prioritized ranking of first-level indicators is: Emergency Preparedness and Response > Equipment Status > Basic Management > Work Environment. The weight distribution analysis of tier-2 indicators reveals that Emergency Drills (C42) under the Emergency Preparedness and Response category carries the highest weight coefficient of 0.29, followed by Emergency Plan Development (C41) at 0.17, while Integrity Of Management Systems (C21) under Equipment Status ranks third with a weight of 0.14. All remaining tier-2 indicators demonstrate relatively minor influence with weights below 0.10. Therefore, Emergency Preparedness and Response constitutes the most critical aspect of equipment operational safety management at CBM gathering stations, with particular emphasis on emergency drills.

Table 11.
The subjective weight of safety management of CBM plant equipment operation.
Based on the expert scoring method, the data for each Tier-2 indicator was obtained. Following the procedures outlined in Section 2.2, the entropy values and objective weights of all Tier-2 indicators were calculated, with detailed results presented in Table 12. As evidenced in Table 12, Emergency Preparedness and Response carries the highest weight (30.27%) in the operational safety management system of CBM gathering station equipment, followed by Basic Management (24.59%). Equipment condition and Work Environment demonstrate comparable yet minimal weight differences, registering 22.72% and 22.42%, respectively. The Emergency Preparedness and Response indicator constitutes a critical factor influencing equipment operational safety management at CBM gathering stations. It quantifies the station’s emergency readiness capability and response speed when confronting unforeseen incidents, ensuring rapid and effective action implementation during emergencies. Therefore, in the operational safety management of equipment at CBM gathering stations, priority attention must be given to the development of this indicator, with systematic enhancement of emergency preparedness and response protocols.

Table 12.
Objective weight of safety management of CBM plant equipment operation.
Based on the integration of subjective and objective weights for equipment operational safety management in CBM gathering stations, the combined optimization coefficients were calculated following the procedures outlined in Section 2.3.4. After normalization processing, the results yielded and . Utilizing Equation (2.16), the comprehensive weights derived from game theory-based combination weighting are presented in Table 13. In order to visually represent the weight distribution of each secondary indicator in the comprehensive evaluation of equipment operation safety management at coalbed methane gathering stations, the results of subjective and objective weights as well as combined weights were integrated to generate Figure 10.

Table 13.
Combined weights for equipment operational safety management in coalbed methane gathering stations.
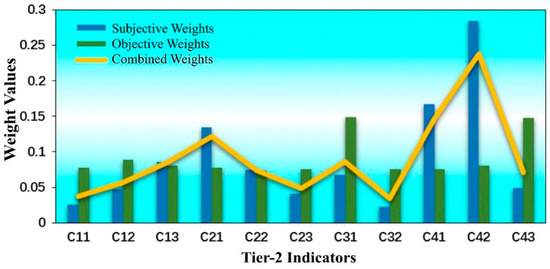
Figure 10.
Weight distribution of Tier-2 indicators in the comprehensive evaluation system for equipment operational safety management at CBM gathering stations.
The fuzzy evaluation matrix can be derived from the combined weights:
The fuzzy comprehensive evaluation results are as follows:
In accordance with the evaluation criteria presented in Table 8, the calculated score is 8.50055. Therefore, the safety level of the operation and safety management for the coalbed methane (CBM) gathering station equipment is determined as “Safe”.
3.4. Section Summary
Although this study has conducted risk assessment on the operational status of equipment in CBM gathering stations, it has not yet carried out systematic classification based on the structural characteristics and functional attributes of the equipment. As a result, it fails to generate more targeted and detailed assessment conclusions. Future research will focus on this direction, optimizing the assessment framework through equipment classification to further improve the accuracy of risk assessment and its practical guiding value.
Furthermore, compared with other traditional Analytic Hierarchy Process (AHP) methods [26,27], this study introduces a combined weighting method integrating the entropy weight method and game theory, which reduces the interference of subjective factors on the evaluation results. However, there is still room for optimization in terms of improving the objectivity. In subsequent work, it is necessary to further explore weighting methods more suitable for this research scenario, so as to more effectively achieve the goals of reducing the subjectivity of evaluation and enhancing the scientificity and reliability of evaluation results.
4. Conclusions
As the service life of equipment extends, the associated risk of accidents also increases. In the context of CBM leakage, medium-hole leaks are the most frequent, with an occurrence probability roughly double that of large-hole leaks, which are the least common. Among leakage-related accidents, jet fires are the most prevalent, exhibiting a probability about three times higher than VCE. Consequently, it is recommended that CBM gathering stations enhance maintenance protocols focused on medium-hole leaks and reinforce prevention and emergency preparedness measures for jet fires.
In the event of medium or large-hole leaks, the difference in effectiveness between complete and incomplete maintenance for reducing accident risks is minimal. However, for small-hole leaks, complete maintenance proves most effective in mitigating the likelihood of accidents. Therefore, priority should be given to complete maintenance during equipment servicing and repair.
Temperature-controlled spiral-wound heat exchangers, skid-mounted circulating pumps, and associated pipelines are key factors influencing accident risks in CBM gathering stations. It is therefore essential to enhance inspection and maintenance activities for such equipment during routine operations.
Subjective and objective weights for each indicator were derived using the Analytic Hierarchy Process (AHP) and the entropy method, respectively. These weights were then integrated through game theory to obtain combined weights, which subsequently served as input for a fuzzy comprehensive evaluation. Among all Tier-1 indicators, Emergency Preparedness and Response received the highest combined weight (0.4551), highlighting its critical importance. Consequently, enhancing management focus on this aspect is recommended during the operation of the CBM gathering station equipment.
Author Contributions
Methodology, J.L., C.S., X.L., D.Z., Y.Z., X.Y. and Y.L.; Writing—original draft, S.Y. All authors have read and agreed to the published version of the manuscript.
Funding
This research received no external funding.
Data Availability Statement
The original contributions presented in this study are included in the article. Further inquiries can be directed to the corresponding author.
Conflicts of Interest
Authors Jian Li, Chaoke Shi, Xiang Li, Yuchen Zhang and Xiaojie Yu were employed by the company China National Petroleum Corporation Coalbed Methane Company Limited. Author Dashuang Zeng was employed by the company China National Petroleum Corporation. The remaining authors declare that the research was conducted in the absence of any commercial or financial relationships that could be construed as a potential conflict of interest.
References
- Guan, Y.; Song, G.; Li, C.; Lim, K.H.; Wang, B.; Xia, L.; Song, H.; Liu, Y.; Wu, C.; Kawi, S. Ni-based core-shell structured catalysts for efficient conversion of CH4 to H2: A review. Carbon Capture Sci. Technol. 2024, 11, 100200. [Google Scholar] [CrossRef]
- Lu, Y.; Zhao, G.; Ge, Z.; Jia, Y.; Tang, J.; Gong, T.; Huang, S.; Li, Z.; Fu, W.; Mi, J. Challenges and development direction of deep fragmented soft coalbed methane in China. Earth Energy Sci. 2025, 1, 38–64. [Google Scholar] [CrossRef]
- Zhang, X.; Lin, B.; Li, Y.; Zhu, C.; Li, Q. Analysis of fractal dimension of coal subjected to electrical breakdown based on nuclear magnetic resonance. J. Nat. Gas Sci. Eng. 2020, 79, 103345. [Google Scholar] [CrossRef]
- Wang, W.; Lyu, S.; Zhang, Y.; Shuqi, M. Research on Risk Assessment of Coalbed Methane Development Project Based on SEWM-GCA. IOP Conf. Ser. Earth Environ. Sci. 2019, 358, 032049. [Google Scholar] [CrossRef]
- Uliasz-Misiak, B.; Misiak, J.; Lewandowska-Śmierzchalska, J.; Matuła, R. Environmental Risk Related to the Exploration and Exploitation of Coalbed Methane. Energies 2020, 13, 6537. [Google Scholar] [CrossRef]
- Tang, Z.; Yang, S.; Wu, G. Occurrence Mechanism and Risk Assessment of Dynamic of Coal and Rock Disasters in the Low-Temperature Oxidation Process of a Coal-Bed Methane Reservoir. Energy Fuels 2017, 31, 3602–3609. [Google Scholar] [CrossRef]
- Li, R.; Liu, X.; Huang, Z.; Cao, M.; Zhang, M.; Zhang, Y.; Jia, K. Analysis of the explosion risk of low-concentration oxygen-bearing coal bed methane in the low-temperature environment. Case Stud. Therm. Eng. 2024, 59, 104468. [Google Scholar] [CrossRef]
- Vinh, N.X.; Chetty, M.; Coppel, R.; Wangikar, P.P. Polynomial Time Algorithm for Learning Globally Optimal Dynamic Bayesian Network. In Proceedings of the Neural Information Processing, Shanghai, China, 13–17 November 2011; pp. 719–729. [Google Scholar]
- Xu, Q.; Liu, H.; Song, Z.; Dong, S.; Zhang, L.; Zhang, X. Dynamic risk assessment for underground gas storage facilities based on Bayesian network. J. Loss Prev. Process Ind. 2023, 82, 104961. [Google Scholar] [CrossRef]
- Liu, M.; Zhou, Y.; Sun, L. Risk Prediction of Gasifier System Based on Dynamic Cloud Bayesian Network. J. Phys. Conf. Ser. 2022, 2381, 012103. [Google Scholar] [CrossRef]
- Wen, J.; Zhang, L.; Guo, Z.; Tang, W.; Shang, S.; Liu, M.; Yun, F. Reliability and safety assessment of submarine pipeline stopper based on Fuzzy Comprehensive Dynamic Bayesian Network. Ocean Eng. 2024, 298, 117099. [Google Scholar] [CrossRef]
- de Ruijter, A.; Guldenmund, F. The bowtie method: A review. Saf. Sci. 2016, 88, 211–218. [Google Scholar] [CrossRef]
- Xie, S.; Dong, S.; Chen, Y.; Peng, Y.; Li, X. A novel risk evaluation method for fire and explosion accidents in oil depots using bow-tie analysis and risk matrix analysis method based on cloud model theory. Reliab. Eng. Syst. Saf. 2021, 215, 107791. [Google Scholar] [CrossRef]
- Li, M.; Wang, H.; Wang, D.; Shao, Z.; He, S. Risk assessment of gas explosion in coal mines based on fuzzy AHP and bayesian network. Process Saf. Environ. Prot. 2020, 135, 207–218. [Google Scholar] [CrossRef]
- Özaydın, E.; Fışkın, R.; Uğurlu, Ö.; Wang, J. A hybrid model for marine accident analysis based on Bayesian Network (BN) and Association Rule Mining (ARM). Ocean Eng. 2022, 247, 110705. [Google Scholar] [CrossRef]
- Lähdesmäki, H.; Shmulevich, I. Learning the structure of dynamic Bayesian networks from time series and steady state measurements. Mach. Learn. 2008, 71, 185–217. [Google Scholar] [CrossRef]
- Wang, N.; Wu, M.; Yuen, K.F. Dynamic enterprise resilience assessment for port systems: A framework integrating Bayesian networks and Dempster-Shafer evidence theory. Reliab. Eng. Syst. Saf. 2025, 262, 111105. [Google Scholar] [CrossRef]
- Kong, X.; Yao, J.; E, Z.; Wang, X. Generation Expansion Planning Based on Dynamic Bayesian Network Considering the Uncertainty of Renewable Energy Resources. Energies 2019, 12, 2492. [Google Scholar] [CrossRef]
- Pant, S.; Kumar, S. PIFS, ARC and Markov model based hybrid method for fuzzy time series forecasting. Expert Syst. Appl. 2025, 279, 127510. [Google Scholar] [CrossRef]
- Luo, C.; Liu, C.; Huang, C.; Qiu, M.; Li, D. ARIMA Markov Model and Its Application of China’s Total Energy Consumption. Energies 2025, 18, 2914. [Google Scholar] [CrossRef]
- Chen, Z.; Xia, Y.; Jiang, C. Reactor reliability modeling and reliable life analysis method for multi-state space reactor systems based on DBN and interval estimation. Prog. Nucl. Energy 2024, 168, 104999. [Google Scholar] [CrossRef]
- Ly, P.T.M.; Lai, W.-H.; Hsu, C.-W.; Shih, F.-Y. Fuzzy AHP analysis of Internet of Things (IoT) in enterprises. Technol. Forecast. Soc. Change 2018, 136, 1–13. [Google Scholar] [CrossRef]
- Singh, R.P.; Nachtnebel, H.P. Analytical hierarchy process (AHP) application for reinforcement of hydropower strategy in Nepal. Renew. Sustain. Energy Rev. 2016, 55, 43–58. [Google Scholar] [CrossRef]
- Mi, B.; Lü, S.; Wang, S.; Chen, Y.; Gao, C. Characteristics of Methane Leakage from Coal Seam Gas Wells in Coal Mining Areas and Leakage Quantity Model. Saf. Coal Mines 2022, 53, 150–156. [Google Scholar] [CrossRef]
- Wang, C.; Yu, W.; Chen, L.; Zhang, H.; Zhang, J.; Wang, C.; Wang, Z.; Lian, L.; Huang, H. A calculation method for the failure probability of corroded oil and gas pipelines considering two layers of correlations. Pet. Sci. Bull. 2024, 9, 819–830. [Google Scholar]
- Durmuşoğlu, Z.D.U. Assessment of techno-entrepreneurship projects by using Analytical Hierarchy Process (AHP). Technol. Soc. 2018, 54, 41–46. [Google Scholar] [CrossRef]
- Briceño-León, C.X.; Sanchez-Ferrer, D.S.; Iglesias-Rey, P.L.; Martinez-Solano, F.J.; Mora-Melia, D. Methodology for Pumping Station Design Based on Analytic Hierarchy Process (AHP). Water 2021, 13, 2886. [Google Scholar] [CrossRef]
Disclaimer/Publisher’s Note: The statements, opinions and data contained in all publications are solely those of the individual author(s) and contributor(s) and not of MDPI and/or the editor(s). MDPI and/or the editor(s) disclaim responsibility for any injury to people or property resulting from any ideas, methods, instructions or products referred to in the content. |
© 2025 by the authors. Licensee MDPI, Basel, Switzerland. This article is an open access article distributed under the terms and conditions of the Creative Commons Attribution (CC BY) license (https://creativecommons.org/licenses/by/4.0/).