Article

Two-Phase Flow Simulation of Bubble Cross-Membrane Removal Dynamics in Boiling-Desorption Mode for Microchannel Membrane-Based Generators

1
Institute of Refrigeration & Cryogenics Engineering, Dalian Maritime University, Dalian 116026, China
2
Fluids & Thermal Engineering Research Group, Faculty of Engineering, University of Nottingham, University Park, Nottingham NG7 2RD, UK
*
Author to whom correspondence should be addressed.
Energies 2025, 18(19), 5156; https://doi.org/10.3390/en18195156
Submission received: 15 August 2025 / Revised: 23 September 2025 / Accepted: 25 September 2025 / Published: 28 September 2025
(This article belongs to the Section J1: Heat and Mass Transfer)

Abstract

Compact and efficient absorption refrigeration systems can effectively utilize waste heat and renewable energy when operated in a boiling-desorption mode, which maximizes the desorption rate. Hydrophobic membranes play a critical role in microchannel membrane-based generators; however, limited research has addressed bubble cross-membrane removal dynamics under boiling-desorption conditions, particularly the influence of membrane hydrophobicity. In this study, a two-phase flow bubble-removal model was developed to accurately represent boiling-desorption behavior. Numerical simulations were performed to investigate the effects of membrane hydrophobicity and heating power on bubble dynamics, wall temperature, venting rate, and channel pressure drop. Results show that bubble venting proceeds through four stages: nucleation and growth, liquid-film rupture with deformation, lateral spreading, and sustained vapor removal. Hydrophobicity effects become most significant from the third stage onwards. Increased hydrophobicity reduces wall temperature, with greater reductions at higher heat fluxes, and enhances venting performance by increasing total vapor removal and reducing removal time. Channel pressure fluctuations comprise high-frequency components from bubble growth and low-frequency components from venting-induced flow interruptions, with relative contributions dependent on hydrophobicity and heat flux. These findings provide new insights into bubble-removal mechanisms and offer guidance for the design and optimization of high-performance microchannel membrane-based generators.

1. Introduction

Globally, thermal conditioning of the built environment, particularly for cooling, has become a major contributor to energy consumption. Statistics show that the operation of air conditioners and electric fans accounts for approximately 20% of the total electricity consumption in buildings, representing a substantial share of global electricity demand. This contribution is further amplified by the rising living standards in many of the world’s hotter regions, where the demand for active cooling devices, especially air conditioners, is growing rapidly. Projections indicate that by 2050, the energy required to meet global cooling demand will double compared to current levels [1]. At present, the residential cooling market is dominated by vapor-compression air conditioners. However, under extreme heat conditions, vapor-compression systems have notable shortcomings: their high electricity demand during peak periods imposes significant stress on power grids, and, due to reliance on high carbon-intensity peak power generation, they pose a major obstacle to achieving global carbon-neutrality goals [2,3]. These challenges highlight the urgent need for alternative cooling technologies with lower carbon emissions and greater sustainability.
Absorption refrigeration technology has emerged as a promising alternative pathway due to its unique advantages. Its core merit lies in the ability to utilize low-grade thermal energy, such as industrial waste heat or solar heat, as the primary driving force, thereby substantially reducing dependence on high-grade electricity and consequently cutting carbon emissions at the source. However, current absorption refrigeration systems face major challenges: the relatively large size of key components (e.g., absorbers and generators) and limited efficiency in coupled heat and mass transfer processes [4,5,6]. These limitations restrict both overall system performance and the feasibility of compact designs. Therefore, innovative optimization of absorbers and generators, particularly to improve compactness and enhance heat/mass transfer, is identified as a critical breakthrough for enabling large-scale deployment of absorption cooling systems.
Among various approaches, advancing the generator that can efficiently operate with low-grade heat sources is central to achieving significant performance gains and meeting future green-cooling demands. Existing generator configurations in absorption refrigeration systems primarily include plate-type [7,8], falling-film [9,10,11], and microchannel designs [12,13]. Comparative performance studies [14] have indicated that the microchannel membrane-based generator, owing to its distinctive membrane-interface design, exhibits substantially superior heat and mass transfer characteristics compared with other types. The membrane structure provides an exceptionally large specific surface area, greatly intensifying interfacial processes and enabling efficient desorption of refrigerant vapor even under low-grade heat input [15]. In a seminal experimental study, Isfahani et al. [16] revealed the internal vapor desorption mechanisms in such generators, identifying two distinct modes: (i) direct diffusion, dominant when the solution temperature is below the saturation point, and (ii) boiling driven desorption, prevailing once the temperature exceeds saturation. Notably, the data confirmed that under sufficient superheat (e.g., 30 °C), the vapor production rate in boiling desorption can reach up to 2.5 times that of direct diffusion, indicating a significant performance enhancement potential. This pronounced efficiency gap has motivated researchers to focus on the key phenomena in boiling desorption. Specifically, bubble dynamics within the microchannel and their cross membrane venting process. To investigate this process, Isfahani et al. [16] further conducted preliminary experiments at room temperature to examine the effect of water flow variation on air bubble venting across the membrane. They observed that excessively high liquid flow velocities hinder complete bubble removal. Based on these findings, they proposed an optimization strategy involving the addition of an adiabatic section downstream of the solution outlet to promote full bubble separation. Subsequently, Venegas et al. [17] experimentally confirmed that boiling desorption can achieve high volumetric power densities, up to 415 kW/m3, far exceeding the typical performance of generators in small capacity absorption chillers reported by Asdrubali et al. [18].
Subsequent to the clear identification by Isfahani et al. [16] of the two desorption modes present in microchannel membrane-based generators, follow-up research has been conducted on the theoretical investigation corresponding to these two modes. To the best of the authors’ knowledge, the most significant contributions to the theoretical research on the two desorption modes have been made by Venegas et al. [19,20]. The authors proposed heat and mass transfer calculation models for each desorption mode, which are primarily composed of empirical correlations. These models allow direct analysis of the effects of variations in microchannel structural parameters, membrane parameters, and operational parameters on the desorption performance of microchannel membrane-based generators using empirical relationships. Furthermore, the authors also provided a ranking of the degree of influence of these parameters on the generator’s desorption performance, offering theoretical guidance for the design and optimization of generators. Subsequently, to improve the accuracy of the results calculated with these empirical correlations, Zhai et al. [13] conducted experimental work on microchannel membrane-based generators under actual lithium bromide solution conditions. They recalibrated the correlations used in the heat transfer model, specifically the Nusselt number, and in the mass transfer model, specifically the Sherwood number, as well as the relationship for calculating frictional pressure drop in the solution channel. Currently, the existing theoretical models based on empirical correlations can only numerically reflect the impact of varying conditions on the desorption performance of generators operating in the boiling desorption mode. However, they are unable to visually illustrate the behavioral changes during bubble removal in the two-phase flow under this mode.
The influence of membrane hydrophobicity on transmembrane vapor flux has been extensively studied in the field of membrane distillation. In processes employing porous membranes for distillation, membrane wetting and temperature polarization are two critical issues that directly affect the operational lifetime and productivity of the system. Previous studies have demonstrated that modifying membrane surfaces with hydrophobic or superhydrophobic materials, such as carbon nanotubes [21,22,23,24], graphene-based layers [25], and metal–organic frameworks (MOFs) [26], can significantly enhance membrane performance. These coatings improve both the hydrophobicity and thermal conductivity of the membrane surface, thereby increasing resistance to wetting and reducing temperature polarization effects, which collectively lead to improved distillation efficiency. Although these studies do not directly involve two-phase flow, they provide substantial evidence that enhanced membrane hydrophobicity can increase transmembrane mass flux. Furthermore, this body of work offers valuable insights and potential strategies for optimizing the membrane properties in microchannel membrane-based generators in future applications.
In summary, although important experimental insights and theoretical predictions have been gained into the boiling desorption mechanisms and macroscopic performance of H2O/LiBr working pairs in microchannel membrane-based generators, two critical knowledge gaps remain. First is the coupled mechanism of bubble dynamics and cross membrane removal. Existing studies have yet to fully elucidate how the complete bubble life cycle within the microchannel, including nucleation, growth, and cross membrane venting, collectively influence overall desorption efficiency. Especially, the entire process should be presented from the perspective of visualization. Experimental observations or numerical simulations capturing the dynamic evolution of this coupled process are still lacking. Second is the influence of membrane hydrophobicity. The surface wettability of the membrane plays a decisive role in bubble formation, deformation, and eventual detachment at the membrane interface. However, systematic investigations into how hydrophobicity modulates bubble cross membrane dynamics remain sparse.
A deeper understanding of the coupled bubble dynamics, venting mechanism in boiling desorption mode, particularly the pivotal role of membrane hydrophobicity, is essential for overcoming the performance bottlenecks of microchannel membrane-based generators and for optimizing their design and operation. To address these gaps, the present study employs multiphase computational fluid dynamics (CFD) simulations to investigate bubble dynamics within microchannels and their cross membrane removal behavior under varying membrane hydrophobicity conditions. The findings aim to provide a theoretical foundation and design guidance for the development of next-generation high-efficiency, compact generators.

2. Numerical Methodology

2.1. Problem Description

In the field of optimizing the desorption performance of microchannel membrane-based generators, it has been established that the boiling desorption mode exhibits the highest desorption efficiency. Further enhancing and utilizing the advantages of this mode requires a clearer understanding of the two-phase flow desorption process within the microchannels. As illustrated in Figure 1, under the boiling desorption mode, the lithium bromide solution undergoes two distinct processes from inlet to outlet under phase change: bubble nucleation/growth and transmembrane removal. However, experimental observation of this process remains challenging. In practice, considering the corrosive nature of lithium bromide solution, the microchannels in generators are typically fabricated from stainless steel. Additionally, the porous membrane atop the microchannels is opaque, and the operation must be conducted under vacuum conditions. These factors collectively hinder the application of conventional visualization techniques. Computational Fluid Dynamics (CFD) thus presents an optimal alternative for investigation, although existing theoretical models still lack the capability to distinguish between gas and liquid phases accurately. Building on previous research, the bubble removal model developed in this study addresses this gap, with a focus on the dynamic behavior during the transmembrane removal of bubbles after contact with the membrane, as depicted in Figure 1, and the influence of membrane hydrophobicity variations on this process. Detailed descriptions will be provided in subsequent sections.

2.2. Governing Equations

In the present investigation, the two-phase flow phenomenon is considered under the assumption that it comprises incompressible, immiscible Newtonian fluids. For each discrete computational cell, the aggregate volumetric fraction of all constituent phases is constrained to be exactly unity [27], as formally described by Equation (1):
α l + α v = 1
The governing continuity equation for the two-phase flow, as implemented in the simulation framework, is formulated as follows [28]:
ν = m ˙ 1 ρ v 1 ρ l
The governing momentum equations describing the dynamics of the two-phase flow in the simulation framework can be expressed as [28]:
ρ ν t + ρ ν ν = P + μ [ ν + ν T ] + ρ g + F c s
In addition, this term corresponds to the surface tension effect, which is incorporated as a volumetric force according to the Continuous Surface Force (CSF) model developed by Brackbill et al. [29]. The value of F c s is determined through the application of Equation (4) [29].
F c s = σ ρ k α v 0.5 ( ρ l + ρ v )
The interfacial curvature, represented by k , are determined using the equations provided in Equation (5) [29].
k = α v | α v |
The energy equation is given in Equation (6) [30,31].
t ( ρ C p T ) + [ ρ C p ν T ] = ( λ T ) + e
e = m ˙ v H l v
After the transfer of energy and mass between the two phases has been completed, the development of the interface is captured by incorporating the volume fraction equation (Equation (8)) into the model [30].
α v t + . ( α v . ν ) = α v α m ˙
The governing rate equation for the discharge of a bubble through a hydrophobic membrane can be written as:
m ˙ v = A α v ρ v Δ t
The coefficient A is obtained through the dust gas model [19,20] calculation:
K m e m = M e m e m ( D e K R u T m e m + P m e m B o R u T m e m μ v )
D e K = ε d p 3 τ ( 8 R u T m e m π M ) 0.5
B o = ε d p 2 32 τ
τ = ( 2 ε ) 2 ε
A = K m e m Δ P
The transmembrane heat transfer of a bubble primarily comprises two mechanisms. The first involves heat conduction through both the porous membrane material and the gas contained within its pores. The second arises from transmembrane mass transfer, in which vapor transports the latent heat of vaporization from the fluid side to the vacuum side of the membrane’s upper portion. Owing to the very low effective thermal conductivity of a hydrophobic membrane with a specific porosity [32], combined with the vacuum condition on the membrane’s upper side and the negligible amount of gas present within the pores, the contribution of the first mechanism is considered insignificant [33]. Consequently, the transmembrane heat transfer can be reasonably approximated by the latter mechanism [31]:
Q v = m ˙ v H l v
In the given equation, the density, thermal conductivity, and viscosity are derived via a weighted-average computation, as presented in Equation (16) [30,31].
ϕ = ϕ l α l + ϕ v α v

2.3. Bubble Removal Mode

As shown in Figure 2a, the bubble removal process occurs within a computational region featuring a liquid–gas interface at the membrane boundary; the grid in the vicinity of this boundary is labeled with letters. At the beginning of each computational time step, the face grids within the computational domain are scanned. The bubble removal model developed in this study first identifies the boundary grid faces a, b, c, d, and e as the porous membrane. It then evaluates the liquid-phase volume fraction in the adjacent cells A, B, C, D, and E. According to the model, if the gas volume fraction in an adjacent cell is greater than or equal to 0.5, that cell is classified as a gas-phase cell (denoted as CV); otherwise, it is designated as a liquid-phase cell (denoted as Cl). As illustrated in Figure 2b, cells A, B, and C satisfy the gas-phase condition and are thus categorized as Cv, with their contents removed according to Equation (9). In contrast, cells D and E do not meet the criterion and are classified as Cl; their corresponding membrane surfaces d and e are treated as impermeable walls, and no contents are removed. This procedure enables the porous membrane to selectively permit vapor transport while inhibiting the passage of the liquid solution.

2.4. Solver Setup

In this study, the Second-Order Upwind scheme is employed for discretizing the momentum and energy equations, whereas the Geometric Reconstruction method is applied to the volume fraction equation. The format adopted for time discretization is the first-order implicit scheme. Surface tension is modeled using the Continuous Surface Force (CSF) approach, in which it is treated as a volumetric force, and the pressure–velocity coupling is achieved via the Pressure-Implicit with Splitting of Operators (PISO) algorithm. The time step is determined as the smallest value associated with all cells in the computational domain so that the Courant number remains below the prescribed limit. In this work, a value of 0.1 is employed. The time step should satisfy Δ t 0.1   h / u max , where u max is the maximum velocity. The time step used in the simulation is 5 × 10⁻⁷. The convergence criterion for the energy equation is set to 1 × 10⁻⁸, while for all other equations, it is set to 1 × 10⁻⁴. Iterations for each time step continue until the convergence criterion is satisfied.

2.5. Computational Domain Configuration

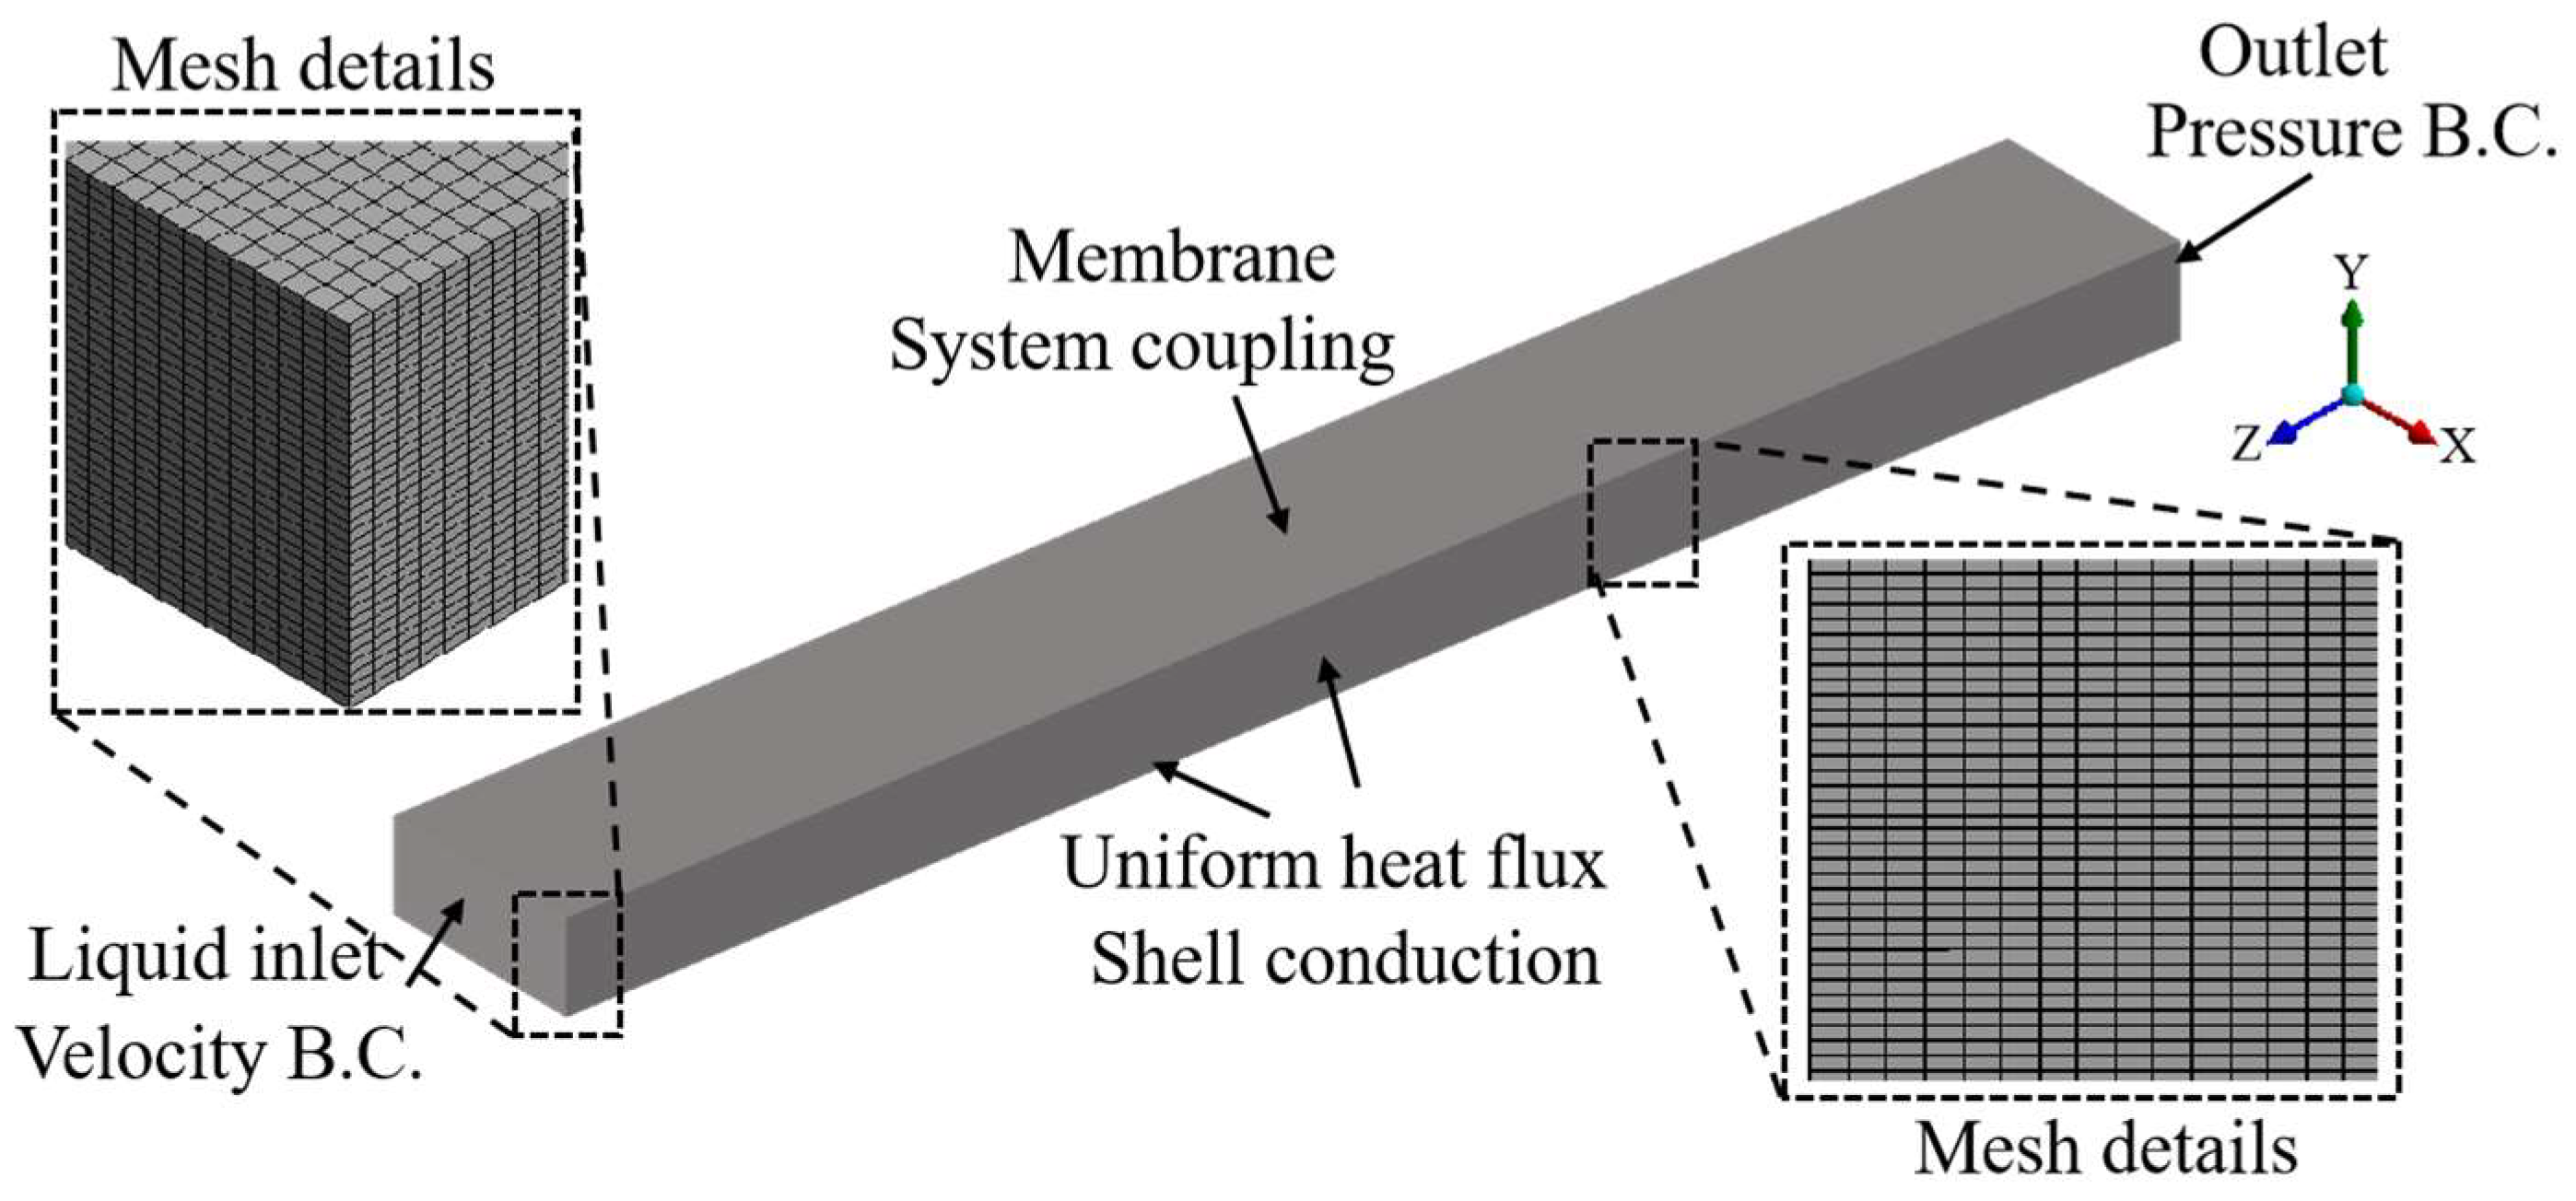
The computational domain consists of a three-dimensional rectangular fluid region measuring 5 mm in length, 0.3 mm in width, and 0.15 mm in height, as illustrated in Figure 3. The boundary conditions applied in the model are also shown in the figure. The top of the channel is formed by a hydrophobic membrane, while a uniform heat flux is imposed on the bottom surface and the two side walls. The inlet fluid enters the microchannel at a temperature approximately 3 K below the saturation temperature, thereby establishing a subcooled state. The flow rate at the solution inlet is 0.05 m/s. The working fluid is an H2O/LiBr solution with a mass fraction of 0.56 and a saturation temperature of 373.15 K, as summarized in Table 1. The parameters of the membrane and driving force are shown in Table 2. During the simulations, the contact angle between the solution and the stainless-steel channel surfaces was set to 110°, based on experimental measurements, as depicted in Figure 4.
The boundary condition at the top porous membrane was configured following the approach illustrated in Figure 5 [34], in which a system-coupling boundary condition was applied. In practical applications, a porous membrane usually possesses a finite thickness; however, the present study focuses exclusively on the process of bubble discharge from the microchannel through the porous membrane. The mass and heat transfer of vapor within the porous membrane, as well as after it exits the membrane, are not considered. Accordingly, the surface mesh at the top boundary is designated as the porous membrane, thereby simplifying it to a one-dimensional representation. The case configurations investigated in this study are summarized in Table 3.

2.6. Grid Independence Test

A three-dimensional structured orthogonal mesh was employed in this study. Mesh independence was examined by numerically simulating the variations in wall temperature and microchannel pressure drop for different mesh densities. The results are presented in Figure 6. As shown in Figure 6a, the temporal evolution of the average temperature on the bottom wall exhibits similar trends for all mesh densities. According to the results listed in Table 3, the deviation in the time-averaged wall temperature decreases with increasing mesh resolution. Figure 6b indicates that the temporal variation in pressure drop is closely related to the mesh size. As summarized in Table 4, the deviation in the time-averaged pressure drop is significantly reduced as the number of mesh elements increases. Considering both computational accuracy and efficiency, a mesh resolution of 330 × 20 × 25 (length × width × height) was selected for all subsequent simulations.

3. Numerical Model Validation

Given the scarcity of experimental data visualizing the boiling two-phase desorption process of H2O/LiBr solution in a microchannel membrane-based generator, the model validation in this study is conducted in two stages. The first stage verifies the bubble-removal model using the visualization experimental data reported by David et al. [35]. The second stage validates the phase-change model in the microchannel by comparison with the experimental data of Ramesh et al. [36] and the numerical results of Rajalingam et al. [37]. Subsequently, the two validation stages are integrated, and the details of each stage are described in the following subsections.

3.1. Bubble Removal Model Validation

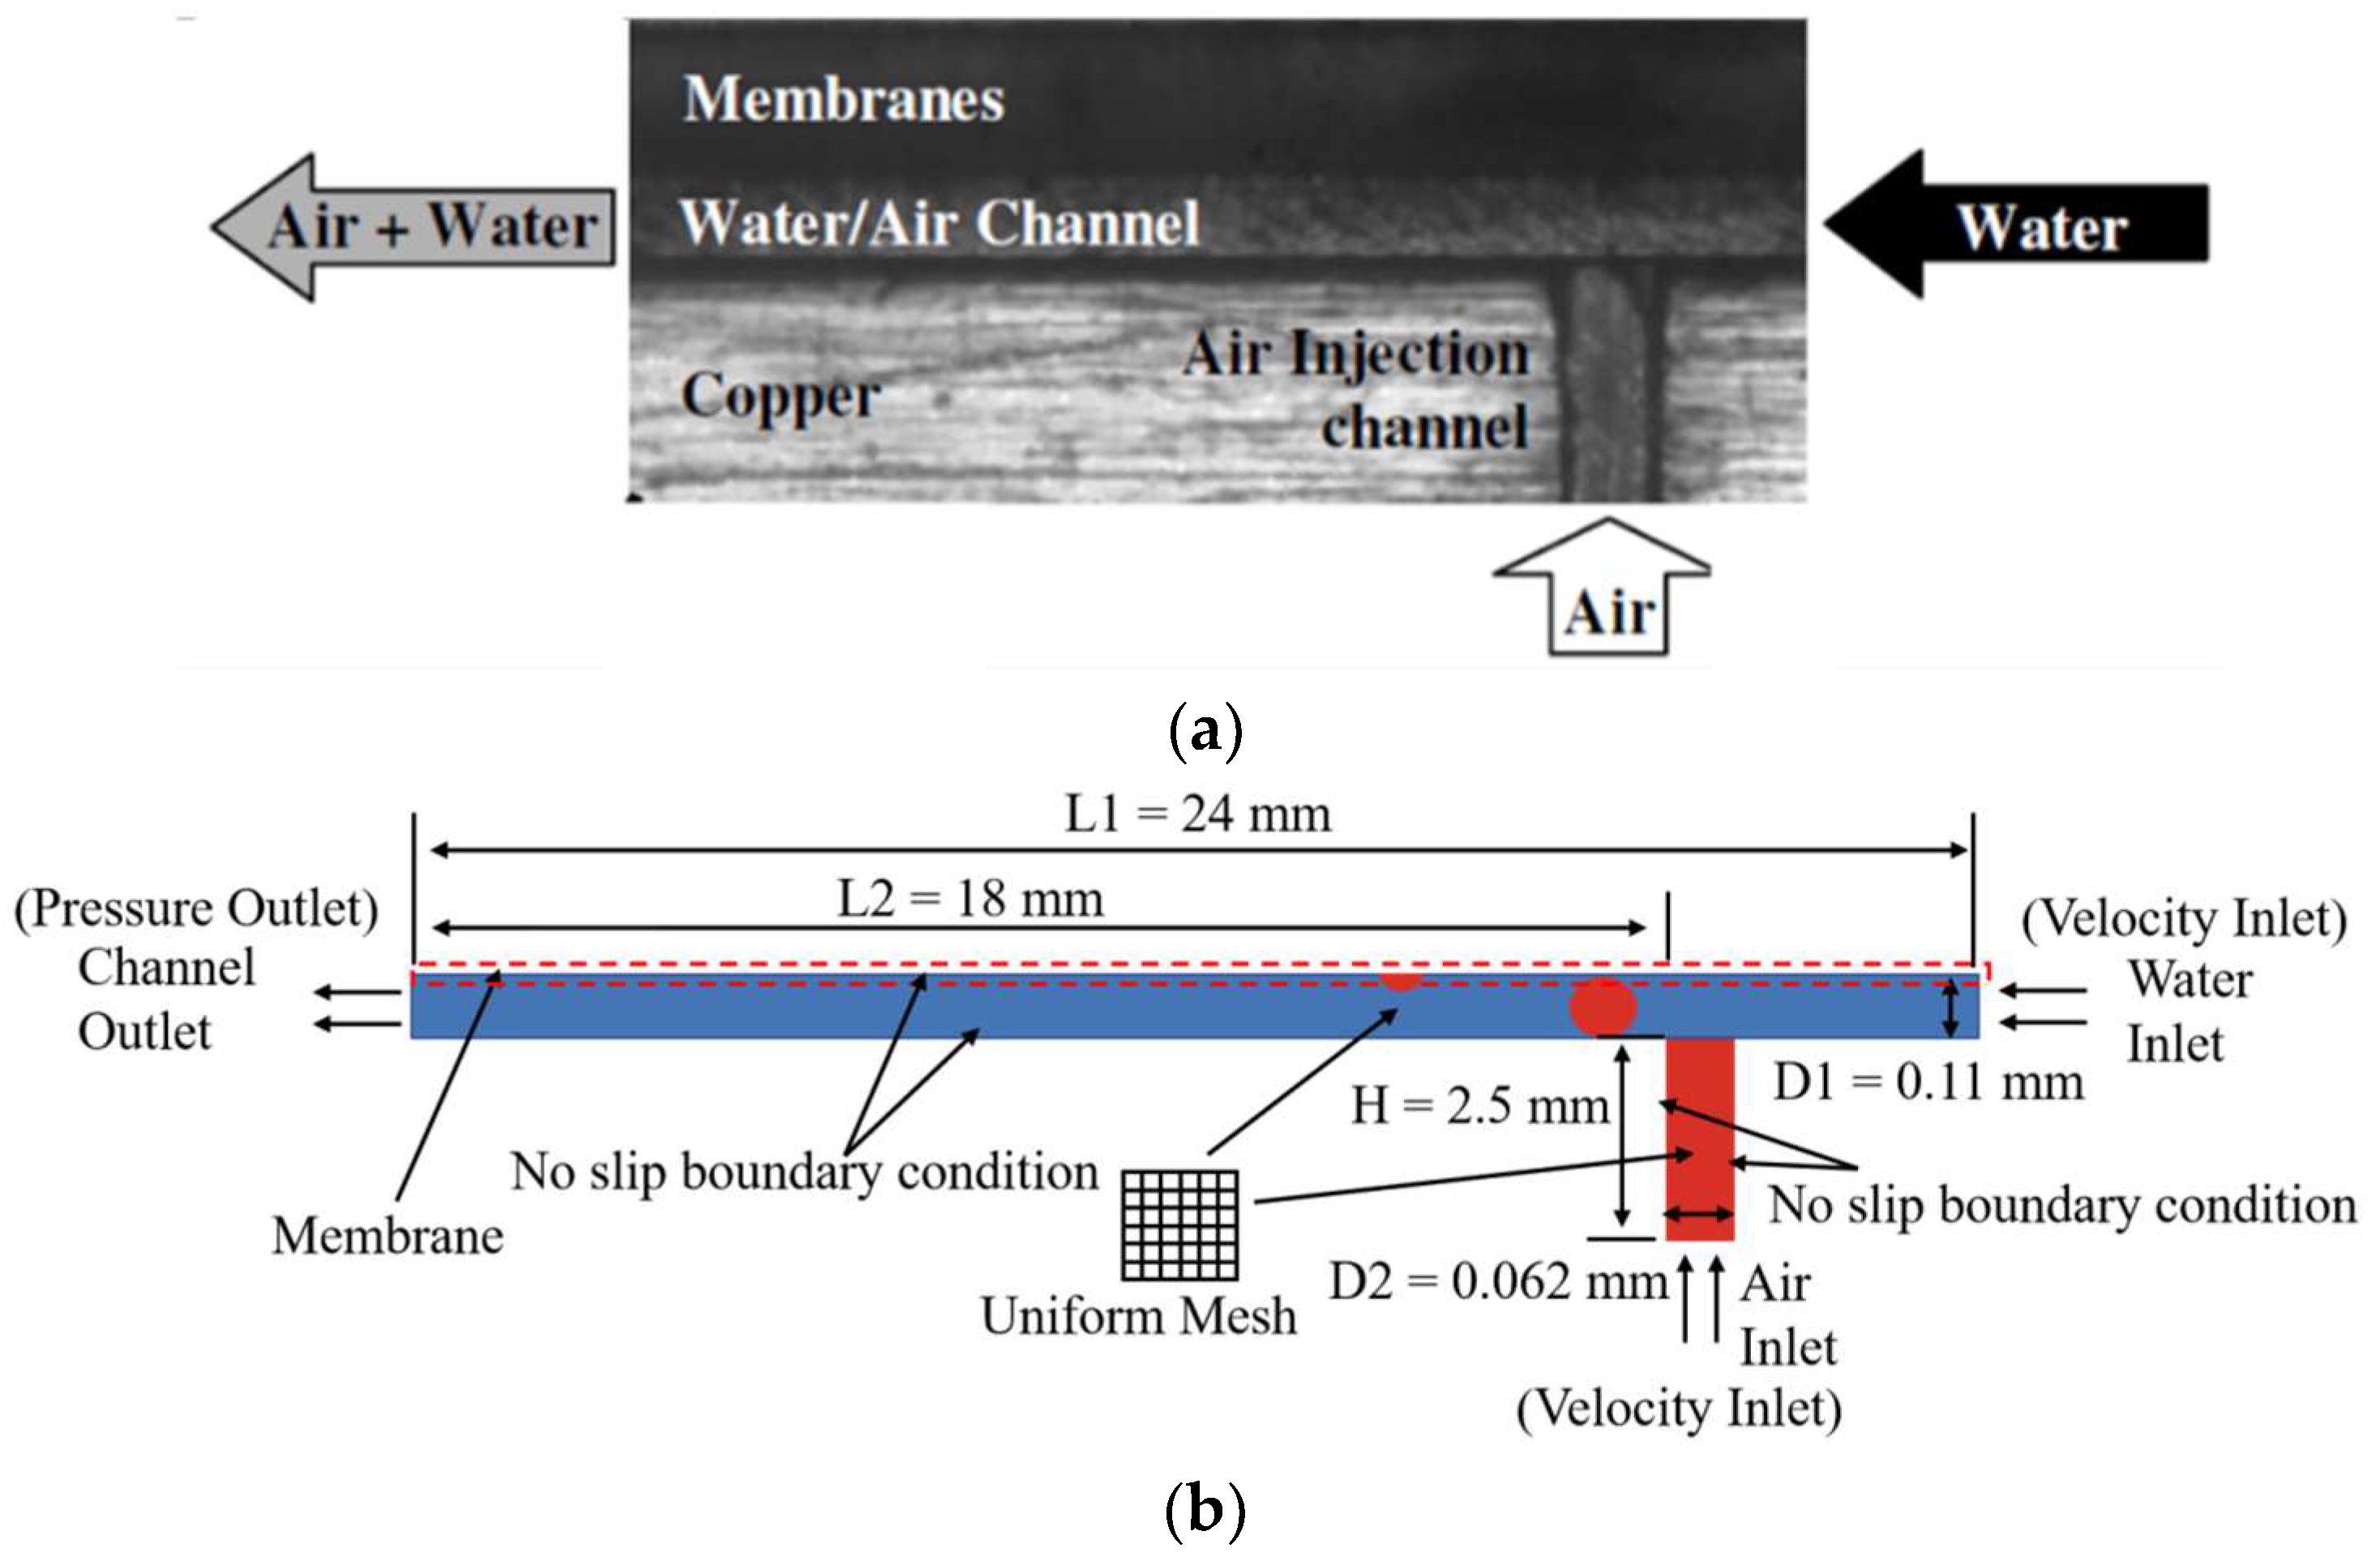
The experimental procedure for bubble removal, illustrated schematically by David et al. [35] (Figure 7a), was adopted as a reference for constructing a T-shaped microchannel physical model (Figure 7b). In this model, the continuous phase is introduced from the right inlet, while the dispersed phase enters from the bottom inlet. The entire experimental process was carried out at room temperature, and heat transfer effects were not considered. The fluid property data employed in the simulations are listed in Table 5 and are applicable solely to this section.
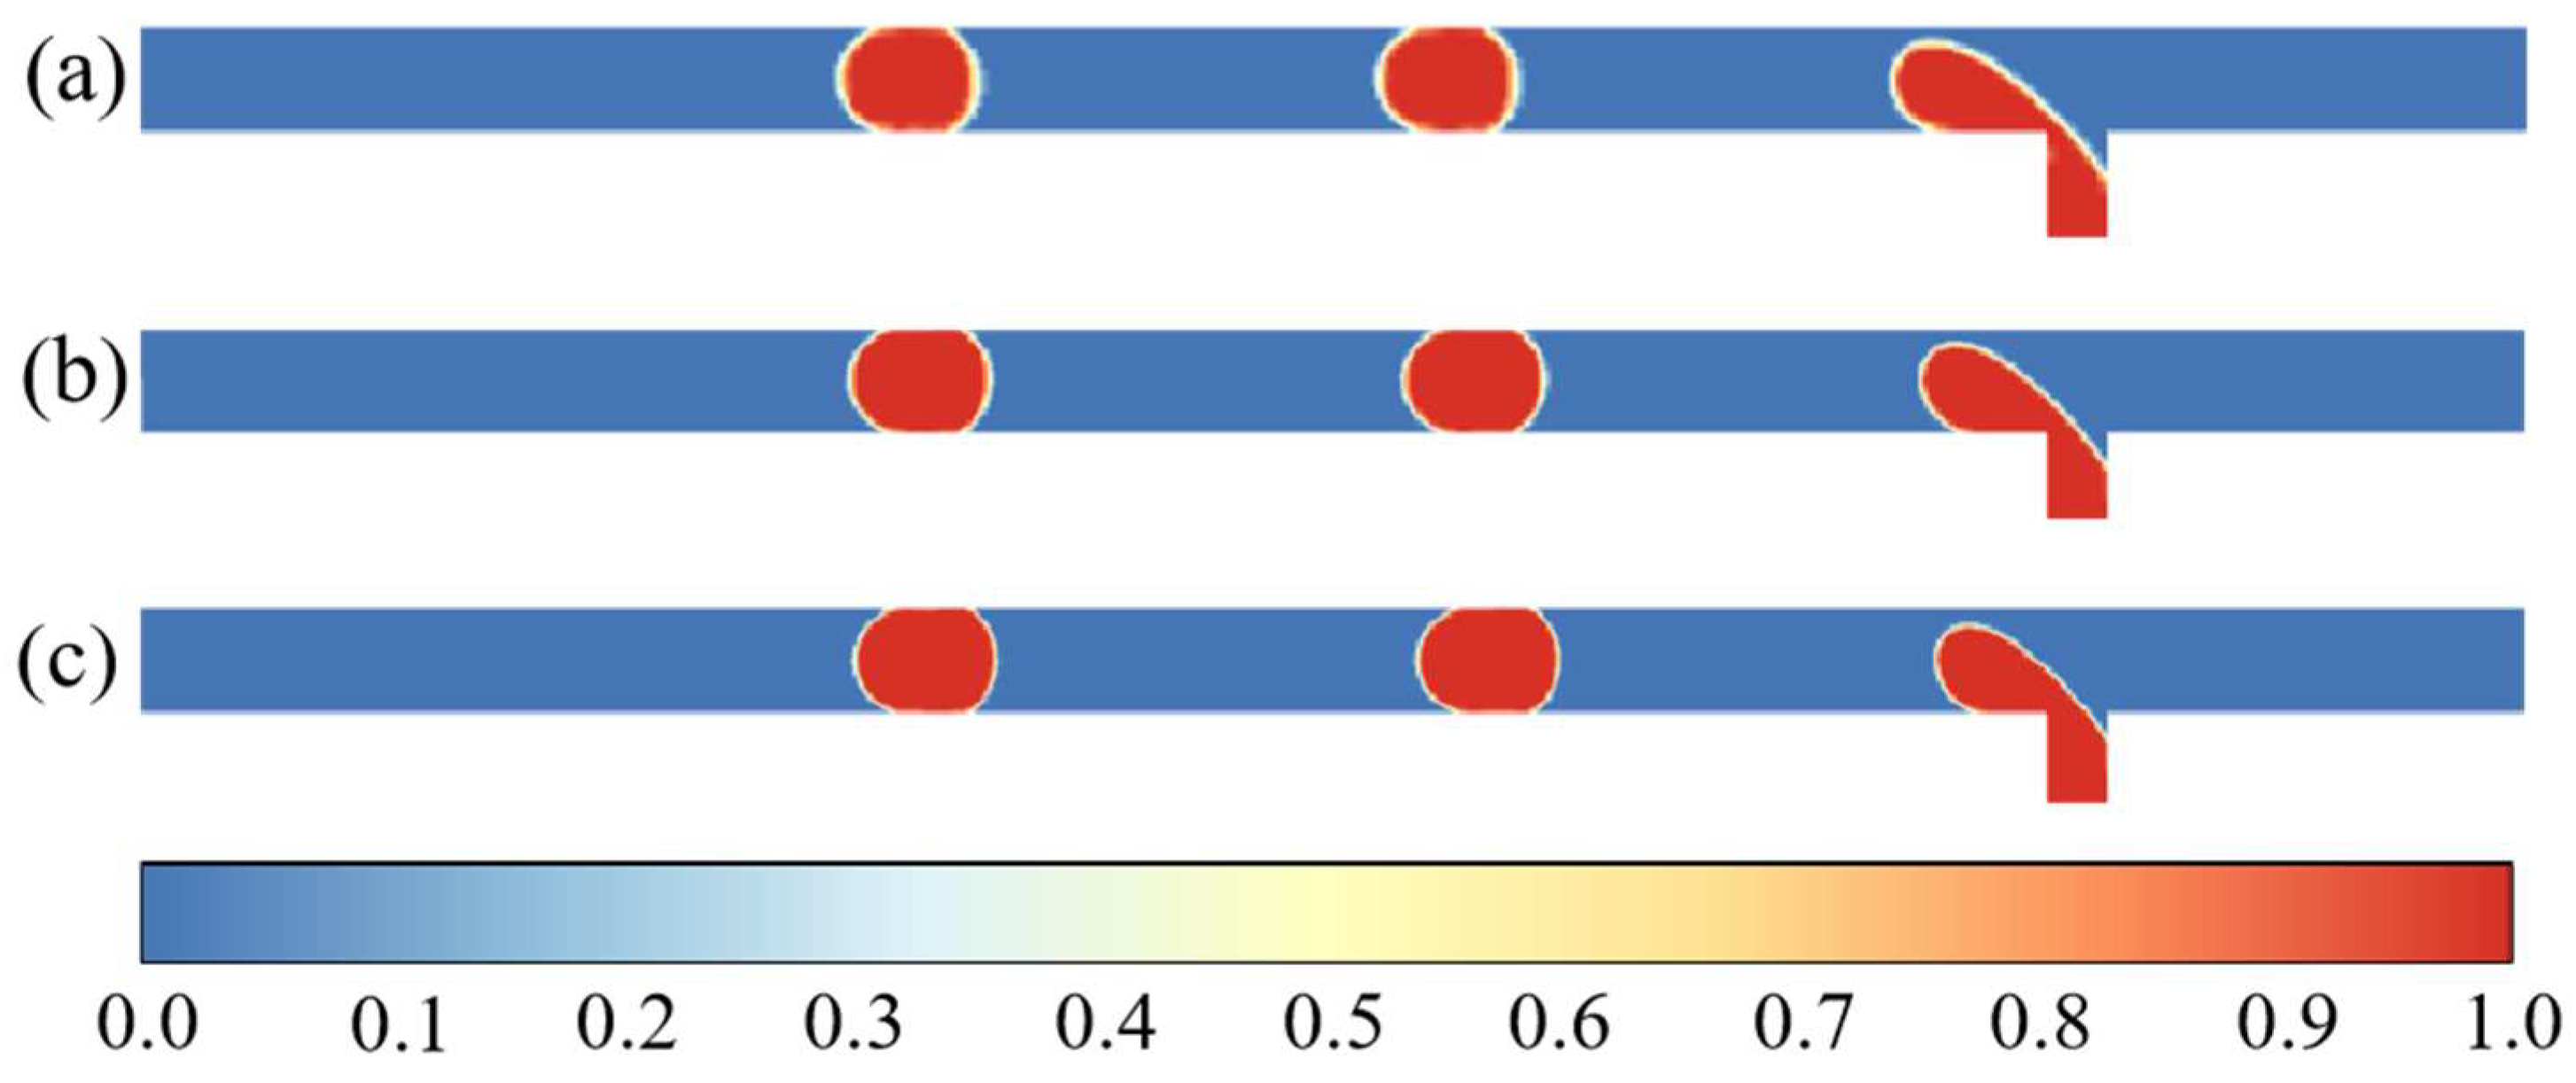
Grid independence was first examined by performing simulations with three different mesh sizes: 6 μm, 4 μm, and 3 μm. Figure 8 presents the volume fraction contours obtained at these resolutions. As the mesh size decreases, the phase interface becomes more well-defined and sharper. To quantitatively assess mesh effects, the influence of mesh size on gas–bubble length was analyzed, and the results are summarized in Table 6. The percentage deviation in bubble length was found to decrease with decreasing mesh size. Based on these observations, and in order to achieve a clear and distinct phase interface, a mesh size of 3 μm was selected for all subsequent simulations.
A comparison between the simulated and experimental bubble morphologies during the removal process is presented in Figure 9. Following contact with the membrane, the bubble spreads across its surface and gradually detaches from the bottom wall (Figure 9b). During spreading, the bubble undergoes deformation along the flow direction (Figure 9c). As its volume decreases, the bubble assumes a hemispherical shape (Figure 9d), which then shrinks progressively as venting continues. Overall, both the evolution of the bubble shape and the venting duration predicted by the simulation show good agreement with the experimental observations of David et al. [35], demonstrating that the proposed model can accurately describe and predict bubble removal through a porous membrane.

3.2. Validation of Phase Change Model

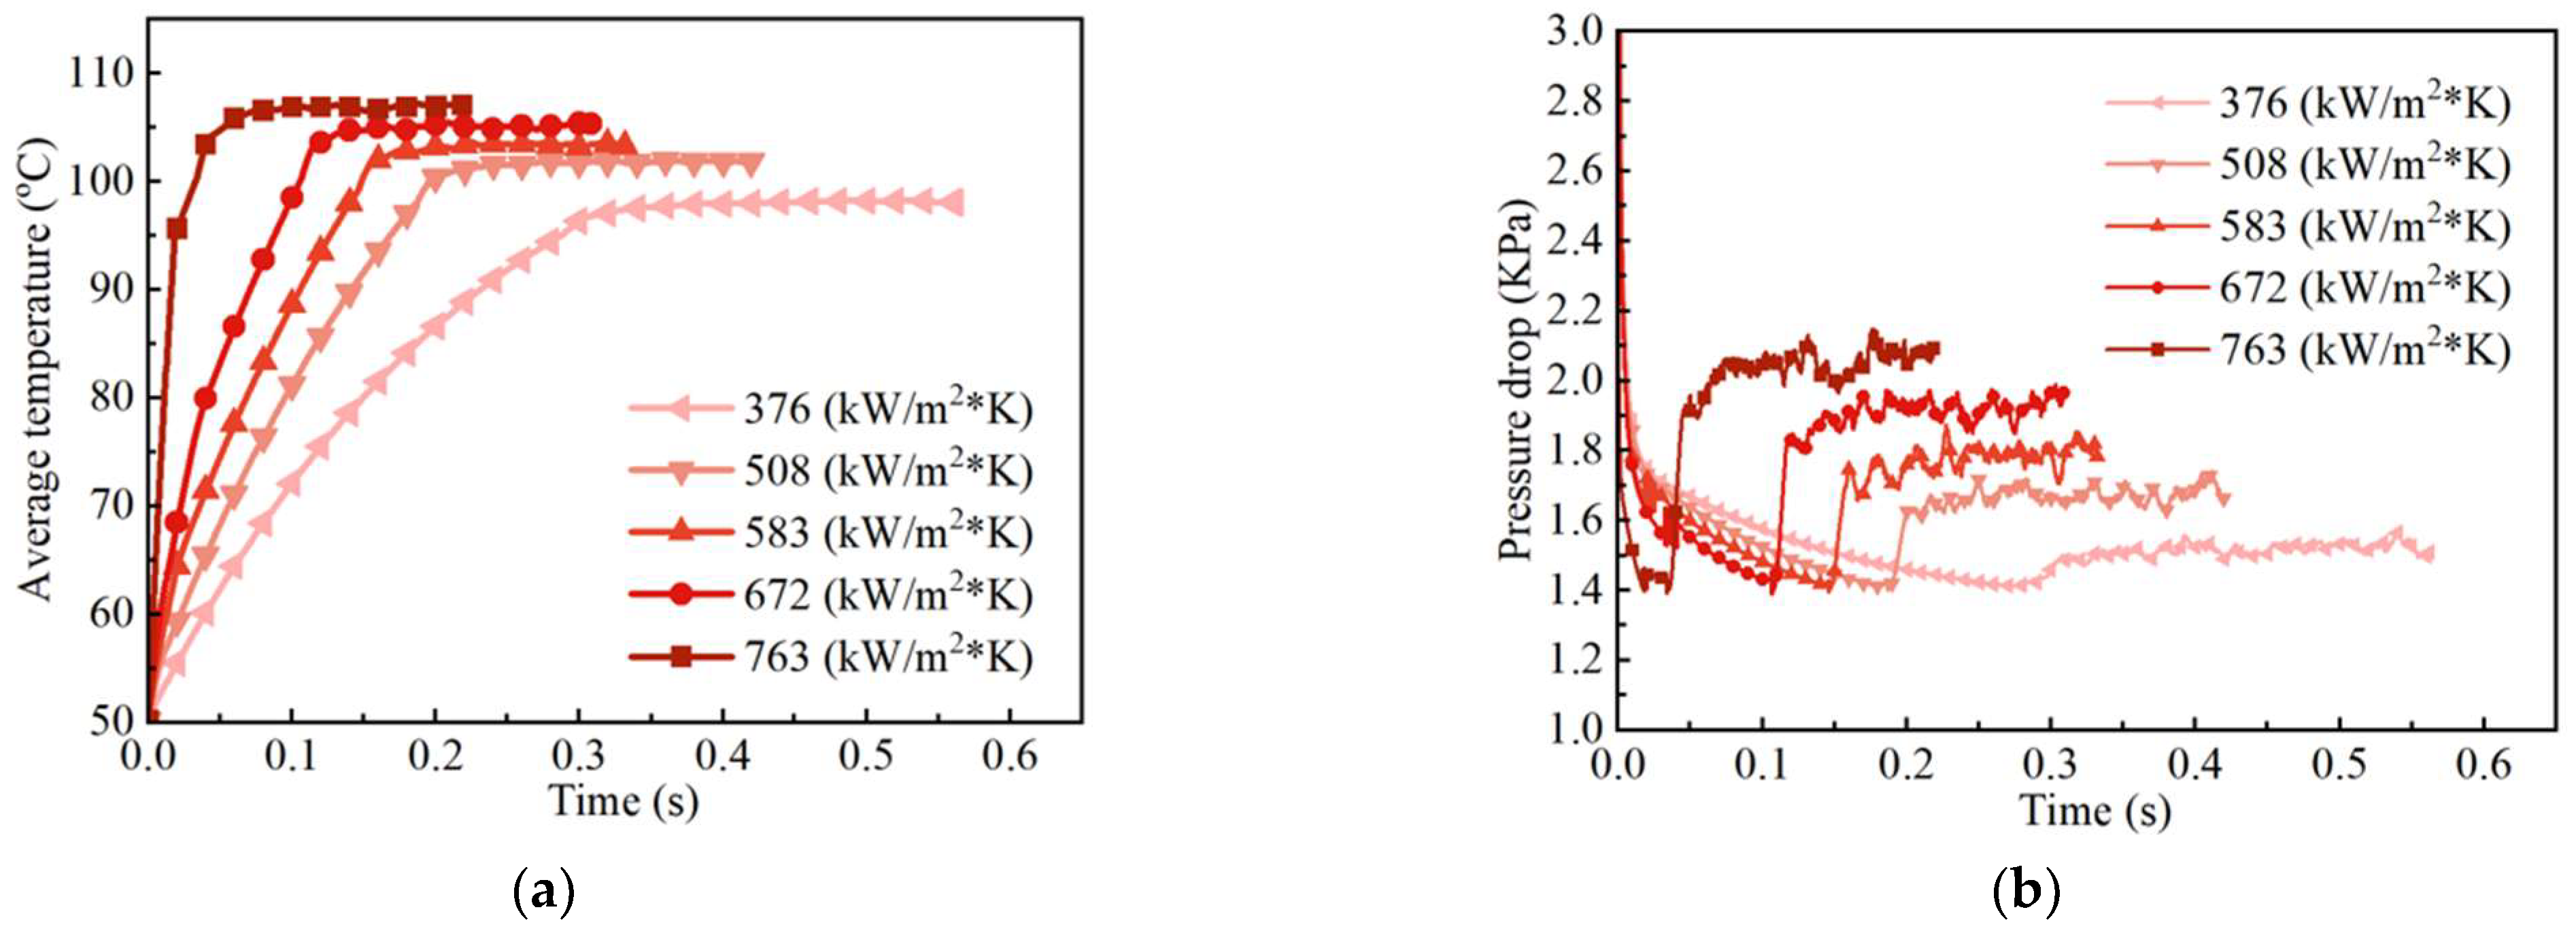
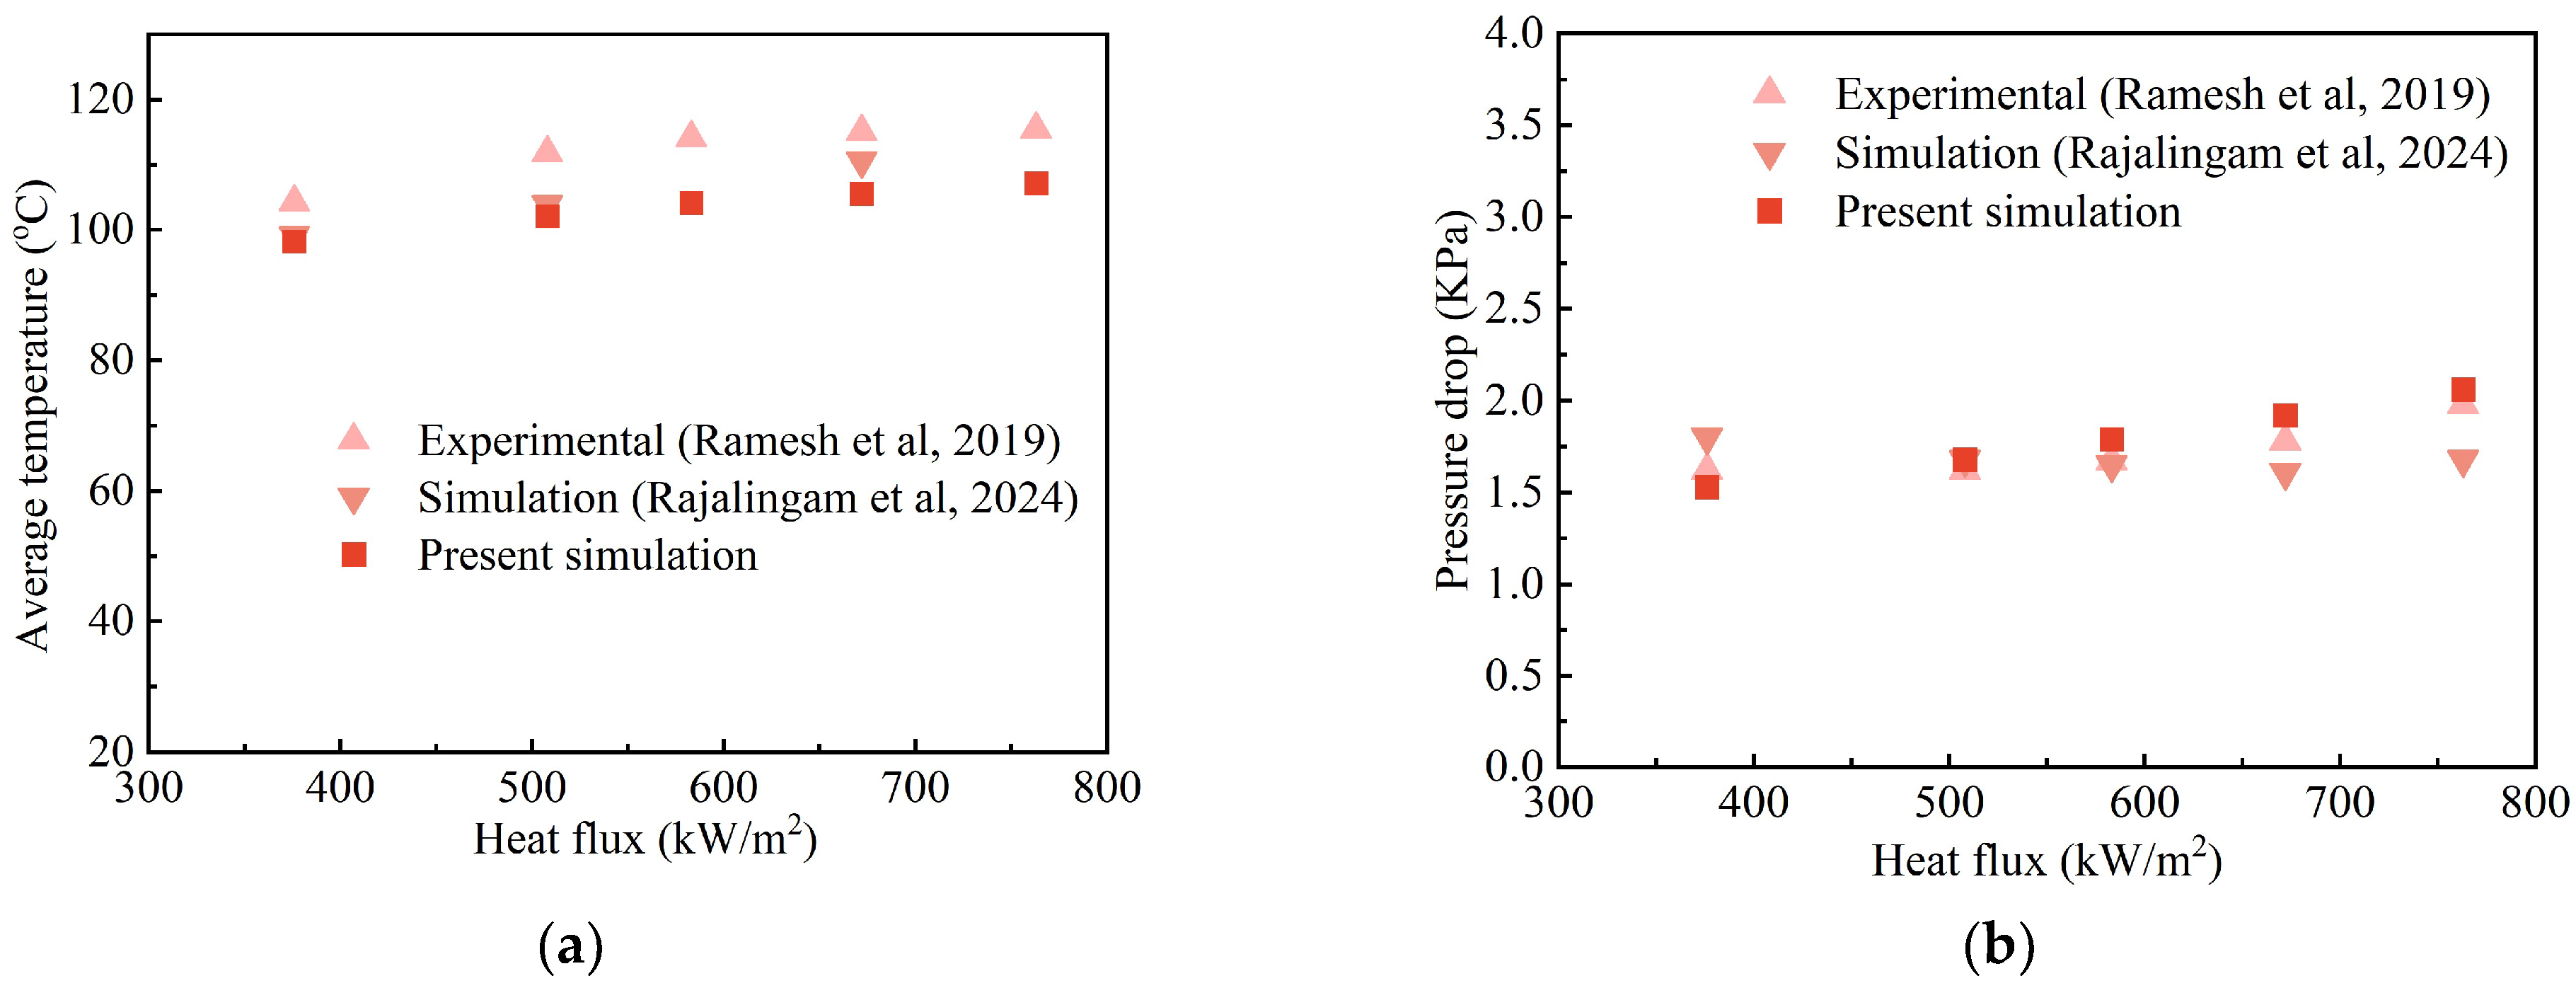
To ensure the accuracy of the computational model, the phase-change model was validated against the experimental data of Ramesh et al. [36] and the simulation results of Rajalingam et al. [37]. The phase-change model used in this article is the Lee model [38]. The geometrical dimensions and boundary conditions used in this validation are identical to those described by Ramesh et al. [36] and are summarized in Table 7. Both the experimental and numerical reference values were obtained under quasi-steady-state conditions. It should be noted that, when boiling occurs, the pressure drop inside the microchannel tends to fluctuate. To ensure the reliability and accuracy of the data used for validation, the temporal variations in wall temperature and pressure drop from the present simulations are presented in Figure 10. As shown, both parameters reached stable values suitable for comparison. The subsequent comparisons between the present simulation results and those of Ramesh et al. [36] and Rajalingam et al. [37] are shown in Figure 11. Figure 11a demonstrates that wall temperature exhibits a consistent increasing trend with rising heating-wall heat flux. Most of the present results show good agreement with both experimental and other numerical data, with a maximum deviation of 9.6%. The pressure-drop comparison is presented in Figure 11b, where the maximum deviation from Ramesh et al.’s [36] experimental results is 7.3%. These validation results confirm the accuracy of the present simulation approach.

4. Results and Discussions

4.1. Overview of Bubble Flow Patterns

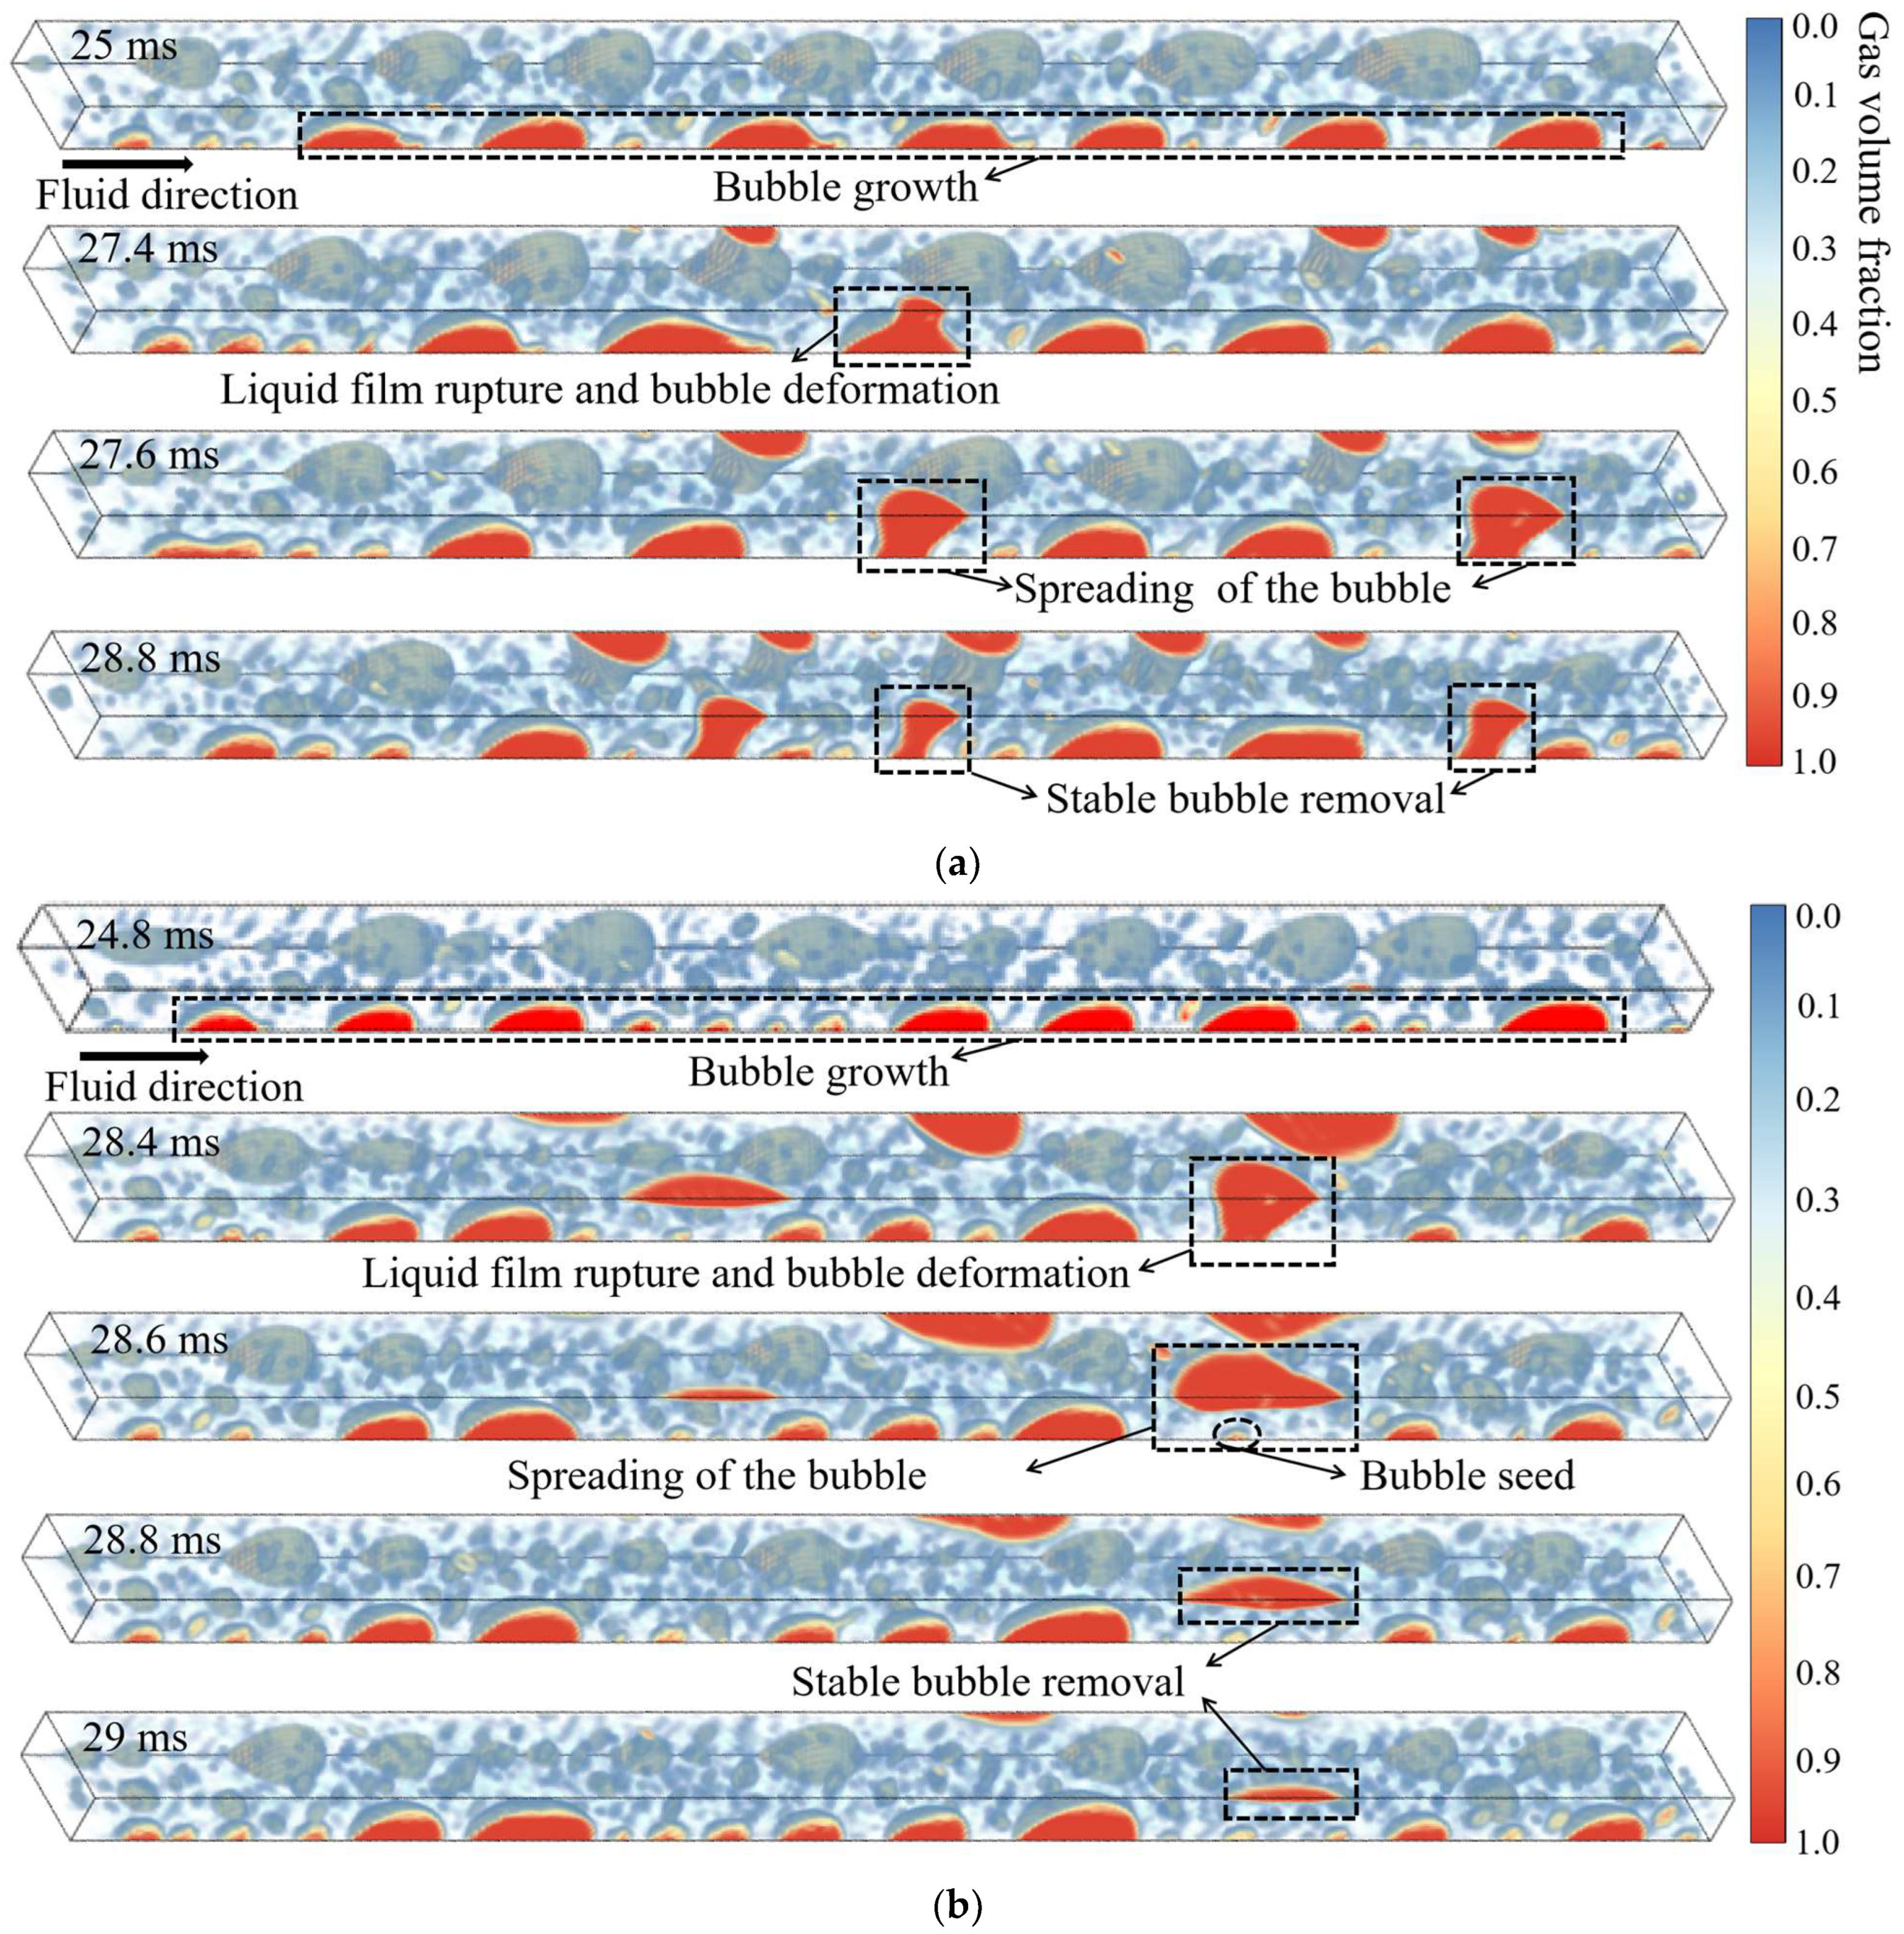
Figure 12 compares the flow patterns observed at a heat-flux condition of 200 kW/m2 for two cases in which the hydrophobicity of the membrane, characterized by the static contact angle, is 120°and 170°, respectively. To ensure comparability, all other initial and boundary conditions were kept identical, except for the hydrophobicity of the top vapor-channel membrane. As shown in Figure 12a, for the membrane with a contact angle of 120°, a bubble must first grow to a critical size and make contact with the top wall before venting through the membrane, as illustrated at t = 25 ms. Before the bubble comes into contact with the membrane, the change in the bubble flow pattern is not related to the hydrophobicity of the membrane. In the early stage of contact, the thin liquid film between the bubble and the membrane ruptures, when the bubble comes into contact with the membrane, the influence of the membrane on the bubble begins to take effect. Due to the strong adsorption ability of the hydrophobic membrane towards gases, the shape of the bubble changes significantly after coming into contact with the membrane. With time, upon contacting the membrane, the bubble begins to spread across its surface, as observed at t = 27.6 ms. However, because the hydrophobicity of the membrane is comparable to that of the bottom wall, the spreading is limited, and the bubble adopts a “trapezoidal-like” shape. The bottom wall and membrane surface compete in attracting the bubble, causing it to largely maintain this trapezoidal configuration throughout the venting process, as observed at t = 28.8 ms. From Figure 12b, it can be clearly observed that the change in membrane hydrophobicity does not affect the nucleation and growth process of the bubbles. Once the bubble comes into contact with the membrane, as the contact angle of the membrane increases to 170°, the spreading extent upon membrane contact is significantly greater, as evident at t = 28.6 ms. This enhanced spreading can be attributed to the superior bubble-adsorption capacity characteristic of a superhydrophobic membrane, consistent with the experimental findings of Park et al. [39]. Although the bottom wall still exerts a strong adhesive force on the bubble, preventing full detachment during spreading. However, for the superhydrophobic membrane, the bubbles can still largely detach from the bottom wall surface as a whole. But during the detachment process, bubble seeds will be left on the bottom wall surface. These bubble seeds will then undergo the aforementioned process again. The higher degree of spreading on the superhydrophobic membrane also indicates more effective utilization of the membrane surface area, which can enhance bubble-venting efficiency. Once the bubble reaches its maximum spreading extent, it enters a continuous shrinking stage as venting proceeds, as observed at t = 29 ms.
Based on the above analysis, the bubble-venting process can be divided into four sequential stages: (i) bubble nucleation and growth, (ii) liquid-film rupture and bubble deformation, (iii) bubble spreading, and (iv) continuous bubble removal. The influence of membrane hydrophobicity on venting dynamics becomes most pronounced starting from the third stage; nevertheless, the overall removal process follows a similar pattern in both cases.
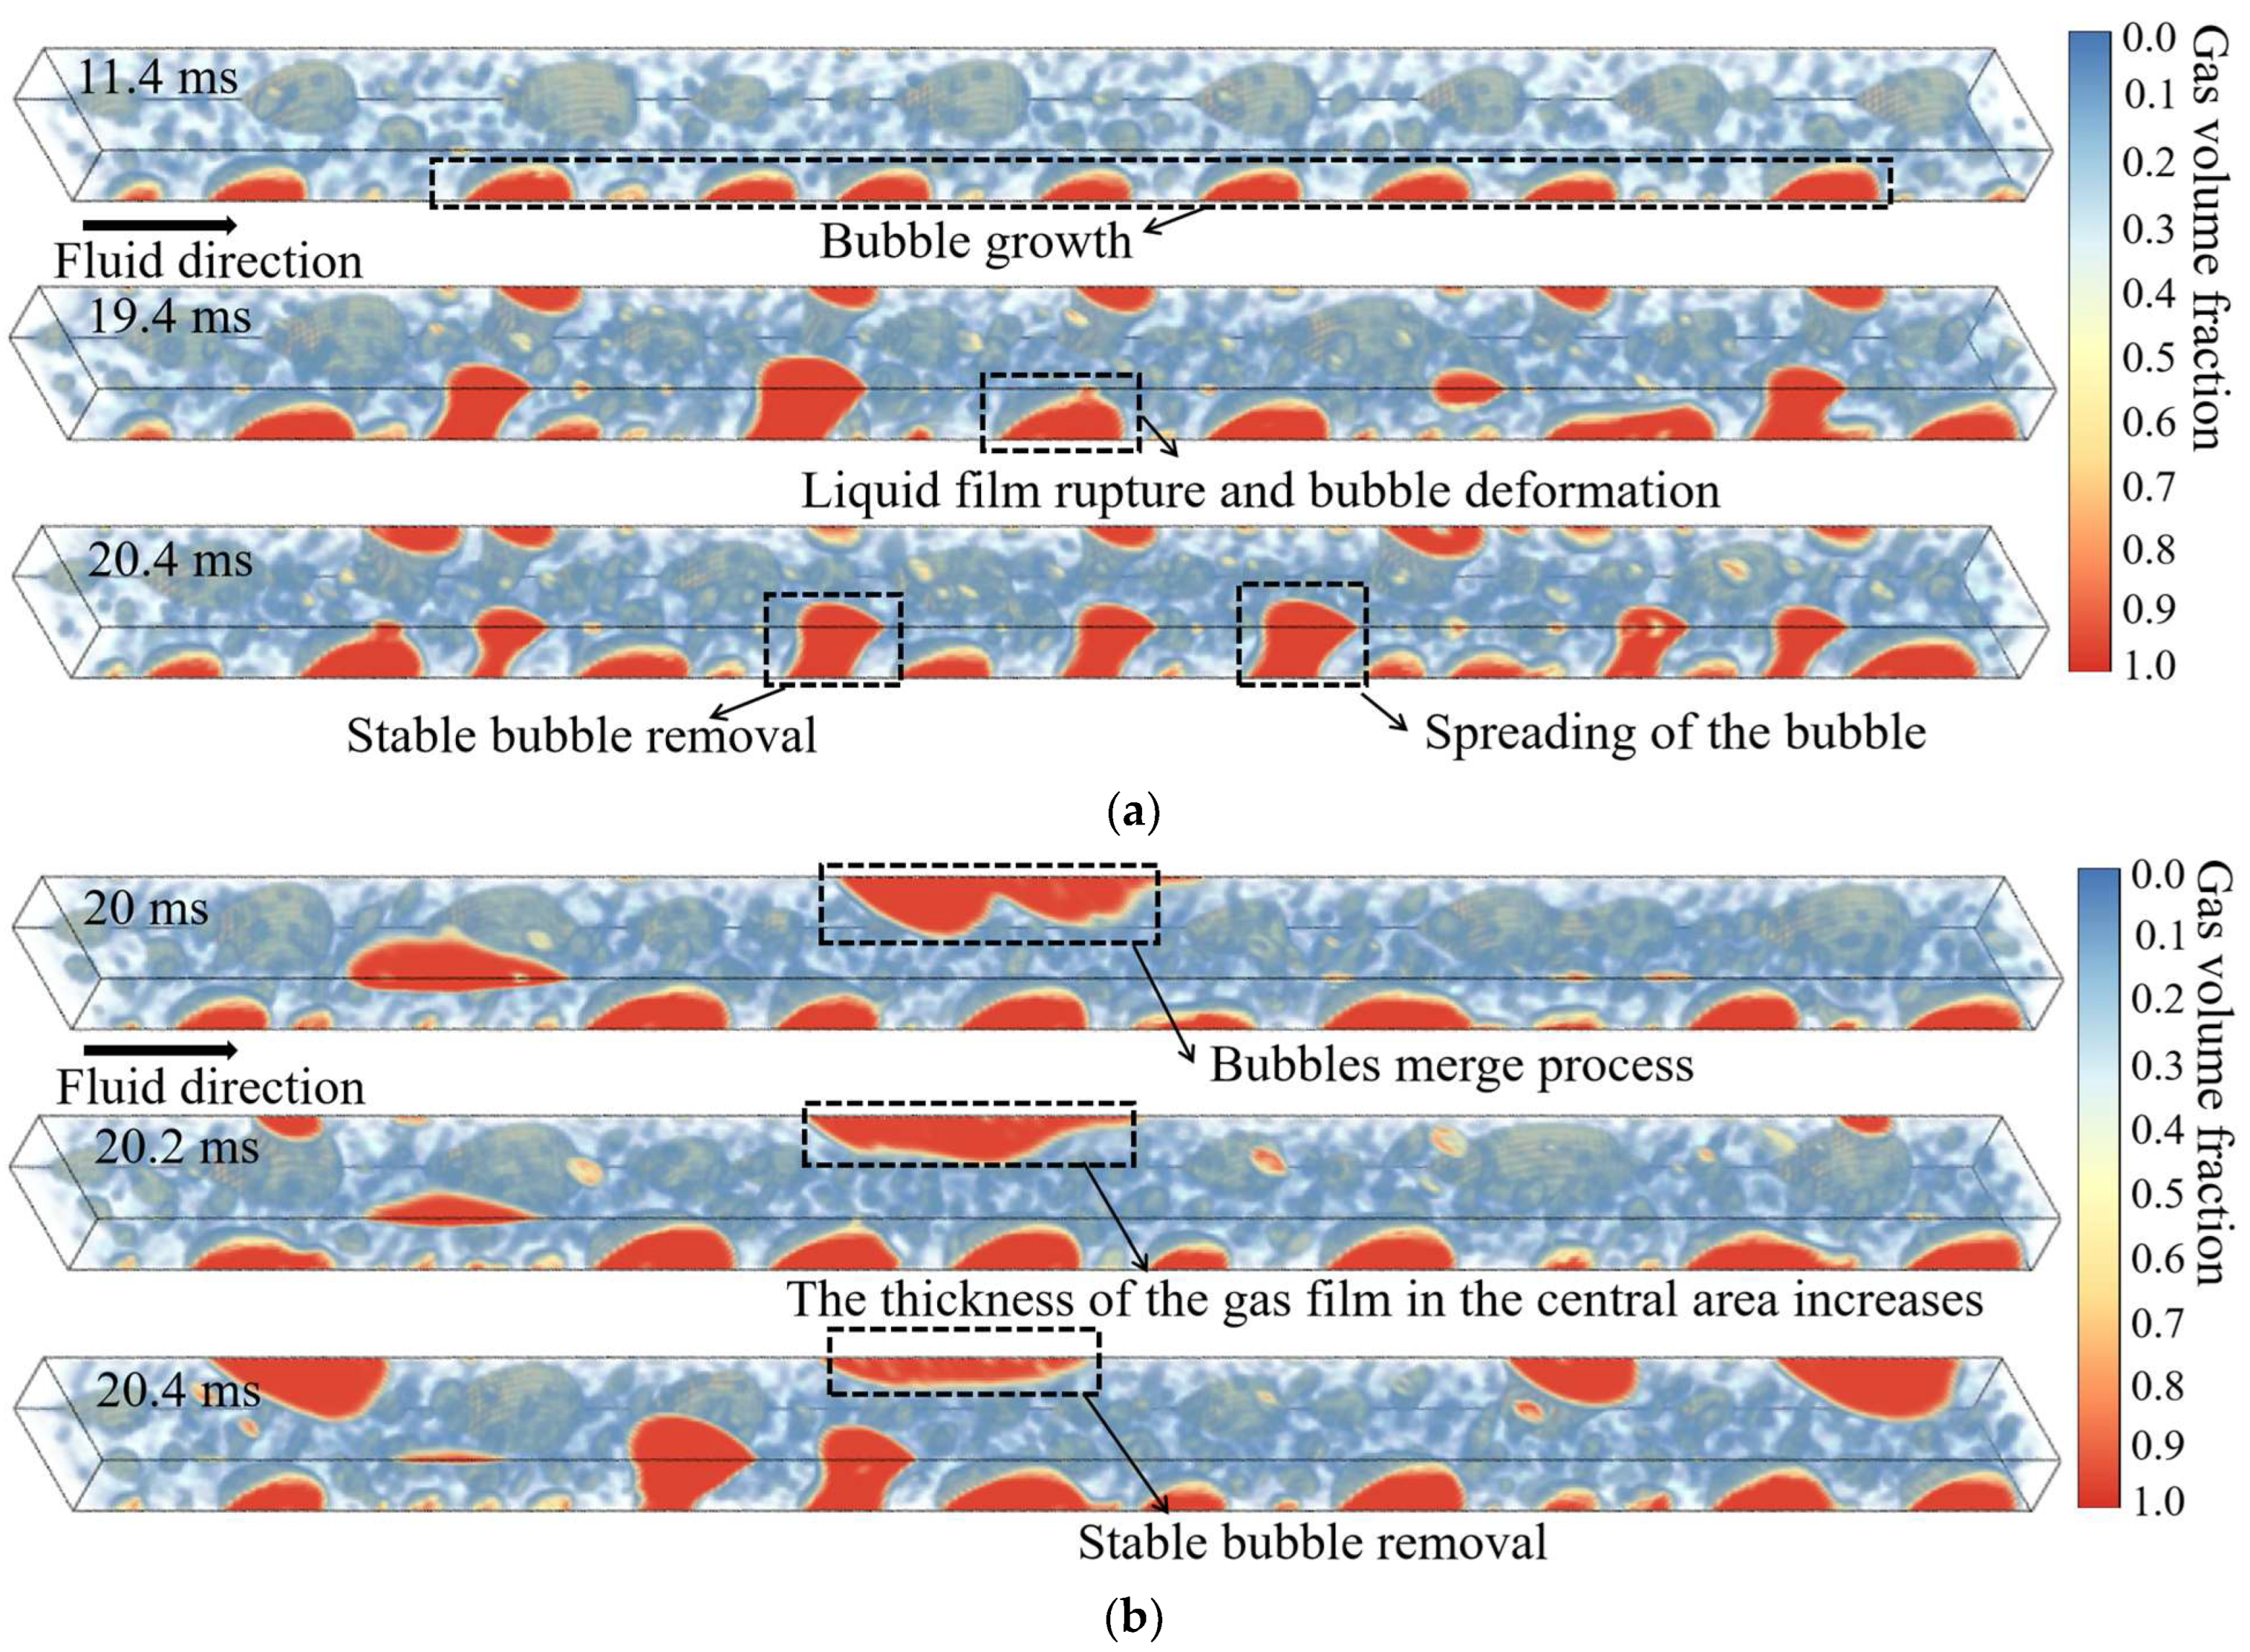
Figure 13 presents a comparison of the flow patterns at a heat flux of 650 kW/m2 for membranes with contact angles of 120° and 170°. As shown in Figure 13a, when the heating-wall heat flux is increased, the bubble removal dynamics under the hydrophobic membrane condition still follow the four stages described previously. Throughout the venting process, the bubbles retain a trapezoidal-like shape. The primary differences compared with the lower-heat-flux case are the increased number of bubbles and the earlier onset of each stage in the removal process. For the superhydrophobic membrane case, Figure 13b shows that the bubble removal dynamics also remain consistent with the previously described four stages. However, the probability of bubble coalescence during removal is noticeably higher. This is partly due to the increased bubble population and partly attributable to the enhanced spreading of bubbles on the superhydrophobic membrane surface. As illustrated at t = 20 ms, bubble coalescence occurs, and during subsequent spreading, the thickness of the vapor film at the bubble’s central region increases, as observed at t = 20.2 ms. This indicates that, under high-heat-flux conditions, a larger vapor cushion layer is more likely to form on the membrane surface, significantly increasing the contact area between vapor and membrane. Such an increase in contact area is favorable for enhancing the venting rate.
Overall, these observations suggest that increasing the heating-wall heat flux does not fundamentally alter the sequential stages of the bubble removal process, but it does modify specific features, including bubble quantity, timing of stage transitions, and the likelihood of coalescence.

4.2. Wall Temperature Distribution

Figure 14 presents the wall-temperature and bubble-distribution profiles along the bottom surface of the channel under different heat fluxes and membrane hydrophobicities (the conditions for different cases in the figure can be found in Table 3). For clearer assessment of the effect of the venting membrane, the figure also includes results for a reference case in which the top vapor-channel membrane is replaced by a solid wall. Except for this difference, all other initial and boundary conditions were kept identical. In all cases, the wall temperature rises rapidly from the inlet liquid temperature of 370 K to above the saturation temperature for boiling onset. At a heat flux of 200 kW/m2 (Figure 14a), the wall-temperature profiles in the upstream region are nearly identical for all cases. Combined with the small bubble sizes observed, this indicates that bubble nucleation dominates in this region and that venting is unlikely to occur at low heat flux, regardless of membrane presence. In the midstream and downstream regions, the wall temperature tends to stabilize. This corresponds to the presence of a continuous liquid film on the wall, enabling sustained evaporation. Compared with the no-membrane case, the occurrence of venting reduces the wall temperature due to enlarged liquid-film coverage on the heated bottom wall. At low heat flux, the influence of membrane hydrophobicity on wall temperature is minimal, as the total bubble population is small and the number of bubbles reaching the venting size threshold is similar for both membranes. At a heat flux of 650 kW/m2 (Figure 14b), the degree of overlap among wall-temperature curves in the upstream region decreases, implying that venting events occur closer to the channel inlet under high heat flux. In the midstream and downstream regions, the wall temperature again reaches a plateau, consistent with the continued presence of a liquid film. However, compared with the no-membrane case, the wall-temperature drop after venting is larger, and this reduction becomes more pronounced with increasing membrane hydrophobicity. According to the bubble-dynamics analysis in Figure 11, bubbles on the superhydrophobic membrane spread faster and to a greater extent, facilitating quick venting. This slows the growth of dry regions on the heated wall, as also reflected in the bubble distribution patterns in Figure 14b.
Overall, these results indicate that increasing the membrane hydrophobicity in a microchannel membrane-based generator reduces the wall-temperature level and that the magnitude of this reduction increases with applied heat flux.

4.3. Analysis of Differences in Venting Volume

Figure 15 illustrates the venting volumes in the channel under different heat-flux and membrane-hydrophobicity conditions (The conditions for different cases in the figure can be found in Table 3). In this study, the venting volume was calculated as the difference between the gas-bubble volume in a no-membrane channel and that in a membrane-equipped channel.
At a heat flux of 200 kW/m2, Figure 15a shows that the influence of the membrane on the gas-volume evolution inside the channel begins after t = 15 ms, with the difference from the no-membrane case increasing over time. The membrane prevents the continuous growth of gas holdup in the channel. The effect of membrane hydrophobicity becomes evident after t = 25 ms, when higher hydrophobicity produces more frequent fluctuations in gas volume due to the faster venting rate of bubbles on the superhydrophobic membrane. Figure 15b presents the cumulative venting volume over time for channels with different membrane hydrophobicities under the same heat flux. The superhydrophobic-membrane channel shows a 16% higher total venting volume than the hydrophobic-membrane channel. By comparing the gas venting volumes of different membranes at the same time in the figure, it was found that, for example, at the time t = 27 ms, the gas venting volume of the superhydrophobic membrane was approximately 44% higher than that of the hydrophobic membrane. Further comparing the remove times of different membranes with the same gas venting volume revealed that, to achieve the same venting volume, the superhydrophobic membrane took approximately 5.5% less time. Thus, it can be concluded that the increase in hydrophobicity enhances the desorption performance by increasing the gas venting volume and reducing the removal time. This further explains the reason for the faster venting rate observed in Section 4.1 for the superhydrophobic membrane. At a heat flux of 650 kW/m2, Figure 15c indicates that the membrane’s influence on gas-volume evolution appears earlier, at t = 11 ms, with a marked divergence from the no-membrane case occurring after t = 14 ms. This earlier onset is closely related to the increased bubble-generation rate and earlier occurrence of venting at high heat flux. The membrane significantly reduces the rate of increase in gas holdup in the channel. The effect of membrane hydrophobicity emerges after t = 13 ms, and the higher-hydrophobicity membrane maintains more frequent fluctuations, similar to the low-heat-flux case. In addition, near t = 20 ms, the volume of the bubbles in the microchannel shows a significant downward trend. By referring to the bubble cloud diagram near this time point in Figure 13b, it can be observed that at this moment, the bubbles aggregate on the superhydrophobic membrane surface. This process can further enhance the utilization of the membrane area, thereby accelerating the venting rate. Figure 15d shows that the superhydrophobic-membrane channel achieves 25% higher total venting volume than the hydrophobic-membrane channel, highlighting that the influence of membrane hydrophobicity on venting volume intensifies with increasing heat flux. As at high heat flux, the superhydrophobic-membrane channel also requires less time to reach the same cumulative venting volume.
Overall, the results indicate that increasing membrane hydrophobicity consistently enhances venting performance, and this enhancement becomes more pronounced at higher heat fluxes. The faster venting rates of superhydrophobic membranes not only increase total venting volume but also reduce the time required to achieve a given amount of gas removal.

4.4. Pressure Distribution

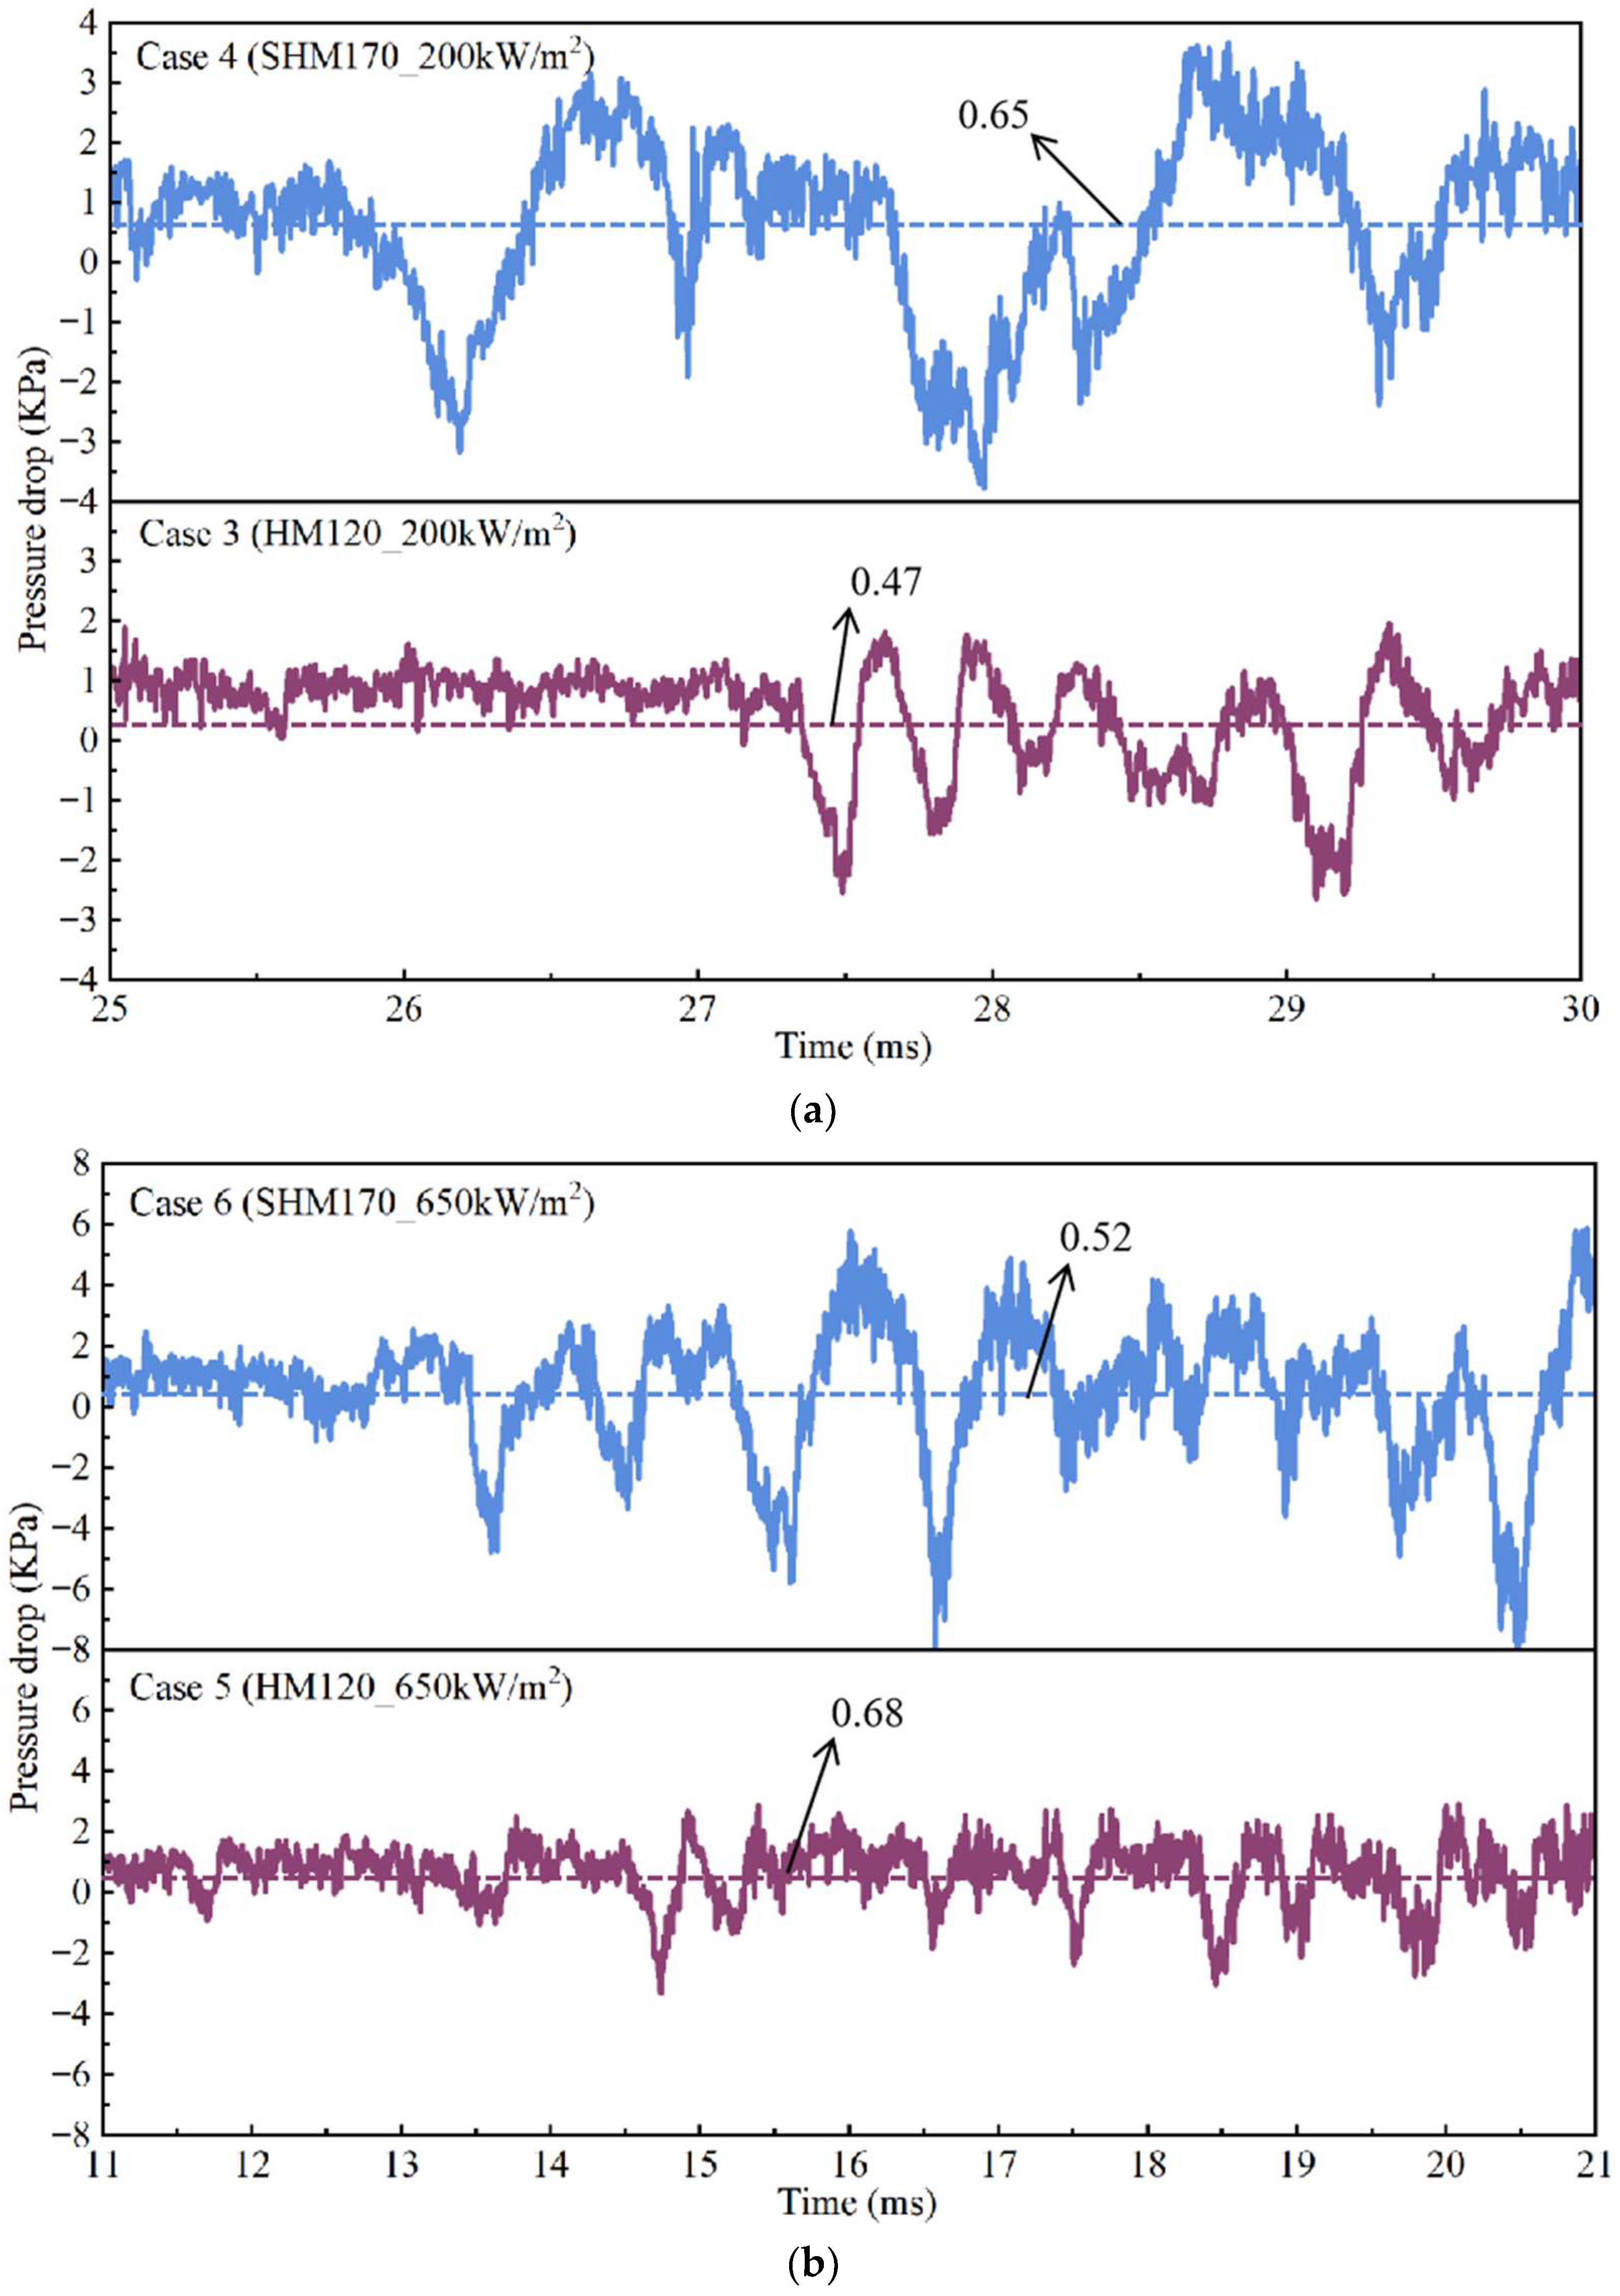
Figure 16 shows the temporal evolution of pressure drop in the channel under two heat-flux conditions and different membrane hydrophobicities (The conditions for different cases in the figure can be found in Table 3). At a heat flux of 200 kW/m2 (Figure 16a), comparison with the bubble-cloud images for Case 3 in Section 4.1 reveals that, during the bubble growth stage, the channel exhibits high-frequency but low-amplitude pressure fluctuations. After the onset of venting, the fluctuation frequency decreases while the amplitude increases. This trend becomes more pronounced with increasing membrane hydrophobicity. The channel with the superhydrophobic membrane exhibits a higher average pressure drop than that with the hydrophobic membrane. At a heat flux of 650 kW/m2 (Figure 16b), the patterns of frequency and amplitude variation with respect to membrane hydrophobicity are consistent with those observed at 200 kW/m2. However, both fluctuation frequency and amplitude increase overall as the heat flux rises. Interestingly, under this high-heat-flux condition, the channel with the superhydrophobic membrane exhibits a lower average pressure drop than the hydrophobic-membrane channel.
The underlying causes of these changes in pressure-fluctuation characteristics, as well as the role of membrane hydrophobicity in influencing them, require further investigation and will be analyzed in subsequent sections.
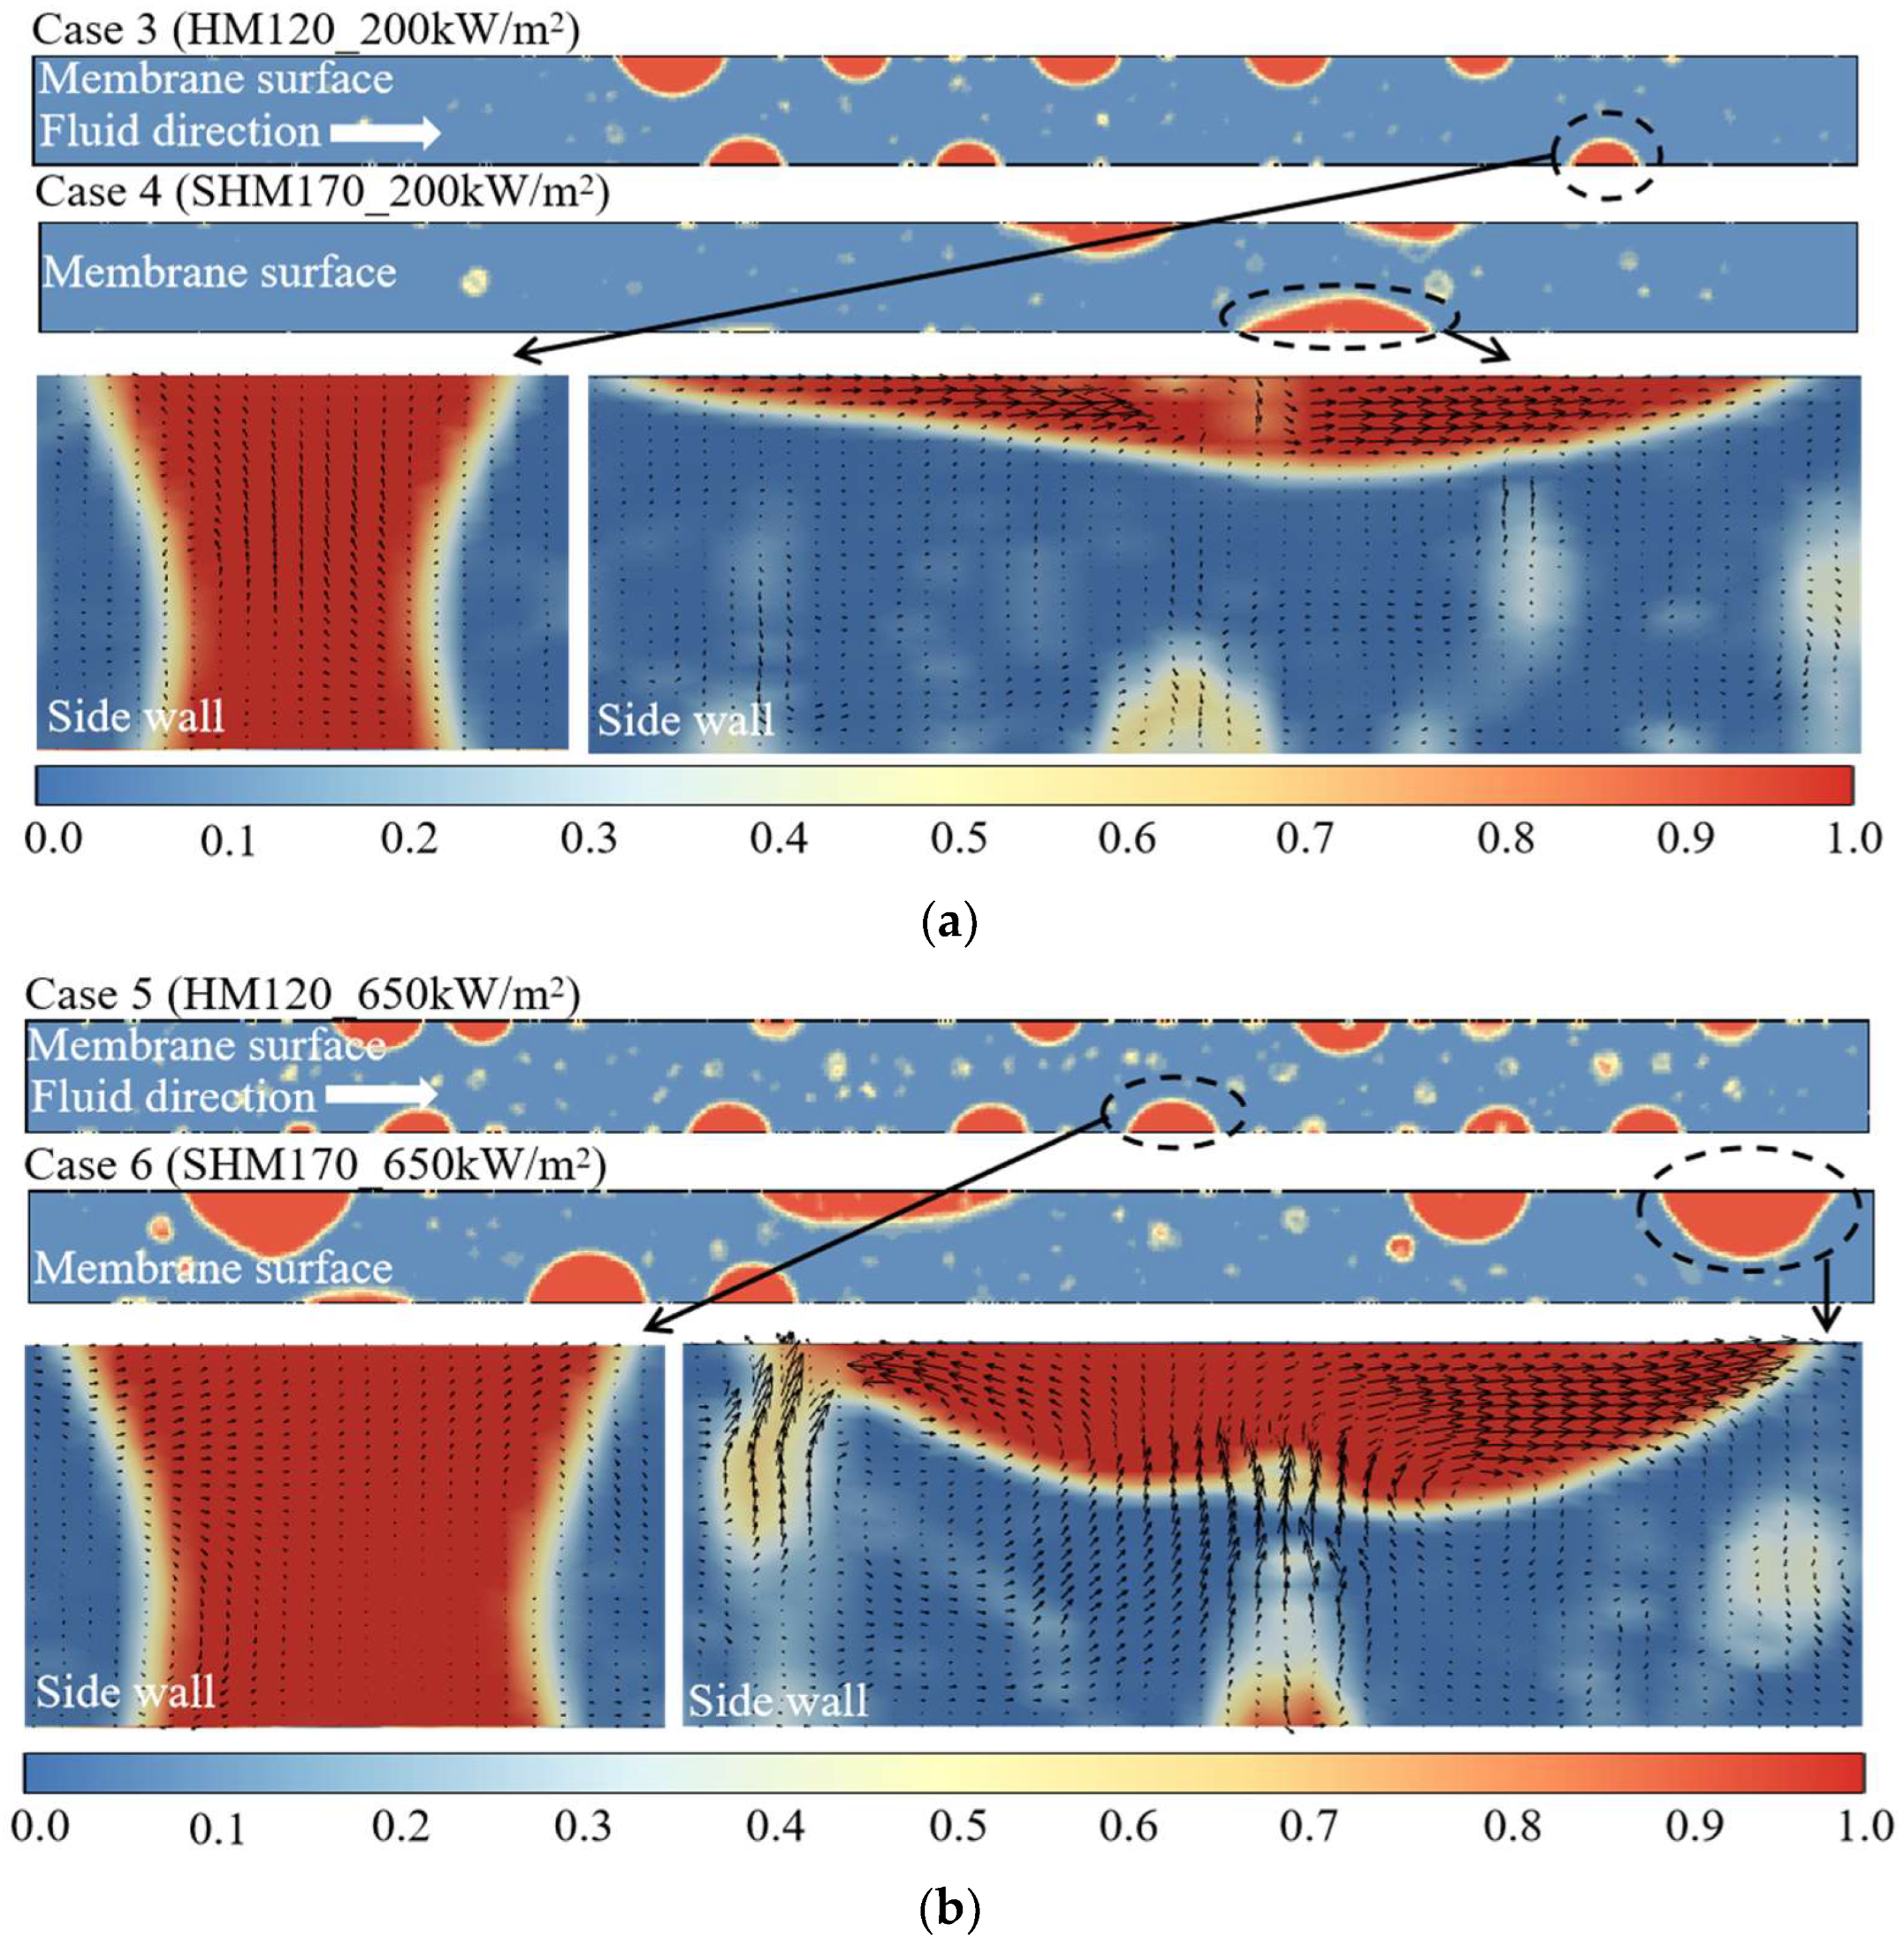
To further investigate the mechanisms underlying the variations in pressure-fluctuation frequency and amplitude, the bubble flow patterns on the membrane surface and the velocity-field distributions during venting were examined at t = 28.8 ms for 200 kW/m2 and at t = 20.4 ms for 650 kW/m2. The results are shown in Figure 17 (The conditions for different cases in the figure can be found in Table 3).
At 200 kW/m2 (Figure 17a), the number of bubbles in contact with the hydrophobic membrane is greater than that for the superhydrophobic membrane. Velocity-field snapshots were randomly selected for the removal of membrane-contacting bubbles under both membrane conditions. The analysis reveals that venting events induce flow-rate discontinuities in the vicinity of the disappearing bubble. Due to the incompressibility of the liquid, such discontinuities vanish immediately after the bubble collapse, leading to sudden acceleration or deceleration of the surrounding fluid near the venting orifice. The associated inertial forces are identified as the primary cause of pressure fluctuations in the channel. The higher number of such events for the hydrophobic-membrane case explains the observed decrease in fluctuation frequency with increasing membrane hydrophobicity. Furthermore, the velocity-field maps show that the magnitude of local flow-velocity changes near the venting orifice increases with membrane hydrophobicity, resulting in larger fluctuation amplitudes. At 650 kW/m2 (Figure 17b), the pressure-fluctuation patterns for both membrane types are consistent with those at 200 kW/m2. However, the increased heat flux results in a greater number of bubbles in contact with the membrane and larger velocity-field variations during venting. Consequently, both the frequency and amplitude of pressure fluctuations are elevated compared with the low-heat-flux case.
These findings suggest that the overall pressure fluctuation in the channel is a superposition of a high-frequency component caused by bubble growth and a low-frequency component induced by flow-rate discontinuities during venting events. The relative contribution of each component is modulated by both the membrane hydrophobicity and the applied heat flux.

5. Application Areas and Future Optimization

The bubble removal model developed in this study is suitable for investigating the visualized dynamic behavior of bubbles on the membrane surface during the removal process. It can also be applied to quantitatively analyze the bubble removal rate across the membrane, provided that the transmembrane mass transfer driving force and the membrane parameters are known. The model offers flexibility for adaptation in various research contexts. During above process, the membrane can be simplified in one dimension. For instance, to study phenomena within the membrane, it can serve as an inlet boundary condition at the membrane surface adjacent to the two-phase flow, thereby enabling the observation of vapor transport after it enters the membrane. During this process, the membrane cannot be simplified to one dimension, a three-dimensional model must be provided.
In the microchannel membrane generator, the driving force for transmembrane mass transfer is the pressure difference between the two sides of the membrane. In this study, the pressure difference used in the calculation of transmembrane mass transfer flux is a constant value. This value was selected based on the average value obtained from literature research of the boiling desorption mode. For the actual process, the pressure close to the solution side is calculated based on the water vapor partial pressure of the lithium bromide solution. Since the concentration of the lithium bromide solution along the channel increases continuously during the generation process, the water vapor partial pressure of the lithium bromide solution from the inlet to the outlet of the solution channel is a changing value, that is, the mass transfer driving force is a changing value. To achieve more realistic detection of pressure dynamic changes requires updating the physical property changes in the lithium bromide solution along the channel direction during the generation process. For the lithium bromide solution, the changes in important physical parameters are simultaneously related to concentration changes and temperature changes. Addressing this complexity represents an important direction for future improvement of the model.

6. Conclusions

In this study, a bubble-removal model was developed to capture the selective-permeability characteristic of a porous membrane, allowing vapor to pass through while preventing the liquid solution from crossing. Based on the simulation conditions employed, the principal conclusions can be summarized as follows:
(1)
The bubble-venting process proceeds through four distinct, sequential stages: (i) bubble nucleation and growth; (ii) rupture of the liquid film accompanied by bubble deformation; (iii) lateral spreading of the bubble; and (iv) sustained removal of vapor through the membrane. The effect of membrane hydrophobicity on venting dynamics becomes most evident from the third stage onward. While an increase in the heating-wall heat flux does not alter the fundamental sequence of these stages, it does influence key characteristics such as the number of bubbles generated, the timing of transitions between stages, and the probability of bubble coalescence.
(2)
Increasing the membrane hydrophobicity in a microchannel membrane-based generator leads to a reduction in wall temperature, with the magnitude of this reduction becoming more pronounced at higher applied heat fluxes.
(3)
Increasing membrane hydrophobicity consistently improves venting performance, with the degree of enhancement becoming more significant at higher heat fluxes. The accelerated venting rates achieved by superhydrophobic membranes not only increase the total volume of vapor removed but also shorten the time required to reach a specified removal amount.
(4)
The overall pressure fluctuation within the channel results from the superposition of a high-frequency component, generated by bubble growth, and a low-frequency component, arising from flow-rate discontinuities during venting events. The relative contribution of these components is governed by both membrane hydrophobicity and the applied heat flux.
(5)
The bubble removal model constructed in this work provides an effective visual and quantitative analysis framework for studying the behavior of bubbles on the membrane surface. Currently, the model simplifies the mass transfer driving force by assuming a constant pressure difference, and verifies its basic feasibility. The future improvement direction lies in coupling the concentration and temperature changes in the lithium bromide solution within the channel to achieve dynamic simulation of the mass transfer driving force, thereby enhancing the prediction accuracy of the model for the real process.

Author Contributions

Software, writing—original draft preparation, writing—review, data curation and validation, J.Z.; Conceptualization, investigation, editing, methodology, project administration, funding acquisition, H.G.; Conceptualization, investigation, project administration, funding acquisition, Y.Y.; All authors have read and agreed to the published version of the manuscript.

Funding

This research was funded by Liaoning Provincial Department of Science and Technology (2010224002), the National Natural Science Foundation of China (NSFC) (50976015), and the European Union’s Horizon 2020 research and innovation programme under the Marie Skłodowska-Curie grant agreement No. 778104.

Data Availability Statement

The data are contained within the article.

Conflicts of Interest

The authors declare no conflicts of interest.

Nomenclature

ν Velocity [m/s]
m ˙ Mass transfer in [kg/s]
P Pressure [N/m2]
g Acceleration due to gravity [m2/s]
F Force [N]
k Interface curvature [1/m]
e Energy transfer [W]
H l v Latent heat [J/kg]
m ˙ v Transmembrane mass transfer rate [kg/m3/s]
A bubble transmembrane desorption rate coefficient
Δ t Time step [s]
M molecular weight [kg/mole]
e m e m membrane thickness [μm]
D e K diffusion term
R u universal gases constant [J/kg/K]
T m e m membrane temperature [K]
P m e m membrane pressure [Pa]
B o molar viscous flow
ε membrane porosity
d p membrane pore diameter [μm]
τ membrane tortuosity
Δ P mass transfer driving force [kPa]
Q Heat transfer across membrane [J/m3/s]
ϕ General expression variable
ABoundary grid
BBoundary grid
CBoundary grid
DBoundary grid
EBoundary grid
aBoundary grid faces
bBoundary grid faces
cBoundary grid faces
dBoundary grid faces
eBoundary grid faces
ClLiquid-phase cell
CvGas-phase cell
h Grid size
u max Maximum velocity [m/s]
HMHydrophobic membrane
SHMSuperhydrophobic membrane
Greek
α Volume fraction [m3/m3]
ρ Density [kg/m3]
μ Dynamic viscosity [Pa s]
σ Surface tension coefficient [N/m]
λ Thermal conductivity [W/m K]
Subscripts
l liquid
v vapor
c s continuum surface tension
f a c e boundary face
m f membrane face
c o u p l i n g coupling boundary

References

  1. IEA. The Future of Cooling; International Energy Agency: Paris, France, 2018. [Google Scholar]
  2. Khalfallah, E.; Missaoui, R.; El Khamlichi, S.; Ben Hassine, H. Energy Efficient Air Conditioning: A Case Study of the Maghreb; World Bank: Washington, DC, USA, 2016; pp. 14–17. [Google Scholar]
  3. Popoola, O.; Chipango, M. Improved peak load management control technique for nonlinear and dynamic residential energy consumption pattern. Build. Simul. 2021, 21, 195–208. [Google Scholar] [CrossRef]
  4. Gao, L.; Zheng, Z.; Tao, L.; Xue, W.; Huang, L.; Liu, R.; Cheng, J. Experiment study of evaporation heat transfer characteristics in plate climbing film evaporator. Cryogenics 2011, 24, 42–45. [Google Scholar]
  5. Gajghate, S.S.; Barathula, S.; Das, S.; Saha, B.B.; Bhaumik, S. Experimental investigation and optimization of pool boiling heat transfer enhancement over graphene-coated copper surface. Therm. Anal. 2020, 140, 1393–1411. [Google Scholar] [CrossRef]
  6. Nolwenn, L.P.; Huaylla, F.; Stutz, B.; Perraud, J. Long-term solar heat storage process by absorption with the KCOOH/H2O couple: Experimental investigation. Pergamon Energy 2017, 141, 1313–1323. [Google Scholar]
  7. Hamid, K.; Wang, C.C.; Tolstorebrov, I.; Hafner, A.; Eikevik, T.M. Experimental study on ammonia/water mixture desorption heat transfer for vapor absorption-compression heat pump. Int. J. Heat Mass Transfer. 2025, 246, 127114. [Google Scholar] [CrossRef]
  8. García-Hernando, N.; Almendros-Ibáñez, J.A.; Ruiz, G.; De-Vega, M. On the pressure drop in Plate Heat Exchangers used as desorbers in absorption chillers. Energy Convers. Manag. 2011, 52, 1520–1525. [Google Scholar] [CrossRef]
  9. Lee, J.H.; Kim, D.H.; Kim, S.M.; Kim, M.S.; Kim, I.G.; Woo, S.M.; Hong, S.J.; Park, C.W. Heat transfer characteristics of a falling film generator for various configurations of heating tubes in an absorption chiller. Appl. Therm. Eng. 2019, 148, 1407–1415. [Google Scholar] [CrossRef]
  10. Hu, T.L.; Xie, X.Y.; Jiang, Y. A detachable plate falling film generator and condenser coupling using lithium bromide and water as working fluids. Int. J. Refrig. 2019, 98, 120–128. [Google Scholar] [CrossRef]
  11. Wirtz, M.; Stutz, B.; Phan, H.T.; Boudehenn, F. Numerical modeling of falling-film plate generator and rectifier designed for NH3-H2O absorption machines. Heat Mass Transfer. 2022, 58, 431–446. [Google Scholar] [CrossRef]
  12. Thorud, J.D.; Liburdy, J.A.; Pence, D.V. Microchannel membrane separation applied to confined thin film desorption. Exp. Therm. Fluid. Sci. 2006, 30, 713–723. [Google Scholar] [CrossRef]
  13. Zhai, C.; Wu, W. Experimental evaluation on heat/mass transfer and pressure drop of a microchannel membrane-based desorber for compact and efficient H2O/LiBr absorption refrigeration. Int. J. Heat Mass Transfer. 2022, 195, 123198. [Google Scholar] [CrossRef]
  14. Zhai, C.; Wu, W. Heat and mass transfer performance comparison of various absorbers/desorbers towards compact and efficient absorption heat pumps. Int. J. Refrig. 2021, 127, 203–220. [Google Scholar] [CrossRef]
  15. Robeson, L.M. Polymer membranes for gas separation. Curr. Opin. Solid State Mater. Sci. 1999, 4, 549–552. [Google Scholar] [CrossRef]
  16. Isfahani, R.N.; Fazeli, A.; Bigham, S.; Moghaddam, S. Physics of lithium bromide (LiBr) solution dewatering through vapor venting membranes. Int. J. Multiph. Flow 2014, 58, 27–38. [Google Scholar] [CrossRef]
  17. Venegas, M.; García-Hernando, N.; De-Vega, M. Experimental evaluation of a membrane-based microchannel desorber operating at low desorption temperatures. Appl. Therm. Eng. 2020, 167, 114781. [Google Scholar] [CrossRef]
  18. Asdrubali, F.; Baldinelli, G.; Presciutti, A. Solar cooling with small-size absorption chillers: Different solutions for summer air conditioning. Ind. E Form.-Spec. Int. Issue IIF-IIR 2008, 7, 34–38. [Google Scholar]
  19. Venegas, M.; De-Vega, M.; García-Hernando, N.; Ruiz-Rivas, U. Simplified model of a membrane-based rectangular micro-desorber for absorption chillers. Int. J. Refrig. 2016, 71, 108–123. [Google Scholar] [CrossRef]
  20. Venegas, M.; García-Hernando, N.; De-Vega, M. A parametric analysis on the effect of design and operating variables in a membrane-based desorber. Int. J. Refrig. 2019, 99, 47–58. [Google Scholar] [CrossRef]
  21. Pual, S.; Bhoumick, M.C.; Roy, S.; Mitya, S. Carbon nanotube enhanced membrane filtration for trace level dewatering of hydrocarbons. Sep. Purif. Technol. 2022, 292, 121047. [Google Scholar] [CrossRef]
  22. Liu, J.; Xie, B.L.; Mushtaq, N.; Xu, G.R.; Zeev, E.B.; Hu, Y.X. New insights into the role of carbon nanotubes spray-coated on both sides of the PTFE membrane in suppressing temperature polarization and enhancing water flux in direct contact membrane distillation. J. Membr. Sci. 2024, 689, 122184. [Google Scholar] [CrossRef]
  23. Intrchom, W.; Roy, S.; Mitra, S. Functionalized carbon nanotube immobilized membrane for low temperature ammonia removal via membrane distillation. Sep. Purif. Technol. 2020, 235, 116188. [Google Scholar] [CrossRef]
  24. Gupta, I.; Chakraborty, J.; Roy, S.; Farinas, E.T.; Mitra, S. Nanocarbon immobilized membranes for generating bacteria and endotoxin free water via membrane distillation. Sep. Purif. Technol. 2021, 259, 118133. [Google Scholar] [CrossRef]
  25. Ren, J.; Li, J.F.; Xu, Z.S.; Liu, Y.; Cheng, F.Q. Simultaneous anti-fouling and flux-enhanced membrane distillation via incorporating graphene oxide on PTFE membrane for coking wastewater treatment. Appl. Surf. Sci. 2020, 531, 147349. [Google Scholar] [CrossRef]
  26. Cao, H.; Mao, Y.P.; Wang, W.L.; Jin, Y.; Gao, Y.B.; Zhang, M.M.; Zhao, X.Q.; Sun, J.; Song, Z.L. ZIF-8 based dual scale superhydrophobic membrane for membrane distillation. Desalination 2023, 550, 116373. [Google Scholar] [CrossRef]
  27. Perez-Raya, I.; Kandlikar, S.G. Discretization and implementation of a sharp interface model for interfacial heat and mass transfer during bubble growth. Int. J. Heat Mass Transfer. 2018, 116, 30–49. [Google Scholar] [CrossRef]
  28. Sato, Y.; Niceno, B. A sharp-interface phase change model for a mass-conservative interface tracking method. J. Comput. Phys. 2013, 249, 127–161. [Google Scholar] [CrossRef]
  29. Brackbill, J.U.; Kothe, D.B.; Zemach, C. A continuum method for modeling surface tension. J. Comput. Phys. 1992, 100, 335–354. [Google Scholar] [CrossRef]
  30. Kharangate, C.R.; Mudawar, I. Review of computational studies on boiling and condensation. Int. J. Heat Mass Transfer. 2017, 108, 1164–1196. [Google Scholar] [CrossRef]
  31. Khan, Z.A.; Ahmad, N.; Sattar, M.; Haq, M.A.; Khan, I.; Ganie, A.H. Cell alternation algorithm for simulating bubble growth in boiling flows through volume of fluid (VOF) method in fluent. Alex. Eng. J. 2022, 61, 13051–13066. [Google Scholar] [CrossRef]
  32. Alkhudhiri, A.; Darwish, N.; Hilal, N. Membrane distillation: A comprehensive review. Desalination 2012, 287, 2–18. [Google Scholar] [CrossRef]
  33. Lawson, K.W.; Lloyd, D.R. Review membrane distillation. J. Membr. Sci. 1997, 124, 1–25. [Google Scholar] [CrossRef]
  34. Soukane, S.; Naceur, M.W.; Francis, L.; Alsaadi, A.; Ghaffour, N. Effect of feed flow pattern on the distribution of permeate fluxes in desalination by direct contact membrane distillation. Desalination 2017, 418, 43–59. [Google Scholar] [CrossRef]
  35. David, M.P.; Steinbrenner, J.; Miler, J.; Goodson, K.E. Visualization and Analysis of Venting from a Single Microchannel Two-phase Copper Heat Exchanger. In Proceedings of the ASME InterPack Conference, San Francisco, CA, USA, 19–23 July 2009; pp. 1–8. [Google Scholar]
  36. Ramesh, B.; Jayaramu, P.; Gedupudi, S. Subcooled flow boiling of water in a copper microchannel: Experimental investigation and assessment of predictive methods. Int. Commun. Heat Mass Transfer. 2019, 103, 24–30. [Google Scholar] [CrossRef]
  37. Rajalingam, A.; Chakraborty, S. Fluid flow and heat transfer characteristics of a microstructured microchannel heat sink under flow boiling condition. Appl. Therm. Eng. 2024, 248, 123265. [Google Scholar] [CrossRef]
  38. Lee, W.H. A Pressure Iteration Scheme for Two-Phase Modeling; Los Alamos Scientific Laboratory: Los Alamos, NM, USA, 1979; pp. 407–431. [Google Scholar]
  39. Park, J.; Ryu, J.; Lee, S.J. Penetration of a bubble through porous membranes with different wettabilities. Soft Matter 2019, 15, 5819–5826. [Google Scholar] [CrossRef] [PubMed]
Figure 1. Diagram of research question description.
Energies 18 05156 g001
Figure 2. Schematic of bubble removal model. (a) Illustration of cells near boundary face, (b) working procedure of bubble removal.
Energies 18 05156 g002
Figure 3. Illustration of simulation domain and employed boundary conditions.
Energies 18 05156 g003
Figure 4. The contact angle between the LiBr aqueous solution and the surface of stainless steel.
Energies 18 05156 g004
Figure 5. The boundary condition for the membrane.
Energies 18 05156 g005
Figure 6. The variation in wall temperature (a) and microchannel pressure drop, (b) with time under different grid sizes.
Energies 18 05156 g006
Figure 7. Schematic of bubble removal model: (a) assembly of bubble removal chip [35], (b) model geometry used in the mode verification.
Energies 18 05156 g007
Figure 8. Volume fraction contours at various mesh sizes. (a) 6 μm, (b) 4 μm, (c) 3 μm.
Energies 18 05156 g008
Figure 9. Comparison with the experimental results [35]. (a) Bubble formation; (b) bubble comes into contact with the membrane; (c) bubble spreading deformation; (d) bubble contraction; (e) bubbles continue to be removed; (f) bubble removal completed.
Energies 18 05156 g009
Figure 10. The changes in the average wall temperature (a) and the pressure drop in the microchannel, (b) over time during the model verification process.
Energies 18 05156 g010
Figure 11. The comparison of the simulation results with those from experimental studies and numerical studies is as follows: (a) average temperature of the wall surface [36,37], (b) pressure drop in the microchannel [36,37].
Energies 18 05156 g011
Figure 12. The cloud map distribution of the influence of membrane hydrophobicity on the bubble dynamic behavior under the 200 kW/m2 heating condition: (a) hydrophobic membrane (120°), (b) superhydrophobic membrane (170°).
Energies 18 05156 g012
Figure 13. The cloud map distribution of the influence of membrane hydrophobicity on the bubble dynamic behavior under the 650 kW/m2 heating condition: (a) hydrophobic membrane (120°), (b) superhydrophobic membrane (170°).
Energies 18 05156 g013
Figure 14. The temperature distribution of the bottom wall surface along the channel direction: (a) under a heat flux density of 200 kW/m2, (b) under a heat flux density of 650 kW/m2.
Energies 18 05156 g014
Figure 15. The variation in bubble volume size within the microchannel over time: (a) the change in bubble volume content within the microchannel under 200 kW/m2 condition, (b) the variation in the volume size of the cross membrane venting under 200 kW/m2 condition, (c) the change in bubble volume content within the microchannel under 650 kW/m2 condition, (d) the variation in the volume size of the transmembrane venting under 650 kW/m2 condition.
Energies 18 05156 g015aEnergies 18 05156 g015b
Figure 16. Pressure fluctuations within the microchannels of the membrane-based generator: (a) at 200 kW/m2, (b) at 650 kW/m2.
Energies 18 05156 g016
Figure 17. The bubble flow pattern on the membrane surface and the velocity field distribution during the bubble venting process: (a) at 200 kW/m2, (b) at 650 kW/m2.
Energies 18 05156 g017
Table 1. Properties of H2O/LiBr solutions.
H2O/LiBr Solution ρ
(kg/m3)
μ
(Pa·s)
λ
(W/m K)
C p
(J/kg K)
H l v
(J/kg)
σ
(N/m)
Liquid15951.6 × 10−30.477620742.7 × 1060.085
Vapor0.11611.265 × 10−50.024291889
Table 2. Membrane parameters and driving force.
ParameterValue
Porosity0.8
Pore size (μm)0.45
Thickness (μm)60
Mass transfer driving force (kPa)0.9
Table 3. Investigation conditions.
CaseMembrane Contact Angle (°)Heat Flux (kW/m2)Initial Condition
1-200No membrane
2-650
3120200Membrane
4170200
5120650
6170650
Table 4. Grid independence study.
No.Mesh Size-Channel Space
(L × W × H)
Avg Tw
(K)
e%∆P (Pa)e%
1198 × 12 × 15378.410.030.3896.68
2330 × 20 × 25378.300.00790.4150.96
3396 × 24 × 30378.27-0.419-
3396 × 24 × 30378.27-0.419-
Table 5. Properties of air and water at 1 atm.
Two Phase ρ
(kg/m3)
μ
(Pa·s)
σ
(N/m)
Water998.21.003 × 10−30.072
Air1.2251.789 × 10−5
Table 6. Effect of mesh sizes on gas bubble length.
Mesh Size (μm)Gas Bubble Length (mm)Percentage Change (%)
60.134-
40.1415.22
30.1452.84
Table 7. Parameters of existing experimental study used for validation.
Ramesh et al. [36]
Channel dimension1 × 0.49 × 40 mm3
Mass flux855 kg/m2s
Heat flux377–763 kW/m2
Working fluidWater
Inlet temperature323.15 K
Disclaimer/Publisher’s Note: The statements, opinions and data contained in all publications are solely those of the individual author(s) and contributor(s) and not of MDPI and/or the editor(s). MDPI and/or the editor(s) disclaim responsibility for any injury to people or property resulting from any ideas, methods, instructions or products referred to in the content.