Article

Computational Analysis of the Effects of Power on the Electromagnetic Characteristics of Microwave Systems with Plasma

by
Kamal Hadidi
1,
Camille E. Williams
2,3 and
Vadim V. Yakovlev
2,*
1
Isklen, LLC., Sudbury, MA 01776, USA
2
Center for Industrial Mathematics and Statistics, Department of Mathematical Sciences, Worcester Polytechnic Institute, Worcester, MA 01609, USA
3
Department of Physics, Worcester Polytechnic Institute, Worcester, MA 01609, USA
*
Author to whom correspondence should be addressed.
Energies 2025, 18(19), 5128; https://doi.org/10.3390/en18195128
Submission received: 16 August 2025 / Revised: 15 September 2025 / Accepted: 22 September 2025 / Published: 26 September 2025
(This article belongs to the Special Issue Progress in Electromagnetic Analysis and Modeling of Heating Systems)

Abstract

The scaling of microwave plasma technologies from successful laboratory demonstrations to larger industrial applications usually involves an increase in microwave power. This upgrade is accompanied by a higher electron density (and electric conductivity) of the plasma that often limits the power efficiency of the device. In this paper, we address this issue through a focused computational study of electromagnetic characteristics of a microwave system containing plasma. Our approach employs finite-different time-domain analysis supported by a simple model which characterizes the plasma medium using plasma frequency and the frequency of electron-neutral collisions. Based on experimental data for electron density with respect to power, the plasma frequency is generated as a linear function of power, thus enabling a direct understanding of how frequency characteristics of the reflection coefficient and patterns of the electric field may vary for different power levels in a variety of plasma scenarios. For a cavity modeled after conventional plasma applicators, computational results illustrate complex behavior of the field with respect to power. When the power is increased, energy efficiency may decrease, remain low, or increase depending on where the operating frequency stands with respect to the system’s resonances. The proposed modeling approach identifies the system parameters which are most impactful in tuning the system to resonance, thus informing the design variables for subsequent computer-aided design of the scaled system.

1. Introduction

Recent years have seen significant developments in diverse microwave (MW) plasma technologies such as surface processing of semiconductor components, diamond synthesis, hydrogen production, nitric acid synthesis, decomposition of CO2, plasma antennas, plasma-based intelligent reflecting surface, and other innovations [1,2,3,4,5,6,7,8,9,10,11,12].
When designing MW plasma technologies to be operational on an industrial scale, one needs to deal with multiple interrelated issues. This creates significant challenges and often requires special treatment [13,14,15,16,17]. The conventional approach usually involves constructing the scaled-up system (guided by the basic laws of physics and engineering perceptions), applying desirable characteristics to it, and analyzing the performance after. Successful ventures of this type are reported in the literature [13,14], but technical aspects of these works are project-specific. In the absence of a systematic approach, scaling issues are addressed nearly from scratch for each individual process or application.
One of the challenges associated with industrial scaling is a lack of control over the shape of the plasma volume. To this end, it was demonstrated that plasma can be made sufficiently uniform through the proper use of certain MW plasma sources [18]. An approach based on the use of solid-state generator arrays was suggested in [19].
Another challenge designers may face is a limitation on power levels. The increase in power also increases the electron density (and hence the electric conductivity) of the plasma. This generally worsens the system’s coupling and cuts the energy efficiency of the system. It is therefore implied that there is an upper limit on the scaling of MW plasma technology.
When developing new MW plasma systems and processes (or scaling them up), it may be logical for designers to turn to guidance from computer modeling. In reported simulations, distributions (and maximum values) of electron density were computed for select values of power [20,21,22], gas temperature [23], pressure [23,24,25], and time [24,26] using the Finite Element Method (FEM) implemented in COMSOL Multiphysics [27]. In these multiphysics simulations, the underlying electromagnetic (EM) processes were modeled in frequency domain (FD). In computational electromagnetics, FD FEM is generally known for its mathematical robustness and flexibility in geometry handling. It is also known, however, for demanding exceptional computational resources, for limited instructiveness, and as a result, for being frequently impractical for computer-aided design (CAD) of electrically large systems. In computational studies of microwave power engineering, EM modeling using the Finite-Difference Time-Domain (FDTD) technique is widely recognized to be more informative, often more accurate, and less computationally expensive than FEM FD simulations [28,29,30].
On the other hand, as a numerical method proposed for solving Maxwell’s equations, the FDTD technique provides limited options for multiphysics modeling [30]. These circumstances confront the modeler with a choice based on the ultimate goals of modeling—either to prioritize the vital need for estimates of physical processes induced by the electromagnetic field (even having paid a very high price for it), or a better understanding of the primary electromagnetic processes in the background of a complex multiphysics phenomenon and acquiring data on their possible control and optimization.
This paper explores the latter approach in response to the conventional challenge of power limitation for scaling of MW plasma systems. By utilizing the resources of FDTD EM modeling, we suggest a systematic analysis of EM processes to clarify the options for dealing with this constraint and mitigating the related technical issues. The recently proposed simplified characterization of MW plasma [31,32] has laid groundwork for the use of the FDTD technique to determine the operational bounds of applicators with plasma and assist in the CAD of such devices. With the motivation to demonstrate the benefits of this approach in dealing with the impact of MW power, we:
(i)
Extend the plasma model [32] by adding a direct approximation of the link between plasma frequency and MW power;
(ii)
Perform an instructive computational analysis of a 2.45 GHz system resembling certain plasma applicators.
Computations are executed with the use of the FDTD simulator QuickWave (version v2018) [33]. They explicitly demonstrate, for the first time, how the level of MW power may influence the EM characteristics of a MW device containing plasma— namely, the field patterns and reflections. Computational results reveal the absence of a straightforward dependence between decreased energy coupling and increased power but suggest an opportunity to take advantage of the resonant properties of the system to improve coupling and energy efficiency.

2. Computational Method

2.1. Plasma Model

EM time-domain simulation of MW systems with plasma has previously been limited by the challenges associated with the generation of input parameters to characterize the plasma medium. The considerable complexity of the underlying physics is in part accountable for this shortcoming. Initial ideas to simplify characterization of MW plasma for FDTD EM modeling were outlined in [31], and a detailed roadmap to generating FDTD inputs for plasma media is given in [32]. In this approach (illustrated by the flow chart in Figure 1), a plasma medium is characterized by electric conductivity σ, which is defined by the loss factor ε″ as
σ = 2 π f ε 0 ε ,
where ε 0 is the permittivity of free space, and f is the operating frequency. Since MW plasma is not only lossy but also a dispersive medium, the loss factor, following the Lorenz–Drude model, is expressed as:
ε = 2 π f p 2 γ f [ ( 2 π f ) 2 + γ 2 ] ,
where f p is the plasma frequency and γ is the electron-neutral collision frequency. In (2), f is generally one of the standard ISM frequencies, so the compilation of input data for a plasma medium can be reduced to the definition of collision frequency and plasma frequency.
By assuming that the MW plasma is highly collisional and dominated by collisions between electrons and heavy particles, the collision frequency γ can be represented as:
γ = n g v e σ e n ,
where n g is the neutral gas density, v e is the average thermal speed of the electrons, and σ e n is the cross-section of electron-neutral collisions. As for plasma frequency, it can be expressed as a function of electron density N as:
f p = q 2 π N m ε 0 8.97 N
where m and q are the mass and the charge of an electron.
Plasma parameters n g , v e , σ e n (in (3)) and N (in (4)) depend on operational parameters of a MW plasma system, such as power P 0 , pressures P , and the gas flow rate R . Unlike earlier dependencies, however, the connection between these parameters and operational parameters is system-specific. If the model is to be a practical tool of design, the relationships of n g , v e , σ e n and N to P 0 , P , and R must be determined by either experimental diagnostics or literature-based review of similar systems and processes. In practice, experimental determination is often challenging, and at times it is not possible. To overcome this data uncertainty, [32] describes a literature-based approach to estimate values of n g , v e and σ e n for different plasma scenarios. What remains then is to understand how N depends on P 0 for a broad range of values and system types.

2.2. Plasma Frequency as Function of Power

In order to explore the impact of systematically increasing input power on the electric field and the reflection coefficient of a system, we follow the plasma model introduced in [30] and extend the ideas originally coined in [34] to approximate an explicit link between P 0 and f p .
In general, electron density is a system-specific function of MW power. According to the experimental data in the literature, the relationship N ( P 0 ) is typically close to linear. Based on measurements reported for three independent systems in [35,36,37], a set of three respective linear equations can be formulated using a first order regression of the experimental data provided:
N · 10 23   [ m 3 ]   =   1.12 · 10 3 P 0   [ W ]   +   2.57
N · 10 23   [ m 3 ] = 7.54 · 10 6 P 0   [ W ] + 8.28 · 10 4
N · 10 23   [ m 3 ] = 2.32 · 10 10 P 0   [ W ] + 5.22 · 10 7
By combining (5)–(7) with (4), another regression can be applied to linearly approximate the relationship between plasma frequency and MW power:
f p   [ G H z ] 0.938   P 0   [ W ]   +   4.56 · 10 3
f p   G H z 0.213   P 0   [ W ] + 91.5
f p   G H z 0.000432   P 0   [ W ] + 2.05
Expressions (8)–(10), along with (1)–(3) and values for n g , v e and σ e n fixed by the methods in [32], set up explicit conditions for σ in each of the MW plasma systems described by [35,36,37]. While, in general, a higher input power can indirectly lead to a higher plasma frequency, this dependency, for many different reasons, may be non-linear. However, given the diversity of the devices behind these measurements of N ( P 0 ) , we assume that the corresponding values of f p and σ (Table 1) depict a broad range of how key FDTD input parameters can realistically depend on MW power.

3. Plasma Applicator and Its Model

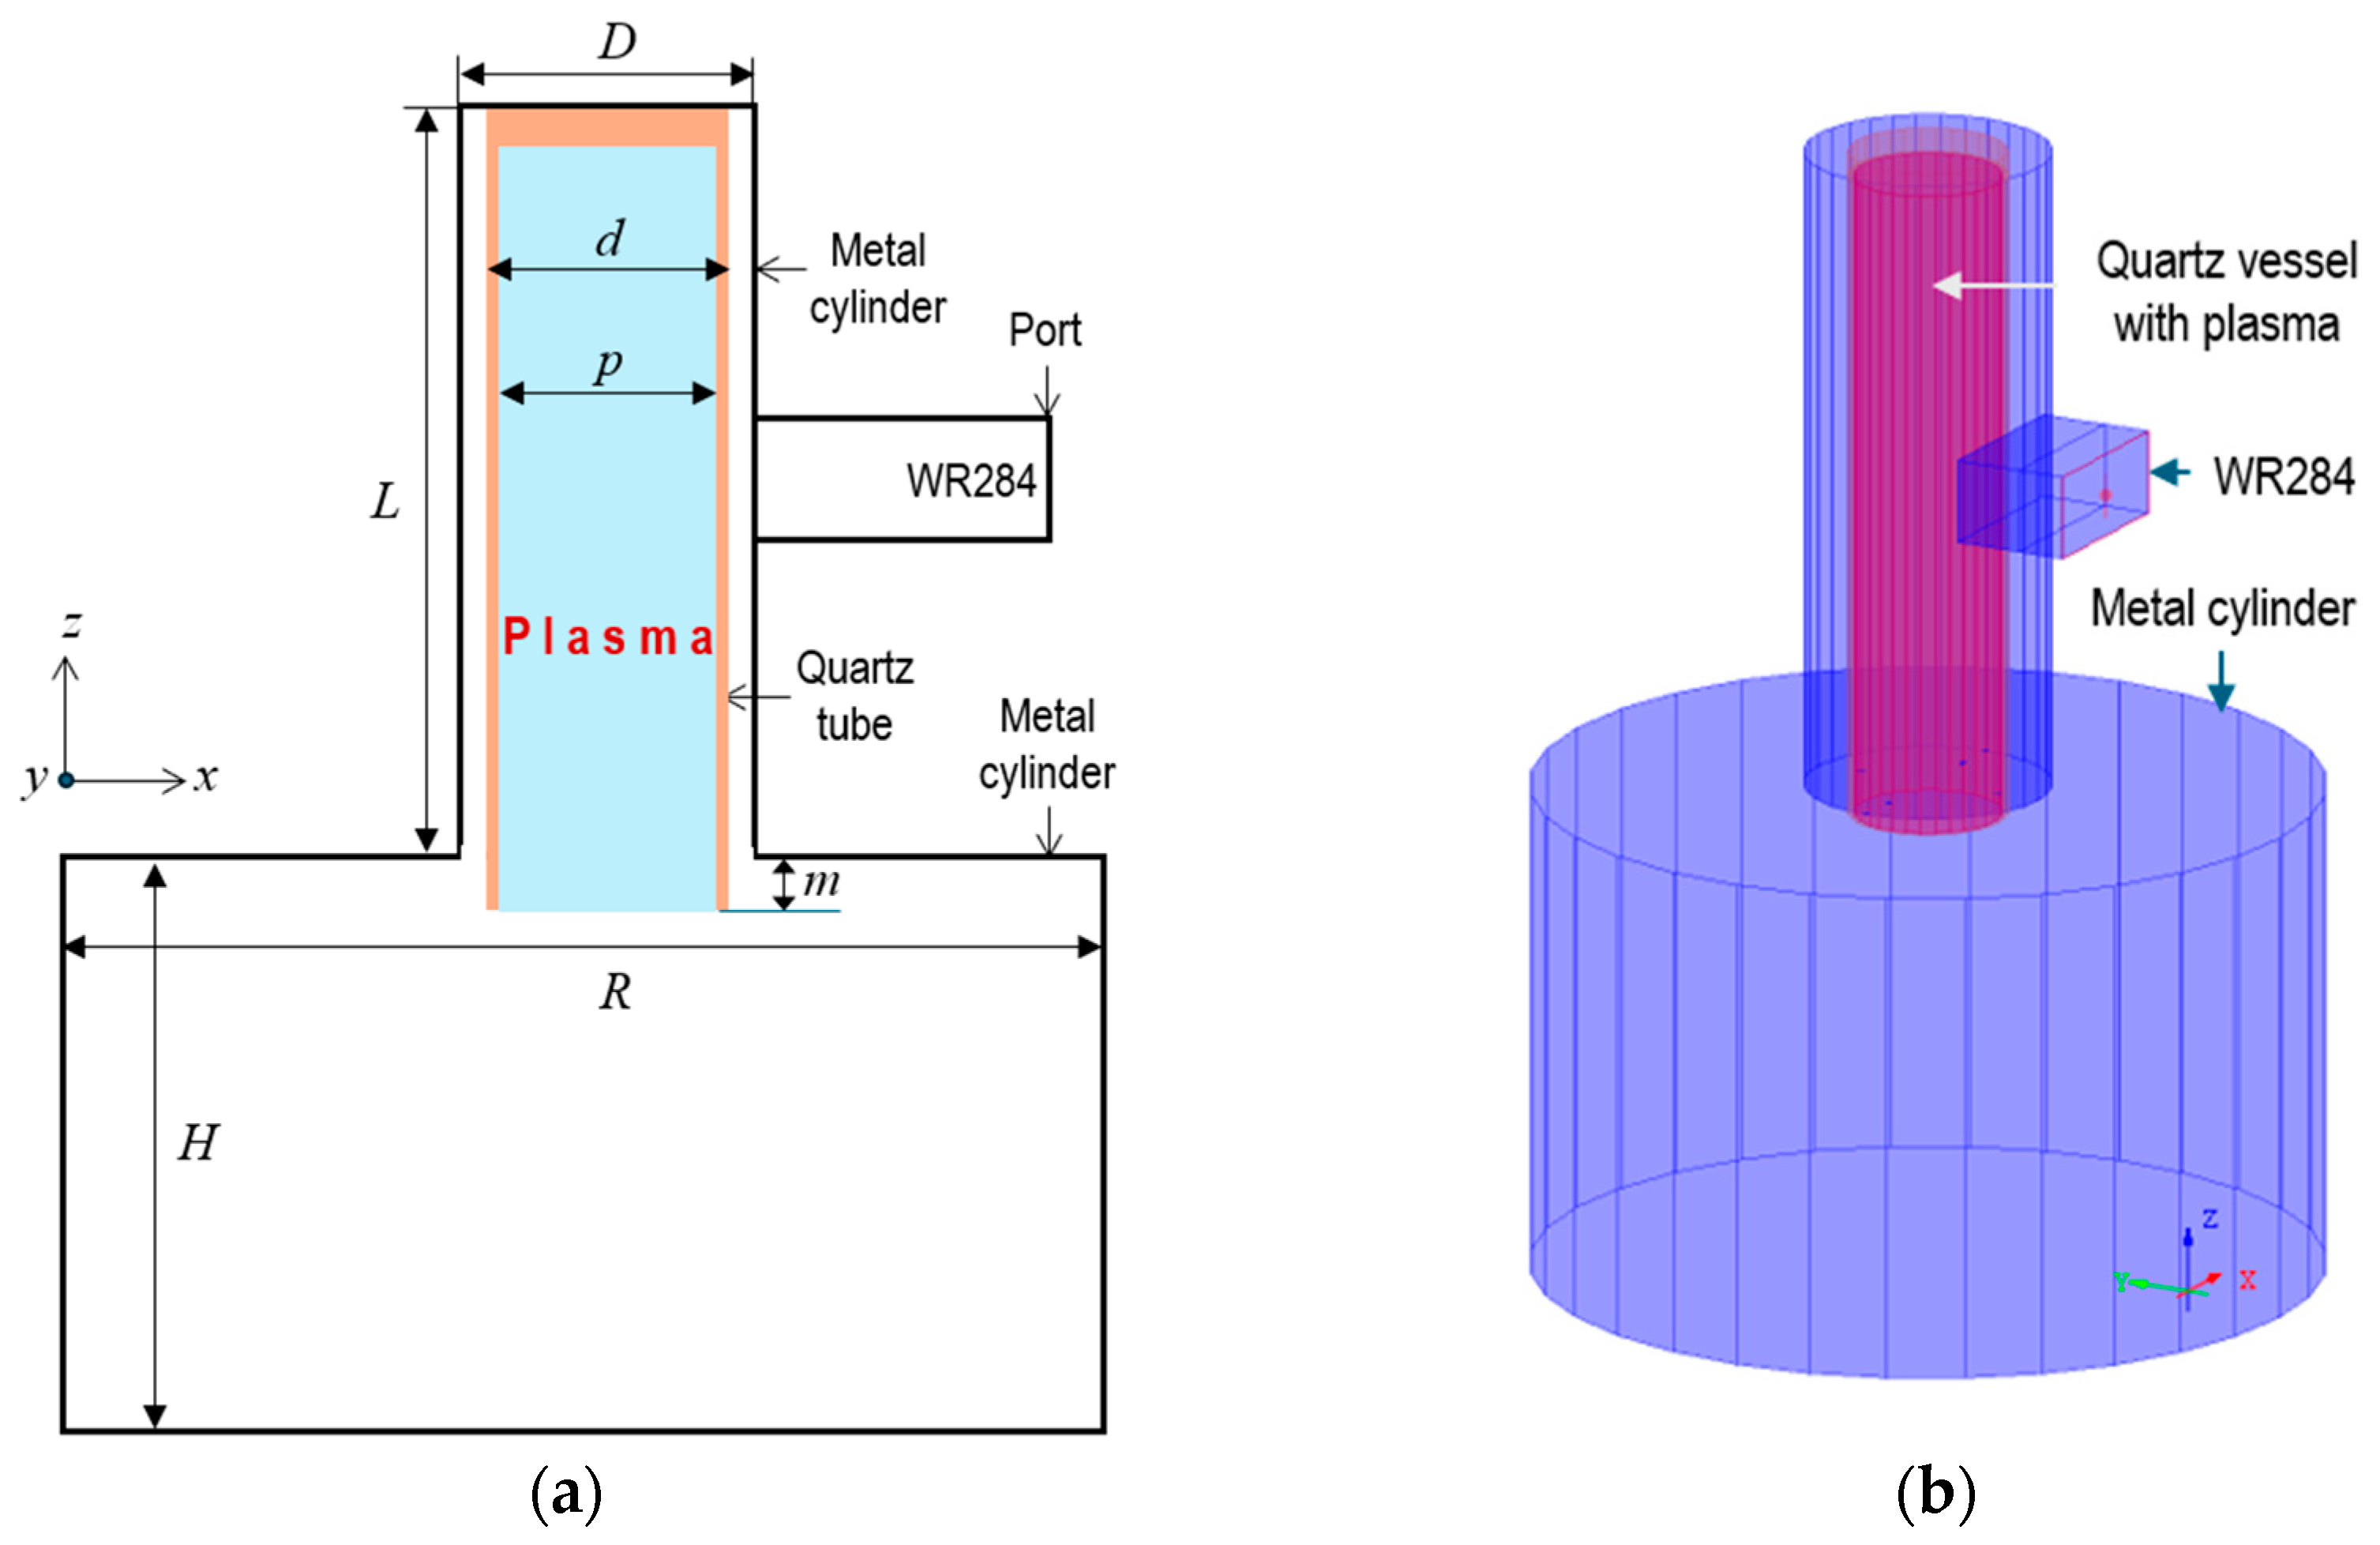
To demonstrate functionality of the extended plasma model and usefulness of the related FDTD simulation, we perform a computational study of a generic 2.45 GHz MW applicator (Figure 2). In this applicator, the plasma is ignited in a gas enclosed in a cylindrical quartz tube coaxially positioned in a metal cylinder. The cylinder is connected to an exciting rectangular waveguide (WR284) oriented such that its wide wall is parallel to the y-axis. This entire setup is placed on top of a larger cylindrical cavity which serves as a reactor for the intended application. The system is designed to resemble some typical MW apparatuses containing plasma [8,38,39]. The fixed dimensions of the applicator are H = 200 mm, R = 300 mm, D = 100 mm, L = 264 mm, and m = 12 mm, as defined in Figure 2. To isolate the impact of the plasma, the processed material (which would normally be situated in the larger cylinder) is not included. The model is built for the FDTD simulator QuickWave and exploits a non-uniform mesh with 1.2 mm cells in air and 0.25 mm cells in the quartz and plasma.
To define the electron-neutral collision frequency γ , we use formula (3). In accordance with [32], for applications at low and near atmospheric pressures, the neutral gas density can be assumed to be n g = 1.94 × 10²² m−3 or n g = 2.25 × 1024 m−3, respectively. Based on the mean of a Maxwell Boltzmann distribution, the average speed of electrons can be approximated as v e = 1.06 × 10⁶ m/s. Lastly, if the majority of collisions are assumed to be purely elastic, the electron-neutral collision cross-section can be roughly estimated by the circular area set by the atomic radii of the neutral gas used in ignition. Using these values, Table 2 contains the values of γ for Helium, Argon, and Xenon at low and near atmospheric pressures.
In our exploration, we assume that the relationship between plasma frequency and MW power is defined by (9) and choose the corresponding values of f p and σ from Table 1. The values for the electric conductivity in this case are high (for P 0 > 500 W, σ is larger than 18 S/m) and notably exceed σ for typical lossy dielectric materials. The volume occupied by plasma medium in the system is also not negligible size, so it is expected that the system will behave like a resonant structure.

4. Results of Computational Analysis

4.1. Impact of Microwave Power

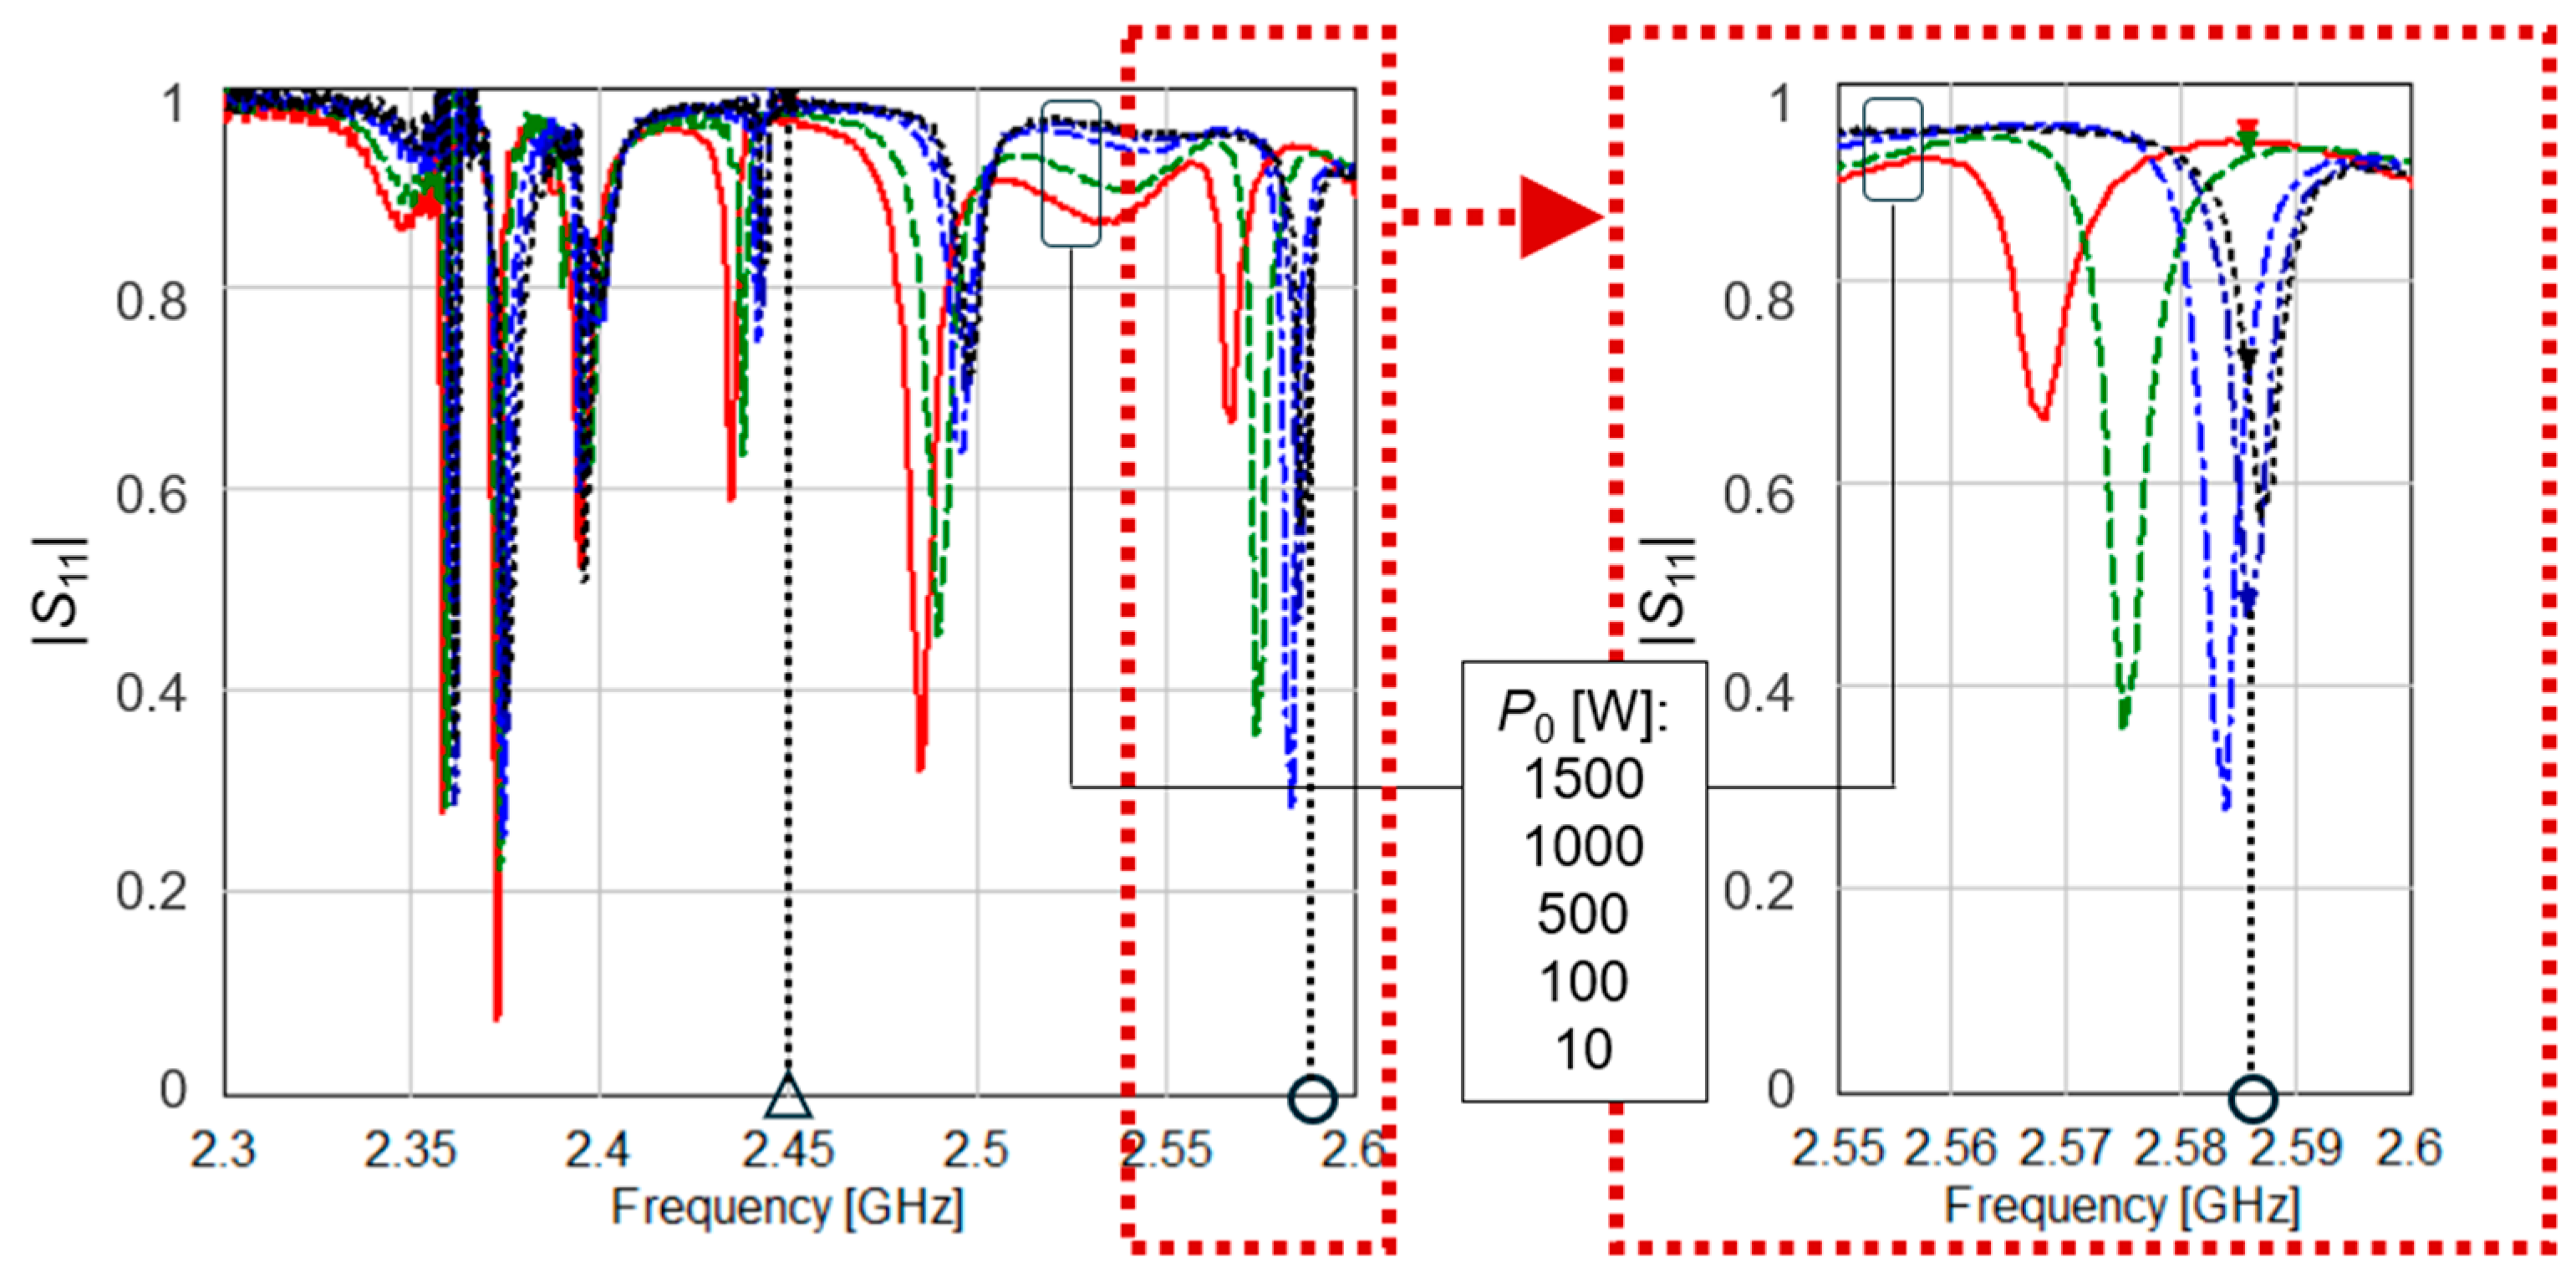
In Figure 3, the curves are shown for a fixed geometry of the plasma vessel and varied levels of MW power. As P 0 increases, the behavior of absorption (and hence energy efficiency of the applicator) appears to depend on where the operating frequency f 0 is with respect to the system’s resonances.
At certain frequencies, the reflections rise when the power increases. At f = 2.485 GHz, when MW power increases from 10 to 1500 W, | S 11 | surges and efficiency η (such that η = 1 S 11 | 2 100 % ) drops from 90 to 4.7%.
However, at most frequencies, if f is not near a resonance, the reflection is very high (and the coupling is very poor) regardless of the level of P 0 . For example, in Table 3 when f = 2.45 GHz, η is limited within 1.8 to 5.7%. Moreover, at some frequencies, when the power increases, the reflection coefficient actually decreases and energy efficiency goes up. One such case is f = 2.586 GHz. For this frequency, when P 0 is increased from 10 to 1000 W, η increases from 11 to 78%. This rather counterintuitive behavior is a direct consequence of the fact that the shapes and positions of resonances vary with the conductivity of the plasma medium, which depends on P 0 . The insert in Figure 3 depicts the formation of such resonances which make this effect possible.

4.2. Influence of Plasma Geometry

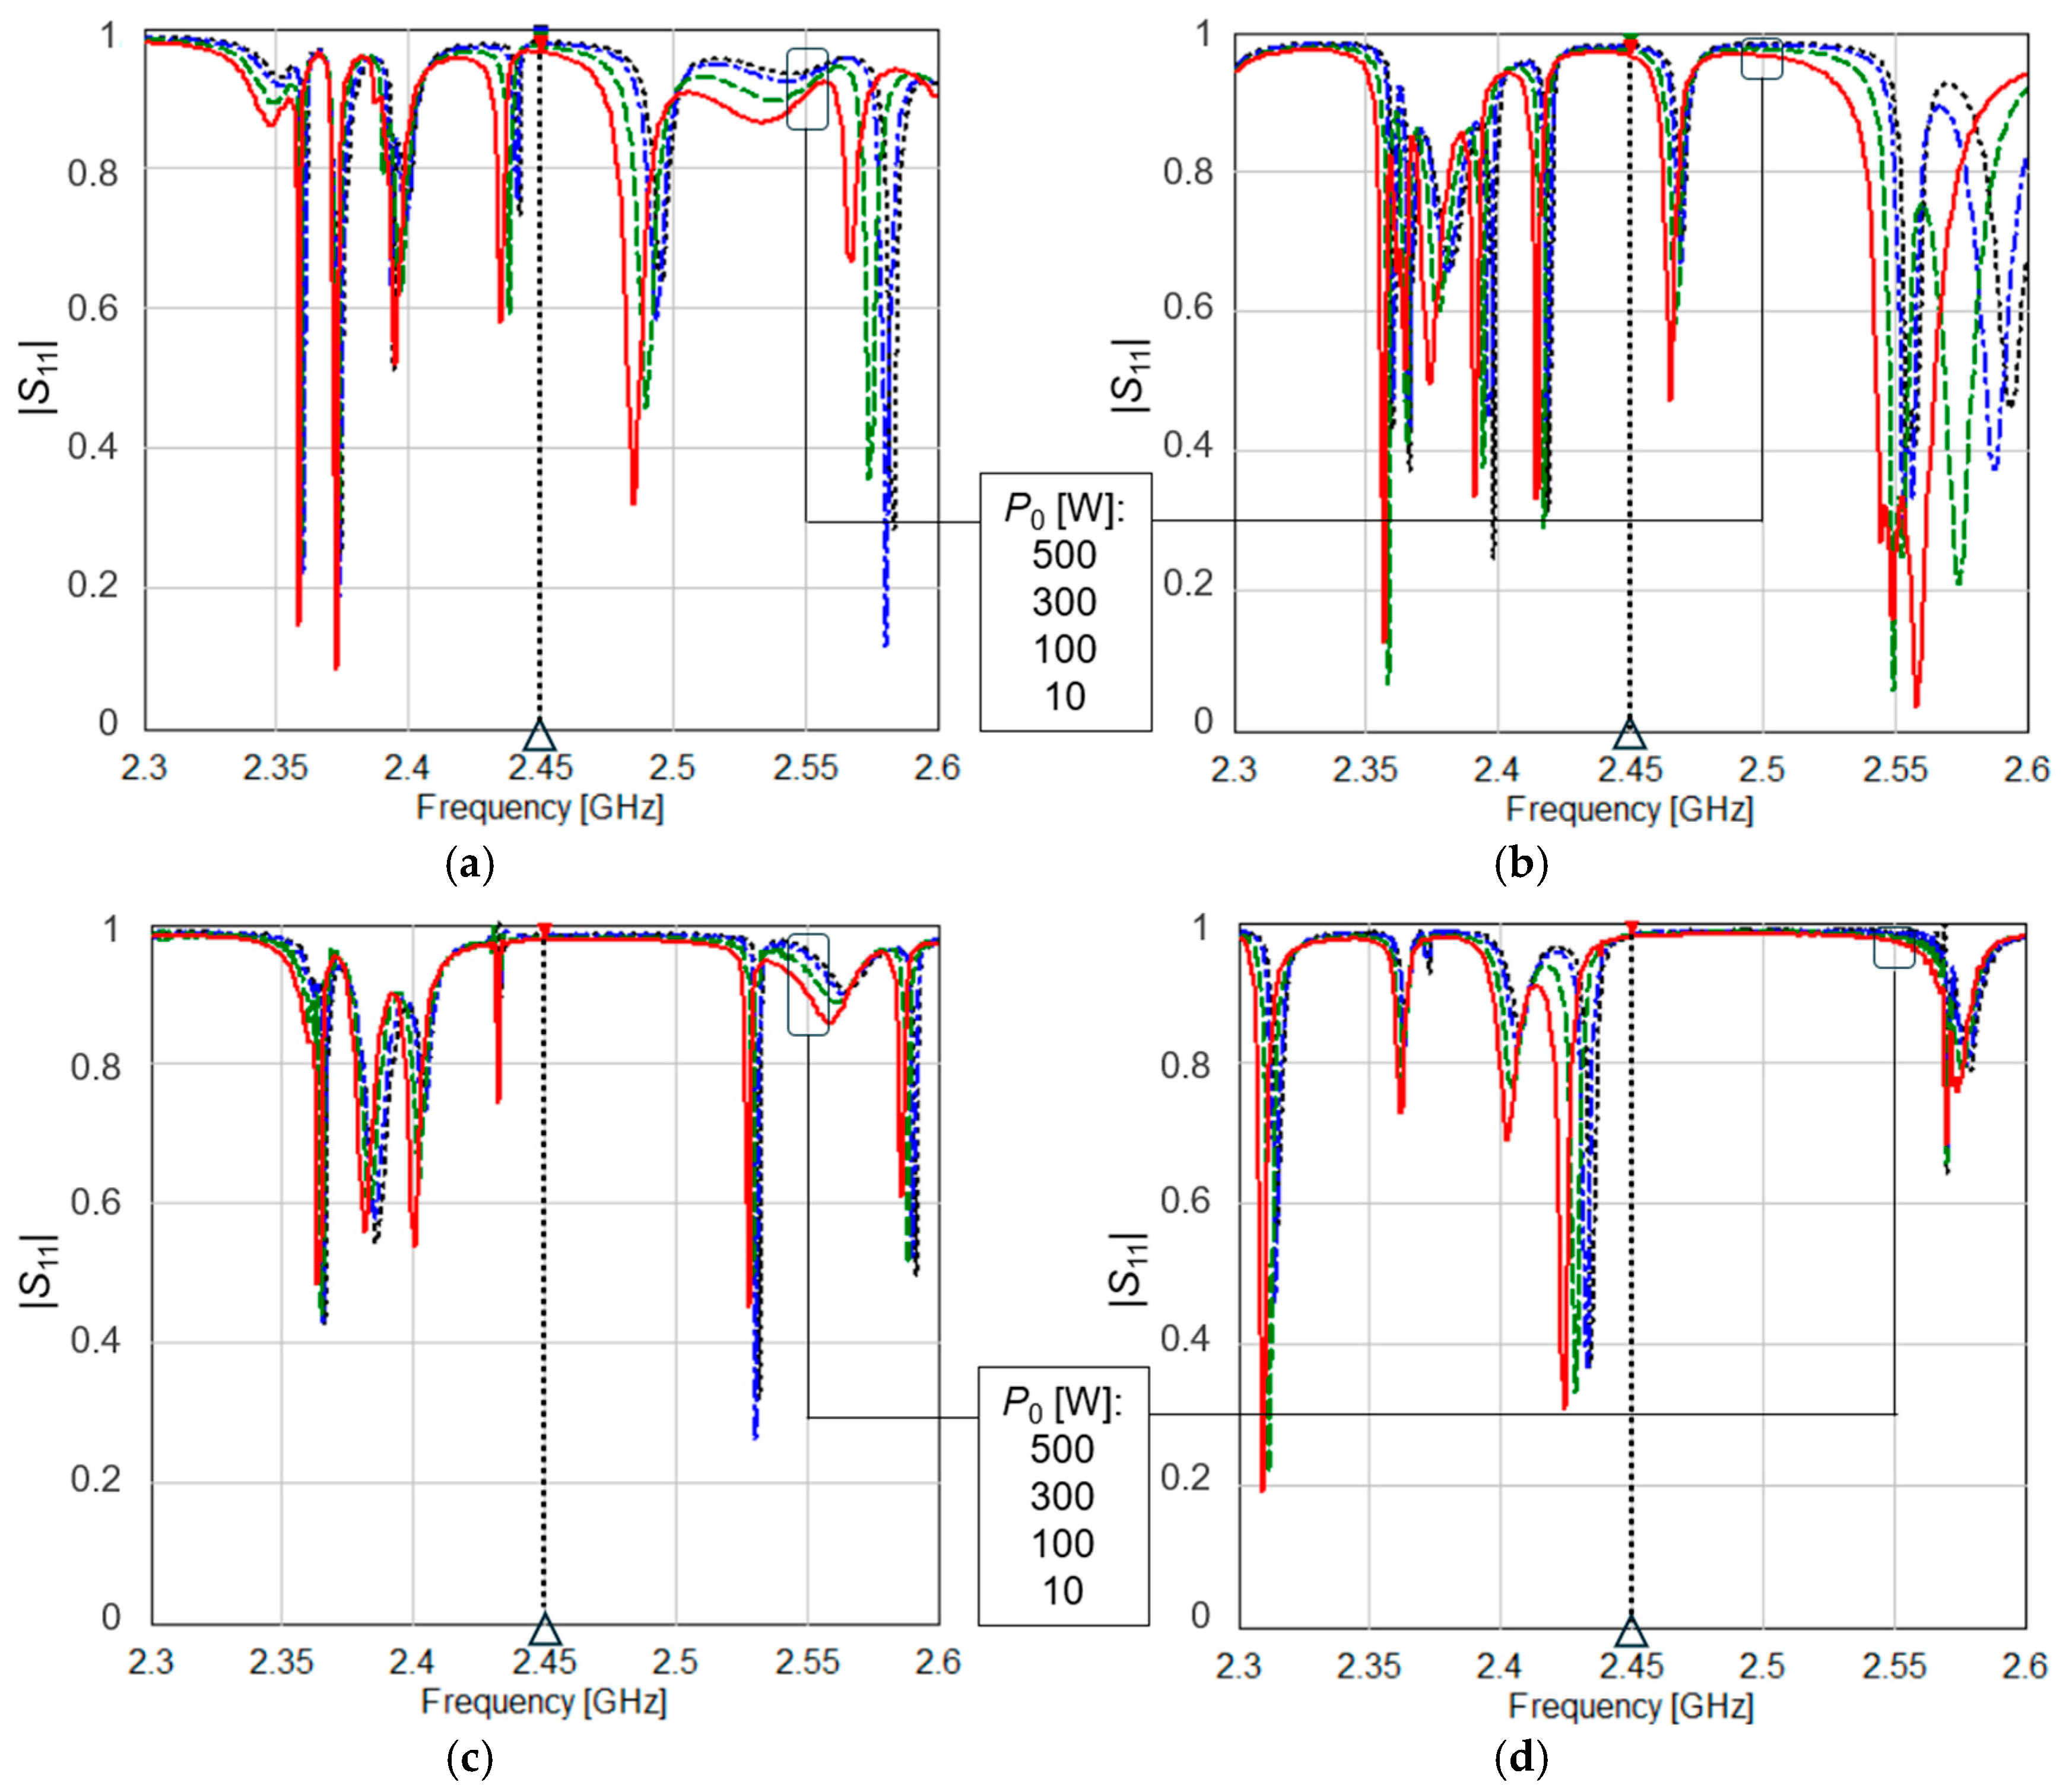
Apart from the conductivity of the plasma medium, geometric parameters of the system are also capable of altering the profiles of the | S 11 | ( f ) characteristics. The curves in Figure 4 obtained for different geometrical characteristics of the plasma vessel show that both the diameter of the plasma cylinder p and the thickness of the quartz wall t = ( d p ) / 2 can be impactful enough to completely modify the system’s resonances. As demon-strated in Figure 4a,c,d, increasing p from 38 to 54 mm results in a substantial change in the | S 11 | ( f ) characteristics; these changes include the appearance of new, and wider, resonances. As seen in Figure 4b,d, altering t from 2 to 10 mm eliminates two deep resonances in the frequency range from 2.4 to 2.5 GHz (around 2.42 and 2.47 GHz) and creates two others of lower depths (near 2.41 and 2.44 GHz).

4.3. Effect of Gas

The | S 11 | ( f ) curves shown in Figure 5 are simulated for a fixed power and geometry, and a variety of neutral gases with a wide range of atomic radii (from He to Xe). It is seen that across the gases selected, the positions and the depths of the resonances are practically identical. Different gases used in plasma ignition are known to have an impact on plasma density, space charge, electron sheath thickness and other physical aspects of plasma, which also influence the EM field [40,41]. From the EM perspective however, the MW system considered (Figure 2) seems to be nearly independent of the gas in which plasma is ignited. This is consistent with the fact that, in the framework of the proposed approach, the gas is only explicitly introduced into the FDTD model through the value of σ e n (and effectively γ ) in accordance with (1) and (2). It is ultimately less impactful on σ than N (through f p ).

4.4. Effect of Pressure

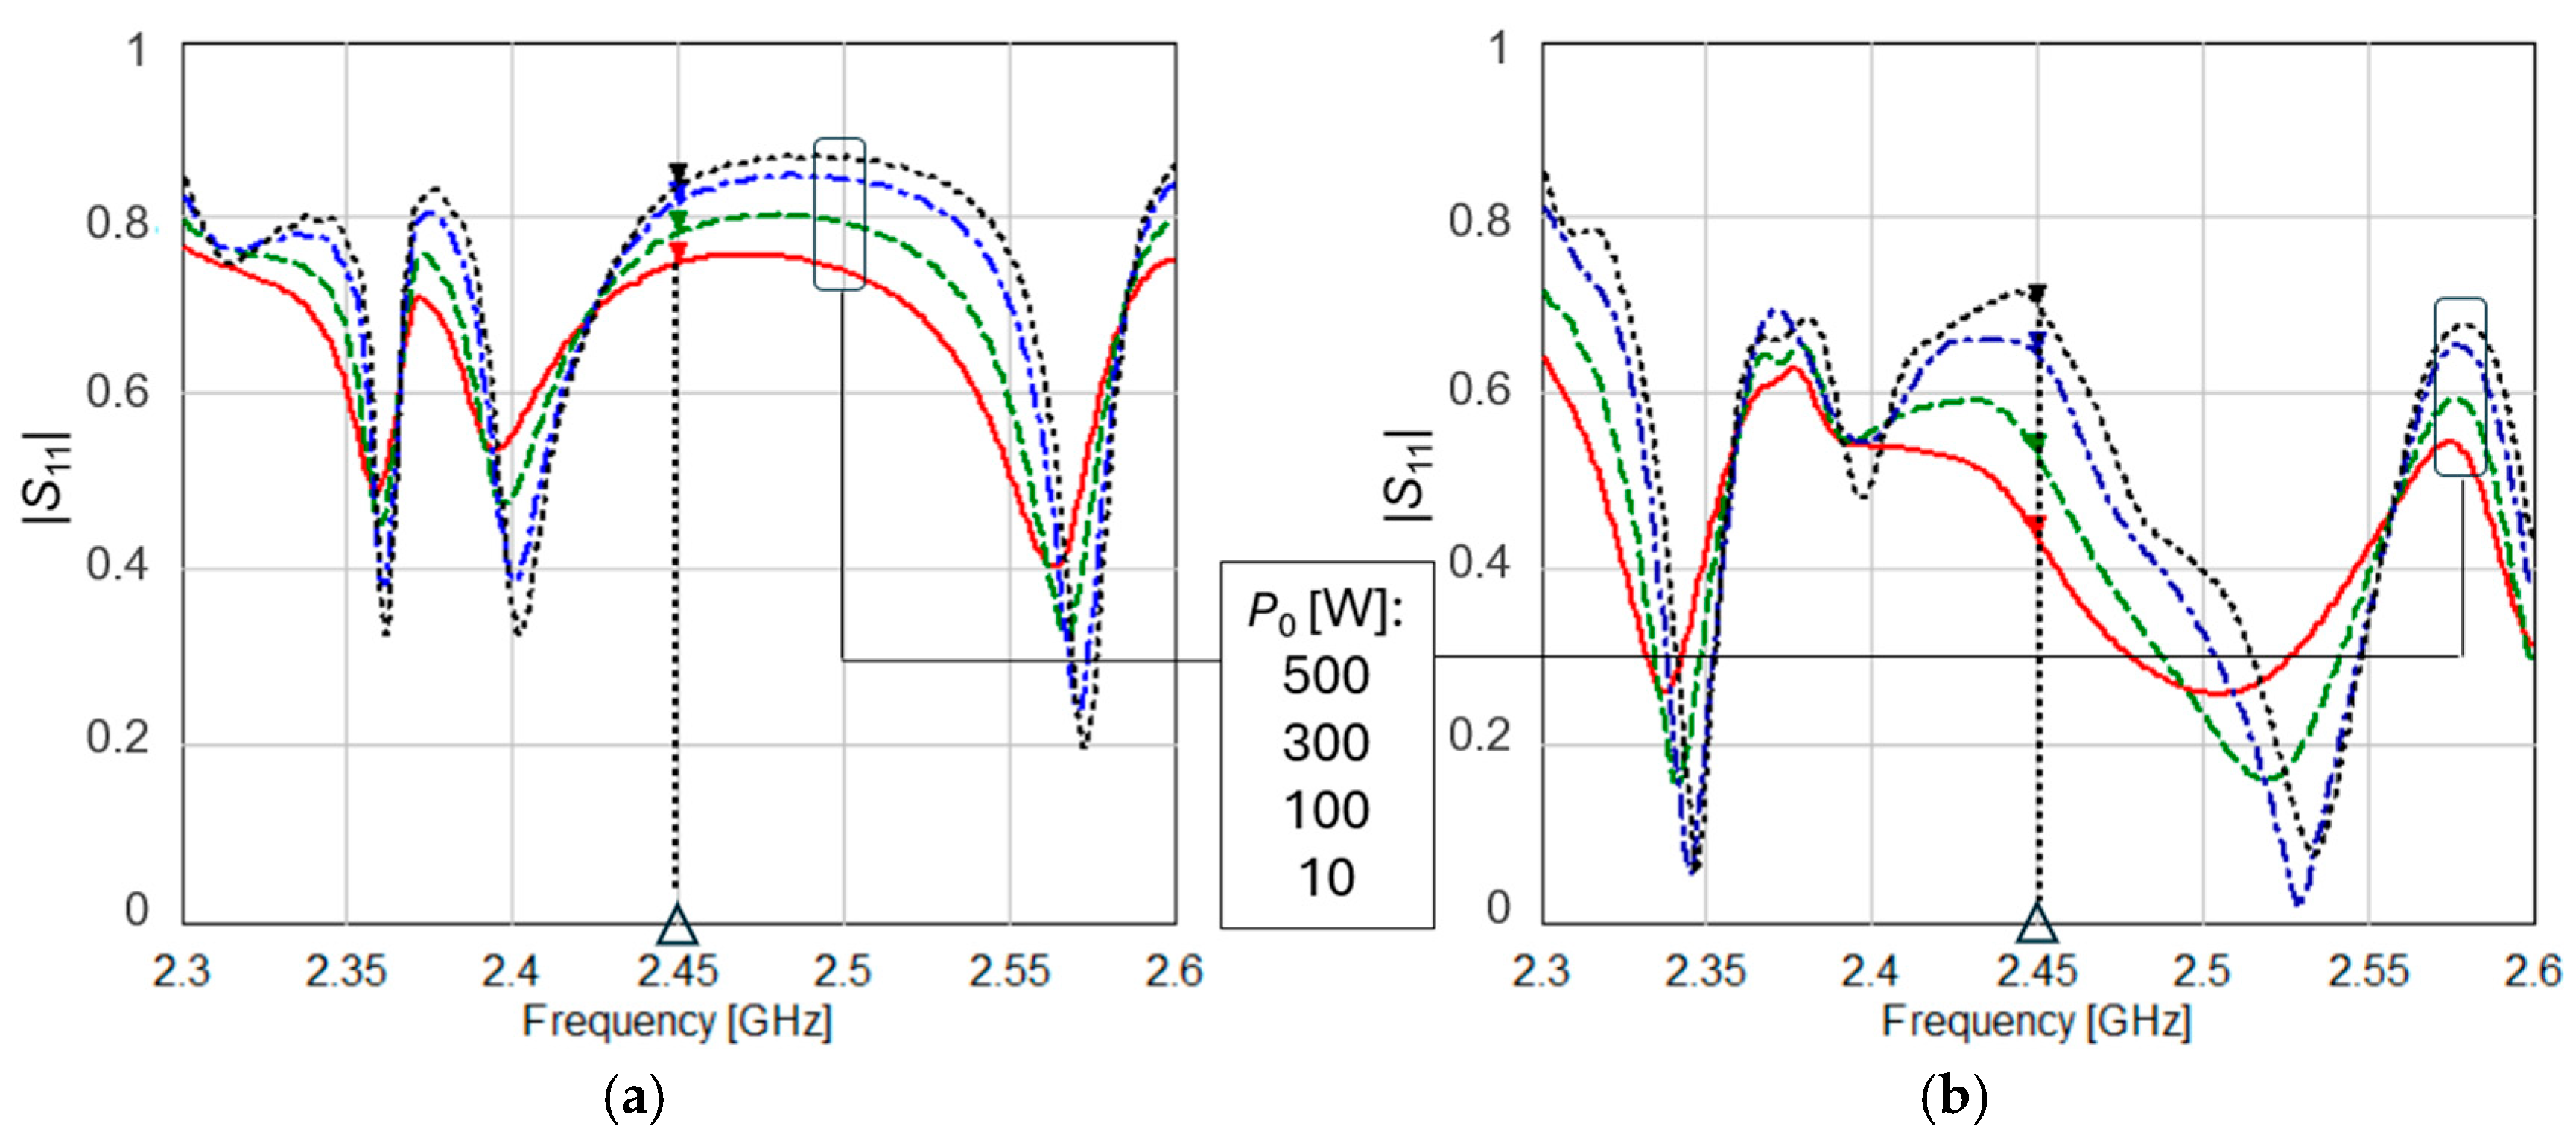
In contrast to the characteristics in Figure 3, Figure 4 and Figure 5, the graphs in Figure 6 are computed for higher (near atmospheric) pressure. The pressure under which a MW system with plasma operates is represented in the FDTD model through n g in formula (3), within the definition of collision frequency γ . Unlike σ e n in (3), which numerically represents the choice of neutral gas and varies at most within one order of magnitude, n g is capable of varying within two orders of magnitude. Direct comparison of Figure 4a and Figure 6b suggests that the two-order magnitude difference of n g is sufficient to see shifts and deformations in the profiles of the | S 11 | ( f ) curve.
Based on (1) and (2), plasma conductivity is inversely proportional to collision frequency and therefore inversely proportional to n g . As expected, when n g is higher, the resonances observed in Figure 6 are not as sharp or deep as those observed for lower pressure scenarios. This is consistent with the modeling results obtained in [38] for an atmospheric plasma source.

4.5. Variation in the Electric Field

Another benefit of a time domain simulation of MW systems with plasma comes with an opportunity to undertake a targeted analysis of the electric field at the frequencies of particular interest. The | S 11 | ( f ) curves in Figure 3, Figure 4, Figure 5 and Figure 6 indicate that at frequencies which are not near resonances, the level of reflections is very high and practically independent on MW power. It has been demonstrated that, in cases like that, the field distributions corresponding to 5 < P 0 < 500 W look nearly identical, though for higher values of power, the patterns are characterized by higher magnitudes of the field [34].
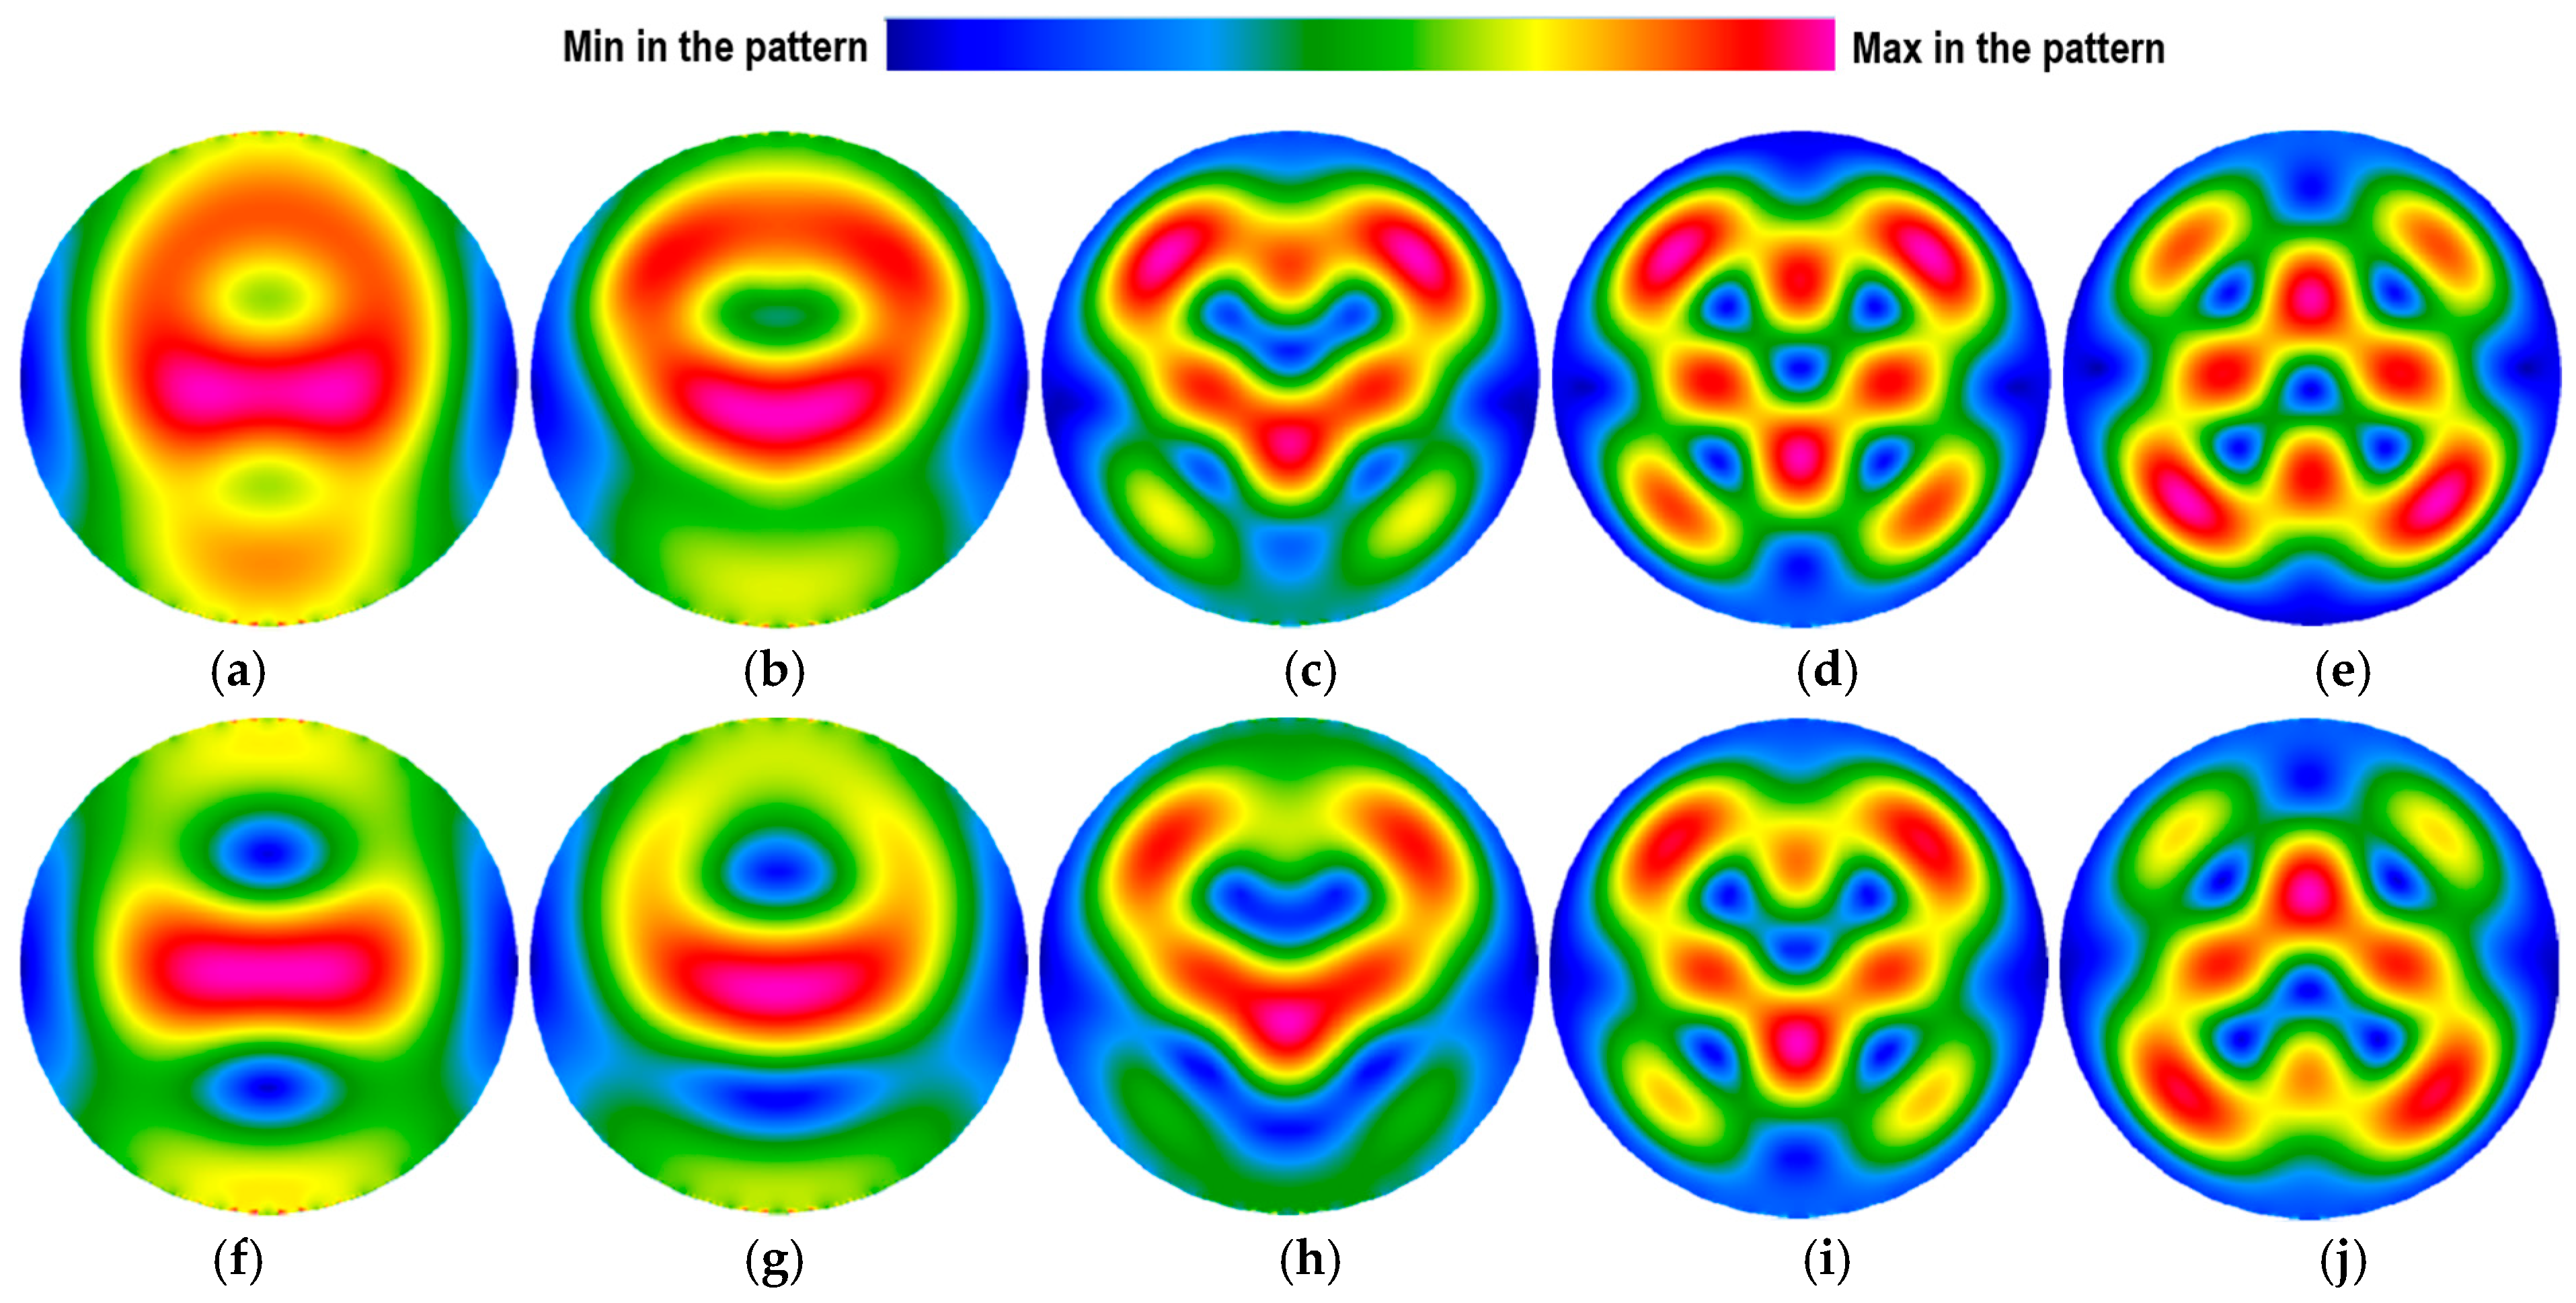
Figure 7 and Figure 8 show the patterns of the electric field for different levels of P 0 at 2.586 GHz, i.e., at the resonant frequency analyzed above (Section 4.1, Figure 3) as the one at which the energy coupling improves with the growth of power. It is seen that the increase of P 0 leads not only to the increase in the magnitude of the electric field (Table 4 and Table 5), but also, through the rise in electron density of the plasma medium and its electric conductivity, to the transformation of the field distribution. Figure 7 visualizes the field in the central vertical cross-section through the system whereas Figure 8 shows the field in the horizontal cut through the lower cavity.
A visible transformation of the field in the space around the plasma vessel is apparently conditioned by the change in plasma electric conductivity. The model also reveals a striking variation in the field distribution in the domain of its interaction with the processed material. The evolution appears to be a gradual formation of a certain mode of the cylindrical resonator (patterns (e) and (f)) that becomes possible with a sufficient level of coupling ( η roughly above 50%, in accordance with Table 3) that provides “proper” excitation of the field in the cavity.

5. Discussion

The key observation from the | S 11 | ( f ) curves in Figure 3, Figure 4, Figure 5 and Figure 6 is that for the applicator considered (Figure 2), coupling with the plasma is not merely inversely proportional to the level of MW power. The system is characterized by strong resonances, so, with the rise in P 0 , the energy efficiency of the applicator can worsen, improve, or remain permanently low, depending on whether the operating frequency P 0 is at, near, or away from a resonant frequency. In practice however, f is not a free choice, but a fixed parameter chosen to be one of the ISM frequencies. Moreover, when the dimensions of an applicator change (e.g., are increased in the framework of a scale up process), the profile of the | S 11 | ( f ) curves is shifted and distorted.
As a result, the output of the presented computational analysis is best interpreted following the principles of FDTD-based CAD established in microwave power engineering [30,42]. When the time-domain analysis of a given MW system produces a frequency response of the reflection coefficient possessing resonances close to f , it indicates that, with an appropriate change in geometric parameters, the | S 11 | ( f ) curve could be modified in such a way that the resonances occur closer to, or at, f = 2.45 GHz. The exact change necessary for desirable reshaping of the | S 11 | characteristics can be determined either through a series of simple computational tests, or, in more complex cases, with the use of suitable numerical optimization [43,44,45,46]. It can therefore be inferred that the analysis in Section 4 identifies feasible design variables for the optimization for the applicator considered from geometric parameters of the plasma vessel. A similar set of computations performed for other systems would similarly bring conclusions about the most impactful design variables.
From the EM perspective, a cavity enclosed by metal walls and containing a medium of high electric conductivity, like the system modeled in this paper, is a resonant structure. Accordingly, multiple resonances are exhibited in Figure 3, Figure 4, Figure 5 and Figure 6. While the presented computational analysis shows that these resonant properties could potentially be used to control energy efficiency of the system and aid in industrial scaling, most of the resonances observed are sharp and narrow. As a result, tuning the resonant behavior of the system could prove challenging. It may therefore be practical to first check for design options for decreasing Q-factor for EM optimization or CAD backed by the proposed approach. Increasing the size of the plasma volume or inclusion of an “dummy load” absorbing a small part of electric energy might be considered.
On the other hand, it appears that MW systems containing plasma and intrinsically characterized by strong resonances will benefit from working with solid-state generators of MW energy that are known for fine-tuning frequency and power, i.e., for offering precise control over microwave output.

6. Conclusions

In the present paper, we have extended the simple plasma model in [32], developed for FDTD EM modeling of MW systems containing plasma, by approximating the connection between the plasma frequency (a key input parameter of an FDTD model) and MW power (a physically tunable parameter). This connection is based on a generalization of the measured data reported in the literature on electron density versus power and subsequent calculation of plasma frequency as an approximately linear function of power. The exact relationship of plasma frequency to power can be expected to be of similar nature, but the exact values of this linearity are heavily system-dependent. In this paper, we have used the equation f p ( P 0 ) generated by data presented in [36] to produce illustrative FDTD simulations of EM characteristics in a conventional MW plasma applicator. Through this exercise, it was determined that, depending on how the operating frequency of the applicator relates to the system’s resonances, the coupling of the electric field with the plasma can decrease, increase, or remain low with the increase in power.
We have analyzed in detail the resonant conditions under which the rise in the power level leads to improved coupling and increased energy efficiency of the system. This scenario is of particular interest for CAD, assisting in efficient scaling up of systems and processes involving MW plasma because it suggests a way of mitigating the associated power limitation. In addition to this, the model has demonstrated that the variation in MW power may also result in dramatic differences in the distribution of the electric field in the cavity where the processed material would be positioned. This effect is worth further studying as a potential non-trivial mechanism of control over the field patterns.
The modeling approach introduced in [32] and expanded upon in this paper demonstrates the value of FDTD electromagnetic modeling for situations in which it is practical to simplify the plasma medium in order to understand the underlying electromagnetic processes. The proposed approach is compatible with the machine-learning procedure [46] introduced for optimization of MW plasma applicators. While the output of full multiphysics simulation can contain a large amount of data regarding the interrelated parameters of the device, it ultimately provides little clarity on the underlying processes and courses of potential action. When it comes to addressing the limitations on power for industrial scaling of MW applicators containing plasma, this approach provides simple explanations for the fundamental processes at work within these applicators and illuminates a variety of design solutions to address energy efficiency concerns.

Author Contributions

Conceptualization, K.H., C.E.W. and V.V.Y.; methodology, C.E.W. and V.V.Y.; software, C.E.W. and V.V.Y.; investigation, K.H. and V.V.Y.; data curation, C.E.W. and V.V.Y.; writing—original draft preparation, K.H., C.E.W. and V.V.Y.; writing—review and editing, K.H., C.E.W. and V.V.Y.; visualization, C.E.W. and V.V.Y.; supervision, V.V.Y.; funding acquisition, C.E.W. and V.V.Y. All authors have read and agreed to the published version of the manuscript.

Funding

The work of C.E.W. was partially supported by the WPI STAR Fellowship.

Data Availability Statement

Data is contained within the article.

Conflicts of Interest

Author K.H. was employed by the company Isklen, LLC. The remaining authors declare that the research was conducted in the absence of any commercial or financial relationships that could be construed as a potential conflict of interest.

References

  1. Hessel, V.; Cravotto, G.; Fitzpatrick, P.; Patil, B.S.; Lang, J.; Bonrath, W. Industrial applications of plasma, microwave and ultrasound techniques: Nitrogen-fixation and hydrogenation reactions. Chem. Eng. Process. 2013, 71, 19–30. [Google Scholar] [CrossRef]
  2. Penkov, O.V.; Khadem, M.; Lim, W.-S.; Kim, D.-E. A review of recent applications of atmospheric pressure plasma jets for materials processing. J. Coat. Technol. Res. 2015, 12, 225–235. [Google Scholar] [CrossRef]
  3. Mallik, A.K. Microwave plasma CVD grown single crystal diamonds—A review. J. Coat. Sci. Technol. 2016, 3, 75–99. [Google Scholar] [CrossRef]
  4. Cohick, Z.; Luo, W.; Perini, S.; Baker, A.; Wolfe, D.; Lanagan, M. A novel, all-dielectric, microwave plasma generator towards development of plasma metamaterials. Appl. Phys. Express 2016, 9, 116201. [Google Scholar] [CrossRef]
  5. De la Fuente, J.F.; Kiss, A.A.; Radoiu, M.T.; Stefanidis, G.D. Microwave plasma emerging technologies for chemical processes. J. Chem. Technol. Biotechnol. 2017, 92, 2495–2505. [Google Scholar] [CrossRef]
  6. Tiwari, S.; Caiola, A.; Bai, X.; Lalsare, A.; Hu, J. Microwave plasma-enhanced and microwave heated chemical reactions. Plasma Chem. Plasma Process. 2020, 40, 1–23. [Google Scholar] [CrossRef]
  7. Achkasov, K. Microwave-induced plasma—From academia to industry. In Proceedings of the 2021 European Microwave Week, Workshop W-07 “High-Power Microwave Industrial Applications”, Utrecht, The Netherlands, 10–15 January 2021. [Google Scholar]
  8. Bardos, L.; Barankova, H. Microwave Plasma Sources and Methods in Processing Technology; IEEE Press/Wiley: Hoboken, NJ, USA, 2022. [Google Scholar]
  9. Cho, C.H.; Kim, J.H.; Yang, J.K.; Park, I.S.; Choi, Y.-S.; Kang, I.J. Dry reforming process using microwave plasma generator with high carbon dioxide conversion efficiency for syngas production. Fuel 2024, 361, 130707. [Google Scholar]
  10. Zhu, H.; Huang, Y.; Yin, S.; Zhang, W. Microwave plasma setups for CO2 conversion: A mini-review. Green Energy Resour. 2024, 2, 100061. [Google Scholar] [CrossRef]
  11. Magarotto, M.; Sadeghikia, F.; Schenato, L.; Rocco, D.; Santagiustine, M.; Galtarossa, A.; Horestani, A.K.; Capobianco, A.-D. Plasma antennas: A comprehensive review. IEEE Access 2024, 12, 80468. [Google Scholar] [CrossRef]
  12. Magarotto, M.; Schenato, L.; Santagiustine, M.; Galtarossa, A.; Capobianco, A.-D. Plasma-based intelligent reflecting surface for beam-steering and polarization conversion. IEEE Access 2023, 11, 43546. [Google Scholar]
  13. Ong, M.Y.; Nomanbhay, S.; Kusumo, F.; Show, P.L. Application of microwave plasma technology to convert carbon dioxide (CO2) into high value products: A review. J. Clean. Prod. 2022, 336, 130447. [Google Scholar] [CrossRef]
  14. King, D.; Yaran, M.K.; Schuelke, T.; Grotjohn, T.A.; Reinhard, D.K.; Asmussen, J. Scaling the microwave plasma-assisted chemical vapor diamond deposition process to 150–200 mm substrates. Diam. Relat. Mater. 2008, 17, 520–524. [Google Scholar] [CrossRef]
  15. Rabinovich, A.; Nirenberg, G.; Kocagoz, S.; Surace, M.; Sales, C.; Fridman, A. Scaling up of non-thermal gliding arc plasma systems for industrial applications. Plasma Chem. Plasma Process. 2022, 42, 35–50. [Google Scholar] [CrossRef]
  16. Sung-Spitzl, H.; Spitzl, R. Scale-up of microwave resonator plasma sources for large area. In Proceedings of the 47th Annual Technical Conference of the Society of Vacuum Coaters, Dallas, TX, USA, 24–29 April 2004; pp. 483–485. [Google Scholar]
  17. Radoiu, M.; Mello, A. Scaling up microwave excited plasmas—An alternative technology for industrial decarbonization. Plasma Process. Polym. 2024, 21, e2300200. [Google Scholar] [CrossRef]
  18. Zoubian, F.; Renaut, N.; Latrasse, L. Distributed elementary ECR microwave plasma sources supplied by solid state generators for production of large area plasmas without scale limitation: Plasma density measurements and comparison with simulation. Plasma Res. Express 2021, 3, 025010. [Google Scholar] [CrossRef]
  19. Fiore, M.; Guissart, A.; Di Modugna, R.; Lobascio, F.; Di Modugno, N.; De Nicolo, T.; Bruno, C. Solid-state generator array for dynamic plasma shaping. In Proceedings of the 59th IMPI’s Microwave Power Symposium, Edmonton, AB, Canada, 24–26 June 2025; pp. 45–47. [Google Scholar]
  20. Baeva, M.; Hempel, F.; Baierl, H.; Trautvetter, T.; Foest, R.; Loffhagen, D. Two- and three-dimensional simulation analysis of microwave excited plasma for deposition applications: Operation with argon at atmospheric pressure. J. Phys. D Appl. Phys. 2018, 51, 385202. [Google Scholar] [CrossRef]
  21. Baeva, M.; Stankov, M.; Trautvetter, T.; Methling, R.; Hempel, F.; Loffhagen, D.; Foest, R. The effect of oxygen admixture on the properties of microwave generated plasma in Ar–O2: A modelling study. J. Phys. D Appl. Phys. 2021, 54, 355205. [Google Scholar] [CrossRef]
  22. Zhang, W.; Tao, J.; Huang, K.; Wu, L. Numerical investigation of the surface wave formation in a microwave plasma torch. IEEE Trans. Plasma Sci. 2017, 45, 2929–2939. [Google Scholar] [CrossRef]
  23. Bosi, F.; Magarotto, M.; de Carlo, P.; Manente, M.; Trezzolani, F.; Pavarin, D.; Melazzi, D.; Alotto, P.; Bertani, R. Numerical simulation of vibrationally active Ar-H2 microwave plasma. In Proceedings of the 2016 COMSOL Conference, Munich, Germany, 12–14 October 2016. [Google Scholar]
  24. Nowakowska, H.; Jasiński, M.; Mizeraczyk, J. Electric field distributions and energy transfer in waveguide-based axial-type microwave plasma source. In Proceedings of the 2008 COMSOL Conference, Hannover, Germany, 4–6 November 2008. [Google Scholar]
  25. Ong, M.Y.; Chia, S.R.; Milano, J.; Nomanbhay, S.; Chew, K.W.; Yusaf, T.; Show, P.L. Simulation of argon-excited microwave plasma reactor for green energy and CO2 conversion application. Appl. Energy 2024, 353, 122160. [Google Scholar] [CrossRef]
  26. Lejeune, A. Atmospheric plasma modelling applied for thermal plasma assisted processes. In Proceedings of the 2024 COMSOL Conference, Florence, Italy, 22–24 October 2024. [Google Scholar]
  27. COMSOL Multiphyscis. Available online: https://www.comsol.com (accessed on 8 August 2025).
  28. Yakovlev, V.V. Examination of contemporary electromagnetic software capable of modeling problems of microwave heating. In Advances in Microwave and Radio Frequency Processing; Willert-Porada, M., Ed.; Springer: Berlin/Heidelberg, Germany, 2006; pp. 178–190. [Google Scholar]
  29. Celuch, M.; Gwarek, W.K. Properties of the FDTD method relevant to the analysis of microwave power problems. J. Microw. Power Electromagn. Energy 2007, 41, 62–80. [Google Scholar] [CrossRef] [PubMed]
  30. Celuch, M.; Kopyt, P.; Olszewska-Placha, M. Coupled electromagnetic-thermodynamic simulations of microwave heating problems using the FDTD and FEM methods. In Development of Packaging and Products for Use in Microwave Ovens; Erle, U., Pesheck, P., Lorence, M., Eds.; Elsevier: Amsterdam, The Netherlands, 2020; pp. 459–511. [Google Scholar]
  31. Williams, C.E.; Yakovlev, V.V. Characterization of microwave plasma in electromagnetic modeling for processing applications. In Proceedings of the 57th IMPI’s Microwave Power Symposium, Denver, CO, USA, 27–29 June 2023; pp. 51–53. [Google Scholar]
  32. Williams, C.E.; Yakovlev, V.V. Characterization of microwave plasma for electromagnetic modeling in processing applications. J. Microw. Power Electromagn. Energy 2025, 59, 279–290. [Google Scholar] [CrossRef]
  33. QuickWave, QWED Sp. z o. o. Available online: https://www.qwer.eu (accessed on 8 August 2025).
  34. Hadidi, K.; Williams, C.E.; Yakovlev, V.V. Computational analysis of electron density effect on power absorption in microwave plasma applicators. In Proceedings of the 59th IMPI’s Microwave Power Symposium, Edmonton, AB, Canada, 24–26 June 2025; pp. 62–64. [Google Scholar]
  35. Zhang, Q.; Zhang, G.; Wang, L.; Wang, X.; Wang, S.; Chen, Y. Measurement of the electron density in a microwave plasma torch at atmospheric pressure. Appl. Phys. Lett. 2009, 95, 201502. [Google Scholar] [CrossRef]
  36. Xiao, W.; Liao, Y.; Huang, K. Measuring electron density of atmospheric microwave plasma jet by microwave perturbation method. IEEE Trans. Instrum. Meas. 2022, 71, 8005109. [Google Scholar] [CrossRef]
  37. Guissart, A.; Richter, T.; Fiore, M.; Muller, R.; Perez-Lopez, E.; Ates, H.; Dingeldein, M.; Baumgaertner, K.-M. Performance study of a solid-state microwave remote plasma source. In Proceedings of the 59th IMPI’s Microwave Power Symposium, Edmonton, AB, Canada, 24–26 June 2025; pp. 42–44. [Google Scholar]
  38. Latrasse, L.; Radoiu, M.; Nelis, T.; Antonin, O. Self-matching plasma sources using 2.45 GHz solid-state generators: Microwave design and operating performance. J. Microw. Power Electromagn. Energy 2017, 51, 237–258. [Google Scholar] [CrossRef]
  39. Pauly, S.; Schulz, A.; Walker, M.; Gorath, M.; Baumgärtner, K.; Tovar, G. Modeling and experimental study of remote microwave plasma source for high-rate etching. Chem. Ing. Tech. 2022, 94, 410–416. [Google Scholar] [CrossRef]
  40. Taylor, K.J.; Yun, S.; Tynan, G.R. Control of plasma parameters by using noble gas admixtures. J. Vac. Sci. Technol. 2004, 22, 2131–2138. [Google Scholar] [CrossRef]
  41. Hrycak, B.; Czylkowski, D.; Jasinski, M.; Mizeraczyk, J. Tuning characteristics of coaxial microwave plasma source operated with argon, nitrogen and methane at atmospheric pressure. Prz. Elecktrotechniczny (Electr. Rev.) 2012, R 88, 310–312. [Google Scholar]
  42. Mechenova, V.A.; Yakovlev, V.V. Efficiency optimization for systems and components in microwave power engineering. J. Microw. Power Electromagn. Energy 2004, 39, 15–29. [Google Scholar] [CrossRef] [PubMed]
  43. Delgado, H.J.; Thursby, M.H. A novel neural network combined with FDTD for the synthesis of a printed dipole antenna. IEEE Trans. Antennas Propag. 2005, 53, 2231–2236. [Google Scholar] [CrossRef]
  44. Lee, Y.; Filipovic, D.S. ANN based electromagnetic models for the design of RF MEMS switches. IEEE Microw. Wirel. Compon. Lett. 2005, 15, 823–825. [Google Scholar]
  45. Murphy, E.K.; Yakovlev, V.V. Neural network optimization of complex microwave structures with a reduced number of full-wave analyses. Int. J. RF Microw. Comput.-Aided Eng. 2011, 21, 279–287. [Google Scholar] [CrossRef]
  46. Williams, C.E.; Murphy, E.K.; Yakovlev, V.V. Machine-learning efficiency optimization of microwave applicators with plasma. Eur. J. Microw. Energy 2024, 1, 44–50. [Google Scholar] [CrossRef]
Figure 1. Determination of input data for plasma medium in the EM FDTD model (adapted from [32]). The system-specific dependencies of plasma parameters on operational parameters are shown by the dotted arrow.
Energies 18 05128 g001
Figure 2. MW plasma system: layout and geometrical parameters (a) and 3D view of the system in the QuickWave GUI (b).
Energies 18 05128 g002
Figure 3. Frequency characteristics of the reflection coefficient in the system in Figure 2 for MW power in the range from 10 to 1500 W ( σ by (9), Table 1); d = 58 mm; p = 54 mm; plasma in Argon at low pressure; f = 2.45 GHz is marked by Δ ; f = 2.586 GHz is marked by o.
Energies 18 05128 g003
Figure 4. Frequency characteristics of the reflection coefficient in the system in Figure 1 for microwave power in the range from 10 to 500 W ( σ by (9), Table 1); plasma in Argon at low pressure; d = 58 mm (a,b), 50 mm (c), 42 mm (d); p = 54 mm (a), 46 mm (c), 38 mm (b,d).
Energies 18 05128 g004
Figure 5. Frequency characteristics of the reflection coefficient in the system in Figure 1 for Helium, Argon, and Xenon; low pressure; P 0 = 500 W ( σ by (9)); d = 58 mm; p = 22 mm (a) and 45 mm (b).
Energies 18 05128 g005
Figure 6. Frequency characteristics of the reflection coefficient in the system in Figure 1 for MW power in the range from 10 W to 500 W ( σ by (9), Table 1; plasma in Argon at near atmospheric pressure; d = 42 mm; p = 38 mm (a), d = 58 mm; p = 54 mm (b).
Energies 18 05128 g006
Figure 7. Surfaces of the electric field in the central yz-plane at the resonant frequency (2.586 GHz); d = 58 mm; p = 54 mm; plasma in Argon at low pressure; P 0 = 10 W (a), 300 W (b), 1500 W (c); σ by (9) (Table 1); maximum field values in the patterns are given in Table 4.
Energies 18 05128 g007
Figure 8. Thermal patterns of the electric field in the xy-plane through the lower cavity at 50 mm (ae) and 33.5 mm (fj) from the bottom at the resonant frequency (2.586 GHz); d = 58 mm; p = 54 mm; plasma in Argon at low pressure; P 0 = 10 W (a,f), 100 W (b,g), 300 W (c,h), 500 W (d,i), 1500 W (e,j); σ by (9) (Table 1); max field values in the patterns are given Table 5.
Energies 18 05128 g008
Table 1. Values of plasma frequency and electric conductivity based on experimental data [35,36,37].
(8) & (1) and (2)(9) & (1) and (2)(10) & (1) and (2)
P0 [W] f p  [GHz] σ  [S/m] f p  [GHz] σ  [S/m] f p  [GHz] σ  [S/m]
10456910,02185.43.52.050.0020
100465410,3951136.132.090.0021
500502912,13819317.82.270.0025
1000549814,50826032.42.480.0030
1500596717,08831347.02.700.0035
2000643619,88035862.62.910.0041
Table 2. Calculated values of collision frequency for three gases at different pressures.
Pressureγ [GHz] (by (3))
HeArXe
Low0.060.330.75
Near atmospheric7.237.887.5
Table 3. Magnitude of the reflection coefficient [-] and corresponding energy coupling [%] at different operating frequencies.
| S 11 | η
Power P0 [W]10100500100015001010050010001500
f   =   2.450   GHz   ( Δ )0.9710.9810.9830.9910.9805.73.83.41.84.0
f = 2.485 GHz0.3220.8090.9540.9650.97690359.06.94.7
f = 2.586 GHz (o)0.9450.9320.7160.4730.7171113497849
Table 4. Maximum magnitudes of the electric field in the patterns in Figure 7 and corresponding values of density of dissipated power.
Figure 7P0 [W]|E|max [V/mm]Pdiss [W]
(a)108.60.14
(b)300117.221.0
(c)150043194.4
Table 5. Maximum magnitudes of the electric field in the patterns in Figure 8.
P0 [W]|E|max [V/mm]
(a–e)(f–j)
101.512.22
1005.067.33
300 14.715.5
50029.927.7
150071.467.5
Disclaimer/Publisher’s Note: The statements, opinions and data contained in all publications are solely those of the individual author(s) and contributor(s) and not of MDPI and/or the editor(s). MDPI and/or the editor(s) disclaim responsibility for any injury to people or property resulting from any ideas, methods, instructions or products referred to in the content.