1. Introduction
As the world places greater importance on environmental protection and sustainable development, the share of renewable energy in the energy mix has been growing steadily. Solar energy, acclaimed as a clean, emission-free, and sustainable resource, is an optimal choice for green energy development [
1]. Photovoltaic (PV) power generation, the principal means of harnessing solar energy, is experiencing rapid growth. Nevertheless, PV output is affected by multiple factors, making it fluctuating and unpredictable. This variability challenges grid stability and dispatch [
2]. Consequently, improving PV power forecasting and mitigating its grid impacts have become key to ensuring dependable and efficient system operation [
3].
Traditional PV power prediction methods include physical models and statistical approaches, which have been widely studied [
4]. Physical models rely on detailed meteorological and environmental factors, but they often suffer from high computational complexity and sensitivity to input accuracy [
5]. Statistical methods like exponential smoothing [
6], auto-regressive moving average [
7], and autoregressive integrated moving average [
8] capture historical patterns but struggle with nonlinear and complex relationships, degrading accuracy.
Deep learning techniques have garnered considerable attention for PV power prediction in recent years due to their powerful feature extraction and nonlinear modeling capabilities [
9]. Many scholars have applied Convolutional Neural Networks (CNN) [
10], gated recurrent units [
11], and Long Short-Term Memory (LSTM) [
12] to improve forecasting accuracy. Building on this, many studies adopt hybrid architectures. Zang et al. [
13] proposed a spatiotemporal hybrid CNN-LSTM model for short-term solar radiation prediction and evaluated its performance in different seasons and weather conditions, showing its superior predictive ability. Limouni et al. [
14] proposed an LSTM-TCN-based forecasting model to improve prediction accuracy, and the results demonstrated that the proposed model outperforms baseline and conventional models in forecasting accuracy. Li et al. [
15] introduced a Stacking ensemble of optimized Neural Prophet, LSTM, and Informer models, which achieved good performance by delivering lower errors, improved stability across different forecasting horizons, and better adaptability to seasonal changes in solar power generation. However, deep learning models often face hyperparameter selection challenges, significantly affecting their performance.
To address this problem, scholars have explored various optimization algorithms to meet the challenge of optimizing deep learning parameters. Hou et al. [
16] used the whale optimization algorithm (WOA) to optimize the training iterations, learning rate, and number of hidden neurons of the LSTM to enhance the prediction accuracy of the model. Li et al. [
17] proposed a short-term PV power generation prediction method by combining the sparrow search algorithm (SSA) and BiLSTM, and verified its effectiveness by comparing it under different seasons and weather. Zhou et al. [
18] utilized the RIME optimization algorithm (RIME) to modify the hyperparameters of neural networks and proved the capability of RIME in short-term photovoltaic power prediction. Zhang et al. [
19] introduced a short-term PV forecasting model based on a secondary decomposition method, and optimized the BiLSTM hyperparameters using the Crested Porcupine Optimization algorithm (CPO). The results showed that CPO effectively tuned the model parameters, leading to improved forecasting performance. However, these algorithms still have some drawbacks, such as long optimization times and the risk of falling into local optima, resulting in suboptimal performance.
Further, data quality is another key factor that directly affects the accuracy of power prediction. The power generation data series is a non-smooth, non-linear signal with various time scales and contains numerous hidden patterns. Integrating signal decomposition and dimensionality reduction methods with deep learning can improve the accuracy of power predictions. Wang et al. [
20] proposed a PCA-SSA-VMD-based hybrid model to enhance offshore wind power forecasting for economic scheduling and demonstrated that the proposed model effectively enhances prediction precision and validates its effectiveness. Zhang et al. [
21] proposed a combined model that combines Empirical Mode Decomposition (EMD) and Kernel Principal Component Analysis (KPCA) for data preprocessing with a deep learning framework for wind power forecasting, achieving superior prediction accuracy compared to benchmark models. Peng et al. [
22] developed a hybrid model that combines symplectic geometry model decomposition, KPCA, and an optimized BiLSTM, achieving highly accurate forecasts of wind and photovoltaic power. However, this method is rarely used for PV power forecasting.
Based on the analysis above, this research proposes a hybrid prediction framework that combines data classification, selection, and optimization algorithms with neural networks. The main contributions and innovations are summarized as follows:
- (1)
Classify the data into multiple categories by using clustering and construct differentiated prediction models for various weather conditions to improve the model’s adaptability to complex weather.
- (2)
The feature data are decomposed by using EMD and downscaled by using KPCA to extract key features, reduce redundancy, and improve computational efficiency. The processed model is then compared with the unprocessed counterpart to verify its advantages in improving the stability of PV power forecasting and its adaptability to complex meteorological conditions.
- (3)
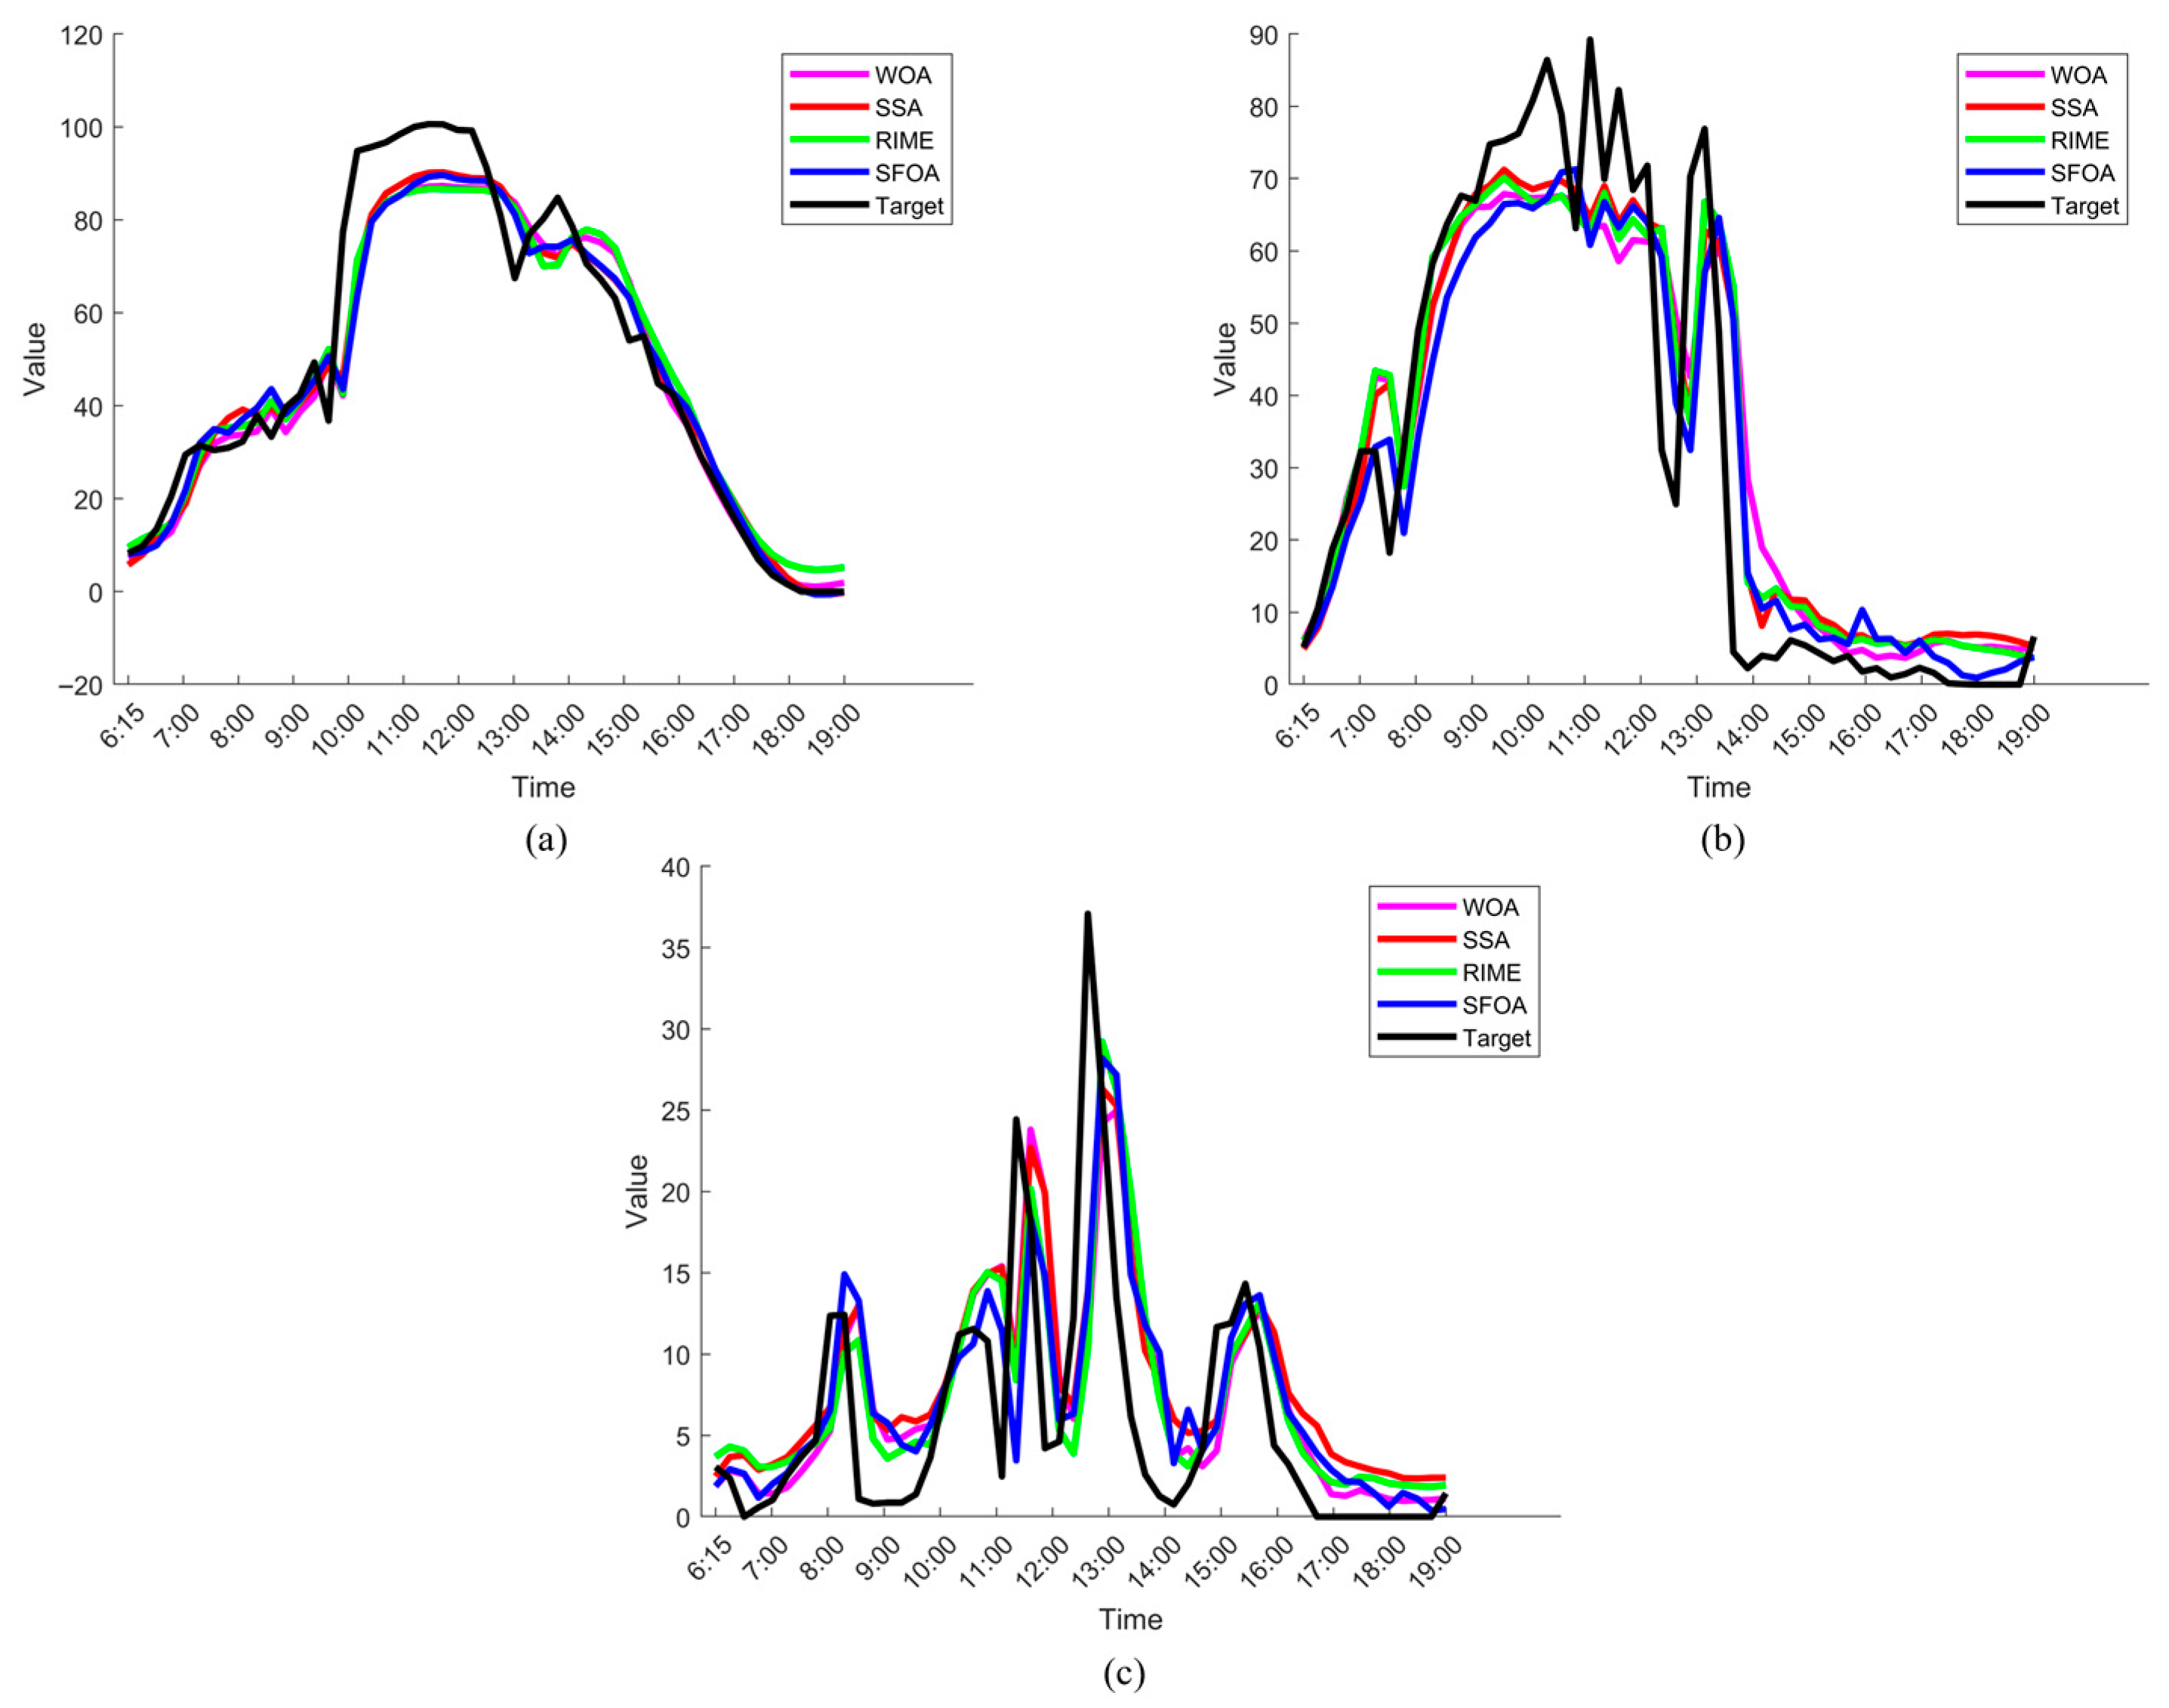
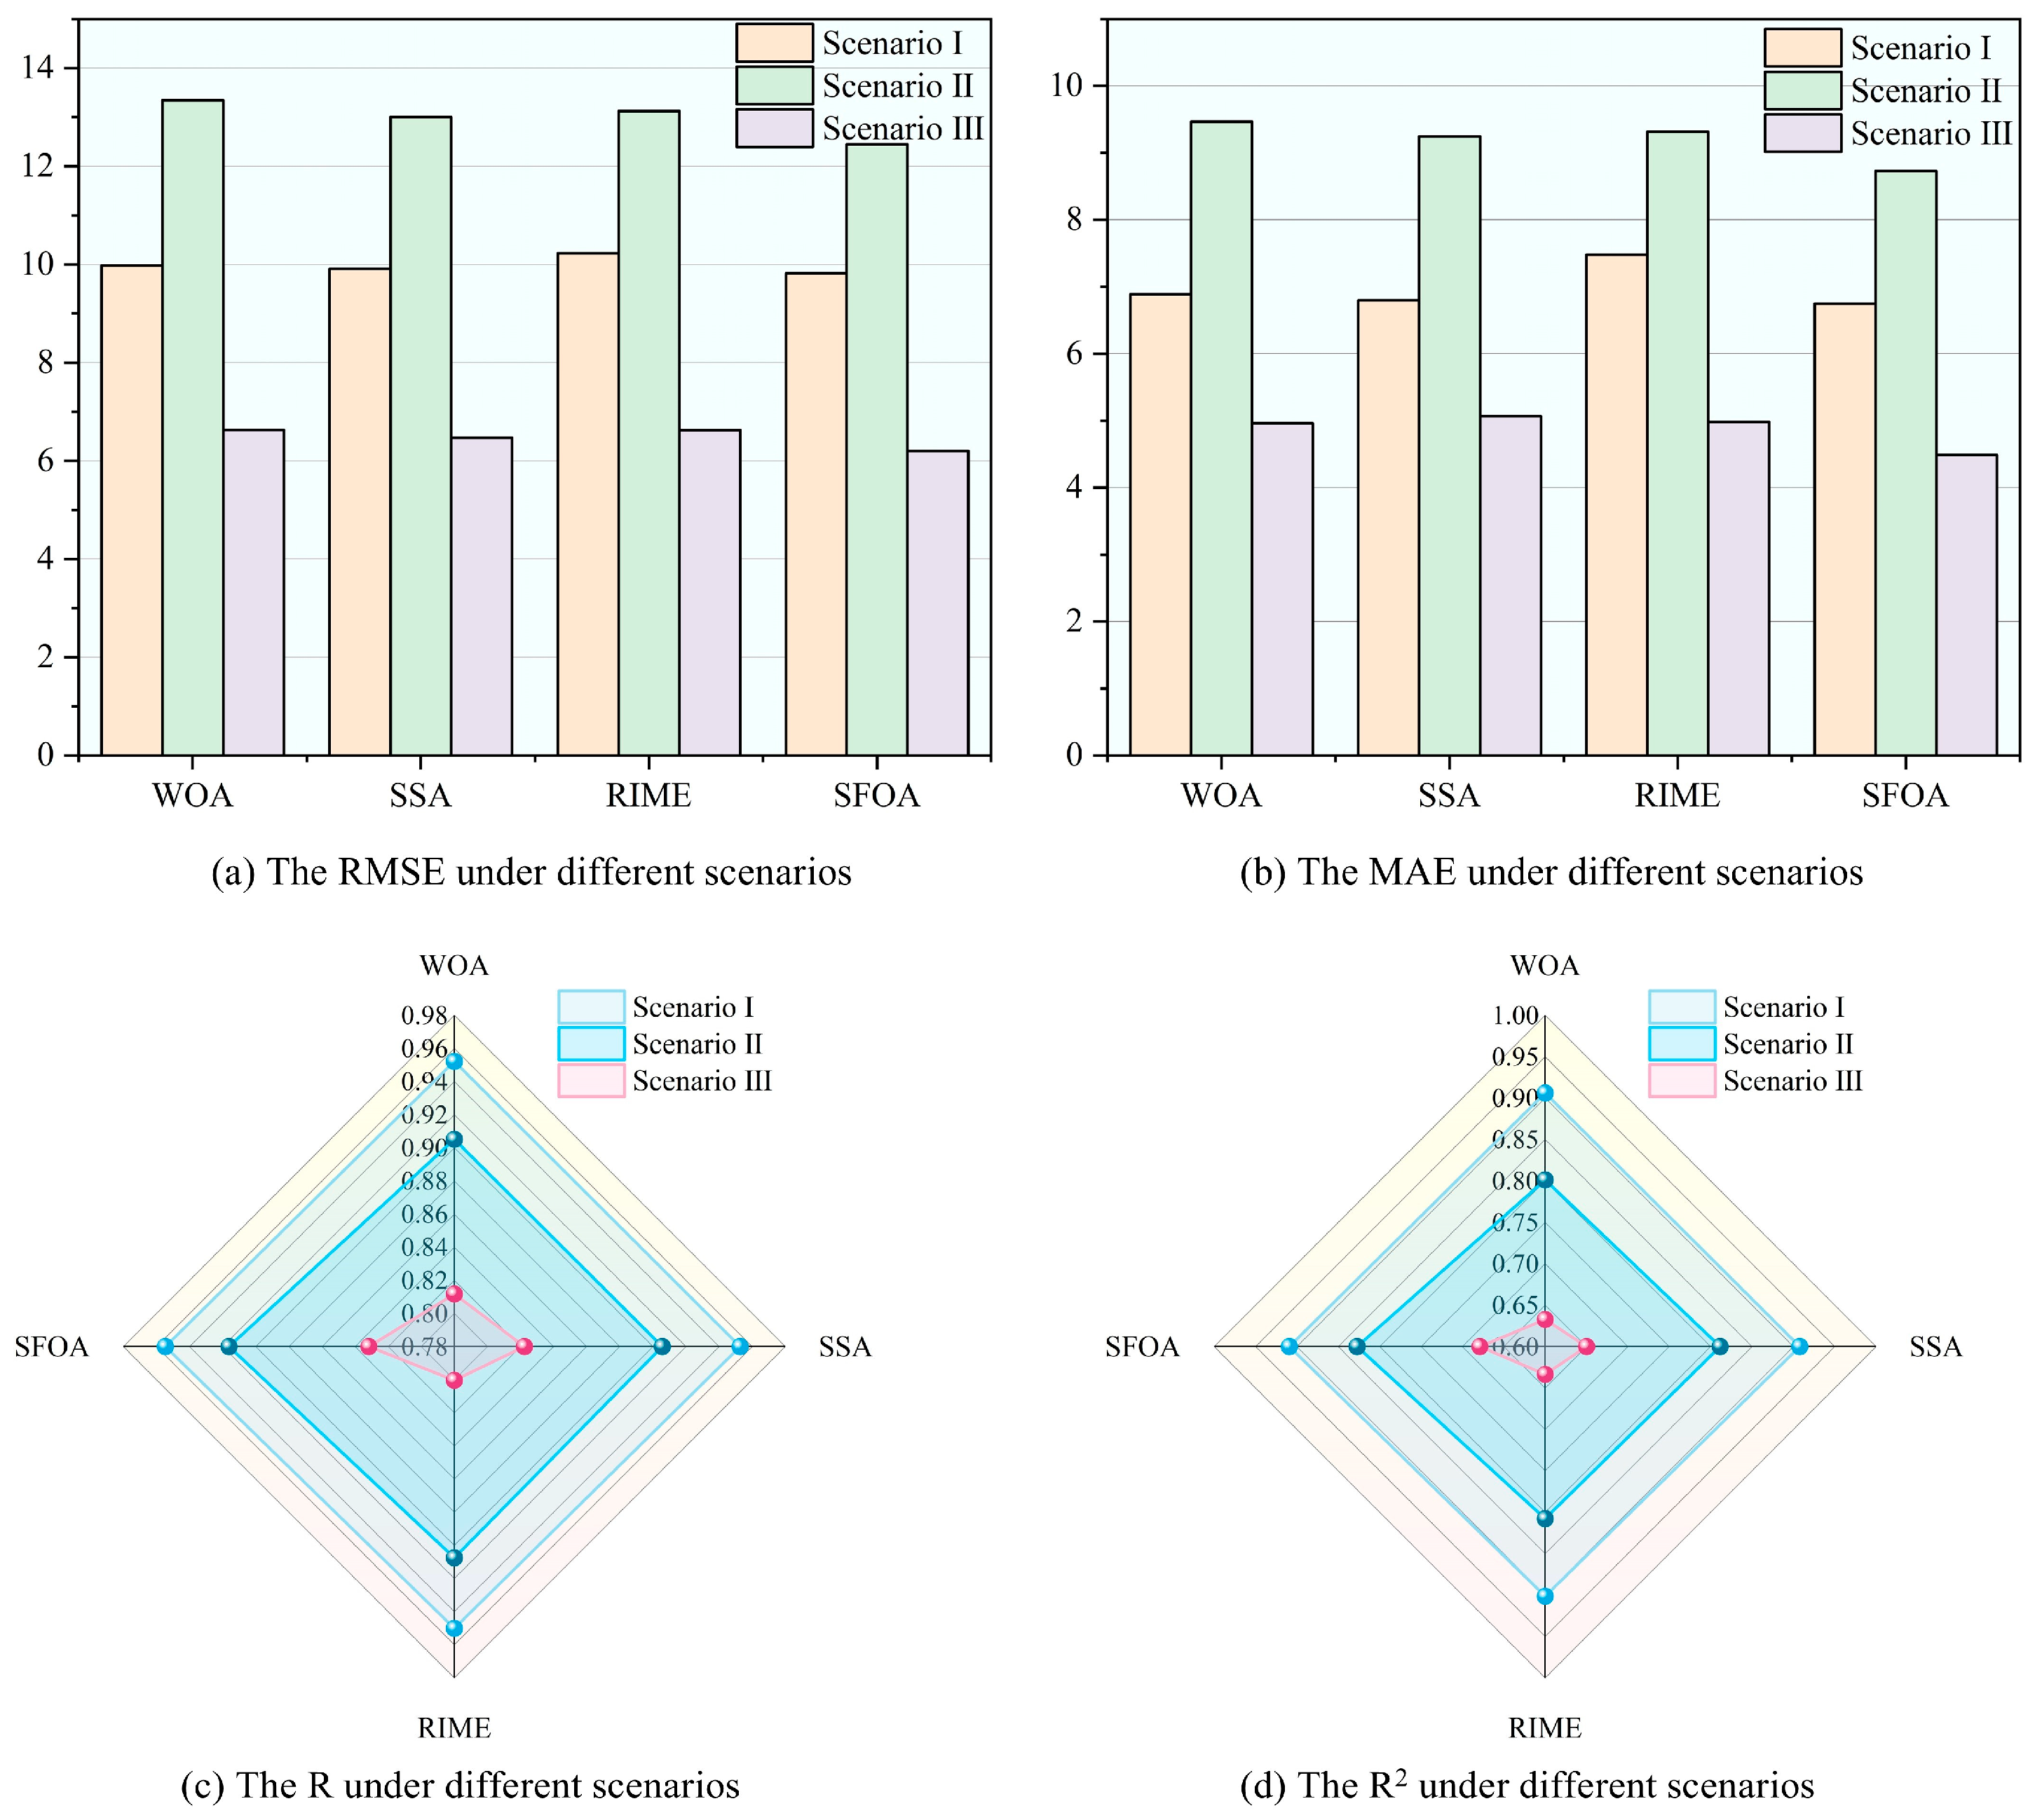
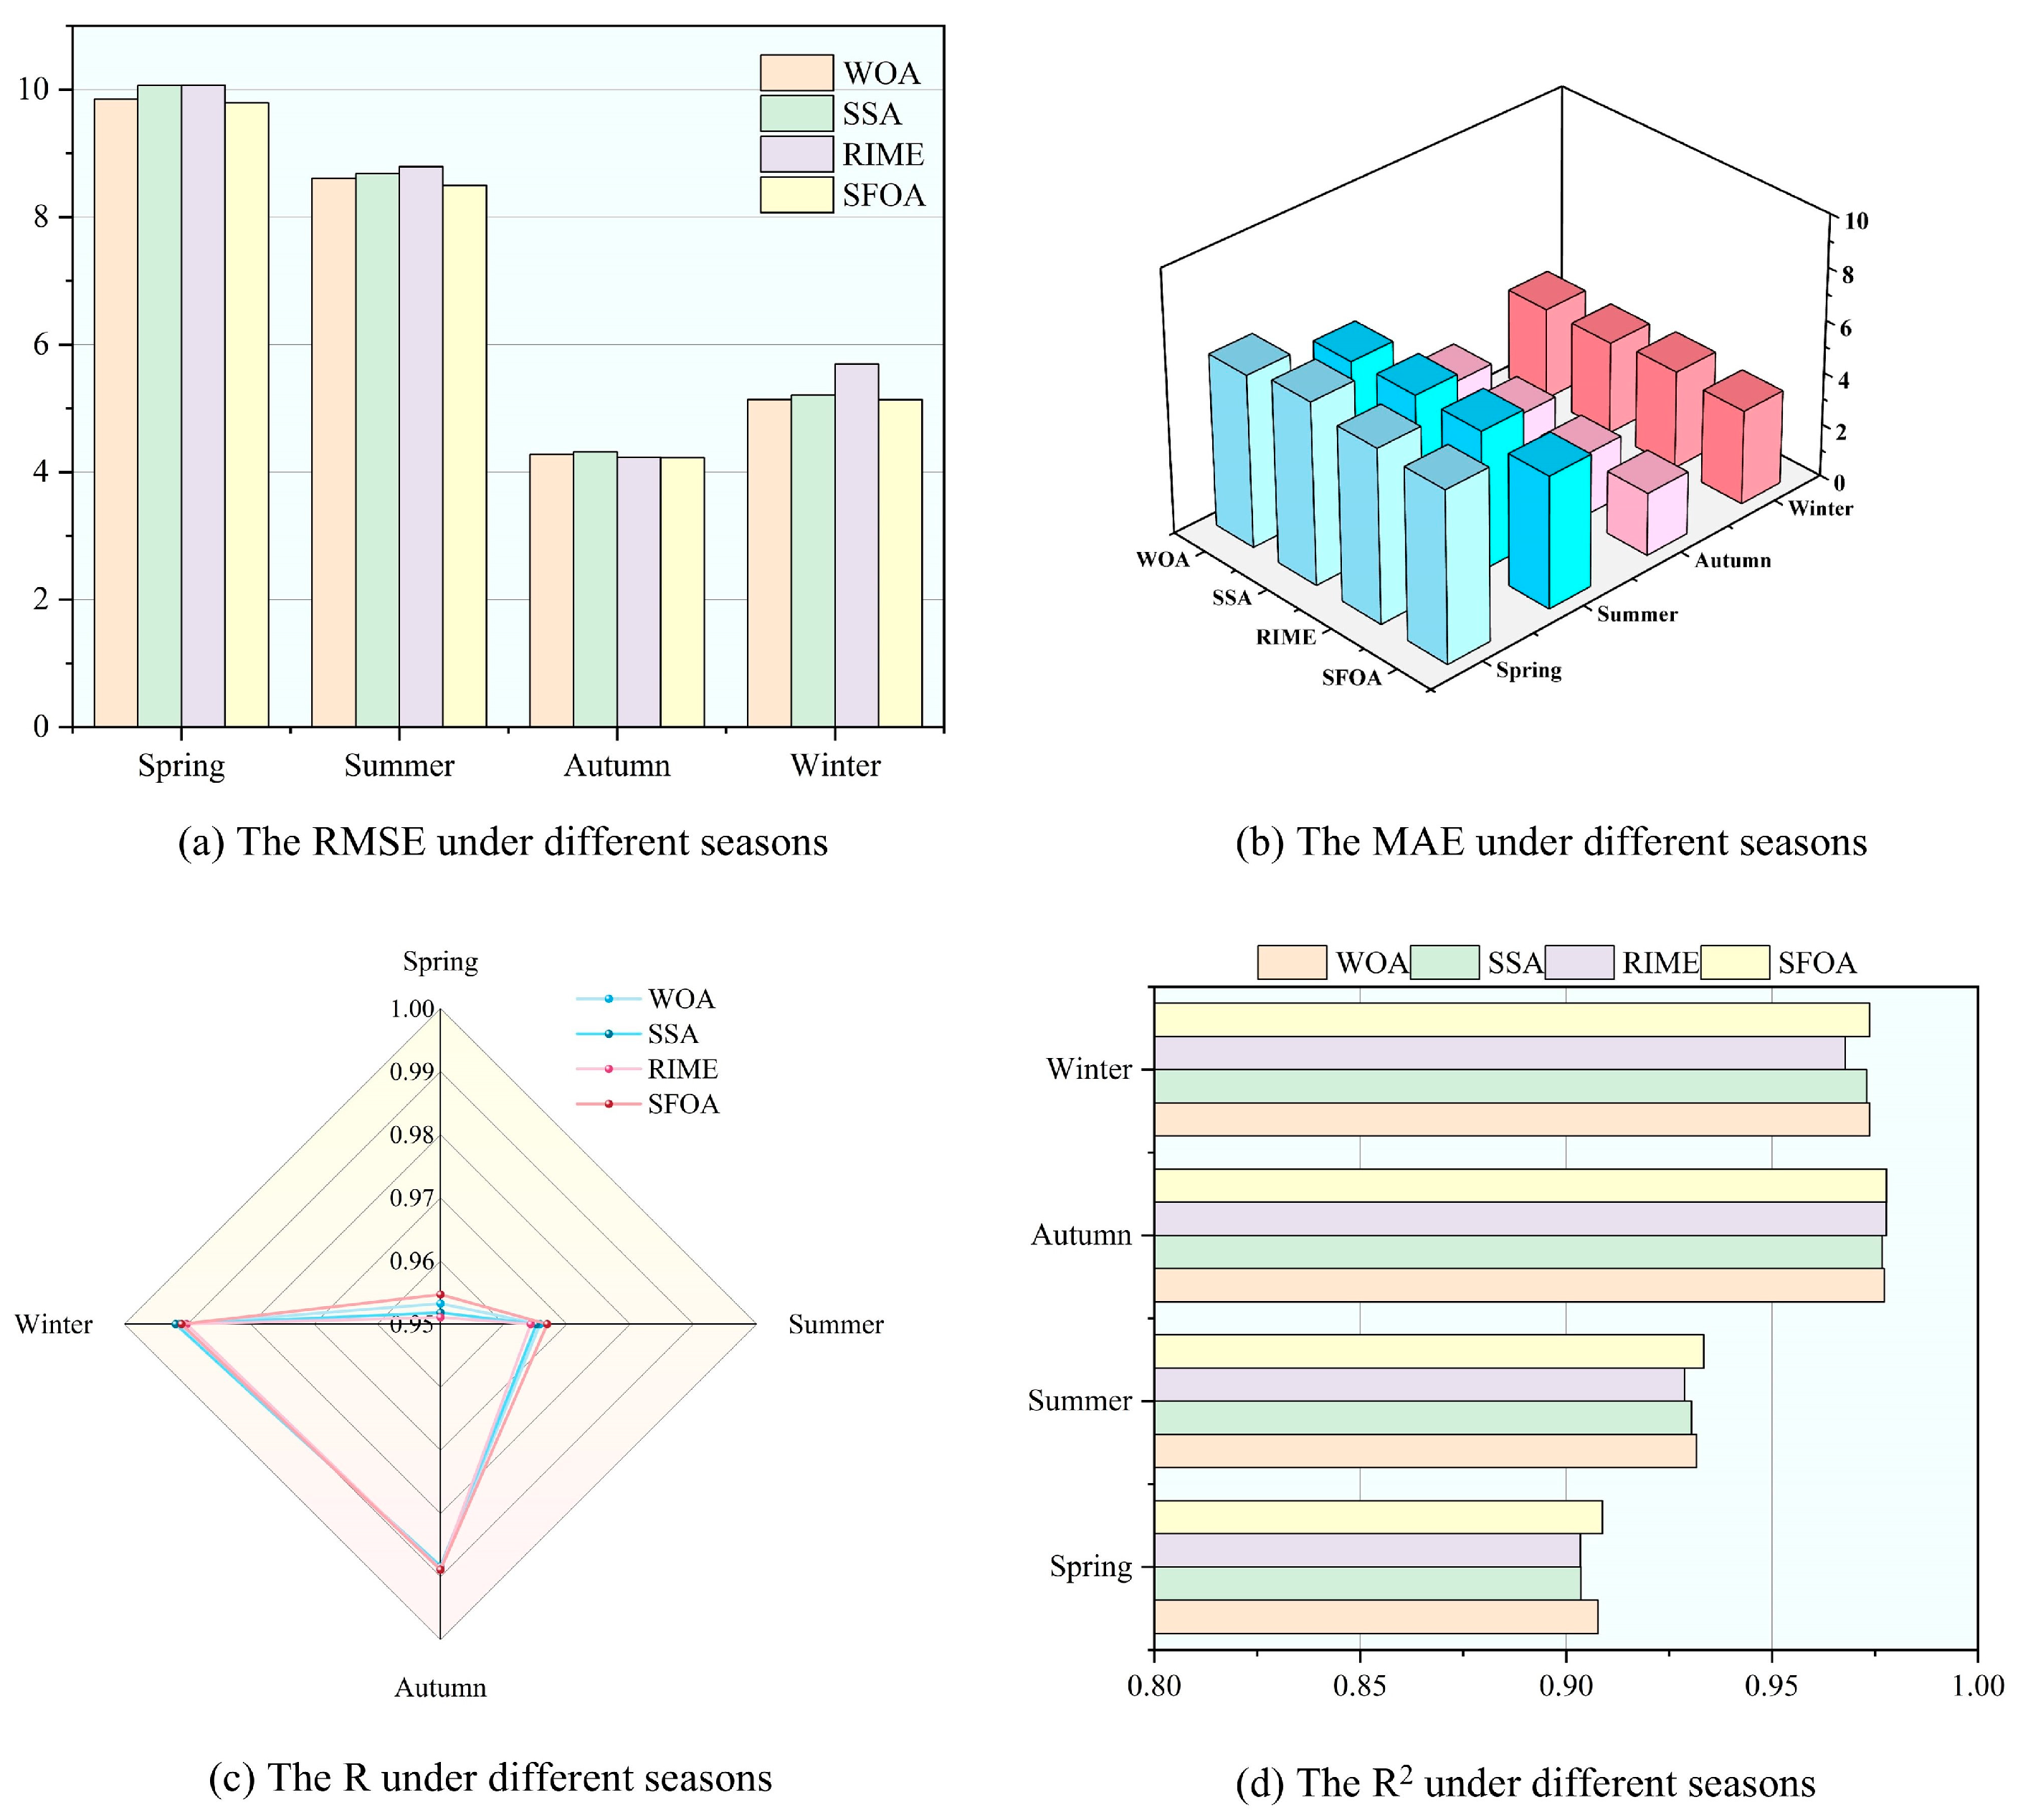
The SFOA is first introduced into the field of photovoltaic forecasting to automatically optimize the hyperparameters of models. It is compared with other optimization algorithms, demonstrating its advantage in improving the generalization ability of photovoltaic forecasting models.
The rest of the paper is arranged as follows:
Section 2 describes the principle behind each method employed.
Section 3 introduces the prediction model and details the experimental steps.
Section 4 shows the experimental data along with the analysis methodology.
Section 5 shows the numerical results and compares them with alternative methods.
Section 6 provides the conclusions and points out issues for further research.
2. Principle
2.1. K-Means Clustering Algorithm
K-means is a widely used clustering algorithm that divides a dataset into clusters by minimizing within-cluster variance. The specific procedure is as follows:
Step 1: Given data , randomly initialize centroids .
Step 2: For each data point , compute its Euclidean distance from each cluster centroids by using the formula . Each data point is then allocated to the cluster corresponding to the nearest centroid. This results in clusters, where each data point is assigned to the cluster whose centroid is closest.
Step 3: After assigning all data points to their respective clusters, the centroids of the clusters are recalculated. The new centroid
for each cluster
is computed as the mean of the data points in that cluster:
where
is the set of data points in cluster
, and
is the number of points in the cluster.
Step 4: Steps 2 and 3 are repeated until the cluster centroids stabilize, or the maximum number of iterations is reached, indicating the algorithm’s convergence.
2.2. Empirical Mode Decomposition
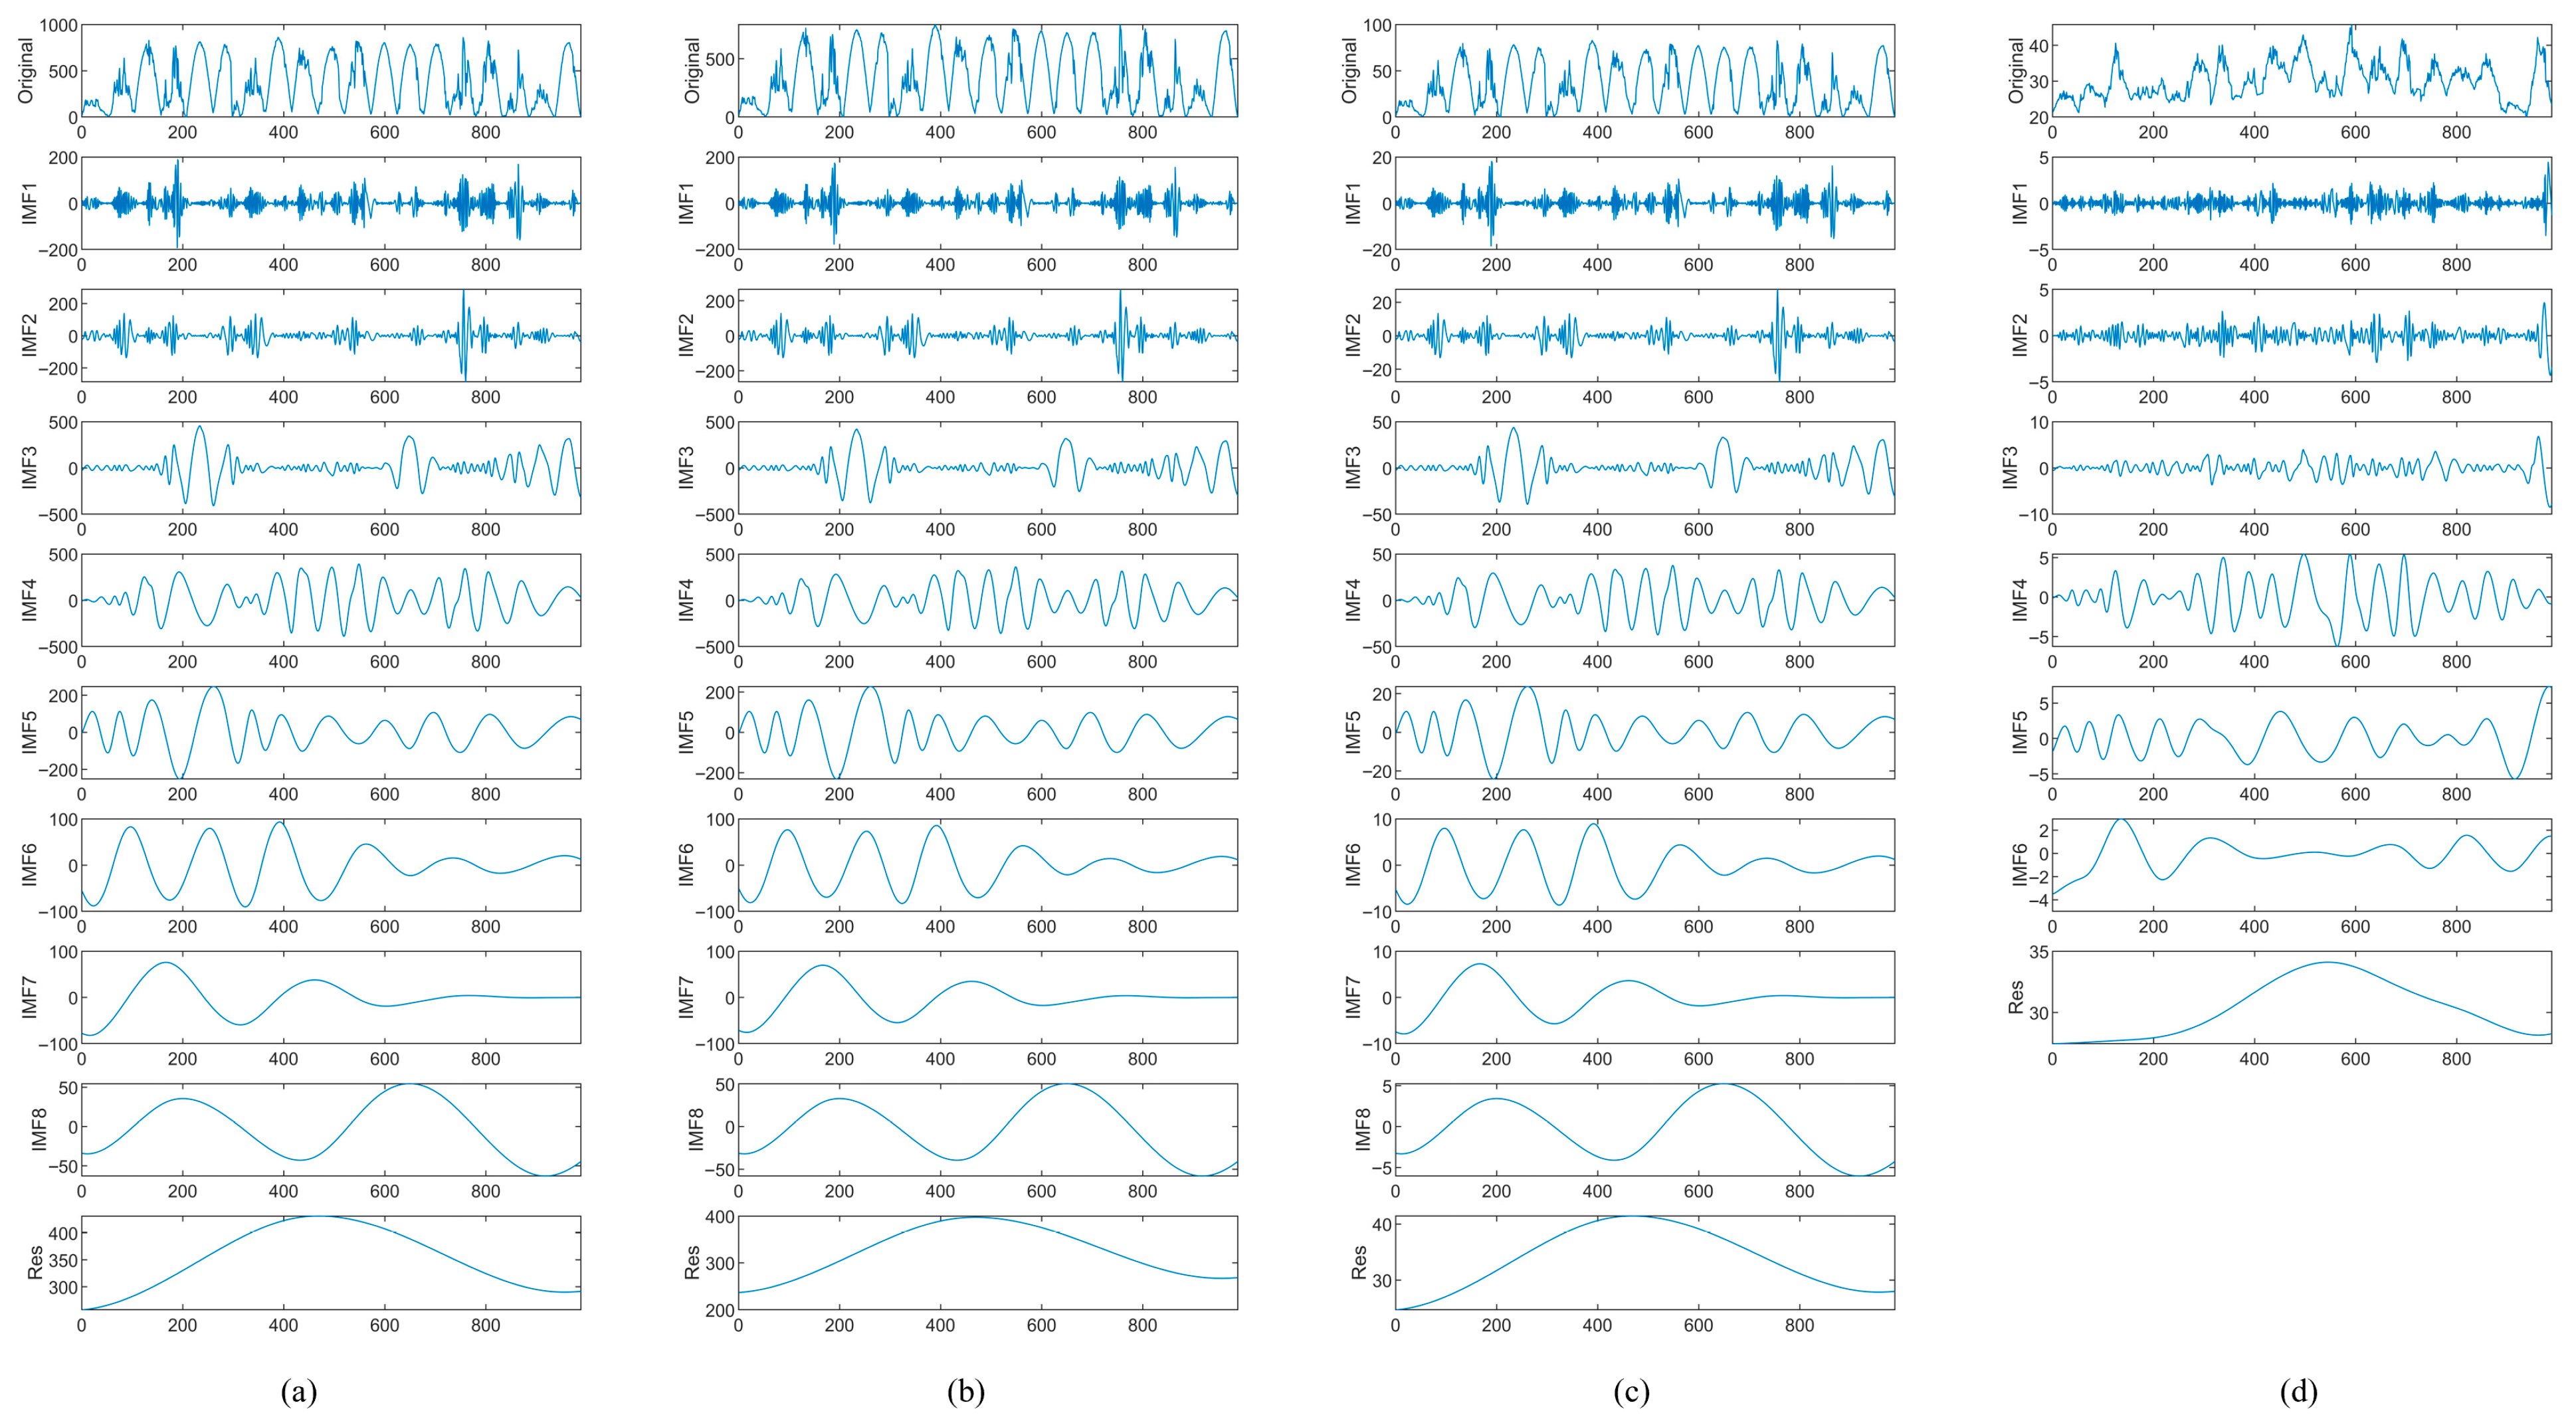
EMD is a decomposition method for nonlinear, non-smooth signals, breaking the signal into intrinsic modal functions (IMFs) that capture oscillatory components at different time scales. The specific decomposition process is as follows:
Step 1: Given a signal , the first step is to identify the local extrema. These extrema points are used to construct the lower and upper envelopes of the signal, denoted as and , respectively.
Step 2: The local mean is calculated as the average of these envelopes. The first component is . If satisfies the stopping criteria, which requires equal numbers of extrema and zero-crossings, it is considered the first IMF.
Step 3: The residual becomes the new signal, and the procedure repeats to find further IMFs, continuing until the residual meets the termination condition.
Step 4: The decomposition stops when the residual signal
becomes monotonic or reaches a predefined threshold
. The final decomposition is:
where
,
,…,
are the IMFs, and
is the residual.
2.3. Kernel Principal Component Analysis
After signal decomposition, the increased input dimension can complicate the model and reduce its generalization ability. KPCA employs a kernel function to transform data into a high dimensional feature space for nonlinear dimensionality reduction. In this space, principal component analysis is applied to extract the key features of the data. Unlike traditional PCA, KPCA enables nonlinear feature extraction by leveraging the kernel function, which avoids high-dimensional mapping. The specific procedure is as follows:
Step 1: Select a kernel function and map the original data into a high-dimensional space, obtaining the corresponding data matrix. The polynomial kernel function is defined as:
where
,
are original data samples, and
is the degree of the highest-order term.
Step 2: Center the kernel matrix and obtain the centered kernel matrix
. The equation is presented below:
where
represents an
matrix whose elements are all
.
Step 3: Calculate the eigenvalues and eigenvectors of the centered kernel matrix.
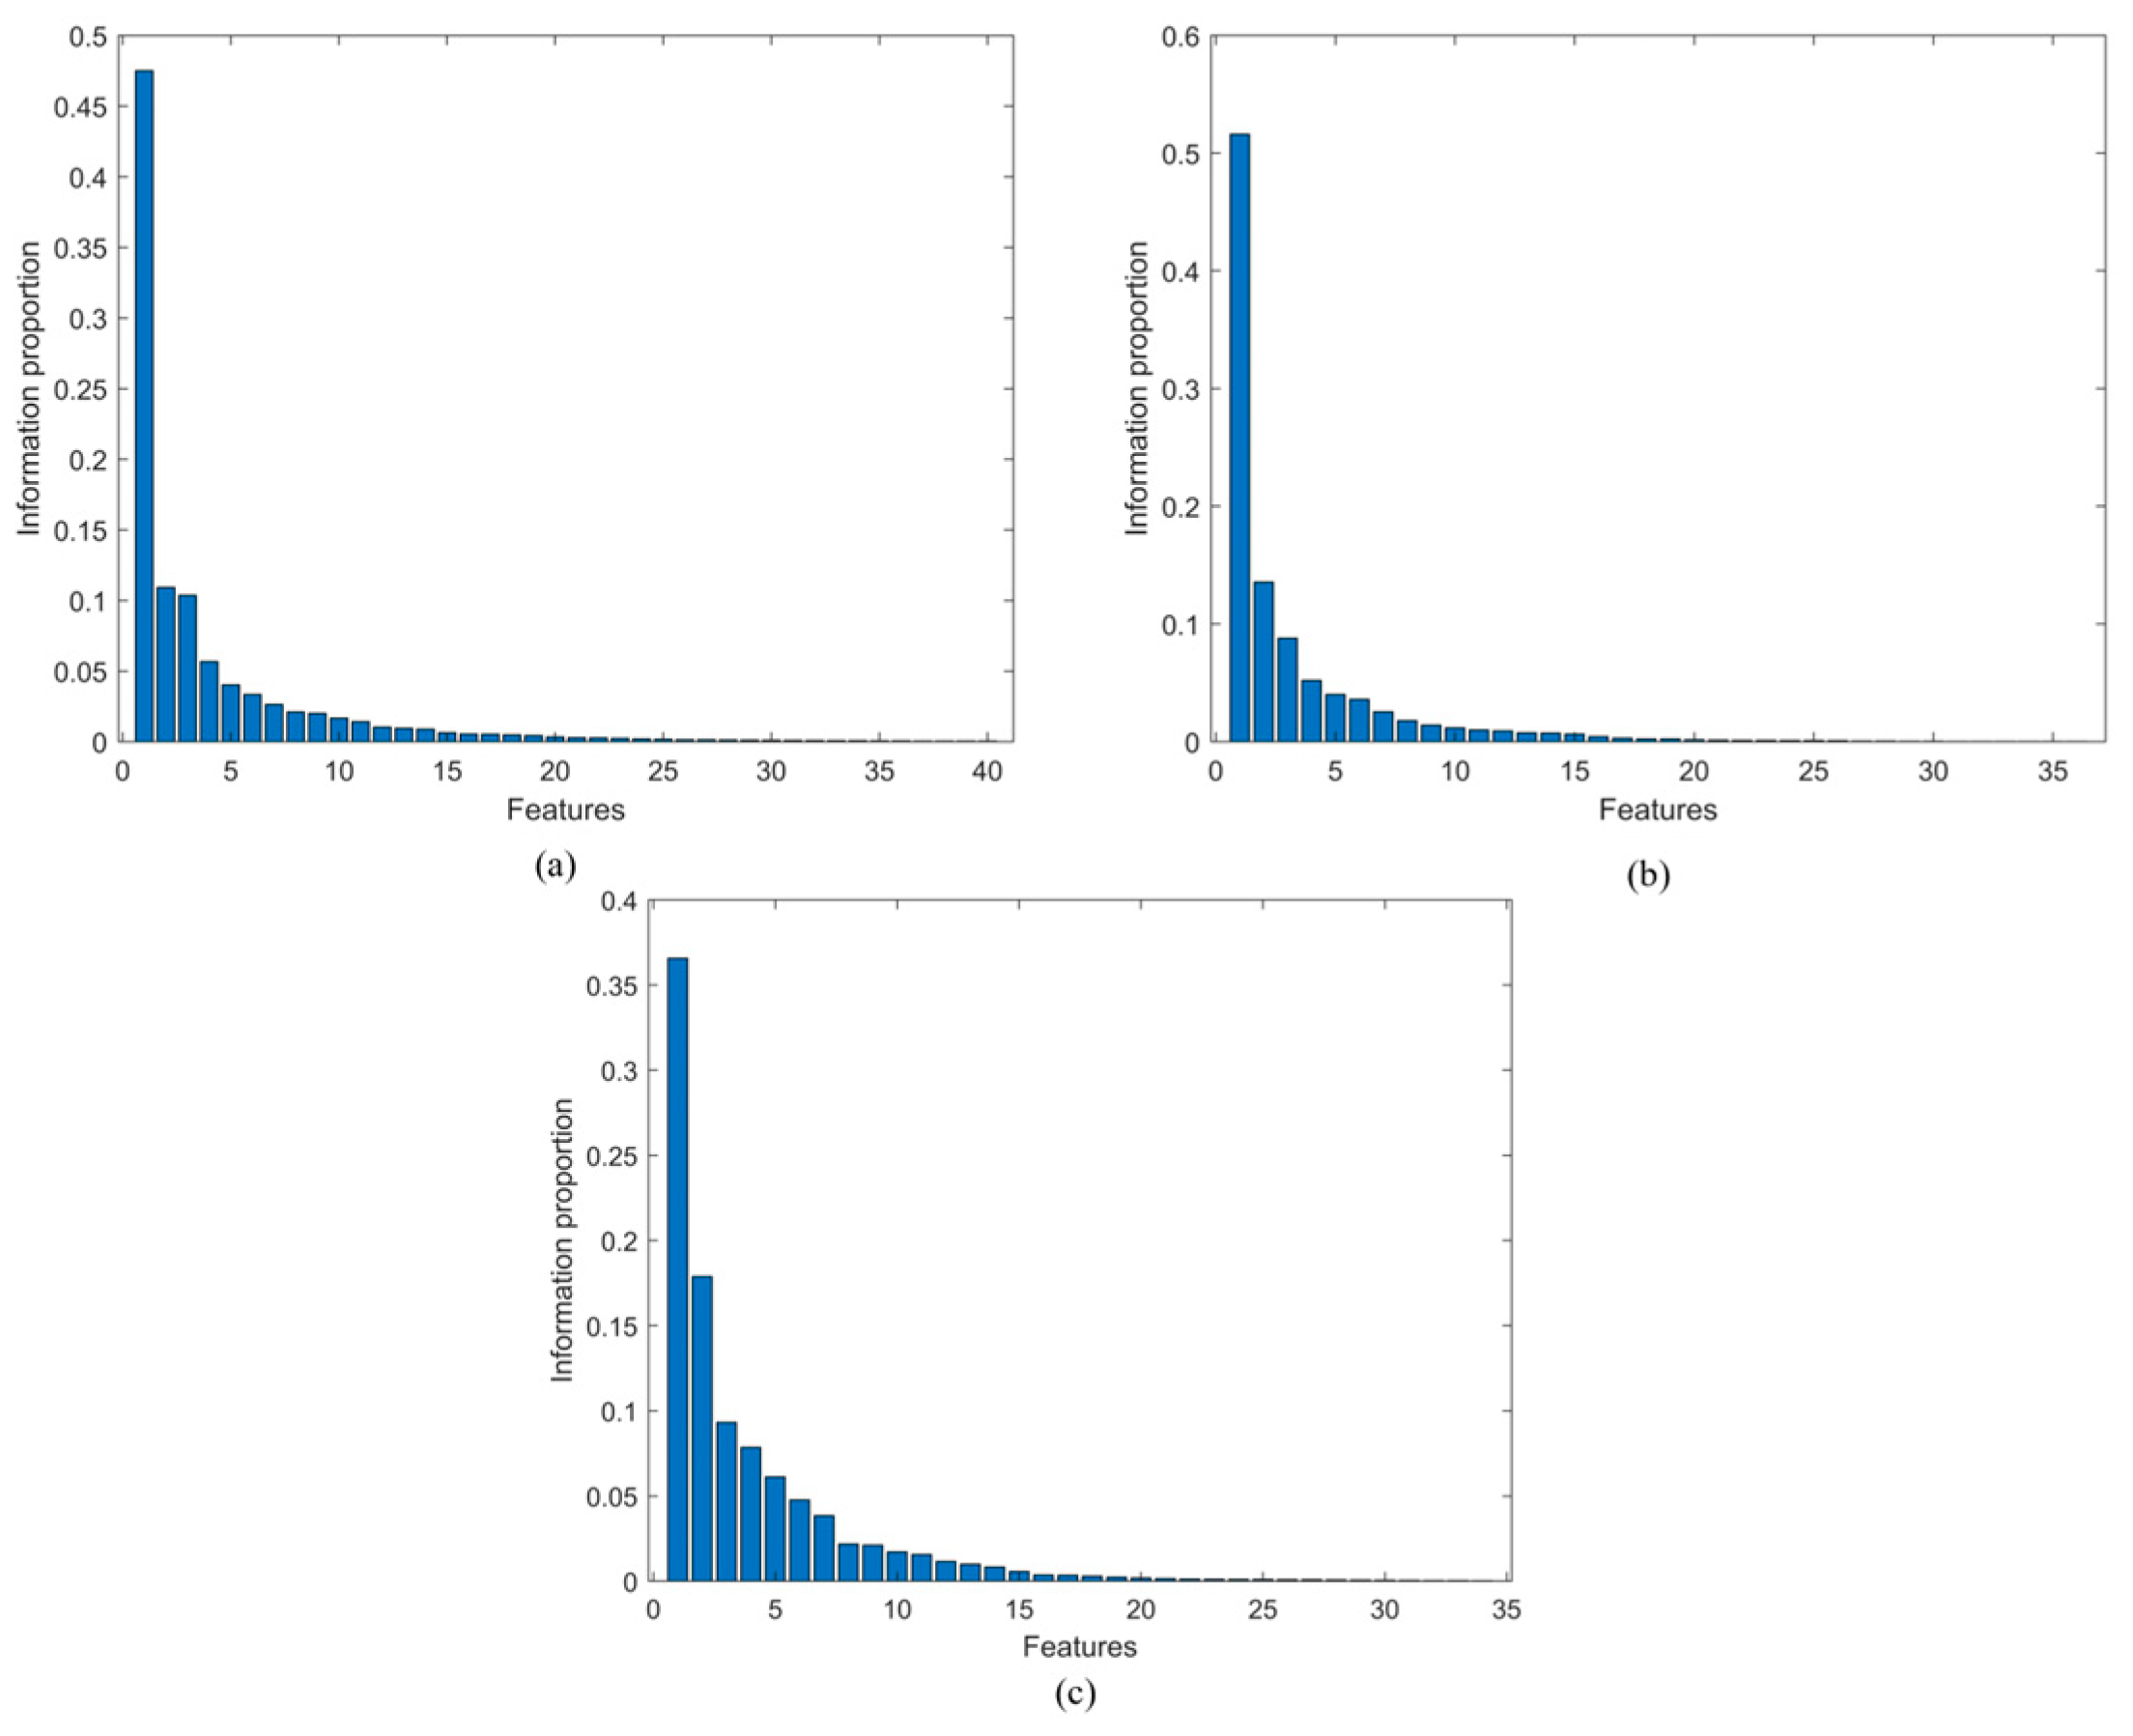
Step 4: The cumulative contribution of the eigenvalues is calculated to quantify the contribution of each eigenvalue to the total variability of the data. When the cumulative contribution reaches a predefined threshold , the top principal components are selected as the reduced-dimensional representation of the data.
2.4. SFOA-CNN-BiLSTM Model
2.4.1. CNN-BiLSTM Neural Network Model
The CNN-BiLSTM model is a hybrid architecture combining Convolutional Neural Networks and Bidirectional Long Short-Term Memory Networks. This architecture leverages the strengths of both models, making it particularly effective for tasks like sequential data analysis.
- (1)
CNN Layer
In the CNN layer, multiple convolutional layers are used to automatically capture spatial hierarchies and local patterns from the input data. These layers apply convolutional filters, generating feature maps that capture local dependencies and patterns. The CNN layer for a single filter
applied to an input sequence
can be expressed as:
where
represents the input sequence,
represents the convolutional filter,
represents the bias term, and
represents an activation function.
- (2)
BiLSTM Layer
The BiLSTM layer is employed to capture the sequential dependencies in the data. Unlike traditional LSTMs that capture only past information, BiLSTM networks capture sequence information by processing data bidirectionally. This enables them to capture information from both the past and the future, making them particularly effective for tasks that require understanding both preceding and succeeding elements. A single LSTM unit computes the following relations:
where
,
,
are the input, forget, and output gates, respectively,
is the hidden state,
is the cell state,
are the weights and
are the biases,
is the current input, and
is the previous hidden state.
The BiLSTM can process the input sequence in two directions. The outputs of both directions are then concatenated to provide a more comprehensive representation of the sequence. For each time step
, the hidden state
of the BiLSTM output is a splice of the forward and reverse LSTM outputs:
where
and
indicate the forward and reverse LSTM outputs at time step
, respectively.
- (3)
Overall CNN-BiLSTM Structure
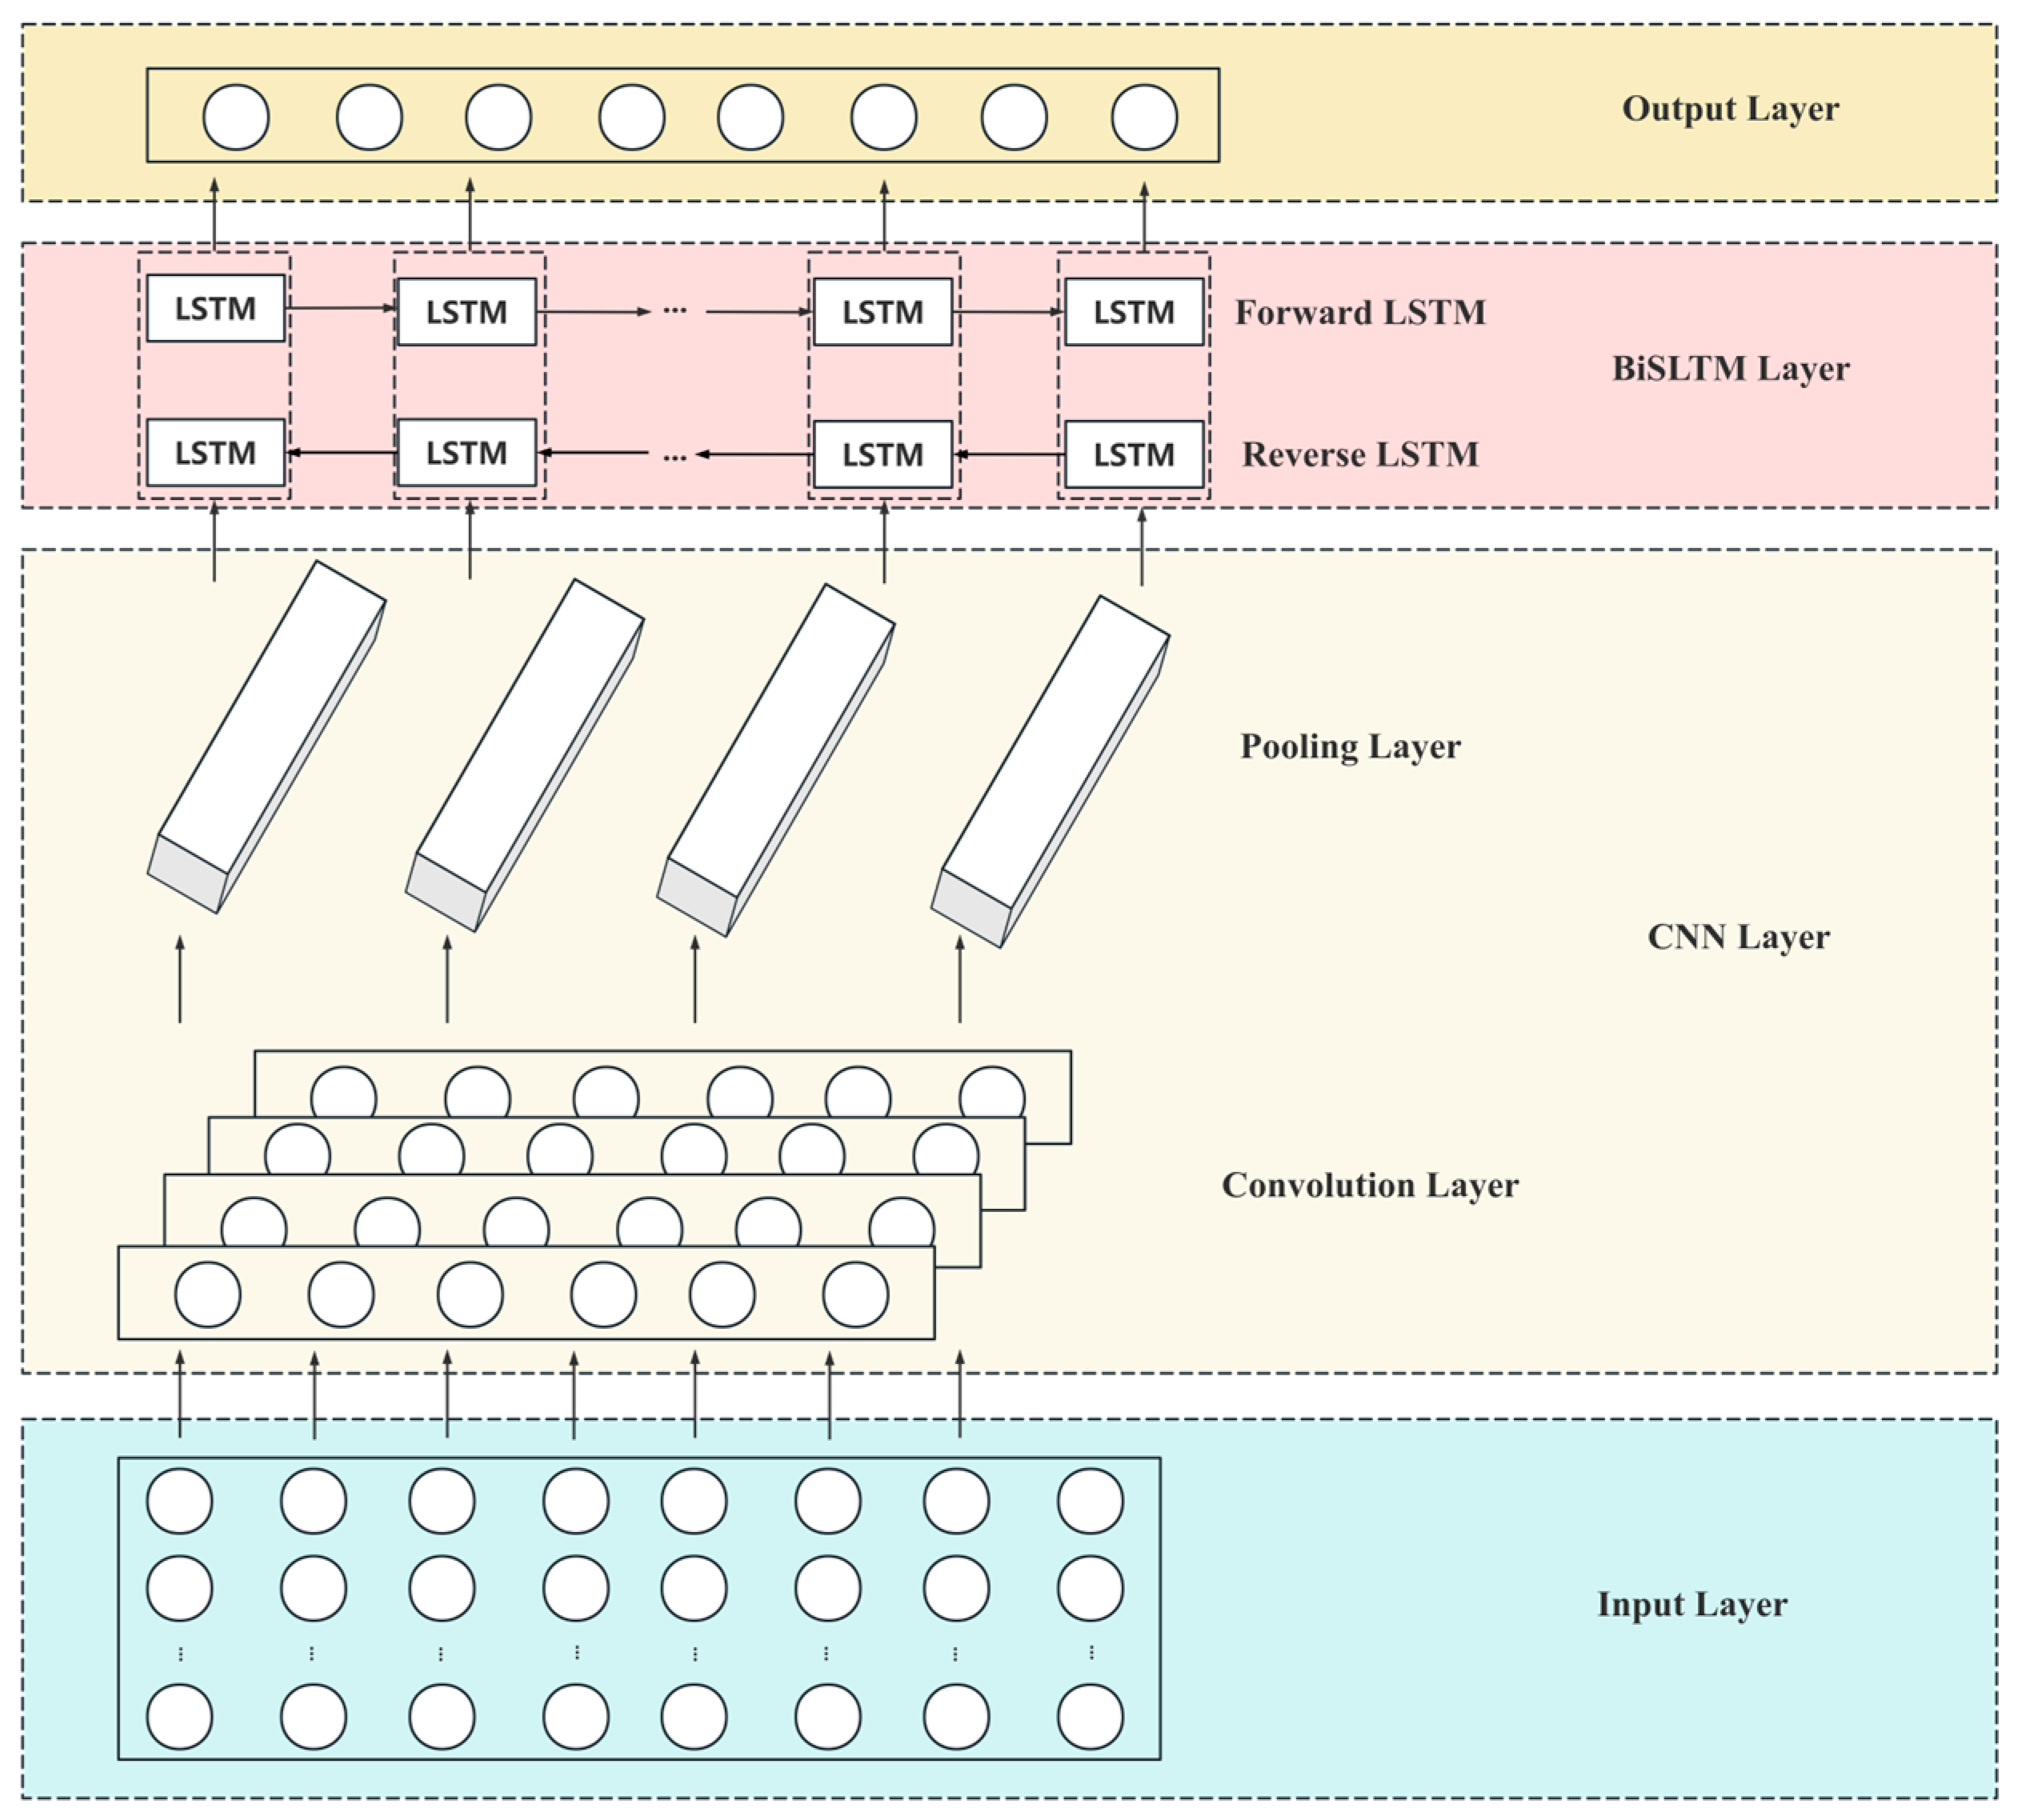
In the CNN-BiLSTM model, the CNN layers initially extract local features from the input sequence. These features are then passed to the BiLSTM layers, which model the temporal dependencies of the sequence in both directions. The specific model parameters are presented in
Table 1, and the structure of the CNN-BiLSTM model is depicted in
Figure 1.
2.4.2. SFOA Principle
SFOA is a novel bio-inspired metaheuristic inspired by the behaviors of starfish, including exploration, preying, and regeneration [
23]. It employs a hybrid search strategy that integrates both five-dimensional and unidimensional search patterns. This integration can not only optimize resource utilization but also significantly enhance computational efficiency, enabling SFOA to swiftly and accurately navigate through complex solution spaces and identify optimal solutions more effortlessly. The main ideas of SFOA are expressed as follows:
where
denotes the
dimensional position of the
starfish,
denotes a random number between (0, 1),
and
are bounds of the
dimensional design variable, respectively.
- (2)
Exploration phase
If the optimization problem has a dimension greater than 5, SFOA uses the following mathematical model:
where
and
denote the obtained position and the current position of a starfish, respectively;
denotes the
-dimension of the best current position,
is a randomly selected 5-dimension in the
-dimension,
denotes the random number between (0, 1);
is the current number of iterations, and
is the maximal number of iterations,
is in the range of [0,
].
If the optimization problem has no dimension greater than 5, the exploration phase uses a one-dimensional search pattern to update the position.
where
and
are the positions of two randomly chosen starfish in the p-dimension,
and
are two random numbers between (−1, 1), and
is a randomly chosen number in the
dimension.
- (3)
Exploitation phase
SFOA employs a parallel bidirectional search strategy, which leverages information from other starfish and the current best position within the population. The distances can be calculated as:
where
represents the five distances between the global best and other starfish, and
refers to five randomly selected starfish. The first update rule for each starfish is modeled as follows:
where
and
are random numbers between (0, 1),
and
are randomly selected in
. In addition, if
, another update rule is modeled as follows:
where
is the current iteration,
is the maximum iterative number, and
is the population size.
2.4.3. The Steps of the SFOA-CNN-BiLSTM Model
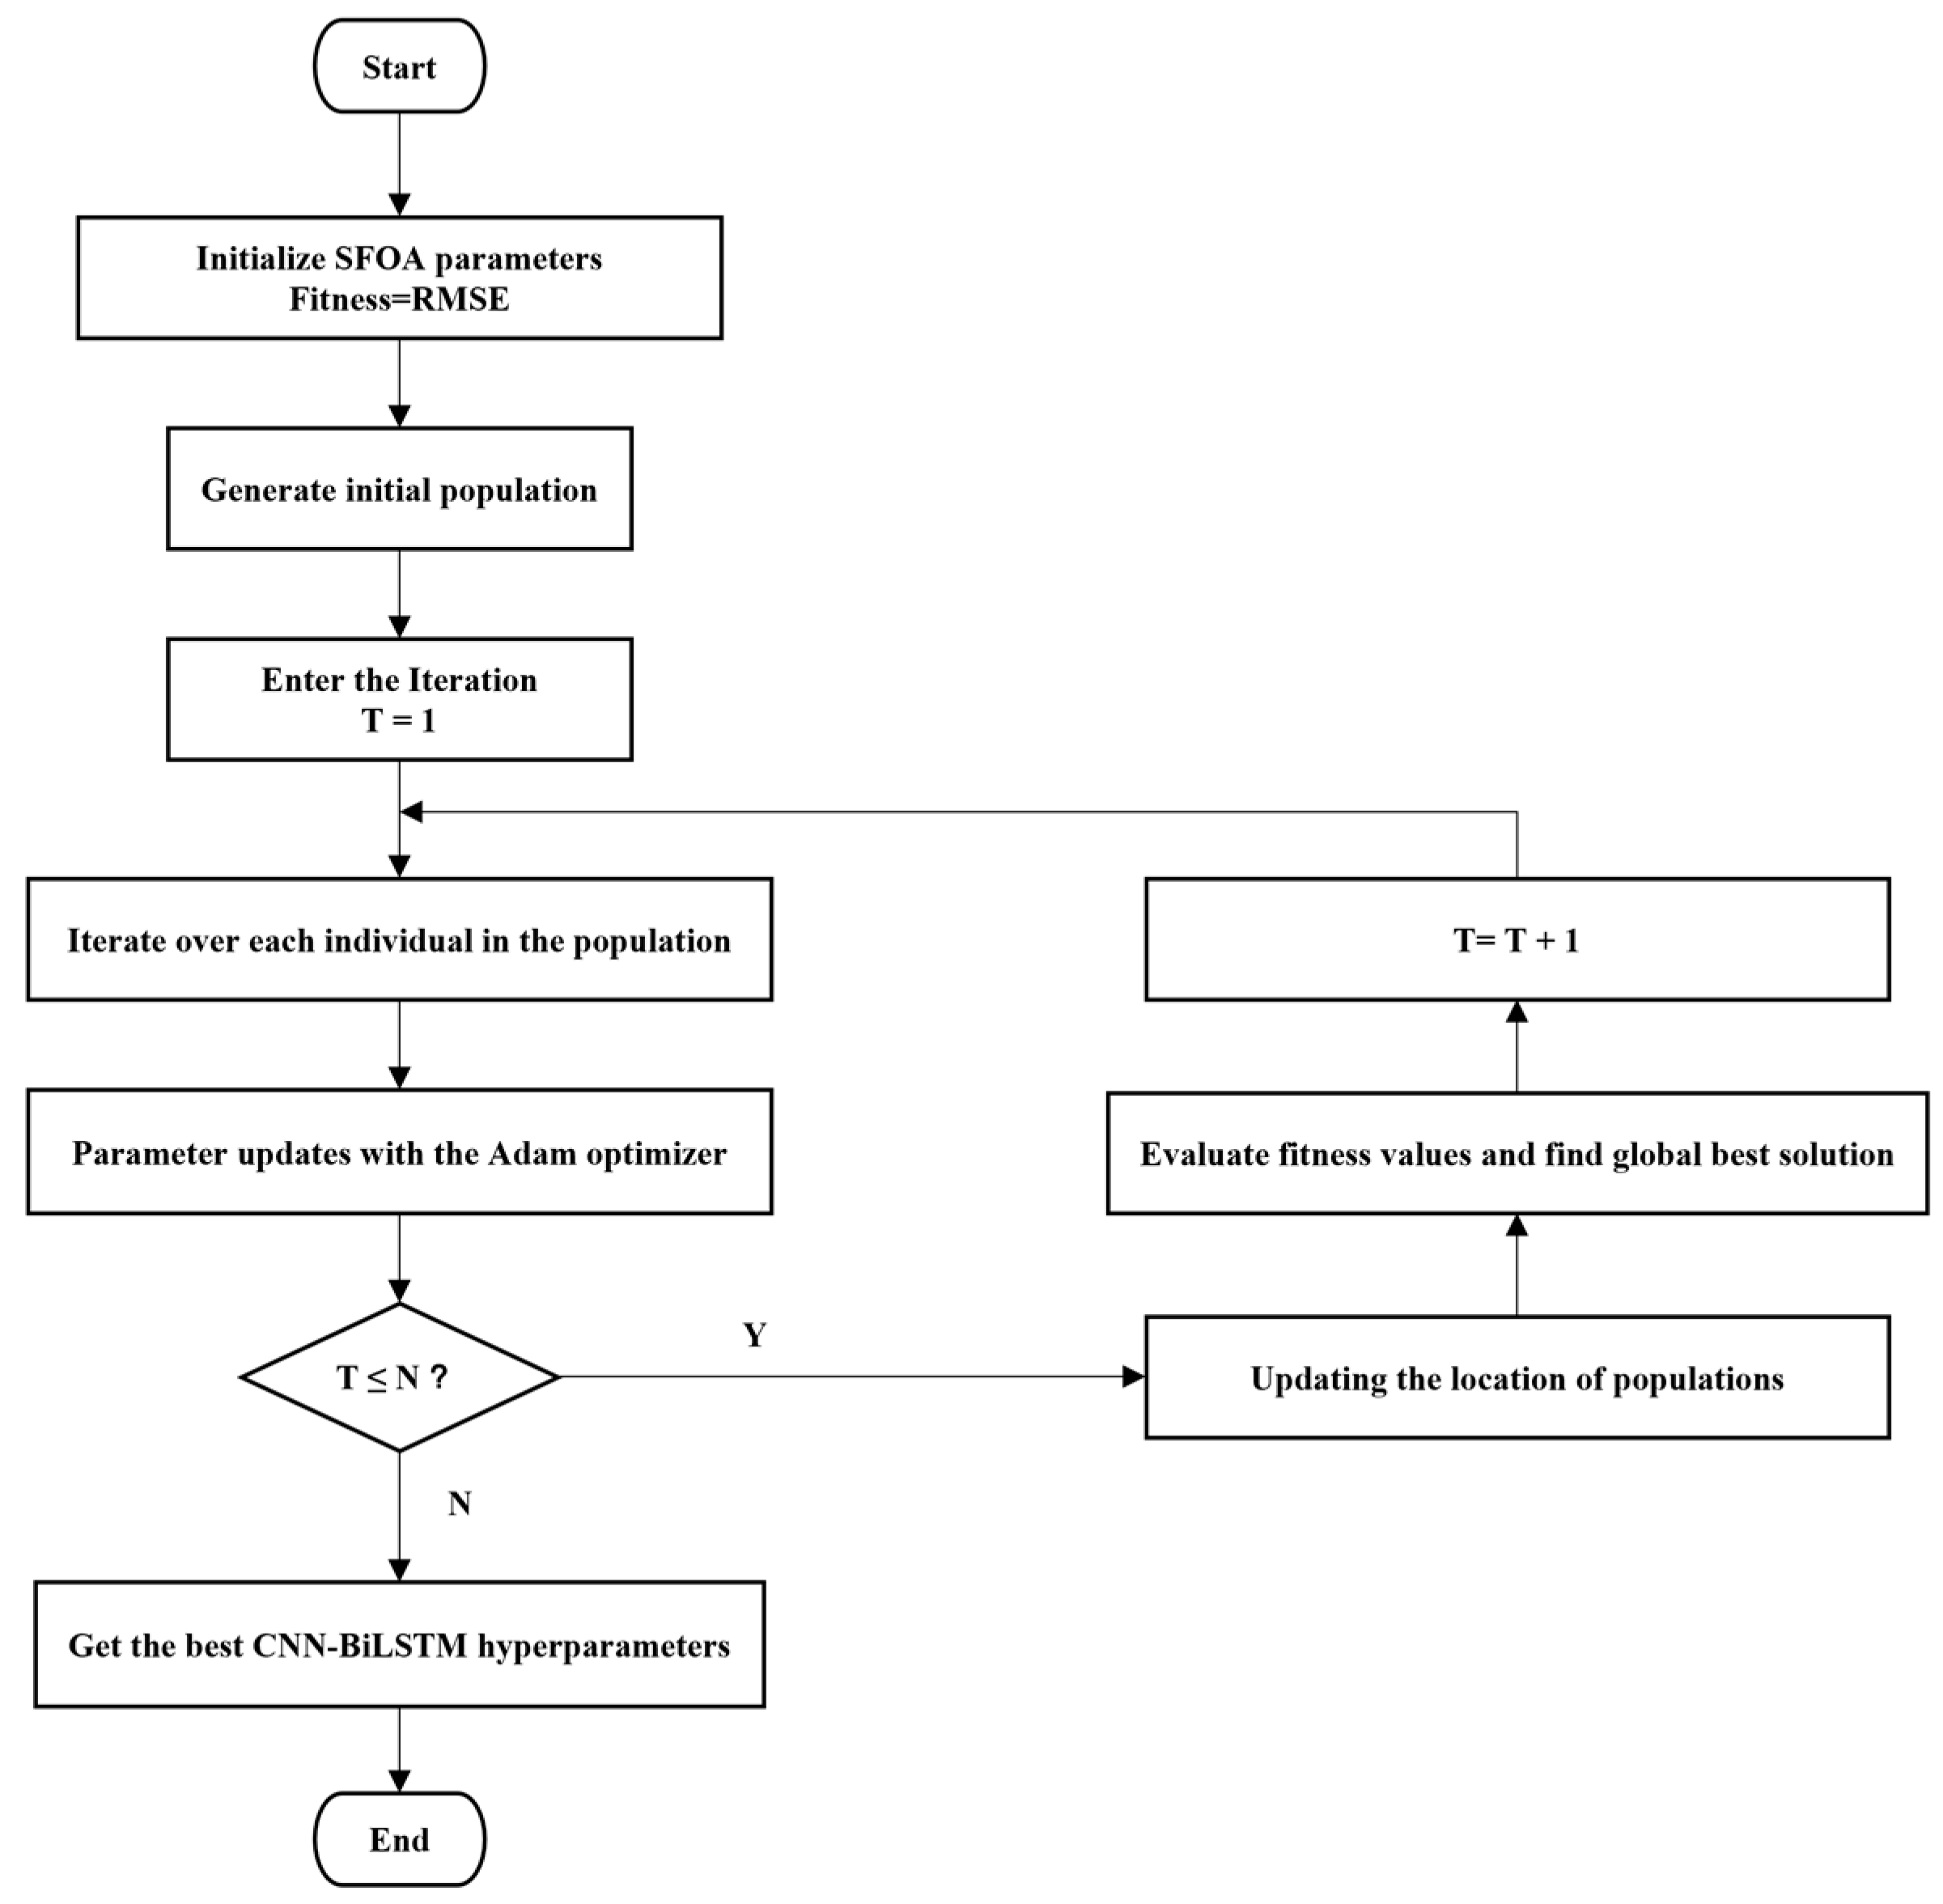
The network performance and convergence speed are determined by the values of its hyperparameters, which can be optimized by SFOA. The main steps in the SFOA optimization of networks are as follows:
Step 1: Determine the optimized hyperparameter range and initialize the SFOA population.
Step 2: Select RMSE as the fitness function.
Step 3: Entering the optimization phase of the SFOA, the process undergoes iterative optimization through two distinct stages.
Step 4: Check the stopping condition. If the maximum number of iterations is reached, the optimization process stops.
Step 5: Obtain the best set of hyperparameters.
Figure 2 shows the steps of optimization of CNN-BiLSTM using SFOA.
2.5. Evaluation Metrics
To assess the model’s performance, six performance metrics are used in this study: RMSE, Mean Squared Error (MSE), Mean Absolute Error (MAE), Mean Absolute Percentage Error (MAPE), Pearson Correlation Coefficient (R), and Coefficient of Determination (R
2). These metrics are commonly used to assess the accuracy and reliability of forecasting models. The detailed equations for each metric are expressed as follows:
where
is the number of samples,
is the real power value,
is the predicted power value, and
is the average power value.
3. PV Power Prediction Based on the Developed Fusion Method
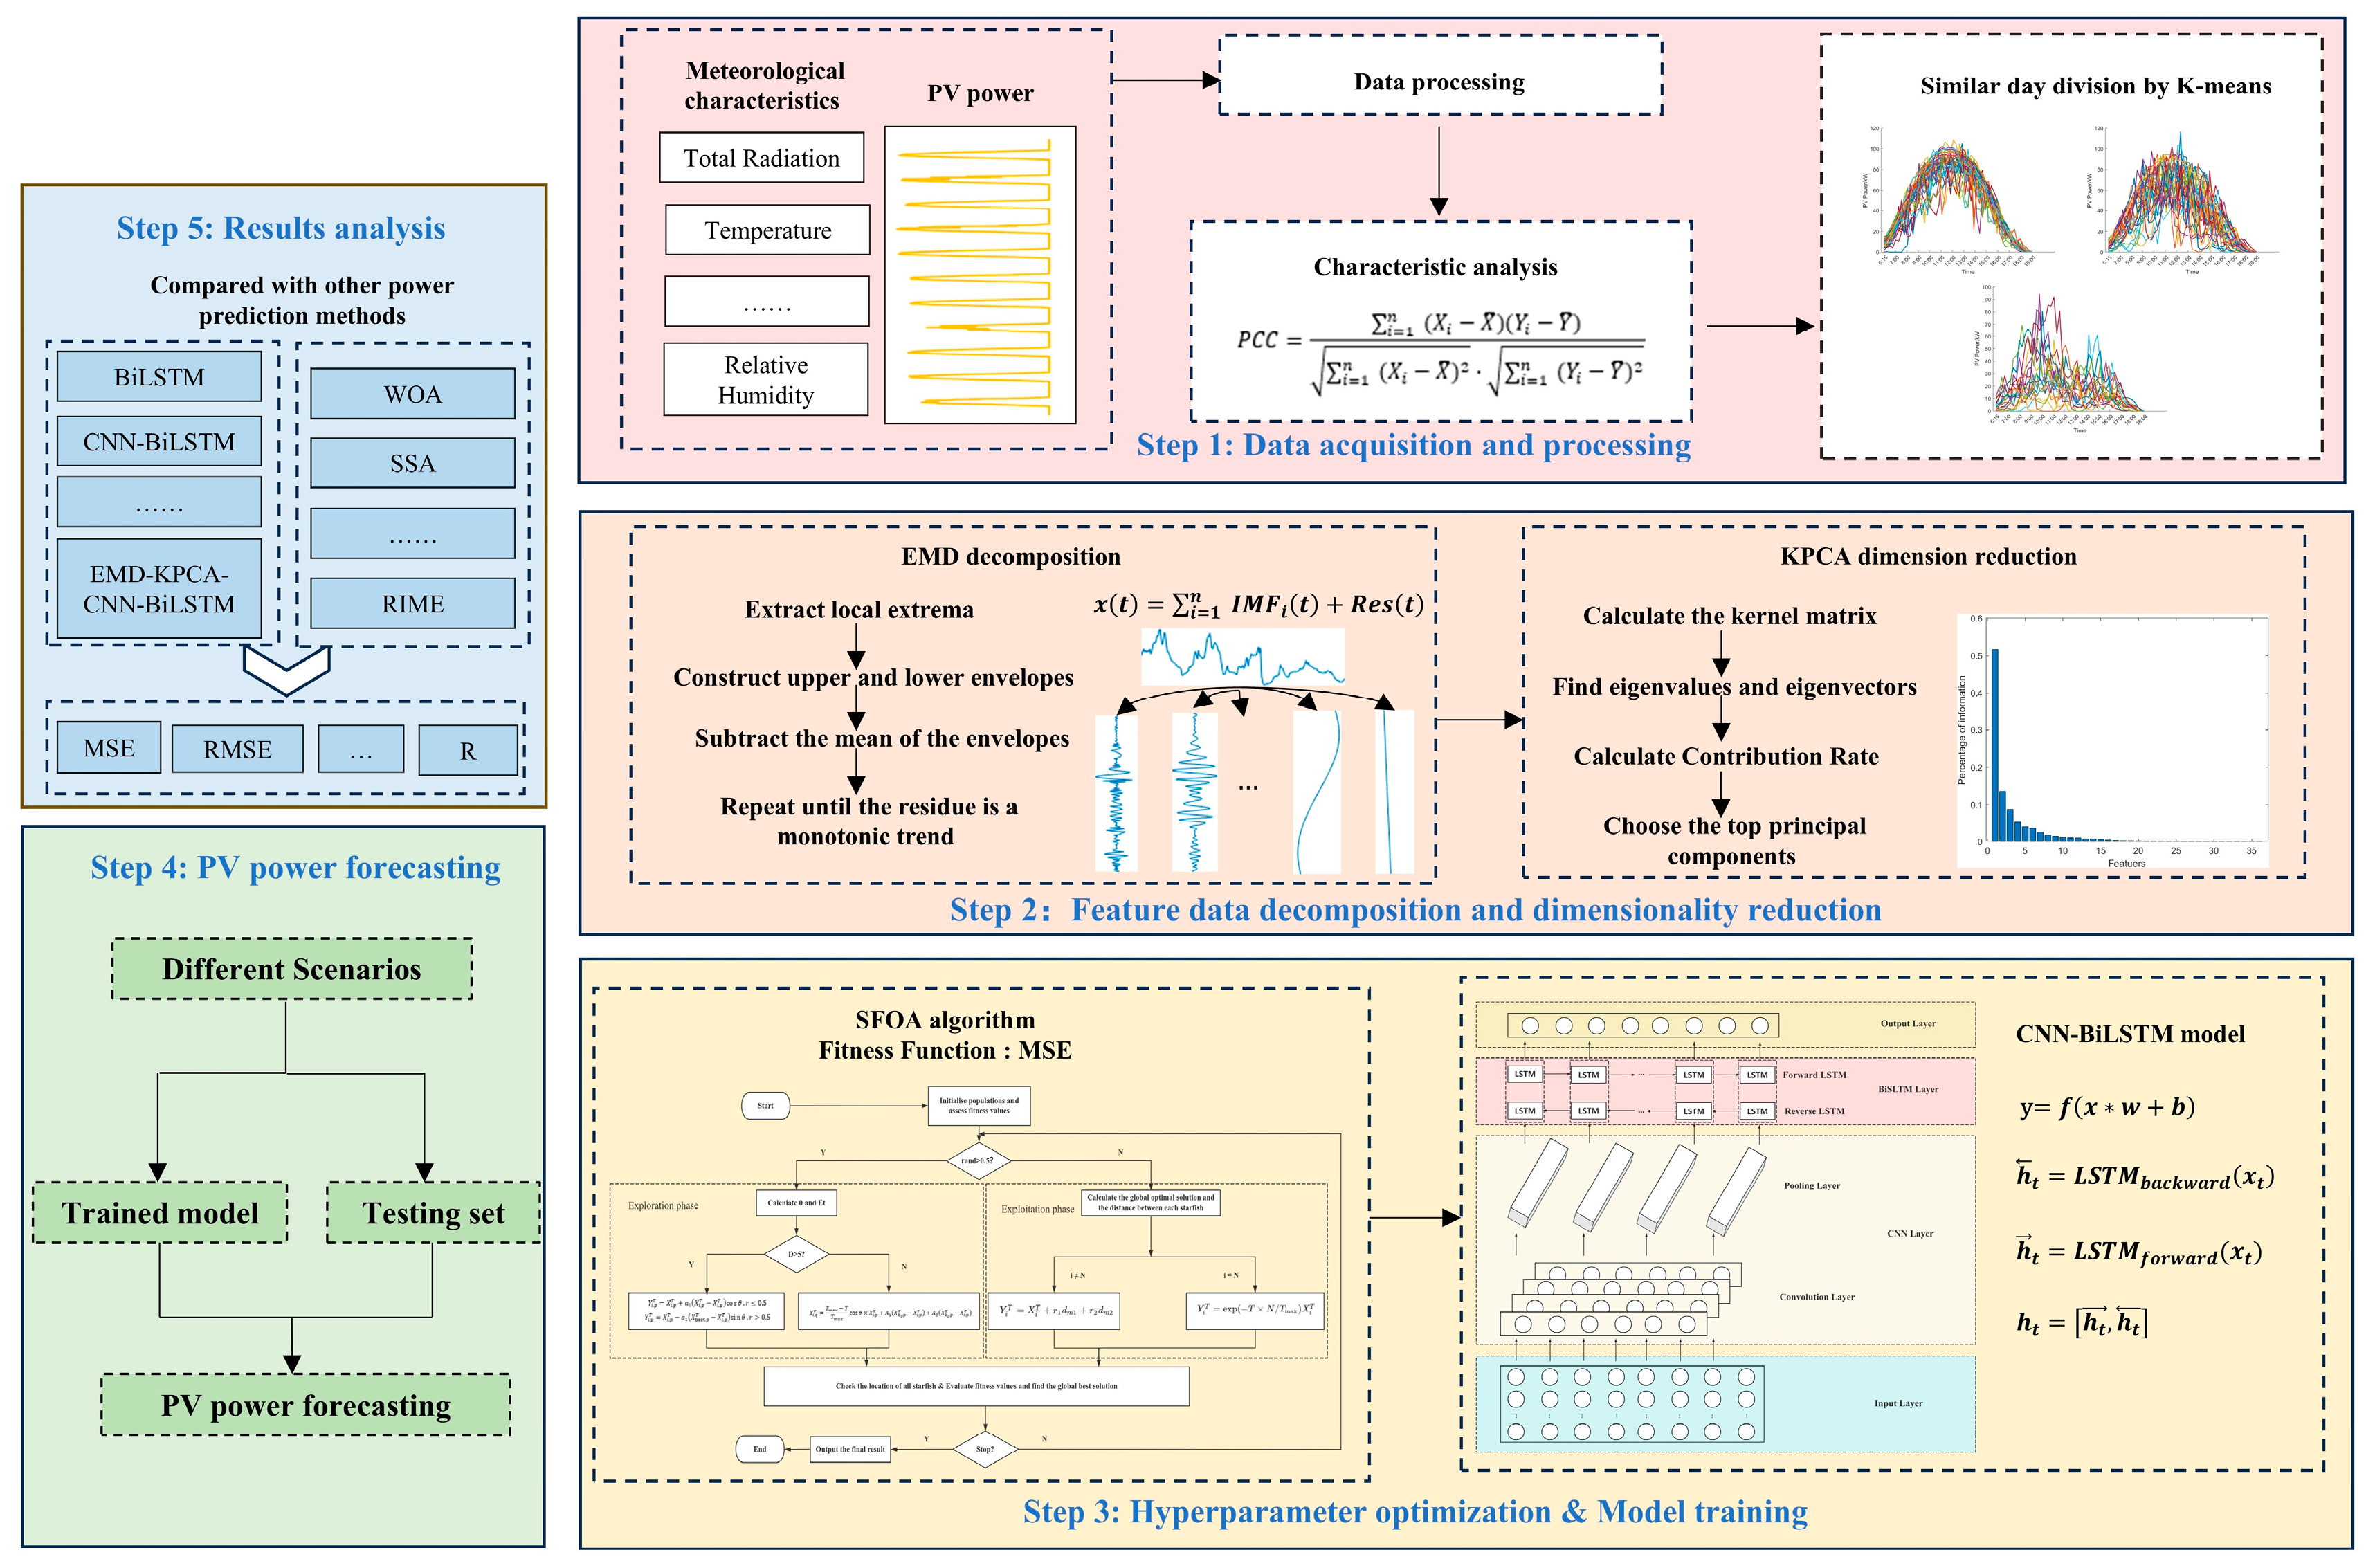
In this paper, a fusion method for PV power prediction based on similar day clustering with EMD-KPCA-SFOA-CNN-BiLSTM is developed. The main steps are illustrated in
Figure 3 and they are described as follows:
Step 1: Data acquisition and processing. The raw power generation dataset is first preprocessed and the most representative feature parameters are screened by correlation coefficient analysis. Then, a similar day clustering method is used to group the data.
Step 2: Feature data decomposition and dimensionality reduction. The feature data is first decomposed by using EMD. Subsequently, KPCA is applied to reduce dimensionality to obtain the principal components affecting the PV output power.
Step 3: Hyperparameter optimization and model training. In training the CNN-BiLSTM model, the SFOA is employed to optimize key hyperparameters to enhance overall model performance.
Step 4: PV power forecasting. During the forecasting stage, the preprocessed data is input into the neural network with optimized hyperparameters to generate short-term PV power predictions.
Step 5: Results analysis. Different evaluation metrics are used to judge the prediction results and to validate the advantages of the developed fusion method in comparison with other prediction methods.
