Abstract
Ammonia bunkering is becoming increasingly important in the maritime industry as ammonia is recognized as a viable alternative fuel for reducing carbon emissions in shipping. Bunkering by tank truck plays a crucial role in the early stages of ammonia-fueled ship development. It involves the efficient transportation of ammonia from production facilities to bunkering stations, offering flexibility in refueling vessels at ports, including those lacking extensive infrastructures like pipelines or large storage tanks. However, the safety and regulations surrounding ammonia use in bunkering are paramount to its adoption. This study focuses on analyzing the effectiveness of safeguards designed to reduce the frequency of ammonia releases and mitigate potential leak damage during bunkering operations. We examine how safeguards, such as breakaway couplings and dry disconnect couplings (DDC), can reduce leak occurrences, while excess flow valves (EFVs) and automatic emergency shut-off valves (ESVs) can limit the consequences of such incidents. If the breakaway coupling and DDC are implemented as safeguards in the flexible hose, and maintenance is performed in accordance with ANSI/CGA G-2.1, the probability of hose failure per bunkering operation will be reduced from approximately 10−5 to 10−7. Under the worst weather conditions during the day, the probit value (Pr) depends on both the amount of ammonia released and the distance from the release point, with the distance having a greater effect on fatality than the amount of ammonia. The individual risk is analyzed to determine whether the bunkering process using tank trucks is acceptable. The analysis concludes that, with these safeguards in place, the individual risk at a location 20 m from the bunker site can be reduced to the lower limit of the As Low As Reasonably Practicable (ALARP) zone, ensuring a safe and acceptable level of risk for ammonia bunkering operations. The safety integrity level (SIL) of the automatic ESV should be at least 2 or higher, and it should be activated within a few seconds after a gas leak begins.
Keywords:
ammonia bunkering; risk analysis; truck to ship; safeguards; individual risk; failure rate 1. Introduction
The Intergovernmental Panel on Climate Change (IPCC) AR6 outlines the urgent need for drastic reductions in greenhouse gas (GHG) emissions to limit the rise in global temperatures and avoid catastrophic climate impacts. The Paris Agreement, adopted in 2015, established an international framework for global efforts to limit warming to well below 2 °C, with a more ambitious target of 1.5 °C above pre-industrial levels. However, achieving these targets requires substantial global efforts to reduce emissions across various sectors, including energy, transportation, agriculture, industry, and maritime transport [1]. The International Maritime Organization (IMO) is working to achieve a minimum 20% reduction in total annual GHG emissions by 2030 and reach net-zero emissions by 2050, compared to the 2008 baseline level [2]. In this context, carbon-free fuels like hydrogen and ammonia have been explored as solutions to reduce GHG emissions. While hydrogen has been commercialized in fuel cell vehicles and some power generation sectors, challenges related to its storage and transportation persist [3]. Ammonia, however, has emerged as a promising alternative due to its easier storage and transportation, as it can be easily liquefied at room temperature by pressurization [4]. Traditionally used as a fertilizer in rural areas, ammonia has been extensively studied for its safe handling technologies. Despite its high toxicity, it is being considered as a potential fuel for ships [5].
Recent technological advancements in ammonia-fueled engines for ships, along with efforts to develop safety standards for ammonia bunkering, are crucial steps toward its use in the maritime industry. Ammonia bunkering using tank trucks represents a flexible approach to fuel distribution, enabling the efficient and cost-effective transport of ammonia to vessels, especially in ports that lack extensive bunkering infrastructure. The use of tank trucks for ammonia supply offers a solution to demonstrate the potential of ammonia as a marine fuel before the establishment of a fully developed ammonia bunkering market, contributing to global decarbonization efforts.
To determine whether ammonia bunkering falls within the acceptable risk range, most studies have employed commercial software to calculate quantitative risks by considering weather conditions and various accident scenarios at a given port. Quantitative risk assessment (QRA) is essential for evaluating these hazards in ammonia bunkering operations. The state-of-the-art in QRA for hazardous material handling, including ammonia, typically involves sophisticated software tools that simulate accident scenarios, dispersion patterns, and consequence impacts. Tools such as PHAST (Process Hazard Analysis Software Tool), ALOHA (Areal Locations of Hazardous Atmospheres), and SAFETI integrate atmospheric dispersion models (e.g., Gaussian plume or puff models), toxicity thresholds from sources like the Emergency Response Planning Guidelines (ERPG) or Immediately Dangerous to Life or Health (IDLH) values, and probabilistic failure data to estimate risks. These software platforms allow for complex simulations, incorporating variables like wind speed, atmospheric stability, release rates, and terrain effects, to predict outcomes such as fatality probabilities and risk contours. Recent advancements have incorporated computational fluid dynamics (CFD) for more accurate modeling of dense gas dispersion in confined or urban environments, as seen in studies on LNG bunkering analogs. Furthermore, integration with fault tree analysis (FTA) and event tree analysis (ETA) enables comprehensive risk quantification, often aligning with frameworks like As Low As Reasonably Practicable (ALARP) to determine acceptable risk levels. Recently, Duong et al. conducted a quantitative risk analysis utilizing commercial software to evaluate the truck-to-ship ammonia bunkering process [6]. Their study systematically identifies hazards arising from ammonia’s chemical properties and operational conditions, proposing targeted risk mitigation strategies to enhance the safety and sustainability of maritime fuel supply chains. Additionally, Duong et al. provided a comprehensive review of ammonia bunkering safety in the maritime sector, integrating commercial software-based simulations with insights from existing literature to assess technical and operational risks [7]. This work emphasizes the critical need for standardized safety protocols and international regulatory frameworks to support safe and efficient ammonia bunkering practices.
While software-driven QRA provides efficient results for practical applications, it often operates as a “black box”, limiting in-depth exploration of underlying variables and sensitivities. In contrast, this study adopts an analytical approach using fundamental models to dissect the risk components more transparently. By employing basic atmospheric diffusion equations (e.g., the Pasquill–Gifford model for puff dispersion) and probit functions for toxicity assessment, we aim to explicitly examine the influence of key variables such as ammonia release quantity, distance from the release point, and environmental factors on human fatality probability. This method allows for a parametric analysis, revealing insights like the logarithmic relationship between release amount and probit value. Such an approach not only complements software-based methods but also facilitates a deeper understanding of risk dynamics, aiding in the optimization of safeguards for ammonia tank trucks.
Therefore, in this study, a Probit equation is derived as a function of the total amount of released ammonia and the distance from the release point, and the individual risk is assessed using a well-known release model and atmospheric dispersion model. Building upon this foundation, this study then analyzes the effectiveness of safeguards, such as breakaway couplings, dry disconnect couplings (DDC), excess flow valves (EFVs), automatic emergency shut-off valves (ESVs), and water curtains, using generic failure rate data. Since the regulatory basis for risk primarily concerns its effect on human safety, the environmental effects of ammonia release are not considered here. This analysis focuses on potential outcomes and individual risks to determine the necessary safeguards for ammonia bunkering via tank truck, ensuring that the associated risks are acceptable for marine applications.
2. Ammonia Tank Truck for Bunkering
Pure liquid ammonia can be transported to ships in three states: high-pressure liquid, semi-refrigerated, or refrigerated. Currently, the most practical and efficient method is transporting ammonia as a high-pressure liquid via tank truck. Therefore, this discussion will focus only on ammonia bunkering operations using tank trucks that store ammonia in a high-pressure liquid state.
2.1. Safeguards for Ammonia Bunkering from Truck to Ship
Ammonia bunkering via tank truck to ship (TTS) is progressing with pilot projects and safety protocols. The IMO may amend the IGF Code to include ammonia, with a focus on safety measures. Future regulations will emphasize standardization to ensure the safe and sustainable use of ammonia in the maritime industry. Although there are currently no specific legal regulations for the safety of tank trucks used in ammonia bunkering, the safeguards in this work are implemented in accordance with the safety established for LNG bunkering and the ANSI/CGA G-2.1 (2014) [8].An ammonia bunkering system shall be designed so that a single human error in operation does not directly lead to a serious accident. In this context, generic failure rate data are used, without considering human errors in the maintenance of safeguards. As shown in Figure 1, the storage tanks for anhydrous ammonia on the tank truck should be equipped with essential safety components to prevent accidents during bunkering operations. These components include relief valves to prevent excessive pressurization of the ammonia storage tank and hydrostatic relief valves to mitigate local pressure increases in the liquid piping.
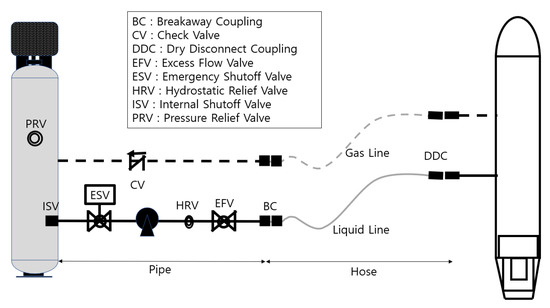
Figure 1.
Safeguards for ammonia bunkering on the truck side.
During the ammonia unloading process from the tank truck to the ship, several safety measures must be incorporated into the liquid line. These include an approved quick-closing remotely controlled internal valve, an automatic emergency shut-off valve (ESV) activated by a gas leak detector, and an excess flow valve (EFV) to control the flow in case of rupture or breakage. Additionally, a breakaway coupling is essential to prevent the hose from being severed due to the tank truck driving off or the vessel moving away due to mooring failure. A dry disconnect coupling (DDC) should also be installed to prevent the accidental opening of the hose during the bunkering process. Furthermore, a check valve should be installed in the line after the manifold on the ship’s side to prevent reverse flow.
The return ammonia vapor line from the ship to the tank truck should be equipped with similar safeguards, including an automatic ESV and an EFV on the ship side, as well as DDC, breakaway coupling, and check valve on the truck side, to ensure the safety of the gas line. The rubber hoses used for both the liquid and gas lines must be inspected annually to maintain their integrity and ensure safety. These hoses should have a maximum allowable working pressure (MAWP) rating of at least 350 psi (2410 kPa) to ensure they can withstand the pressure conditions typically encountered during ammonia bunkering operations.
2.2. Ammonia Bunkering Procedure
A typical ammonia bunkering operation using a tank truck will be carried out in a series of steps to ensure safety:
- Positioning the tank truck: The ammonia tank truck is first positioned at the designated bunkering location. This ensures that the transfer process takes place at the proper site, where emergency equipment for ammonia release, such as alarm systems, eye wash stations, and emergency showers, is readily available.
- Checking the emergency system: The operator must verify the configuration and status of safety facilities and emergency equipment. The automatic ESVs should be tested before starting the bunkering process to minimize the risk of ammonia release.
- Connecting the hoses: As shown in Figure 1, the flexible ammonia liquid and gas hoses are fully connected to the manifold on the ship.
- Pre-transfer inspection: Before initiating the ammonia transfer, it is essential to inspect the entire connection setup to ensure there are no leaks or abnormal conditions in the hoses, pipes, valves, and connections. Any issues identified during the inspection must be addressed before proceeding to prevent the risk of accidents during the transfer.
- Starting the ammonia transfer: Once the pre-transfer inspection confirms everything is secure, the ammonia transfer pump is operated in low-speed mode. This gradual start allows the liquid ammonia to be gently introduced into the ship’s fuel tank, giving the system time to stabilize and ensuring no leaks or abnormalities are detected.
- Ramp-up to normal transfer speed: If no abnormalities are detected during the initial low-speed transfer, the pump speed is gradually increased to the normal transfer rate. Throughout the transfer, continuous monitoring is required to check parameters such as ammonia flow rate, pressure, liquid level, and temperature in both the tank of the truck and the ship’s fuel tank. These parameters must be carefully observed to ensure safe operation.
- Responding to abnormalities: If any abnormal conditions are detected during the transfer, such as unexpected pressure fluctuations, temperature changes, severe vibration, or leaks, the ESV is activated, and the transfer pump is stopped either automatically or via the remote control. These safety mechanisms are critical for halting the transfer before a failure occurs or for stopping the ammonia release quickly to minimize damage.
- Completion of the bunkering operation: Once the ammonia transfer is completed and the ship’s fuel tank is adequately filled, the operator should ensure that all valves are securely closed and that the equipment and piping system show no abnormalities before safely disconnecting the flexible hose from the ship’s manifold. The hoses should be handled with care to prevent spillage or damage.
By following these steps, ammonia bunkering can be carried out safely, minimizing the risk of leaks during the ammonia transport process.
3. Risk Analysis
Risk analysis is a valuable tool in the decision-making process. It evaluates damage and the likelihood of an accident occurring and helps determine whether safeguards should be implemented in the system, considering the risk. It is also an effective method for demonstrating the safety of ammonia bunkering by tank truck during public hearings, which can increase acceptance among nearby residents. The risk at a specific location can be quantified by a single value, which is the product of the probability of an accident occurring and the severity of its consequences.
In general, the acceptable risk criteria are defined as follows [9,10]:
- Lower limit of intolerable risk:
- -
- For the public: 10−4 fatalities/year
- -
- For workers: 10−3 fatalities/year
- Lower limit of tolerable risk: 10−6 fatalities/year
The range of risks from 10−6 fatalities/year to 10−4 or 10−3 fatalities/year is known as the As Low As Reasonably Practicable (ALARP) region. Risks within this range should be reduced to the lowest level feasible without disproportionate effort or cost.
Typically, risk assessments are conducted through accident scenarios. These scenarios describe the combination of events and circumstances that could lead to undesirable or hazardous situations. They are assessed by calculating the frequency of occurrence and their potential consequences, such as the risk of injury, fatality, or property damage [11]. To simplify the risk assessment process, this paper focuses on calculating the leakage probability using generic failure data for each component of the ammonia transfer process. It also considers the effectiveness of safeguards such as EFVs, breakaway couplings, DDCs, and ESVs. The total amount of ammonia released in the event of a leak is also calculated, as this is crucial for assessing the potential consequences of such an incident.
Finally, individual risk is estimated based on the likelihood of an ammonia leak and the potential harm it may cause, assuming the worst-case weather conditions during the daytime. This helps determine whether the risk is acceptable or if additional safety measures are necessary to reduce the risk to a level within the ALARP region. If a specific port for bunkering is designated, the risk assessment can be adjusted based on real weather conditions. Through this simplified analysis, we can ensure that the ammonia bunkering process by tank truck meets the required safety guidelines for public health.
3.1. Frequency Analysis
The fault tree analysis (FTA) for ammonia release during the bunkering process from a tank truck to ships is shown in Figure 2. The components of the tank truck bunkering system include pipes, flanges, pumps, and flexible hoses. The failure frequency of each piece of equipment during bunkering is generally estimated using data derived from statistical analysis of accident occurrence. The failure probability of each component for one-hour bunkering operation is shown in Table 1, with the time unit converted into bunker operation time using UK HSE data [12]. The UK HSE data is based on historical incident reports, industry safety databases, and regulatory agencies, which track and analyze failure rates and accidents across various industries, including transportation, chemical handling, and infrastructure. Since most tank trucks operate on land, HSE failure data is used in this study. However, if tank trucks remain on the coast for extended periods, adjustments may be necessary to account for marine conditions, such as corrosion.
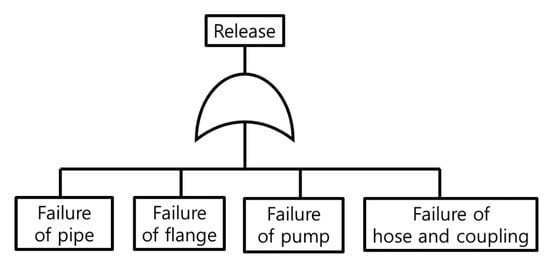
Figure 2.
Fault tree analysis for ammonia bunkering on the truck side.

Table 1.
The probability of component failure [12].
The likelihood of an accident during bunkering, based on the total pipe length or the number of flanges used in unloading line, is shown in Figure 3. The likelihood of failure for a flexible hose, which is on the order of 10−5, is roughly 100 times higher than that for 10 m of pipe and twenty flanges used in a tank truck unloading line, which are on the order of 10−7. This indicates that, based on historical accident data, flexible hoses are more prone to failure during the bunkering process, and it is crucial to reduce the failure rate of flexible hoses to align with the failure rates of other components.
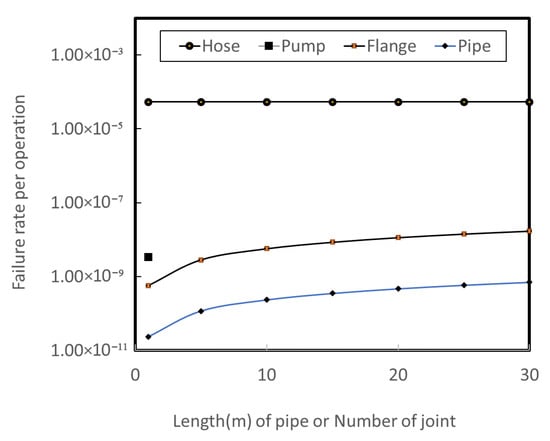
Figure 3.
The likelihood of component failure per bunkering operation.
The subtree for the failure of hoses and couplings includes leak, burst, guillotine, and coupling failure. The causes of hose failure and their countermeasures are listed in Table 2. To reduce hose rupture, the design safety factor of the hose should be increased, and systematic maintenance should be performed. According to ANSI/CGA G-2.1 [8], while storage tanks should have a maximum allowable working pressure (MAWP) of 250 psi (1724 kPa), the hose should be designed for a minimum working pressure of 350 psi (2410 kPa) and a minimum burst pressure of 1750 psi (12,070 kPa). The hose assembly must also withstand a test pressure of 525 psi (3620 kPa) if configured. Hoses that show signs of damage, such as scratches, deterioration, swelling, twisting, damaged couplings, defective markings, or visible leaks, should be replaced immediately. Additionally, hoses must be pressure-tested at least annually. If the manufacturer does not specify a maximum usage period, the hose should be disposed of 10 years after the manufacturing date. ANSI/CGA G-2.1 specifies the test frequency and methods, while the “Inspection before bunkering” in Table 2 refers to the visual inspection conducted prior to each bunkering operation. If hose maintenance is performed according to ANSI/CGA G-2.1 standards, it is believed that the probability of hose leaks or bursts will be on par with that of other components.

Table 2.
The causes of hose failure of the bunkering operation.
The guillotine failure of a hose, caused by the ship moving away due to waves or the tank truck driving off from the bunkering site, can be prevented by using a safeguard such as a breakaway coupling. The coupling separates the hose before it is subjected to guillotine failure. Breakaway couplings can be double-closure types, where both the upstream and downstream ends of the separated hose are sealed using internal check valves. Since the probability of mooring failure per bunkering operation and the check valve failure per demand are on the order of 10−5 and 10−2, respectively, as shown in Table 1, the probability of guillotine failure during bunkering is on the order of 10−7.
A DDC, which automatically seals off when disconnected and opens when fully connected, can also be used as a safeguard to prevent leakage due to coupling errors. The disconnected DDC functions similarly to a check valve at each hose end, except for latent failure, which may persist in a failed state for an extended period before being required to perform its intended function. The DDC is visually inspected before each connection, so the probability of failure on demand is lower than 10−2. As a result, the frequency of leaks due to coupling failure during bunkering is less than 10−7.
If the breakaway coupling and the DDC are implemented as safeguards in flexible hose and maintenance is performed according to ANSI/CGA G-2.1, the probability of failure of the hose per bunkering operation will be lower to the same order as that of pipes or flanges. Consequently, the probability of a leak per bunkering operation will be on the order of 10−7.
The ESV, which is automatically activated by a leak detector, and the EFV and a check valve do not directly affect the frequency of leakage accidents. They serve as safeguards to reduce the consequences of a leak by controlling the total amount of ammonia released in the event of a leakage.
3.2. Consequence Analysis
3.2.1. Method
This study employs a comprehensive approach to assess the risks associated with ammonia bunkering, using toxicity data published by the National Research Council on the mortality rate of individuals exposed to ammonia vapor. The first step in the methodology involves calculating the fatality probability, which is defined as a function of ammonia concentration in the atmosphere and the duration of exposure. This calculation provides a detailed basis for understanding the potential health impacts. From the fatality probability and atmospheric dispersion model, the distance from the release point for a given fatality with the total amount of released ammonia is derived. Using the worst-case weather conditions, the study calculates the maximum distance at which harmful concentrations of ammonia might persist from the instantaneous release of ammonia. Finally, this section examines the relationship between safeguards and consequences.
3.2.2. Probability of Fatality from Ammonia Exposure
In order to analyze the consequences of an ammonia leak, acute exposure guideline levels (AEGLs) and Probit equation are used to calculate the distance from leak point corresponding to AEGL-3 and the probability of death.
AEGLs describe the human health effects resulting from a one-time or rare exposure to airborne chemicals [14]. These are used by emergency responders when dealing with chemical spills or other catastrophic exposures. For a given exposure duration, a chemical may have up to three AEGL values, each corresponding to a specific tier of health effects:
- AEGL-3 is the airborne concentration of a substance above which it is predicted that the general population could experience life-threatening health effects or death.
- AEGL-2 is the airborne concentration of a substance above which it is predicted that the general population could experience irreversible or other serious, long-lasting adverse health effects, or an impaired ability to escape.
- AEGL-1 is the airborne concentration of a substance above which it is predicted that the general population could experience notable discomfort effects.
All three tiers (AEGL-1, AEGL-2, and AEGL-3) are developed for five exposure periods: 10 min, 30 min, 60 min, 4 h, and 8 h. Table 3 shows how the ammonia AEGL values vary with exposure duration [15].

Table 3.
AEGLs for ammonia from National Research Council.
The Probit equation is a mathematical equation that quantifies the relationship between the concentration of a dangerous material and its effects on people. It can also be used to determine the proportion of people who will experience a specific level of harm from exposure to a hazardous phenomenon. The Probit equation for death due to ammonia exposure is shown in Equation (1) [16]:
Pr = −9.82 + 0.71 ln(C2 × T)
The toxic load (TL) for ammonia is the value inside the natural logarithm of Equation (1), which is the square of ammonia concentration multiplied by the exposure time. Using Equation (1), the probability of death can be calculated using the following equation [16].
Anyone other than essential workers for ammonia bunkering should be prohibited from entering a dangerous area that may be exposed to fatal concentrations corresponding to AEGL-3 if the release rate is greater than 10−4. The TL, Pr, and death probability for AEGL-3 are calculated and shown in Table 4. As indicated in Table 4, AEGL-3 corresponds to a death probability of 0.0246, and the TL is approximately 7.28 × 10⁷ ppm2·min.

Table 4.
Toxic load and probability of death based on AEGL-3 for ammonia.
3.2.3. Hazard Distances for a Given Fatal Probability
In the event of an accident, ammonia leaks until the safeguard, either the EFV or the ESV, is activated. Generally, the EFV or ESV has a very short activation time, and the leak stops once the safeguard operates. If the activation time of the safeguard is short, the atmospheric dispersion can be approximated by treating the release as an instantaneous event using Gaussian model, as ammonia is a light gas. The Gaussian model is chosen because it effectively represents the distribution of ammonia concentrations under the assumption of uniform wind flow. The concentration (at y = z = 0) on the ground where the puff passes, as a function of distance in the downwind direction, is described by Equation (3) [17].
where
x (m) is the distance downwind from the leak point;
σₓ, σᵧ, and σz are the Pasquill–Gifford dispersion coefficients for an instantaneous release;
Q* (kg) is the total amount of released ammonia;
u (m/s) is the wind speed;
t (s) is the time.
The instantaneous maximum concentration on the ground where the puff passes occurs (when x0 = ut), and the concentration is given by the following:
The toxic load for the ammonia puff at a location in the downwind direction (x0) from the release point can be obtained using the following equation:
By setting an arbitrary variable , and differentiating this variable:
Eliminating the variable t in Equation (5) with k, we get the following:
Performing the integration, the expression simplifies as follows:
Since the toxic load corresponding to AEGL-3 for ammonia is 0.00211 (kg/m3)2·s, which corresponds to 7.28 × 10⁻⁷ ppm2·min at 25 °C, Equation (8) is given by the following:
Using the dispersion coefficients given in Table 5 and Equation (9), the distance from the release point corresponding to AEGL-3, for each atmospheric stability class, can be calculated using the following equation:
where

Table 5.
Equations for the Pasquill–Gifford Dispersion Coefficients for Puff Dispersion.
a and b are constants, as provided in Table 5.
Q* (kg) is the total amount of released ammonia.
u (m/s) is the wind speed.
The distance corresponding to AEGL-3 increases with atmospheric stability, decreases with the wind speed to the power of approximately 1/4, and increases with the total released amount to the power of about 1/2. The distance increases significantly with the atmospheric stability class from A to F, as illustrated in Figure 4. The atmospheric stability class ranges from A to D during the daytime, depending on wind speed and insolation, and from D to F at nighttime, as shown in Table 6 [17]. The frequency of accidents may increase in extreme environments, such as high waves, and the consequences of ammonia release could be severe under atmospheric classes E or F. Therefore, bunkering should be prohibited at night and during extreme environmental conditions until the risks in these conditions are fully understood.
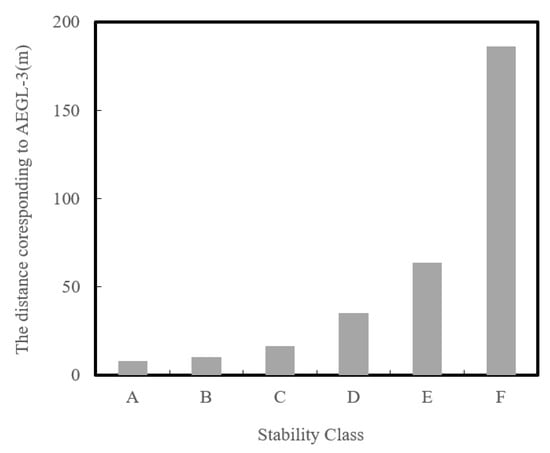
Figure 4.
The distance corresponding to AEGL-3 with atmospheric stability class for .

Table 6.
Atmospheric stability classes for use with the Pasquill–Gifford dispersion model.
During the daytime, the atmospheric stability class:
- A cannot form if the wind speed is more than 3 m/s;
- B cannot form if the wind speed exceeds 4 m/s;
- C cannot form if the wind speed is less than 2 m/s;
- D cannot form if the wind speed is less than 4 m/s.
Figure 5 shows the distance corresponding to AEGL-3 during the daytime, assuming the total released ammonia is 1 kg, in order to comparatively examine the fatal distance based on atmospheric stability. The worst-case weather conditions during the daytime are represented by atmospheric stability class D and wind speed of 4 m/s, as shown in Figure 5. Under the condition, by using Equation (10) and Table 5, the distance corresponding to AEGL-3 is given by:
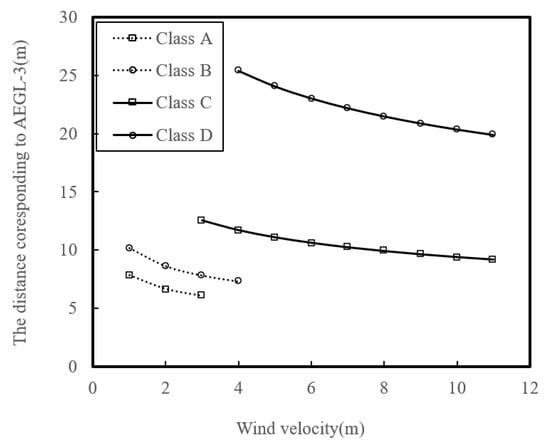
Figure 5.
The distance corresponding to AEGL-3 with wind velocity in daytime.
Since the Probit value corresponding to a death probability of 0.99 is 7.33, the distance of a death probability of 0.99 from the leak point can be calculated using Equations (1) and (8):
By dividing Equation (11) by Equation (12), the distance corresponding to AEGL-3 from an ammonia instantaneous release is approximately four times greater than that corresponding to a death probability of 0.99.
When the atmospheric stability changes from class D to class C or B, the distance is expected to decrease to less than half of its original value, as shown in Figure 5.
3.2.4. Consequences and Safeguards
To calculate the total amount of ammonia released, the mass release rate must first be estimated. Release may occur as gas-phase release from the gas line or as liquid or two-phase release from the liquid line. Since the release rate is highest in the liquid phase, the mass release rate of ammonia can be conservatively estimated using the following equation [18].
where
A (m2) is the cross-sectional area;
CD is the discharge coefficient;
ρ (kg/m3) is the density;
psat (Pa) is the vapor pressure;
patm (Pa) is the atmospheric pressure.
When ammonia is released through a hole corresponding to the diameter of a hose, the damage distance can be quite large. Therefore, such release should be prevented with appropriate safety measures. An alternative accident scenario is a leak from a hole that is 20% of the diameter of hose [19]. Most liquid hose used in tank trucks has an inner diameter of 50 mm. The release rates of ammonia from holes that are 10% and 20% of the hose’s diameter are shown in Figure 6 [18]. The release rate increases with temperature due to the vapor pressure increasing with temperature, reaching up to about 3.3 kg/s.
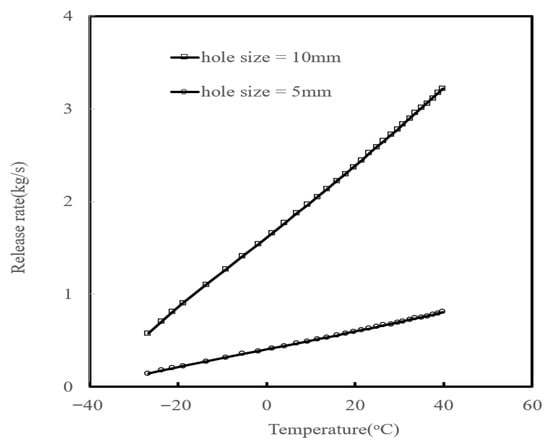
Figure 6.
Release rate of liquid ammonia from a hole with storage temperature.
As shown in Figure 7, the distance corresponding to AEGL-3 increases with the release time of ammonia, from the point it starts to the moment it is stopped by safeguards. The distance can reach several hundred meters, even if the release is stopped in just a tens of seconds. Therefore, in the event of an ammonia release accident, it is crucial to quickly activate safeguards to stop the release and reduce the damage. To minimize the release time from a hole in the hose, EFVs and ESVs on the tank truck side and a check valve on the ship side should be activated in a few seconds.
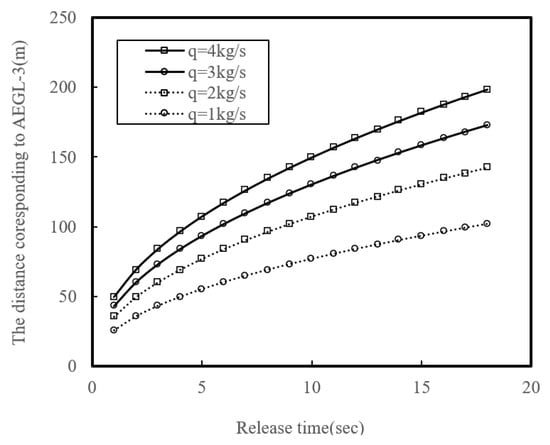
Figure 7.
The distance corresponding to AEGL-3 with release time in the worst case of weather conditions in daytime.
EFVs are designed to close when the flow rate exceeds the normal operating range due to downstream release or valve opening errors that create unintended discharge paths. However, EFVs may not always provide the expected safety function. For example, if the flow rate does not exceed the operating capacity of the EFV, it may fail to close properly. This can happen when the pump flow rate is too steeply dependent on the pressure difference. If a release occurs downstream of the pump, the pump may act as a regulator and limit the flow rate below the EFV’s closing threshold [20]. To prevent this, the pipe and the hose, including valves and fittings in the bunkering line, must have a capacity greater than the rated flow rate of the EFV. Generally, the EFV fails to close in cases of small-flow leaks (e.g., valve seal failure) or partial valve openings, as the flow rate is lower than the EFV’s rated capacity.
As shown in Figure 1, if a DDC and breakaway coupling are used as safeguards to prevent large-scale gas releases due to the guillotine effect of a flexible hose or disconnection coupler in a bunkering process, the EFV may not activate due to a release rate too small to trigger it. Therefore, careful sizing of the EFV is critical to ensure proper activation in the event of a downstream release.
ESVs must be designed to close as quickly as possible to reduce damage, taking into account surge pressure. Automatic ESVs are based on sensing elements, logic solvers, and output signals to close the valves. Most of these automatic valves are designed as fail-safe mechanisms. The valves used for emergency shut-off must be able to maintain the shut-off state without leakage within a very short period of time in an emergency situation. The ESV’s operation time is influenced by the sensing time, the logic calculation time, and the actuator’s operation time. Generally, the logic calculation time is typically under 1 s, and the actuator’s operation time is around 1 s. However, the sensing time can range from several seconds to tens of seconds, depending on the detection method. Leak detectors, primarily gas sensors, are used to detect released gas. However, these sensors may take tens of seconds to detect ammonia gas. Therefore, it is desirable to also monitor the parameters that change immediately during an ammonia release, such as pressure changes, sonic intensity changes, or surrounding temperature variations due to liquid ammonia flashing. This can be performed using sensors like ultrasonic sensors, pressure sensors, or infrared sensors. If multi-sensors are used to close the ESV, the logic calculation time should be considered to ensure the valve closes quickly.
3.3. Individual Risk
The individual risk is the probability that an average unprotected person, permanently present at a certain location, is killed in a period of one year due to an accident resulting from ammonia bunkering [21]. The individual risk can be calculated as the product of the failure rate and the probability of death from the failure. Calculating individual risk for people near the bunkering site is a common task to demonstrate whether the risk is acceptable.
Figure 6 shows the layers of protection to reduce damage after the release. The starting failure rate per bunkering is 1 × 10⁻⁷, as it will be on the order of 10−7, as discussed in Section 3.1. The first layer of protection is the EFV. Since the possibility of EFV failure on demand in the bunkering line may be higher than in a normal chemical process, as discussed qualitatively in Section 3.2, the probability of EFV failure on demand is assumed to be 1 × 10⁻¹, despite the value of 1.3 × 10⁻² as shown in Table 1.
The second layer is the automatic ESV, which should operate quickly and reliably. The probability of failure on demand (PFD) for the ESV is assumed to be 1.0 × 10⁻², as shown in Table 1. To increase the reliability of the ESV, it is desirable to conduct an operational test before starting bunkering. If the PFD falls within the range of 0.01 to 0.001, it corresponds to SIL 2. Therefore, to ensure that the PFD remains below 0.01, the Safety Integrity Level (SIL) for the automatic shut-off valve system must be at least SIL 2, in accordance with IEC 61511 self-certification requirements. In order to be SIL 2 or higher of ESV, the reliability of the actuator can have a significant impact, so it is necessary to use a highly reliable actuator or shorten the inspection cycle. In addition, it is necessary to pay attention to the configuration of the sensor in consideration of the operating time.
The third layer may be a water curtain, which prevents the dispersion of ammonia vapor into densely populated areas and absorbs ammonia vapor to lower the concentration in the atmosphere [22]. The last layer of protection is emergency evacuation, which alerts people in areas where ammonia vapor is dispersed, so they can evacuate to a safe area or stay in a shelter until the ammonia vapor cloud passes [23].
Since the risk from ammonia bunkering by TTS without a water curtain and emergency plan is considered broadly acceptable, as discussed later, the probability of failure on demand for the water curtain and emergency plan is assumed to be 1.0 × 10⁻¹ and 0.5, respectively, without detailed analysis [24,25]. The probability of each accident scenario during bunkering is shown in Figure 8.
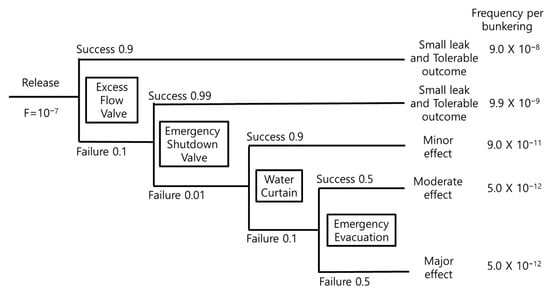
Figure 8.
Layer of protection analysis for ammonia release.
If the ESV is successfully activated, the consequence analysis of the event can be interpreted as an instantaneous release. However, if the ESV activation fails, the release should be interpreted as continuous. The instantaneous release case has been described earlier. In the case of a continuous release, the situation becomes more complex, as the diffusion model equation changes. Nonetheless, this interpretation is crucial for emergency response and is further developed in Korean Patent 10-2747492 [25]. The risk after the ESV layer will be on the order of 10−11 per bunkering, which is broadly acceptable, and no further measures are considered necessary. Therefore, we analyze the probability of death for a person near the bunkering site based on the total amount of ammonia released from the leak until the ESV is activated. From Equations (1), (4), and (8), the Probit equation, for a short time period, is given by:
where the value of 3.45 × 10¹⁰ is a conversion factor from (kg/m3)2·s to ppm2·min.
For the worst-case scenario during the daytime, with atmospheric stability class D and wind speed of 4 m/s, the Probit equation becomes:
The probit value (Pr) is proportional to the natural logarithm of the total amount of released ammonia and decreases with the natural logarithm of the distance from the release point raised to the power of 2.08. It can be observed that the distance has a greater impact on fatality than the amount of released ammonia. Therefore, mitigation measures for ammonia bunkering should prioritize the separation distance between residents and the bunkering site, followed by controlling the amount of ammonia released.
Figure 9 shows the probability of death according to the total amount of ammonia released and the distance from the leak point. As shown in Figure 9, if the total amount of ammonia released is about 2, 4, 6, 8, and 10 kg, the probability of death at a location 20 m away from the leak point in the downwind direction is 0.39, 0.76, 0.90, 0.95, and 0.98, respectively. The death probability for a person 20 m from the bunkering site in the downwind direction is on the order of 10−9 per bunkering, as shown in Figure 8. It is expected that the death probability calculated under the worst weather conditions will represent a higher value under actual weather conditions. If the total ammonia leakage exceeds 10 kg, the probability of death at that point may increase beyond the order of 10−9 per bunkering, so it is crucial that the ESV operates within a few seconds.
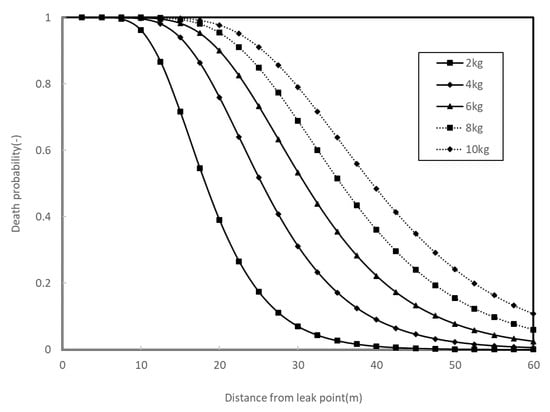
Figure 9.
Probability with distance of downwind direction from leak point.
Assuming that bunkering is performed four times a day, with 1 h allocated for bunkering preparation and 1 h for the operation, over approximately 250 days a year, the individual risk is on the order of 10−6 fatalities per year, which is near the lower limit of the ALARP region. Therefore, it is important to maintain the reliability of safeguards such as the ESV, breakaway coupling, and DDC, which can play an important role in increasing the acceptance of nearby residents for ammonia bunkering from tank trucks to ships at a port. Recently, a demonstration of ammonia bunkering from an ammonia ISO tank to a ship’s fuel tank was successfully carried out in Busan, utilizing the safeguards discussed so far. In the near future, a similar ammonia bunkering demonstration using a tank truck will take place in Ulsan.
4. Conclusions
Ammonia bunkering via tank trucks plays a pivotal role in enabling the marine industry’s transition to low-carbon fuels, offering a cost-effective and flexible solution for transporting ammonia to bunkering ports without the need for extensive infrastructure. However, ensuring the safe operation of tank trucks, particularly addressing vulnerabilities such as flexible hoses in bunkering lines, requires robust safeguards and well-established regulatory frameworks to mitigate associated risks.
This study proposes a risk-based model to estimate the probability of human fatality using an atmospheric dispersion model and ammonia toxicity data. The probit value (Pr) is found to correlate logarithmically with the ammonia release quantity and decreases with the distance from the release point raised to the power of 2.08, underscoring the importance of distance in reducing fatality risk. As a result, mitigation strategies should prioritize the separation of bunkering sites from populated areas and the effective management of ammonia releases.
The implementation of safeguards such as automatic Emergency Shut-off Valves (ESVs), Excess Flow Valves (EFVs), breakaway couplings, and Dry Disconnect Couplings (DDC), coupled with rigorous maintenance practices, can reduce individual risk to a level near the lower boundary of the As Low As Reasonably Practicable (ALARP) region. Specifically, automatic ESVs should achieve a Safety Integrity Level (SIL) of at least 2, activating within seconds of detecting a leak. These findings provide a solid foundation for the development of risk-based regulatory frameworks that ensure the safe and sustainable use of ammonia tank trucks in bunkering operations. We believe this study may assist in the creation of a regulatory framework that could facilitate the safe bunkering of ammonia via tank trucks as a sustainable marine fuel.
Author Contributions
Conceptualization, Y.-D.J.; formal analysis, H.-y.L.; investigation, J.-J.K.; resources, C.M.J.; writing—original draft preparation, Y.-D.J.; writing—review and editing, C.M.J., J.-J.K., H.-y.L. and K.W.C.; supervision, K.W.C. All authors have read and agreed to the published version of the manuscript.
Funding
This research was supported by the Ministry of SMEs and Startups (MSS), Korea Institute for Advancement of Technology (KIAT), through the Innovation Development (R&D) for Global Regulation-Free Special Zone (RS-2024-00488525, 2024).
Data Availability Statement
The original contributions of this study are included in the article. For further inquiries, please contact the author (Y.-D.J.).
Conflicts of Interest
Author Young-Do Jo, Chung Min Jun, Jin-Jun Kim are employed by the MS gas Co. The remaining authors declare that the research was conducted in the absence of any commercial or financial relationships that could be construed as a potential conflict of interest.
Nomenclature
| A: | cross-sectional area (m) |
| a, b: | constants (−) |
| C: | Concentration (kg/m3) |
| CD: | discharge coefficient (−) |
| P: | probability of death (−) |
| Pr: | Probit equation (−) |
| psat: | vapor pressure (Pa) |
| patm: | atmospheric pressure (Pa) |
| Q*: | total amount of released ammonia (kg) |
| T: | Time (s) |
| TL: | Toxic Load (ppm2·min) |
| t: | time (s) |
| u: | wind speed (m/s) |
| X0.99: | distance of a death probability of 0.99 from the leak point (m) |
| XAEGL-3: | distance corresponding to AEGL-3 from the leak point (m) |
| x: | distance downwind from the leak point (m) |
| ρ: | density (kg/m3) |
| σₓ, σᵧ, and σz: | Pasquill–Gifford dispersion coefficients for an instantaneous release (m) |
References
- Rose, S.K.; Richels, R.; Blanford, G.; Rutherford, T. The Paris Agreement and next steps in limiting global warming. Clim. Change 2017, 142, 255–270. [Google Scholar] [CrossRef]
- IMO. International Maritime Organization (IMO) Adopts Revised Strategy to Reduce Greenhouse Gas Emissions from International Shipping; International Maritime Organization: London, UK, 2023. [Google Scholar]
- Sadeq, A.M.; Homod, R.Z.; Hussein, A.K.; Togun, H.; Mahmoodi, A.; Isleem, H.F.; Patil, A.R.; Moghaddam, A.H. Hydrogen energy systems: Technologies, trends, and future prospects. Sci. Total Environ. 2024, 939, 173622. [Google Scholar] [CrossRef] [PubMed]
- Yang, M.; Lam, J.S.L. Risk assessment of ammonia bunkering operations: Perspectives on different release scales. J. Hazard. Mater. 2024, 468, 133757. [Google Scholar] [CrossRef] [PubMed]
- Kojima, Y. Safety of ammonia as a hydrogen energy carrier. Int. J. Hydrogen Energy 2024, 50, 732–739. [Google Scholar] [CrossRef]
- Duong, P.A.; Kim, H.J.; Ryu, B.R.; Kang, H. A Quantitative Risk Analysis during Truck-to-Ship Ammonia Bunkering. Sustainability 2024, 16, 2204. [Google Scholar] [CrossRef]
- Duong, P.A.; Ryu, B.R.; Song, M.K.; Nguyen, H.V.; Nam, D.; Kang, H. Safety Assessment of the Ammonia Bunkering Process in the Maritime Sector: A Review. Energies 2023, 16, 4019. [Google Scholar] [CrossRef]
- ANSI/CGA. Requirements for the Storage and Handling of Anhydrous Ammonia; ANSI/CGA: Washington, DC, USA, 2014. [Google Scholar]
- HSE. Reducing Risks, Protecting People: HSE’s Decision Making Process; HSE Books: Dublin, Ireland, 2001; pp. 44–49. [Google Scholar]
- HSE. Guidance on ALARP Decisions in COMAH; HSE Books: Dublin, Ireland, 2002. [Google Scholar]
- Jo, Y.-D.; Ahn, B.J. A method of quantitative risk assessment for transmission pipeline carrying natural gas. J. Hazard. Mater. 2005, 123, 1–12. [Google Scholar] [CrossRef] [PubMed]
- HSE. Failure Rate and Event Data for Use Within Land Use Planning Risk Assessments Updated 28-6-2012; HSE Books: Dublin, Ireland, 2012; pp. 39–85. [Google Scholar]
- McElhaney, K.L.; Staunton, R.H. Reliability Estimation for Check Valves and Other Components. In Proceedings of the ASME Pressure Vessels & Piping Conference, Montreal, QC, Canada, 21–26 July 1996. [Google Scholar]
- National Research Council. Acute Exposure Guideline Levels for Selected Airborne Chemicals; National Research Council: Ottawa, ON, Canada, 2007; Volume 6, p. 62. [Google Scholar]
- HSE. 2010 SPC/Tech/OSD/30, Rev 2013—Methods of Approximation and Determination of Human Vulnerability for Offshore Major Accident Hazard Assessment; HSE Books: Dublin, Ireland, 2010; p. 4. [Google Scholar]
- Crowl, D.A.; Louvar, J.F. Chemical Process Safety: Fundamentals with Applications, 3rd ed.; Prentice Hall International Series; Prentice Hall: Upper Saddle River, NJ, USA, 2011. [Google Scholar]
- Jo, Y.-D.; Shin, A.; Lee, S.; Jun, C.M.; Lee, S.-S.; Kim, J.-J. A study on ammonia release rate in bunkering system. J. Korean Inst. Gas 2024, 28, 79–86. [Google Scholar]
- KOSHA GUIDE P-107-2020. In Technical Guidelines for Selecting Worst and Alternative Incident Scenarios; KOSHA: Ulsan, Republic of Korea, 2020.
- Office of Emergency Management. EPA 550-F-0-7001, Emergency Isolation for Hazardous Material Fluid Transfer Systems—Applications and Limitations of Excess Flow Valves; Office of Emergency Management: Washington, DC, USA, 2007. [Google Scholar]
- Jo, Y.-D.; Crowl, D.A. Individual risk analysis of high-pressure natural gas pipelines. J. Loss Prev. Process Ind. 2008, 21, 589–595. [Google Scholar] [CrossRef]
- Hua, M.; Qi, M.; Yue, T.; PIa, X.; Pan, X.; Jiang, J. Experimental research on water curtain scavenging ammonia dispersion in confined space. Procedia Eng. 2018, 211, 256–261. [Google Scholar] [CrossRef]
- Jo, Y.-D.; Park, K.-D. Emergency response plane of toxic gas releases with considering ventilation ratio and meteorological conditions. J. Saf. Secur. Eng. 2016, 6, 229–237. [Google Scholar] [CrossRef]
- Misuri, A.; Ricci, F.; Sorichetti, R.; Cozzani, V. The Effect of Safety Barrier Degradation on the Severity of Primary Natech Scenarios. Reliab. Eng. Syst. Saf. 2023, 235, 109272. [Google Scholar] [CrossRef]
- Ricci, F.; Yang, M.; Reniers, G.; Cozzani, V. Emergency response in cascading scenarios triggered by natural events. Reliab. Eng. Syst. Saf. 2024, 243, 109820. [Google Scholar] [CrossRef]
- Jo, Y.-D.; Jun, C.M.; Kim, J.-J. Ammonia Leakage Accident Automatic Initial Response System. KR 10-2747492, 23 December 2024. [Google Scholar]
Disclaimer/Publisher’s Note: The statements, opinions and data contained in all publications are solely those of the individual author(s) and contributor(s) and not of MDPI and/or the editor(s). MDPI and/or the editor(s) disclaim responsibility for any injury to people or property resulting from any ideas, methods, instructions or products referred to in the content. |
© 2025 by the authors. Licensee MDPI, Basel, Switzerland. This article is an open access article distributed under the terms and conditions of the Creative Commons Attribution (CC BY) license (https://creativecommons.org/licenses/by/4.0/).