Article

Optimal PV Sizing and Demand Response in Greek Energy Communities Under the New Virtual Net-Billing Scheme

by
Ioanna-Mirto Chatzigeorgiou
1,*,
Dimitrios Kitsikopoulos
2,
Dimitrios A. Papadaskalopoulos
3,
Alexandros-Georgios Chronis
4,
Argyro Xenaki
1 and
Georgios T. Andreou
1,*
1
Department of Electrical and Computer Engineering, Aristotle University of Thessaloniki, 54124 Thessaloniki, Greece
2
Department of Spatial Planning and Development, Aristotle University of Thessaloniki, 54124 Thessaloniki, Greece
3
Department of Electrical and Computer Engineering, University of Patras, 26504 Patras, Greece
4
Department of Electrical and Computer Engineering, National Technical University of Athens, 15780 Athens, Greece
*
Authors to whom correspondence should be addressed.
Energies 2025, 18(19), 5082; https://doi.org/10.3390/en18195082
Submission received: 6 August 2025 / Revised: 10 September 2025 / Accepted: 22 September 2025 / Published: 24 September 2025
(This article belongs to the Section A2: Solar Energy and Photovoltaic Systems)

Abstract

Energy Communities have emerged as a key mechanism for promoting citizen participation in the energy transition. In Greece, recent legislation replaced the virtual net-metering scheme with a virtual net-billing framework, introducing new economic and regulatory conditions for shared renewable energy investments. This study develops an optimization tool for determining the optimal PV system size and Demand Response actions for individual EC members under this new framework. The model is constructed to align closely with the current regulatory and legal context, incorporating technical, economic, and policy-related constraints. It uses real electricity production and consumption data from existing Greek ECs, as well as 2024 Day Ahead Market prices, grid fees, and surcharges. The results emphasize the importance of customized sizing strategies and suggest that policy refinements may be needed to ensure equitable participation and maximize community-level benefits.

1. Introduction

Collective citizen-led schemes in localized energy generation, distribution, and governance have been identified, during recent years, as important pillars of a more democratic and ecological sound energy system [1]. They are, also, recognized at the EU level as fundamental enablers of the clean energy transition. The EU law has defined Renewable Energy Communities (RECs) in the Renewable Energy Directive (RED II, Directive (EU) 2018/2001 [2] and Citizen Energy Communities (CECs) in the Internal Electricity Market Directive (IEMD, Directive (EU) 2019/944) [3]. These two definitions establish the legal foundations for community-based energy production, management and consumption across the EU and serving as a foundation for national policies and laws. While RECs focus specifically on Renewable Energy Sources (RESs) and emphasize local benefits, environmental sustainability, and social cohesion, CECs have broader scope and flexibility, encompassing various forms of energy and market-oriented citizen activities without strict geographic constraints.
Greece first enacted a legislation for collective citizen energy initiatives with Law 4513/2018 [4]—adopted before the EU’s updated directive. This law created a new form of civil cooperative, the Energy Community (EC), characterized by open and voluntary membership, democratic governance and specific requirements for geographic proximity. In the years between 2018 and 2023, more than 1484 ECs were created [5]. The main activity adopted by citizen-led ECs in Greece is collective self-consumption through a virtual net-metering scheme that allows aggregation of generation and consumption across multiple metering points [6]. Under this arrangement, each member’s electricity use is offset against their share of community production, with settlement occurring on a triennial basis.
This virtual net-metering scheme has proven particularly advantageous in the context of Greece’s volatile energy market, providing protection against price fluctuations, enhancing energy resilience, and offering stable and fast investment returns. The main RESs used in these schemes are the centralized Photovoltaic (PV) grid-connected systems, shared among members, typically in unequal ownership shares. Centralized PV systems have generally been found more viable for sustainable energy planning than distributed systems, particularly when considering overall system capacity, economies of scale, and cost-effectiveness in both installation and maintenance [7].
However, as highlighted in recent studies [8], several structural barriers continue to limit their scalability and effectiveness of citizen-led energy initiatives in Greece—hereafter referred to as Energy Communities (ECs), including all relevant legal forms. The most prominent among these are the complex bureaucratic procedures, inconsistent or frequently changing legislative frameworks, and limitations in financing mechanisms, particularly for non-commercial or self-consumption-oriented ECs. Many communities still face challenges in securing permissions, accessing land, and maintaining compliance with administrative and metering requirements. Furthermore, Greek ECs have increasingly faced issues of corporate capture, where commercial actors exploit regulatory frameworks by establishing pseudo-community entities, thereby appropriating financial benefits originally intended for genuine citizen-led initiatives [9]. This undermines core principles such as democratic control and local benefit-sharing. Such trends threaten the legitimacy and long-term sustainability of ECs across Europe, including Greece, where regulatory loopholes and insufficient oversight have facilitated this shift.
Subsequent legislative updates brought Greece in closer alignment with EU policy. Law 5037/2023 [10] formally transposed the EU’s laws introducing the two distinct categories: RECs and CECs. In September 2024, the virtual net-billing scheme replaced the virtual net-metering scheme. Virtual net-billing, as established by Law 5074/2024 [11], differs from virtual net-metering by accounting separately for energy consumed from the grid and surplus energy exported. Unlike net-metering, where consumption and production are netted over a long settlement period (e.g., annually or triennially), virtual net-billing settlements occur at 15 min intervals.
Across Europe, national regulatory frameworks for energy communities vary considerably. Several countries, including Austria, Germany, and Portugal, have introduced legal frameworks that explicitly enable energy sharing, collective self-consumption, and, in some cases, access to shared storage. Others, such as Croatia, Malta, and Ireland, have transposed the EU directives into their national electricity laws, defining and operationalizing RECs and CECs. Northern European countries, including Denmark and the Netherlands, place particular emphasis on integrating energy communities into broader market participation schemes, often linking them with demand response and flexibility services. This diversity illustrates the wide range of regulatory pathways across the EU and provides a useful backdrop for situating the Greek case, which, while progressive in introducing virtual net-billing, remains more limited in scope compared to many of its European counterparts [12].
In this constantly evolving regulatory landscape, developing tools that can support ECs’ creation and growth is increasingly important. Among these, optimizing PV system sizing is essential for maximizing energy production and reducing costs. Optimal PV sizing refers to the process of determining the most economically beneficial PV system capacity for a given application, balancing initial investment, energy generation, self-consumption, and revenue from surplus energy. Various optimization techniques—including traditional methods and modern approaches—have been widely employed to optimize the sizing and placement of PVs, with various objectives such as minimizing costs and emissions and maximizing the utilization of RESs [13].
Demand Response (DR) has also been identified as a promising strategy to increase self-consumption and reduce peaks [14] in collaborative energy schemes. DR “includes all intentional electricity consumption pattern modifications by end-use customers that are intended to alter the timing, level of instantaneous demand, or total electricity consumption” [15]. Optimization techniques have also been extensively used in residential DR to achieve bill and discomfort minimization and maximize energy generated by local sources [16]. Finally, research has also been conducted on combined PV and Battery Energy Storage System (BESS) sizing and the potential benefits of communal BESSs [17].
However, optimizing PV system sizing faces several practical challenges, as outlined by Khatib et al. [18]. These include the scarcity of high-resolution weather and load data, the need for highly accurate component models that reflect site-specific conditions and inefficiencies and the difficulty of accounting for the variability in commercial PV component specifications. The authors also mentioned that the optimization of PV system sizing must balance simplicity with accuracy to remain practical.
Various optimization methods have been applied to PV sizing for ECs. These methods can be broadly classified into mathematical methods and nature-inspired meta-heuristic algorithms. The latter include mostly Particle Swarm Optimization (PSO) [19], Genetic Algorithms (GAs) [20], and hybrid metaheuristics [21] approaches. The mathematical methods include Linear Programming (LP) and Mixed Integer Linear Programming (MILP). Iqbal et al. [22] provide a comprehensive review of optimization techniques applied in renewable energy systems, including system sizing, and highlight how different methods—such as linear programming for cost minimization and metaheuristics for complex multi-objective problems—are selected based on the specific characteristics and constraints of the sizing task.
LP and MILP have been used extensively in the literature [18,23,24], due to their ability to deliver globally optimal solutions with guaranteed convergence under linear constraints, as well as the compatibility with grid pricing structures and regulatory requirements. Compared to metaheuristic methods, LP and MILP often require less computational time and avoid issues like premature convergence or the need for extensive parameter tuning.
In the study by Fina et al. [25], a MILP model was developed to maximize the Net Present Value (NPV) of PV investments in energy communities in Austria. The model considered various spatial deployment patterns (urban, traditional, rural, mixed) and enabled sizing both at the level of individual buildings and the entire community, using 15 min resolution data for consumption, and PV systems installed on both rooftops and façades. The results highlighted the strong economic potential of community-based PV investments, particularly through load diversity and the aggregation of available surfaces.
Volpato et al. [26] also developed a MILP model tailored to Italian RECs and CECs, aiming to minimize the total community energy cost under realistic constraints. Their model incorporated DR scenarios, an innovative cost allocation mechanism, and an analysis of complementarity between prosumers in terms of demand and generation profiles. Although the model assumes fixed PV capacity per user, it provides valuable insights into the regulatory and economic parameters that affect EC performance under the new European framework.
Cosic et al. [27] proposed a MILP optimization model to minimize energy costs and CO2 emissions in Austrian ECs. The study used real-world data for a nine-user microgrid and incorporated dynamic energy pricing. The model allowed for shared PV generation and battery storage, simulating the provisions of the Austrian Renewable Expansion Act (EAG). Results showed up to 15% cost reduction and 34% emission reduction, confirming the benefits of community participation.
Novoa et al. [28] focused on ECs in the U.S. and developed a MILP model aimed at achieving Zero Net Energy or islanding operation targets, while avoiding transformer overloading. The model used representative day clustering, variable TOU tariffs, and net metering. Results demonstrated that appropriate PV and battery sizing can yield significant technical and economic benefits.
Hascuri et al. [29] examined the sizing of standalone PV systems in Morocco, applying two MILP formulations: one with equalities and a simplified one with only inequalities. The objective was to minimize the initial capital investment. Their 6 h resolution analysis showed that the reduced model achieved comparable results with much lower computational complexity, making it suitable for large-scale planning.
Farrokhifar et al. [30] applied a stochastic MILP approach in U.S.-based EC, combining PV, wind turbines, batteries, and electric vehicles with Vehicle to Grid (V2G) capability. The model aimed to minimize the community’s total life-cycle cost while maximizing renewable and storage utilization. It also included flexible and shiftable loads and DR. The results demonstrated the potential of integrated management to enhance system flexibility and sustainability.
Budin and Delimar [31] proposed a two-stage stochastic MILP model for EC design, based on real-world data from Croatia and Germany. A novel feature of their method is the use of unsupervised clustering (k-means, GMM) to represent stochastic load profiles. The model supports shared storage and P2P trading, aligning with RED II and RED III frameworks. Emphasis is placed on fairness and risk management in resource allocation.
Kassab et al. [32] developed a MILP model for the combined sizing and energy management of a DC microgrid, applied to a university facility in France. The system included PV and batteries and examined both islanded and grid-connected scenarios. The objective was to minimize the total life-cycle cost (investment, operation, replacement, management). While theoretical, the model is scalable to EC schemes.
Table 1 provides a comprehensive overview of recent studies employing MILP-based optimization approaches for PV sizing in Energy Communities (ECs), highlighting key modeling choices, assets considered, regulatory contexts, and temporal resolutions.
Furthermore, Fotopoulou et al. [33] developed a day-ahead optimization algorithm for energy communities that integrates PV production, battery storage, and flexible loads under the new virtual net-billing law, enabling peer-to-peer cost-sharing and demonstrating up to 25% cost reduction through cooperative operation compared to individual prosumer setups.
Compared to the existing literature, the present study offers the first systematic application of MILP for the optimal sizing of PV systems in ECs in Greece, under the new regulatory framework of the virtual net-billing Law 5074/2024. It offers a realistic and representative sizing scenario, tailored to Greek RECs and CECs. To our knowledge, no previous study has applied PV sizing methodologies within the scope of this legislation.
The proposed approach integrates real 15 min interval data for consumption, production, and wholesale prices, capturing the dynamics of the Greek electricity market. While recent studies often adopt multi-objective optimization (e.g., minimizing costs, emissions, and discomfort, or maximizing self-consumption [27,34,35]), this study deliberately adopts a single-objective model that minimizes net investment cost. This design choice reflects an emphasis on simplicity, interpretability, and relevance to current financial constraints and planning needs.
The focus is on citizen participation in centralized collective PV projects—the dominant model in Greece—while excluding energy sharing, as it is not yet regulated under Greek law. Overall, this work contributes a practical decision-support tool tailored to the current legal framework, bridging the gap between technical optimization and legal feasibility. By combining detailed metering data with regulatory and market parameters, the study offers actionable insights for the cost-effective deployment of community energy projects in Greece.

2. Methods

2.1. The Virtual Net-Billing Scheme

Under the Greek virtual net-billing scheme (Law 5074/2024), energy metering and financial settlement are performed in 15 min intervals, in line with EU market standards. In each interval, the injected energy refers to the total electricity generated by the community PV system and fed into the grid. This energy is represented in the DAM market by an aggregator and proportionally allocated to each member based on ownership shares. Simultaneously, the absorbed energy is the electricity drawn from the grid by a member during the same interval. This absorbed quantity is subject to regulated charges (e.g., DSO, TSO, taxes) imposed by the energy supplier.
The netting mechanism identifies the netted energy as the minimum of injected and absorbed energy per interval. This is the energy simultaneously produced and consumed. For this quantity, the aggregator credits the supplier, and the supplier passes on only the balancing cost. The balancing parameter λ m N (€/kWh) reflects the cost imposed by the supplier for balancing the netted energy injected into the grid. It is defined as the sum of the Unit Imbalance Price and the three Unit Adjustment Charges (ΛΠ1, ΛΠ2, and ΛΠ3):
λ m N =   I m b a l a n c e   +   Λ Π 1   +   Λ Π 2   +   Λ Π 3  
If the injected energy exceeds the consumed energy, the surplus is labeled as surplus energy, which remains on the grid and is compensated at the DAM price. Conversely, if the absorbed energy exceeds the simultaneous production, the difference is owed energy and is charged at the retail tariff of the supplier. In Figure 1, we can see an example of the energy flows during a day of a typical household under the virtual net-billing framework.

2.2. Model

2.2.1. The Objective Function

In this study, a MILP model is developed to assess the optimal sizing of PV systems and the potential contribution of DR for individual members of RECs or CECs under Greece’s new virtual net-billing framework. The objective is to minimize the net annualized cost of participation, accounting for the investment, operational expenses, and revenues from surplus energy sold to the grid.
The optimization seeks to minimize the net cost over one representative year, annualized over a 20-year investment horizon. The objective function includes:
  • Capital expenditure (CAPEX) for the PV installation including the purchase and installation cost, annualized using a fixed annuity factor based on the assumed discount rate.
  • Operational expenditure (OPEX) such as annual maintenance costs per installed kW.
  • Electricity purchase cost for grid-imported energy at a fixed retail price.
  • Netted cost charge, reflecting regulatory surcharges applied to self-consumed energy.
  • Revenue from surplus energy, compensated at the DAM price minus the export charge, which reflects the cost of the aggregator’s service for the representation of the PV park to the DAM market.
Mathematically, the objective function is expressed by Equation (2).
min NetCost = min Cost Revenue = min C IMP + C N + C OPEX + f · C CAPEX R EXP = m i n ( d D t T ( E d , t IMP · λ R + d D t T E d , t N · ( m M λ m   N + λ A ) + c o p ·   P s h +   r   ·   ( 1 + r ) N ( 1 + r ) N 1   ·   c c p ·   P s h )               d D t T E d , t EXP · ( λ d , t W M λ A )  

2.2.2. Constraints

The model is defined over 15 min intervals for the full year (35,040 time-steps) of 2024, capturing a detailed variation in consumption, production, and prices. At the same time, it enforces the following constraints:
  • Equation (3) The maximum PV share that a household can own.
  • Equation (4) Energy balance at each timestep: consumption (including DR-adjusted demand) must be covered by PV generation, grid import, or export (in the case of surplus).
  • Equation (8) Daily DR neutrality, ensuring that load shifts are balanced within a 24 h window.
  • Equations (6) and (7). Physical limits on DR flexibility, bounded by a percentage of instantaneous demand.
Finally, under the net-billing scheme a prosumer cannot simultaneously import electricity from the grid and export surplus PV production during the same 15 min interval. To reflect this physical and regulatory limitation, the model includes a binary variable (9) that governs the operating mode at each time step. More specifically:
  • For X d , t = 1 the system is in import mode, allowing energy to be imported from the grid (exported energy is 0);
  • For X d , t = 0 , the system is in export mode, allowing energy to be exported from the grid (imported energy is 0).
This logic is enforced using big-M constraints as defined in Equations (10) and (11). In this context, M is a large constant (e.g., 106) that effectively activates or deactivates each energy flow depending on the binary state. This mechanism ensures that only one direction of energy flow with the grid is active at each timestep, making the model more realistic and compliant with current Greek net-billing implementation rules.
P s h     P m a x
D d , t + E d , t D R = E d , t G + E d , t I M P E d , t E X P         t T   ,     d D
E d , t N = D d , t + E d , t D R E d , t I M P         t T   ,     d D
E d , t D R     α · D d , t         t T   ,     d D
E d , t D R α · D d , t         t T   ,     d D
t T D E d , t D R = 0           d D
X d , t { 0,1 }         t T   ,     d D
M   a sufficiently large number
E d , t I M P M · X d , t         t T   ,     d D
E d , t E X P M   · ( 1 X d , t )         t T   ,     d D
BESSs were not included in the present modeling because the Greek virtual net-billing law does not currently allow shared storage within energy communities. While individual household batteries are technically feasible, they remain rare and economically challenging in Greece due to the absence of supporting incentives. Our focus in this study is restricted to scenarios that comply with the existing regulation and market conditions.

2.2.3. Solver and Implementation

The model is implemented in Pyomo and solved using the Gurobi solver. As discussed in the next sub-sections, a sensitivity analysis is performed on key economic and technical parameters, and a scenario analysis contrasts the cost outcomes for a no PV scenario, PV-only and PV/DR scenario.

2.3. Data

Kazmi et al. in [36] highlighted the importance of open-source datasets and tools for ECs and listed 9 widely available datasets with high-resolution data that could support research on optimal design and operation. They also highlighted the fact that despite the availability of datasets, most countries of the world and many climate zones are still not represented. Since their publication, several more datasets have been released, such as two more datasets including Australian ECs [37,38]. At the same time, new datasets filled important geographical gaps, e.g., three datasets with data from Norwegian ECs [39,40], as well as datasets from Ireland, Greece and Portugal [41,42,43]. Datasets such as NorPEN, iFlex, and Plegma provide high-resolution consumption and generation data, with some including appliance-level monitoring and dynamic pricing experiments. Several also include behavioral or survey data, enabling socio-technical analyses. To summarize the current landscape, Table 2 includes both the earlier datasets and more recent contributions, offering a wider overview of international datasets with household energy community data.
For this study, the focus was placed on collecting data from Greek ECs, following the recommendation of [44], which emphasizes the importance of using data that reflect the local socio-technical context. In particular, the analysis centered on the Commonen EC based in Ioannina [45], which operates two 100 kW PV parks located in Mpafra and Koutselio. In Mpafra, the PV panels are installed on a rooftop, while in Koutselio they are ground mounted. Both systems are currently operating under virtual net-metering contracts. The houses are not situated in proximity to the PV parks but rather distributed within the same broader geographical region. Representative data were collected and simulated for a single household at each site to assess the benefits and optimal sizing of PV systems under the newly introduced virtual net-billing scheme.
The Mpafra and Koutselio households were chosen because they provided high-resolution, synchronized 15 min data on both consumption and PV generation from households that are active members of Greek Energy Communities, collected specifically for this research. These cases are intended as illustrative validation examples, rather than as a representative sample of Greek households, and allowed us to test the framework under real-world conditions. In parallel, we collected and reviewed a range of international and national open datasets (summarized in Table 2). However, none of these datasets fully matched the requirements of the present validation (synchronized 15 min consumption and PV production data from Greek community members) under the new virtual net-billing framework. These datasets will nonetheless provide a valuable resource for future extensions of this work, where broader validation across a range of socio-technical conditions across urban, rural, and mixed households is planned.
Table 2. List of widely available datasets that can be used to model and optimize energy communities.
DatasetCountryYearNumber of HouseholdsDurationSampling RateDataRef.
EMBEDUSA2017314–27 days12 kHz (house), 1 Hz (appliances)Appliances[46]
REDDUSA201163–19 days0.5–1 Hz (NILM data)Household, Appliances[47]
BLUEDUSA201118 days12 kHzAppliances[48]
PLAIDUSA2013 & 2014562 weeks30 kHzAppliances[49]
ADRESAustria2009 & 2010302 weeks1 HzHousehold[50]
REFITUK2015202 years0.125 HzAppliances[51]
UK-DALEUK20155Up to 4 years16 kHz, 0.17 HzHousehold, Appliances[52]
DREDThe Netherlands201516 months1 Hz, 1 minHousehold, Appliances[53]
HESUK2010–20112501 year10 s (household), 2 minHousehold, Appliances, Interviews[54]
DataportUSA20141400 (75 free)4 years (full), 6 months (free)1 Hz, 1 min, 15 minHousehold, Appliances[55]
Smart*USA2014–20163–114–4004 years1 HzHousehold, Occupancy Weather, PV[56]
AMPdsCanada2012–201412 years1 minHousehold, Appliances, Weather, water and gas[57]
ECOSwitzerland201468 months1 HzHousehold, Appliances, Occupancy[58]
PRECONPakistan2018421 year1 minHousehold, Appliances[59]
ENERTALKSouth Korea20162229–122 days15 HzHousehold, Appliances[60]
SustDataED2Portugal202211144 days2–10 HzHousehold, Appliances, Weather, PV, Wind, biomass, hydro[61]
IHEPCDSFrance2006–2010147 months1 minHousehold, Appliances[62]
IDEALUK202025523 months1 HzHousehold[63]
NorPENNorway202262 months10 sHousehold, Weather, Irradiance, estimated PV, Interviews[39]
IEDLIndia202011 year1 minHousehold, Appliances[64]
ECD-UYUruguay2022110,95321 days15 min (households), 1 min (appliances)Household, Appliances[65]
GREENDAustria/Italy201381 year1 HzHousehold, Appliances[66]
Australian Distribution Network PV DatasetAustralia2010–20133003 years30 minHousehold, PV[37]
iFlex Dynamic Pricing DatasetNorway2019–202144832 winters1 hHousehold, Weather, PV, Interviews[67]
SHEERMPortugal20211326–450 days15 minHousehold, Weather, PV, Price[43]
Ireland Energy Community Load ProfilesIreland2020201 year1 minHousehold, Appliances, Weather, PV, BESS[41]
Norwegian Energy Community DatasetNorway20151001 year1 h (households), 1 min (appliances)Household, Appliances, EV, estimated PV, Weather, Prices[40]
Plegma DatasetGreece2022–2023133–14 months0.1 HzHousehold, Appliances, Interviews[42]
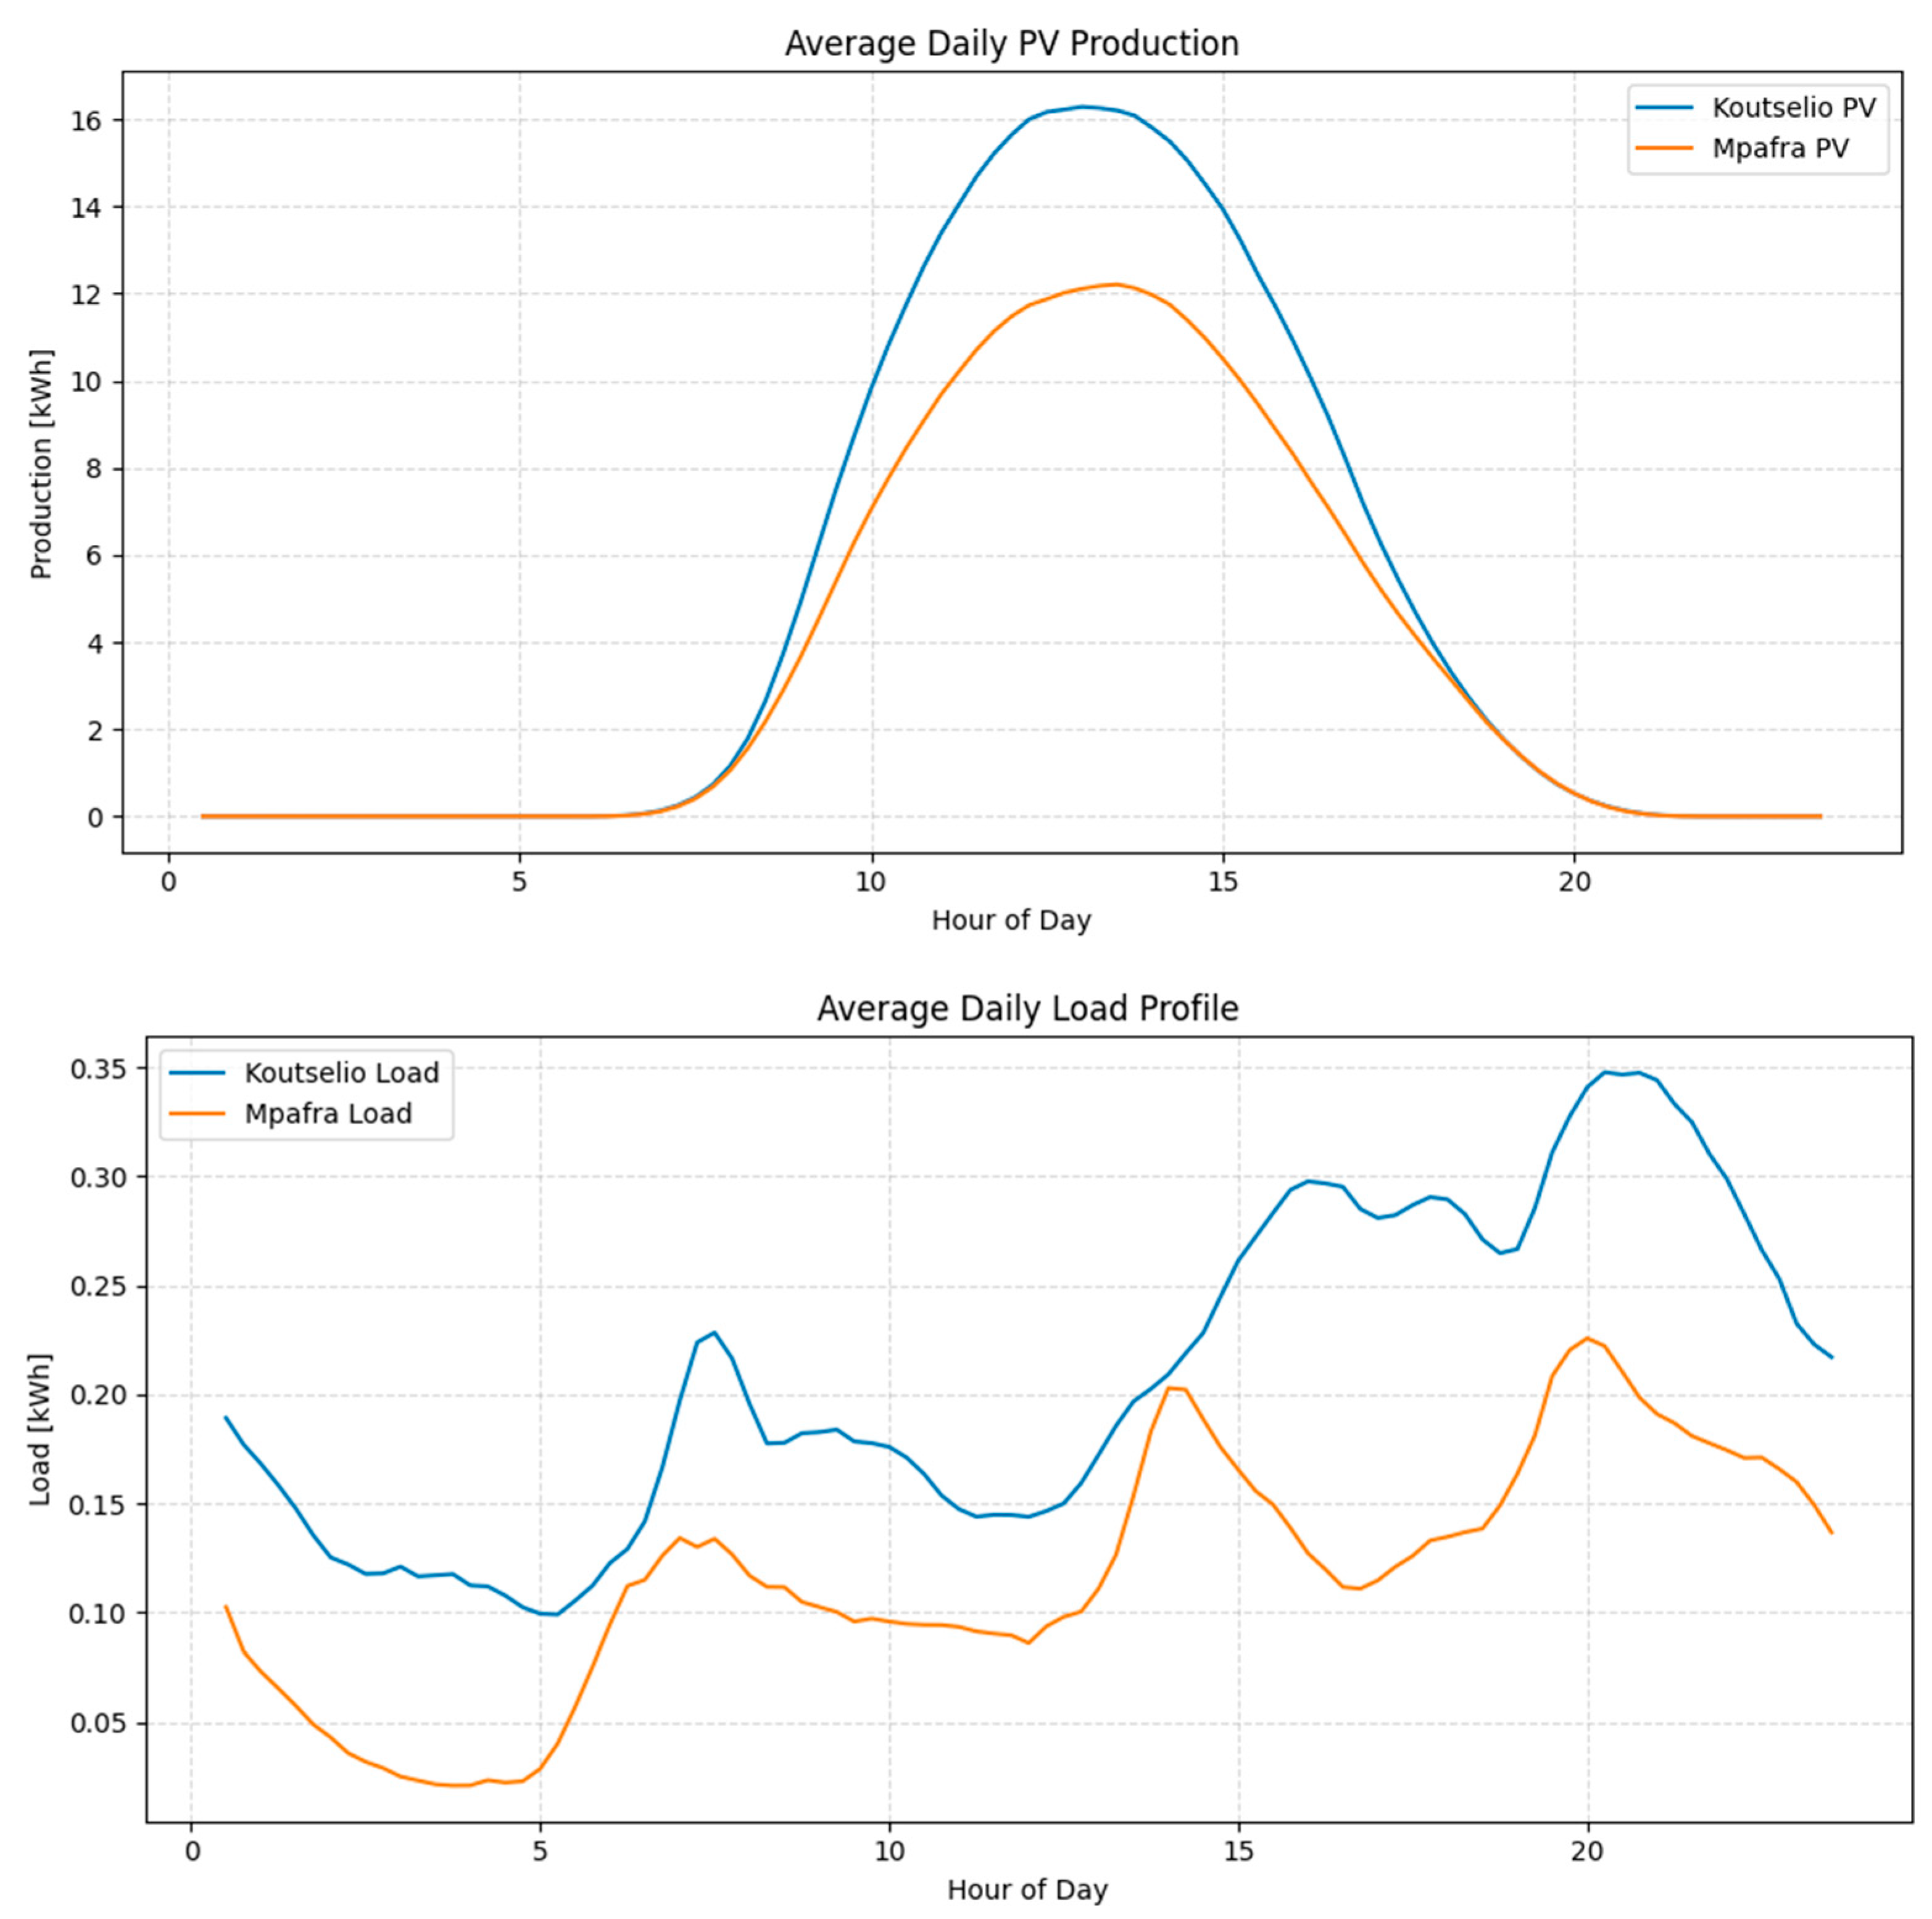
The electricity production profiles of the two PV parks and the two households are illustrated in Figure 2. It is noteworthy that the household in Koutselio exhibits significantly higher electricity consumption, and its associated PV park also shows greater electricity production. Both houses have similar basic characteristics and use a heat pump for heating. To reflect actual market conditions, DAM prices were sourced from the Hellenic Energy Exchange (EnExGroup) [68], and their fluctuations are shown in Figure 3.
The remaining model parameters were defined in accordance with local market conditions and legal regulations, as summarized in Table 3 and Table 4 below.
The static parameters used in the model were selected based on current Greek market conditions, regulatory provisions, and typical engineering assumptions for small-scale PV investments. The aggregator fee λ A = 0.0025 / k W h represents the cost charged by the aggregator for managing the PV park’s participation in the DAM electricity market. According to the current legal framework, this fee is applied to all exported electricity. The value was sourced from a well-known Greek energy market website that lists aggregator service rates for small producers. The retail electricity price λ R = 0.15   / k W h   represents the average residential tariff in Greece and is used to value self-consumed electricity under the virtual net-billing scheme. The balancing charge λ m N reflects the cost imposed by the supplier for balancing the netted energy injected into the grid. Regulated charges are not included in the model, since they are charged on the whole imported energy as they would outside the virtual net-billing scheme as well.
The supplier’s cost is calculated as the product of the netted energy and the balancing parameter λ m N , which is the sum of the Unit Imbalance Price and the three Unit Adjustment Charges (ΛΠ1, ΛΠ2, and ΛΠ3) published for each Balancing Settlement Period by the Greek Transmission System Operator (IPTO). The Imbalance prices and ΛΠ1–ΛΠ3 charges are published monthly. Their values for 2024 can be found in Table 4. Under the virtual net-billing Law 5074/2024, installed PV capacity is restricted to a maximum of 100% of the contracted capacity of the household. The maximum PV capacity P m a x = 8  kW represents the standard upper limit for residential installations in Greece (8 kVA). The capital cost c c p   =   850   ( / k W )   and operational cost c o p   =   20   ( / k W )   reflect average values derived from local market conditions and installer quotations for residential-scale grid-connected PV systems. The DR activation ratio α = 10 %   indicates the portion of total load assumed to be flexible. This value is based on rough assumptions informed by residential DR studies, due to the lack of detailed empirical data in the Greek context.
A discount rate of r   =   2 %   was adopted to represent a conservative real interest rate, aligning with current European economic conditions and commonly used values in investment analysis. The lifetime of the PV system N = 20   years corresponds to the expected operational duration and warranty periods of most PV system components. Finally, the degradation rate η = 0.5 %   per year reflects standard long-term performance decline for crystalline silicon PV modules, consistent with both manufacturer data and empirical studies.

2.4. Sensitivity Analysis Design

To investigate the influence of key economic and technical parameters on the model’s outcomes, a one-way sensitivity analysis was performed. Five parameters were selected based on their practical relevance and policy significance: CAPEX, OPEX, aggregator’s fee, the DR capacity limit and the PV panel degradation rate. Each parameter was independently varied within realistic bounds derived from market trends and literature. All details are included in Table 5:

3. Results

3.1. Baseline Cases

Table 6 presents the results for the three baseline scenarios simulated for the two households in the Commonen EC. As expected, the “No PV” scenario leads to the highest annual net cost due to full reliance on grid electricity. When PV is installed, the net cost drops in both locations. Adding DR capability offers a marginal additional improvement in cost—1.5% for the Koutselio case and 1.6% for the Mpafra case.

3.2. Sensitivity Analysis Results

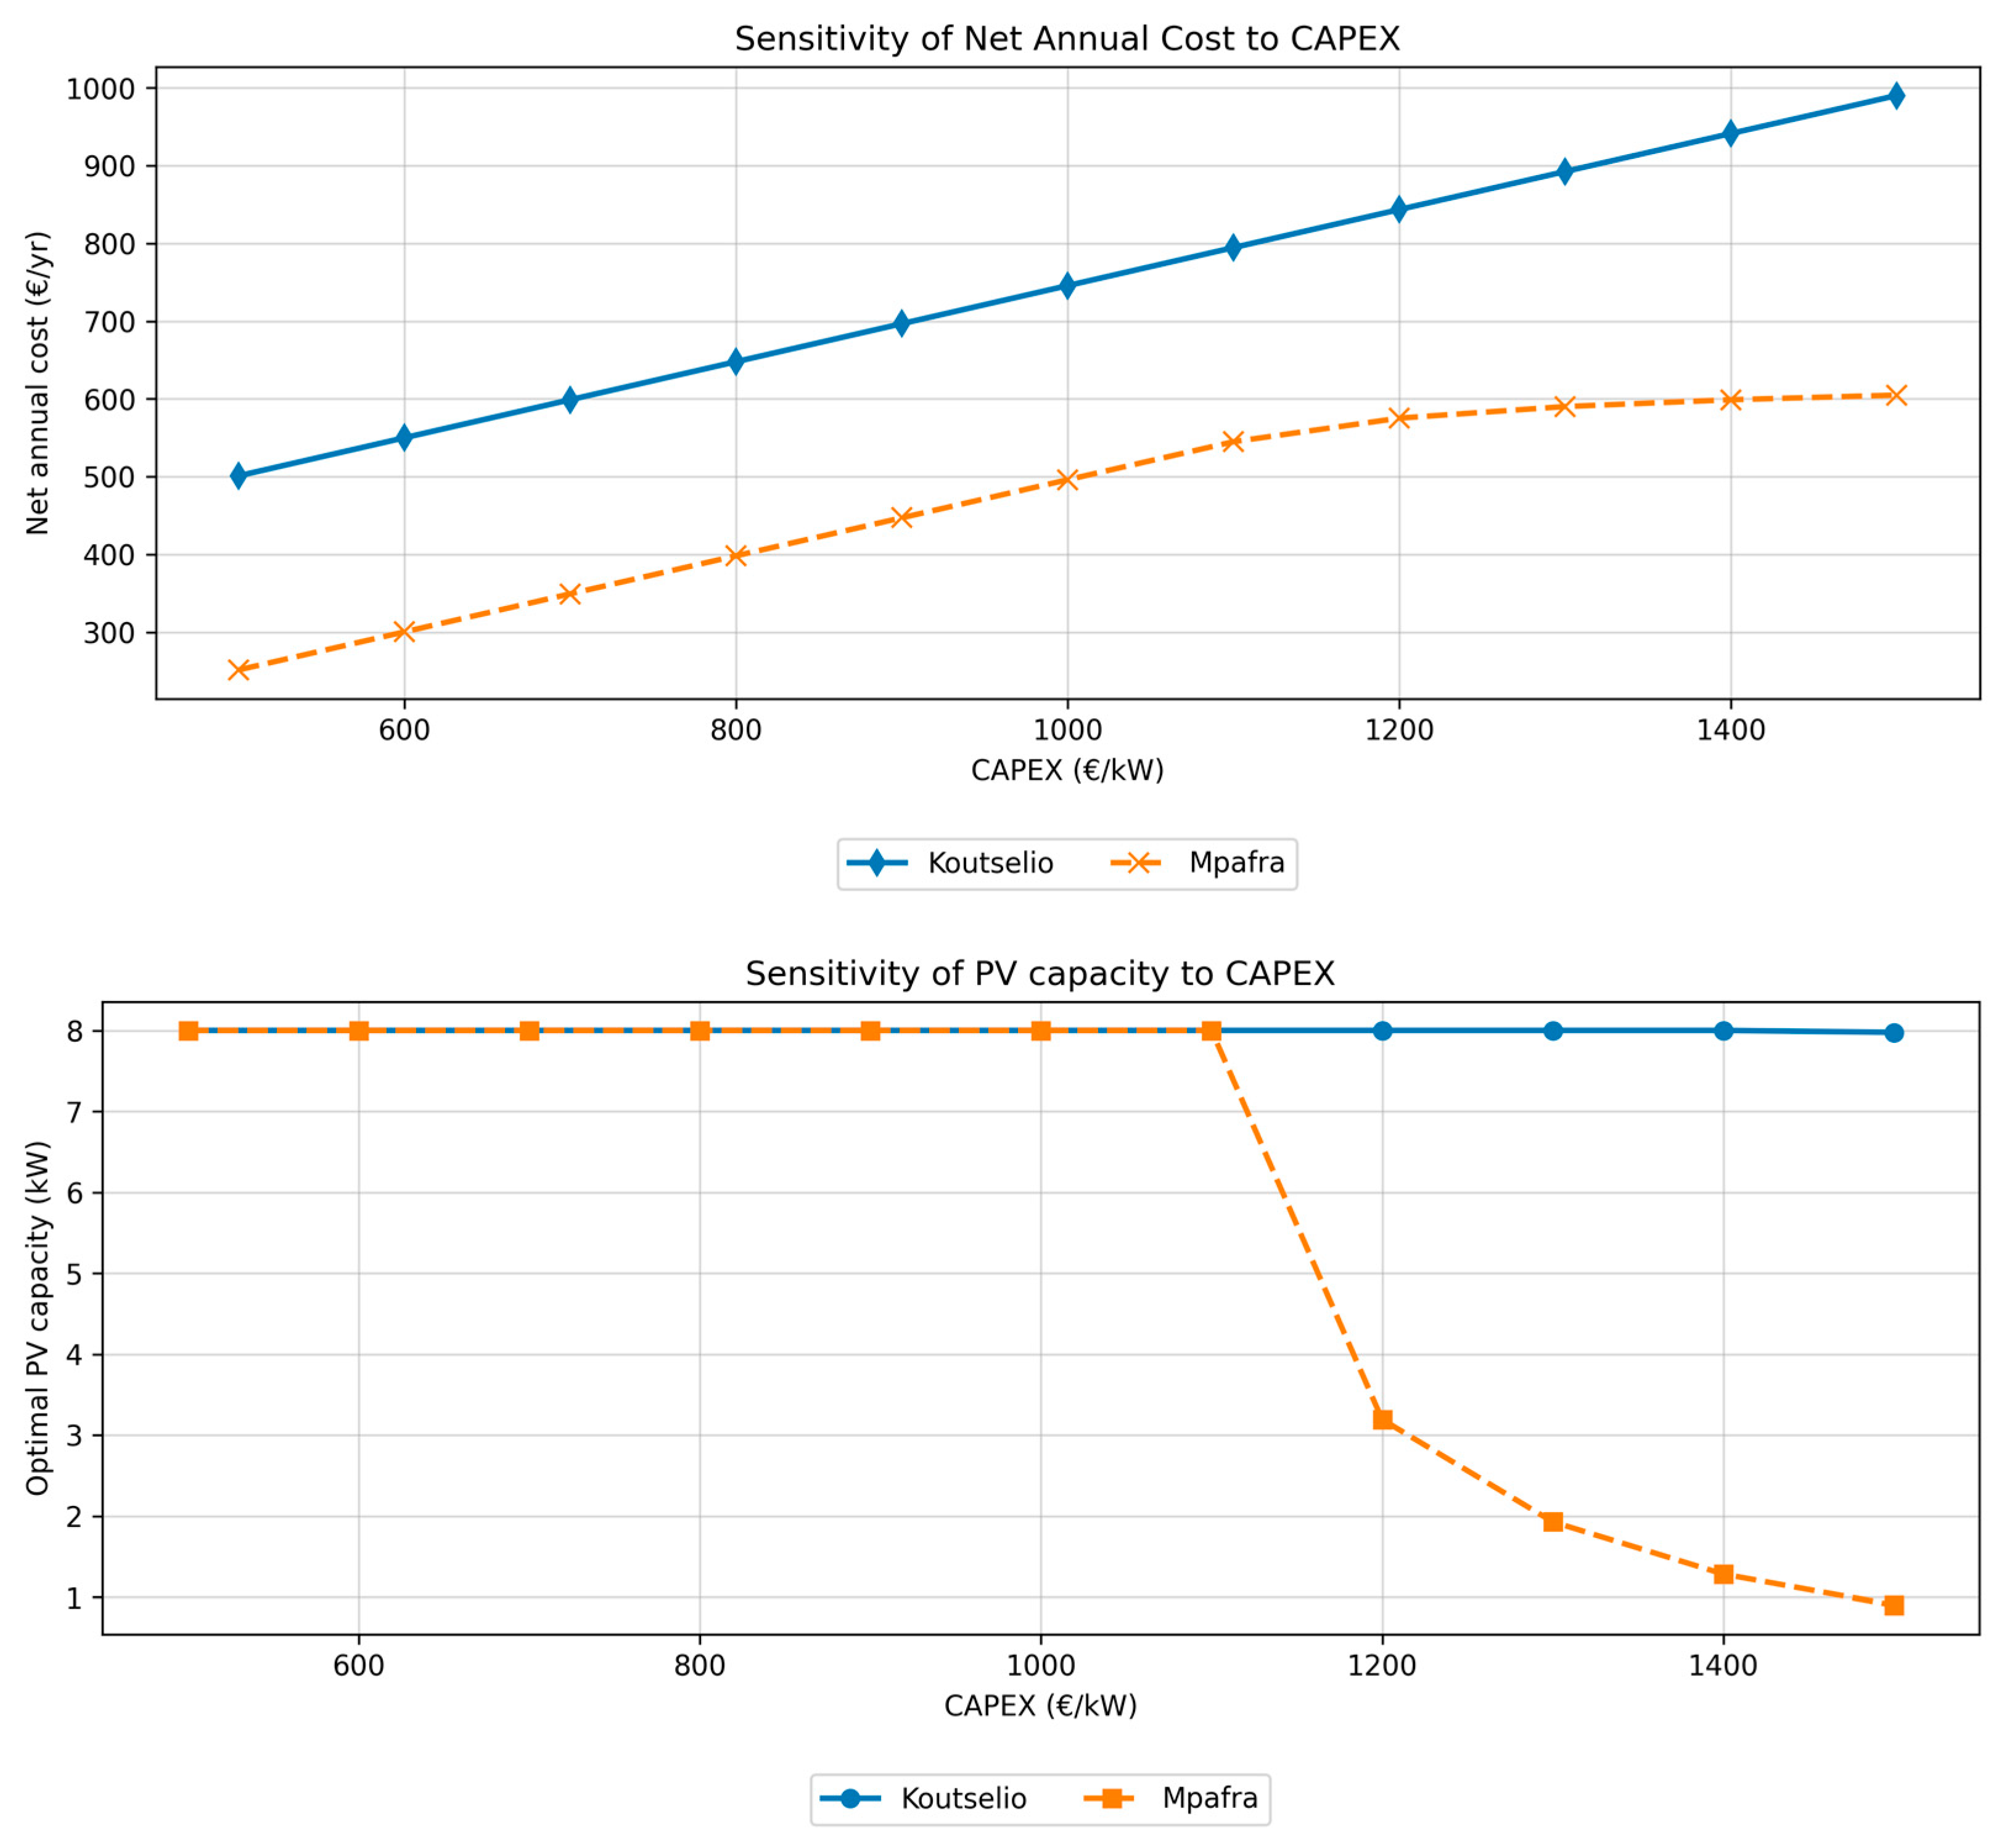
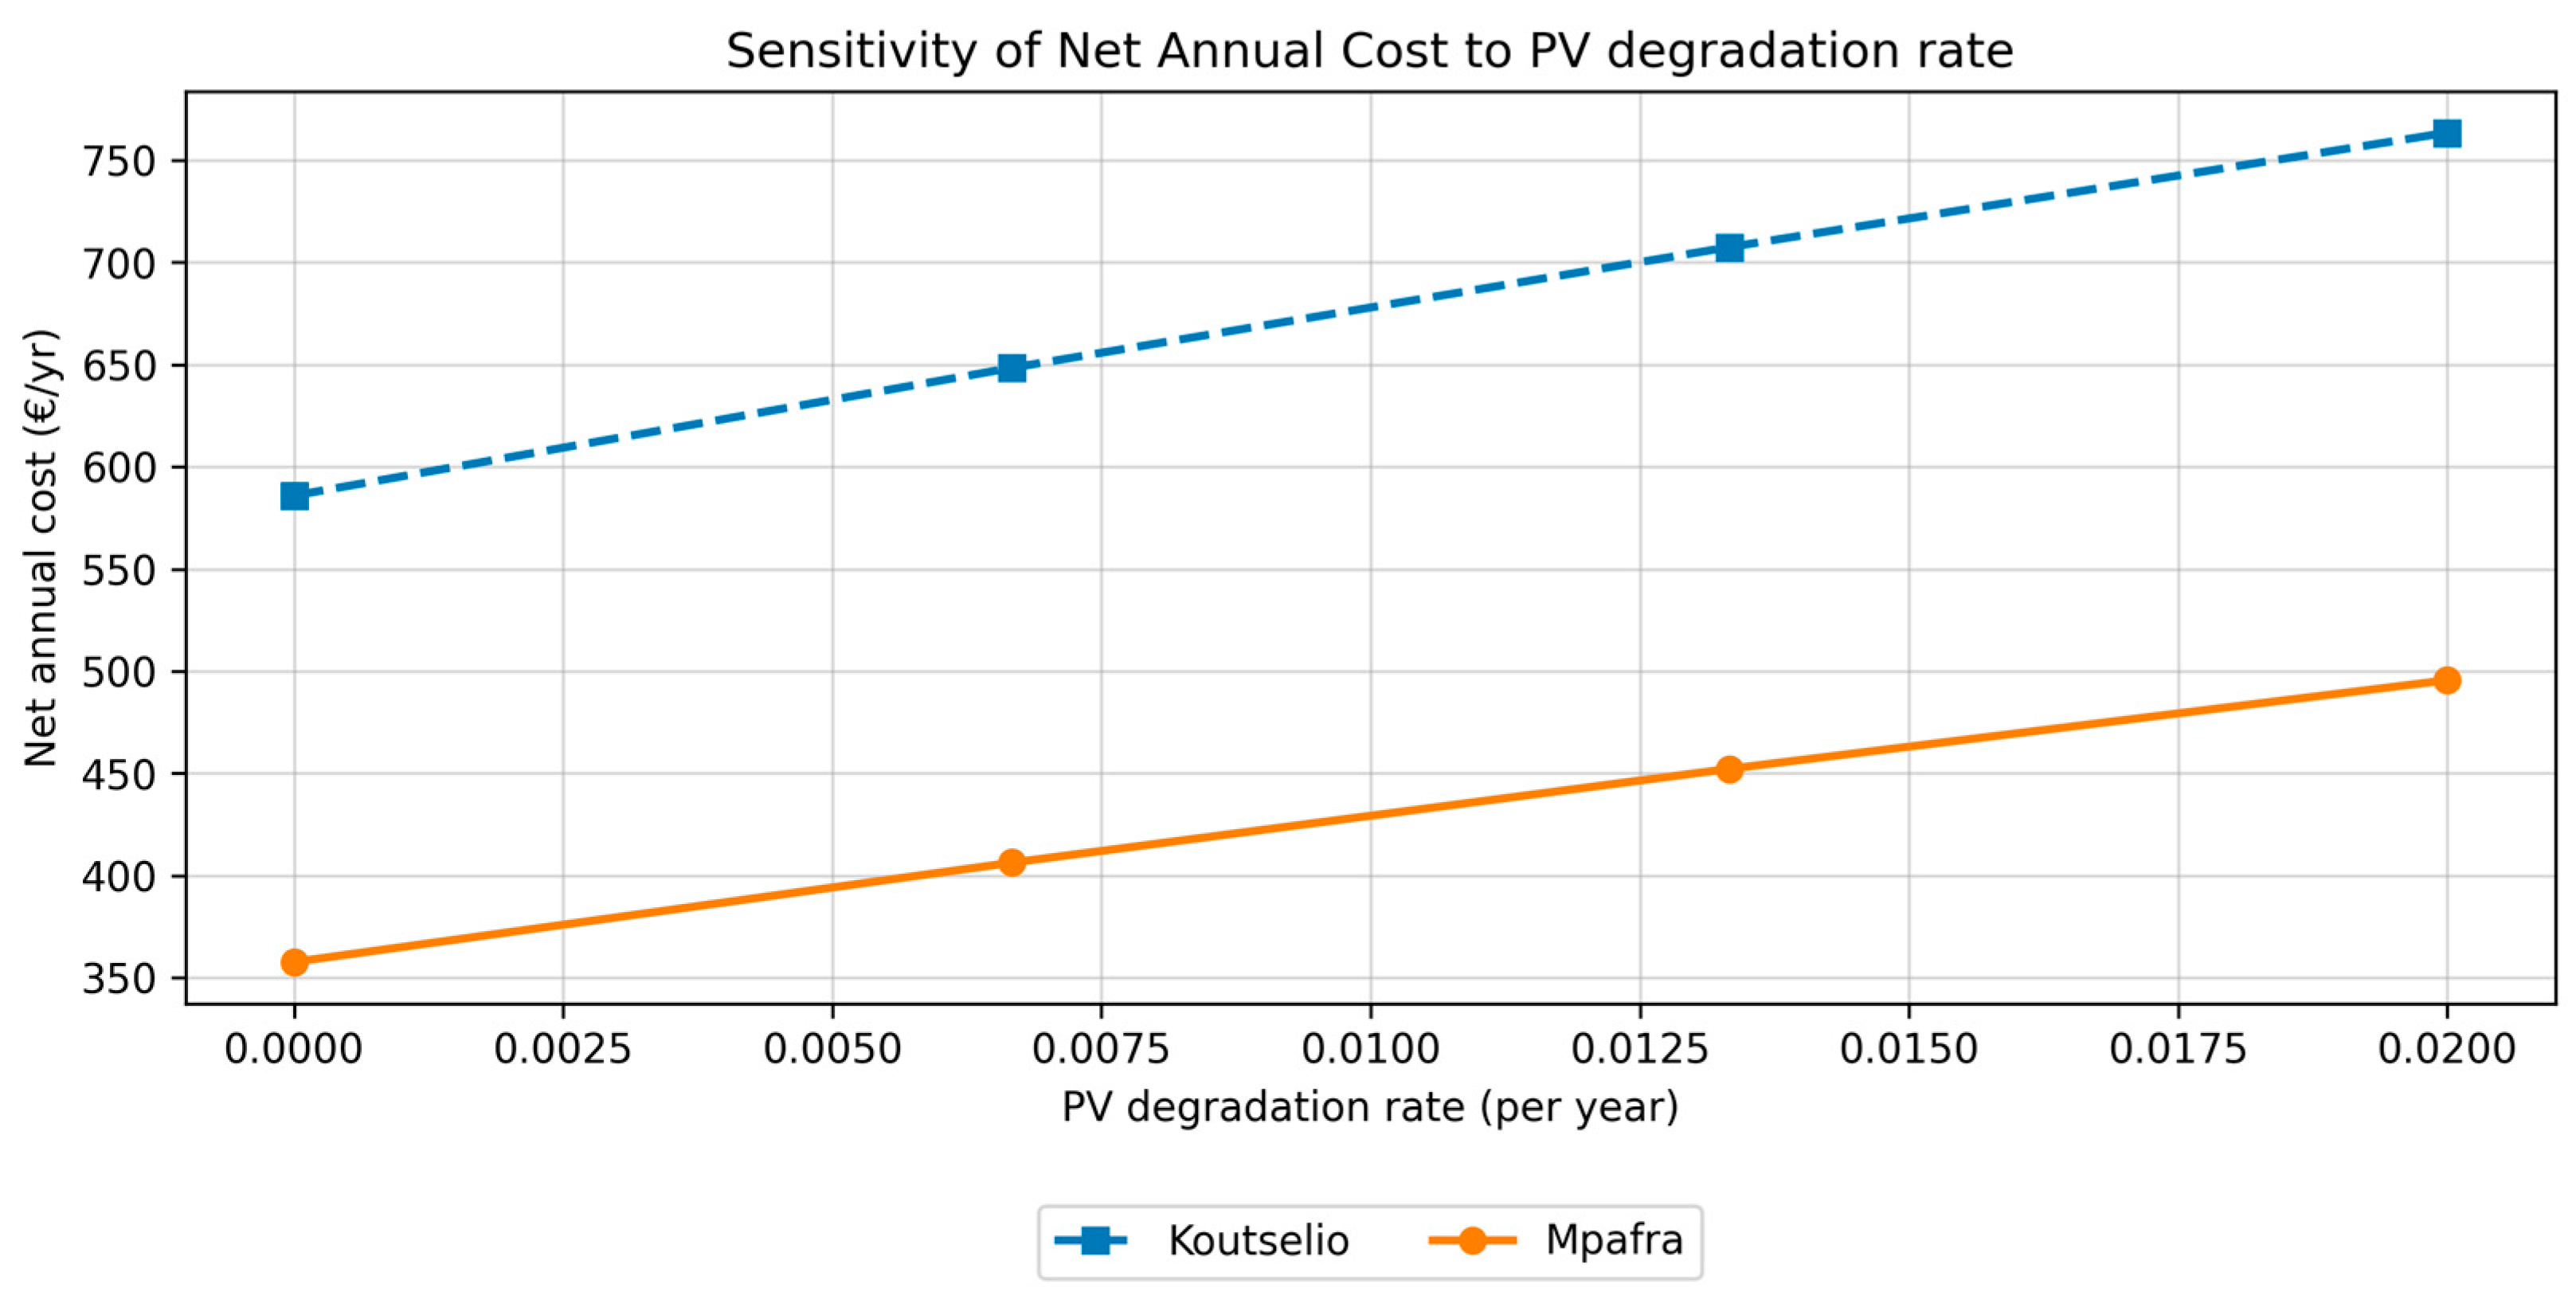
The results of the sensitivity analysis across both case studies are presented below in Figure 4, Figure 5, Figure 6, Figure 7 and Figure 8.
The sensitivity analysis of the two representative households—Mpafra and Koutselio—reveals how differences in load and generation profiles shape investment and operational decisions. Mpafra consistently shows lower net annual costs across all tested parameters, largely due to its lower electricity consumption and more favorable alignment of generation with load during critical periods. Mpafra tends to reduce PV capacity earlier than Koutselio when faced with rising CAPEX or OPEX. This behavior is partly explained by its lower PV production potential, which limits the returns from scaling up generation capacity, especially when surplus energy cannot be self-consumed or is under-compensated in the DAM.
Overall, the findings illustrate how site-specific consumption and generation characteristics—particularly load volume—critically influence optimal system design. While Mpafra benefits from lower overall costs, it is less incentivized to maintain large PV capacity when economic conditions become less favorable. Koutselio, with higher demand and better solar potential, justifies larger systems and derives greater benefit from DR. These insights highlight the importance of fine-grained modeling and suggest that future regulatory or financial support schemes should consider both technical resource availability and demand-side potential to promote equitable and efficient EC participation.

3.3. DR Strategy

The DR strategy is modeled as an intra-day, energy-neutral load-shifting mechanism, where per-interval adjustments are capped at a fraction α of the baseline demand. In this study, α is tested at 5%, 10%, 15%, and 30%, capturing a spectrum of flexibility levels. These values approximate the portion of household demand that could realistically be shifted within a single day without compromising essential services. Such percentage-based constraints are a common simplification in DR research, particularly in large-scale models [69,70], and here they provide a first indication of how DR may reduce costs at the household level.
Even under these constraints, DR emerges as a beneficial strategy, lowering net annual costs for both households without affecting PV sizing. As shown in Figure 7, while the DR capacity increases from 0.1 to 0.5, the total annualized net cost gradually decreases, indicating improved economic performance of the energy system. Specifically, the objective drops from €422.63 to €394.42, a 6.67% reduction for the Mpafra case and from €672.33 to €633.09, a 5.84% cost reduction for the Koutselio case.
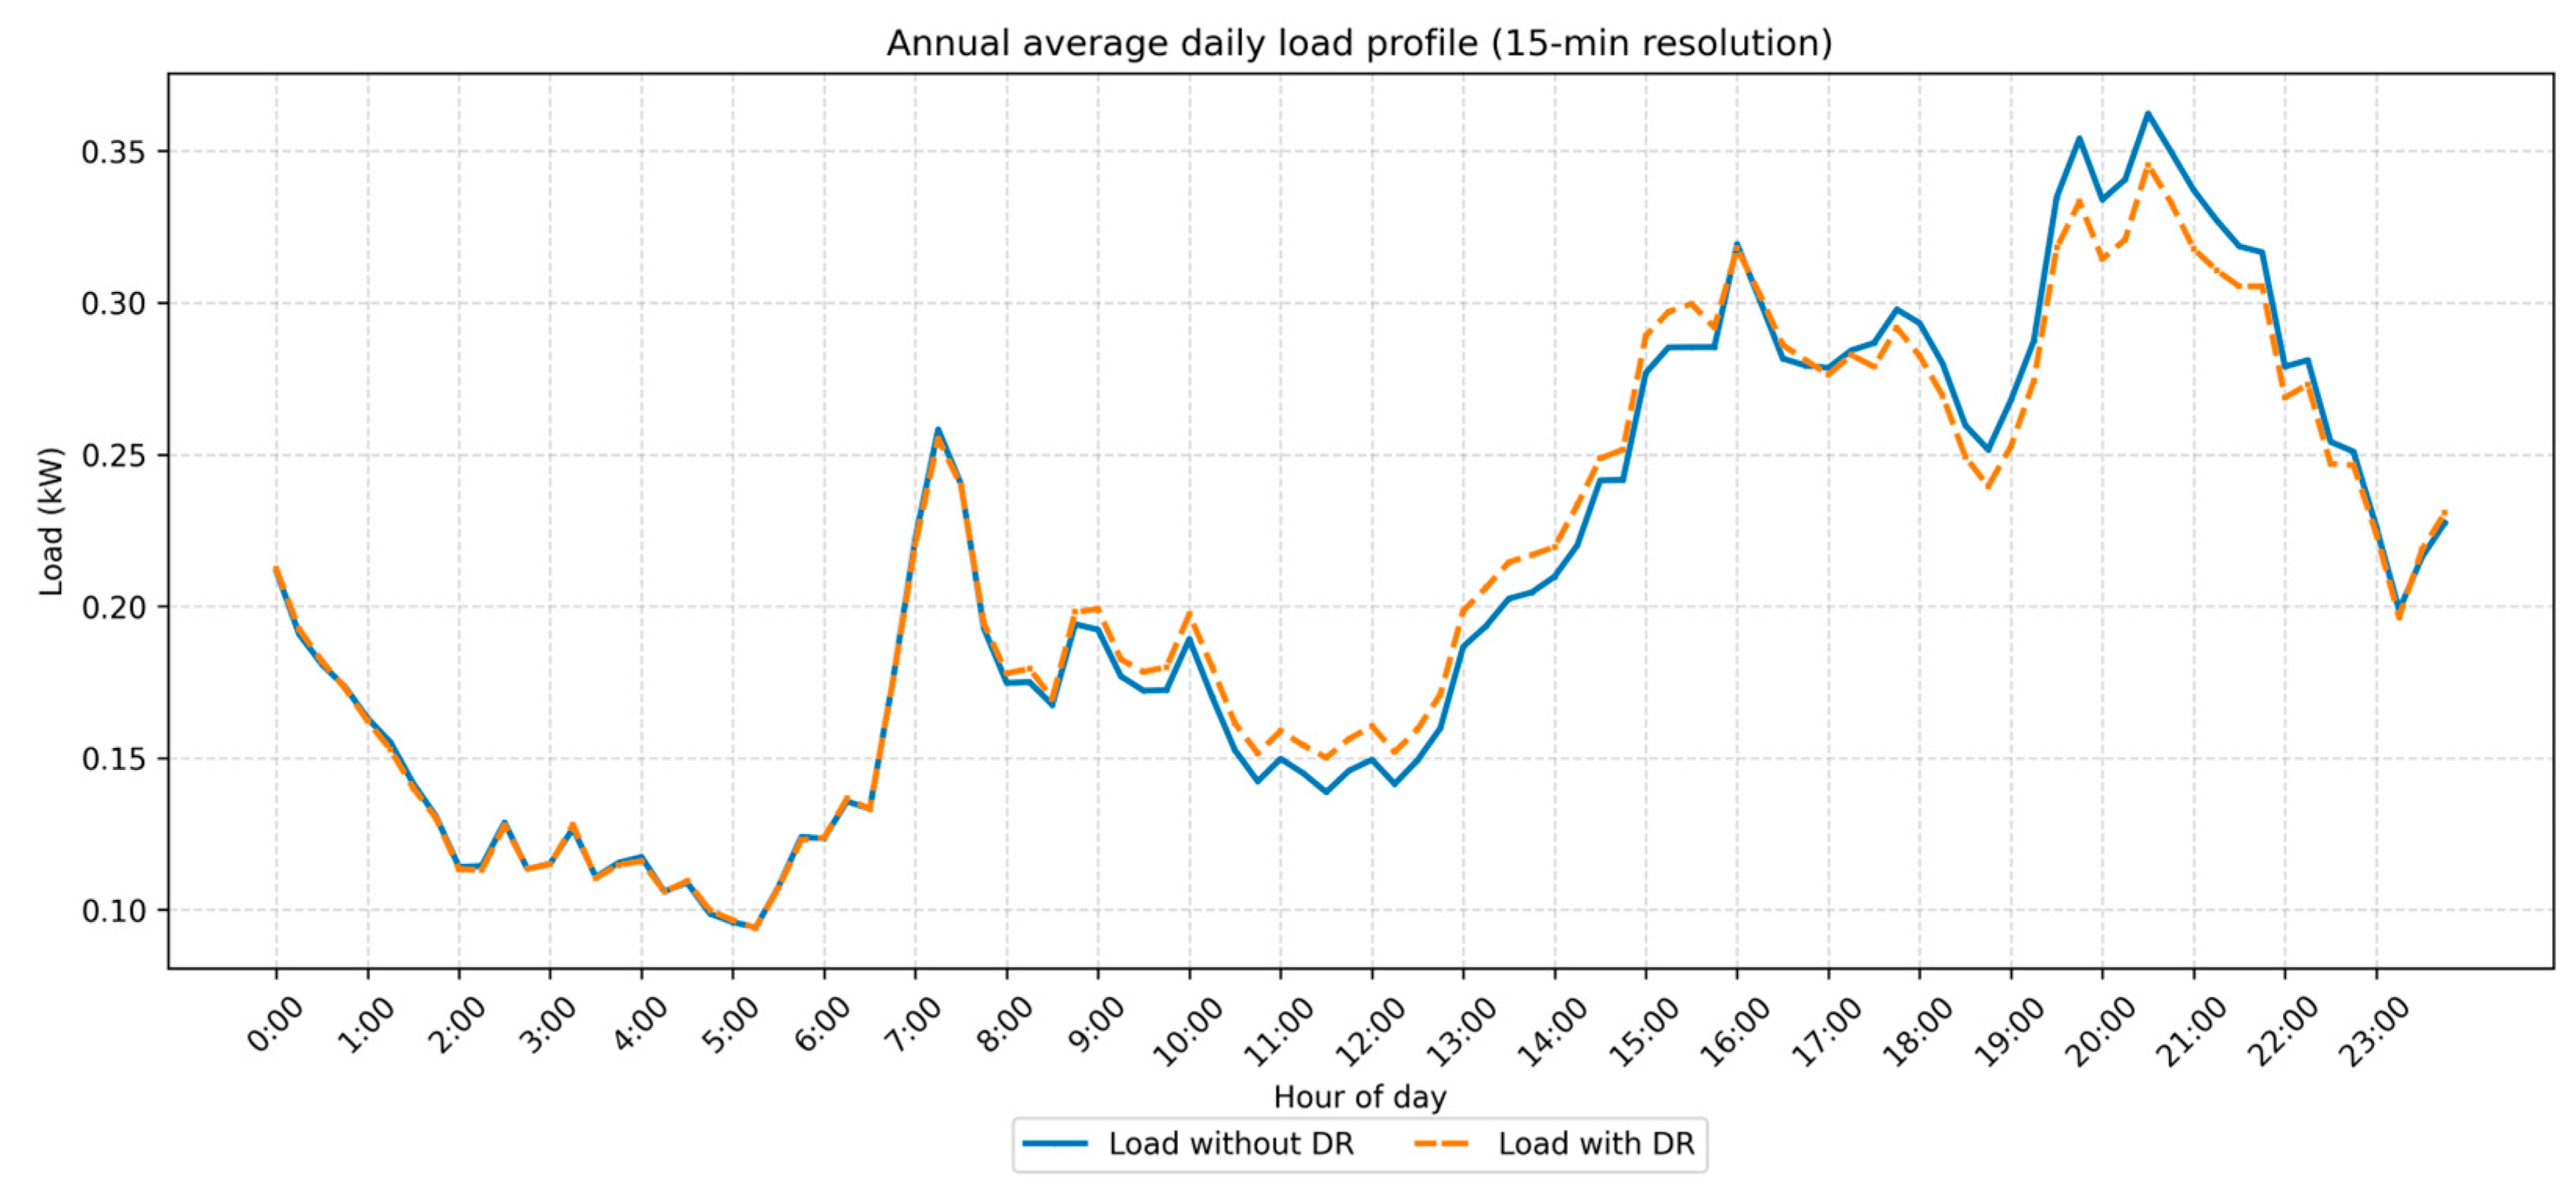
The results of the implemented DR strategy are presented in Figure 9 and Figure 10 as yearly average for the Mpafra and Koutselio cases, respectively. As we can see, the model shifts consumption from late evening to the morning and noon. The current modeling of DR has its limitations since the load can only be shifted throughout a single day as constrained by Equation (7) and only as a proportion of the original load, which means that even with higher DR capacity, the load shape cannot be drastically changed. This is why, even under higher DR capacities, a restricted financial gain is observed. This approach simplifies the diversity of potential shifting behaviors and is rather conservative in scope. However, it can serve as an indication of the potential DR strategies that the households can adopt under the current market conditions.

4. Discussion

Given the current challenges and opportunities that Greek ECs face, the outcomes of this study offer valuable guidance for both policymakers and practitioners. As Greece transitions to the virtual net-billing scheme, where settlements are made every 15 min and surplus generation is less financially rewarding, accurate system sizing becomes crucial. By minimizing net annual costs while maximizing self-consumption, the proposed MILP optimization framework enables ECs to make informed investment decisions that are aligned with the new regulatory and economic conditions.
The sensitivity analyses further reveal that investment viability is strongly influenced by changes in CAPEX and OPEX. In the Mpafra case, net annual costs rise sharply from ~250 €/yr at 500 €/kW to more than 600 €/yr at 1500 €/kW, with optimal PV capacity decreasing below 1 kW at high-cost levels. This indicates that smaller or less energy-intensive households remain economically viable only within a narrow cost envelope. By contrast, the Koutselio case demonstrates greater resilience: PV capacity remains close to 8 kW even at higher CAPEX levels, though net annual costs nearly double (from ~500 €/yr to ~990 €/yr between 500–1500 €/kW). Similarly, increases in OPEX disproportionately affect smaller systems, again narrowing their feasibility range.
From a policy perspective, the results suggest that modest levels of financial support could be decisive. For Mpafra, a 30% CAPEX subsidy would reduce the net annual cost at 1200 €/kW from ~575 €/yr to ~450 €/yr. In Koutselio, a 20% subsidy would be sufficient to keep net costs below 850 €/yr even under high CAPEX. Complementary measures such as reduced VAT on equipment or maintenance cost relief programs tied to EC participation could further stabilize investment outcomes.
In addition to CAPEX and OPEX, the degradation rate of PV systems is another critical factor influencing investment outcomes. The sensitivity analysis shows that increasing degradation from 0% to 2% per year raises the net annual cost by nearly 40% in the Mpafra case and by around 30% in Koutselio. While larger systems remain more resilient, households with modest loads or smaller installations become disproportionately exposed to lifetime performance losses. This underscores the importance of quality standards, warranties, and support schemes that safeguard long-term system performance, while also reinforcing the case for collective citizen participation in the energy system. Ensuring access to durable technologies and maintenance services can therefore complement financial incentives, enhancing both the economic attractiveness and social equity of EC participation.
In addition, the sensitivity to aggregator fees shows moderate but consistent effects: a fivefold increase in fees (from 0.001 to 0.005 €/kWh) raises net annual costs by about 8–10% in both cases. While less critical than CAPEX or OPEX, this highlights the importance of ensuring transparent and fair pricing of aggregation services. As aggregator participation becomes a prerequisite for unlocking demand response flexibility under EU and Greek regulation, safeguarding against excessive fee structures will be key to maintaining the economic attractiveness of energy community participation.
Beyond cost and technical parameters, the analysis also highlights the role of DR. Even under the simplified formulation used here, where per-interval load shifting is capped as a fraction of baseline demand, modest reductions in net annual costs are observed: approximately 6–7% for both households as α increases from 10% to 50%. While the absolute savings are limited, these results indicate that DR can complement PV investments even under conservative assumptions. This suggests that policies and market mechanisms enabling household-level flexibility will be an essential complement to financial incentives in ensuring the viability of energy com-munities under virtual net-billing.
Finally, the results underscore the strategic value of data-driven planning tools to navigate Greece’s shifting legislative environment. As ECs are burdened by bureaucratic hurdles and regulatory uncertainty, tools like this can simplify decision-making, reduce investment risk, and foster trust among members. In the context of Law 5074/2024 and the growing complexity of energy market participation, such optimization frameworks can act as enablers, empower local actors and strengthen the legitimacy of grassroots initiatives. Ensuring that the most sensitive cost components are mitigated through targeted support will not only sustain the economic viability of citizen-led ECs but also safeguard compliance with EU directives on energy democracy, while helping Greece achieve its national targets for decentralized renewable energy deployment.

5. Conclusions

This study presents a high-resolution MILP optimization model for determining the optimal PV sizing and DR actions for a single member of a Greek REC or CEC under the newly implemented virtual net-billing scheme. The model incorporates 15 min resolution data for consumption, production, and market prices, reflecting the dynamic and granular structure of Greece’s updated energy regulations. The proposed single-objective formulation offers a practical tool to support citizens and cooperatives in evaluating centralized solar projects under realistic economic constraints.
While the model provides useful insights, it is not without limitations. A central limitation of this study is the absence of battery storage. Shared BESSs, although prevalent in European EC designs, are not currently permitted by the Greek law under the virtual net-billing framework. Consequently, our analysis focused on PV-only scenarios as a first validation step under current national regulation. Future work will extend the framework to include both individual household batteries and hypothetical shared BESS configurations, which are expected to further increase self-consumption, improve economic performance, and align the Greek case with the broader European experience.
Furthermore, the analysis was conducted for a single year and based on two households and serves as an initial validation rather than a basis for national-level generalization. The main contribution of the study lies in developing and testing an optimization framework for the new virtual net-billing model under the current Greek regulatory design. Future research will extend this work by incorporating larger and more diverse datasets—either from the open datasets reviewed in Section 3.2 or from new data collected directly from Greek energy communities through the DR-RISE project (https://dr-rise.eu/).
Looking ahead, the growing deployment of Electric Vehicles (EVs) (installed in properly insulated buildings) is expected to significantly reshape household electricity demand, both in terms of volume and temporal distribution. These technologies not only increase overall consumption but also introduce new flexibility opportunities that can be exploited through DR. Integrating heat pumps and EVs into demand-side management strategies can help flatten demand peaks and enhance system responsiveness [71]. Future work will include multi-day flexibility cycles, behavioral participation models, and appliance-level availability constraints, which are expected to reveal greater savings and strengthen the complementarity between DR and PV in energy communities.
A further limitation of this study is that the optimization is performed at the level of an individual household. Under the current Greek virtual net-billing framework, production and benefits are statically allocated to members, and there is no legal provision for dynamic energy sharing or multi-member collaborative optimization. This restricts the analysis to single-member PV sizing rather than community-level coordination. However, several research studies show that collective optimization and dynamic sharing can unlock higher efficiency and fairness in energy communities [72,73,74]. We therefore recommend that future regulatory reforms consider enabling such mechanisms, which would allow the presented framework to be extended to community-wide optimization and energy-sharing strategies.
Moreover, the inclusion of stochastic representations of solar generation and load uncertainty could provide a more robust and flexible optimization framework [75]. Such improvements would increase the relevance of the model for policy design and practical deployment across diverse EC settings. Finally, other compensation options for ECs could be considered for surplus production such as fixed tariffs under Power Purchase Agreements (PPAs).
An additional source of uncertainty for the future development of energy communities concerns electricity price dynamics. Price volatility directly affects the economics of virtual net-billing: higher retail prices increase the value of self-consumed PV and shorten payback periods, whereas lower prices weaken the incentive for investment. Beyond average price levels, volatility introduces greater investment risk for households and communities, as future savings become more uncertain. At the same time, fluctuating prices could increase the potential value of demand response, making flexibility a more important complement to PV deployment. These dynamics underline the need to account for electricity price variability in future analyses of energy community viability.
While ECs have demonstrated strong potential across Europe to promote renewable energy, energy democracy, and social equity, their success in Greece is hindered by persistent structural challenges [76]. Moreover, unresolved challenges such as grid access constraints, export curtailments, and a lack of prioritization for community-led initiatives pose significant risks to the long-term viability of the new virtual net-billing scheme. To ensure that RECs and CECs can thrive under this framework, technical optimization must be complemented by robust regulatory support. This includes transparent and equitable capacity allocation, curtailment protections, and policies that elevate social and environmental priorities above purely commercial interests.

Author Contributions

Conceptualization, I.-M.C. and D.K.; methodology, I.-M.C., D.K. and D.A.P.; software, I.-M.C., A.-G.C. and A.X.; validation, I.-M.C., D.K., A.-G.C., G.T.A. and A.X.; writing—original draft preparation, I.-M.C.; writing—review and editing, all; supervision, G.T.A. All authors have read and agreed to the published version of the manuscript.

Funding

The research was funded by the European Union (Grant Agreement No 101104154). Views and opinions expressed are, however, those of the authors only and do not necessarily reflect those of the European Union or the European Commission. Neither the European Union nor the granting authority can be held responsible for them.

Data Availability Statement

The data presented in this study are available on request from the corresponding author. The data are not publicly available due to privacy restrictions.

Acknowledgments

Results presented in this work have been produced using the Aristotle University of Thessaloniki (AUTh) High Performance Computing Infrastructure and Resources.

Conflicts of Interest

The authors declare no conflicts of interest.

Abbreviations

The following abbreviations are used in this manuscript:
CECsCitizen Energy Communities
RECsRenewable Energy Communities
ECsEnergy Communities
PVPhotovoltaic
BESSBattery Energy Storage System
DRDemand Response
A. Indices and Sets
t ,   T Index and set of time intervals (15 min resolution)
d ,   D Index and set of days
m ,   M Index and set of months
B. Parameters
D d , t Baseline   demand   at   day   d   and   time   t   ( k W h )
P d , t Normalized   PV   production   at   day   d  and time t
λ d , t W M Day   Ahead   Market   price   at   day   d   and   time   t   ( / k W h )
λ R Fixed   electricity   import   retail   price   ( / k W h )
λ A Aggregator s   charge   on   surplus   energy   ( / k W h )
λ m N Monthly   charge   on   netted   energy   ( / k W h )
P m a x Maximum   capacity   allowed   by   law   ( k W )
c c p Acquisition   and   installation   cost   per   kwp   ( / k W )
c o p Maintenance   cost   per   kwp   for   each   y   ( / k W )
r Discount rate for cost calculation (%)
N number   of   years   for   the   assessment   ( years )
α Demand response flexibility limit as a fraction of load
η PV system degradation rate (%)
C. Variables
P s h Member s   PV   share   ( k W )
E d , t E X P Energy   exported   to   the   grid   at   day   d   and   time   t   ( k W h )
E d , t I M P Energy   imported   from   the   grid   at   day   d   and   time   t   ( k W h )
E d , t N Energy   netted   at   day   d   and   time   t   ( k W h )
E d , t D R Energy   shifted   at   day   d   and   time   t   ( k W h )
X d , t Binary   variable   indicating   whether   the   prosumer   imports   ( X d , t = 1 )   or   exports   ( X d , t = 0 )   energy   at   day   d and time   t

References

  1. Kostakis, V.; Giotitsas, C.; Kitsikopoulos, D. Envisioning energy futures through visual images: What would a commons-based energy system look like? Energy Res. Soc. Sci. 2024, 118, 103771. [Google Scholar] [CrossRef]
  2. European Commission. Directive (EU) 2018/2001 of the European Parliament and of the Council of 11 December 2018 on the Promotion of the Use of Energy from Renewable Sources; European Commission: Brussel, Belgium, 2018; pp. 82–209. Available online: http://data.europa.eu/eli/dir/2018/2001/oj (accessed on 29 April 2025).
  3. European Commission. Directive (EU) 2019/944 of the European Parliament and of the Council of 5 June 2019 on Common Rules for the Internal Market in Electricity; European Commission: Brussel, Belgium, 2019; pp. 125–199. Available online: https://eur-lex.europa.eu/legal-content/EN/TXT/PDF/?uri=CELEX:32019L0944 (accessed on 29 April 2025).
  4. Hellenic Parliament. Νόμος 4513/2018—Ενεργειακές Κοινότητες και άλλες διατάξεις; ΦΕΚ A’ 9/23.01.2018; Hellenic Parliament: Athens, Greece, 2018. Available online: https://www.taxheaven.gr/law/4513/2018 (accessed on 29 April 2025).
  5. Στατιστικά ΓΕΜH. Available online: https://statistics.businessportal.gr/status-changes/legal-types (accessed on 1 July 2025).
  6. Neij, L.; Palm, J.; Busch, H.; Bauwens, T.; Becker, S.; Bergek, A.; Buzogány, A.; Candelise, C.; Coenen, F.; Devine-Wright, P.; et al. Energy communities—Lessons learnt, challenges, and policy recommendations. Oxf. Open Energy 2025, 4, oiaf002. [Google Scholar] [CrossRef]
  7. Aghamolaei, R.; Shamsi, M.H.; O’Donnell, J. Feasibility analysis of community-based PV systems for residential districts: A comparison of on-site centralized and distributed PV installations. Renew. Energy 2020, 157, 793–808. [Google Scholar] [CrossRef]
  8. Sofia, Y.; Katsaprakakis, D.; Sakkas, N.; Condaxakis, C.; Karapidakis, E.; Syntichakis, S.; Stavrakakis, G.M. The Role of Energy Communities in the Achievement of a Region’s Energy Goals: The Case of a Southeast Mediterranean Region. Energies 2025, 18, 1327. [Google Scholar] [CrossRef]
  9. Friends of the Earth Europe. Corporate Capture of Energy Communities—A Threat for a Citizens Energy Transition in Europe; Friends of the Earth Europe: Brussels, Belgium, 2025; p. 36. Available online: https://friendsoftheearth.eu/wp-content/uploads/2025/04/Report-Corporate-Capture-on-Energy-Communities.pdf (accessed on 10 July 2025).
  10. Hellenic Parliament. Ελληνική Δημοκρατία Νόμος 5037/2023—Ενεργειακή Aπόδοση και Ενεργειακές Υπηρεσίες, Διαδικασίες Ενεργειακού Ελέγχου, Ενεργειακές Κοινότητες και άλλες διατάξεις; ΦΕΚ A’ 78/28.03.2023; Hellenic Parliament: Athens, Greece, 2023. Available online: https://www.taxheaven.gr/law/5037/2023 (accessed on 29 April 2025).
  11. Hellenic Parliament. Υπουργείο Περιβάλλοντος και Ενέργειας Κοινή Υπουργική Aπόφαση για το νέο πρόγραμμα φωτοβολταϊκών με εφαρμογή Net-Billing; ΦΕΚ Β’ 5074/05.09.2024.; Hellenic Parliament: Athens, Greece, 2024. Available online: https://ypen.gov.gr/wp-content/uploads/2024/09/FEK-5074B_05_09_2024-net-billing.pdf (accessed on 29 April 2025).
  12. Energy Communities Repository—Policy database—European Commission. Available online: https://energy.ec.europa.eu/topics/markets-and-consumers/energy-consumers-and-prosumers/energy-communities/energy-communities-repository-policy-database_en (accessed on 10 September 2025).
  13. Al-Shahri, O.A.; Ismail, F.B.; Hannan, M.A.; Lipu, M.S.H.; Al-Shetwi, A.Q.; Begum, R.A.; Al-Muhsen, N.F.O.; Soujeri, E. Solar photovoltaic energy optimization methods, challenges and issues: A comprehensive review. J. Clean. Prod. 2021, 284, 125465. [Google Scholar] [CrossRef]
  14. Lopes, R.A.; Martins, J.; Aelenei, D.; Lima, C.P. A cooperative net zero energy community to improve load matching. Renew. Energy 2016, 93, 1–13. [Google Scholar] [CrossRef]
  15. Albadi, M.H.; El-Saadany, E.F. A summary of demand response in electricity markets. Electr. Power Syst. Res. 2008, 78, 1989–1996. [Google Scholar] [CrossRef]
  16. Barbato, A.; Capone, A. Optimization Models and Methods for Demand-Side Management of Residential Users: A Survey. Energies 2014, 7, 5787–5824. [Google Scholar] [CrossRef]
  17. Weckesser, T.; Dominković, D.F.; Blomgren, E.M.V.; Schledorn, A.; Madsen, H. Renewable Energy Communities: Optimal sizing and distribution grid impact of photo-voltaics and battery storage. Appl. Energy 2021, 301, 117408. [Google Scholar] [CrossRef]
  18. Khatib, T.; Mohamed, A.; Sopian, K. A review of photovoltaic systems size optimization techniques. Renew. Sustain. Energy Rev. 2013, 22, 454–465. [Google Scholar] [CrossRef]
  19. Faria, J.; Marques, C.; Pombo, J.; Mariano, S.; Calado, M.d.R. Optimal Sizing of Renewable Energy Communities: A Multiple Swarms Multi-Objective Particle Swarm Optimization Approach. Energies 2023, 16, 7227. [Google Scholar] [CrossRef]
  20. Magnor, D.; Sauer, D.U. Optimization of PV Battery Systems Using Genetic Algorithms. Energy Procedia 2016, 99, 332–340. [Google Scholar] [CrossRef]
  21. Bouaouda, A.; Sayouti, Y. Hybrid Meta-Heuristic Algorithms for Optimal Sizing of Hybrid Renewable Energy System: A Review of the State-of-the-Art. Arch. Comput. Methods Eng. 2022, 29, 4049–4083. [Google Scholar] [CrossRef]
  22. Iqbal, M.; Azam, M.; Naeem, M.; Khwaja, A.S.; Anpalagan, A. Optimization classification, algorithms and tools for renewable energy: A review. Renew. Sustain. Energy Rev. 2014, 39, 640–654. [Google Scholar] [CrossRef]
  23. Dinh, H.T.; Kim, D.; Kim, D. MILP-based optimal day-ahead scheduling for a system-centric community energy management system supporting different types of homes and energy trading. Sci. Rep. 2022, 12, 18305. [Google Scholar] [CrossRef]
  24. Lamedica, R.; Santini, E.; Ruvio, A.; Palagi, L.; Rossetta, I. A MILP methodology to optimize sizing of PV—Wind renewable energy systems. Energy 2018, 165, 385–398. [Google Scholar] [CrossRef]
  25. Fina, B.; Auer, H.; Friedl, W. Profitability of PV sharing in energy communities: Use cases for different settlement patterns. Energy 2019, 189, 116148. [Google Scholar] [CrossRef]
  26. Volpato, G.; Carraro, G.; Cont, M.; Danieli, P.; Rech, S.; Lazzaretto, A. General guidelines for the optimal economic aggregation of prosumers in energy communities. Energy 2022, 258, 124800. [Google Scholar] [CrossRef]
  27. Cosic, A.; Stadler, M.; Mansoor, M.; Zellinger, M. Mixed-integer linear programming based optimization strategies for renewable energy communities. Energy 2021, 237, 121559. [Google Scholar] [CrossRef]
  28. Novoa, L.; Flores, R.; Brouwer, J. Optimal renewable generation and battery storage sizing and siting considering local transformer limits. Appl. Energy 2019, 256, 113926. [Google Scholar] [CrossRef]
  29. Hascuri, M.; Rami, M.A.; Derrhi, M. PV system sizing with storage management: A comparative study based on Mixed Integer Linear Programming. In Proceedings of the 2019 6th International Conference on Control, Decision and Information Technologies (CoDIT), Paris, France, 23–26 April 2019; pp. 545–550. [Google Scholar] [CrossRef]
  30. Farrokhifar, M.; Aghdam, F.H.; Alahyari, A.; Monavari, A.; Safari, A. Optimal energy management and sizing of renewable energy and battery systems in residential sectors via a stochastic MILP model. Electr. Power Syst. Res. 2020, 187, 106483. [Google Scholar] [CrossRef]
  31. Budin, L.; Delimar, M. Renewable Energy Community Sizing Based on Stochastic Optimization and Unsupervised Clustering. Sustainability 2025, 17, 600. [Google Scholar] [CrossRef]
  32. Kassab, F.A.; Celik, B.; Locment, F.; Sechilariu, M.; Hansen, T.M. Combined Optimal Sizing and Energy Management of a DC Microgrid using MILP. In Proceedings of the 2023 IEEE Belgrade PowerTech, Belgrade, Serbia, 25–29 June 2023; pp. 1–6. [Google Scholar] [CrossRef]
  33. Fotopoulou, M.; Tsekouras, G.J.; Vlachos, A.; Rakopoulos, D.; Chatzigeorgiou, I.M.; Kanellos, F.D.; Kontargyri, V. Day Ahead Operation Cost Optimization for Energy Communities. Energies 2025, 18, 1101. [Google Scholar] [CrossRef]
  34. Attia, A.M.; Al Hanbali, A.; Saleh, H.H.; Alsawafy, O.G.; Ghaithan, A.M.; Mohammed, A. A multi-objective optimization model for sizing decisions of a grid-connected photovoltaic system. Energy 2021, 229, 120730. [Google Scholar] [CrossRef]
  35. Mariuzzo, I.; Fioriti, D.; Guerrazzi, E.; Thomopulos, D.; Raugi, M. Multi-objective planning method for renewable energy communities with economic, environmental and social goals. Int. J. Electr. Power Energy Syst. 2023, 153, 109331. [Google Scholar] [CrossRef]
  36. Kazmi, H.; Munné-Collado, Í.; Mehmood, F.; Syed, T.A.; Driesen, J. Towards data-driven energy communities: A review of open-source datasets, models and tools. Renew. Sustain. Energy Rev. 2021, 148, 111290. [Google Scholar] [CrossRef]
  37. Ratnam, E.L.; Weller, S.R.; Kellett, C.M.; Murray, A.T. Residential load and rooftop PV generation: An Australian distribution network dataset. Int. J. Sustain. Energy 2017, 36, 787–806. [Google Scholar] [CrossRef]
  38. Australian Government Department of Climate Change, Energy, the Environment and Water. Smart-Grid Smart-City Customer Trial Data. Available online: https://data.gov.au/data/dataset/smart-grid-smart-city-customer-trial-data (accessed on 6 May 2025).
  39. Vavouris, A.; Guasselli, F.; Stankovic, L.; Stankovic, V.; Gram-Hanssen, K.; Didierjean, S. Descriptor: A Norwegian Positive Energy Neighborhood Dataset of Electrical Measurements and Interviews on Energy Practices (NorPEN). IEEE Data Descr. 2024, 1, 113–121. [Google Scholar] [CrossRef]
  40. Berg, K.; Löschenbrand, M. A data set of a Norwegian energy community. Data Brief 2022, 40, 107683. [Google Scholar] [CrossRef]
  41. Khadem, S.; Trivedi, R.; Bahloul, M.; Saif, A.; Patra, S. Comprehensive Dataset on Electrical Load Profiles for Energy Community in Ireland. Sci. Data 2024, 11, 621. [Google Scholar] [CrossRef] [PubMed]
  42. Athanasoulias, S.; Guasselli, F.; Doulamis, N.; Doulamis, A.; Ipiotis, N.; Katsari, A.; Stankovic, L.; Stankovic, V. The Plegma dataset: Domestic appliance-level and aggregate electricity demand with metadata from Greece. Sci. Data 2024, 11, 376. [Google Scholar] [CrossRef] [PubMed]
  43. Cecílio, J.; Barros, M.; Oliveira de Sá, A.; Rodrigues, T. SHEERM: Sustainable Household Energy and Environment Resources Management dataset. Zenodo 2024. [Google Scholar] [CrossRef]
  44. Mutule, A.; Borscevskis, O.; Astapov, V.; Antoskova, I.; Carroll, P.; Kairisa, E. PV Energy Communities in Residential Apartments: Technical Capacities and Economic Viability. Sustainability 2025, 17, 2901. [Google Scholar] [CrossRef]
  45. Commonen—ΚOΙΝΕΡΓΕΙA. Available online: https://www.commonen.gr/en/ (accessed on 6 May 2025).
  46. Jazizadeh, F.; Afzalan, M.; Becerik-Gerber, B.; Soibelman, L. EMBED: A Dataset for Energy Monitoring through Building Electricity Disaggregation. In Proceedings of the Ninth International Conference on Future Energy Systems, Karlsruhe, Germany, 12–15 June 2018; Association for Computing Machinery: New York, NY, USA, 2018; pp. 230–235. [Google Scholar]
  47. Kolter, J.; Johnson, M. REDD: A Public Data Set for Energy Disaggregation Research. Artif. Intell. 2011, 25, 59–62. [Google Scholar]
  48. Anderson, K.D.; Ocneanu, A.; Carlson, D.R.; Rowe, A.G.; Berges, M.E. BLUED: A Fully Labeled Public Dataset for Event-Based Non-Intrusive Load Monitoring Research. 2012. Available online: https://api.semanticscholar.org/CorpusID:25397318 (accessed on 9 September 2025).
  49. Gao, J.; Giri, S.; Kara, E.C.; Bergés, M. PLAID: A public dataset of high-resoultion electrical appliance measurements for load identification research: Demo abstract. In Proceedings of the 1st ACM Conference on Embedded Systems for Energy-Efficient Buildings, Memphis, TN, USA, 3–6 November 2014; Association for Computing Machinery: New York, NY, USA, 2014; pp. 198–199. [Google Scholar]
  50. Einfalt, A.; Leitinger, C.; Tiefgraber, D.; Ghaemi, S. ADRES Concept–Micro Grids in Österreich. In Proceedings of the Internationalen Energiewirtschaftstagung an der TU Wien (IEWT), Wien, Austria, 1 January 2009. [Google Scholar]
  51. Murray, D.; Stankovic, L.; Stankovic, V. An electrical load measurements dataset of United Kingdom households from a two-year longitudinal study. Sci. Data 2017, 4, 160122. [Google Scholar] [CrossRef]
  52. Kelly, J.; Knottenbelt, W. The UK-DALE dataset, domestic appliance-level electricity demand and whole-house demand from five UK homes. Sci. Data 2015, 2, 150007. [Google Scholar] [CrossRef] [PubMed]
  53. Uttama Nambi, A.S.; Reyes Lua, A.; Prasad, V.R. Loced: Location-aware energy disaggregation framework. In Proceedings of the 2nd ACM International Conference on Embedded Systems for Energy-Efficient Built Environments, Seoul, Republic of Korea, 4–5 November 2015; pp. 45–54. [Google Scholar]
  54. Household Electricity Survey. Available online: https://www.gov.uk/government/publications/household-electricity-survey--2 (accessed on 11 August 2025).
  55. Parson, O.; Fisher, G.; Hersey, A.; Batra, N.; Kelly, J.; Singh, A.; Knottenbelt, W.; Rogers, A. Dataport and NILMTK: A building data set designed for non-intrusive load monitoring. In Proceedings of the 2015 IEEE Global Conference on Signal and Information Processing (Globalsip), Orlando, FL, USA, 14–16 December 2015; IEEE: New York, NY, USA, 2015; pp. 210–214. [Google Scholar]
  56. Barker, S.; Mishra, A.; Irwin, D.; Cecchet, E.; Shenoy, P.; Albrecht, J. Smart*: An open data set and tools for enabling research in sustainable homes. SustKDD August 2012, 111, 108. [Google Scholar]
  57. Makonin, S.; Ellert, B.; Bajić, I.V.; Popowich, F. Electricity, water, and natural gas consumption of a residential house in Canada from 2012 to 2014. Sci. Data 2016, 3, 160037. [Google Scholar] [CrossRef]
  58. Beckel, C.; Kleiminger, W.; Cicchetti, R.; Staake, T.; Santini, S. The ECO data set and the performance of non-intrusive load monitoring algorithms. In Proceedings of the 1st ACM Conference on Embedded Systems for Energy-Efficient Buildings, Memphis, TN, USA, 3–6 November 2014; Association for Computing Machinery: New York, NY, USA, 2014; pp. 80–89. [Google Scholar]
  59. Nadeem, A.; Arshad, N. PRECON: Pakistan residential electricity consumption dataset. In Proceedings of the Tenth ACM International Conference on Future Energy Systems, Phoenix, AZ, USA, 25–28 June 2019; pp. 52–57. [Google Scholar]
  60. Shin, C.; Lee, E.; Han, J.; Yim, J.; Rhee, W.; Lee, H. The ENERTALK dataset, 15 Hz electricity consumption data from 22 houses in Korea. Sci. Data 2019, 6, 193. [Google Scholar] [CrossRef] [PubMed]
  61. Pereira, L.; Quintal, F.; Gonçalves, R.; Nunes, N.J. SustData: A public dataset for ICT4S electric energy research. In Proceedings of the 2nd International Conference on ICT for Sustainability ICT4S 2014, Stockholm, Sweden, 24–27 August 2014; pp. 359–368. [Google Scholar]
  62. Hebrail, G.; Berard, A. Individual Household Electric Power Consumption; UCI Machine Learning Repository: Irvine, CA, USA, 2006. [Google Scholar]
  63. Pullinger, M.; Kilgour, J.; Goddard, N.; Berliner, N.; Webb, L.; Dzikovska, M.; Lovell, H.; Mann, J.; Sutton, C.; Webb, J.; et al. The IDEAL household energy dataset, electricity, gas, contextual sensor data and survey data for 255 UK homes. Sci. Data 2021, 8, 146. [Google Scholar] [CrossRef] [PubMed]
  64. Chavan, D.R.; More, D.S.; Khot, A.M. Iedl: Indian energy dataset with low frequency for nilm. Energy Rep. 2022, 8, 701–709. [Google Scholar] [CrossRef]
  65. Chavat, J.; Nesmachnow, S.; Graneri, J.; Alvez, G. ECD-UY, detailed household electricity consumption dataset of Uruguay. Sci. Data 2022, 9, 21. [Google Scholar] [CrossRef] [PubMed]
  66. Monacchi, A.; Egarter, D.; Elmenreich, W.; D’Alessandro, S.; Tonello, A.M. GREEND: An energy consumption dataset of households in Italy and Austria. In Proceedings of the 2014 IEEE International Conference on Smart Grid Communications (SmartGridComm), Venice, Italy, 3–6 November 2014; pp. 511–516. [Google Scholar]
  67. Hofmann, M.; Siebenbrunner, T. A rich dataset of hourly residential electricity consumption data and survey answers from the iFlex dynamic pricing experiment. Data Brief 2023, 50, 109571. [Google Scholar] [CrossRef] [PubMed]
  68. Day-Ahead Market—EnExGroup. Available online: https://www.enexgroup.gr/web/guest/markets-publications-el-day-ahead-market#! (accessed on 6 May 2025).
  69. Wang, J.; Qiu, D.; Wang, Y.; Ye, Y.; Strbac, G. Investigating the impact of demand-side flexibility on market-driven generation planning toward a fully decarbonized power system. Energy 2025, 324, 135692. [Google Scholar] [CrossRef]
  70. Qiu, D.; Dong, Z.; Ruan, G.; Zhong, H.; Strbac, G.; Kang, C. Strategic retail pricing and demand bidding of retailers in electricity market: A data-driven chance-constrained programming. Adv. Appl. Energy 2022, 7, 100100. [Google Scholar] [CrossRef]
  71. Papadaskalopoulos, D.; Strbac, G.; Mancarella, P.; Aunedi, M.; Stanojevic, V. Decentralized Participation of Flexible Demand in Electricity Markets—Part II: Application With Electric Vehicles and Heat Pump Systems. IEEE Trans. Power Syst. 2013, 28, 3667–3674. [Google Scholar] [CrossRef]
  72. Barreto, R.; Faria, P.; Silva, C.; Vale, Z. Clustering Direct Load Control Appliances in the Context of Demand Response Programs in Energy Communities. IFAC-PapersOnLine 2020, 53, 12608–12613. [Google Scholar] [CrossRef]
  73. Fernandez, E.; Hossain, M.; Nizami, M. Game-theoretic approach to demand-side energy management for a smart neighbourhood in Sydney incorporating renewable resources. Appl. Energy 2018, 232, 245–257. [Google Scholar] [CrossRef]
  74. Huang, P.; Sun, Y. A collaborative demand control of nearly zero energy buildings in response to dynamic pricing for performance improvements at cluster level. Energy 2019, 174, 911–921. [Google Scholar] [CrossRef]
  75. Good, N.; Mancarella, P. Flexibility in Multi-Energy Communities With Electrical and Thermal Storage: A Stochastic, Robust Approach for Multi-Service Demand Response. IEEE Trans. Smart Grid 2019, 10, 503–513. [Google Scholar] [CrossRef]
  76. Chronis, A.-G.; Hatziargyriou, N. The Role of Energy Communities in Enhancing Sustainability in Europe: Successes and Challenges. IEEE Energy Sustain. Mag. 2025, 1, 42–52. [Google Scholar] [CrossRef]
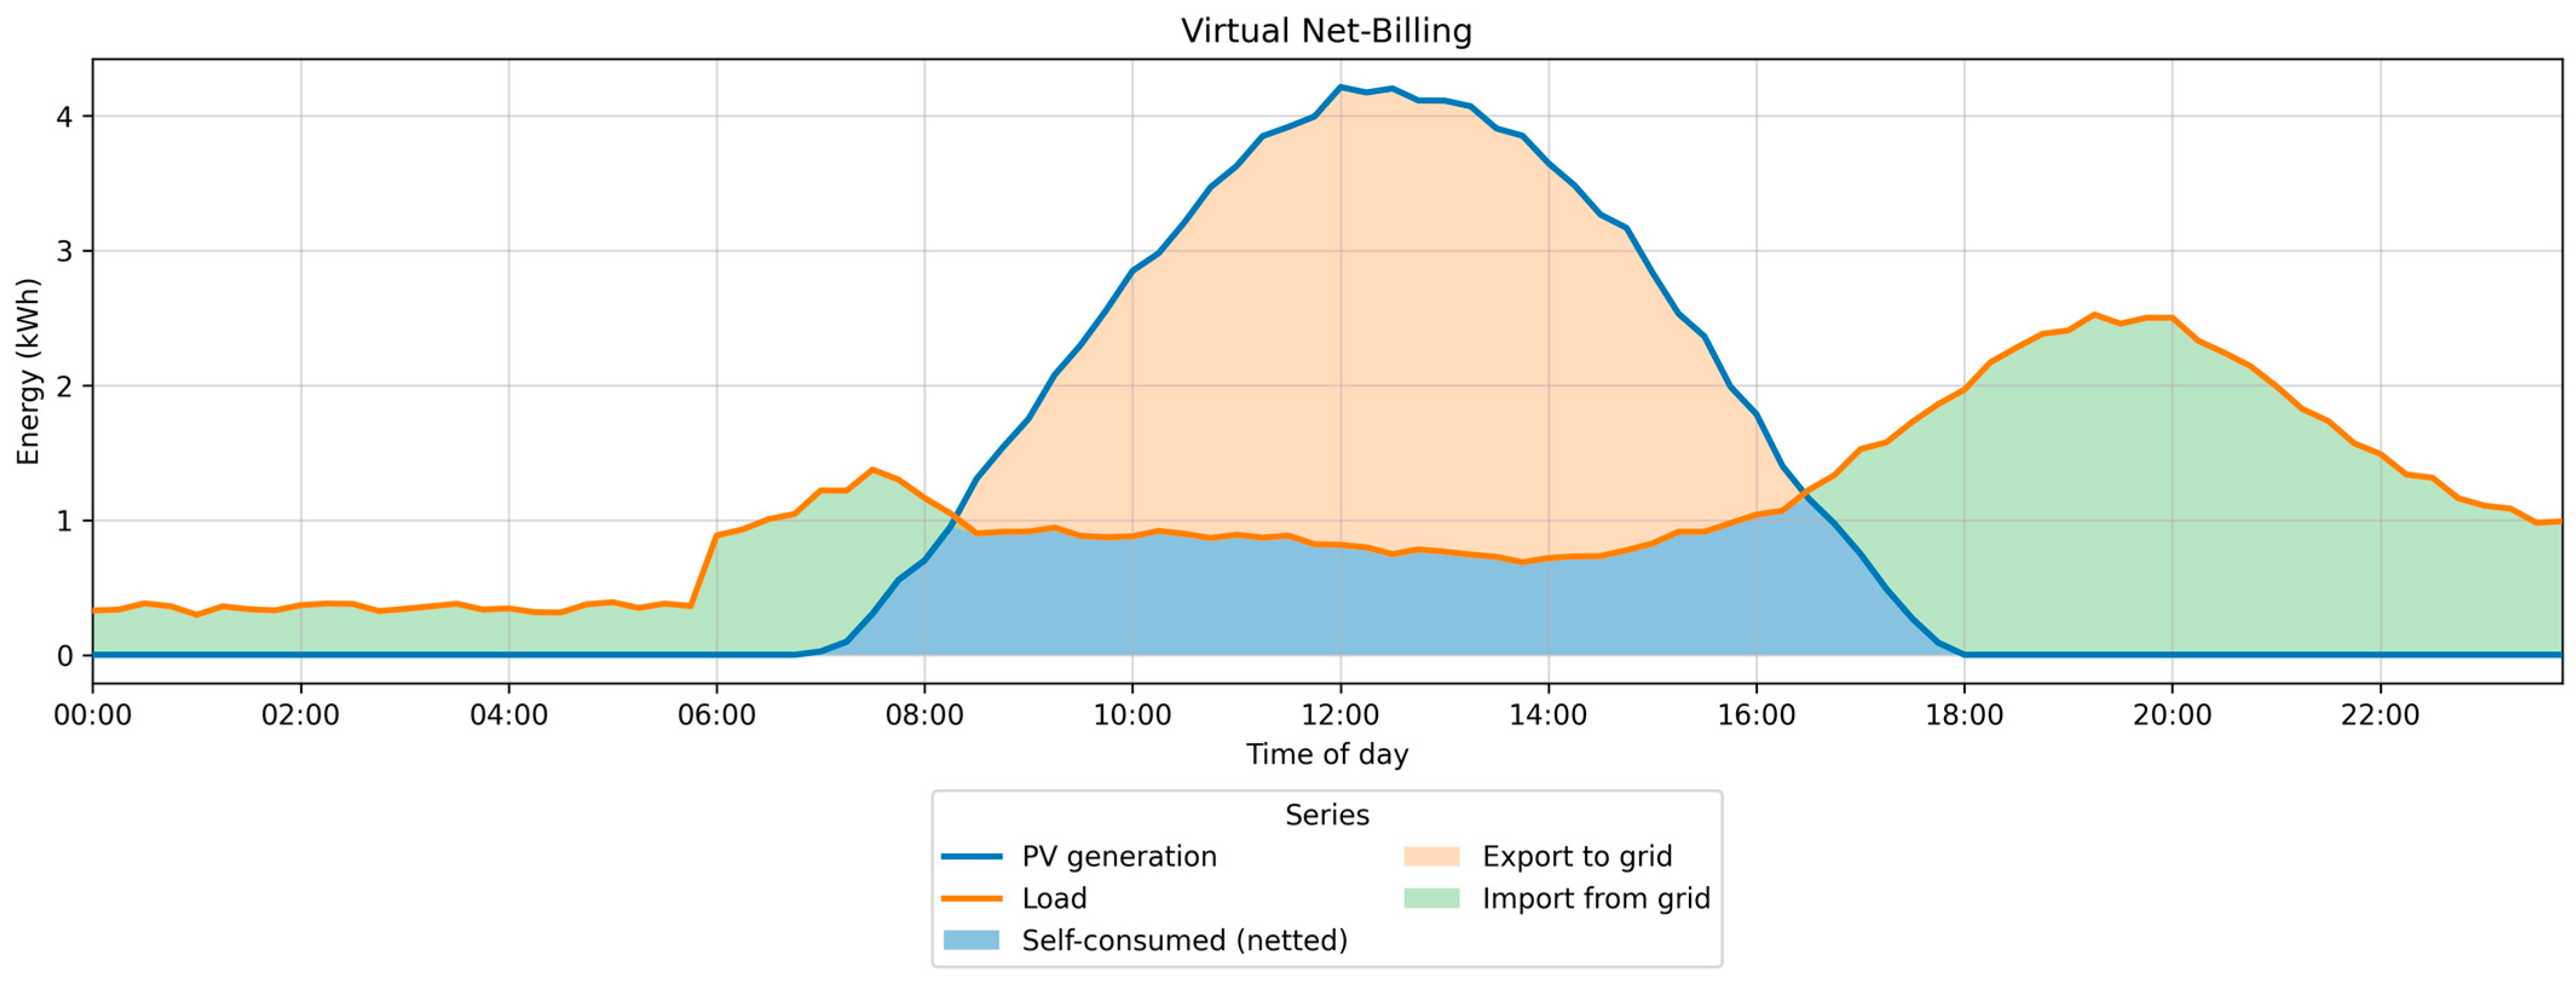
Figure 1. Virtual net-billing energy flows.
Energies 18 05082 g001
Figure 2. Average Daily Production and Consumption curves for both houses and PV parks.
Energies 18 05082 g002
Figure 3. Seasonal average hourly DAM prices in Greece in 2024.
Energies 18 05082 g003
Figure 4. Sensitivity analysis of Net Annual Cost and optimal PV capacity to Operational Expenditure (OPEX) for both houses.
Energies 18 05082 g004
Figure 5. Sensitivity analysis of Net Annual Cost and optimal PV capacity to Capital Expenditure (CAPEX) for both houses.
Energies 18 05082 g005
Figure 6. Sensitivity analysis of Net Annual Cost to annual PV degradation rate for both houses.
Energies 18 05082 g006
Figure 7. Sensitivity analysis of Net Annual Cost to maximum DR capacity for both houses.
Energies 18 05082 g007
Figure 8. Sensitivity analysis of Net Annual Cost to aggregator’s fee for both houses.
Energies 18 05082 g008
Figure 9. Average DR shifting for the Mpafra house with a DR capacity of 10%.
Energies 18 05082 g009
Figure 10. Average DR shifting for the Koutselio house with a DR capacity of 10%.
Energies 18 05082 g010
Table 1. Literature Review of PV sizing optimization studies for ECs using MILP.
ReferenceAlgorithmOptimization GoalAssetsDRCountryTemporal ResolutionRegulatory Framework
Fina et al. [25]MILPMaximize Net Present Value (NPV)PV, HVAC, BatteriesNoAustria15 min, for 1 yearBased on Austrian market
Volpato et al. [26]MILPMinimize operational costPV, Biogas ICE CHPYesItaly60 min, 3 representative daysAligned with EU directives (RED II & IEMD)
Cosic et al. [27]MILPMinimize energy cost & CO2 emissionsPV, BatteriesIndirect via dynamic pricingAustria60 min, for 1 yearCompliant with Austrian EAG (Renewable Expansion Act)—shared energy
Novoa et al. [28]MILPMinimize investment & operating cost, meet ZNE or islanding goals, avoid transformer overloadingPV, BatteriesIndirect via dynamic pricingUSA60 min, representative days via k-medoids clusteringBased on SCE utility tariffs (TOU-D-A, TOU-8-B), includes NEM and grid constraints
Hascuri et al. [29]Two MILP types (i) Original (equalities), (ii) Reduced (inequalities only)Minimize CAPEX (two MILP variants)PV, BatteriesNoMorocco360 min, for 1 yearNone indicated
Farrokhifar et al. [30]Stochastic MILPMinimize net present cost, maximize RES and storage usage, meet demand via DR and V2GPV, Wind, Batteries, EVs (V2G)YesUSA60 min, for 1 yearNone indicated
Budin & Delimar [31]Two-stage stochastic MILP with unsupervised clustering (load & uncertainty modeling)Cost reduction & limiting grid impactsPV, Shared BatteryIndirect via dynamic pricingCroatia, Germany15 min, for 1 yearRED II/RED III—Clean Energy Package, P2P trading
Kassab et al. [32]MILPMinimize total system cost (CAPEX, O&M, replacement, energy management)PV, BatteriesNoFrance60 min, for 1 yearNone indicated
Our studyMILPMinimize net investment cost (CAPEX, O&M, operation)PVYesGreece15 min, for 1 yearGreek Law 5074/2024 for virtual net-billing in ECs
Table 3. The optimization parameters and their default values.
λ R 0.15 ( / k W h )
λ A 0.0025 ( / k W h )
P m a x 8 ( k W )
c c p 850 ( / k W )
c o p 20 ( / k W )
r 2 (%)
N 20 ( y e a r s )
α 0.10
η 0.5%
Table 4. Imbalance and ΛΠ prices.
MonthImbalanceΛΠ1ΛΠ2ΛΠ3
1−0.0272.0342.1429.177
20.3351.5552.00210.029
30.9761.4563.0199.852
40.1141.3864.36510.056
5−0.4231.8442.7817.039
6−1.0801.9163.0067.398
7−0.2512.9643.4618.778
8−2.9993.1623.2699.398
9−4.9322.8964.53411.691
10−3.0462.5015.92715.430
11−2.0604.0914.38617.502
120.7793.3844.43915.560
Table 5. Variation in the parameters.
ParameterVariation for the Sensitivity Analysis
CAPEX500–1500 €/kW
OPEX10–80 €/kW
Aggregator’s fee0.001–0.005 €/kWh
DRcap0–50%
PV panel degradation rate0–2%
Table 6. Baseline cases for both houses.
ScenariosKoutselioMpafra
Optimal PV Capacity (kW)Net Cost
(€/year)
Optimal PV Capacity (kW)Net Cost
(€/year)
No PV01094.390614.82
PV8682.898429.84
PV and DR8672.338422.63
Disclaimer/Publisher’s Note: The statements, opinions and data contained in all publications are solely those of the individual author(s) and contributor(s) and not of MDPI and/or the editor(s). MDPI and/or the editor(s) disclaim responsibility for any injury to people or property resulting from any ideas, methods, instructions or products referred to in the content.