Article

Development of Low-Emission Cooking Device Based on Catalytic Hydrogen Combustion Technology

by
Alina E. Kozhukhova
*,
Stephanus P. du Preez
,
Christiaan Martinson
and
Dmitri G. Bessarabov
Hydrogen South Africa (HySA) Infrastructure, Faculty of Engineering, North-West University (NWU), Potchefstroom Campus, Private Bag X6001, Potchefstroom 2520, South Africa
*
Author to whom correspondence should be addressed.
Energies 2025, 18(19), 5074; https://doi.org/10.3390/en18195074
Submission received: 13 August 2025 / Revised: 4 September 2025 / Accepted: 10 September 2025 / Published: 24 September 2025
(This article belongs to the Section A5: Hydrogen Energy)

Abstract

The development of a prototype of a cooking device based on catalytic hydrogen combustion (CHC) is presented in this research. CHC is the catalytic reaction between hydrogen (H2) and oxygen (O2), generating heat and water vapour as the only by-product. In the developed prototype, only H2 gas is fed to the catalytic surface while air is entrained from the environment by convection (i.e., passive approach). Therefore, the convective mass transfer during the exothermic reaction between H2 and O2 allows a continuous H2/air mixture supply to the catalytic surface. In this prototype, 30 g of Pt/Al2O3 (0.5 wt% Pt) catalyst is used for the H2 combustion. The developed prototype performance was evaluated by determining its combustion temperature, H2 slip (amount of unreacted H2 in the flue gas), and flue gas composition with respect to NOx formation. Tests were performed at inlet H2 flows of 1–5 normal (N) L/min, which equates to a power output of 0.18–0.90 kW, respectively. The observed combustion temperature of the catalyst surface, determined using an IR camera, was in the range of 324.5 °C (at 1 NL/min) to 611.2 °C (at 5 NL/min). The H2 slip of <1.75 vol% was observed during CHC at 1–5 NL/min H2 flow. The maximum efficiency of 42% was determined at 1 NL/min H2 flow and a power output of 0.18 kW.

1. Introduction

About a third of the global population, estimated at approximately 2.4 billion people, have limited or no access to clean cooking fuels or technologies [1]. Instead, these people rely on solid fuels such as wood, dry animal dung, charcoal, and coal. Apart from harmful greenhouse gas (GHG) emissions that can be released during cooking using solid fuel, black carbon (or soot) particles are produced. These household air pollutants contribute to nearly 4 million premature deaths globally each year, 490,000 of which are only in sub-Saharan Africa [1,2]. In addition, the unregulated and overuse of wood for cooking causes deforestation and contributes to climate change [3,4,5,6]. Therefore, the transition towards a sustainable and clean cooking future is vitally important, presenting a need for alternative, clean fuels and technologies.
Several alternative fuels have been considered to mitigate the risks associated with cooking and heating, including biogas, liquefied petroleum gas (LPG), agricultural waste, and biomass [7,8,9,10,11]. The use of biomass such as rice husk and sawdust to produce refuse-derived fuel in the form of pellets has been demonstrated in a study by Nwaokocha and Giwa [9]. The authors stated that biomass fuel could be a good substitute for wood as cooking fuel in Nigeria. The higher heating value of 6160.7 and 7808.1 kJ/kg was determined for rice husk and sawdust, respectively. In a study by Pérez et al., agricultural waste/biomass such as peanut shells and rice husks were used to produce cooking briquettes to combust in an improved cookstove gasifier [11]. The results of the study demonstrated that the use of the briquettes and improved design of the cookstove could save fuel consumption by up to 61% and reduce cooking time by 18%, as well as contribute to wood savings by 2.05 MT/year and CO emission reductions by 41%. A stove utilising biogas for baking bread was designed in India by Kurchania et al. [12]. It was found that the biogas consumption was 1 m3 while the efficiency of the stove was approximately 44%. Although those technologies have been demonstrated, using such alternative fuels and technologies poses some technical challenges and will not eliminate the issue associated with pollutant emissions [13,14,15]. Therefore, cleaner fuel alternatives for domestic cooking and heating applications are still required.
Green hydrogen (H2) produced by water electrolysis using renewable energy sources (RESs) is globally considered an alternative energy carrier and clean and sustainable fuel for the future [16,17]. Generally, H2 is a central pillar of the energy transition required to mitigate climate change through the decarbonization of transport, industry, and domestic power use. It is widely known that replacing natural gas with H2 as fuel for spatial heating and cooking presents a distinct advantage in releasing only water vapour with limited or zero harmful exhausts such as GHG emissions and partially combusted hydrocarbons and/or soot [18,19]. However, when using H2 for open flame combustion purposes, a substantial amount of NOx emissions can be formed due to the relatively high combustion temperature of H2 [20,21]. Neither NO nor NO2 are classified as a GHG, although they play a primary role in the formation of tropospheric ozone, which is classed as a GHG. Also, elevated levels of NOx can damage the human respiratory system; for example, long-term exposure to high levels can cause chronic lung disease. In addition, NOx and SOx in the atmosphere are captured in terrestrial moisture to form nitric and sulphuric acids, therefore forming acid rain. Acid rain, along with wet and dry deposition, degrades cement and limestone as well as leaches critical soil nutrients, which adversely affects our ecosystem [22,23].
There are three ways of NOx formation: (i) thermal, (ii) fuel, and (iii) prompt. Thermal NOx is produced by the reaction of atmospheric nitrogen in the combustion air at the high temperatures associated with H2’s combustion. At the same time, fuel NOx is formed by the oxidation of nitrogen bound in the fuel molecules. Prompt NOx forms from the reaction of atmospheric nitrogen with carbon-based fuels. The type of NOx produced depends on the type of fuel. For example, the combustion of natural gas and H2 produces mostly thermal NOx, while coal produces mostly fuel NOx [22].
Catalytic hydrogen combustion (CHC, i.e., flameless) is regarded as a promising technology to minimise thermal NOx emissions and occurs according to the following equation:
2H2 (g) + O2 (g) = 2H2O (g), ∆H°298K = −483.65 kJ
Thermal NOx formation is temperature-sensitive, and its formation is significant at temperatures higher than 1200 °C, and minute at temperatures lower than 800 °C [24]. As can be seen from Equation (1), the CHC reaction is a reaction of H2 oxidation on the catalyst surface, generating heat and water vapour. Depending on the catalytic activity, CHC initiates spontaneously at room temperature or even lower (e.g., 0 °C for Pt) [3]. Comprehensive reviews on the catalyst materials and technologies have been previously carried out by Kozhukhova et al. and Kim et al. [3,25]. Typically, the combustion temperature associated with CHC is much lower than 1200 °C, which results in limited to no NOx emissions [3,25]. Another advantage of CHC is that the combustion temperature is controllable by the H2 flow, a major advantage over direct flame-based H2 combustion. Here, the higher the H2 flow, the higher the combustion temperature that can be obtained. Therefore, in applications of H2 for domestic use (e.g., cooking and spatial heating), low-temperature flameless CHC appears to be an attractive technology. Application-specific required temperatures are well below 100 °C for spatial heating and below 700 °C for cooking applications [26]. In addition, CHC-based domestic appliances can be safely used indoors as CHC does not produce smoke and soot. However, some undesirable effects, such as flashback (unwanted combustion caused by flame intrusion of the space from which the fuel/H2 was being supplied), can also occur. Moreover, at high inlet H2 concentrations, relatively high NOx formation can be observed; the inlet conditions for CHC must be fine-tuned to ensure either minimal or no NOx formation.
Some applications of CHC have been proposed: (i) driving a gas turbine for power generation [27,28,29,30], (ii) microreactors for portable power generation [31,32], and (iii) heat generation for spatial/cooking applications [3,26,33,34,35,36,37,38,39]. There are two main approaches for supplying fuel to the combustion area: diffusion (non-pre-mixed) and pre-mixed. In the case of the diffusion CHC, air and fuel (i.e., H2) are injected independently before the combustion reaction [28]. The diffusion approach has been previously demonstrated for heat generation applications [26,33,34,35,36]. In a study by Großmann et al., the portable H2 cooker with a hydride storage was developed. The H2 flow of up to 500 L/h was obtained from 5 kg Hydralloy C2 metal hybrid storage. A power output of 1.5 kW (1.0 kW excluding heat losses) was obtained during portable cooker operation [33]. A water heater based on a diffusion approach was developed by Pangborn. A thermal efficiency of 80% was obtained [36]. In a study by Fumey et al., a diffusion catalytic burner was designed. The catalytic burner could be operated with H2 flow of 5, 10, and 15 L/min, which was equal to a power of 0.9, 1.8, and 2.7 kW, respectively. The combustion temperature was in a range of 522–715 °C. An additional safety feature was introduced to the catalytic burner to prevent flashback. The H2 and air supplies were separated by a SiC diffuser disc, thereby providing a lack of air below the disc where H2 was supplied, leading to a reduced flashback probability [26]. A recent study by Mordarski et al. reported the development of a heat generator for water heating applications based on low-temperature H2 combustion. The system was tested at H2 flow rates of 5.5 and 8.0 L/min with a constant air flow of 110 L/min, while the water was supplied via a peristaltic pump at 0.3 and 0.6 L/min. The results demonstrated that increasing the inlet H2 flow to 8.0 L/min resulted in a higher thermal power; however, it also led to higher heat losses when compared to 5.5 L/min H2 flow [40].
The pre-mixed CHC has been studied to a limited extent [41,42]. In a study by Choi et al., the combustion characteristics of H2/air-premixed gas were studied in a millimetre scale (10.0 mm × 10.0 mm × 1.5 mm) catalytic combustor. A H2 conversion of approximately 95% was obtained during operation at 338 mL/min [41]. Mori et al. studied CHC reaction using H2/air (2–7 mol% H2) premixed gas mixtures at 2–4 m/s flow velocity. The authors found that the H2 slip (amount of unreacted H2 in the flue gas) on the surface of the Pt catalyst plate (20 mm × 40 mm) was 2–3 mol% when the inlet H2 concentration was 6 mol% and 1–2 mol% when the inlet H2 concentration was 4 mol%. The authors have also determined that the Pt plate catalyst had low catalytic activity and had to be preheated to 127 °C prior to each test [42]. Conventional combustion of the premixed H2/air mixtures is typically used in industrial sectors, such as large-scale gas turbines, and may increase the likelihood of flashbacks [25,28].
The present research presents a prototype of a cooking device based on CHC technology, designed for cooking and heating applications. A proton-exchange membrane (PEM) electrolyser coupled with solar energy was used for on-site green H2 production, and was used to evaluate the developed cooking device. For air supply, a diffusion/passive approach was applied. The developed cooking device was evaluated by determining its combustion temperature, H2 slip, and NOx emissions. Lastly, the efficiency of the cooking device at the H2 flow of 1–5 NL/min was determined.

2. Experimental

2.1. Cooking Device Design

The design of the cooking device is based on findings from our previous research [43,44,45,46,47]. The cooking device consists of three sections: (i) H2 supply section, (ii) mixing section including the gas flow distributor, and (iii) catalytic combustion section. The schematic and the photograph of the prototype of the cooking device are presented in Figure 1.
The diameter of the cooking device is 10 cm, and the height is 11 cm, including the device’s supporting legs. H2 is supplied to the cooking device via an intelligent mass flow controller (DPC 17, Aalborg, Orangeburg, NY, USA). As soon as H2 is introduced, the temperature of the catalyst surface increases due to a heterogeneous catalytic reaction between H2 and O2. This, in turn, results in the convective heat transfer of the supplied gas and ambient air due to the formation of the temperature gradient. The ambient air can, therefore, be entrained by the convection (i.e., passive approach) from the bottom of the device, below the H2 supply section (i), ensuring continuous CHC reaction. In this work, control of the air supply was limited due to the passive approach and could only be regulated by the H2 flow and convection. A sintered titanium fine grid (i.e., gas flow distributor) was fixed between sections (i) and (ii) to obtain uniform gas flow distribution in the mixing section (ii). Thereafter, the gas flow mixture reaches the catalyst surface in section (iii) of the cooking device, where CHC occurs. The heat generated during the reaction can, therefore, be used for cooking applications.
The catalyst used during the evaluation of the cooking device was 0.5 wt% Pt/Al2O3 spheres. The total weight of 30 g of the catalyst was placed on the catalyst holder inside section (iii) of the cooking device. Therefore, a total of approximately 0.15 g of Pt was used during the evaluations. The preparation of the Pt/Al2O3 has been described elsewhere [48].
The cooking device is facilitated with automatic flashback arrestors (E460, African Oxygen Ltd., Johannesburg, South Africa). In the case of any unwanted ignition, the additional safety feature prevents the transmission of a flashback from the H2 inlet pipe into the H2 supply facility connected upstream. However, considering that the H2 inlet gas is of high purity and O2 is not present in the H2 supply, the risk of flame propagation is mitigated.

2.2. Experimental Setup

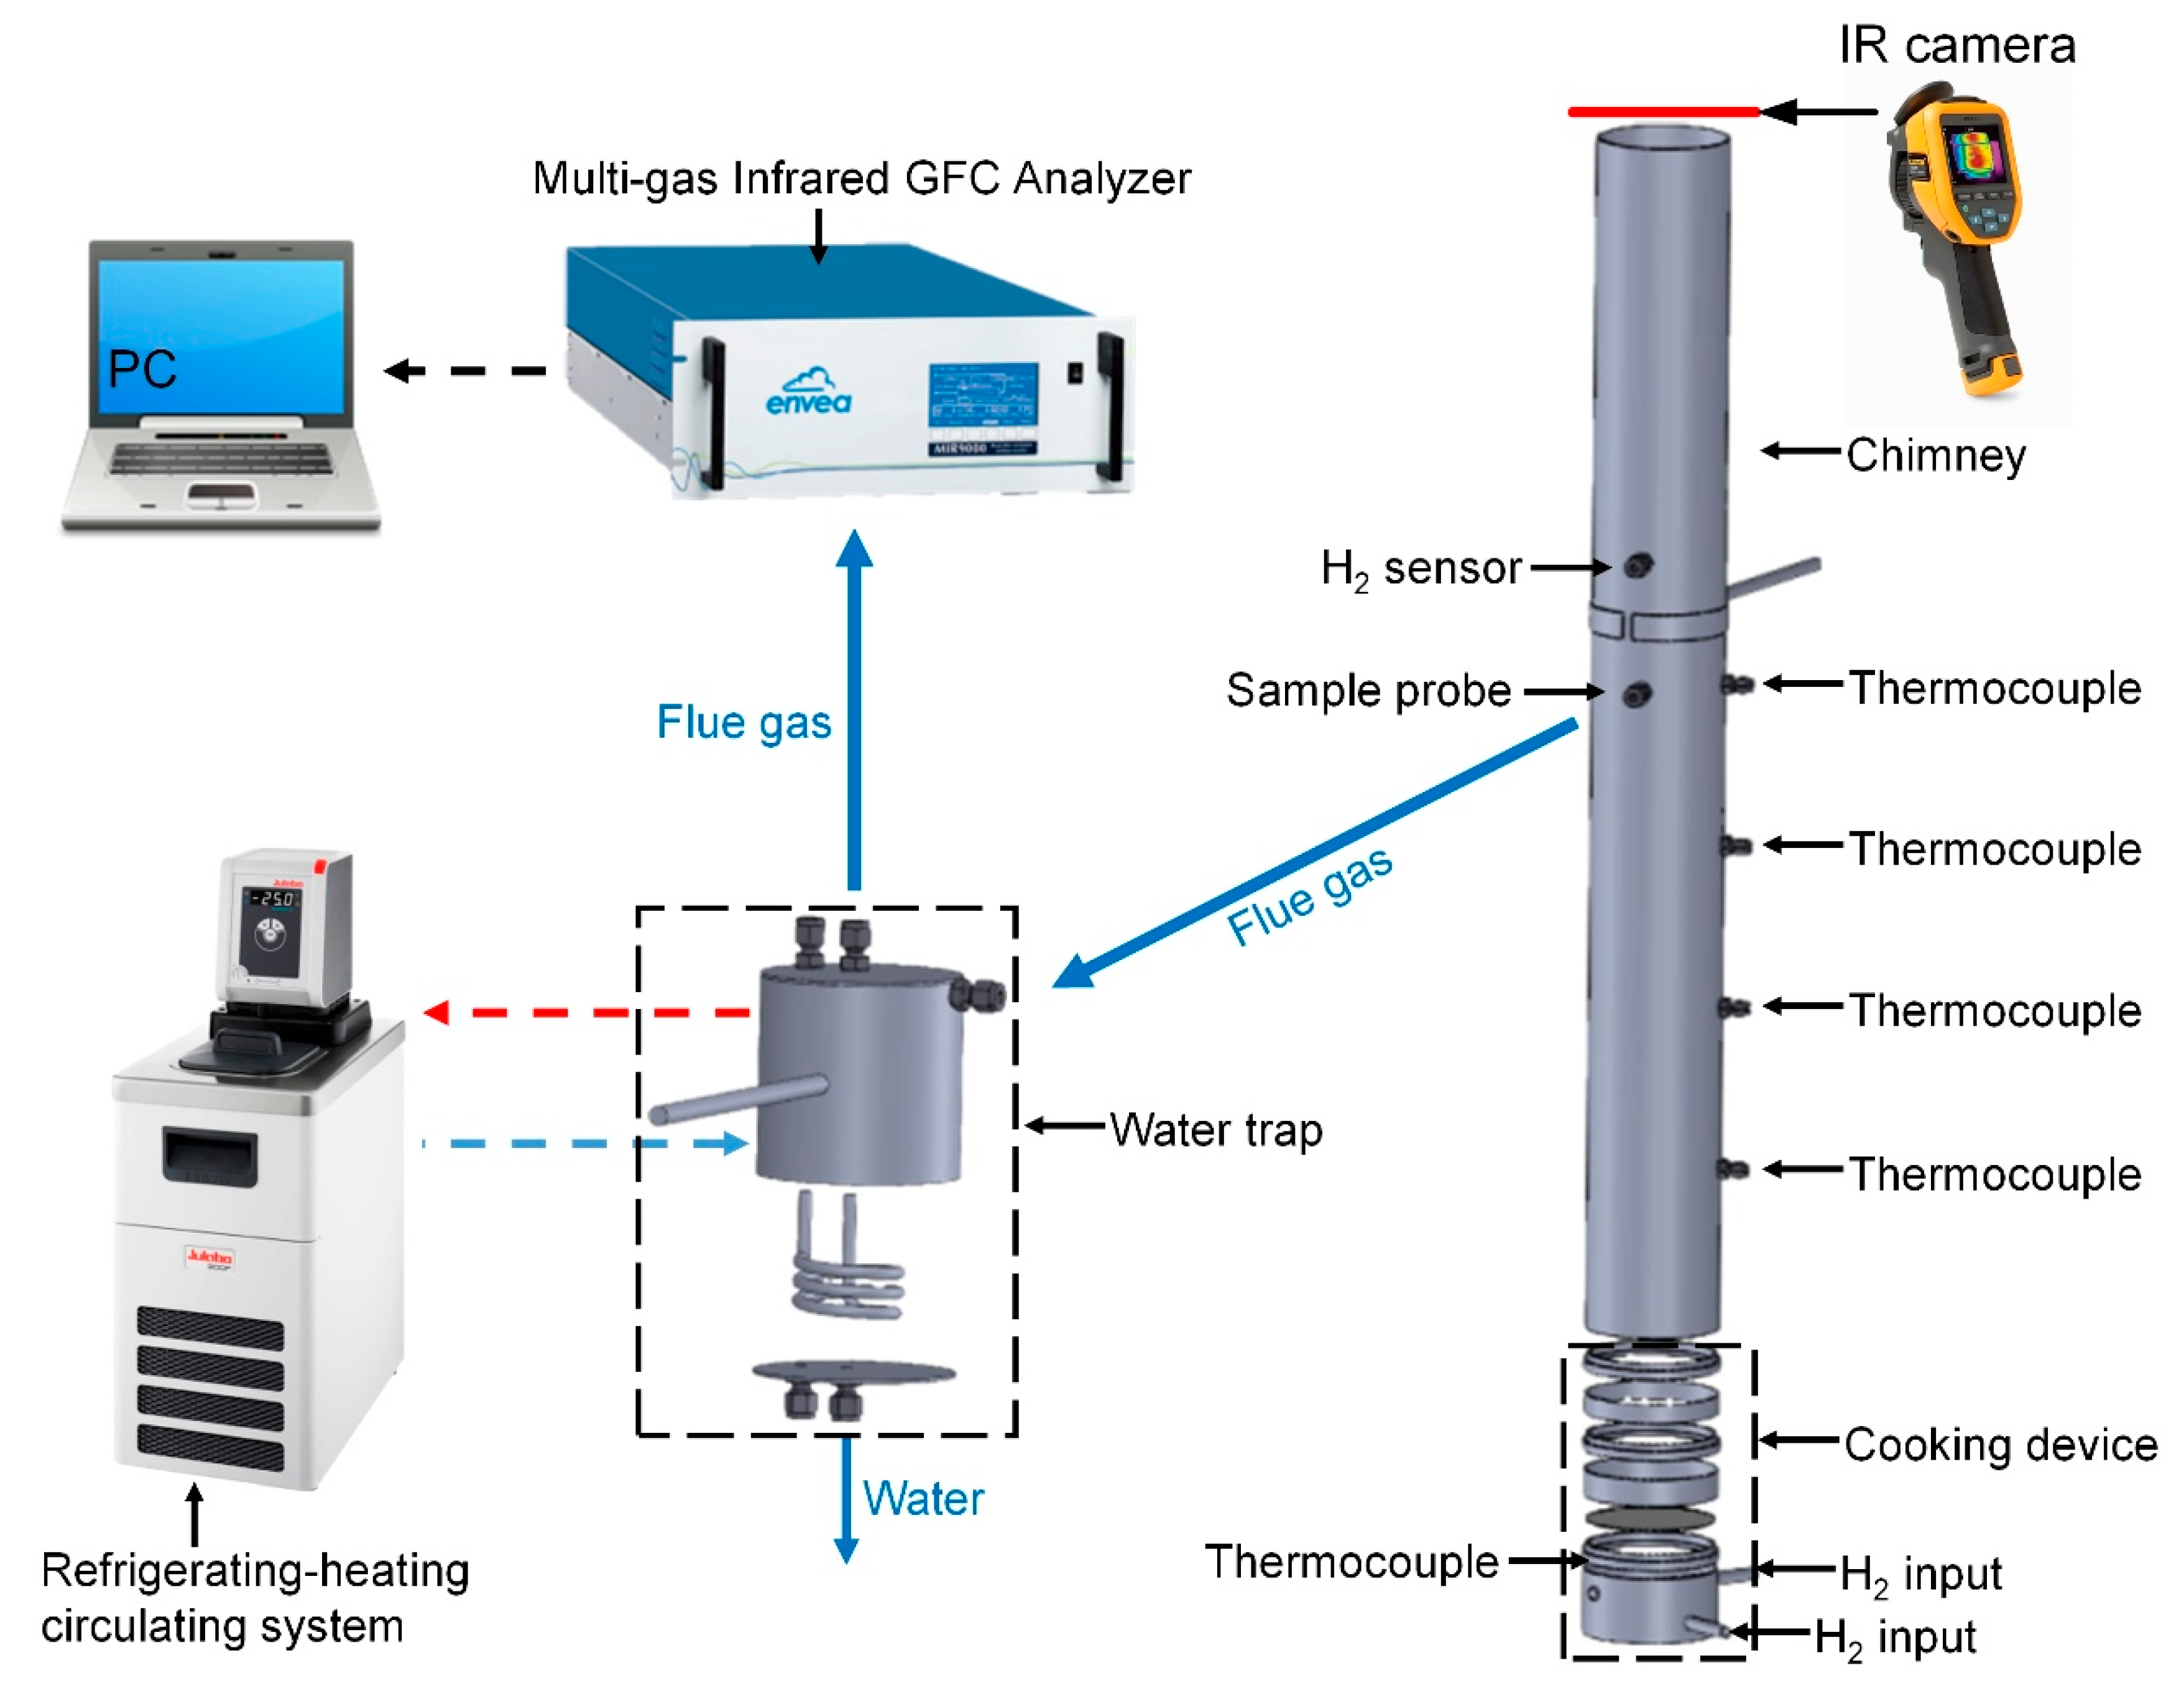
The cooking device was evaluated by determining its combustion temperature, H2 slip, and flue gas emissions. For this purpose, the following experimental setup was assembled (Figure 2).
Figure 2 shows the schematic of the experimental setup used for the evaluation of the flue gas during the operation of the cooking device. A stainless-steel tube (chimney) of 90 cm in length and 10 cm in diameter was placed on the cooking device top to cover the entire catalytic surface, collect the flue gas, and prevent flue gas dilution by ambient air. The chimney top is open-ended to allow the exit of the flue gas. The temperature distribution of the flue gas was measured along the chimney length; four K-type thermocouples were placed inside the chimney every 12.5 cm (i.e., 12.5, 25, 37.5, and 50 cm above the catalytic surface) to determine sample probe location. The temperature of the catalyst surface (i.e., combustion temperature) was determined using an infrared (IR) camera (TiS75+, Fluke, Everett, WA, USA). The IR camera was positioned parallel to the catalyst surface above the chimney at a distance of approximately 0.9 m, which was also set in the IR camera settings.
The temperature measured by the IR camera is determined by the actual temperature of the object and its emissivity. For example, the emissivity of Pt and oxidized Pt ranges between 0.93 and 0.97 and 0.07 and 0.11, while the emissivity of aluminum oxide is 0.40. The catalyst used in the present work is Pt/Al2O3; typically, Pt is present on the surface of the Al2O3 support in the form of metallic Pt (approximately 62%) and PtOx (approximately 28%) [46]. In the present work, the emissivity of the catalyst surface was determined from the temperatures determined by the K-type thermocouple and compared with the temperatures determined by the IR camera. For this purpose, a K-type thermocouple was installed inside the catalytic combustion section (iii), positioned in direct contact with the catalyst. The emissivity was, therefore, adjusted to achieve a ±1% difference between the measured temperatures. The emissivity of the catalyst surface was determined to be 0.85 and was used throughout all combustion temperature measurements. The accuracy of the IR camera measurements is ±2 °C.
The sample probe was allocated inside the chimney, 50 cm above the catalytic surface, where the temperature of the flue gas was determined to be 50–70 °C. The sample probe allowed the extraction of the flue gas from the exhaust stream. Next, the extracted flue gas sample passed through the water trap. The water trap is connected to a refrigerating-heating system (CORIO CD-200F, Julabo, Seelbach, Germany), allowing cooling of the water trap and consequent condensation of the water vapour in the flue gas sample. Thereafter, the gas sample was analyzed using a multi-gas infrared analyzer (MIR 9000 CLD, ENVEA, Poissy, France) utilizing the gas filter correlation (GFC) technique. The analyzer calculates the amount of NO2 from NOx and NO values as NO2 = NOx − NO. The calibration procedure was performed using gas mixtures of 280 ppm ± 2% NO2 in N2 and 2700 ppm ± 2% NO in N2 (Speciality Gases SA, Roodepoort, South Africa). The calibration was performed according to the MIR 9000 instrument manual through the reference zero and gas standard calibration sequence.
The flue gas H2 content was measured using a 0–100 vol% H2 sensor (NEO986A, NEO Hydrogen Sensors GmbH, Neuss, Germany). The NEO986A H2 sensor has been factory calibrated. The sensor was placed 60 cm above the catalyst surface inside the chimney. All above-mentioned temperature and hydrogen concentration signals are accumulated with an NI 9214 data-acquisition (DAQ) instrument (National Instruments, Austin, TX, USA). The H2 and temperature measurements were logged every 1 s, using LabVIEW software (2018, Version 18.0f2).

2.3. Evaluation Procedure

The cooking device is operated with H2 flows of 1–5 NL/min, equal to a power of 0.18–0.90 kW. The power was calculated with respect to the H2 volumetric flow, multiplied by the lower heating value of H2 of 33.3 kWh/kg or 3.0 kWh/Nm3. During the evaluation procedure, the IR mapping of the catalyst surface, as well as the H2 slip and NOx concentrations, were taken at inlet H2 flows of 1–5 NL/min. After each test, the cooking device was allowed to cool to room temperature to have similar starting conditions for all tests. The duration of each test was 30 min.
The equilibrium amounts of NOx, i.e., NO and NO2, and N2O formation during H2 combustion were modelled using the thermodynamic modelling software package HSC 10 [49]. The BAL module was used to calculate the adiabatic combustion temperatures at the various normalized air-to-fuel ratios (Λ). The GEM module was used for the calculations predicting the formation of the N–O species during CHC. All other thermodynamic calculations indicated were determined using the REA module. For all calculations, pure substances were used.
The Λ was defined as follows [24]:
Λ = 1 Φ = ( F A ) s t o i c ( F A )
where Φ is the equivalence ratio, ( F A ) s t o i c = 2 for Equation (1), and ( F A ) is the actual fuel-to-air ratio.

3. Results and Discussion

3.1. Combustion Temperature

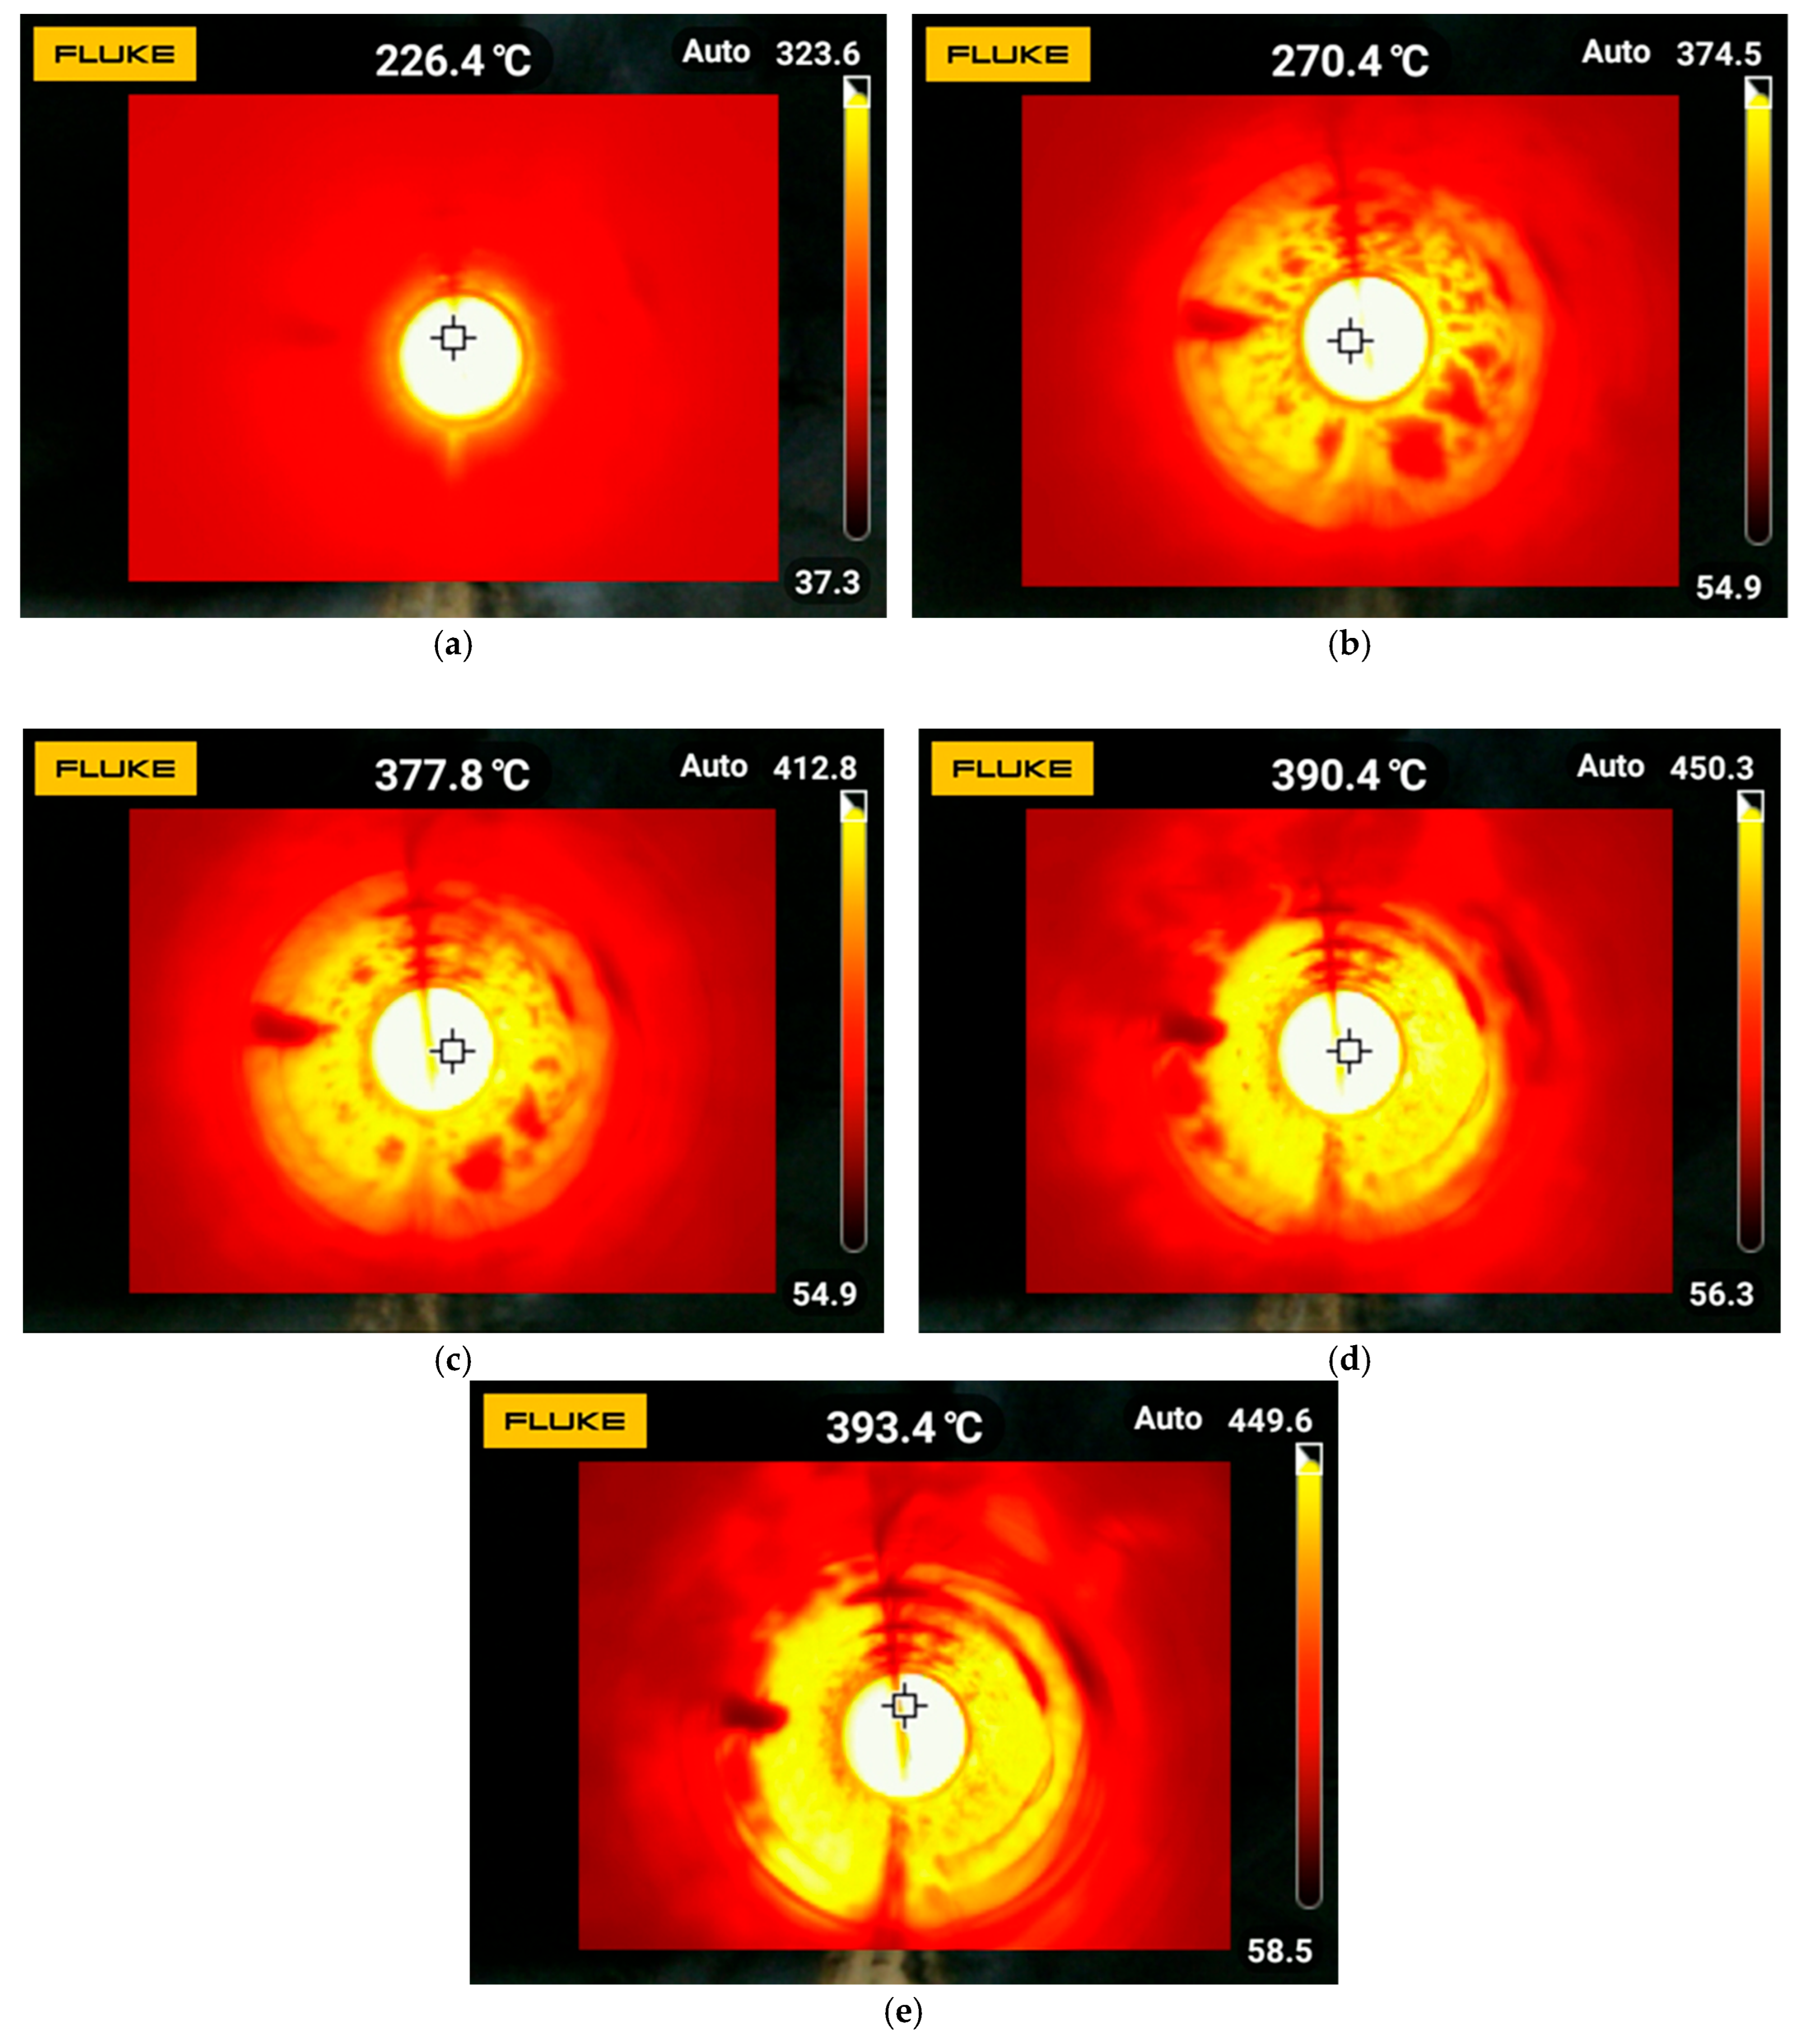
The combustion temperature on the catalyst surface was determined from the temperature mapping taken by the IR camera 0.9 m above the catalyst surface. The temperature was allowed to stabilize for 20 min after setting the H2 flow and before taking an image of the catalyst surface. Figure 3 presents the IR images taken while operating the cooking device at inlet H2 flows of 1–5 NL/min. The ambient temperature in this set of experiments was determined to be 28–29 °C. In the IR temperature mapping images, the value displayed in the upper right corner represents the maximum temperature within the field of view, while the value shown at the top centre corresponds to the spot temperature measured at the crosshair (centre box). The shadow observed stretching from the side wall towards the centre is a thermocouple.
In Figure 3, the IR region is presented on a colour scale, with dark red and yellow representing low and high temperatures, respectively. In this case, the yellow colour can only be observed on the catalytic surface where the CHC reaction occurs (Figure 3a–e) and on the chimney walls (Figure 3b–e). The temperature measured by the IR camera is determined by the actual temperature of the object and its emissivity. For example, the emissivity factor for the catalyst surface is 0.85, while shiny surfaces such as stainless steel have a factor of 0.1. The temperature of surfaces with an emissivity factor of <0.6 is difficult to determine reliably. The chimney was made of stainless steel polished/reflective material (emissivity factor 0.1) that does not radiate IR energy well. Therefore, the yellow colour that appeared on the chimney surface was likely related to the water vapour condensation on the chimney walls.
It can be seen from Figure 3 that the combustion temperature distribution on the catalyst surface was uniform. The black line in the middle of the surface observed in the IR images was the thermocouple placed inside the chimney to determine the flue gas temperature (refer to Section 2.2). It is further seen that the combustion temperature increased with increasing the inlet H2 flow except for the inlet H2 flow of 5 NL/min, where the combustion temperature remained relatively unchanged. The maximum determined combustion temperatures were 323.6 ± 6.5, 374.5 ± 7.5, 412.8 ± 8.3, 450.3 ± 9.0, and 449.6 ± 9.0 °C at inlet H2 flows of 1, 2, 3, 4, and 5 NL/min, respectively.
The fact that the combustion temperature remained relatively unchanged when the inlet H2 flow was increased from 4 to 5 NL/min was likely related to the insufficient air supply on the catalytic surface [35]. Depending on the type of fuel and application, combustion performance varies with the air-to-fuel ratio and type of gas mixture (lean, stoichiometric, or rich). In the present research work, air was introduced to the catalytic surface through convection (passive approach), which limited the control of the air-to-fuel ratio. However, it is likely that an insufficient amount of air was entrained by the convection to the catalytic surface at the 5 NL/min H2 flow, resulting in incomplete combustion. Also, the effect of the chimney has to be taken into account; it is possible that increased gas flow rates of the entrained air would occur at higher inlet H2 flows due to greater temperature and moisture differences between inlet and outlet gases. However, this also accelerates gas flow rates, thereby resulting in a shorter residence time of the H2 fuel on the catalytic surface and, consequently, in lower combustion temperatures.
To at least partially evaluate the amount of entrained air during operation of the cooking device, the thermodynamic modelling software package HSC 10 was applied. This was achieved by simulating the CHC at various Λ under adiabatic conditions, i.e., reaction heat is not transferred to the surroundings. Figure 4 shows the effect of Λ on the adiabatic temperature, as well as the amount of excess H2, O2, and the amount of N2 present as a function of Λ. Equation (1) was used to determine the adiabatic temperature.
The excess H2, O2, and amount of N2 were calculated based on the amount of H2 and O2 required for the reaction. For instance, as per the stoichiometric ratio, 1 mol O2 participates in the reaction, and the corresponding moles of N2 were determined, assuming a partial pressure of nitrogen (PN2) of 0.78 atm. Excess O2 was calculated as the total O2 available from the air minus 1 mole required to react with 2 moles of H2.
Figure 4 shows the increase and subsequent decrease in adiabatic temperature as a function of Λ over a range from 0.03 (corresponding to H2-rich conditions) to 32 (corresponding to H2-lean conditions). As Λ increased from 0.03 to 1, the adiabatic temperature increased from 268 to a peak value of 2260 °C, followed by a decrease to 119 °C at Λ = 32. As can be seen, the maximum adiabatic temperature can be reached when using the stoichiometric amount of air (Λ = 1), which is the minimum theoretical quantity needed to completely burn the fuel (i.e., H2) according to Equation (1). The initial temperature increase before the stoichiometric amount can be ascribed to the increasing availability of H2 as a fuel, promoting the CHC reaction. The subsequent decrease in temperature is ascribed to heat loss due to the excess O2 and N2 [50].
Based on this, it was estimated that Λ for the combustion temperature ranging from 323 to 450 °C presented in Figure 3 was either approximately 0.04–0.06 (H2-rich; in a case where an insufficient amount of air was entrained) or within the range of 7.8–8.2 (H2-lean; elevated amount of entrained air and increased gas flow rates due to the chimney effect). It should be noted that the catalytic combustion of lean H2/air mixtures can result in superadiabatic surface temperatures due to the low Lewis number of H2 (Le ≈ 0.3) [32,51]. However, in the present study, significant conductive (e.g., heat transfer through the catalyst into the device housing), convective (e.g., heat displacement via gas transport along the setup), and radiative (e.g., heat emission from the catalyst surface to the surroundings) heat losses, together with the increased gas flow rates due to the chimney effect, reduced the catalyst surface temperature well below the theoretical superadiabatic values. As a result, the IR-measured surface temperatures reported here should be regarded as relative indicators of combustion intensity rather than direct measures of the inlet H2/air compositions.
Nevertheless, to confirm the expected Λ range and to further assess the performance of the cooking device, H2 slip and residual O2 concentrations were measured during its operation at each examined H2 flow. These results are presented in the following section.

3.2. H2 Slip and O2 Concentration

H2 slip is referred to as the amount of H2 that passes through the catalytic surface without being oxidized [35]. H2 slip is an important characteristic of an H2-powered cooking device—it assures safe device operation. Elevated H2 slip may result in the accumulation of explosive H2/air mixtures in enclosed spaces. It is widely known that H2 forms explosive mixtures with air over a wide range of H2 concentrations (4–75 vol%) [3]. In the event that an H2 autoignition temperature (i.e., approximately 585 °C) is reached, an unwanted ignition of these mixtures may occur. Nonetheless, in practice, H2 autoignition is a complex process and depends on various factors such as reactor design, wall temperature, and pressure [52,53]. In addition, it has been demonstrated that catalytically produced water inhibits homogeneous combustion of H2/air mixtures [53]. Nevertheless, elevated H2 slip will result in fuel waste as well as the thermal inefficiency of the cooking device. Therefore, it is important to control H2 slip during the operation of the cooking device.
In the present research work, H2 slip and O2 concentration were measured at each examined H2 flow (i.e., 1, 2, 3, 4, and 5 NL/min). Table 1 shows the H2 slip values and O2 concentration determined during operation of the developed cooking device. Inlet H2 concentrations were determined using a H2 sensor below the catalytic combustion section (iii). The concentrations of O2 in the flue gas extracted through the sample probe inside the chimney were determined using the IR analyzer. The concentration of O2 in the ambient air was determined to be 19.7 ± 0.1%.
As can be seen from Table 1, inlet H2 flows of 1, 2, 3, 4, and 5 NL/min corresponded to 12.4, 25.8, 34.8, 41.9, and 47.9 vol% H2 in air, respectively. According to Equation (1), the stoichiometric composition for H2 combustion in air is approximately 29.5 vol% H2. Based on the measured inlet compositions in Table 1, and assuming that the balance gas was ambient air, the mixtures obtained at 1 and 2 NL/min can therefore be classified as H2-lean. In contrast, those obtained at 3–5 NL/min can be classified as H2-rich.
The H2 slip values determined during cooking device operation were 0.04, 1.04, 3.58, 8.05, and 12.17 vol% at inlet H2 flows of 1, 2, 3, 4, and 5 NL/min, respectively. It can also be seen from Table 1 that the O2 concentration decreased as the inlet H2 flow increased from 1 to 5 NL/min. It was determined that O2 concentration decreased from 14.5 ± 0.3 to 6.3 ± 0.8% at the inlet H2 flow of 1 and 5 NL/min, respectively.
It can also be seen from Table 1 that nearly complete combustion occurred at the inlet H2 flows of 1 and 2 NL/min, corresponding to H2-lean mixtures, as the H2 slip remained at or below 1 vol%. At the inlet H2 flow of 2 NL/min, the inlet gas mixture was close to stoichiometric (25.8 vol% H2 in air); however, the elevated O2 concentration in the flue gas (10.5 vol%) suggests increased gas flow rates of the entrained air caused by the chimney effect. This additional air flow likely lowered the observed combustion temperature on the catalyst surface by reducing the residence time of the reactants on the catalyst surface, implying that the actual combustion temperature would be considerably higher in the absence of the chimney.
At higher inlet H2 flows (>3 NL/min, corresponding to H2-rich mixtures), O2 was significantly reduced but still present in the flue gas while the H2 slip increased. This indicates that the amount of entrained air was insufficient to achieve complete combustion of the H2 fuel. Besides the H2-rich inlet gas compositions and increased gas flow rates due to the same chimney effect, restrained additional air flow from the top may have contributed to O2 starvation under these conditions.
Based on the results presented in Figure 3 and Figure 4 and Table 1, the actual Λ was likely in the range of 0.04–0.06 for inlet H2 flows of 1–2 NL/min, and 7.8–8.2 for the inlet H2 flows of 3–5 NL/min. In addition, the chimney effect resulted in increased gas flow rates at all studied inlet H2 flows, leading to shorter residence times of the H2 fuel and, consequently, lower combustion temperatures.
Nonetheless, the results presented in the present section indicate that an inlet H2 flow of 2 NL/min is considered a suitable H2 flow for the cooking device, given the minute H2 slip of 1.04 vol% and a combustion temperature of 374.5 °C. However, taking into account that the H2 slip of 3.58 vol% determined at the inlet H2 flow of 3 NL/min, which is lower than 4 vol% required for H2 autoignition, the inlet H2 flow of 3 NL/min could be considered ideal, as the combustion temperature was 412.8 °C (that is lower than the autoignition temperature of 585 °C).

3.3. NOx Analysis

It is important to monitor gas emissions released during the combustion of fuels. According to the EU Commission’s regulation, emissions of NOx from fuel boiler space heaters and fuel boiler combination heaters using gaseous fuels should not exceed 56 mg/kWh fuel input (approximately 31.8 ppm) [54]. Yet, typical values in flue gas for oil/gas systems are 50–100 ppm. It is widely known that the combustion of H2 is advantageous over the combustion of natural gas as it releases only water vapour, without any harmful exhausts such as CO2, CO, unburned hydrocarbons, and soot. However, previous research has shown that the direct flame H2 combustion in air produces a substantial amount of NOx due to a high combustion temperature, i.e., 2259 °C [3,21]. When combusting H2 catalytically, only traces of NOx are produced due to lower combustion temperatures [26].
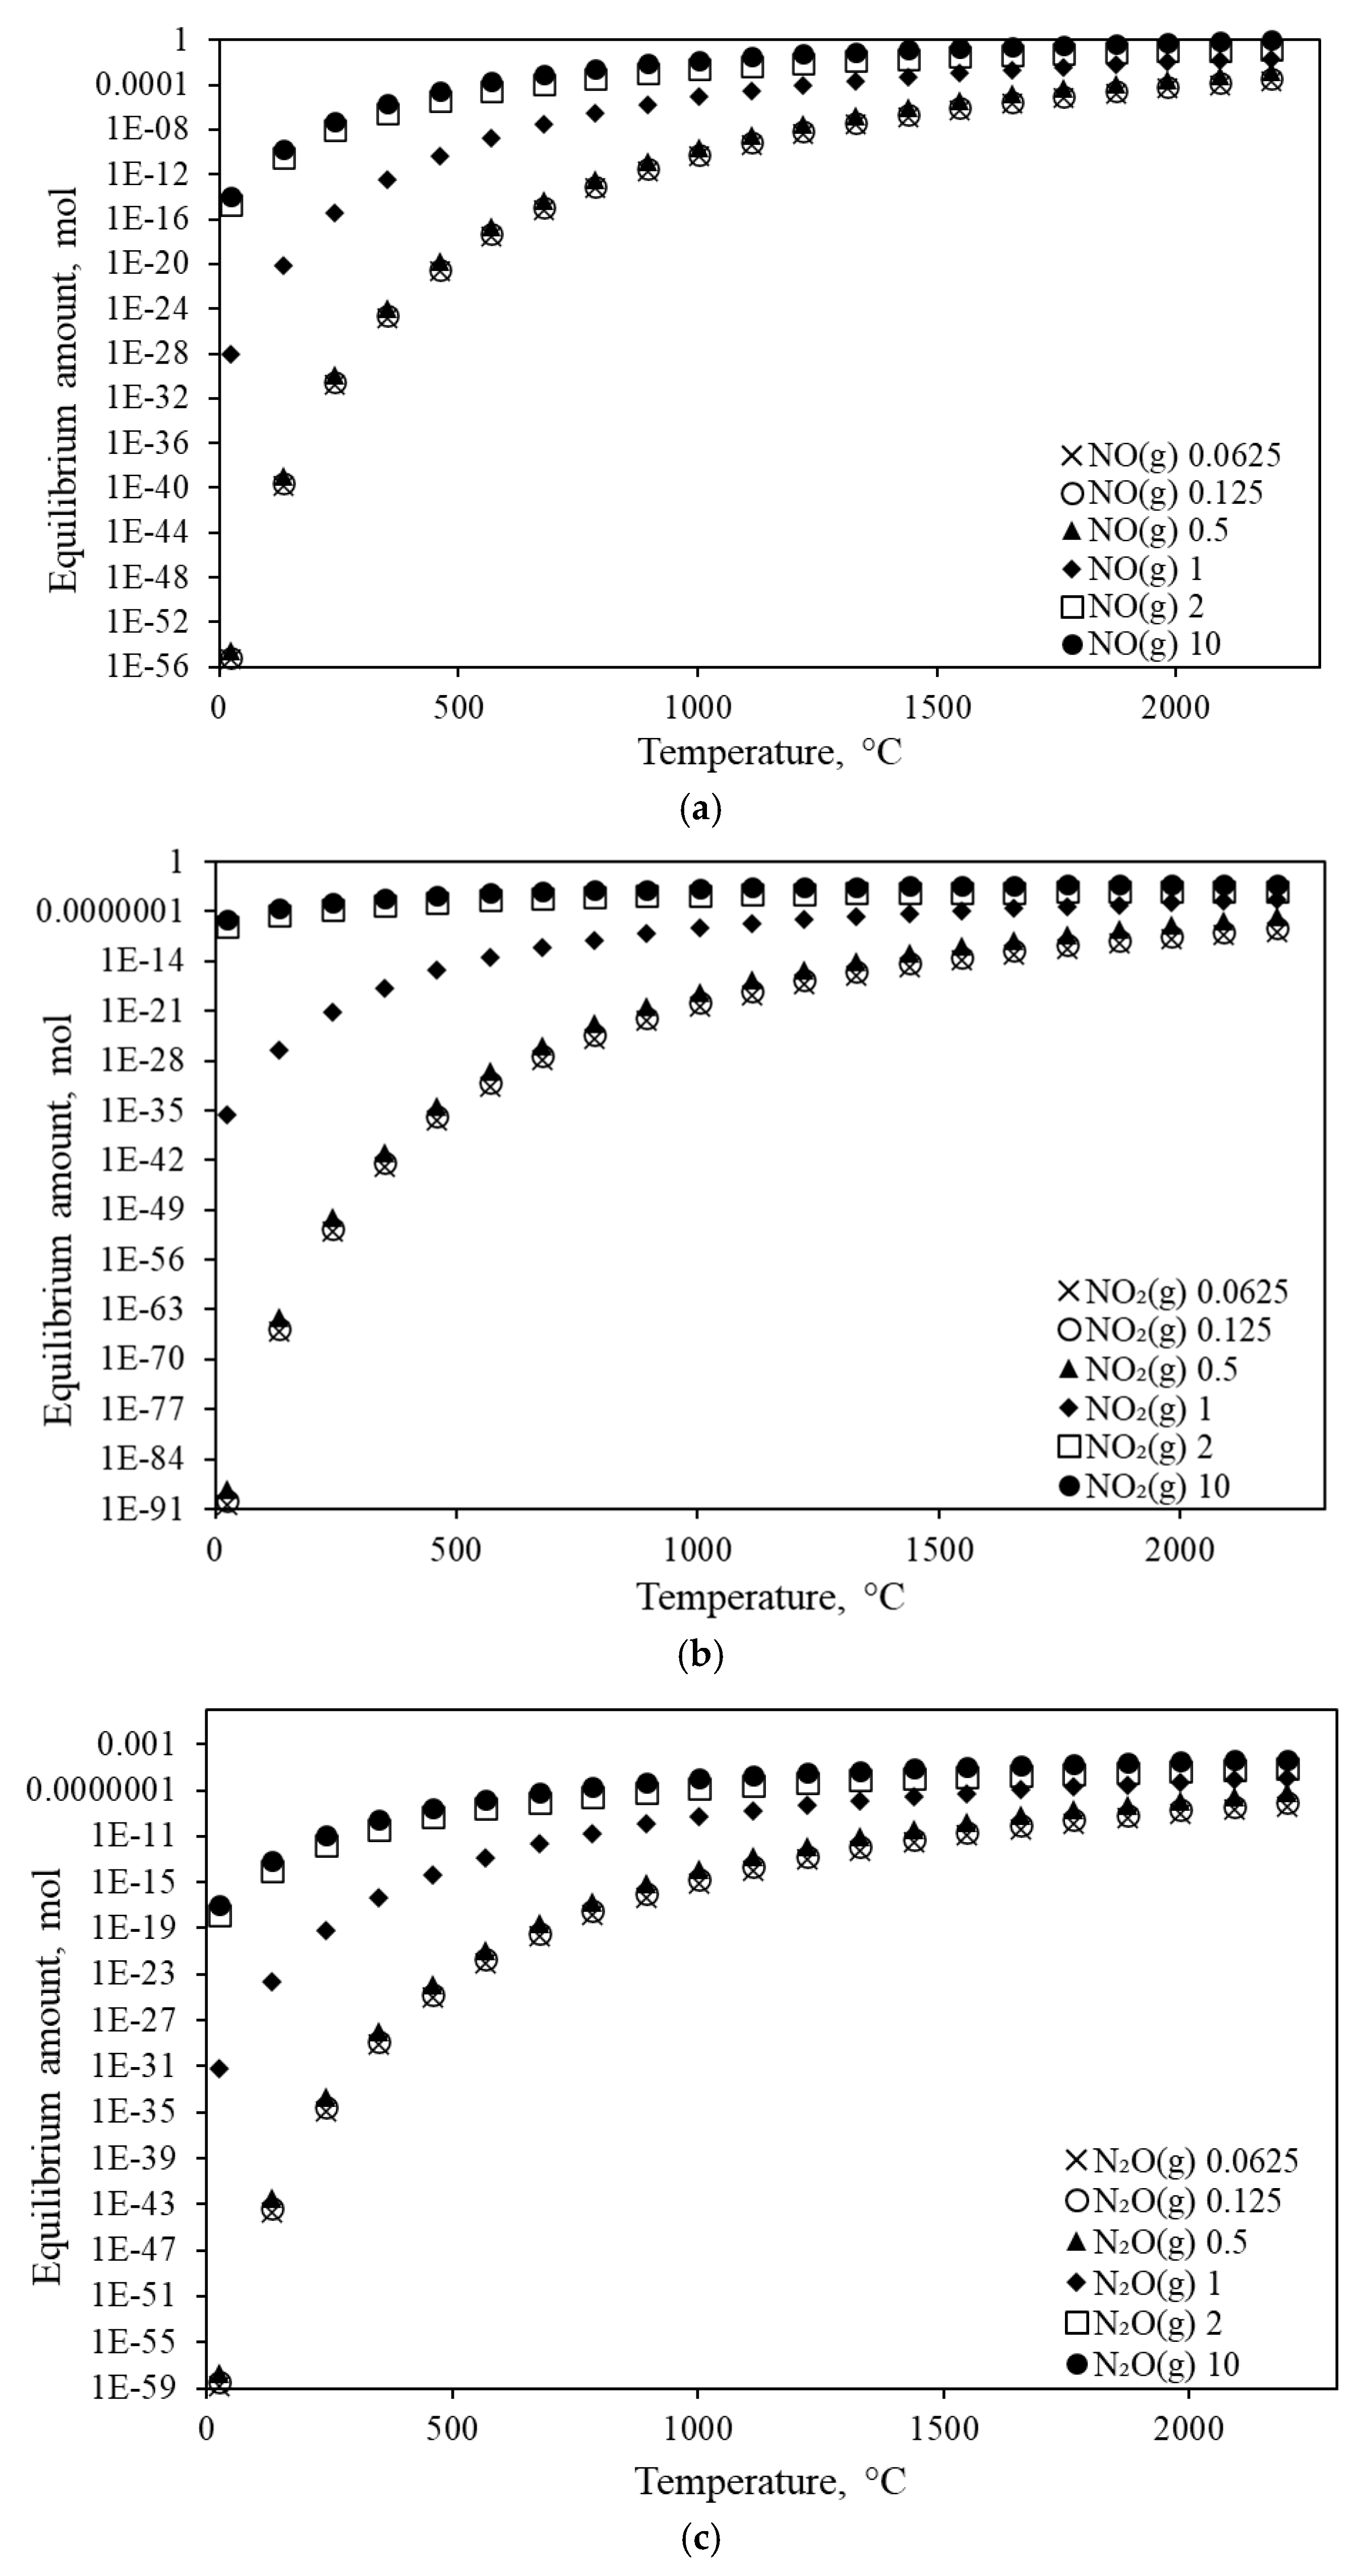
To demonstrate this, the equilibrium amounts of NOx, i.e., NO and NO2, and N2O formation during H2 combustion are modelled and presented in Figure 5. The equilibrium amounts refer to the relative amounts of the various substances present in a chemical reaction at equilibrium. Here, the reactants include H2, O2, and N2, with products being water, NO, NO2, N2O, and unreacted O2. For this, the combustion temperature for H2 up to 2200 °C is considered. Additionally, to showcase the effect of the air-to-fuel ratio, six Λ (0.0625, 0.125, 0.5, 1, 2, and 10) are also included. The reason is that a higher Λ suggests larger fractions of O2 and N2 that can react, shifting the reaction constant for O2-N2 interaction towards the product side.
Figure 5a–c show the calculated equilibrium amounts of NO, NO2, and N2O, respectively, as a function of temperature at different Λ (0.0625, 0.125, 0.5, 1, 2, and 10). For all N–O products, the equilibrium amounts increase with temperature, reaching a stable value after approximately 1500 °C. The effect of Λ is most pronounced at intermediate temperatures (<<1000 °C), where larger Λ lead to higher equilibrium amounts.
From Figure 5, the following deductions can be made: (i) NO (g) is the primary pathway for N2 and O2 interaction as it had the largest equilibrium amount of the three N–O products, (ii) NO, NO2, and N2O had minute equilibrium amounts for Λ = 0.0625, 0.125, and 0.5 over the entire temperature range, and formations only initiated at >>1000 °C, (iii) as Λ increased, the formation temperatures of all the N–O products decreased, specifically for NO2, (iv) at the higher Λ = 1, 2, and 10, all formation initiated at the lower temperatures, e.g., NO and N2O formation became significant at ~1000 °C, and NO2 at ~500 °C, (v) NO2 showed the most significant dependency on Λ, which is evident by the decrease in formation temperature and formation rate.
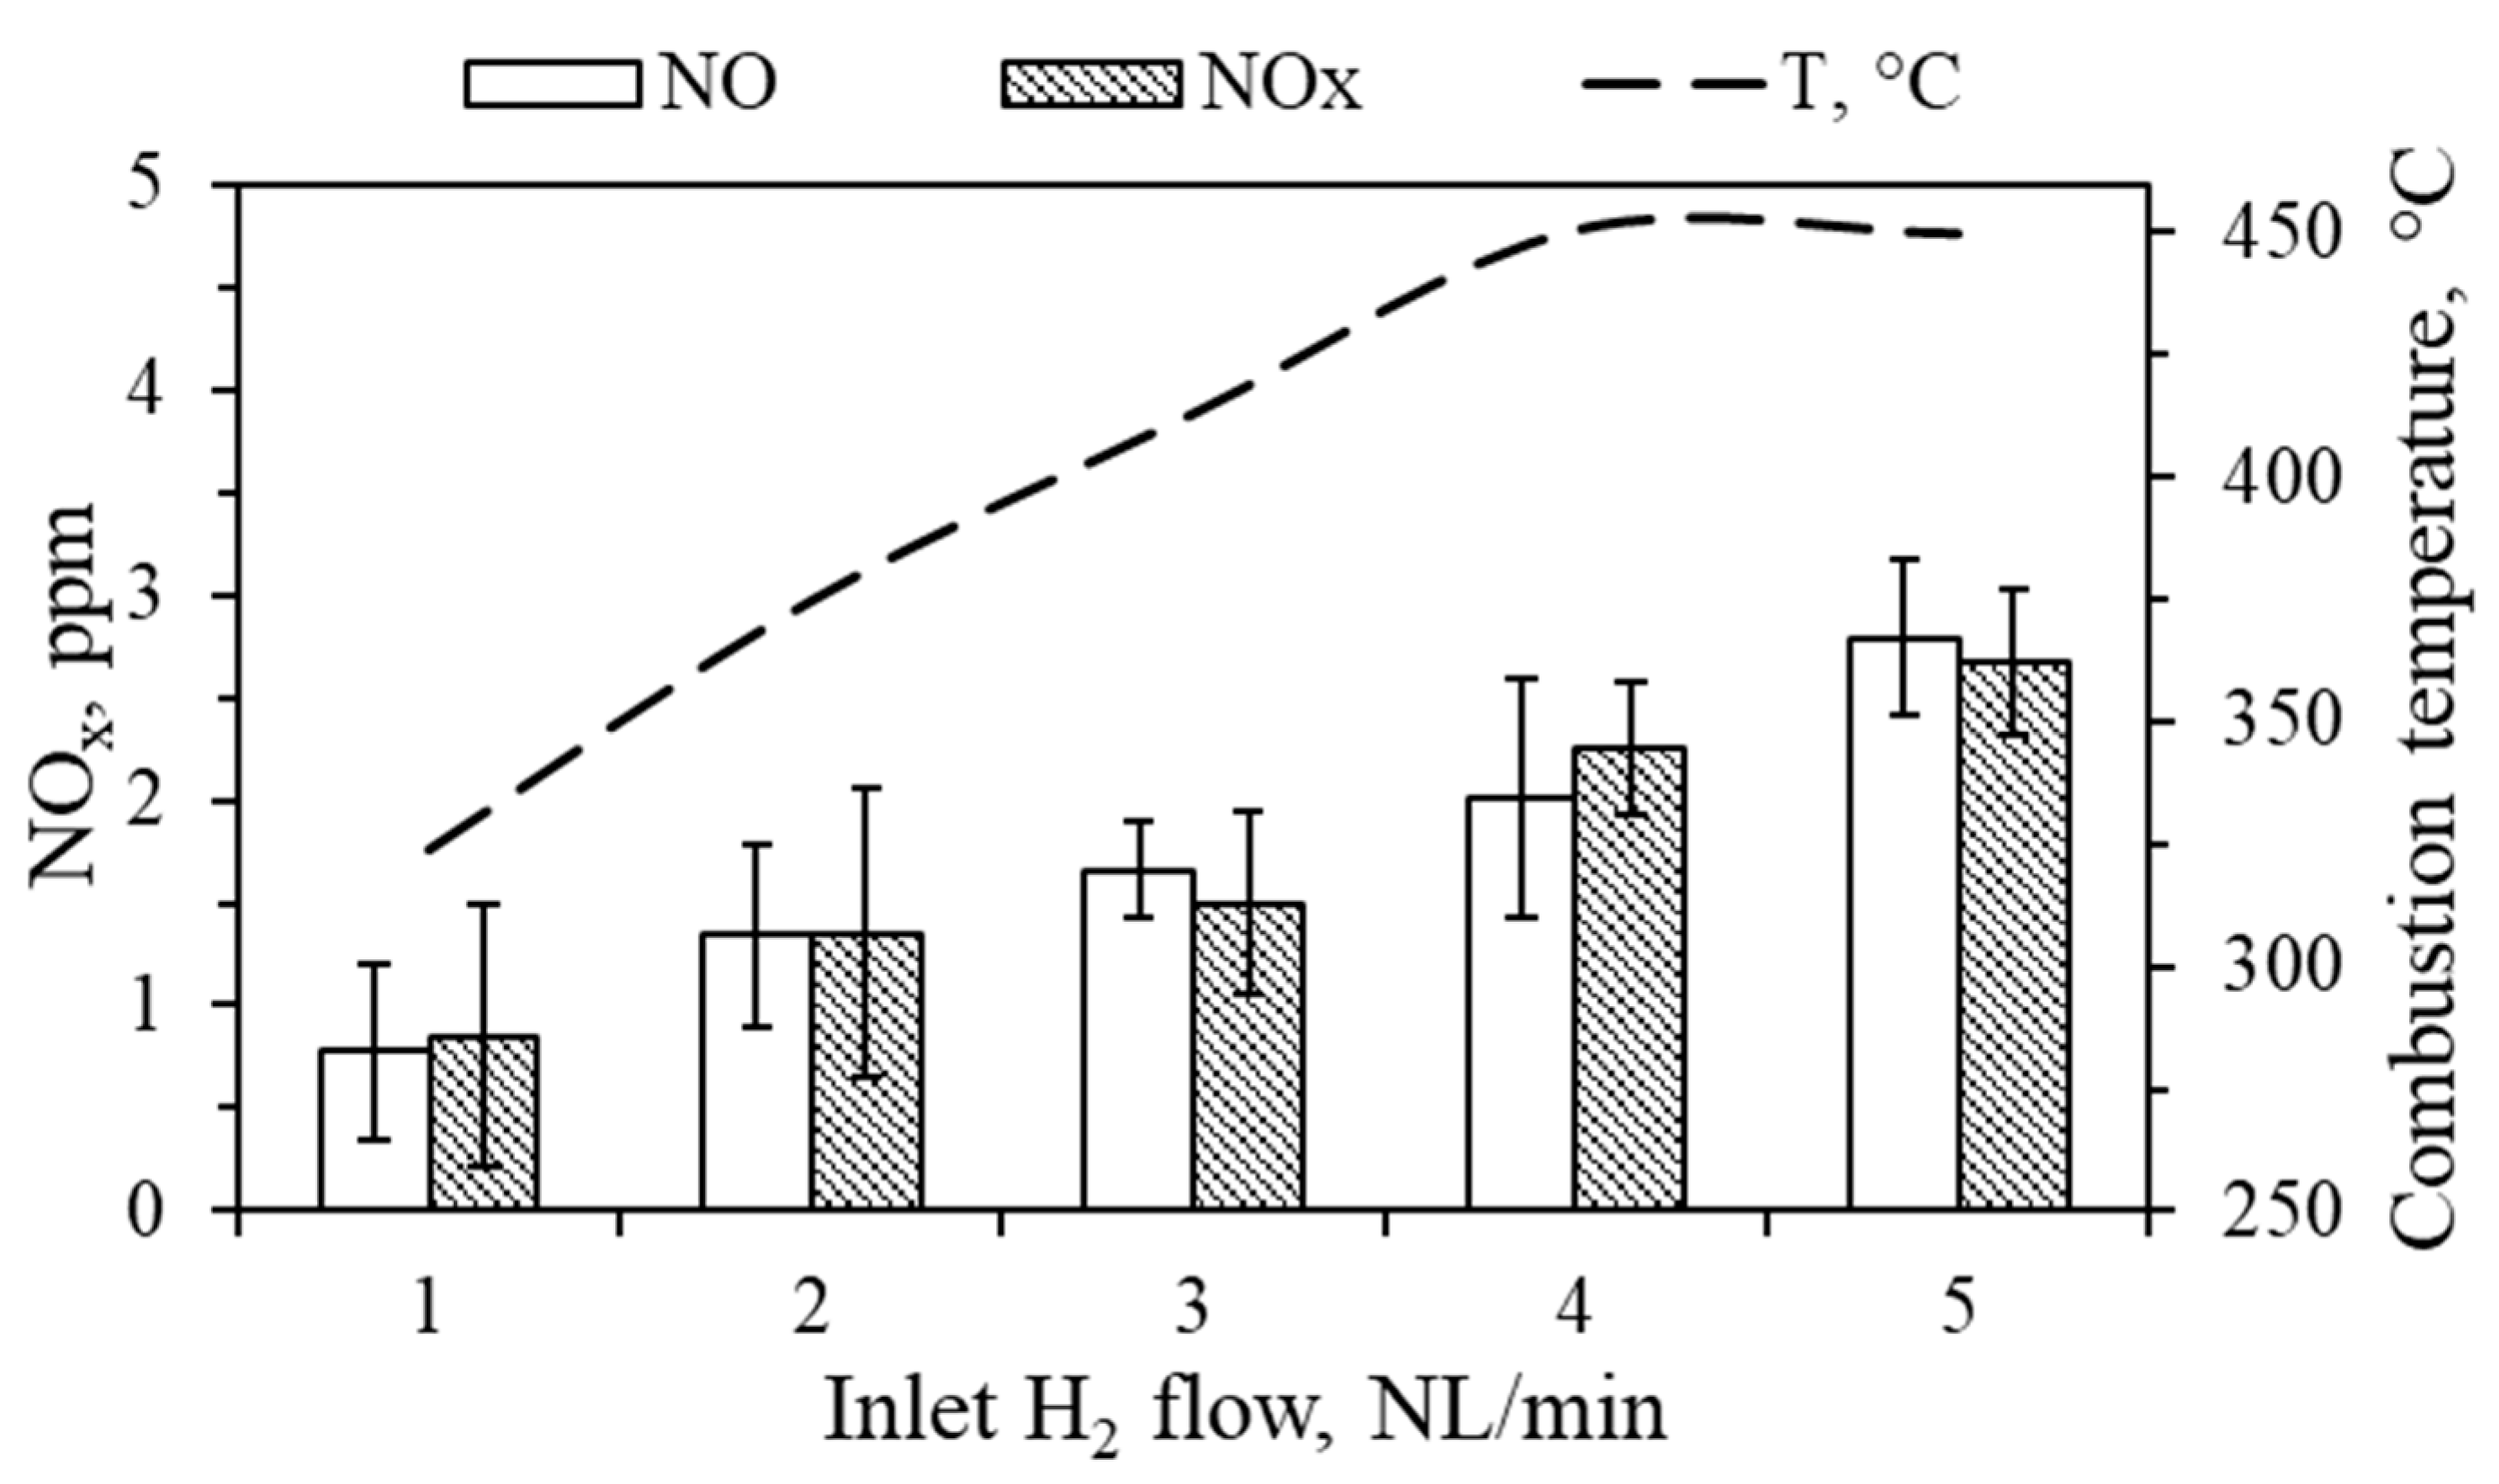
In this research work, the NOx (NO and NO2) emissions were measured during the operation of the cooking device prototype. In this set of experiments, ambient NOx was measured and subtracted from the values obtained at 1–5 NL/min. Figure 6 shows NOx formation (in ppm) as a function of the inlet H2 flow and combustion temperature. Here, either no NO2 or very minute amounts thereof were generated. Based on the results presented in Figure 5, it is likely that some NO2 is present, but below the instrument detection limit (0.1 ppm), thus, it was excluded from Figure 6. The red dashed line in Figure 6 represents the maximum combustion temperatures determined from the temperature mappings demonstrated in Figure 3.
Figure 6 shows that the amount of NO and NOx increased with increasing inlet H2 flow from 1 to 5 NL/min and the combustion temperature from 323.6 to 449.6 °C. At inlet H2 flows of 1, 2, 3, 4, and 5 NL/min, NO of 0.8 ± 0.4, 1.3 ± 0.4, 1.7 ± 0.2, 2.0 ± 0.6, and 2.8 ± 0.6 ppm and NOx of 0.9 ± 0.6, 1.4 ± 0.7, 1.5 ± 0.5, 2.3 ± 0.3, and 2.7 ± 0.4 ppm, were determined. It is interesting to note here that although the combustion temperature remained relatively unchanged with increasing the inlet H2 flow from 4 to 5 NL/min, the amount of NO and NOx increased from 2.0 to 2.8 ppm and from 2.3 to 2.7 ppm, respectively. It has been previously demonstrated that the thermal NOx formation depends on several factors, such as available O2, temperature in the combustion zone, pressure, residence time in the combustion zone, and gas flow rate [22,26]. Fumey et al. demonstrated that excess air can lead to a reduction in thermal NOx emissions due to the cooling effect from excess air and the reduced residence time of the flue gas in the combustion zone [26]. In the present research, the increase in thermal NOx with increasing inlet H2 flow, while the combustion temperature remained unchanged, can be attributed to the alteration of the H2/air mixture and the increased availability of O2 in the combustion zone.
When considering the equilibrium amounts presented in Figure 5, the achieved combustion temperatures for the various H2 flow rates shown in Figure 3, and the expected Λ range determined in Figure 4, a magnification of the N–O equilibrium amounts is presented in Figure 7. Here, a temperature range of 25–550 °C and Λ of 0.05 (corresponding to a H2 flow of 1–2 NL/min) and 8 (corresponding to a H2 flow of 3–5 NL/min) were used. It is, however, noted that the H2/air ratio will decrease with an increase in H2 flow. Nevertheless, the purpose of Figure 7 is to demonstrate, for the respective temperature range associated with the achieved H2 flow rates, the expected N–O product formation. N2O was again included.
Figure 7 shows that at the relevant temperature range achieved by the prototype of the cooking device over H2 flows of 1–2 NL/min (Λ ≈ 0.05), NO and N2O were the dominant N–O products formed. Among these, NO is the primary N–O product, with N2O being the secondary product at the considered temperature range. The amounts of NO2 were considerably lower when compared to NO and N2O. However, the NO2 formation rate was higher when compared to the formation rates of NO and N2O.
At higher inlet H2 flows of 3–5 NL/min (Λ ≈ 8), the equilibrium shifted towards greater overall amounts of N–O products. Under these conditions, NO2 became the primary product, while NO was a secondary product with considerably lower amounts of N2O. At temperatures above 200 °C, however, the equilibrium amounts of NO and NO2 approached similar levels. This change in product distribution with increasing gas flow can be attributed to higher amounts of entrained air and higher combustion temperatures, both of which promote the formation of NO2.
The equilibrium calculation presented in Figure 7 suggests that at low H2 flows (1–2 NL/min), NO would be the primary N–O product. This trend corresponds with the observations in Figure 6, which show that the concentration of NO was higher than that of NO2. However, at higher H2 flows (3–5 NL/min), NO2 should become the dominant product along with NO. In contrast, the experimental results showed that only NO was detected over the tested H2 flow range. The measured NOx amounts matched those of NO within the experimental error, indicating that NO2 formation was negligible under operating conditions. This discrepancy between calculated and experimental results emphasizes the impact of the chimney. While equilibrium thermodynamics predicts relatively large amounts of NO2, the relatively short residence time of the gas mixture in the combustion zone suppresses the complete oxidation of NO to NO2. As a result, NO was the primary N–O product even at higher Λ and combustion temperatures.
It has been previously demonstrated that due to high temperatures (i.e., 2045 °C) of direct H2 combustion, high levels of NOx can be obtained [3,20,21]. Several approaches have been used to reduce NOx emissions, such as changing the air-to-fuel ratio of the combustion mixture, injecting water or steam, and improving the burner design [55,56,57]. For example, by improving the H2 nozzle design of the partially premixed H2 burner, Schmidt et al. reduced NOx emissions for equivalence ratios below 0.85 [55]. The authors determined approximately 230 mg/kWh (approximately 127 ppm) while operating the burner at 902 °C and an equivalence ratio of 1. CHC is another approach to reducing NOx emissions, achieved through lower combustion temperatures. A cooking stove based on CHC has been developed by Fumey et al. [26,34]. The maximum NOx of 9.49 ppm (0.37 mg/kWh) was determined at the operating temperature of 662.4 °C [26]. Nonetheless, the total NOx (NOx = NO + NO2) in the flue gas did not exceed 2.8 ppm at all the experimental conditions and is significantly lower than the value set by EU regulations. It can therefore be concluded that CHC-based technologies are advantageous for domestic heat generation since only trace amounts of NOx can be formed while temperatures required for cooking and heating applications are achieved.

3.4. Effect of the Chimney and O2 Starvation

To investigate the effect of the chimney and O2 starvation on the performance of the cooking device, an additional test has been performed. In the first set of experiments, the combustion area was covered with a chimney. This resulted in increased gas flow rates, insufficient O2 availability, and reduced residence time of the H2 fuel on the catalyst surface. In the next set of experiments, a gap of 0.5 cm between the combustion area and the chimney was set to reduce the impact of the chimney and establish additional air flow to the combustion area. The gap between the catalyst surface and the chimney was monitored using a H2 sensor to ensure that no H2 was flowing through the gap. The cooking device was subsequently operated at inlet H2 flows of 1–5 NL/min. The combustion temperature, H2 slip, and flue gases (O2 and NOx) were determined and presented in Table 2.
From the results presented in Table 2, it can be seen that the combustion temperature increased from 324.5 ± 6.5 to 611.2 ± 12.2 °C with increasing inlet H2 flow from 1 to 5 NL/min. When compared to the combustion temperatures observed in the first set of experiments (323.6, 374.5, 412.8, 450.3, and 449.6 °C at 1, 2, 3, 4, and 5 NL/min, respectively), the higher combustion temperatures in the second set of experiments can be attributed to the reduced gas flow rates (mitigated chimney effect), which increased the residence time of the H2 fuel on the catalyst surface. Furthermore, the additional air supplied from the top provided sufficient O2 availability in the combustion area, further enhancing the combustion efficiency.
It is of interest here that the maximum combustion temperature of 611.2 °C was determined at the inlet H2 flow of 5 NL/min, while in a study by Fumey et al. the temperatures of 522.2–541.4 °C were determined at the same H2 flow [26]. The reason for this can be the differences in cooking device design, air supply approach, and the various catalysts used. In the study by Fumey et al., a separate air input was used to investigate the performance of the device at different air-to-fuel ratios. It was found that the resulting combustion temperatures were higher at lower air-to-fuel ratios due to the reduced cooling effect from excess air [26]. In contrast, in the present work, the air was entrained by convection, which limited control of the air-to-fuel ratios. Nevertheless, the chimney effect in the prototype described in the present study increased entrained air flows even at low H2 inlet flows, contributing to a cooling effect. Additionally, different catalyst materials (SiC foams coated with Pt vs. Pt/Al2O3 in a study by Fumey et al. vs. the present study, respectively) could result in different device performances.
It can further be seen from Table 2 that the H2 slip values also improved. The maximum H2 slip of 1.75 ± 0.35 vol% was determined at the inlet H2 flow of 5 NL/min. When compared to the first set of experiments, the H2 slip improved substantially from 12.17 ± 2.31 to 1.75 ± 0.35 vol% at the inlet H2 flow of 5 NL/min, respectively. It can, therefore, be stated that the performance of the developed cooking device is determined not only by the inlet H2 flow but also by the reaction area (greater O2 availability due to additional air flow from the top). An increase in the diameter of the cooking device could also be a future research perspective.
Flue gas analysis revealed that total NOx in the flue gas did not exceed 4.4 ppm at all experimental conditions. The total NOx value was higher than the 2.8 ppm obtained in the first set of experiments (at an inlet H2 flow of 5 NL/min). It can be ascribed to an increased residence time of the H2 fuel, a greater amount of available air, and higher combustion temperatures associated with the second set of experiments.
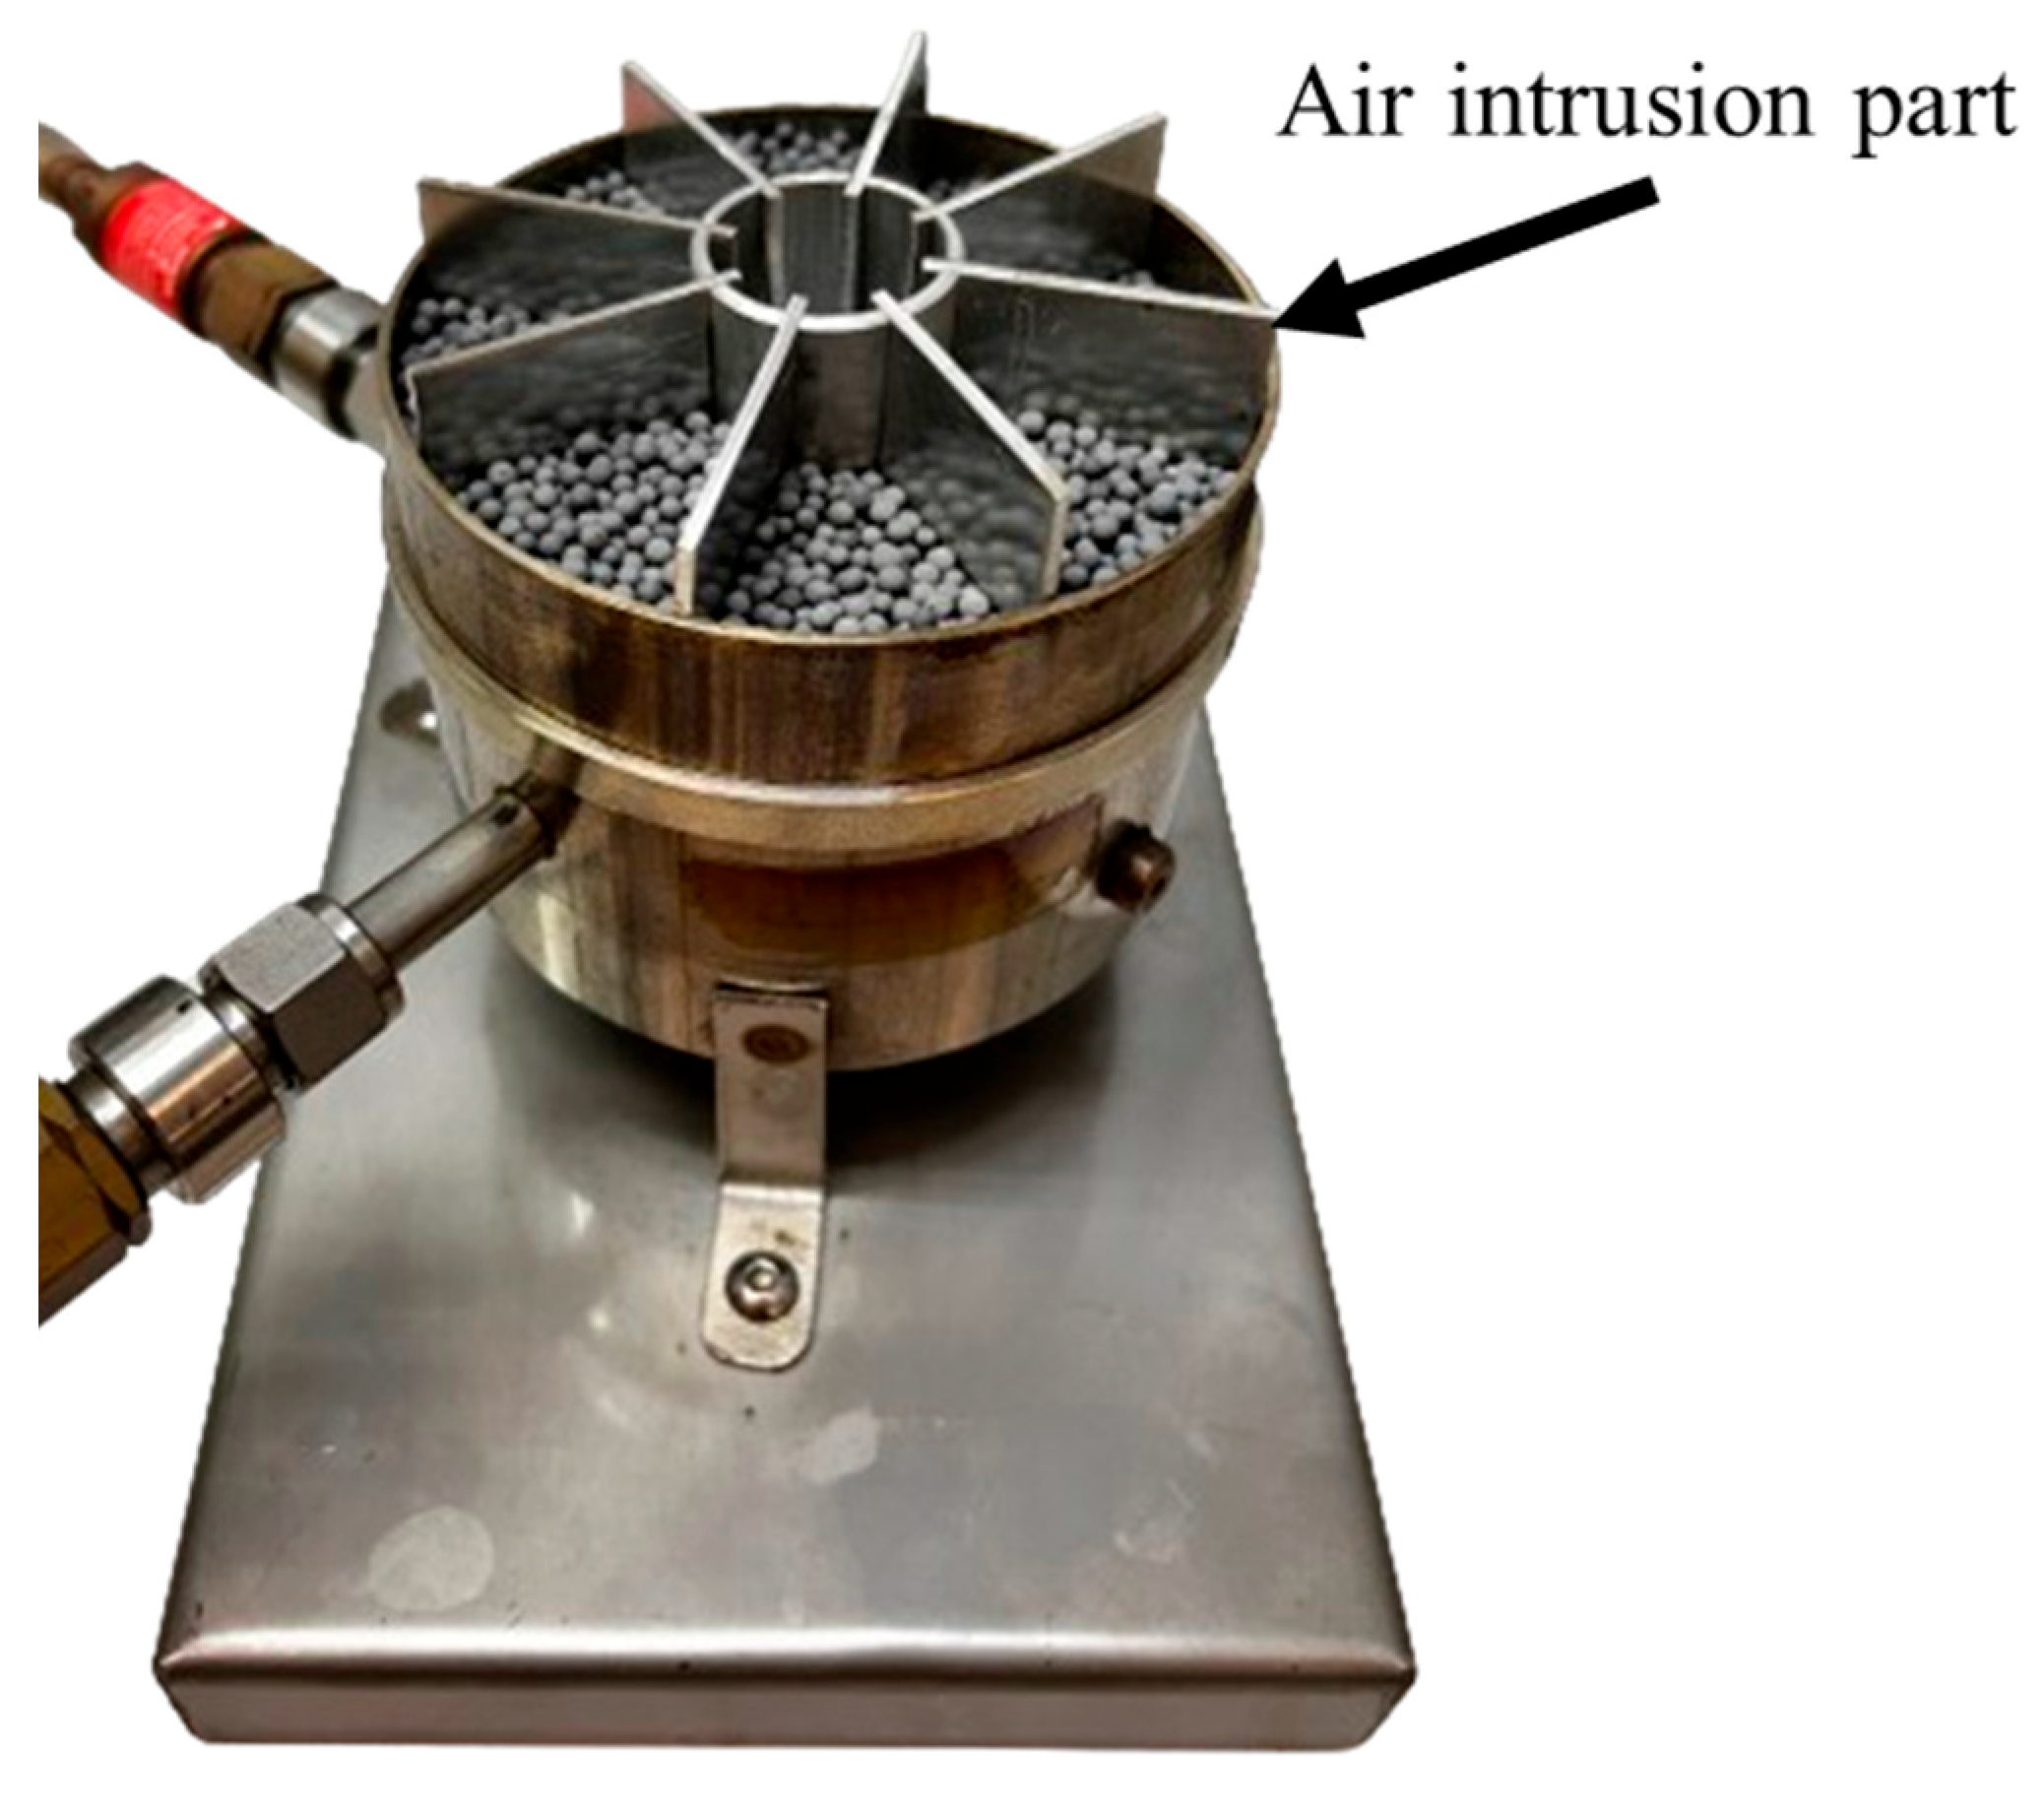
It is further seen from Table 2 that the residual O2 content remained relatively unchanged at all experimental conditions, suggesting sufficient air supply to the combustion area. Therefore, it can be concluded that due to the specific design of a prototype of the cooking device and the passive air supply approach (through convection), the combustion area has to remain open from the top to ensure efficient combustion performance and sufficient air supply during cooking. Hence, to perform further efficiency tests, some modifications to the prototype design have been made. Eight aluminum plates (40 mm × 20 mm) were fixed together (also referred to as “air intrusion part”) and placed inside the catalytic combustion section (iii) (Figure 8). This additional part was 5 mm higher than the catalytic combustion section (iii); therefore, forming a fixed gap between the catalytic surface and the cooking pot during the efficiency test (refer to Section 3.5).

3.5. Efficiency Test

The efficiency of the cooking device was determined by heating 500 mL of water in an aluminum pot of 150 mm in diameter from 20 to 90 °C. Efficiency tests were performed at inlet H2 flows of 1–5 NL/min. The European Standard EN 30-2-1:2015 was adopted and used to estimate the efficiency of the prototype in the present study [58]. This standard sets out the requirements and test method for the rational use of energy in domestic cooking appliances using gas fuel. The following equation was used to estimate the efficiency [34,58]:
E f f i c i e n c y , % = E f f i c i e n c y ( t h e o r i c ) E f f i c i e n c y ( c o o k e r ) 100 % = 4.186 · 10 3 m e t 2 t 1 V c H s 100 %
where me = mwater + 0.213mpot; mwater—mass of the water in the pot; mpot—mass of the aluminum pot with the lid; t1—initial temperature of the water (20 ± 1 °C); t2—final temperature of the water (90 ± 1 °C); Vc—volume of the gas; and Hs—lower heating value of H2 (33.3 kWh/kg).
The estimated efficiency of the cooking device is presented in Figure 9.
It can be seen from Figure 9 that the efficiency decreased with an increase in the inlet H2 flow. The maximum efficiency of 42% was determined at the inlet H2 flow of 1 NL/min; The minimum efficiency of 9% was determined at the inlet H2 flow of 5 NL/min.
From the results presented in Section 3.1 and Section 3.2 and Figure 9, it can be concluded that efficiency decreases at higher gas flow rates and when an insufficient amount of air is supplied. This is due to increased heat loss through heat transport from the combustion zone, resulting from excess fuel (i.e., H2) and/or air flow. Therefore, it can be concluded that before the cooking device can be implemented for real-world cooking applications, some improvements should be executed in the design to prevent heat losses emanating from the heat source (i.e., the cooking device). For example, Vogt et al. implemented a heat exchanger to improve the overall efficiency of the H2 stove [35]. Based on the lower heating value, the efficiency was improved from 59 to 66% at the inlet H2 flow of 7 NL/min. Adding a heat exchanger and thermal isolation material to the cooking device developed in the present research could be a future research perspective to prevent convective heat losses.

4. Conclusions

A prototype of the cooking device based on CHC technology was developed for domestic cooking/heating applications. The cooking device was evaluated by determining its combustion temperature, H2 slip, flue gas emissions, and water heating efficiency. Evaluation of the cooking device was performed at the inlet H2 flow of 1–5 NL/min. The resulting power output with respect to the inlet H2 flow was in a range of 0.18–0.90 kW. The combustion temperature determined using the IR camera was in a range of 324.5–611.2 °C.
From the results of the study, it can be concluded that the combustion temperature increased with increasing the inlet H2 flow, while H2 slip and water heating efficiency decreased. Considering the minute H2 slip of 0.09 vol%, combustion temperature of 324.5 °C, and the heating efficiency of 42%, the inlet H2 flow of 1 NL/min is considered a suitable H2 flow for the cooking device developed in the present study. At the inlet H2 flow of 2 and 3 NL/min, the H2 slip of <4 vol% was determined while the combustion temperatures of 374.5 and 412.8 °C, respectively, were achieved. However, due to the relatively low heating efficiency of 24% and 17%, the inlet H2 flows of 2 and 3 NL/min are considered not suitable for the cooking device before design improvement is implemented.
The following can be considered as future research perspectives to improve the thermal efficiency of the cooking device: (i) an increase in the reaction area (i.e., cooking device diameter), (ii) adding a heat exchanger and thermal isolation material, (iii) adding a separate air input to control the air-to-fuel ratio.
If the convective heat losses are minimized by employing (i) or (ii), it is possible to implement the cooking device with a low power output of less than 0.9 kW for domestic cooking applications. Adding the separate air input as indicated in (iii) will allow controlling the air-fuel ratio, which will result in higher combustion temperatures and power output. For domestic purposes, heat generation by CHC has the potential for higher efficiency than H2 conversion to electricity for electrical cooking. In the case of CHC, efficiency depends on the heat conductivity from the combustion zone to the cooking pot and can reach nearly 100%, while the efficiency of a fuel cell averages between 40 and 60%. In addition, CHC-based technology for cooking will reduce the required nominal fuel cell power output and the necessary H2 storage capacity. This could potentially reduce the overall cost reductions for RE-powered living units.

Author Contributions

Conceptualization, A.E.K., S.P.d.P. and D.G.B.; Methodology, A.E.K.; Software, C.M.; Validation, A.E.K.; Formal analysis, A.E.K. and S.P.d.P.; Investigation, A.E.K. and S.P.d.P.; Resources, D.G.B.; Data curation, A.E.K.; Writing—original draft, A.E.K.; Writing—review & editing, S.P.d.P. and D.G.B.; Visualization, A.E.K. and S.P.d.P.; Project administration, D.G.B.; Funding acquisition, D.G.B. All authors have read and agreed to the published version of the manuscript.

Funding

This work is based on the research supported in part by the Department of Science and Innovation (DSI) and HySA Infrastructure in Potchefstroom, South Africa, through their financial support KP5 programme and by the National Research Foundation of South Africa and Sasol Ltd. (SASPD22080347739).

Data Availability Statement

The original contributions presented in this study are included in the article. Further inquiries can be directed to the corresponding author.

Acknowledgments

The authors would like to acknowledge that opinions, findings, and conclusions or recommendations expressed in this publication generated by the Sasol-NRF supported research are those of the author(s) and that Sasol and the NRF accept no liability whatsoever in this regard. The authors would also like to acknowledge the assistance provided by Ted Paarlberg (Technical Assistant at HySA Infrastructure CoC) for the design and construction of the prototype.

Conflicts of Interest

The authors declare no conflict of interest.

References

  1. Tracking SDG 7: The Energy Progress Report. 2022. Available online: https://trackingsdg7.esmap.org/sites/default/files/download-documents/sdg7-report2022-full_report.pdf (accessed on 20 June 2025).
  2. du Preez, S.P.; Kozhukhova, A.E.; Bessarabov, D.G. Catalytic hydrogen combustion using platinum supported on anodized aluminium oxide adhered to metallic aluminium. S. Afr. J. Chem. 2022, 76, 31–37. [Google Scholar] [CrossRef]
  3. Kozhukhova, A.E.; du Preez, S.P.; Bessarabov, D.G. Catalytic hydrogen combustion for domestic and safety applications: A critical review of catalyst materials and technologies. Energies 2021, 14, 4897. [Google Scholar] [CrossRef]
  4. Lim, S.S.; Vos, T.; Flaxman, A.D.; Danaei, G.; Shibuya, K.; Adair-Rohani, H.; AlMazroa, M.A.; Amann, M.; Anderson, H.R.; Andrews, K.G.; et al. A comparative risk assessment of burden of disease and injury attributable to 67 risk factors and risk factor clusters in 21 regions, 1990–2010: A systematic analysis for the Global Burden of Disease Study 2010. The Lancet 2012, 380, 2224–2260. [Google Scholar] [CrossRef] [PubMed]
  5. Bailis, R.; Ezzati, M.; Kammen, D.M. Mortality and greenhouse gas impacts of biomass and petroleum energy futures in Africa. Science 2005, 308, 98. [Google Scholar] [CrossRef]
  6. Rudel, T.K. The national determinants of deforestation in sub-Saharan Africa. Philos. Trans. R. Soc. B Biol. Sci. 2013, 368, 20120405. [Google Scholar] [CrossRef] [PubMed]
  7. Patel, S.; Khandelwal, A.; Leavey, A.; Biswas, P. A model for cost-benefit analysis of cooking fuel alternatives from a rural Indian household perspective. Renew. Sust. Energy Rev. 2016, 56, 291–302. [Google Scholar] [CrossRef]
  8. Yasmin, N.; Grundmann, P. Adoption and diffusion of renewable energy–The case of biogas as alternative fuel for cooking in Pakistan. Renew. Sust. Energy Rev. 2019, 101, 255–264. [Google Scholar] [CrossRef]
  9. Nwaokocha, C.N.; Giwa, S.O. Investigation of bio-waste as alternative fuel for cooking. In Proceedings of the 3rd International Conference On African Development Issues (CU-ICADI), Ota, Nigeria, 9–11 May 2016; pp. 1–5. [Google Scholar]
  10. Mishra, N.K.; Biswas, P.; Patel, S. Future of clean energy for cooking in India: A comprehensive analysis of fuel alternatives. Energy Sustain. Dev. 2024, 81, 101500. [Google Scholar] [CrossRef]
  11. Hurtado Pérez, E.; Mulumba Ilunga, O.; Alfonso Solar, D.; Moros Gómez, M.C.; Bastida-Molina, P. Sustainable Cooking Based on a 3 kW Air-Forced Multifuel Gasification Stove Using Alternative Fuels Obtained from Agricultural Wastes. Sustainability 2020, 12, 7723. [Google Scholar] [CrossRef]
  12. Kurchania, A.K.; Panwar, N.L.; Pagar, S.D. Design and performance evaluation of biogas stove for community cooking application. Int. J. Sustain. Energy. 2010, 29, 116–123. [Google Scholar] [CrossRef]
  13. Khandelwal, M.; Hill, M.E.; Greenough, P.; Anthony, J.; Quill, M.; Linderman, M.; Udaykumar, H.S. Why Have Improved Cook-Stove Initiatives in India Failed? World Dev. 2017, 92, 13–27. [Google Scholar] [CrossRef]
  14. Sambandam, S.; Balakrishnan, K.; Ghosh, S.; Sadasivam, A.; Madhav, S.; Ramasamy, R.; Samanta, M.; Mukhopadhyay, K.; Rehman, H.; Ramanathan, V. Can Currently Available Advanced Combustion Biomass Cook-Stoves Provide Health Relevant Exposure Reductions? Results from Initial Assessment of Select Commercial Models in India. EcoHealth 2015, 12, 25–41. [Google Scholar] [CrossRef]
  15. Pope, D.; Bruce, N.; Dherani, M.; Jagoe, K.; Rehfuess, E. Real-life effectiveness of ‘improved’ stoves and clean fuels in reducing PM2.5 and CO: Systematic review and meta-analysis. Environ. Int. 2017, 101, 7–18. [Google Scholar] [CrossRef] [PubMed]
  16. Dou, Y.; Sun, L.; Ren, J.; Dong, L. Chapter 17-Opportunities and future challenges in hydrogen economy for sustainable development. In Hydrogen Economy, 2nd ed.; Scipioni, A., Manzardo, A., Ren, J., Eds.; Academic Press: Cambridge, MA, USA, 2023; pp. 537–569. [Google Scholar]
  17. Sarker, A.K.; Azad, A.K.; Rasul, M.G.; Doppalapudi, A.T. Prospect of Green Hydrogen Generation from Hybrid Renewable Energy Sources: A Review. Energies 2023, 16, 1556. [Google Scholar] [CrossRef]
  18. Kaleem, A.; Zaman, A.; Rajakaruna, S. Hydrogen at home: The current and future landscape of green hydrogen in residential settings. Sustain. Energy Technol. Assess. 2024, 72, 104058. [Google Scholar] [CrossRef]
  19. Varlamov, G.B.; Glazyrin, S.A.; Khamzina, A.; Bimurzina, Z.A.; Zhakiyev, N. Hydrogen energy for advancing energy efficiency and environmental friendliness of the heat supply system of residential house. Sustain. Energy Technol. Assess. 2024, 64, 103689. [Google Scholar] [CrossRef]
  20. Skottene, M.; Rian, K.E. A study of NOx formation in hydrogen flames. Int. J. Hydrogen Energy 2007, 32, 3572–3585. [Google Scholar] [CrossRef]
  21. Frassoldati, A.; Faravelli, T.; Ranzi, E. A wide range modeling study of NOx formation and nitrogen chemistry in hydrogen combustion. Int. J. Hydrogen Energy 2006, 31, 2310–2328. [Google Scholar] [CrossRef]
  22. Kohl, A.L.; Nielsen, R.B. Control of Nitrogen Oxides. In Gas Purification; Kohl, A.L., Nielsen, R.B., Eds.; Gulf Professional Publishing: Houston, TX, USA, 1997; pp. 866–945. [Google Scholar]
  23. Skalska, K.; Miller, J.S.; Ledakowicz, S. Trends in NOx abatement: A review. Sci. Total Environ. 2010, 408, 3976–3989. [Google Scholar] [CrossRef]
  24. Turns, S.R. An Introduction to Combustion: Concepts and Applications, 3rd ed.; McGraw Hill Education: New York, NY, USA, 2011. [Google Scholar]
  25. Kim, J.; Yu, J.; Lee, S.; Tahmasebi, A.; Jeon, C.-H.; Lucas, J. Advances in catalytic hydrogen combustion research: Catalysts, mechanism, kinetics, and reactor designs. Int. J. Hydrogen Energy 2021, 46, 40073–40104. [Google Scholar] [CrossRef]
  26. Fumey, B.; Buetler, T.; Vogt, U.F. Ultra-low NOx emissions from catalytic hydrogen combustion. Appl. Energy 2018, 213, 334–342. [Google Scholar] [CrossRef]
  27. Basavaraju, A.; Ramesh, A.B.; Jajcevic, D.; Heitmeir, F. Experimental parametric investigation of platinum catalysts using hydrogen fuel. Int. J. Hydrogen Energy 2018, 43, 21307–21321. [Google Scholar] [CrossRef]
  28. du Toit, M.H.; Avdeenkov, A.V.; Bessarabov, D. Reviewing H2 combustion: A case study for non-fuel-cell power systems and safety in passive autocatalytic recombiners. Energ. Fuel. 2018, 32, 6401–6422. [Google Scholar] [CrossRef]
  29. du Toit, M.; Engelbrecht, N.; Oelofse, S.P.; Bessarabov, D. Performance evaluation and emissions reduction of a micro gas turbine via the co-combustion of H2/CH4/CO2 fuel blends. Sustain. Energy Technol. Assess. 2020, 39, 100718. [Google Scholar] [CrossRef]
  30. Arsalis, A. Thermodynamic modeling and parametric study of a small-scale natural gas/hydrogen-fueled gas turbine system for decentralized applications. Sustain. Energy Technol. Assess. 2019, 36, 100560. [Google Scholar] [CrossRef]
  31. Zhou, J.; Wang, Y.; Yang, W.; Liu, J.; Wang, Z.; Cen, K. Combustion of hydrogen–air in catalytic micro-combustors made of different material. Int. J. Hydrogen Energy 2009, 34, 3535–3545. [Google Scholar] [CrossRef]
  32. Sui, R.; Prasianakis, N.I.; Mantzaras, J.; Mallya, N.; Theile, J.; Lagrange, D.; Friess, M. An experimental and numerical investigation of the combustion and heat transfer characteristics of hydrogen-fueled catalytic microreactors. Chem. Eng. Sci. 2016, 141, 214–230. [Google Scholar] [CrossRef]
  33. Großmann, U.P.; Lehmann, J.; Menzl, F. A non-stationary hydrogen cooker with portable hydride storage and catalytic hydrogen burner. Int. J. Hydrogen Energy 2000, 25, 87–90. [Google Scholar] [CrossRef]
  34. Fumey, B.; Stoller, S.; Fricker, R.; Weber, R.; Dorer, V.; Vogt, U.F. Development of a novel cooking stove based on catalytic hydrogen combustion. Int. J. Hydrogen Energy 2016, 41, 7494–7499. [Google Scholar] [CrossRef]
  35. Vogt, U.; Fumey, B.; Bielmann, M.; Siong, V.; Gallandat, N.; Züttel, A. Catalytic hydrogen combustion on porous SiC ceramics. In Proceedings of the 15th European Fuel Cell Forum 2011, Luzern, Switzerland, 28 June–1 July 2011; pp. 45–54. [Google Scholar]
  36. Pangborn, J.B. Catalytic Combustion of Hydrogen in Model Appliances. J. Energy 1981, 5, 285–288. [Google Scholar] [CrossRef]
  37. Arrieta, C.E.; Amell, A.A. Combustion analysis of an equimolar mixture of methane and syngas in a surface-stabilized combustion burner for household appliances. Fuel 2014, 137, 11–20. [Google Scholar] [CrossRef]
  38. Du Preez, S.P.; Jones, D.R.; Bessarabov, D.G.; Falch, A.; Mota das Neves Quaresma, C.; Dunnill, C.W. Development of a Pt/stainless steel mesh catalyst and its application in catalytic hydrogen combustion. Int. J. Hydrogen Energy 2019, 44, 27094–27106. [Google Scholar] [CrossRef]
  39. du Preez, S.P.; Jones, D.R.; Warwick, M.E.A.; Falch, A.; Sekoai, P.T.; Mota das Neves Quaresma, C.; Bessarabov, D.G.; Dunnill, C.W. Thermally stable Pt/Ti mesh catalyst for catalytic hydrogen combustion. Int. J. Hydrogen Energy 2020, 45, 16851–16864. [Google Scholar] [CrossRef]
  40. Mordarski, G.; Skowron, K.; Duraczyńska, D.; Drabczyk, A.; Socha, R.P. Development of a Multi-Bed Catalytic Heat Generator Utilizing a Palladium-Based Hydrogen Combustion System. Energies 2025, 18, 1348. [Google Scholar] [CrossRef]
  41. Choi, W.; Kwon, S.; Dong Shin, H. Combustion characteristics of hydrogen–air premixed gas in a sub-millimeter scale catalytic combustor. Int. J. Hydrogen Energy 2008, 33, 2400–2408. [Google Scholar] [CrossRef]
  42. Mori, Y.; Miyauchi, T.; Hirano, M. Catalytic combustion of premixed hydrogen-air. Combust. Flame 1977, 30, 193–205. [Google Scholar] [CrossRef]
  43. Kozhukhova, A.E.; du Preez, S.P.; Shuro, I.; Bessarabov, D.G. Development of a low purity aluminum alloy (Al6082) anodization process and its application as a platinum-based catalyst in catalytic hydrogen combustion. Surf. Coat. Technol. 2020, 404, 126483. [Google Scholar] [CrossRef]
  44. Kozhukhova, A.E.; du Preez, S.P.; Malakhov, A.A.; Bessarabov, D.G. A thermally conductive Pt/AAO catalyst for hydrogen passive autocatalytic recombination. Catalysts 2021, 11, 491. [Google Scholar] [CrossRef]
  45. Kozhukhova, A.E.; du Preez, S.P.; Bessarabov, D.G. Preparation of Pt/Ce–Zr–Y mixed oxide/anodized aluminium oxide catalysts for hydrogen passive autocatalytic recombination. Int. J. Hydrogen Energy 2022, 47, 12726–12738. [Google Scholar] [CrossRef]
  46. Kozhukhova, A.E.; du Preez, S.P.; Bessarabov, D. Preparation of highly active and thermally conductive Platinum nanoparticle/Ce–Zr–Y mixed oxide/AAO washcoat catalyst for catalytic hydrogen combustion technologies. ACS Appl. Nano Mater. 2022, 5, 8161–8174. [Google Scholar] [CrossRef]
  47. Kozhukhova, A.E.; du Preez, S.P.; Shuro, I.; Bessarabov, D.G. Preparation of a cartridge-type Pt/Al2O3 catalyst using a sputter deposition method for catalytic hydrogen combustion. Energ Fuel 2022, 36, 13911–13923. [Google Scholar] [CrossRef]
  48. Kozhukhova, A.E.; du Preez, S.P.; Bessarabov, D.G. Development of Pt–Co/Al2O3 bimetallic catalyst and its evaluation in catalytic hydrogen combustion reaction. Int. J. Hydrogen Energy 2023, 51, 1079–1096. [Google Scholar] [CrossRef]
  49. Roine, A. HSC Chemistry [Software], Version 10; Metso: Pori, Finland, 2024. Available online: https://www.metso.com/portfolio/hsc-chemistry/ (accessed on 16 February 2024).
  50. Ridwan, M.K.; Saptoadi, H.; Afifah, N.A.; Akbar, R.A.; Asy-Syahrani, M.A. Analysis of the Effect of More Fuel and Air Variations Excess Air on Combustion Process Simulation at a 10 kW Biomass Power Plant Using ASPEN PLUS. J. Phys. Conf. Ser. 2024, 2828, 012032. [Google Scholar] [CrossRef]
  51. Appel, C.; Mantzaras, J.; Schaeren, R.; Bombach, R.; Inauen, A.; Kaeppeli, B.; Hemmerling, B.; Stampanoni, A. An experimental and numerical investigation of homogeneous ignition in catalytically stabilized combustion of hydrogen/air mixtures over platinum. Combust. Flame 2002, 128, 340–368. [Google Scholar] [CrossRef]
  52. Pizza, G.; Frouzakis, C.E.; Mantzaras, J.; Tomboulides, A.G.; Boulouchos, K. Dynamics of premixed hydrogen/air flames in microchannels. Combust. Flame 2008, 152, 433–450. [Google Scholar] [CrossRef]
  53. Mantzaras, J.; Bombach, R.; Schaeren, R. Hetero-/homogeneous combustion of hydrogen/air mixtures over platinum at pressures up to 10bar. Proc. Combust. Inst. 2009, 32, 1937–1945. [Google Scholar] [CrossRef]
  54. COMMISSION REGULATION (EU) No 813/2013 of 2 August 2013 Implementing Directive 2009/125/EC of the European Parliament and of the Council with Regard to Ecodesign Requirements for Space Heaters and Combination Heaters. 2013. Available online: https://eur-lex.europa.eu/legal-content/EN/TXT/PDF/?uri=CELEX:32013R0813&rid=1 (accessed on 25 June 2025).
  55. Schmidt, N.; Müller, M.; Preuster, P.; Zigan, L.; Wasserscheid, P.; Will, S. Development and characterization of a low-NOx partially premixed hydrogen burner using numerical simulation and flame diagnostics. Int. J. Hydrogen Energy 2023, 48, 15709–15721. [Google Scholar] [CrossRef]
  56. Tanno, S.; Ito, Y.; Michikawauchi, R.; Nakamura, M.; Tomita, H. High-Efficiency and Low-NOx Hydrogen Combustion by High Pressure Direct Injection. SAE Int. J. Engines 2010, 3, 259–268. [Google Scholar] [CrossRef]
  57. Barreiro, P.; Alava, I.; Blanco, J.M.; Lopez-Ruiz, G. An assessment of the operating conditions of the micromix combustion principle for low NOx industrial hydrogen burners: Numerical and experimental approach. Int. J. Hydrogen Energy 2024, 66, 208–222. [Google Scholar] [CrossRef]
  58. EN 30-2-1:2015; Domestic Cooking Appliances Burning Gas—Part 2-1: Rational Use of Energy—General. Slovenski Inštitut za Standardizacijo: Ljubljana, Slovenia, 2015.
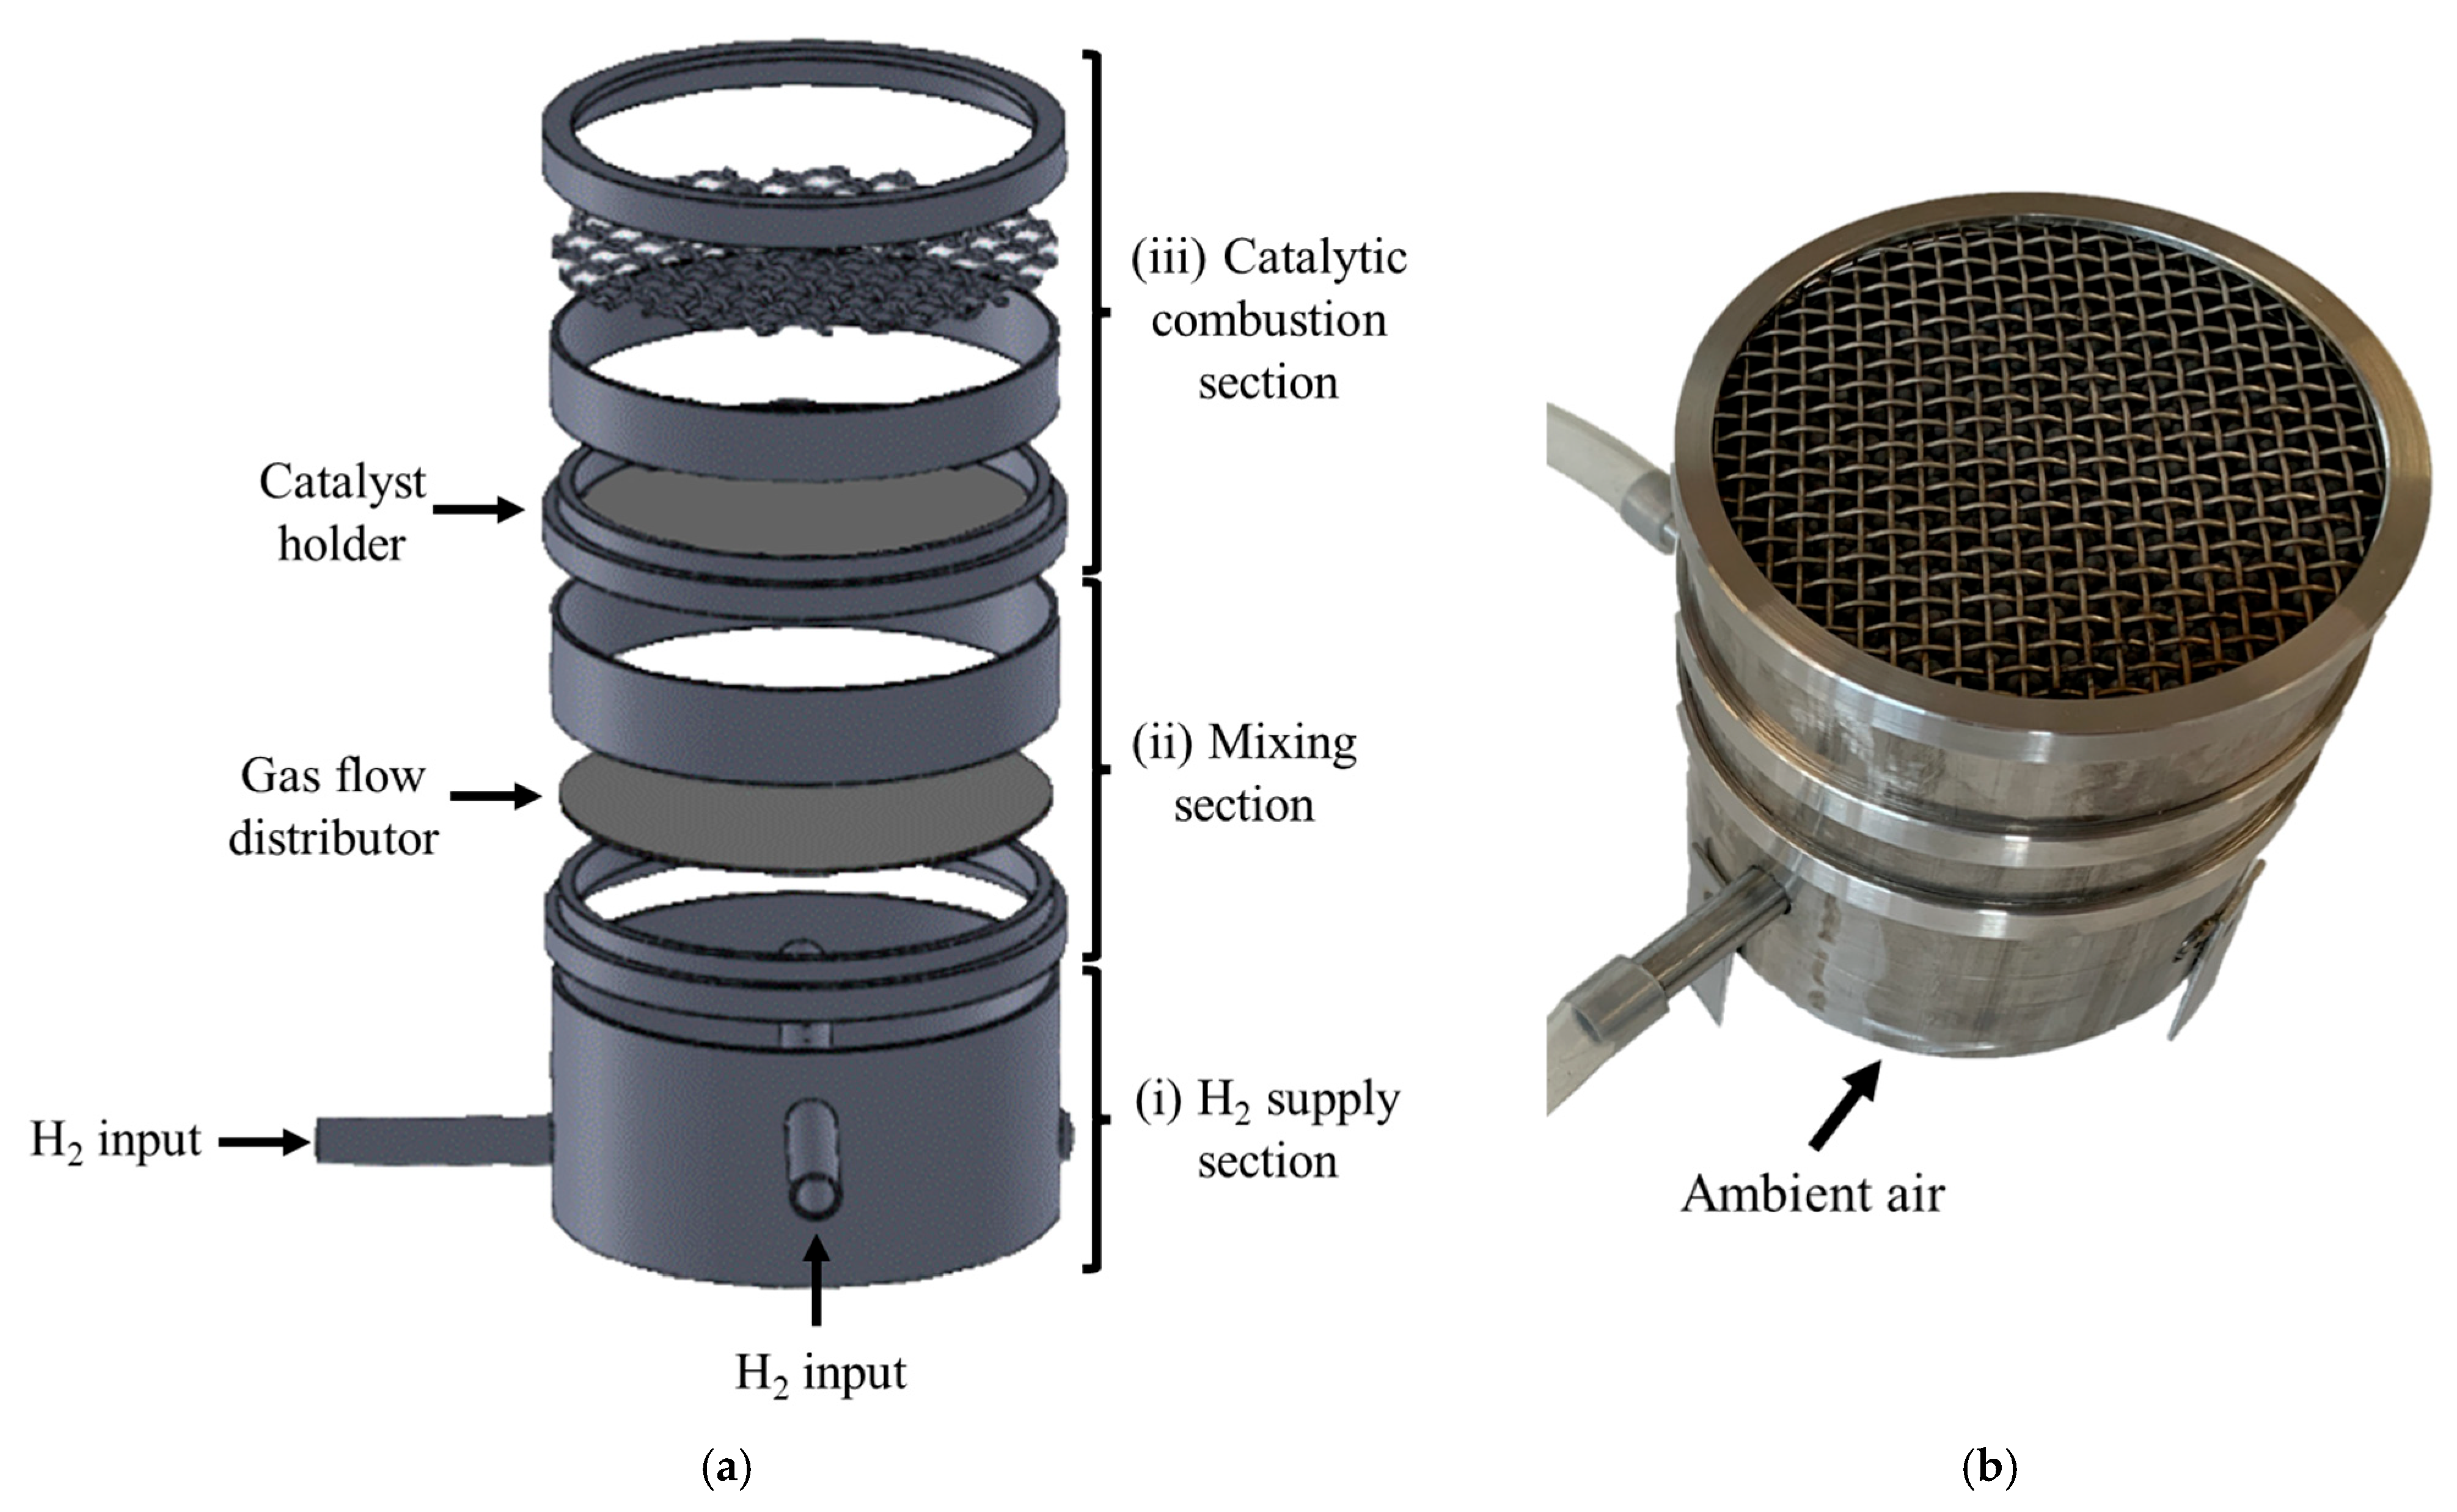
Figure 1. (a) Schematic and (b) photograph of the prototype of the cooking device based on CHC technology.
Energies 18 05074 g001
Figure 2. Schematic of the experimental setup for evaluation of the catalytic hydrogen cooking device.
Energies 18 05074 g002
Figure 3. Temperature mapping of the catalyst surface operating at the H2 flow of (a) 1, (b) 2, (c) 3, (d) 4, and (e) 5 NL/min taken by an IR camera.
Energies 18 05074 g003
Figure 4. Effect of normalized air-to-fuel ratio (Λ) on the adiabatic combustion temperatures of H2 in air (black markers) calculated using the thermodynamic software package HSC 10 [49]. Excess H2 (green markers), excess O2 (blue markers), and the amount of N2 (red markers) are shown in the secondary y-axis.
Energies 18 05074 g004
Figure 5. Equilibrium amounts of (a) NO, (b) NO2, and (c) N2O during the combustion of H2 in air at Λ of 0.0625, 0.125, 0.5, 1, 2, and 10, calculated using the thermodynamic software package HSC 10 [49].
Energies 18 05074 g005
Figure 6. NOx emission (primary y-axis) and combustion temperatures (secondary y-axis) determined during operation of the cooking device at an inlet H2 flow of 1–5 NL/min.
Energies 18 05074 g006
Figure 7. The equilibrium amounts for NO, NO2, and N2O at Λ = 0.05 and 8 over a combustion temperature range relevant to the temperature achieved using the considered prototype, calculated using the thermodynamic software package HSC 10 [49].
Energies 18 05074 g007
Figure 8. Photograph of the cooking device demonstrating the air intrusion part.
Energies 18 05074 g008
Figure 9. Efficiency of the cooking device estimated by heating 500 mL of water from 20 to 90 °C using inlet H2 flow of 1–5 NL/min.
Energies 18 05074 g009
Table 1. H2 slip and O2 concentrations determined during the operation of the cooking device at inlet H2 flows of 1–5 NL/min.
H2 Flow, NL/min12345
H2 inlet, vol%12.40 ± 1.3325.79 ± 1.7434.80 ± 2.8241.92 ± 2.0847.87 ± 2.11
H2 slip, vol%0.04 ± 0.021.04 ± 0.703.58 ± 1.628.05 ± 1.9812.17 ± 2.31
O2, %14.5 ± 0.310.2 ± 0.19.3 ± 0.37.8 ± 0.16.3 ± 0.8
Table 2. The combustion temperature, H2 slip, NO, NOx, and O2 determined during the operation of the cooking device at inlet H2 flows of 1–5 NL/min.
H2 Flow, NL/min12345
T, °C324.5 ± 6.5450.1 ± 9.0559.7 ± 11.2587.0 ± 11.7611.2 ± 12.2
H2 slip, vol%0.09 ± 0.040.10 ± 0.070.59 ± 0.211.58 ± 0.561.75 ± 0.35
Flue gas analysis
NO, ppm2.5 ± 0.43.3 ± 0.53.7 ± 0.43.9 ± 0.54.1 ± 0.4
NOx, ppm2.8 ± 0.43.4 ± 0.44.0 ± 0.44.2 ± 0.24.4 ± 0.4
O2, %19.1 ± 0.218.7 ± 0.118.6 ± 0.118.8 ± 0.118.7 ± 0.1
Disclaimer/Publisher’s Note: The statements, opinions and data contained in all publications are solely those of the individual author(s) and contributor(s) and not of MDPI and/or the editor(s). MDPI and/or the editor(s) disclaim responsibility for any injury to people or property resulting from any ideas, methods, instructions or products referred to in the content.