Abstract
Food waste (FW) sourced from treatment facilities is predominantly in solid form, with low water content and high variations in organic content. High organic content in FW is ideal in anaerobic digestion for bioenergy applications, but proper monitoring during start-up operations should be employed to avoid imbalance in the acidogenic/methanogenic population due to volatile fatty acid (VFA) accumulation in the system. The seed inoculum (5 L) in each horizontal anaerobic reactor (HAR) was fed with food waste without effluent flow (filling-up phase) until it reached the final working volume of 10 L (continuous phase). The pH, alkalinity, chemical oxygen demand (COD), VFA, biogas production, methane concentration, and microbial community dynamics were set as stability indicators during reactor operation. The results revealed that introducing fluctuations in FW concentrations does not negatively affect the biogas production (1.7 ± 0.2 L/LR/d) and methane concentration (59.0 ± 2.5%). Acclimatization of the methanogenic and bacterial population was also observed. This study aimed to evaluate the influence of fluctuating FW concentrations on the process performance of horizontal anaerobic reactors, focusing on process stability, microbial dynamics, and biogas output during filling-up and continuous phases.
1. Introduction
The production and consumption of food around the world are dynamic and evolving. There is a pressing need to increase food production to feed a growing population, yet roughly one-third of all food generated each year is lost to waste [1,2]. In response to limiting the environmental effects of food waste (FW) generation, such as decomposition in landfills or contribution to greenhouse gases through incineration, anaerobic digestion (AD) has emerged as an important technology for the valorization of the organics in FW and bioconversion to bioenergy [3,4]. AD is a biological process wherein microorganisms break down the biodegradable organic material in an oxygen-free environment, converting it into valuable byproducts: a methane-rich biogas and a nutrient-rich digestate that can be used as biofertilizer [5,6]. Despite the technological advantages of AD for FW treatment, the process itself is often constrained by instability. This instability arises from the property of FW being energy-dense and readily biodegradable. The biological breakdown of FW, particularly the carbohydrate fraction, leads to rapid accumulation of intermediate metabolic products, namely volatile fatty acids (VFAs) [5,7]. The hydrolysis and acidogenesis stages can kinetically outpace the slower and rate-determining methanogenesis stage. When the rate of VFA production exceeds the rate of VFA consumption by methanogenic archaea, the alkalinity of the system is consumed, leading to a precipitous drop in pH. This acidification further inhibits the methanogens, creating a feedback loop that culminates in complete process failure [8,9]. Most of the time, the root cause of this kinetic imbalance is the inherent heterogeneity, complexity, and variability of FW as feedstock. Unlike more consistent industrial effluents, FW streams are subject to fluctuations in concentration, as measured by the organic loading rate (OLR), and composition, including carbohydrates, proteins, and lipids [10,11,12]. These fluctuations are driven by different factors such as the source of FW (e.g., household, restaurant, industrial), geographical location, and seasonality [1,6].
To address the challenge of feedstock variability, reactor design appears as a determinant of process performance. Not all AD configurations are equally suited and capable of handling fluctuations in FW compositions and concentrations. Characterized by its horizontal layout, HARs facilitate the horizontal movement of the substrate from the inlet to the outlet with minimal axial mixing, approximating a “plug-flow” hydraulic set-up. The nature of the HAR allows for the establishment of spatial gradients in substrate concentration, metabolic intermediates, and microbial populations along its length [13]. The spatial segregation effectively creates distinct functional zones within a single reactor, where the different stages of anaerobic digestion (hydrolysis, acidogenesis, acetogenesis, and methanogenesis) occur. The horizontal layout of the reactor, along with a slow mixing rate, confers resilience against the shock loads and compositional fluctuations typical of FW substrates. The defining operational characteristic of an HAR stems directly from its plug-flow hydrodynamics. The development of spatial gradients along the length of the reactor, as the substrate moves inside from the inlet to the outlet, alters the biochemical and physicochemical properties of the system through the sequential processes of the microbial consortium. This dynamic process creates distinct and functionally stratified zones inside the HAR [14]. Near the reactor inlet, the substrate is rich in complex and undigested organic matter. The hydrolytic and acidogenic bacteria are the most active, breaking down polymers into monomers, with subsequent conversion to VFAs. Consequently, this zone is characterized by high concentrations of VFAs, high chemical oxygen demand (COD), and a lower pH. As the unreacted substrate and other organic matter move downstream, the concentration of complex substrates decreases while VFA concentrations peak and then begin to decline. This transitional zone is dominated by acetogenic bacteria, which convert higher-order VFAs into acetate, hydrogen, and carbon dioxide. Lastly, towards the end of the reactor, the substrate consists mainly of simple methanogenic precursors. In this zone, methanogenic archaea thrive, consuming the VFAs and hydrogen to produce methane. This final stage is characterized by low VFA concentrations, near-neutral pH, and the highest rates of methane production [13,15]. A related study investigated the performance of methanogenesis in lab-scale HARs fed with randomized acetate at concentrations to introduce fluctuations at 85 ± 20% g COD/L. The results divulged that although the residual acetate concentration in the effluent initially fluctuated in response to the variable substrate, the process showed self-stabilization. Over the 80-day operational period, the variance in effluent acetate decreased, and the system achieved a stable and high degradation efficiency of approximately 90%. Importantly, both the daily biogas production rate and methane concentration remained stable despite the fluctuations in the influent substrate concentration [16].
In this study, two HARs were employed to investigate the effect of fluctuating food waste concentration and hydraulic retention time (HRT) on AD process performance, focusing on microbial population dynamics and biogas production. The introduced fluctuations in food waste concentration and reductions in HRT influence AD microbial community dynamics during start-up (filling-up phase) and reactor operation (continuous phase). The specific objectives of this study were (1) to mimic the fluctuations in food waste concentration typical of field-scale digesters in a controlled lab-scale HAR set-up; (2) to assess the process performance towards the end of the HARs (effluent sampling) where methanogenesis is predominant; (3) to establish a reactor start-up method where varied FW was introduced in lower volumes during the filling-up phase, commencing to the continuous phase with an acclimatized microbial community; and (4) to correlate the fluctuations in FW concentration to reactor performance indicators (physicochemical variables) and microbial community using multivariate analysis. The key success criteria and process stability indicators for this study were (1) stable operating temperature (35–40 °C) and pH (7.5–8.0); (2) stable reactor performance, such as consistent alkalinity, VSS, total and soluble chemical oxygen demand (COD and sCOD); (3) stable biogas output (consistent biogas production and methane concentration); and (4) acclimatized microbial community. The present study is a pioneering attempt to investigate a start-up strategy involving the introduction of fluctuating FW concentrations and its influence on the process performance and biogas output towards the end of the HAR where methanogenesis occurs.
2. Materials and Methods
2.1. Seed Inoculum and Food Waste
The seed inoculum was sourced from a mesophilic (35–37 °C) full-scale digester in Daegu, South Korea. The seed inoculum was settled and starved at 37 °C for 48 h to allow the existing microbes to digest the residual organics, also collecting biogas in Tedlar bags to prevent pressure build-up in the containers. The settled and concentrated seed inoculum was collected and used for HAR operation. Table 1 shows the physical and chemical characteristics of the initial seed inoculum used in this study. The methodologies employed in characterizing the seed inoculum, such as pH, chemical oxygen demand (COD), soluble COD (sCOD), total solids (TS), volatile solids (VS), total suspended solids (TSS), volatile suspended solids (VSS), and VFA + Ethanol were the same as those for monitoring the process performance of the reactors, as shown in Section 2.4 (physicochemical analyses). FW was sourced biweekly from a food waste treatment facility in Pohang, South Korea. The same batch of FW was fed into the reactors every 12 h during a period of around two weeks until a fresh batch of FW was collected. The FW samples were kept in a 4 °C refrigerator prior to feeding.

Table 1.
Physical and chemical characteristics of seed inoculum.
2.2. Horizontal Anaerobic Reactor (HAR)
Two HARs (R1 and R2) were custom fabricated with dimensions of 450 mm (L) × 180 mm (W) × 180 mm (H), with a total volume of 14.6 L and a working volume of 10.0 L each. Settled seed inoculum (5 L) was added to each reactor to initiate the filling-up phase. Each reactor was equipped with a central horizontal mixing shaft fitted with paddles and driven by an external motor to ensure uniform mixing. The temperature was maintained via internal tubing connected to a recirculating water bath, which was managed using a resistance temperature detector (RTD) probe and a temperature controller. The temperature controller turned the water bath on and off automatically to regulate and maintain the set temperature. Figure 1 shows the photograph and schematic diagram of the HARs.
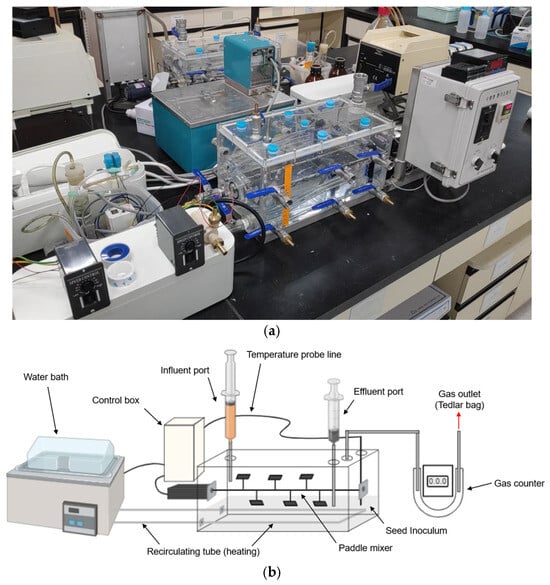
Figure 1.
(a) Photograph and (b) schematic diagram of the horizontal anaerobic reactor (HAR).
2.3. Reactor Operation and Feeding Strategy
The HARs with settled seed inoculum were fed with variable concentrations of FW into each reactor without further dilutions. For the filling-up phase, the feeding of FW into each reactor was performed using a 200 mL syringe every 12 h, and a minimal amount (~10 mL) of effluent was collected until the working volume (10 L) was reached. Table 2 shows the experimental parameters employed for operating the HARs. The volume of food waste fed was increased gradually every other week, from 0.1 to 0.15 mL, at 0.01 mL increments. The total net volume added during the filling-up phase was 5 L, with adjustments in the final period to account for sampling volumes and to reach the final working volume of 10 L.
Table 2.
Experimental parameters for HAR operation.
The continuous phase commenced once the working volume was achieved, and the volume of FW fed (input) was accompanied by collecting the same volume of effluent (output) using a separate syringe to maintain the working volume (0.25 mL). The effluent port was situated towards the end of the HAR. Portions of the collected effluent were used for physicochemical and microbial analyses. Gas volume was quantified using a gas counter and the gas was collected in a Tedlar bag prior to composition analysis. The reactors were operated for 260 d with a constant mixing rate of 3 rpm at 37 °C.
2.4. Physicochemical Analyses
The physicochemical properties were monitored and analyzed to maintain the process performance and stability of the reactors. The pH of the effluent was measured using a benchtop pH meter. The total and soluble chemical oxygen demand (COD and sCOD), measurements for solids, including volatile suspended solids (VSS), and alkalinity were analyzed using Standard Methods [17]. The soluble samples were prepared by using a 0.45 µm porosity Ministar-RC membrane filter (Sartorius, Göttingen, Germany). The daily biogas production was measured by an electronic gas counter consisting of a U-tube manometer and a solenoid valve. The gas passed through a line and was subsequently collected in Tedlar bags. For biogas composition and methane content analysis, the sampled gas samples from the Tedlar bags were injected into a gas chromatograph (6890 Plus, Agilent, Palo Alto, CA, USA) equipped with an HP-5 capillary column and a thermal conductivity detector (GC-TCD). The VFA concentration was measured using a gas chromatograph (6890 Plus, Agilent, Palo Alto, CA, USA) equipped with an HP INNOWax capillary column and a flame ionization detector (GC-FID). The gas chromatograph inlet and detector temperatures were set at 50 °C and 250 °C, respectively. The column oven temperature was set at 60 °C. All analyses were performed in duplicate.
2.5. Microbial Community Analysis
For microbial community analysis, a small portion (~2 mL) of the effluent from the two reactors at different time points during the filling-up phase (0 d, 15 d, 30 d), at 69 d when the working volume was reached, and at 245 d (near the endpoint) when stable operation was observed, were processed and stored at −81 °C. Prior to DNA extraction, the frozen samples were thawed and centrifuged. Total genomic DNA extraction was performed using a magLEAD® 12gC and magLEAD® consumable kit (Precision System Science, Chiba, Japan) following the protocol shown in the manual. Afterwards, a Qubit ® 3.0 Fluorometer (Invitrogen, Carlsbad, CA, USA) was used to quantify the extracted DNA concentration. The microbial community analysis was performed using an Illumina® iSeq 100 sequencing system (Illumina, San Diego, CA, USA) with Nextera® XT index kit v2 (Illumina). The amplification of the microbial 16S rRNA was performed using selected primers: (1) BAC518 F (5′-CCAGC AGCCG CGGTA ATACG-3′) and BAC805 R (5′-GACTA CCAGG GTATC TAATC C-3′) were used as primers to amplify the V4 hypervariable region of the bacterial 16S rRNA gene; (2) ARC787 F (5′-ATTAG ATACC CSBGT AGTCC-3′) and ARC1059 R (5′-GCCAT GCACC WCCTC T-3′) were used as primers to amplify the V5-6 hypervariable regions of the archaeal 16S rRNA gene [18,19]. UPARSE (USEARCH ver. 7.0.1090, Sonoma, CA, USA) was utilized to cluster sequences with ≥97% similarity as operational taxonomic units (OTUs). Classification of the OTUs was carried out by referencing the NCBI BLAST (ver. 2.10.0) [20]. The relative abundance (%) for both the bacterial and archaeal communities were calculated by dividing the specific microbial reads over the total sequence reads.
2.6. Statistical Analysis
Each reactor afforded values (mean ± standard deviation) based on the physicochemical analysis of the effluent. The analysis results of 16S rRNA sequencing data were used to perform non-metric multidimensional scaling (NMDS) ordination, using Bray–Curtis distance, and cluster analysis by the unweighted pair group method with arithmetic averages (UPGMA), to visualize the similarities in the bacterial and archaeal community structure changes in the reactors over time [16,19]. The performance indicators (physicochemical variables) and microbial community composition were correlated at different time points of reactor operation through visualization using canonical correspondence analysis (CCA) [21,22]. A permutation test (n = 999) was conducted for the evaluation of the significance of the relationships between performance indicators and microbial community. All statistical tests were performed using PAST v4.03 for Windows.
3. Results and Discussion
3.1. Reactor Performance
The reactor process performance was measured by monitoring the physicochemical variables, such as the pH, alkalinity, COD, sCOD, VSS, and biogas, while carefully maintaining the mixing rate (3 rpm) and temperature (37 °C). Slow mixing rates of around 3–5 rpm were proven to be advantageous for the maintenance and upkeep of the microbial communities in the reactors. A research study focusing on mixing, specifically shear rates, on the performance and microbial ecology of anaerobic digesters shows that higher mixing rates introduce excessive shear stress and agitation that disrupts the spatial contact between the substrate, bacteria, and archaea, especially during the start-up phase, negatively affecting digester performance evidenced by lower biogas yields and higher VFA accumulation [23]. Maintaining the temperature around 30–40 °C provides a suitable environment for ensuring optimal methanogenic activity, with most bacteria also active around this temperature, leading to a more efficient substrate bioconversion to methane [24,25]. The pH of the reactors impacts AD by affecting microbial activity and the overall digestion process. Optimal pH ranges vary according to the different stages of AD, with the acid-producing bacteria thriving at around pH 6.0–8.0, while methanogens require a narrower pH or around 6.8–7.2 [26,27]. Figure 2a shows the average pH and alkalinity of the two HARs during operation. There was an observed decrease in pH during the first few days of operation, from the initial seed pH of around 8 to less than 7.5, after which the pH increased again to around 7.8 during the filling-up phase. The pH was observed to stabilize at a range of 7.6–8.0 during the continuous phase. The same trend was also observed for the alkalinity of the reactors, which stabilized around 13–16 g/L during the continuous phase. Alkalinity acts as a natural buffer preventing drastic changes in the pH of the reactor system that could otherwise lead to microbial activity inhibition [28,29].
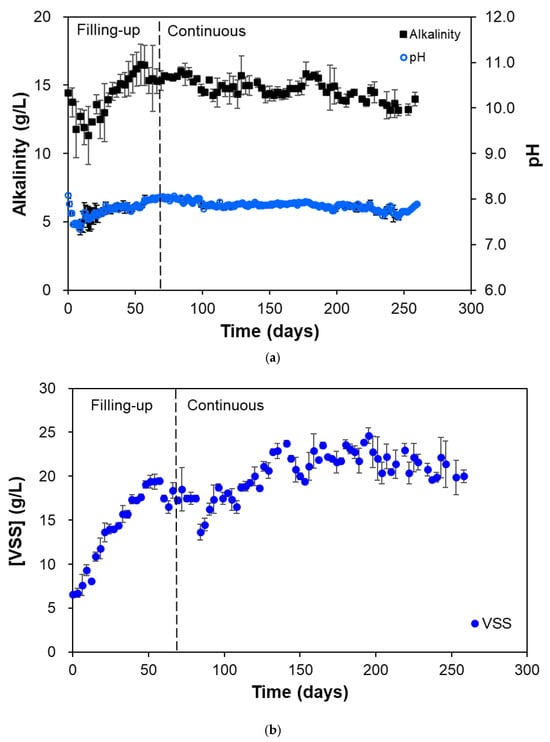
Figure 2.
(a) Alkalinity, pH, and (b) VSS concentration of the effluent during HAR (R1 and R2) operation.
The VSS concentration was also monitored to estimate the microbial concentration present in the HARs during operation. The VSS approximates the organic solids concentration in the reactor, derived from the measurement of volatile solids through gravimetric means. Since bacteria and archaea are mostly organic in nature, the VSS concentration is directly proportional to the microbial concentration in the system [30,31,32]. The VSS of the two HARs both exhibited a steep increase up to the end of the filling-up phase. A second increase in VSS concentration was observed from 100 to 150 d until stabilization at around 20–25 g/L from 150 d onwards, indicating that the estimated microbial concentrations also achieved stability (Figure 2b).
3.2. Substrate Degradation
The fluctuations in FW concentration fed in the reactors imparted a degree of process stability in terms of effluent COD concentrations during operation, as shown in Figure 3a. Experimentally, the variations in FW concentration fed were found to be within the range of around 180–280 g COD/L. This led to high variations in OLR as well, but the effluent COD concentrations exhibited a narrow range of around 30–40 g/L. Effluent COD stability was observed both during the filling-up phase and continuous phase, meaning that the start-up strategy of gradually increasing FW concentration led to a more stable microbial community that acclimatized to receive higher OLRs during the continuous phase. Effluent COD is usually expressed as a constraint parameter in AD operations, as higher COD values affect biogas production efficiency and are hazardous for the microorganisms in the reactor [33]. The microbial community was able to handle and utilize the fluctuations in FW concentration, further evidenced by monitoring the sCOD and VFA concentrations of the effluent. The sCOD concentration is the amount of readily available organic matter that can be utilized by the microorganisms in the system, specifically during the hydrolysis and acidogenesis phases of AD. But sCOD alone is not enough as a suitable parameter to determine the overall AD performance [34]. High sCOD in a system signifies a higher potential for biogas production and fluctuations in sCOD values during reactor operation can indicate issues with hydrolysis or acidogenesis phases, leading to instability and failure of the reactor. Another important variable to monitor is the VFA concentration. VFAs, particularly acetic and propionic acids, are crucial intermediate products formed during the acidogenesis phase of AD. An increase in VFA concentration without a corresponding increase in methane production is a sign of process instability and imbalance, which could potentially lead to inhibition of methanogens through overloading or inadequate pH control [35,36,37]. Figure 3b shows the simultaneous monitoring of the effluent sCOD and VFA of the two HARs. The sCOD concentration was observed to stabilize at around 5–10 g/L, while the VFA concentration stabilized at around 1–3 g/L during the continuous phase.
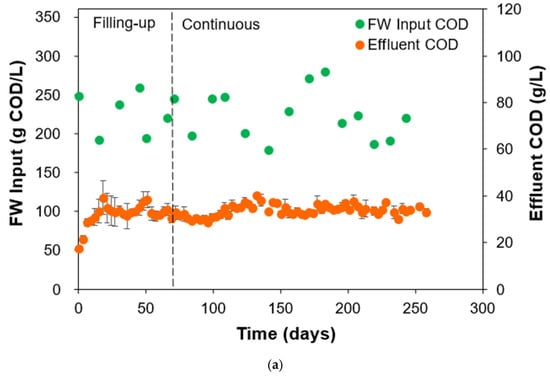
Figure 3.
(a) Variations in FW concentration fed, subsequent effluent concentration, and (b) effluent sCOD and VFA concentrations during HAR (R1 and R2) operation.
3.3. Biogas Production and Methane Concentration
The feeding of FW with highly varied concentrations influenced biogas production and methane concentration in both HARs (Figure 4). There was an observed increase in both biogas production and methane concentration until 21 d to 2.1 L/LR/d and 67%, respectively, followed by a decrease until the end of the filling-up phase (LR corresponds to reactor volume in liters). The filling-up phase afforded biogas production and methane concentration values of 1.5 ± 0.4 L/LR/d and 55.9 ± 15.1%, respectively. The initial high biogas production followed by fluctuations is characteristic of AD systems during start-up, where VFA accumulation and pH instability can occur. The commencement of the continuous phase showed a higher and sustained but fluctuating biogas production at 1.7 ± 0.2 L/LR/d and methane concentrations at 59.0 ± 2.5% from 70 d to 260 d of HAR operation. The sustained biogas production rate is consistent with food waste AD systems operating under mesophilic conditions (30–40 °C) [38,39]. For methane concentration stability, it was notable that the overall performance fell within the typical methane concentration of 50–70% of biogas output from food waste AD [40,41]. The transition point between the filling-up and continuous phases at 69 d marked a critical operation milestone wherein the system undergoes a shift from batch-like start-up conditions to steady-state operation [42]. The FW fed with concentrations ranging from 180 to 280 g COD/L represents a high organic loading. Despite these concentration fluctuations, the HARs maintain stable process performance, leading to sustained biogas production and methane concentration, albeit with fluctuations due to the nature of the FW fed. This suggests that the microbial community effectively adapted to the fluctuations of FW concentrations introduced in the system [16,43]. Higher COD concentrations typically correlate with increased biogas output, but they also pose risks of process instability without proper monitoring and management [44]. The sustained biogas performance observed in this study shows that the reactor design and operational parameters were well-suited for handling high organic loads.
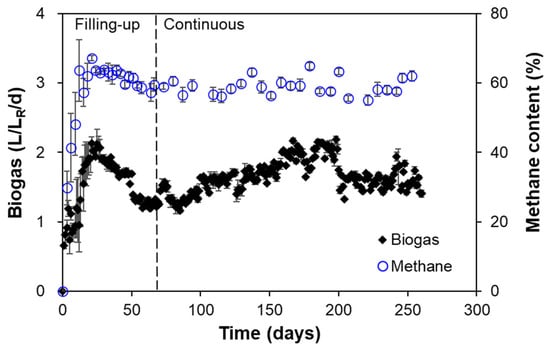
Figure 4.
Daily biogas production and methane concentration during HAR (R1 and R2) operation.
3.4. Microbial Community Analysis
To characterize the microbial communities (bacteria and archaea) during HAR operation, an analysis was conducted using the 16s rRNA gene high-throughput sequencing on the initial (0 d), during the filling-up phase, when complexities arise due to increases in FW volume fed (15 d and 30 d), right before the continuous phase (69 d), and during continuous phase operation, right around the endpoint, when microbial acclimatization occurred as evidenced by observed performance indicators (245 d). The results divulged 754 different OTUs for the bacterial communities, which were classified into 27 predominant species, and 176 different OTUs for the archaeal communities, which were classified into 9 predominant species. The OTUs were considered predominant if the numbers of relative abundance were greater than 1% in at least one sample. The others were considered as minor species. The initial microbial community structure observed at 0 d, particularly the dominance of acetoclastic methanogens, represents a population optimized for stability and non-inhibitory conditions. However, the community was fundamentally mismatched with the harsh operating parameters of the reactors, specifically the introduction of high variability in FW concentrations. The environmental effect of these changes in FW concentrations acted as a stressor, eliminating the more sensitive species, leading the way for acclimatizing the more robust microbial community. This acclimatized community was capable of performing the conversion of organic waste to methane, but through an alternative, more resilient metabolic route. The filling-up phase of the HAR operation was characterized by a diverse bacterial community responsible for the primary and secondary fermentation of the complex FW.
For the analysis of bacterial communities (Figure 5a), genera such as Bacteroides and Defluviitalea were present, playing key roles in the hydrolysis of complex carbohydrates and proteins into simpler monomers and their subsequent degradation into a mixture of VFAs, alcohols, hydrogen (H2), and carbon dioxide (CO2) [45]. Syntrophomonas sapovorans, an obligate syntrophic fatty acid-oxidizing bacterium, showed a distinct increase in abundance between 15 d and 69 d from 0.5 to 1.0%, as its metabolism centers on the β-oxidation of saturated and unsaturated long-chain fatty acids (LCFAs), which are common components of food waste, into acetate and H2. This process is thermodynamically feasible only when the H2 produced is quickly consumed by a syntrophic partner, such as a hydrogenotrophic methanogen. The rise and subsequent decline of the S. sapovorans population served as a metabolic indicator for the progression of the AD process, as its peak abundance corresponds to the period when its primary substrates, LCFAs from the FW, were most available [46,47]. Another key species observed was Acetivibrio saccincola, a bacterium from the genus Acetivibrio, which is known in the literature to efficiently degrade lignocellulose, particularly cellulose and cellobiose, to its component glucose [48,49]. A. saccincola was present in both reactors (17% average relative abundance) at 0 d, but a population decline was observed, due to the effect of changes in composition of FW fed. The species partially recovered at around the start of the continuous phase, but a gradual decrease was again observed until around the endpoint of reactor operation. Another interesting species observed was Caldalkalibacillus thermarum, a thermophilic, alkaliphilic, and strictly aerobic bacterium [50]. The origin of the bacterium in the seed inoculum was unknown, but the anaerobic nature of HAR operation led to decline in its population from average relative abundance of 19% at 0 d to negligible (<1%) at 245 d. It was also observed that Bacteroides propionicifaciens, an important bacterium in terms of AD operation due to its ability to produce acetate and propionate (methane precursors), acclimatized well with an increase in average relative abundance from less than 1% at 0 d to 32% at 245 d [51]. Another notable bacterium, Proteiniphilum acetatigenes, maintained a significant population throughout the HAR operation. P. acetatigenes is proteolytic, a versatile bacterium capable of hydrolyzing amino acids and peptides to produce acetate [52,53].
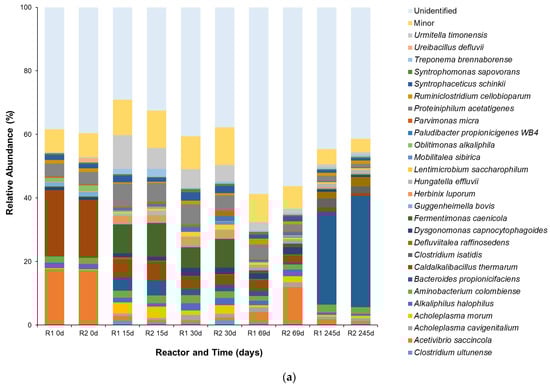
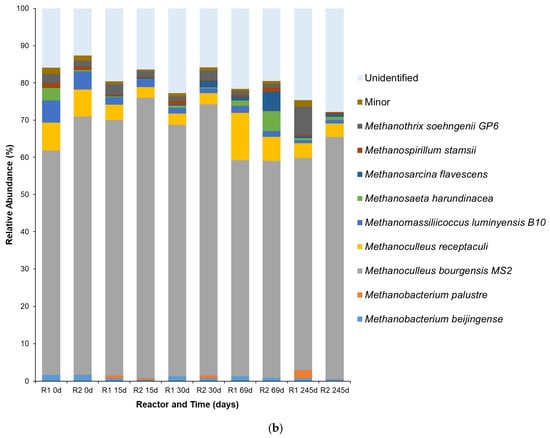
Figure 5.
Species-level (a) bacterial and (b) archaeal populations at different time points of HAR (R1 and R2) operation. Populations with relative abundance < 1% were categorized as part of the minor group.
Meanwhile, the archaeal community analysis (Figure 5b) revealed the acclimatization of methanogens capable of converting the bacterial products, particularly as the population of acetate and propionate bacteria dominated. At the onset of the HAR operation (0 d), Methanothrix soehngenii was observed in the communities, with an average relative abundance of 1.8 ± 0.7% for both reactors during the filling-up phase. M. soehngenii is an efficient acetoclastic methanogen, as it produces methane through the decarboxylation of acetate [54]. Its high affinity for acetate and tendency to form a filamentous morphology make it an indicator of stable anaerobic digesters operating with low VFA concentrations. However, this specialization is also its vulnerability. Acetoclastic methanogens, including M. soehngenii, are highly sensitive to environmental perturbations, particularly elevated concentrations of unionized VFAs, which are characteristic of high-load food waste digestion [55,56]. This sensitivity was illustrated by the population decline of the Methanothrix population, particularly for R2 at 245 d (0.14%). For R1, the observed Methanothrix population was 7.6%, higher than the value observed for R2. This was due to the difference in VFA concentrations between the reactors at 245 d, with R1 having a lower VFA concentration than R2, at 1.8 and 2.6 g/L, respectively. On the other hand, the dominance of Methanoculleus bourgensis MS2 in both reactors was obvious, having an average relative abundance of 62.5% throughout the HAR operation. The genus Methanoculleus are frequently identified as key syntrophic partners for acetate-oxidizing bacteria, particularly in digesters operating with high ammonia levels [57]. The dominance of this genus indicates that the primary substrate for methanogenesis in the HARs was no longer just acetate, but rather the H2 and CO2 produced by a different group of organisms, particularly if fed by FW with high protein concentrations [58]. The acclimatized hydrogenotrophic community was further stabilized by the presence of Methanobacterium beijingense; although lower in terms of its relative abundance, like Methanoculleus, M. beijingense is a hydrogenotrophic methanogen that uses H2/CO2 and formate to produce methane [59]. Methanomassiliicoccus luminyensis B10 was also observed, albeit at average relative abundance of less than 5% throughout HAR operation. M. luminyensis is a hydrogen-dependent methylotroph capable of reducing compounds like methanol with H2, adding another layer to the H2-consuming capacity of the HAR [60,61]. Lastly, Methanoculleus receptaculi, another hydrogenotrophic methanogen, was observed at average relative abundances fluctuating in a range of 4–13% throughout the HAR operation. M. receptaculi was reported to be involved in the degradation of elevated levels of propionate and butyrate, but not directly in the conversion of formate, acetate, or methanol into methane [62,63]. The only limitation observed was the proportion of unidentified taxa being very high, particularly for the bacteria at the species level. Most amplicon-based sequencing (e.g., 16S rRNA gene) has limited resolution below the genus level, and many sequences cannot be confidently assigned at the species level due to incomplete or ambiguous reference databases. While the objective of the current study was to find specific species capable of utilizing the FW substrate fed and their population shift, reflecting their ability to resist the changes or fluctuations in high organic loading settings, the microbial community analysis presented in this study refers to a small subset of the community.
3.5. Statistical Analysis
NMDS analysis (Figure 6a) shows the key results pertaining to the bacterial and archaeal relative abundance of OTUs in the HARs during operation. The values for stress = 0.096 and R2 = 0.62 show good ordination representing the high-dimensional community data in two-dimensional space. This stress level is well within acceptable ranges for ecological community analyses, where values below 0.1 are generally considered excellent, and values up to 0.2 are acceptable [64]. The ordination distinguishes between two distinct clusters standing for different operational phases of the HARs. Cluster 1 encompasses samples from early operational periods (15 and 30 d) during the filling-up phase, characterized by variable groups and proximity to the process variables including sCOD, VFAs, and alkalinity. Cluster 2 contains the longer-term samples during the continuous phase (245 d) from both HARs, positioned distinctly in the ordination space and showing different relationships with the measured physicochemical variables, particularly methane production, COD, and VSS. The progression from initial conditions (0 d) through the two distinct operational phases reveals succession patterns. The NMDS results support microbial analysis results, showing that there were shifts in the bacterial and archaeal community structure that ultimately affected the process variables. The first shift could be attributed to microbial dynamics wherein FW utilization was significant. This affected the bacterial population, leading to them being acclimatized. The second shift was more inclined towards the acclimatization of both bacteria and archaea, as discussed in sub-Section 3.4, leading to stability in VSS (microbial) concentration and increase in methane production. The significance of the NMDS ordination employed was confirmed at p < 0.05. The UPGMA cluster dendrogram (Figure 6b) offers a complimentary result towards community similarity patterns, confirming the temporal clustering observed in the NMDS ordination. Early-phase clustering groups sampled from 15 and 30 d from both HARs were observed at relatively short distances, indicating high microbial community similarity during the filling-up phase. The initial samples (R1 0d, R2 0d) form a separate cluster, reflecting the starting seed inoculum community composition before significant operational changes occurred [65]. However, later-phase samples (R1 245d, R2 245d) cluster together but at greater distances from the early-phase communities, demonstrating substantial community restructuring over the extended operational period. This pattern suggests that long-term reactor operation led to selection for different microbial populations compared to the filling-up phase [66]. The intermediate samples (R1 69d, R2 69d), positioned between the filling-up and continuous phases, signified a transitional microbial community during HAR stabilization.
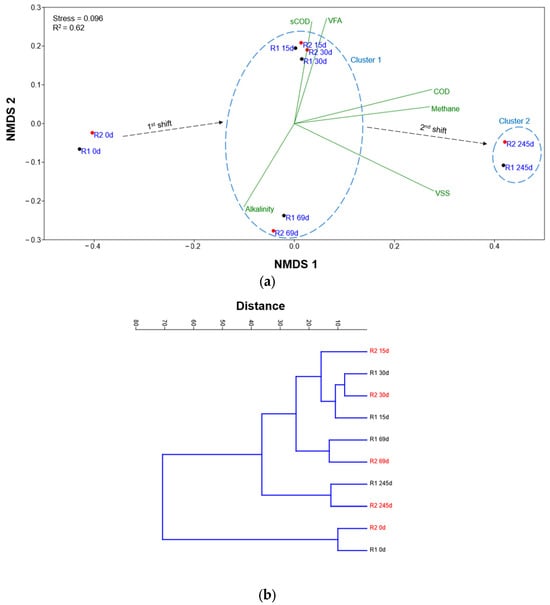
Figure 6.
(a) Non-metric multidimensional scaling (NMDS) ordination plot and (b) cluster dendrogram (UPGMA) based on the Bray–Curtis distance of the bacterial and archaeal species relative abundance of both HARs (R1—black, R2—red) at different time points.
The CCA plot (Figure 7) integrates microbial community data with HAR process performance variables, which are defined by the vector positions. The initial state of the reactors at 0 d is defined by the inoculum community. The CCA plot associates this starting point with two key organisms: the bacterium Caldalkalibacillus thermarum and the archaeon Methanomassiliicoccus luminyensis (p < 0.05). Methanomassiliicoccus is a member of the order Methanomassiliicoccales and represents a distinct line of methanogens. It is known to perform hydrogenotrophic methanogenesis, but with a unique substrate range, specializing in the reduction of methylated compounds such as methanol and methylamines using H2 as the electron donor. Its presence in the seed inoculum provides the system with an immediate, but limited, capacity for consuming H2, one of the key intermediates in AD. The association of 0 d samples with the “Alkalinity” vector simply reflects the initial chemical state of the HAR medium, which is well-buffered to withstand the initial phase of acid production. The samples obtained at 15 d and 30 d from both HARs are defined by their strong correlation with high concentrations of VFAs and sCOD. This state is driven by the dominance of Fermentimonas caenicola and Urmitella timonensis (p < 0.05). The genus Fermentimonas is a facultatively anaerobic bacteria that is known in the literature as an active fermenter. Species like Fermentimonas caenicola have been isolated from mesophilic AD digesters and are capable of degrading carbohydrates and complex proteins, producing acetate as a primary product [67,68]. Their dominance during the filling-up phase is an indicator of active hydrolysis and acidogenesis, where the complex organic feedstock is being rapidly converted into soluble intermediates (sCOD) and VFAs. Meanwhile, less information is known about Urmitella timonensis. Its phylogenetic position and its identical placement in the CCA plot suggest a similar functional role as a primary fermenter, contributing to the production of organic acids [69]. During the continuous phase (245 d), the microbial community has undergone stabilization and acclimatization, leading to a specialized and efficient AD consortium. This phase is characterized by high methane production, high microbial concentration (VSS), and low concentrations of inhibitory intermediates like VFAs. As discussed, the most dominant bacteria associated with this phase is Bacteroides propionicifaciens. (p < 0.05). The genus Bacteroides is known in the literature as a dominant member of the mammalian gut microbiome, where its species are renowned for possessing carbohydrate-active enzymes (CAZymes) [70,71]. The dominance of Bacteroides as a key organism in the stable HAR suggests that it has become a primary bacterium for the hydrolysis of complex substrates [45]. During the transitional phase (69 d), VFAs and acetate levels were relatively high and variable, favoring the fast-growing, high-capacity Methanosarcina. However, as the HARs stabilize, the steady-state acetate concentration has been driven down to lower levels, leading to the presence of both Methanosarcina and Methanosaeta [16]. Furthermore, the observed shift from M. soehngenii (69 d) to M. harundinacea (245 d) is significant. Research shows that M. harundinacea exhibits a high tolerance to ammonia, a compound that accumulates to inhibitory levels in long-running digesters fed with protein-rich substrates [72,73].
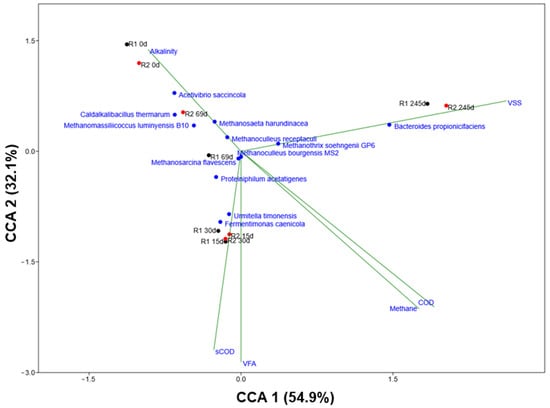
Figure 7.
Canonical correspondence analysis (CCA) ordination diagram showing the correlations between the bacterial and archaeal species relative abundance, reactors (R1—black, R2—red) at different time points, and process performance variables (alkalinity, COD, sCOD, VSS, VFA, and methane concentration—blue). The process performance variables (p < 0.1) and the model (p < 0.05) applied were statistically significant. Significance was tested using permutation test (n = 999).
4. Conclusions
The most distinctive finding of this study was the observed microbial shift from acetoclastic to hydrogenotrophic methanogenesis, maintaining process stability under fluctuating FW concentrations. This metabolic adaptation, facilitated by the plug-flow design, low shear mixing, and functional zonation of HAR, allowed for spatial segregation of the acidogenic and methanogenic zones, reducing VFA inhibition and leading to sustained biogas output and methane concentration during long-term reactor operation. The current study also proved that HARs can successfully undergo a start-up strategy consisting of a filling-up phase (seeding at 50% with full-scale digester sludge, then feeding small amounts of FW) prior to a stabilized continuous phase. Despite the stepwise increases in organic loading and subsequent reductions in HRT from 50 d to 40 d, throughout the operation of the reactors, the effluent pH remained in the optimal 7.6–8.0 range, alkalinity stabilized at 13–16 g/L, and soluble COD and VFAs settled at 5–10 g/L and 1–3 g/L, respectively. Sustained biogas production during the continuous phase was observed at 1.7 ± 0.2 L/LR/d and methane concentrations at 59.0 ± 2.5%, corresponding to typical mesophilic AD digesters fed with FW (~60%). Microbial community analysis revealed an acclimatization: initial acetoclastic Methanothrix and carbohydrate-degrading Acetivibrio declined under early VFA stress, while syntrophic LCFA oxidizers (Syntrophomonas) and hydrogenotrophic methanogens (Methanoculleus bourgensis MS2 + Methanoculleus receptaculi) dominated, forming a resilient consortium that efficiently converted diverse AD products to methane. NMDS, UPGMA, and CCA analyses confirmed that microbial community restructuring corresponded with process performance variables. That is, early sCOD/VFA surges during the filling-up phase drove bacterial diversity shifts, while the continuous phase correlated with high VSS and methane. Notably, Bacteroides propionicifaciens and Proteiniphilum acetatigenes became key hydrolyzers, maintaining reactor stability under fluctuating FW concentrations. Overall, this study places HARs as a robust and scalable option for FW valorization, offering consistent biomethane yields even if there are variability and unpredictability in the FW concentrations fed into the reactors.
Author Contributions
Conceptualization, S.H.; methodology, J.V.T. and S.H.; software, S.H.P. and S.I.K.; validation, S.H.P.; formal analysis, J.V.T.; investigation, J.V.T.; resources, S.H.; data curation, J.V.T., S.H.P. and S.I.K.; writing—original draft preparation, J.V.T.; writing—review and editing, J.V.T., S.H.P., S.I.K. and S.H.; visualization, J.V.T. and S.H.P.; supervision, S.H.; project administration, S.H.; funding acquisition, S.H. All authors have read and agreed to the published version of the manuscript.
Funding
This research was financially supported by the Korea Environmental Industry & Technology Institute (KEITI) grant funded by the Ministry of Environment (ME) of the Korean government (No. 2022003590002) and by the National Research Foundation of Korea (NRF) grant funded by the Korea government (MSIT) (RS-2024-00351586).
Institutional Review Board Statement
Not applicable.
Informed Consent Statement
Not applicable.
Data Availability Statement
Data are contained within the article.
Conflicts of Interest
The authors declare no conflicts of interest.
References
- Tomczak, W.; Daniluk, M.; Kujawska, A. Food Waste as Feedstock for Anaerobic Mono-Digestion Process. Appl. Sci. 2024, 14, 10593. [Google Scholar] [CrossRef]
- Zhao, Y.; Zhang, D.; Guo, S.; Wang, Y.; Wei, X. The World Trends and Patterns of Grain Loss and Waste Research and Their Implications. ACS Agric. Sci. Technol. 2024, 4, 82–91. [Google Scholar] [CrossRef]
- Uddin, M.M.; Wright, M.M. Anaerobic Digestion Fundamentals, Challenges, and Technological Advances. Phys. Sci. Rev. 2023, 8, 2819–2837. [Google Scholar] [CrossRef]
- Jin, C.; Sun, S.; Yang, D.; Sheng, W.; Ma, Y.; He, W.; Li, G. Anaerobic Digestion: An Alternative Resource Treatment Option for Food Waste in China. Sci. Total Environ. 2021, 779, 146397. [Google Scholar] [CrossRef] [PubMed]
- Alengebawy, A.; Ran, Y.; Osman, A.I.; Jin, K.; Samer, M.; Ai, P. Anaerobic Digestion of Agricultural Waste for Biogas Production and Sustainable Bioenergy Recovery: A Review. Environ. Chem. Lett. 2024, 22, 2641–2668. [Google Scholar] [CrossRef]
- Ebel, R.; Eberly, J.; Grimberg, B.I.; Seipel, T.; Menalled, F.D. Household-Scale Anaerobic Digestion of Food Waste—A Community Case Study from Bozeman, Montana. Front. Sustain. Food Syst. 2025, 9, 1561457. [Google Scholar] [CrossRef]
- Li, L.; Peng, X.; Wang, X.; Wu, D. Anaerobic Digestion of Food Waste: A Review Focusing on Process Stability. Bioresour. Technol. 2018, 248, 20–28. [Google Scholar] [CrossRef]
- Li, L.; He, Q.; Wei, Y.; He, Q.; Peng, X. Early Warning Indicators for Monitoring the Process Failure of Anaerobic Digestion System of Food Waste. Bioresour. Technol. 2014, 171, 491–494. [Google Scholar] [CrossRef]
- Wu, D.; Li, L.; Zhen, F.; Liu, H.; Xiao, F.; Sun, Y.; Peng, X.; Li, Y.; Wang, X. Thermodynamics of Volatile Fatty Acid Degradation during Anaerobic Digestion under Organic Overload Stress: The Potential to Better Identify Process Stability. Water Res. 2022, 214, 118187. [Google Scholar] [CrossRef]
- Slopiecka, K.; Liberti, F.; Massoli, S.; Bartocci, P.; Fantozzi, F. Chemical and Physical Characterization of Food Waste to Improve Its Use in Anaerobic Digestion Plants. Energy Nexus 2022, 5, 100049. [Google Scholar] [CrossRef]
- Shabbirahmed, A.M.; Somu, P.; Yang, H.H.; Hiruthyaswamy, S.P.; Karua, C.S.; Yadav, A.K. Challenges and Strategies for Waste Food Anaerobic Digestion: Insights and Future Directions. Environ. Dev. Sustain. 2024, 1–34. [Google Scholar] [CrossRef]
- Moonsamy, T.A.; Rajauria, G.; Priyadarshini, A.; Jansen, M.A.K. Food Waste: Analysis of the Complex and Variable Composition of a Promising Feedstock for Valorisation. Food Bioprod. Process. 2024, 148, 31–42. [Google Scholar] [CrossRef]
- Menzel, T.; Neubauer, P.; Junne, S. Spatial Monitoring of Hydrolysis in a Plug-Flow Bioreactor: A Support for Flexible Operation? Bioresour. Bioprocess. 2024, 11, 23. [Google Scholar] [CrossRef] [PubMed]
- Rossi, E.; Becarelli, S.; Pecorini, I.; Di Gregorio, S.; Iannelli, R. Anaerobic Digestion of the Organic Fraction of Municipal Solid Waste in Plug-Flow Reactors: Focus on Bacterial Community Metabolic Pathways. Water 2022, 14, 195. [Google Scholar] [CrossRef]
- Zhou, H.; Jiang, J.; Zhao, Q.; Li, L.; Wang, K.; Wei, L. Effects of Organic Loading Rates on High-Solids Anaerobic Digestion of Food Waste in Horizontal Flow Reactor: Methane Production, Stability and Mechanism. Chemosphere 2022, 293, 133650. [Google Scholar] [CrossRef]
- Tongco, J.V.; Jannat, M.A.H.; Kim, S.; Park, S.H.; Hwang, S. Process Performance and Biogas Output: Impact of Fluctuating Acetate Concentrations on Methanogenesis in Horizontal Anaerobic Reactors. Energies 2025, 18, 3120. [Google Scholar] [CrossRef]
- APHA-AWWA-WEF. Standard Methods for the Examination of Water and Wastewater, 21st ed.; American Public Health Association: Washinton, DC, USA, 2005. [Google Scholar]
- Yu, Y.; Lee, C.; Kim, J.; Hwang, S. Group-Specific Primer and Probe Sets to Detect Methanogenic Communities Using Quantitative Real-Time Polymerase Chain Reaction. Biotechnol. Bioeng. 2005, 89, 670–679. [Google Scholar] [CrossRef]
- Kim, E.; Shin, S.G.; Jannat, M.A.H.; Tongco, J.V.; Hwang, S. Use of Food Waste-Recycling Wastewater as an Alternative Carbon Source for Denitrification Process: A Full-Scale Study. Bioresour. Technol. 2017, 245, 1016–1021. [Google Scholar] [CrossRef]
- Lee, J.; Kim, E.; Han, G.; Tongco, J.V.; Shin, S.G.; Hwang, S. Microbial Communities Underpinning Mesophilic Anaerobic Digesters Treating Food Wastewater or Sewage Sludge: A Full-Scale Study. Bioresour. Technol. 2018, 259, 388–397. [Google Scholar] [CrossRef]
- Roopnarain, A.; Nkuna, R.; Ndaba, B.; Adeleke, R. New Insights into the Metagenomic Link between Pre-Treatment Method, Addition of an Inoculum and Biomethane Yield during Anaerobic Digestion of Water Hyacinth (Eichhornia crassipes). J. Chem. Technol. Biotechnol. 2019, 94, 3217–3226. [Google Scholar] [CrossRef]
- Yulisa, A.; Park, S.H.; Chairattanawat, C.; Hwang, S. Effect of Feeding Strategies on the Start-up of Anaerobic Digestion of Fish Waste. Energy 2023, 280, 128199. [Google Scholar] [CrossRef]
- Hoffmann, R.A.; Garcia, M.L.; Veskivar, M.; Karim, K.; Al-Dahhan, M.H.; Angenent, L.T. Effect of Shear on Performance and Microbial Ecology of Continuously Stirred Anaerobic Digesters Treating Animal Manure. Biotechnol. Bioeng. 2008, 100, 38–48. [Google Scholar] [CrossRef] [PubMed]
- Bi, S.; Wang, C.; Wang, H.; Du, Y.; Yu, X.; Wang, Y. Comparison of Mesophilic and Thermophilic Anaerobic Digestion of Food Waste: Focusing on Methanogenic Performance and Pathogens Removal. Renew. Energy 2024, 233, 121184. [Google Scholar] [CrossRef]
- Palacios, P.A.; Sieborg, M.U.; Kuipers, S.B.; Fruergaard, S.; Kofoed, M.V.W. Temperature Tactics: Targeting Acetate or Methane Production in Autotrophic H2/CO2 Conversion with Mixed Cultures. Biochem. Eng. J. 2025, 214, 109574. [Google Scholar] [CrossRef]
- Battumur, U.; Yoon, Y.; Bae, G.S.; Kim, C.H. Isolation and Characterization of New Methanosarcina Mazei Strains KOR-3, -4, -5, and -6 from an Anaerobic Digester Using Pig Slurry. Asian-Australas. J. Anim. Sci. 2017, 30, 1198–1205. [Google Scholar] [CrossRef]
- Zhang, W.; Wang, X.; Xing, W.; Li, R.; Yang, T. Responses of Anaerobic Digestion of Food Waste to Coupling Effects of Inoculum Origins, Organic Loads and PH Control under High Load: Process Performance and Microbial Characteristics. J. Environ. Manag. 2021, 279, 111772. [Google Scholar] [CrossRef]
- Hmissi, M.; Harmand, J.; Alcaraz-Gonzalez, V.; Shayeb, H. Evaluation of Alkalinity Spatial Distribution in an Up-Flow Fixed Bed Anaerobic Digester. Water Sci. Technol. 2018, 77, 948–959. [Google Scholar] [CrossRef]
- Diniz, B.C.; Wilfert, P.; Sorokin, D.Y.; van Loosdrecht, M.C.M. Anaerobic Digestion at High-PH and Alkalinity for Biomethane Production: Insights into Methane Yield, Biomethane Purity, and Process Performance. Bioresour. Technol. 2025, 429, 132505. [Google Scholar] [CrossRef]
- Hwang, S.; Hansen, C.L. Evaluating a Correlation between Volatile Suspended Solid and Adenosine 5’-Triphosphate Levels in Anaerobic Treatment of High Organic Suspended Solids Wastewater. Bioresour. Technol. 1998, 63, 243–250. [Google Scholar] [CrossRef]
- Tongco, J.V.; Kim, S.; Oh, B.; Heo, S.; Lee, J.; Hwang, S. Enhancement of Hydrolysis and Biogas Production of Primary Sludge by Use of Mixtures of Protease and Lipase. Biotechnol. Bioprocess. Eng. 2020, 25, 132–140. [Google Scholar] [CrossRef]
- Brown, M.R.; Hands, C.L.; Coello-Garcia, T.; Sani, B.S.; Ott, A.I.G.; Smith, S.J.; Davenport, R.J. A Flow Cytometry Method for Bacterial Quantification and Biomass Estimates in Activated Sludge. J. Microbiol. Methods 2019, 160, 73–83. [Google Scholar] [CrossRef] [PubMed]
- Mathur, R.; Sharma, M.K.; Loganathan, K.; Abbas, M.; Hussain, S.; Kataria, G.; Alqahtani, M.S.; Srinivas Rao, K. Modeling of Two-Stage Anaerobic Onsite Wastewater Sanitation System to Predict Effluent Soluble Chemical Oxygen Demand through Machine Learning. Sci. Rep. 2024, 14, 1835. [Google Scholar] [CrossRef] [PubMed]
- Ma, Y.; Gu, J.; Liu, Y. Evaluation of Anaerobic Digestion of Food Waste and Waste Activated Sludge: Soluble COD versus Its Chemical Composition. Sci. Total Environ. 2018, 643, 21–27. [Google Scholar] [CrossRef]
- Lee, D.J.; Lee, S.Y.; Bae, J.S.; Kang, J.G.; Kim, K.H.; Rhee, S.S.; Park, J.H.; Cho, J.S.; Chung, J.; Seo, D.C. Effect of Volatile Fatty Acid Concentration on Anaerobic Degradation Rate from Field Anaerobic Digestion Facilities Treating Food Waste Leachate in South Korea. J. Chem. 2015, 2015, 640717. [Google Scholar] [CrossRef]
- Wang, Y.; Zhang, Y.; Wang, J.; Meng, L. Effects of Volatile Fatty Acid Concentrations on Methane Yield and Methanogenic Bacteria. Biomass Bioenergy 2009, 33, 848–853. [Google Scholar] [CrossRef]
- Cheah, Y.K.; Dosta, J.; Mata-Álvarez, J. Enhancement of Volatile Fatty Acids Production from Food Waste by Mature Compost Addition. Molecules 2019, 24, 2986. [Google Scholar] [CrossRef]
- Ali, M.; Abdoul-latif, M.; Raganati, F.; Dolínska, B.; Raganati, F.; Klewicka, E.; Mohamed Ali, A.; Zahangir Alam, M.; Mohamed Abdoul-latif, F.; Saedi Jami, M.; et al. Production of Biogas from Food Waste Using the Anaerobic Digestion Process with Biofilm-Based Pretreatment. Processes 2023, 11, 655. [Google Scholar] [CrossRef]
- Cheong, W.L.; Chan, Y.J.; Tiong, T.J.; Chong, W.C.; Kiatkittipong, W.; Kiatkittipong, K.; Mohamad, M.; Daud, H.; Suryawan, I.W.K.; Sari, M.M.; et al. Anaerobic Co-Digestion of Food Waste with Sewage Sludge: Simulation and Optimization for Maximum Biogas Production. Water 2022, 14, 1075. [Google Scholar] [CrossRef]
- Rahman, M.A.; Shahazi, R.; Nova, S.N.B.; Uddin, M.R.; Hossain, M.S.; Yousuf, A. Biogas Production from Anaerobic Co-Digestion Using Kitchen Waste and Poultry Manure as Substrate—Part 1: Substrate Ratio and Effect of Temperature. Biomass Convers. Biorefin 2023, 13, 6635–6645. [Google Scholar] [CrossRef]
- Hassan, O.M.; Khamis, H.S. Biogas Production from Sewage Sludge by Anaerobic Digestion. Tikrit J. Pure Sci. 2015, 20, 27–32. [Google Scholar] [CrossRef]
- Shin, S.G.; Kim, S.; Hwang, S. Startup of Demo-Scale Anaerobic Digestion Plant Treating Food Waste Leachate: Process Instability and Recovery. Int. J. Environ. Res. Public Health 2022, 19, 6903. [Google Scholar] [CrossRef] [PubMed]
- Yousaf, W.; Choudhry, M.; Arshad, M. Synergistic Enhancement of Biogas Production via Thermophilic Co-Digestion of Food Waste and Cheese Whey in a Continuous Stirred Tank Reactor. Phys. Educ. Health Soc. Sci. 2025, 3, 45–56. [Google Scholar] [CrossRef]
- Mulat, D.G.; Fabian Jacobi, H.; Feilberg, A.; Adamsen, A.P.S.; Richnow, H.H.; Nikolausz, M. Changing Feeding Regimes to Demonstrate Flexible Biogas Production: Effects on Process Performance, Microbial Community Structure, and Methanogenesis Pathways. Appl. Environ. Microbiol. 2016, 82, 438–449. [Google Scholar] [CrossRef] [PubMed]
- Manzoor, S.; Schnürer, A.; Bongcam-Rudloff, E.; Müller, B. Genome-Guided Analysis of Clostridium Ultunense and Comparative Genomics Reveal Different Strategies for Acetate Oxidation and Energy Conservation in Syntrophic Acetate-Oxidising Bacteria. Genes 2018, 9, 225. [Google Scholar] [CrossRef]
- Sakurai, R.; Yokoyama, Y.; Fukuda, Y.; Kawakami, M.; Hashimoto, S.; Tada, C. Discovery of a Microbial Carrier with High Adsorption Affinity for Syntrophic Long-Chain Fatty Acid-Degrading Microorganisms. ACS Omega 2024, 9, 39643–39651. [Google Scholar] [CrossRef]
- Aghasa, A.; Choi, S.; Lee, J.; Hwang, S. Effect of Initial Bacterial Diversity on Anaerobic Degradation of Long-Chain Fatty Acids. Biomass Bioenergy 2022, 162, 106498. [Google Scholar] [CrossRef]
- Mai, J.; Hu, B.B.; Zhu, M.J. Metabolic Division of Labor between Acetivibrio thermocellus DSM 1313 and Thermoanaerobacterium thermosaccharolyticum MJ1 Enhanced Hydrogen Production from Lignocellulose. Bioresour. Technol. 2023, 390, 129871. [Google Scholar] [CrossRef]
- Ishida, K.; Krabbe, J.; Meisinger, P.R.; Shabuer, G.; Schieferdecker, S.; Cyrulies, M.; Tank, C.; Barnes, E.; Paetz, C.; Hertweck, C. Discovery and Biosynthesis of Celluxanthenes, Antibacterial Arylpolyene Alkaloids From Diverse Cellulose-Degrading Anaerobic Bacteria. Angew. Chem. Int. Ed. 2025, 64, e202503697. [Google Scholar] [CrossRef]
- Xue, Y.; Zhang, X.; Zhou, C.; Zhao, Y.; Cowan, D.A.; Heaphy, S.; Grant, W.D.; Jones, B.E.; Ventosa, A.; Ma, Y. Caldalkalibacillus thermarum Gen. Nov., Sp. Nov., a Novel Alkalithermophilic Bacterium from a Hot Spring in China. Int. J. Syst. Evol. Microbiol. 2006, 56, 1217–1221. [Google Scholar] [CrossRef]
- Ueki, A.; Abe, K.; Kaku, N.; Watanabe, K.; Ueki, K. Bacteroides propionicifaciens Sp. Nov., Isolated from Rice-Straw Residue in a Methanogenic Reactor Treating Waste from Cattle Farms. Int. J. Syst. Evol. Microbiol. 2008, 58, 346–352. [Google Scholar] [CrossRef]
- Zhao, Y.; Yuan, F.; Su, Y.; Wu, M.; Li, X.; Feng, D.; Dong, H.; Mustafa, A.M.; Luo, J.; Feng, L.; et al. Metagenomic and Proteomic Insights into Graphene Oxide-Boosted Anaerobic Co-Fermentation of Food Waste and Sewage Sludge for Volatile Fatty Acids Production. Chem. Eng. J. 2025, 504, 158706. [Google Scholar] [CrossRef]
- Chen, S.; Dong, X. Proteiniphilum acetatigenes Gen. Nov., Sp. Nov., from a UASB Reactor Treating Brewery Wastewater. Int. J. Syst. Evol. Microbiol. 2005, 55, 2257–2261. [Google Scholar] [CrossRef] [PubMed]
- Huser, B.A.; Wuhrmann, K.; Zehnder, A.J.B. Methanothrix soehngenii Gen. Nov. Sp. Nov., a New Acetotrophic Non-Hydrogen-Oxidizing Methane Bacterium. Arch. Microbiol. 1982, 132, 1–9. [Google Scholar] [CrossRef]
- Besteman, M.S.; Doloman, A.; Sousa, D.Z. Transcriptomic Evidence for an Energetically Advantageous Relationship between Syntrophomonas wolfei and Methanothrix soehngenii. Environ. Microbiol. Rep. 2024, 16, e13276. [Google Scholar] [CrossRef]
- Chang, H.; Yin, Q.; He, K.; De Vrieze, J.; Wu, G. Feeding Regime Selectively Enriching Acetoclastic Methanogens to Enhance Energy Production in Anaerobic Digestion Systems. Biochem. Eng. J. 2025, 220, 109764. [Google Scholar] [CrossRef]
- Bucci, L.; Ghiotto, G.; Zampieri, G.; Raga, R.; Favaro, L.; Treu, L.; Campanaro, S. Adaptation of Anaerobic Digestion Microbial Communities to High Ammonium Levels: Insights from Strain-Resolved Metagenomics. Environ. Sci. Technol. 2024, 58, 580–590. [Google Scholar] [CrossRef]
- Agostini, S.; Bucci, L.; Doni, D.; Costantini, P.; Gupte, A.; Müller, B.; Sibilla, F.; Basaglia, M.; Casella, S.; Kougias, P.G.; et al. Bioaugmentation Strategies Based on Bacterial and Methanogenic Cultures to Relieve Stress in Anaerobic Digestion of Protein-Rich Substrates. Renew. Energy 2024, 225, 120270. [Google Scholar] [CrossRef]
- Ma, K.; Liu, X.; Dong, X. Methanobacterium beijingense Sp. Nov., a Novel Methanogen Isolated from Anaerobic Digesters. Int. J. Syst. Evol. Microbiol. 2005, 55, 325–329. [Google Scholar] [CrossRef]
- Feldewert, C.; Lang, K.; Brune, A. The Hydrogen Threshold of Obligately Methyl-Reducing Methanogens. FEMS Microbiol. Lett. 2020, 367, fnaa137. [Google Scholar] [CrossRef]
- Söllinger, A.; Urich, T. Methylotrophic Methanogens Everywhere—Physiology and Ecology of Novel Players in Global Methane Cycling. Biochem. Soc. Trans. 2019, 47, 1895–1907. [Google Scholar] [CrossRef]
- Chen, S.; Wang, Y.; Cheng, H.; Hazen, T.C.; He, C.; He, Q. Identification of Propionate-Degrading Microbial Populations in Methanogenic Processes for Waste Treatment: Methanosaeta and Methanoculleus. Environ. Eng. Sci. 2022, 39, 202–211. [Google Scholar] [CrossRef]
- Kim, S.; Kim, E.; Hwang, S. Methanogenic Diversity Changes in Full-Scale Anaerobic Digesters by Co-Digestion of Food Waste and Sewage Sludge. J. Mater. Cycles Waste Manag. 2022, 24, 2669–2676. [Google Scholar] [CrossRef]
- Prasetiya, D.; Aminatun, T. Ecological Informatics Approach to Analyze Habitat Preferences of Auricularia Delicata (Italic) in Bingungan Forest, Turgo Natural Forest Conservation Area. In Proceedings of the ICBBB ’19: 2019 9th International Conference on Bioscience, Biochemistry and Bioinformatics, Singapore, 7–9 January 2019; pp. 102–108. [Google Scholar] [CrossRef]
- Bardhan, S.; Dey, A.; Mitra, S.; Manna, R.; Ghosh, P.; Das, S.; Bhattacharya, D.K. Enhancing Phylogenetic Analysis: A New Genome Sequence Comparison Approach Using Bray-Curtis Dissimilarity Metric. In Proceedings of the International Conference on Big Data Analytics in Bioinformatics, DABCon 2024, Kolkata, India, 21–23 November 2024; Institute of Electrical and Electronics Engineers Inc.: Piscataway, NJ, USA, 2024. [Google Scholar]
- Cambria, S.; Minissale, P.; Tavilla, G. Phytosociological Investigations on the Afroalpine Vegetation of the Ruwenzori Mountains (Uganda). Land 2024, 13, 1752. [Google Scholar] [CrossRef]
- An, M.; Shen, L.; Liang, R.; Li, Y.; Zhao, G. Microbial Diagnostics Unveil Key Driver Bacteria and Methanogens Associated with System Stability and Biogas Production in Food Waste Anaerobic Digestion Systems. J. Environ. Chem. Eng. 2024, 12, 114435. [Google Scholar] [CrossRef]
- Hahnke, S.; Langer, T.; Koeck, D.E.; Klocke, M. Description of Proteiniphilum saccharofermentans Sp. Nov., Petrimonas mucosa Sp. Nov. and Fermentimonas caenicola Gen. Nov., Sp. Nov., Isolated from Mesophilic Laboratory-Scale Biogas Reactors, and Emended Description of the Genus Proteiniphilum. Int. J. Syst. Evol. Microbiol. 2016, 66, 1466–1475. [Google Scholar] [CrossRef]
- Sposob, M.; Moon, H.S.; Lee, D.; Kim, T.H.; Yun, Y.M. Comprehensive Analysis of the Microbial Communities and Operational Parameters of Two Full-Scale Anaerobic Digestion Plants Treating Food Waste in South Korea: Seasonal Variation and Effect of Ammonia. J. Hazard. Mater. 2020, 398, 122975. [Google Scholar] [CrossRef]
- Zafar, H.; Saier, M.H. Gut Bacteroides Species in Health and Disease. Gut Microbes 2021, 13, e1848158. [Google Scholar] [CrossRef]
- Onyango, S.O.; Juma, J.; De Paepe, K.; Van de Wiele, T. Oral and Gut Microbial Carbohydrate-Active Enzymes Landscape in Health and Disease. Front. Microbiol. 2021, 12, 653448. [Google Scholar] [CrossRef]
- Gagliano, M.C.; Sampara, P.; Plugge, C.M.; Temmink, H.; Sudmalis, D.; Ziels, R.M. Functional Insights of Salinity Stress-Related Pathways in Metagenome-Resolved Methanothrix Genomes. Appl. Environ. Microbiol. 2022, 88, e02449-21. [Google Scholar] [CrossRef]
- Feng, G.; Zeng, Y.; Wang, H.Z.; Chen, Y.T.; Tang, Y.Q. Proteiniphilum and Methanothrix harundinacea Became Dominant Acetate Utilizers in a Methanogenic Reactor Operated under Strong Ammonia Stress. Front. Microbiol. 2023, 13, 1098814. [Google Scholar] [CrossRef]
Disclaimer/Publisher’s Note: The statements, opinions and data contained in all publications are solely those of the individual author(s) and contributor(s) and not of MDPI and/or the editor(s). MDPI and/or the editor(s) disclaim responsibility for any injury to people or property resulting from any ideas, methods, instructions or products referred to in the content. |
© 2025 by the authors. Licensee MDPI, Basel, Switzerland. This article is an open access article distributed under the terms and conditions of the Creative Commons Attribution (CC BY) license (https://creativecommons.org/licenses/by/4.0/).