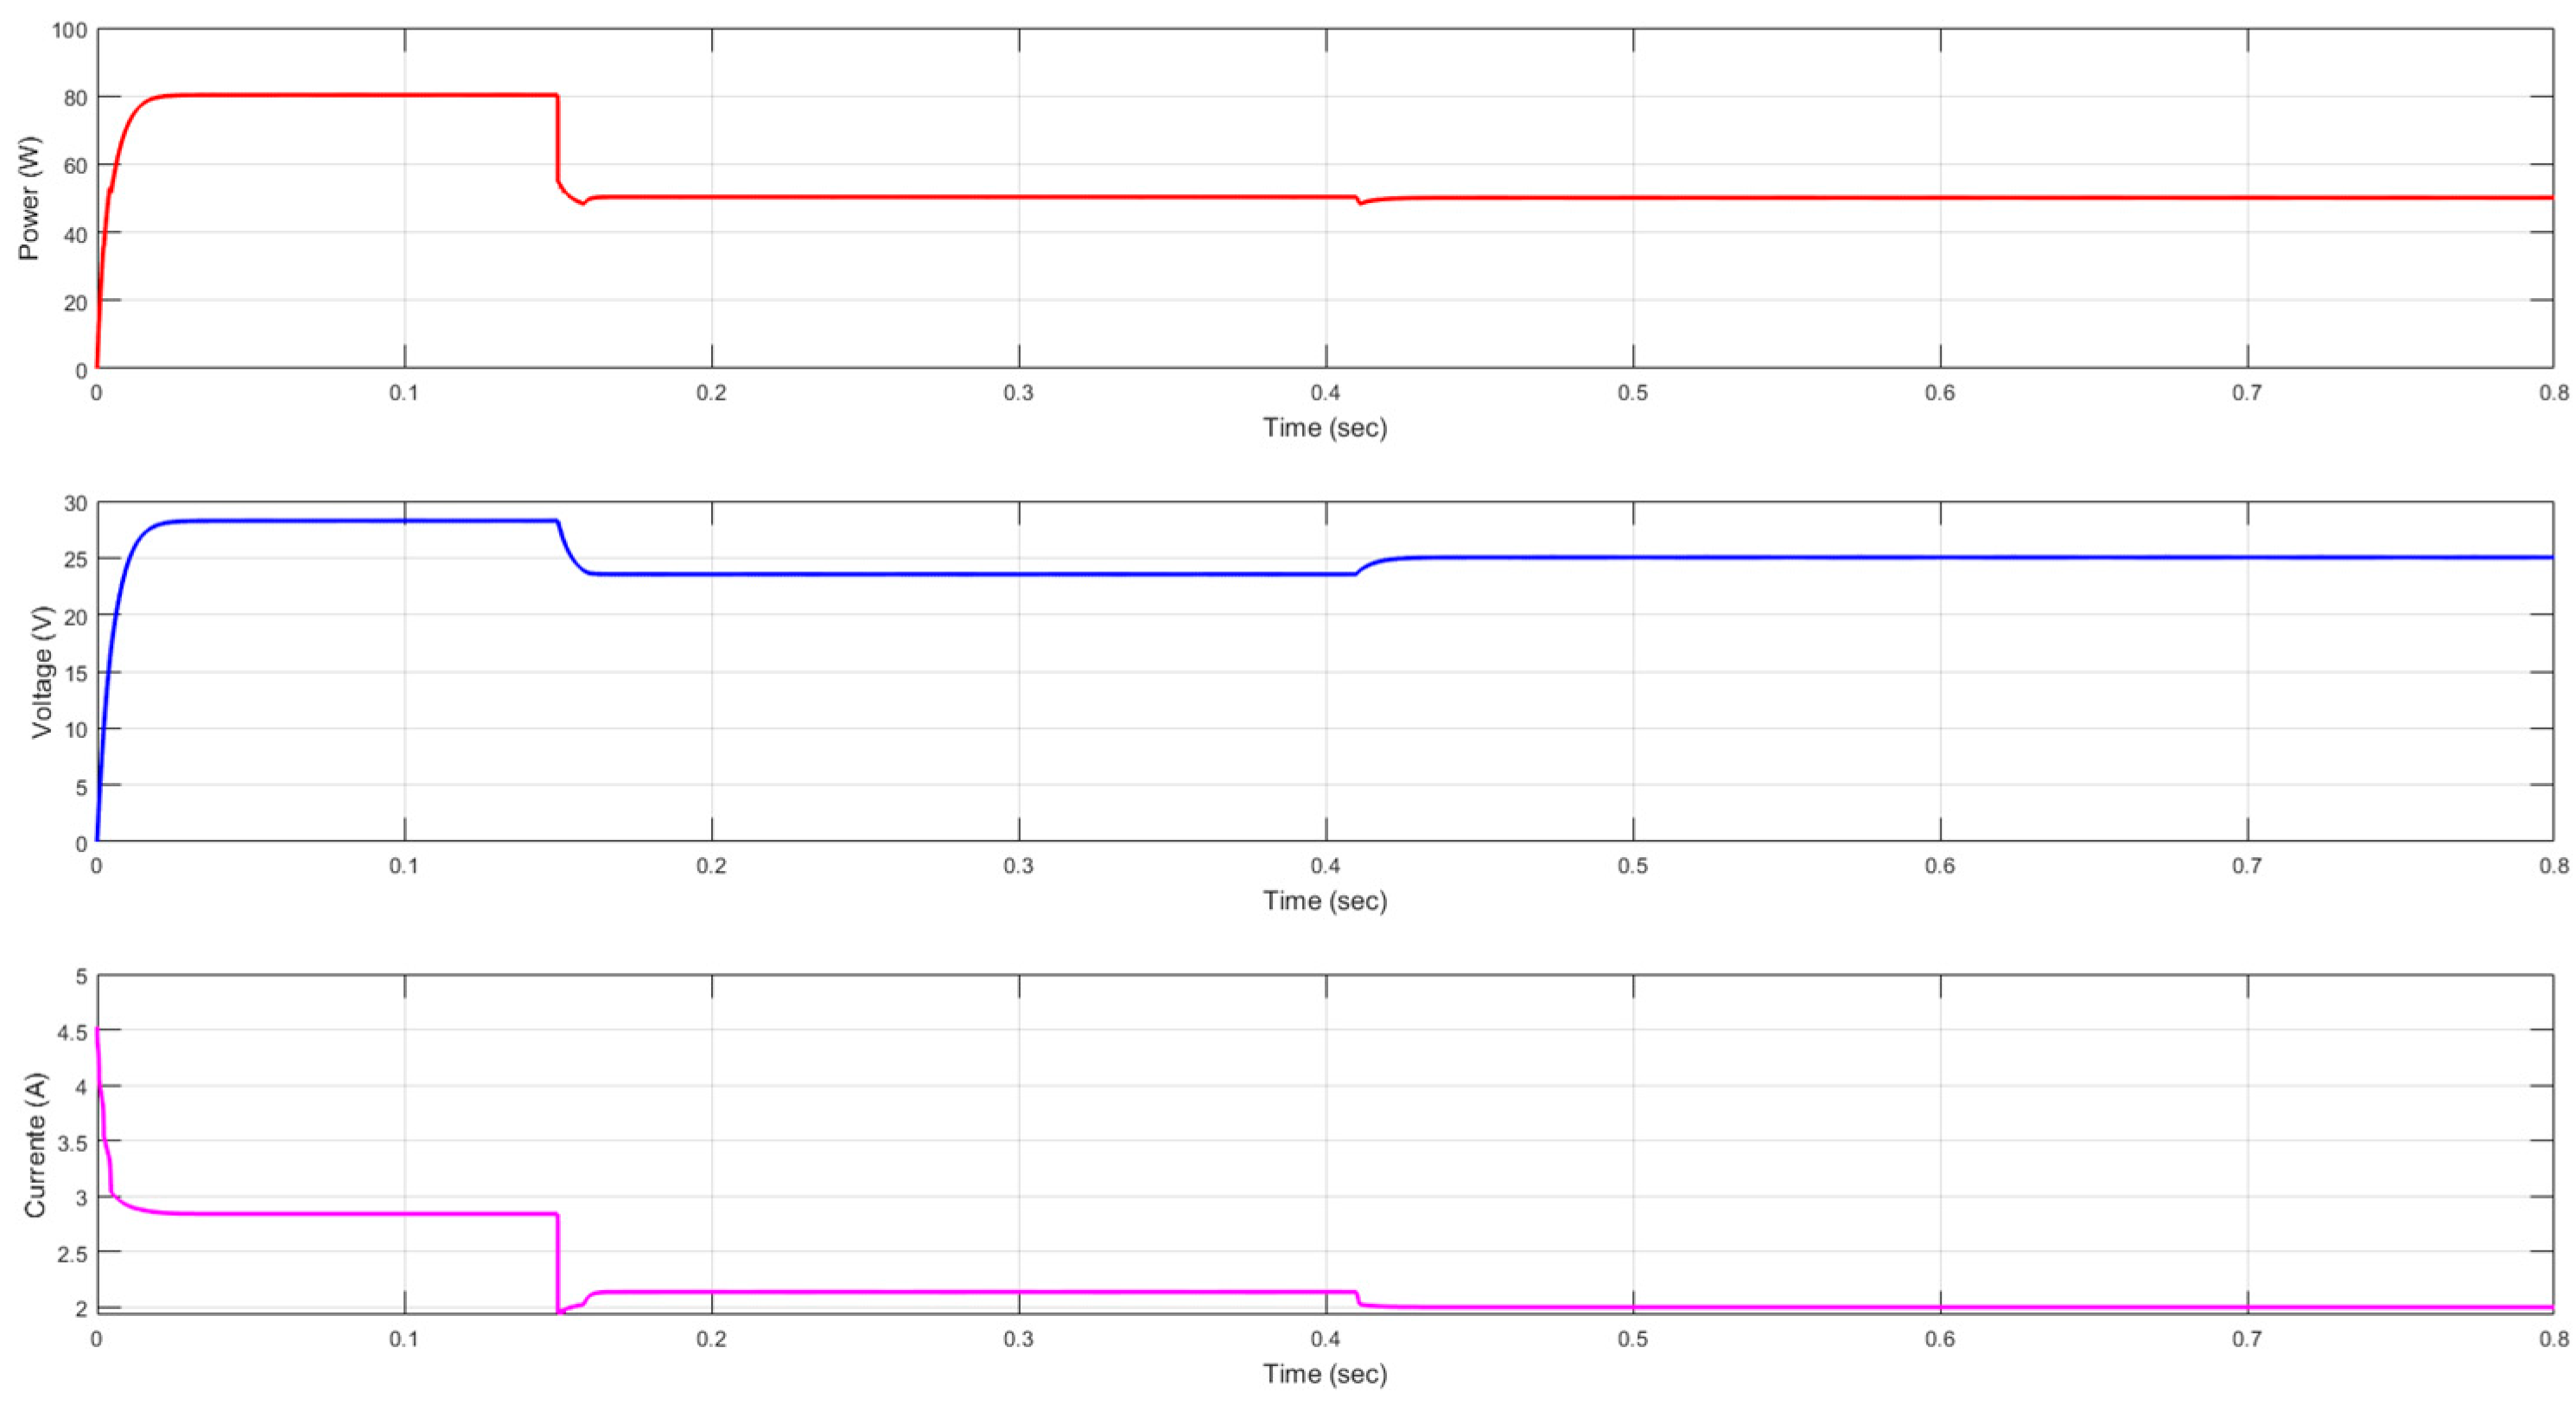
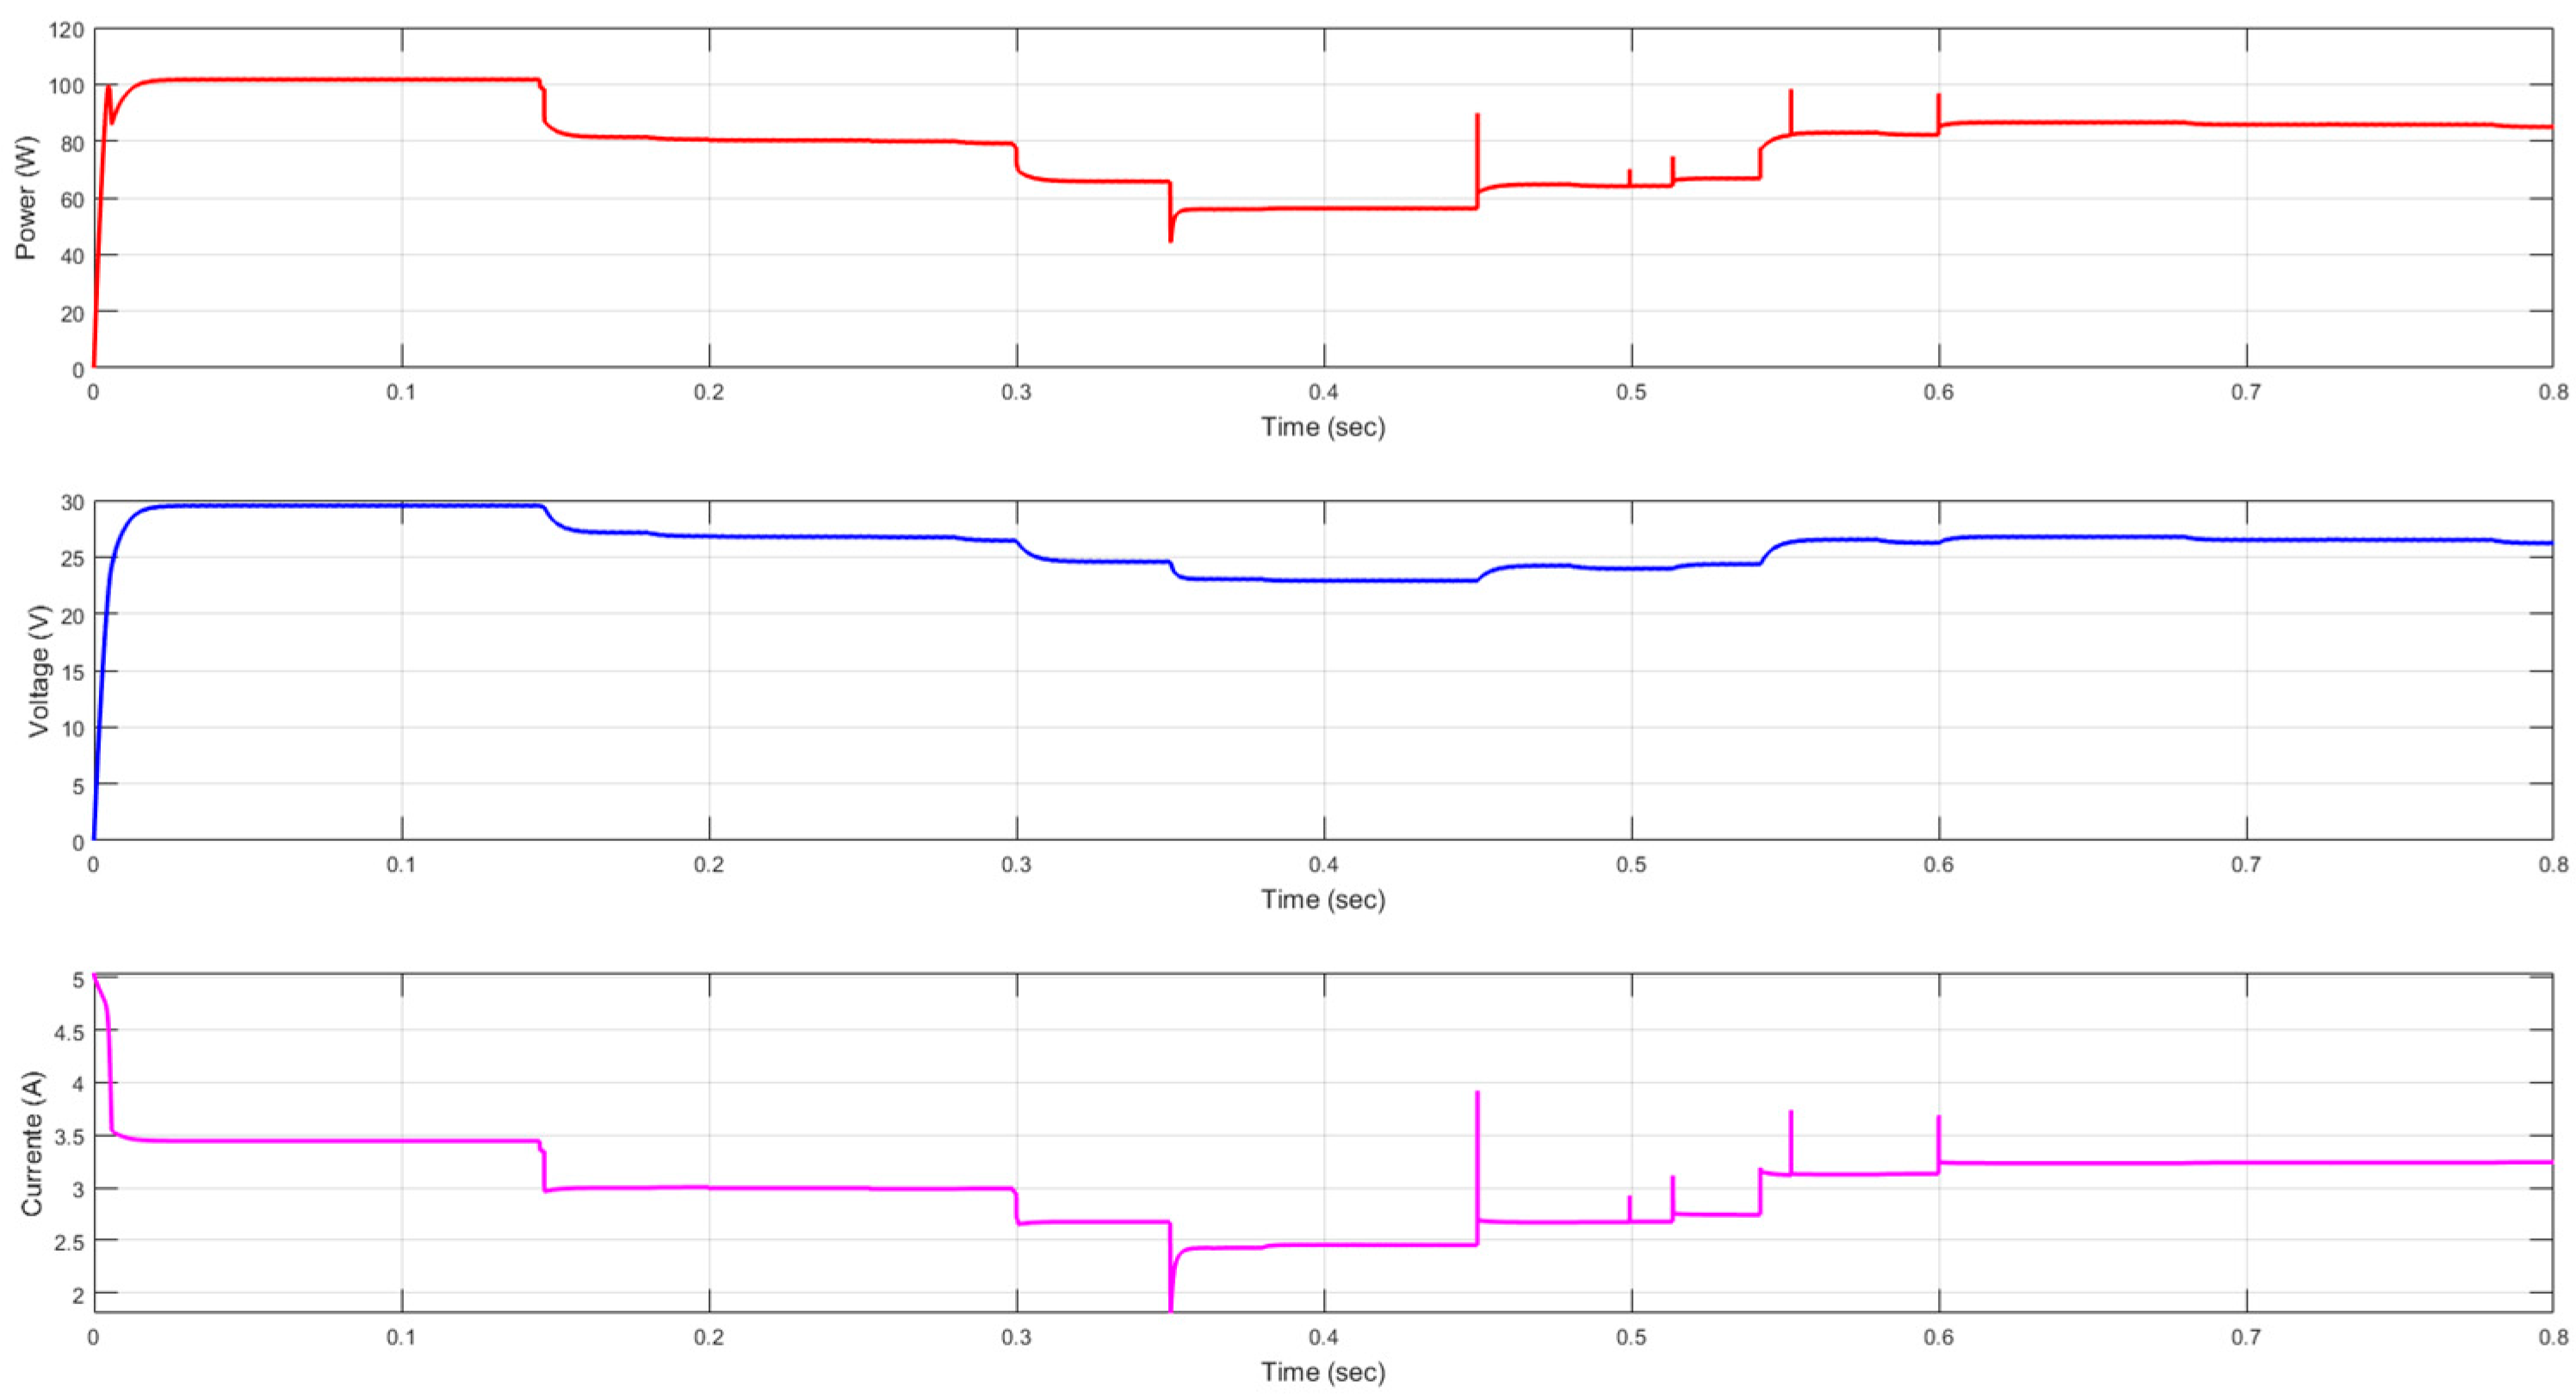
1. Introduction
PV solar energy is a consolidating strategy for meeting the growing global energy demand and mitigating greenhouse gas emissions due to technology maturation, scalability of installations, economic viability, and abundance of the solar resource. Despite the installation and maintenance costs, PV systems often lead to significant savings on electricity bills over time. However, specific technical challenges must be addressed to maximize performance and efficiency. Partial shading is one of the most critical issues affecting PV conversion efficiency, causing hot spots which increase the risk of damage, and reducing the installation lifecycle [
1].
Because solar panels have low conversion efficiency, the PV system must run at peak performance. Every temperature or irradiance change alters the current–voltage (I-V) and power–voltage (P-V) cell characteristics, requiring a new operating point. MPPT techniques address this need in most PV systems [
2]. Under uniform irradiance, the P-V curve of a PV array shows a clear maximum power point. For situations with non-uniform irradiance, such as partial shading, the P-V curve has multiple local peaks where only one is the GMPP. MPPT designs require capturing all available power under any condition [
3].
Partial shading in PV systems generates multiple LMPPs in the system’s characteristic curve, making it challenging to locate the GMPP and reducing overall efficiency [
4]. Partial shading produces cells with low energy output that affect the rest of the PV cells in the array, limiting total energy production. Shading can be classified as static or dynamic, depending on the nature and behavior of objects causing obstruction and environmental conditions. Static shading occurs when permanent objects, such as buildings, walls, chimneys, or other fixed structures, block sunlight at certain times of the day based on the sun’s position. This type of shading is typically predictable. It can often be mitigated at the design stage by optimizing the orientation and placement of PV panels. Dynamic shading is caused by moving or temporary objects such as clouds, tree foliage, birds, or nearby vehicles. These intermittently block sunlight and introduce unpredictable fluctuations in solar irradiance. Dynamic shading is more complex to anticipate and manage, often resulting in rapidly changing operating conditions for the PV system. Both shading types should be considered in system design and in developing MPPT algorithms to ensure optimal PV power output and performance under varying conditions [
5].
A recent study [
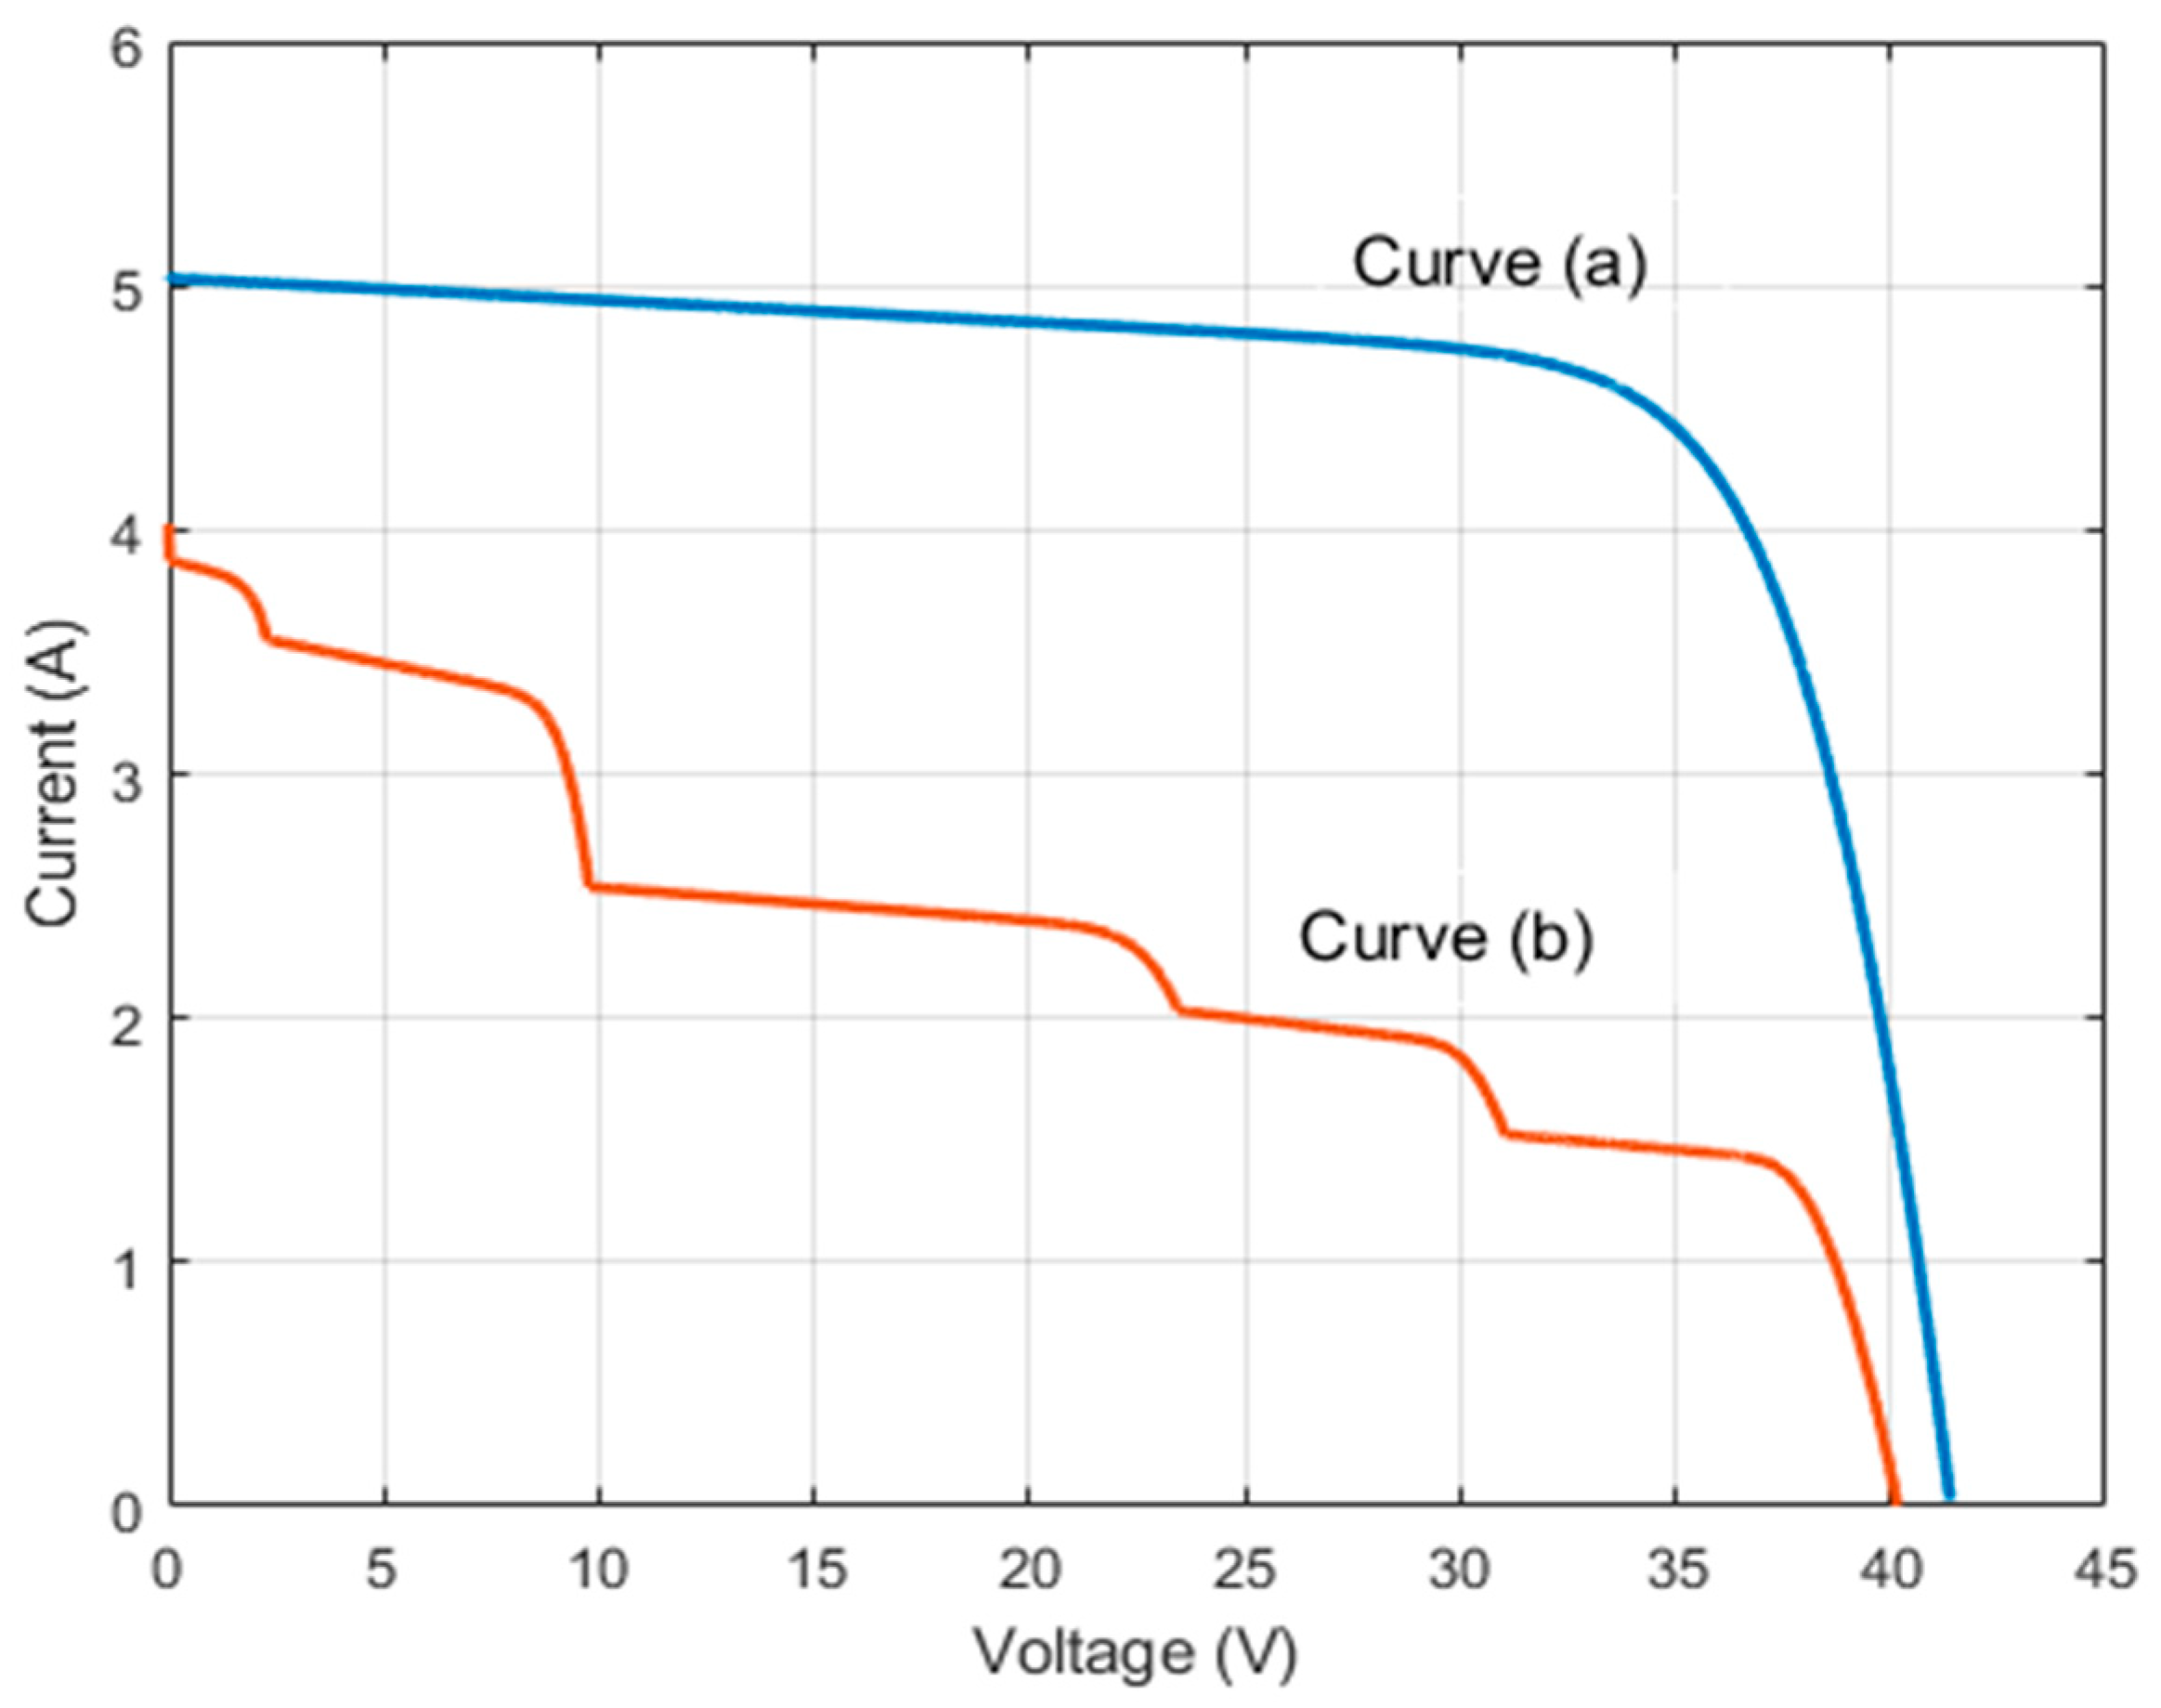
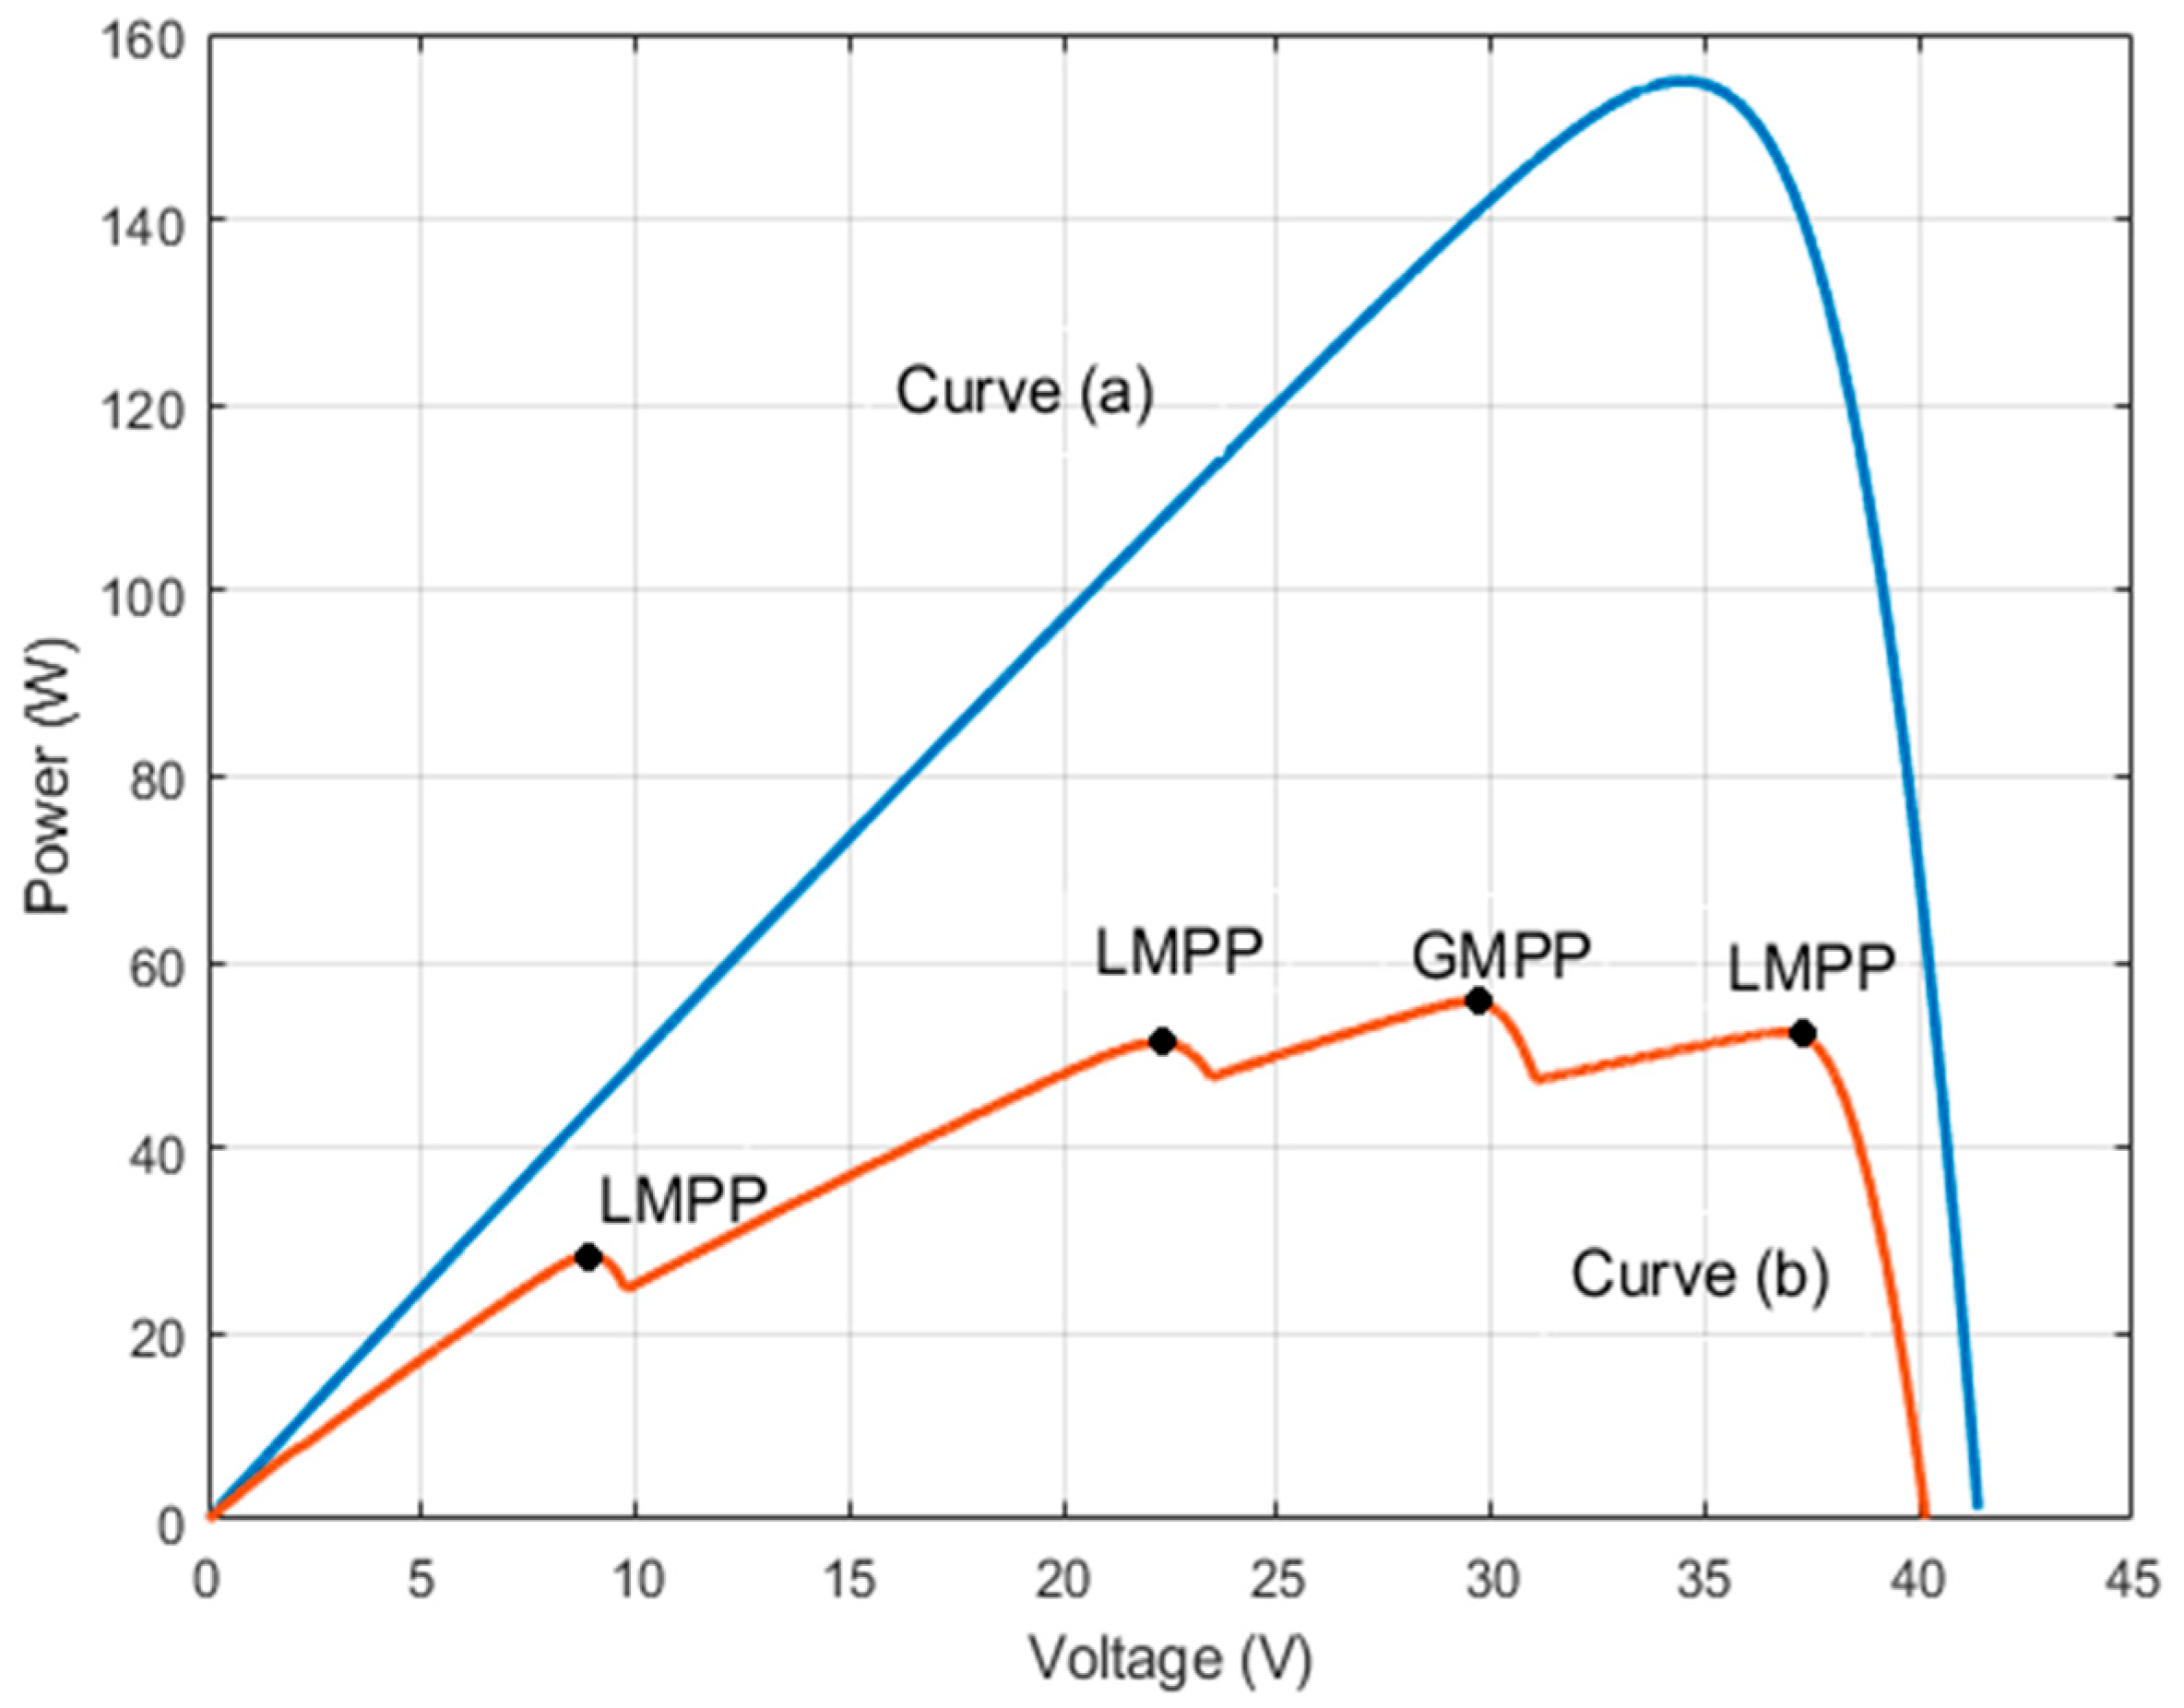
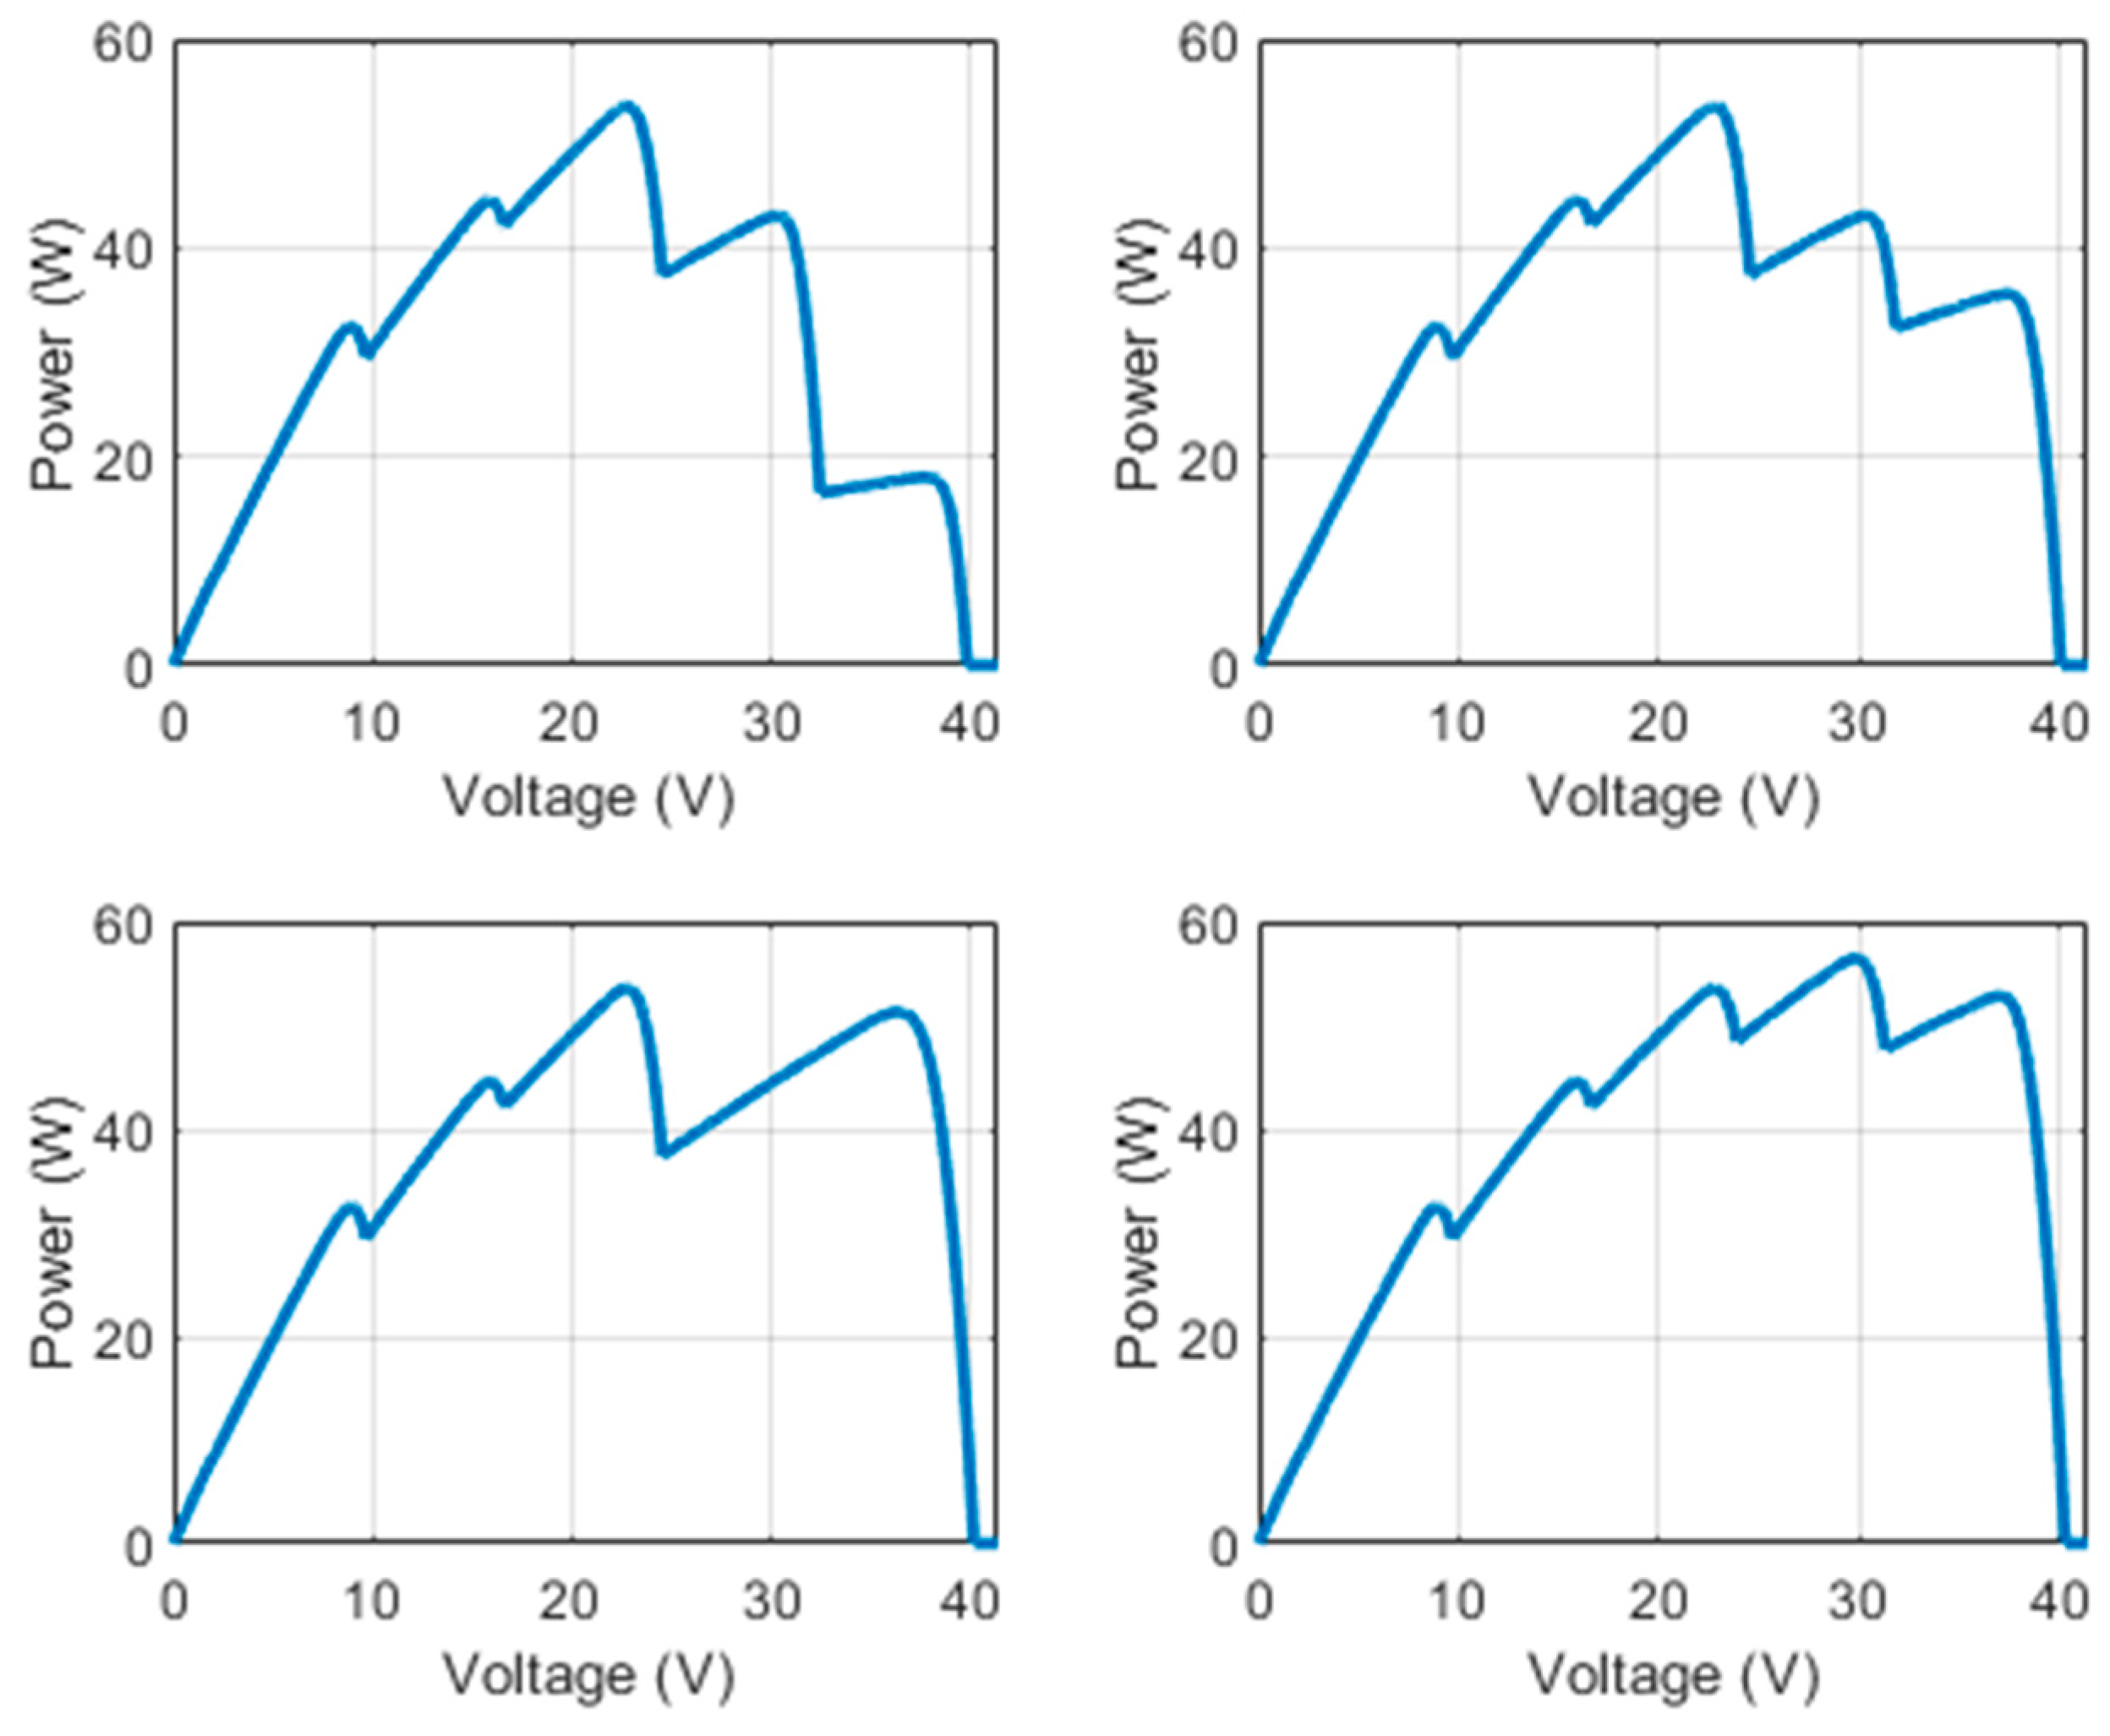
6] analyzes the role of bypass diodes in PV modules under partial shading. When part of a PV module is shaded, the bypass diode conducts to keep the shaded cell from becoming reverse-biased and prevent hotspots and damage. This changes the current–voltage (I-V) and power–voltage (P-V) behavior, introducing multiple LMPPs and a GMPP. This causes a step-like current shape in the I–V curve and several peaks in the P-V curve, as shown in
Figure 1 and
Figure 2. These peaks complicate MPPT and may reduce energy harvesting. Removing the bypass diode could eliminate these peaks and simplify the P-V curve, but the study shows this would cause significant power losses and a higher risk of damage from hotspots. Bypass diodes are therefore essential for protecting PV modules and maintaining efficiency under shading.
The most significant effect of partial shading is the mismatch between the array’s maximum power point (MPP) and the MPPs of each module, which reduces system performance due to power losses. Bypass diodes further cause losses due to their forward conduction resistance. Partial shading causes reverse currents, converting the shaded cells into loads, which reduces power generation and increases thermal losses. It could also drive the MPP tracker to operate at local maximum values, increasing power losses [
7,
8]. These current mismatches cause localized cell heating and increase damage risk, raising maintenance costs.
MPPT techniques are fundamental to maintaining the effective operation of PV systems, as they allow panels to consistently operate at their peak power under diverse environmental conditions, ensuring system competitiveness and reliability [
9]. Within this context, ref. [
9] provides a comprehensive review of classical, intelligent, optimal, and hybrid MPPT methods, highlighting their strengths and limitations with respect to efficiency, tracking speed, and implementation complexity. Complementing this, a comparative study presented in [
10] analyzes the two most widely used classical methods, Perturb and Observe (P&O) and Incremental Conductance (IC). While these algorithms are valued for their simplicity and low implementation cost, their effectiveness diminishes under partial shading or rapidly changing irradiance, where they often misidentify local operating points, leading to reduced stability and efficiency. Together, these contributions underscore the need for advanced and hybrid approaches, such as the ANN–P&O method proposed in this work, which aim to overcome the shortcomings of classical techniques in dynamic environments.
Optimization techniques for MPPT implement advanced algorithms such as swarm intelligence (e.g., Particle Swarm Optimization and Grey Wolf Optimization), bio-inspired methods (e.g., Ant Colony Optimization, Artificial Bee Colony, Cuckoo Search, and Firefly Algorithm), and hybrid approaches (e.g., GWO-P&O and PSO-P&O) to accurately track the GMPP under partial shading and rapidly varying environmental conditions. These methods outperform conventional techniques like P&O or Incremental Conductance (IC) by effectively avoiding local maxima, reducing steady-state oscillations, and improving both tracking speed and efficiency. However, they often require greater computational resources and involve more complex implementation due to their sophisticated nature [
11].
Computational intelligence techniques provide effective solutions for MPPT in PV systems under partial shading, where traditional methods often face limitations. Approaches based on artificial intelligence and machine learning—such as neural networks, fuzzy logic, genetic algorithms (GAs), and adaptive neuro-fuzzy inference systems—can adapt to complex shading patterns and rapidly changing irradiance and temperature, offering high efficiency and reduced variability even without requiring detailed mathematical models [
12,
13]. A comprehensive review in [
14] highlights the wide range of AI applications in PV systems, including GMPP tracking, energy forecasting, parameter identification, and fault detection. Nonetheless, these intelligent methods also introduce challenges, as their implementation can be complex, computationally demanding, and costly, which motivates the exploration of hybrid strategies that balance performance with practical feasibility.
Hybrid MPPT techniques combine multiple methods to use their strengths and minimize weaknesses. For example, conventional and intelligent methods can be integrated to improve accuracy and response speed in different operating conditions. Hybrid systems are especially useful in PV installations affected by partial shading. They adapt in real time to locate and maintain the GMPP more effectively [
15].
Artificial intelligence (AI) has become a central focus in PV systems, especially for addressing partial shading conditions. Conventional MPPT methods often struggle to identify the GMPP. To address this challenge, recent works have investigated AI-based strategies such as PSO [
16] and general AI techniques for dynamic tracking [
17]. Notably, these studies reflect the growing interest in intelligent and hybrid approaches. Reviews highlight the effectiveness of ANN and fuzzy logic in handling complex scenarios [
18], and adaptive fuzzy logic controllers have also been validated experimentally [
19]. Building on this foundation, hybrid schemes that integrate ANN with metaheuristics or fuzzy logic further improve tracking robustness [
20]. Additionally, practical implementations in microcontrollers confirm real-time feasibility [
21]. Other contributions involve combining ANN with Hill-Climbing [
22] or adaptive P&O, which achieves 100% efficiency under shading [
23]. Broader reviews further emphasize the advantages of ANN–metaheuristic hybrids [
24].
Building on these advances, recent studies extend the field to predictive and adaptive frameworks. For instance, hybrid AI models combining physics-informed neural networks and reinforcement learning optimize real-time panel orientation and forecasting [
25]. Dual-mode algorithms using radial basis ANNs with LSTM prediction enable automatic switching between normal and shaded conditions, improving accuracy and robustness [
26]. In addition, Genetic Algorithm (GA)-based MPPT methods effectively explore large solution spaces under shading and irradiance changes, although they remain computationally intensive and parameter-dependent [
27]. Collectively, these works demonstrate the relevance of intelligent and hybrid MPPT strategies, providing context for positioning new contributions, such as the hybrid ANN–P&O approach developed in this study.
2. Materials and Methods
The simulation of the mathematical model of a PV cell in MATLAB/Simulink (2019b) allows for the representation of cell behavior under different environmental conditions, facilitating maximum power point analysis and real-time optimization of the PV system.
2.1. Mathematical Model Construction of a PV Cell Considering Different Shading Patterns
Accurate modeling of PV systems is essential for evaluating the performance of MPPT algorithms, especially under partial shading conditions where nonlinearities are more pronounced. This work focuses on establishing a validated and consistent simulation environment, rather than proposing a novel PV model or converter topology. The aim is to construct a reliable PV cell model based on the single-diode equivalent circuit, providing a scientifically sound platform for assessing the proposed ANN–P&O algorithm under controlled and repeatable conditions. To achieve this, parameter extraction, model validation, and integration with a boost converter are systematically developed and described in the following subsections.
Parameter detection for the PV model.
The PV array was modeled using the single-diode equivalent circuit.
The parameters () were extracted from the manufacturer’s datasheet of the selected PV module by solving the nonlinear system defined by the open-circuit voltage , short-circuit current , maximum power point (), and temperature coefficients.
A Levenberg–Marquardt fitting procedure was applied to minimize the error between the PV model’s simulated and datasheet I-V curves, ensuring accurate parameter detection. Subsequently, validation of the PV model was performed.
Validation of the PV model.
The obtained parameters were validated in simulation by comparing the simulated I-V and P-V curves with the datasheet curves at standard test conditions (STCs) and under partial irradiance.
The fitting error remained below 1% at STC and 3% under non-uniform irradiance, confirming the model’s fidelity.
Following the validation of the PV model, the next key component is the boost converter model.
A conventional boost topology was used, representing the standard interface for MPPT algorithms.
The passive components (inductor and capacitor) and switching frequency were sized according to design guidelines to ensure continuous conduction mode (CCM).
The converter was validated by comparing its simulated step response and steady-state conversion ratio with analytical values, ensuring an agreement within a 2% deviation.
After establishing the PV and boost converter models, the overall purpose of the simulation model is clarified.
The role of the simulation model is not to propose a new converter or PV model, but to provide a robust, validated simulation platform for testing and benchmarking the proposed ANN–P&O algorithm under controlled and repeatable conditions, including dynamic partial shading scenarios.
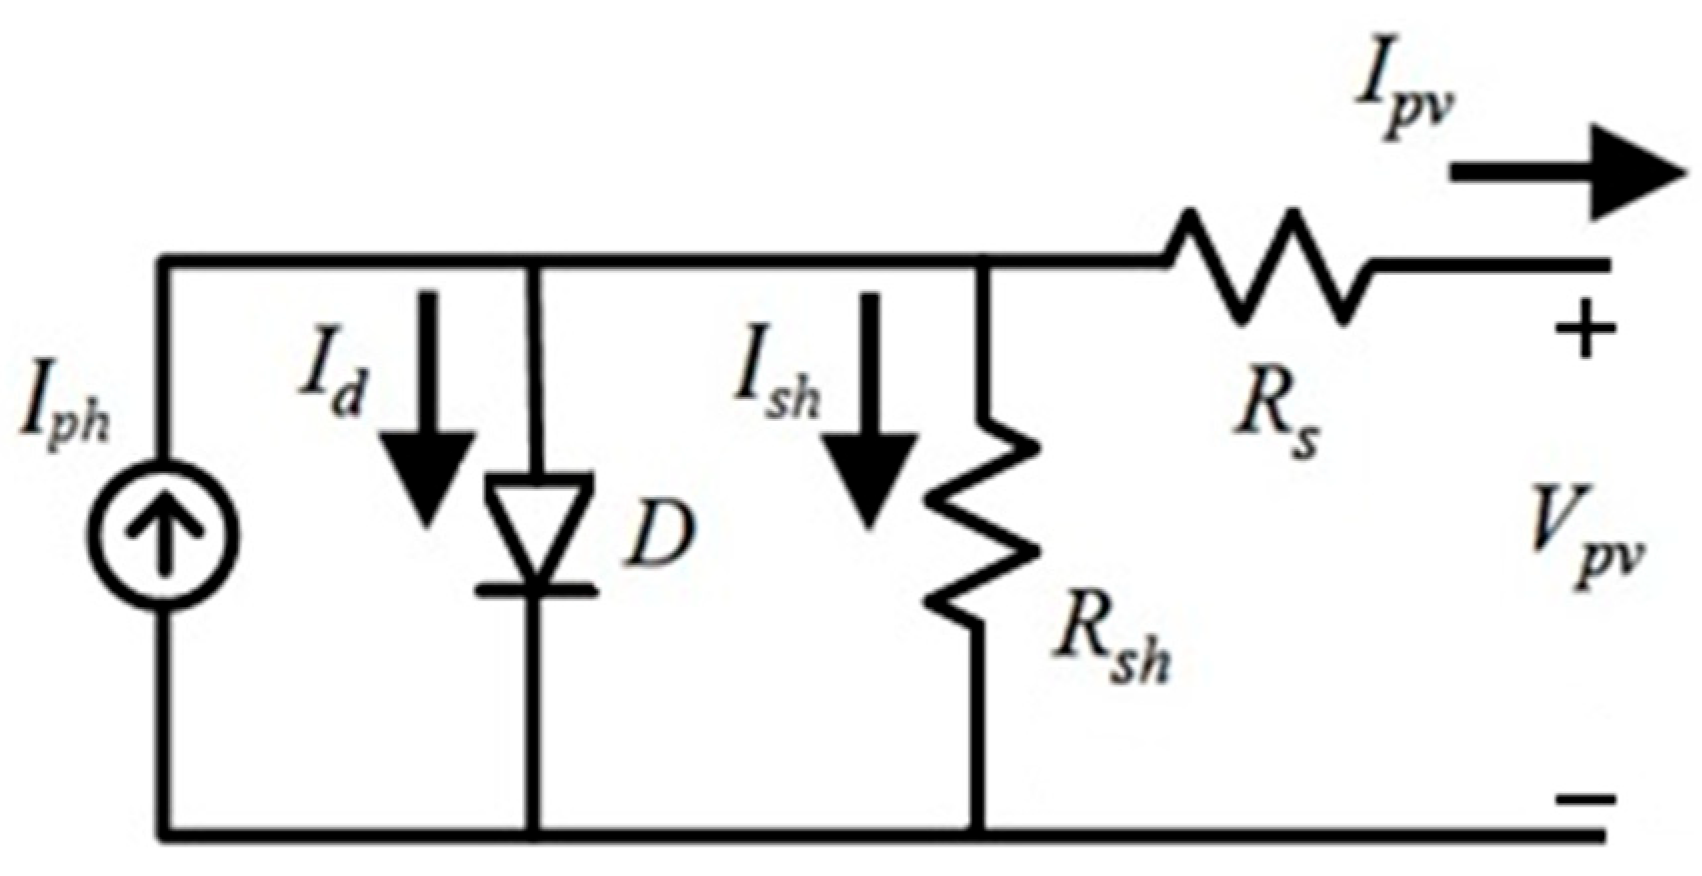
Figure 3 presents the equivalent electrical circuit of a PV cell. This circuit consists of a current source,
representing the current generated by solar radiation, a diode, and two resistances, i.e.,
in series and
in parallel.
represents the losses caused by contacts and connections. In contrast,
represents the leakage current of the diode and
is the output voltage of the cell [
15].
By applying Kirchhoff’s voltage and current law to the circuit in
Figure 3, the current generated (
) by the cell can be determined [
15], as
where
represents the current losses in the parallel resistance,
is the diode current, and
is the photogenerated current.
PV panels have an MPP on the power versus voltage curve depending on irradiance value. This variability requires an algorithm that adjusts
to maximize the captured power. The efficiency of the MPPT system is fundamental in the control design for the optimal operation of PV generation systems despite variations in irradiance and temperature [
28].
The current generated by the PV cell (
) is described as
where
is the photocurrent,
is the reverse saturation current of the diode,
is the electron charge (
),
is the Boltzmann constant (
),
is the operating temperature of the cell, and A is the ideality factor of the diode. This last factor differentiates the behavior between silicon and germanium cells, depending on the manufacturing technology of the cell, and reflects how closely the photodiode behaves to an ideal diode. The resistance
reflects the losses due to contacts and connections, and the coefficients
, representing the number of modules in parallel, and
, representing the number of cells in series [
29].
Shading of an individual cell within a series-connected string can substantially decrease the performance of a PV panel. Because current remains constant throughout the string, a single shaded cell limits the total current, thereby reducing the energy output of the entire panel. The classification of irradiance in a PV array under partial shading conditions is determined by how shadows impact specific cells or modules. Irradiance levels may vary considerably due to shadows cast by objects, clouds or adjacent structures.
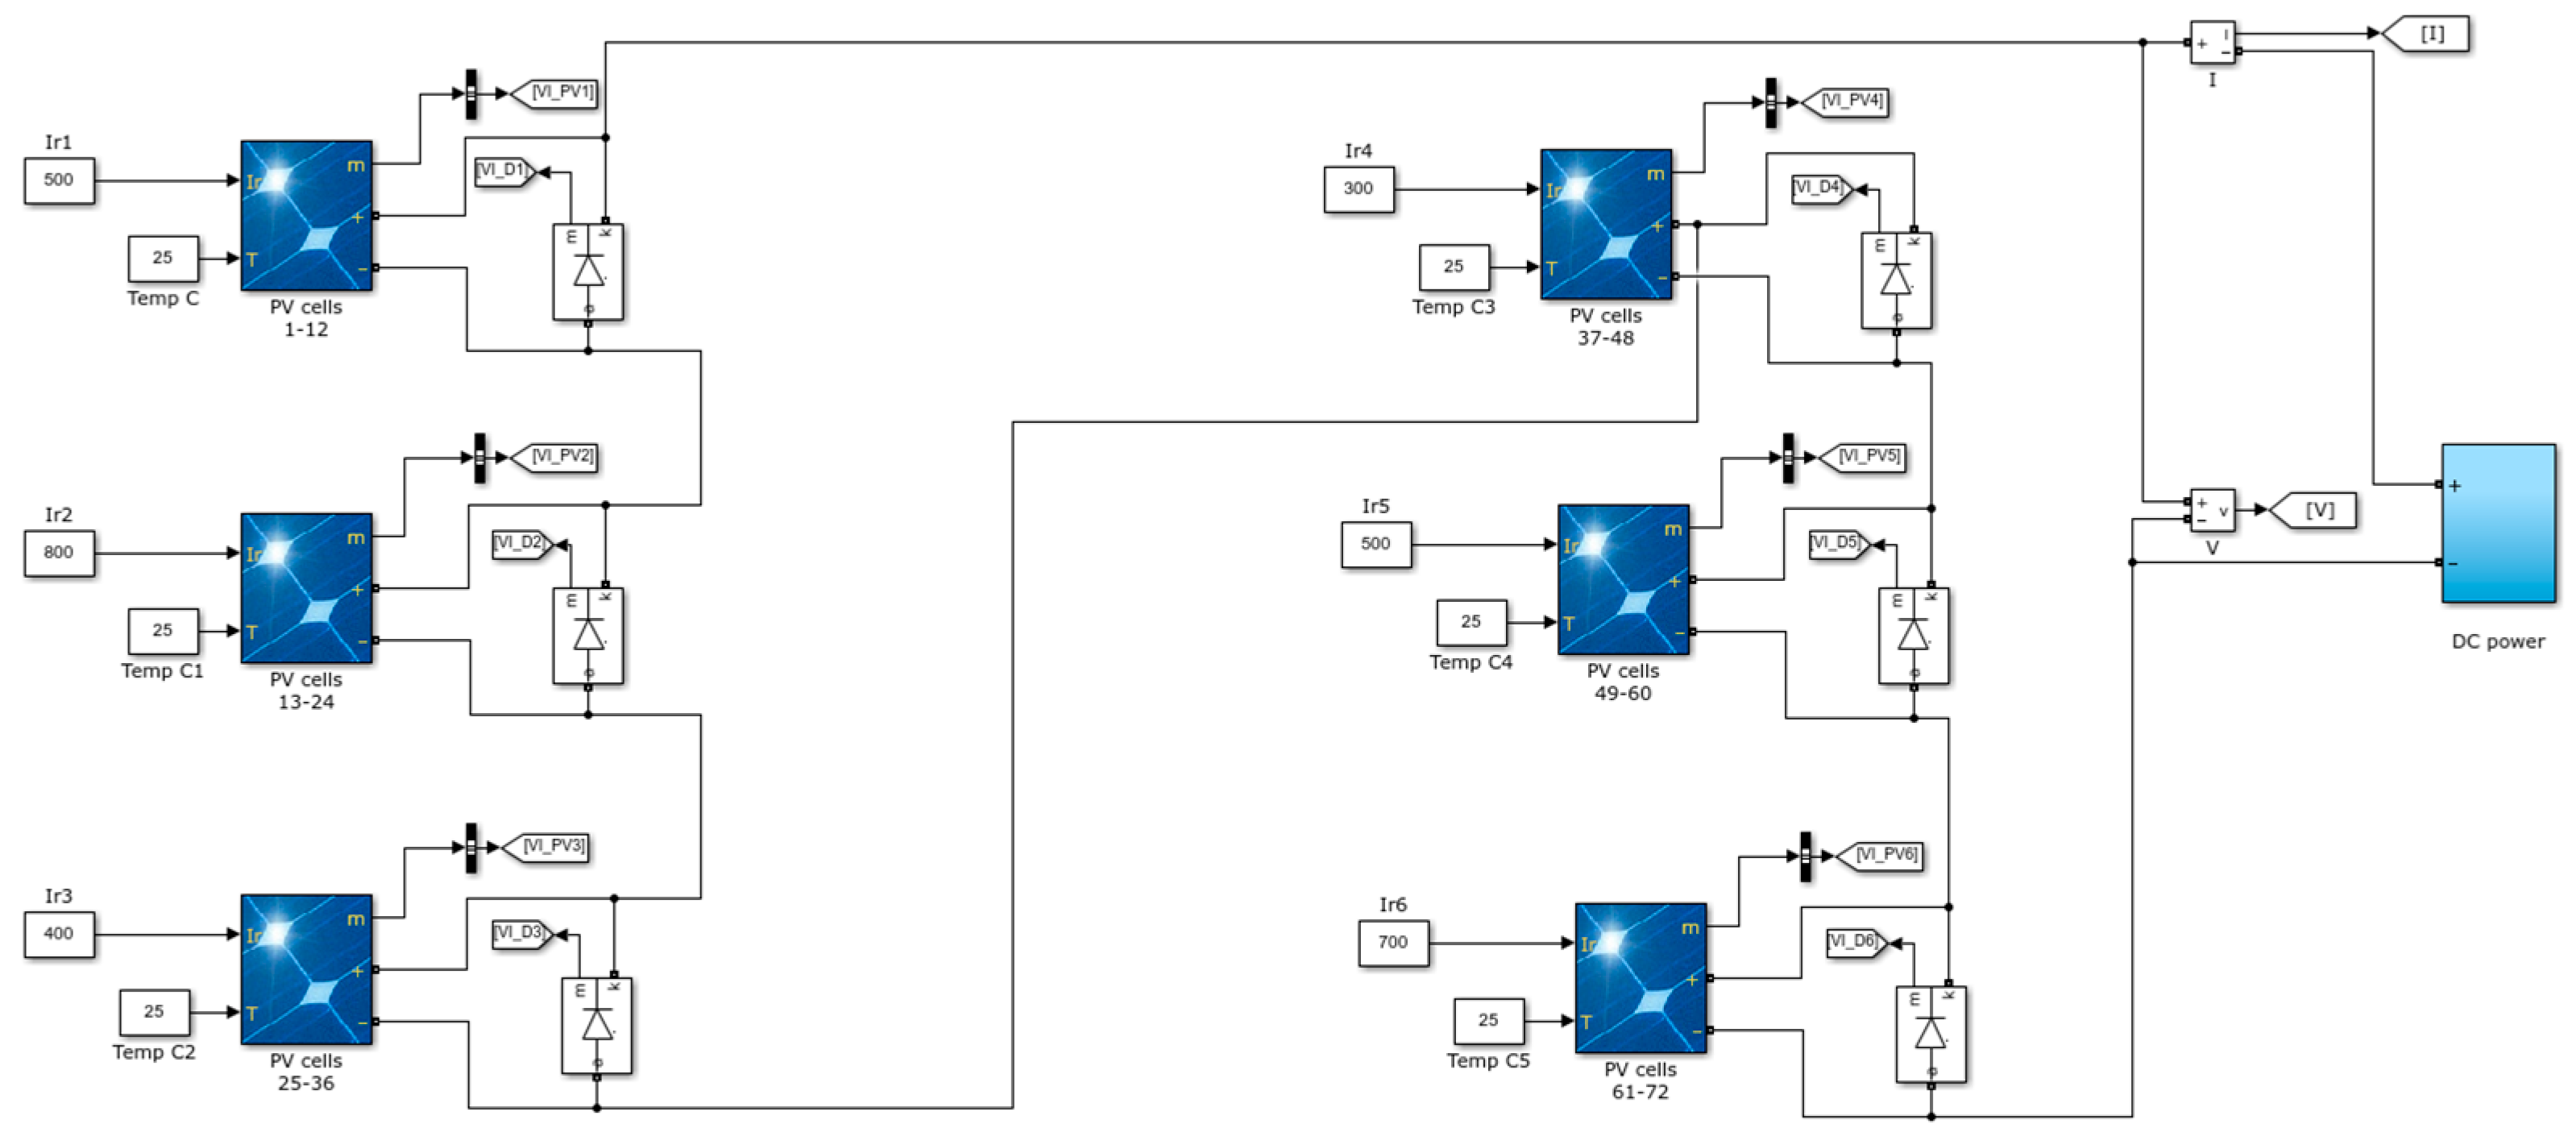
Using block diagrams based on (1)–(2), a Simulink model is used to simulate voltage, current, and power data required for neural network training and to represent the configuration of solar cells within the panel. The simulation utilizes the Upsolar UP-M155M solar panel, which consists of 72 cells and has a 150 W output. The model allows us to adjust parameters such as temperature, cell count, and irradiation levels to replicate partial shading by altering irradiation on designated panel sections. Control switches are included to activate bypass diodes when shading decreases the efficiency of specific panel areas.
Different shading scenarios were tested, simulating dynamic irradiance input (G) at set intervals to simulate shadows on panel sections cast by passing clouds over the PV array. The scenarios included variations in irradiance levels, from fully illuminated modules (1000 W/m
2) to partially shaded modules (330 W/m
2, 470 W/m
2 and 665 W/m
2) and fully shaded modules (160 W/m
2) [
30]. For this, a PV panel with six series-connected arrays of 12 cells each, totaling 72 cells, is considered, and different irradiance values are applied to each section of the panels.
Figure 4 shows the simulation model structure, presenting a PV system diagram in Simulink with the following components:
Temperature (T) and irradiance (G) inputs modify the operating conditions of the PV cell.
The PV cell outputs current (I) and voltage (V) to plot the system’s characteristic curves.
The I-V and P-V curves monitor cell behavior in response to irradiance and temperature.
This model helps design partial shading scenarios, such as grouping cells into sections of 12 within a total of 72 cells. P-V curves are generated in real time in these scenarios as irradiance conditions change as shown in
Figure 5. P-V curves are crucial for identifying the MPP, particularly under partial shading conditions where multiple peaks may occur.
2.2. Desing of the Neural Network to Predict the MPP in the System
The predictive model for PV power using a neural network includes three steps: data collection and preprocessing, building and training the neural network, and model evaluation. This process enables the prediction of power generation under various conditions, facilitating the management and optimization of PV systems [
31].
Feedforward networks become particularly relevant after constructing a predictive model for PV power. These neural networks organize neurons into interconnected layers, enabling them to solve complex problems and model nonlinear relationships. During training, forward propagation (to generate outputs) and backward propagation (to adjust weights via error backpropagation) are repeated multiple times, optimizing the weights to minimize errors in the training data. Once trained, the MLP is evaluated with new, unseen data to test its generalization ability, ensuring it can process inputs different from those encountered during training.
The predictive model used a multilayer perceptron (MLP) trained with the Levenberg–Marquardt algorithm (LMA) structure is:
The model inputs are normalized voltage and irradiance values from PV array simulations under partial shading.
Target output for the model is the normalized output power.
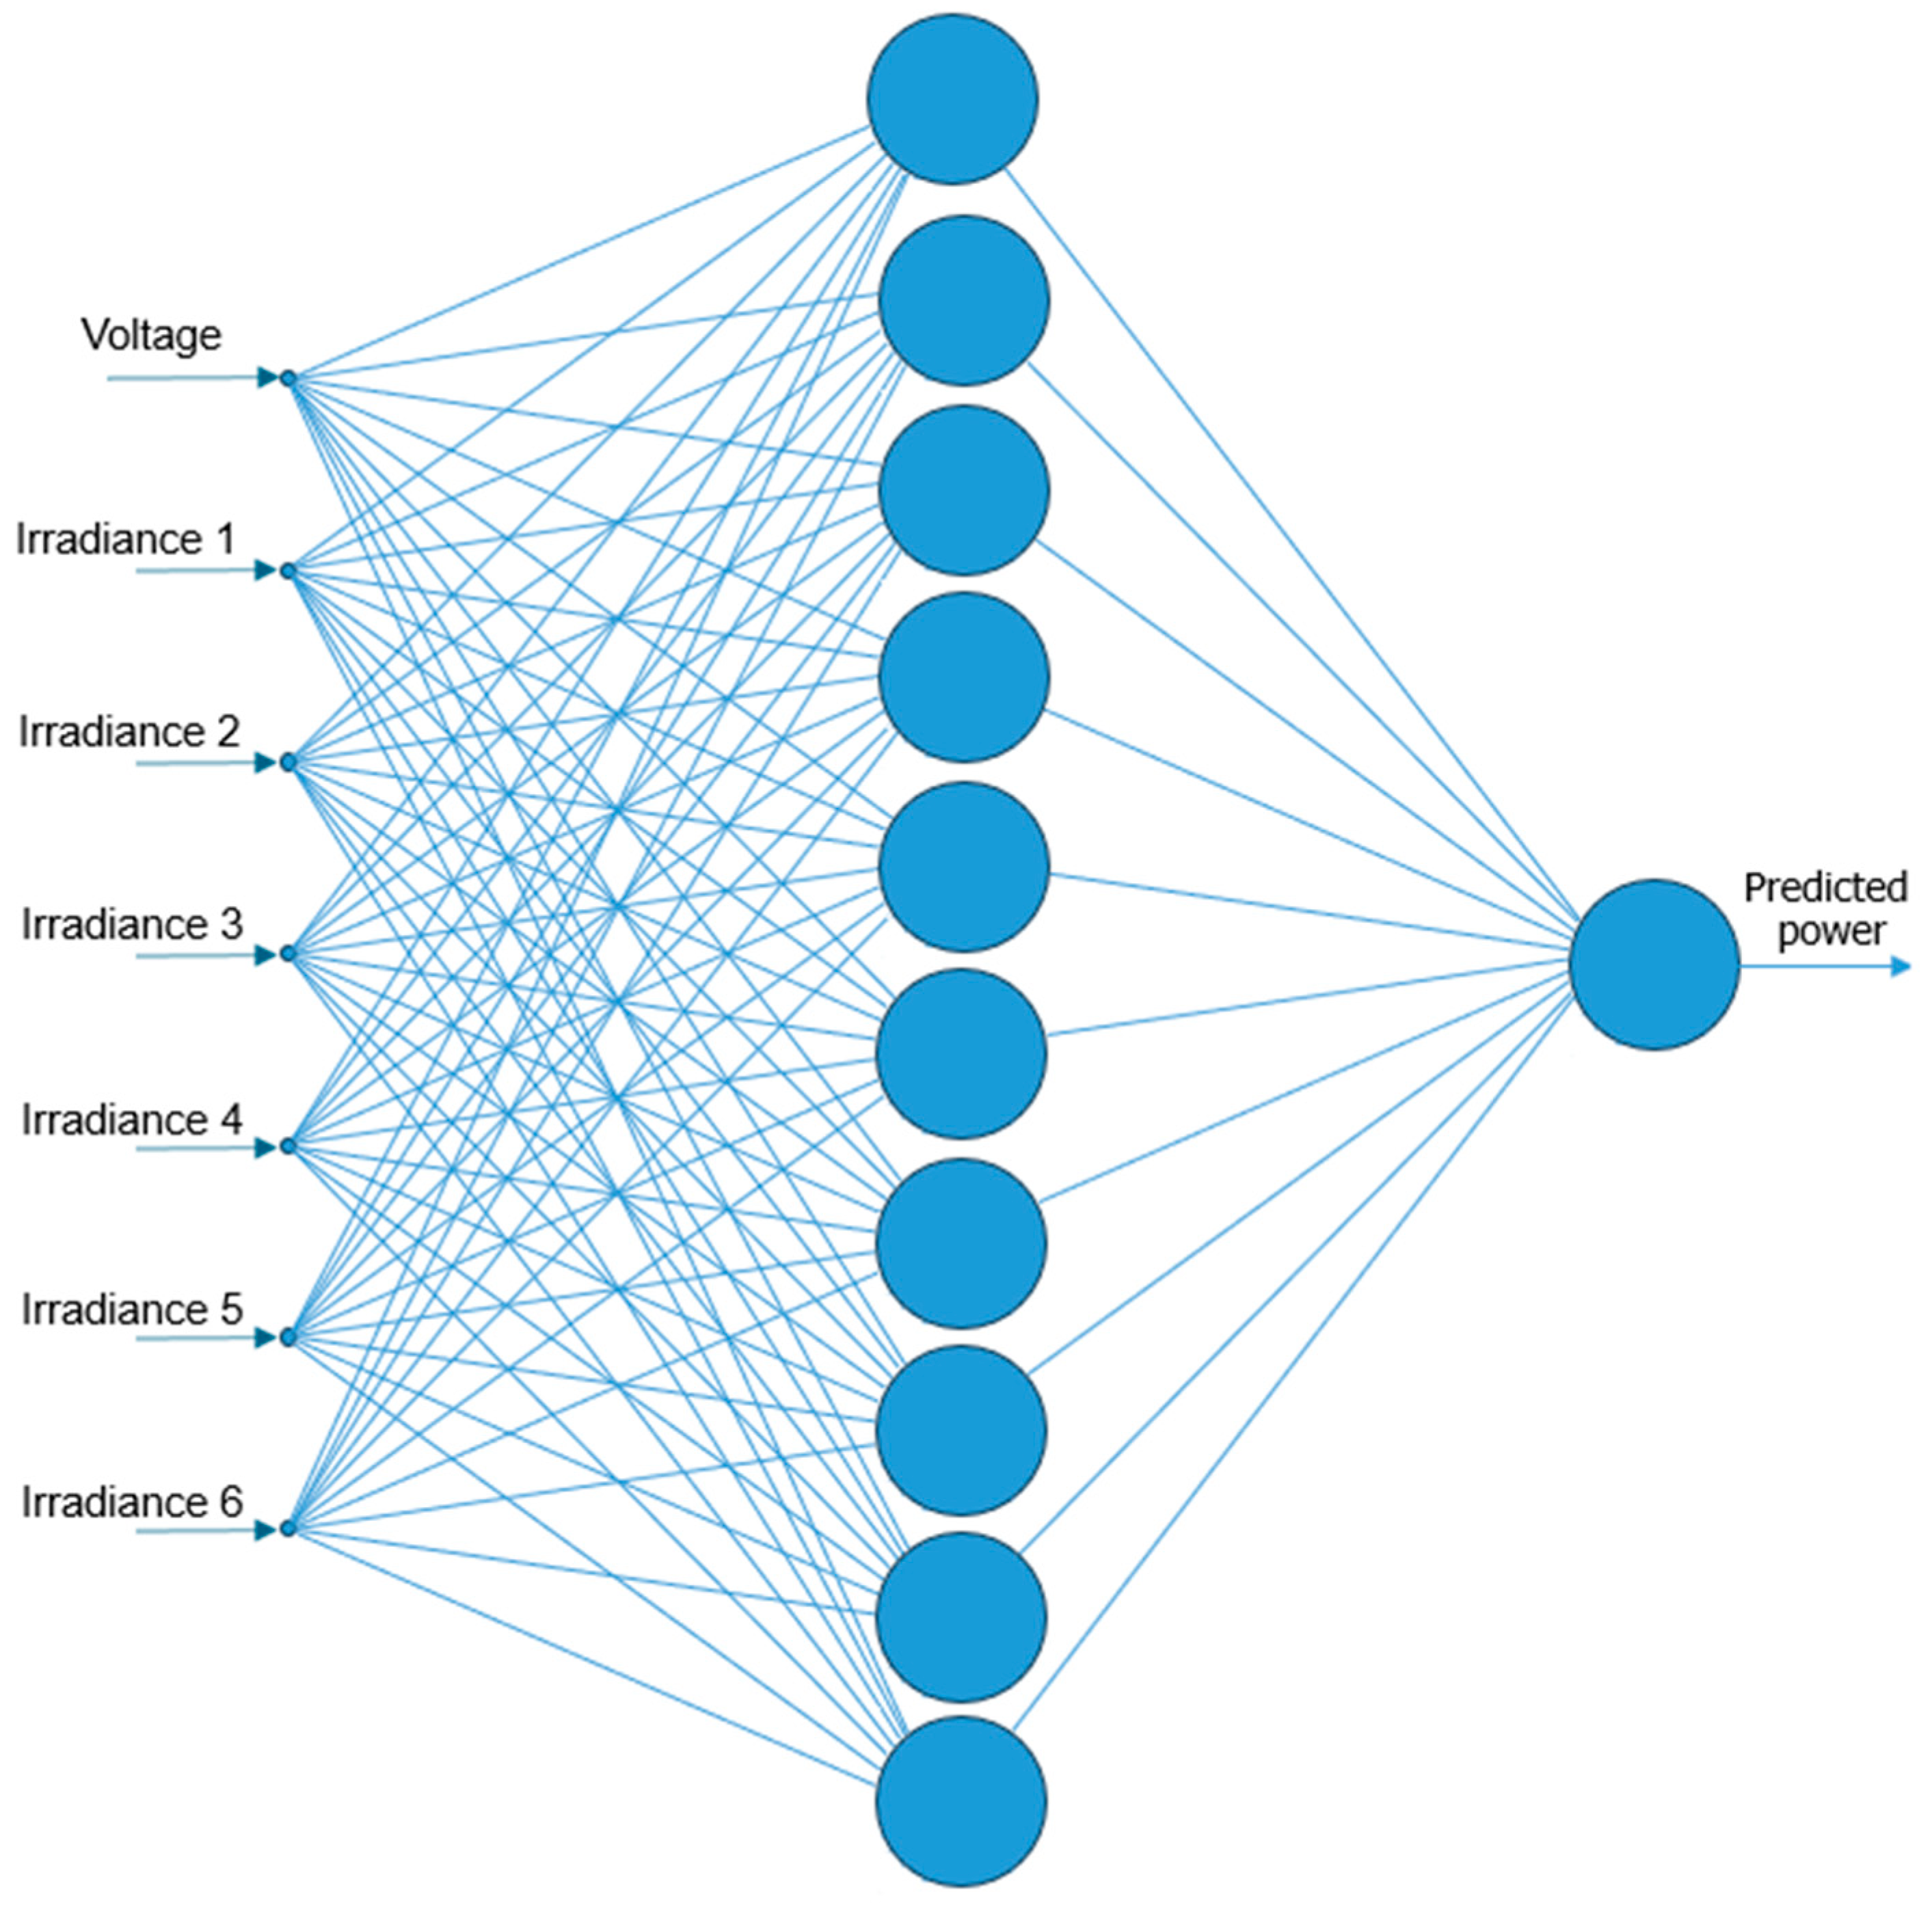
Regarding the network structure, the input layer includes voltage and irradiance profile.
- ⚬
Following the input layer are two hidden layers, each consisting of 10 fully connected neurons.
- ⚬
The output layer then comprises one neuron, which predicts power.
As for activation functions, the hidden layers utilize a sigmoid activation function.
- ⚬
Meanwhile, the output layer uses a linear function.
The neural network was trained on simulated data generated under varying shading conditions, allowing it to predict and regulate the system’s output at the GMPP. Training was performed using the Levenberg–Marquardt Algorithm (LMA), which combines Newton’s method with gradient descent to ensure fast and stable convergence. Through iterative weight adjustment, the network minimizes the error between predicted and actual power, effectively capturing the nonlinear characteristics of P-V curves. The training inputs consisted of voltage and irradiance from different module sections, while the desired output as the corresponding power at the GMPP, enabling the model to learn representative shading patterns and improve its accuracy in real-time MPPT applications.
Figure 6 illustrates the structure of the artificial neural network used in the simulation.
To ensure the accuracy of the estimator, a training and validation process is carried out:
First, simulation data is generated for multiple irradiance scenarios, representing different levels of partial shading. Specific training settings included a maximum of 1000 epochs. Performance was evaluated using the Mean Squared Error (MSE), with the best validation performance achieved at epoch 1000 (MSE = 3.91 × 10⁻³). To encourage generalization, early stopping with validation checks (patience = 6) was implemented.
Data is divided into training and validation subsets to prevent overfitting and ensure the neural network generalizes well under different shading conditions.
Finally, the error between the estimated MPP and the actual MPP (obtained by simulation) is calculated for each condition. A low error indicates good accuracy in the estimation.
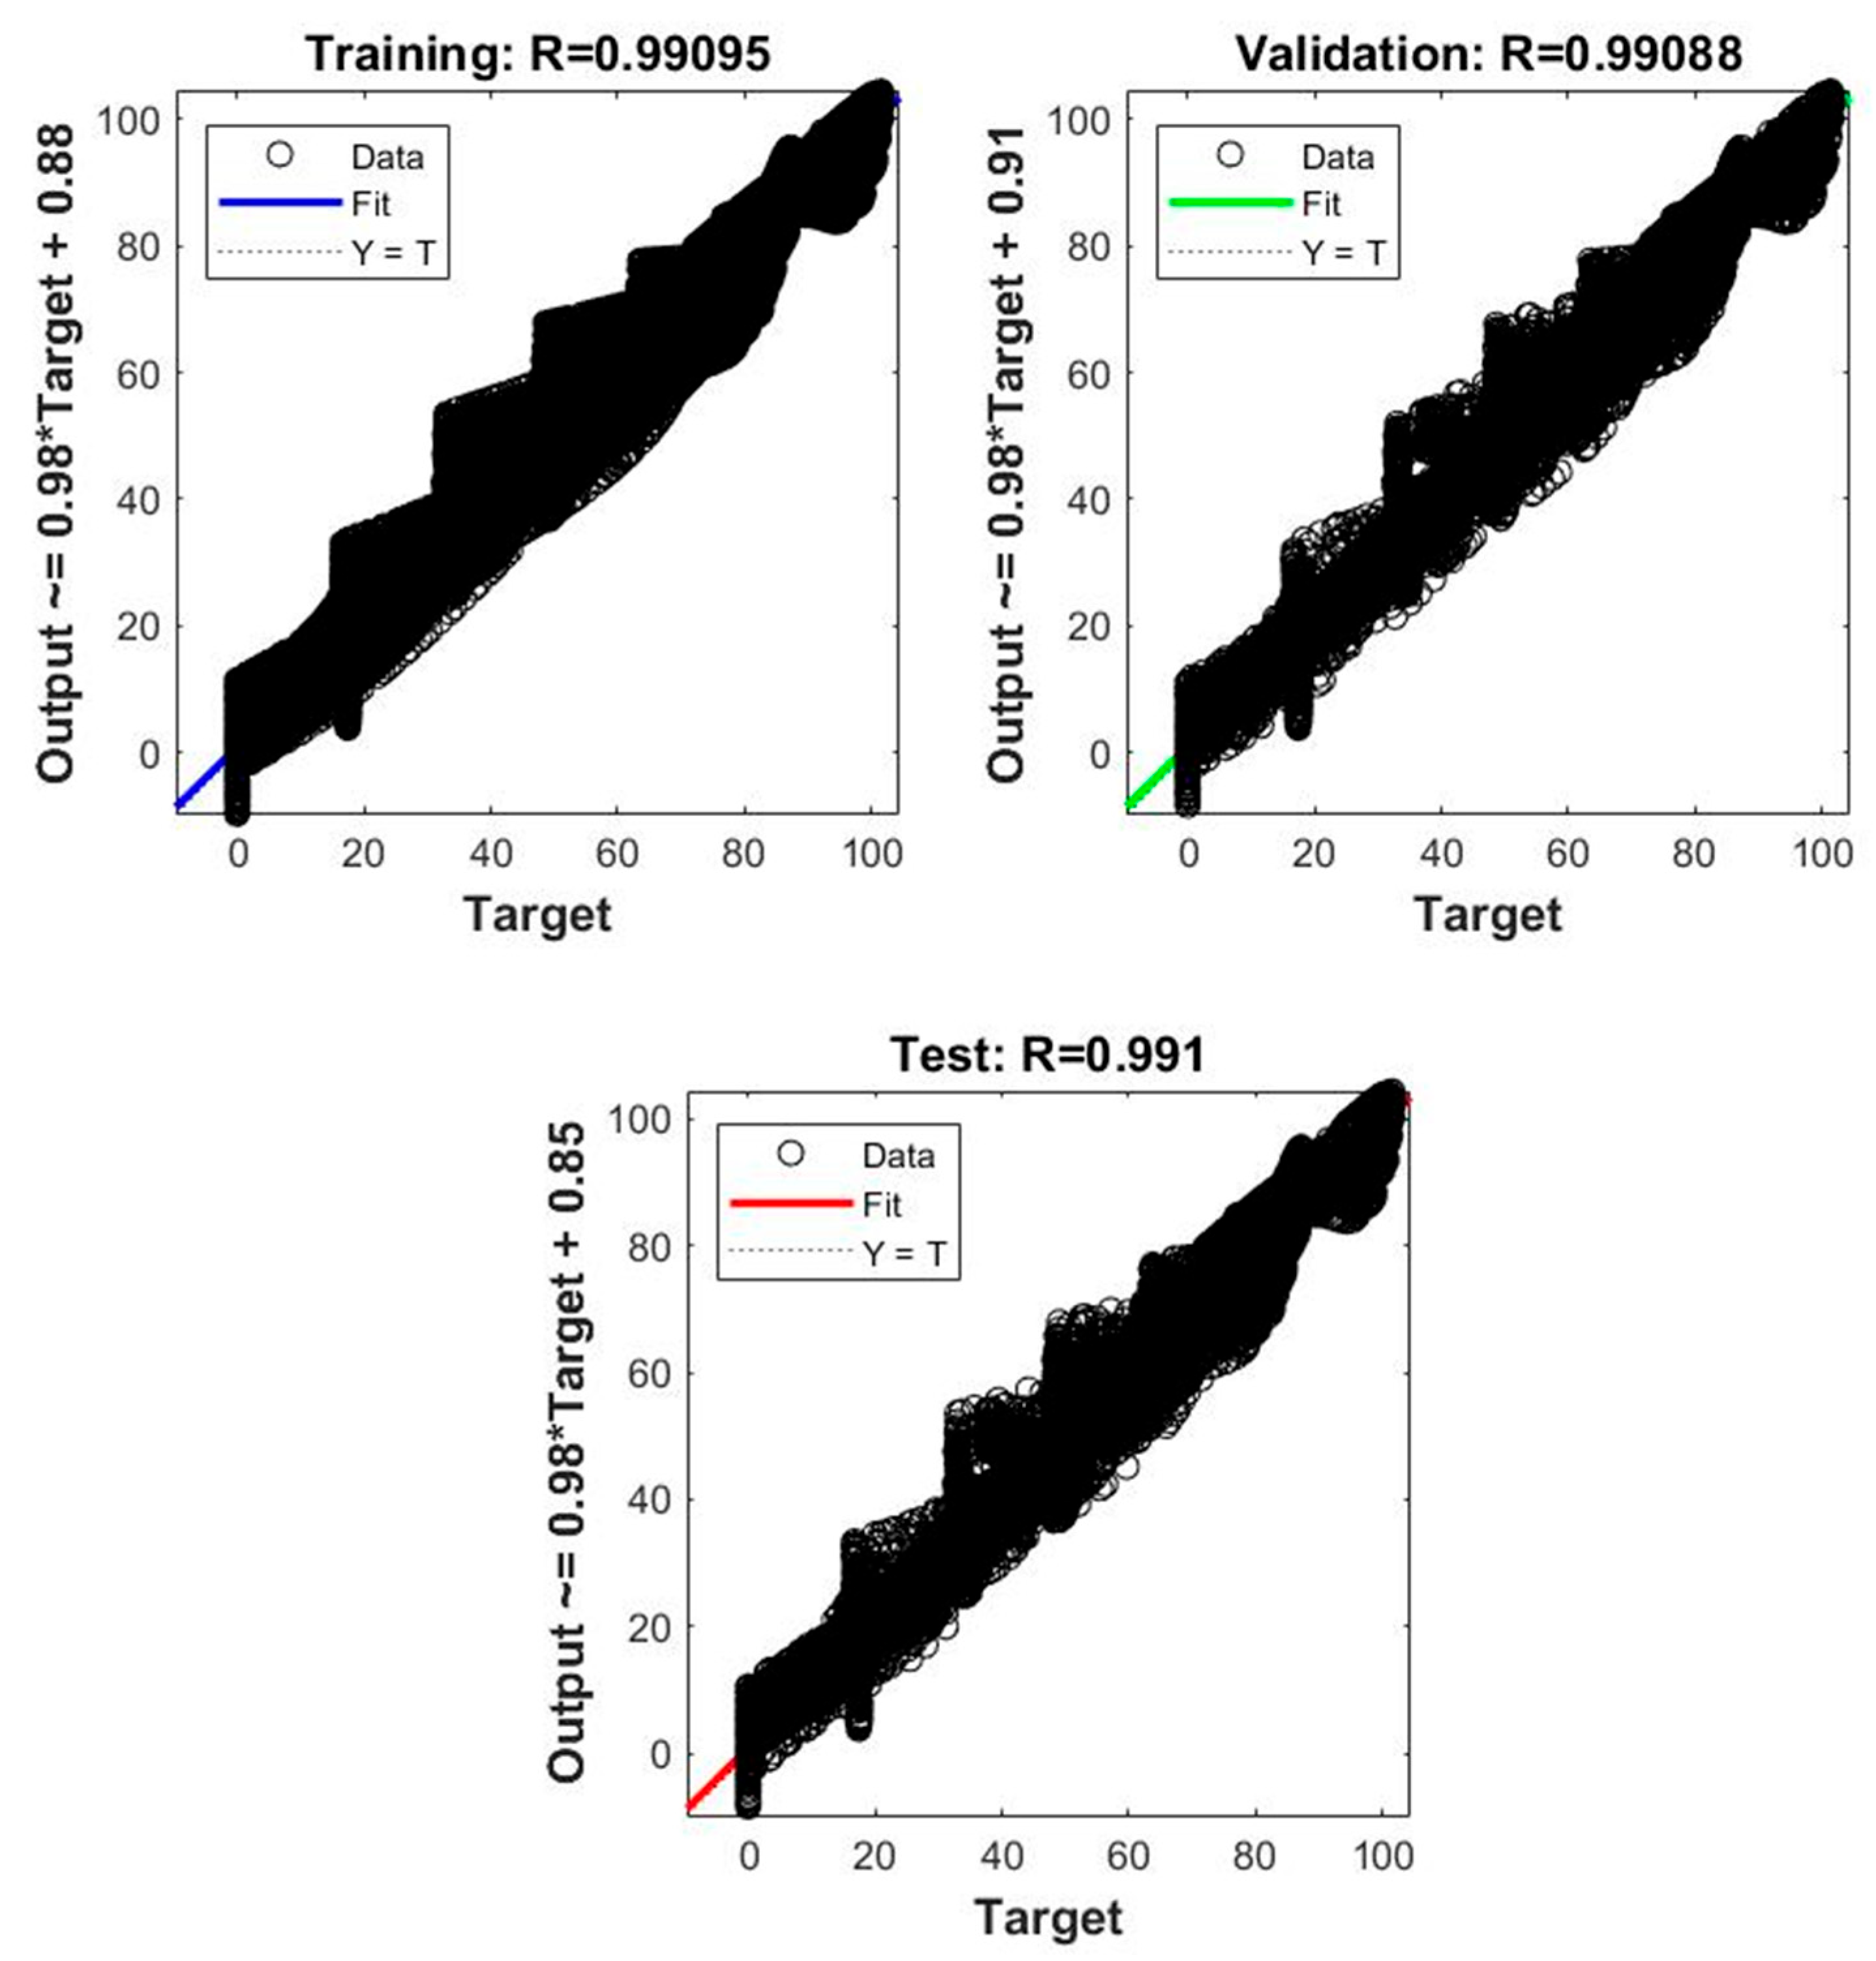
Figure 7 shows the correlation between the training, validation, and testing error data.
A slope near 1 and clustered points around the regression line show a highly accurate model and strong agreement between actual and predicted values. The high correlation coefficient (R = 0.99051) confirms that the neural network performed exceptionally well on the training, validation, and testing datasets, effectively learning the input-output relationship. Following training, the next step is to implement the model in the PV system for MPPT and the necessary code to embed it in the system controller.
2.3. Intelligent Control Algorithm for the MPPT
For the P&O algorithm, when the PV system’s operating voltage shifts in a given direction and the generated power rises, the operating point nears MPP. In this case, the voltage should be adjusted in the same direction. If the power falls, the operating point shifts away from the MPP, and voltage must then be adjusted in the opposite direction to reapproach the MPP.
The proposed algorithm builds on the MPPT P&O method. It is enhanced by a neural network-derived search point which predicts maximum power (Pprev) and its associated voltage (Vprev). This streamlines efficiency by starting near the estimated MPP. After that, the P&O algorithm adjusts the voltage to pinpoint the MPP precisely. It makes incremental perturbations and monitors changes in generated power. The operation is adapted to align with the neural network’s predicted maximum power point.
The proposed algorithm is based on a key premise: having a more precise knowledge of the solar panel’s power-voltage (P-V) curve enables MPPT systems to operate more efficiently.
Figure 8 illustrates the algorithm. It integrates the P&O method with neural network-generated values.
The algorithm simulation is performed in MATLAB, as shown in
Figure 9, which includes an MPPT controller block. This block provides a control signal to adjust the PWM duty cycle, ensuring continuous MPPT operation. Within the controller, the P&O algorithm receives voltage and current data from the solar panel array and neural network, then generates a reference voltage to adjust the PWM duty cycle. A feedback control loop on the right side of the MPPT block produces a PWM signal for the DC-DC converter, regulating the panel’s output power to maintain the system at its maximum power point. The control system consists of:
PV array input: The intelligent control system uses an artificial neural network. This neural network was trained to predict the MPP under different environmental and operational conditions. This approach improves the system’s efficiency and dynamic response compared to conventional control methods. The first block, ‘NeuralNetworkFunction’, receives the PV array’s voltage and irradiance as inputs. It generates an output that predicts the maximum power. The output also determines the optimal operating point and the voltage at which maximum power is produced.
Delay blocks (1/z): These blocks store previous values of variables. These include array voltage, array current, and array power. The stored values are required for computing differences in the P&O algorithm.
P&O algorithm: This model operates in conjunction with a PWM generator to adjust the DC-DC converter’s duty cycle. As a result, power regulation is effective. In the ‘PO’ block, the P&O algorithm uses previous voltage, power, and duty ratio values. It calculates the new duty cycle and adjusts the PV array’s operating point.
PWM generation: The resulting duty signal D is sent to a PWM generator that modulates the pulse width. It controls the power converter’s switch in the power section of the system.
DC-DC boost converter: In this power circuit, the PWM controls the voltage and current of the PV array and regulates the converter’s switch to keep the system at its maximum power point.
2.4. Selection of Perturbation Period and Perturbation Magnitude in P&O
In the P&O algorithm, tracking efficiency and system stability strongly depend on two critical parameters:
An inappropriate choice of these parameters may lead to excessive oscillations around the MPP, considerable power losses, or even instability. Therefore, a scientifically sound and quantitative selection criterion is required.
2.4.1. Perturbation Period Selection
The perturbation period must be larger than the dominant time constant τ of the DC–DC converter and its control loop, so the PV power settles before each measurement.
The adopted rule is
which ensures that the measured power corresponds to at least 95% of the settled response. In practice, this can be expressed as:
where
is the crossover frequency of the converter control loop, this criterion prevents the algorithm from acting on unsettled signals and guarantees stable operation.
2.4.2. Perturbation Magnitude Selection
Oscillation around the MPP introduces an average power loss proportional to the local curvature of the P-V curve. Using a quadratic approximation around the optimal voltage
VMPP:
To limit this loss to a fraction ε of the maximum power P
MPP, the following condition is imposed:
This condition provides a physically grounded upper bound for the perturbation step size, ensuring a trade-off between convergence speed and energy efficiency.
2.4.3. Lower Bound Due to Noise and Irradiance Variations
To avoid misinterpretation of the power increment due to measurement noise (σp) or fast irradiance variations (
), a lower bound must also be enforced:
It should be noted that κ = 3 (three-sigma criterion). Near the MPP, ∣∂P/∂V∣ → 0|, so keeping ΔV constant would make ∣ΔP∣ vanish; therefore, ΔV must be adaptive. This ensures that perturbation produces a detectable effect beyond noise and environmental fluctuations.
2.4.4. Adaptive Strategy
Considering both the upper and lower bounds, an adaptive perturbation law is defined as
where α is a gain tuned so that far from MPP (large slope) steps are larger, while near MPP (small slope) steps shrink automatically, while ΔV
min and ΔV
max are derived from the above constraints.
Far from the MPP, the steep power slope leads to larger ΔV and faster convergence. Near the MPP, the slope decreases, and ΔV is automatically reduced, minimizing oscillations. This framework ensures that the perturbation period is directly related to the converter dynamics, preventing premature decisions and perturbation magnitude is bounded by the P-V curvature, limiting power losses. Algorithm robustness against noise and fast irradiance changes is guaranteed through a lower bound.
The parameter ε represents the relative loss tolerance defined as
where
is the average power loss induced by steady oscillations around the MPP.
In practice, ε is a design choice that specifies how efficient degradation is acceptable in exchange for a feasible perturbation magnitude ΔV. Typical values range between 0.1% and 1% of PMPP.
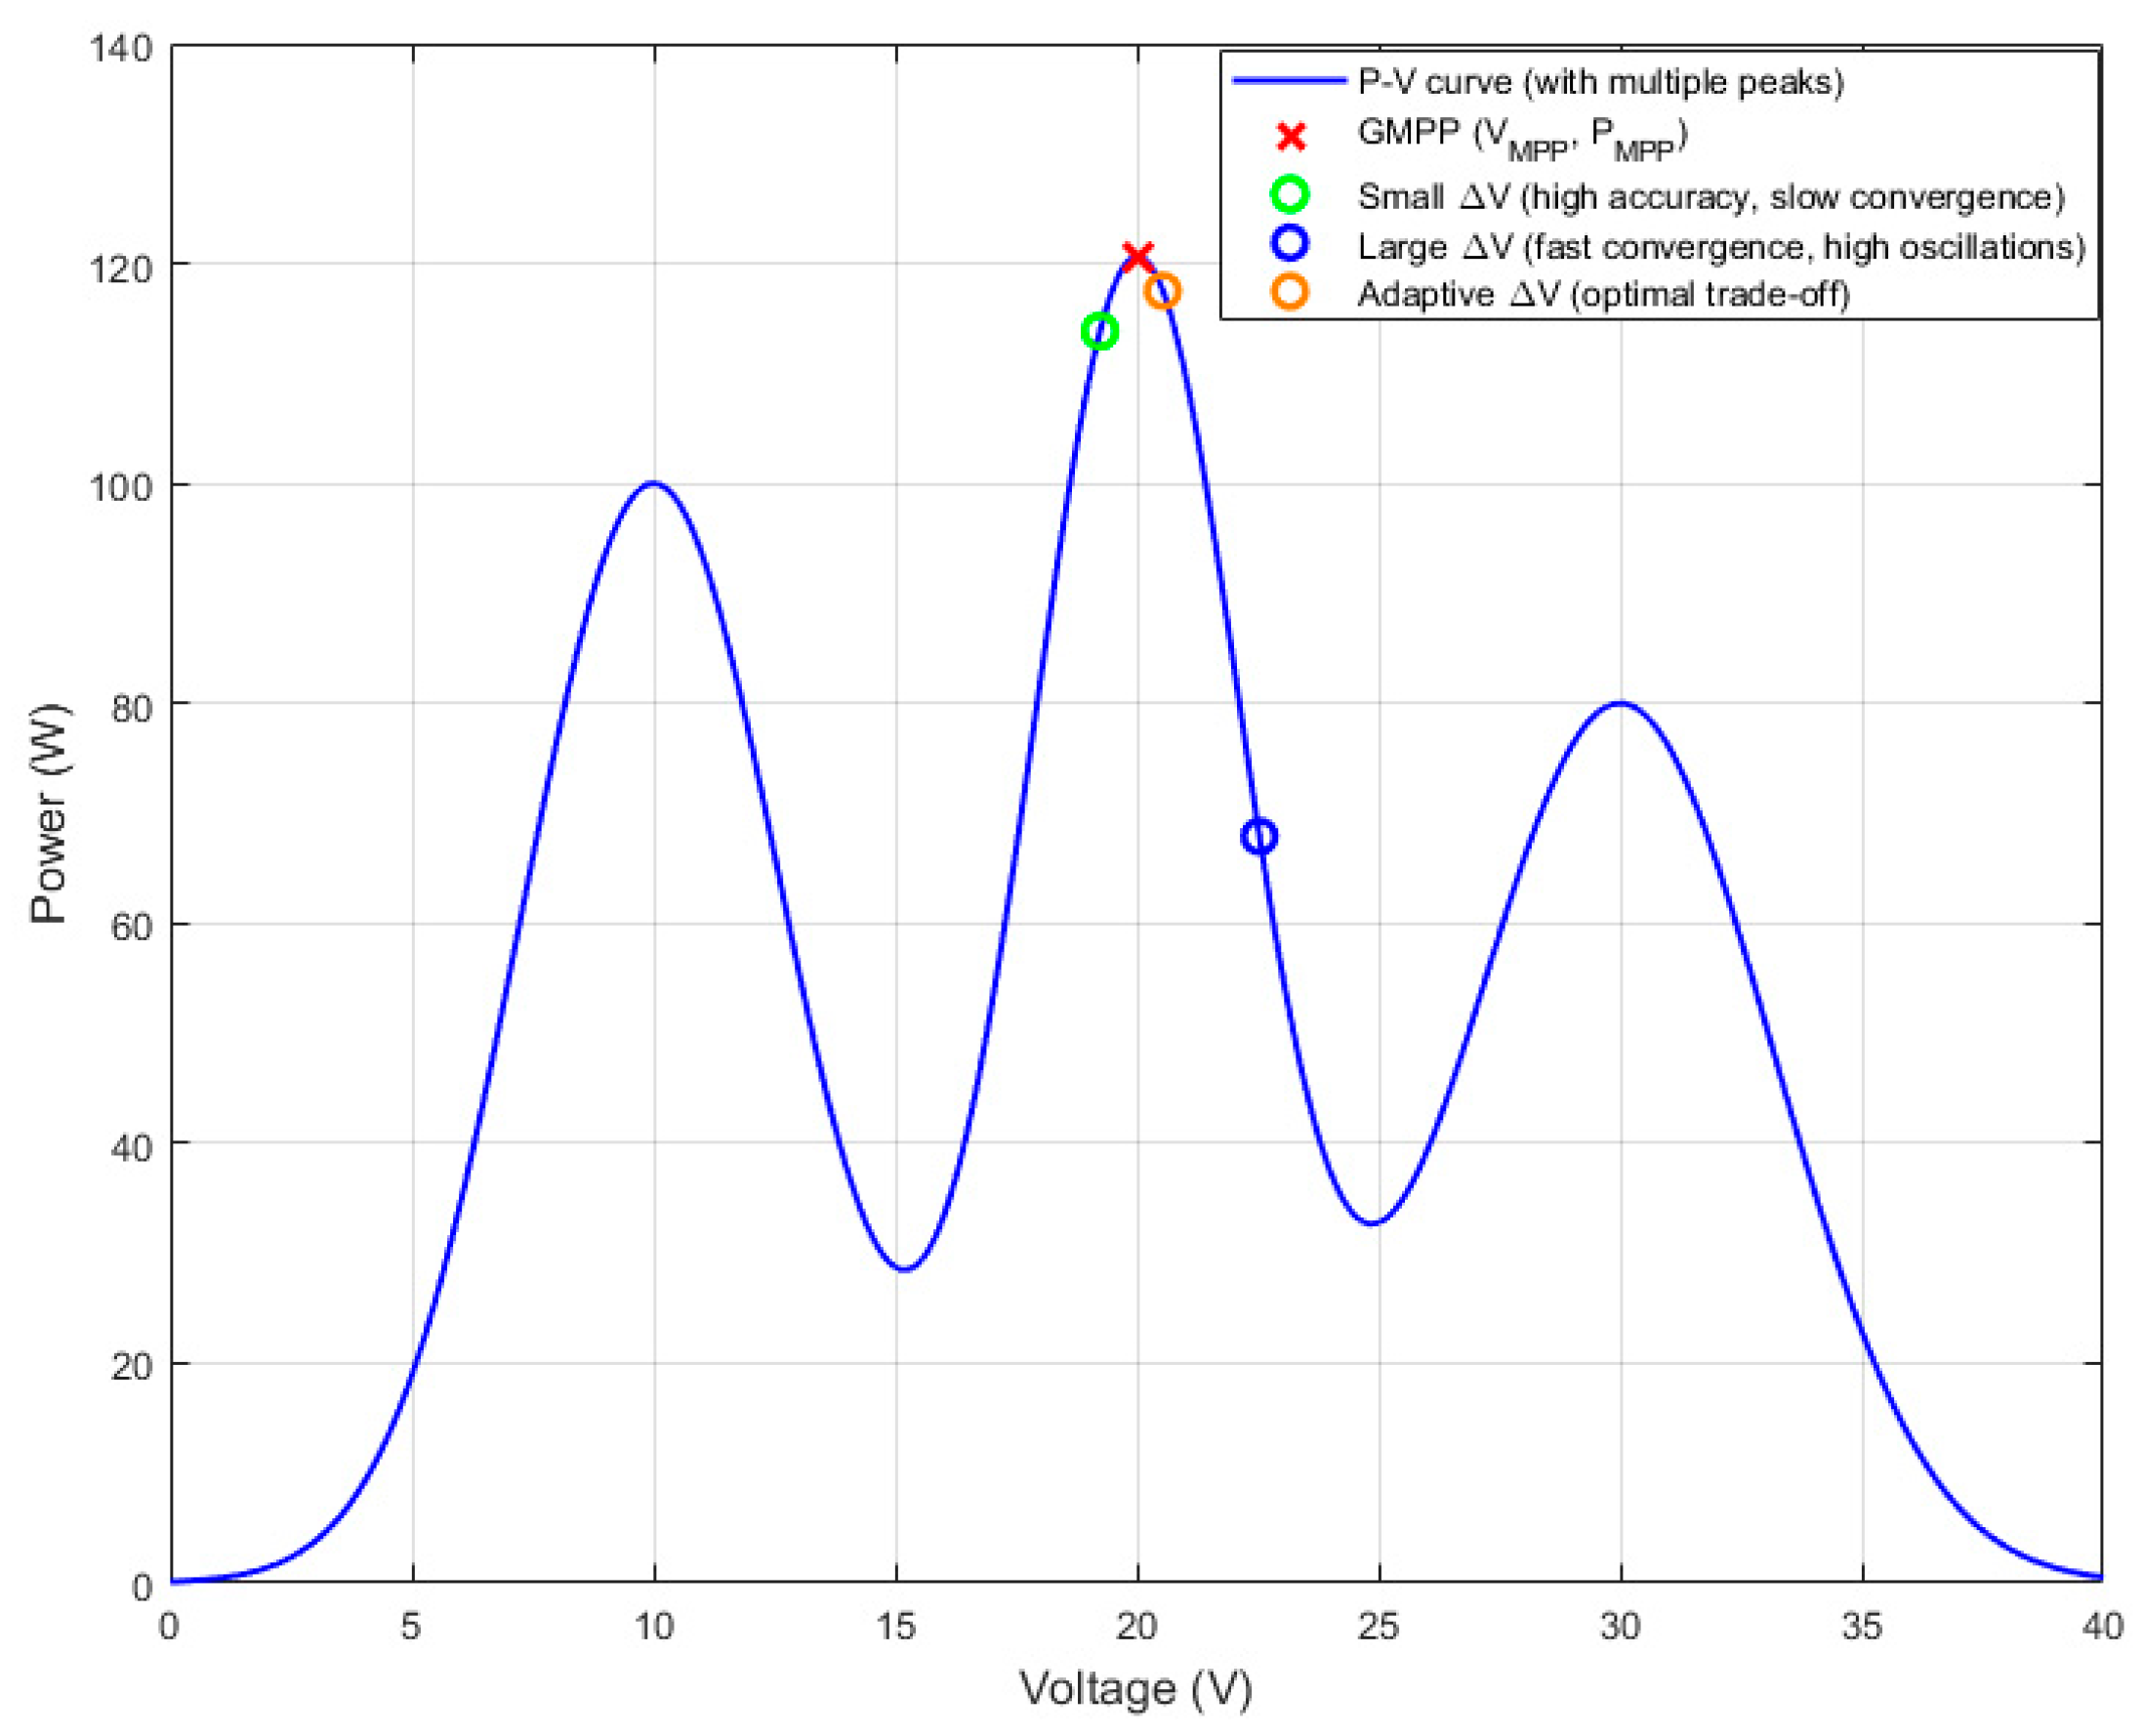
Figure 10 illustrates the impact of the perturbation magnitude (ΔV) in the P&O algorithm on the power–voltage (P-V) curve of the PV system. A very small ΔV (green point) achieves high accuracy near the MPP but results in slow convergence. In contrast, a large ΔV (blue point) yields faster convergence but introduces significant oscillations around the MPP. The adaptive ΔV strategy (yellow point) ensures an optimal trade-off since it dynamically adjusts the perturbation step according to the slope of the P-V curve, while keeping ΔV within ΔV
min and ΔV
max (using the clip operator). This approach combines the stability of small perturbations with the responsiveness of large ones.
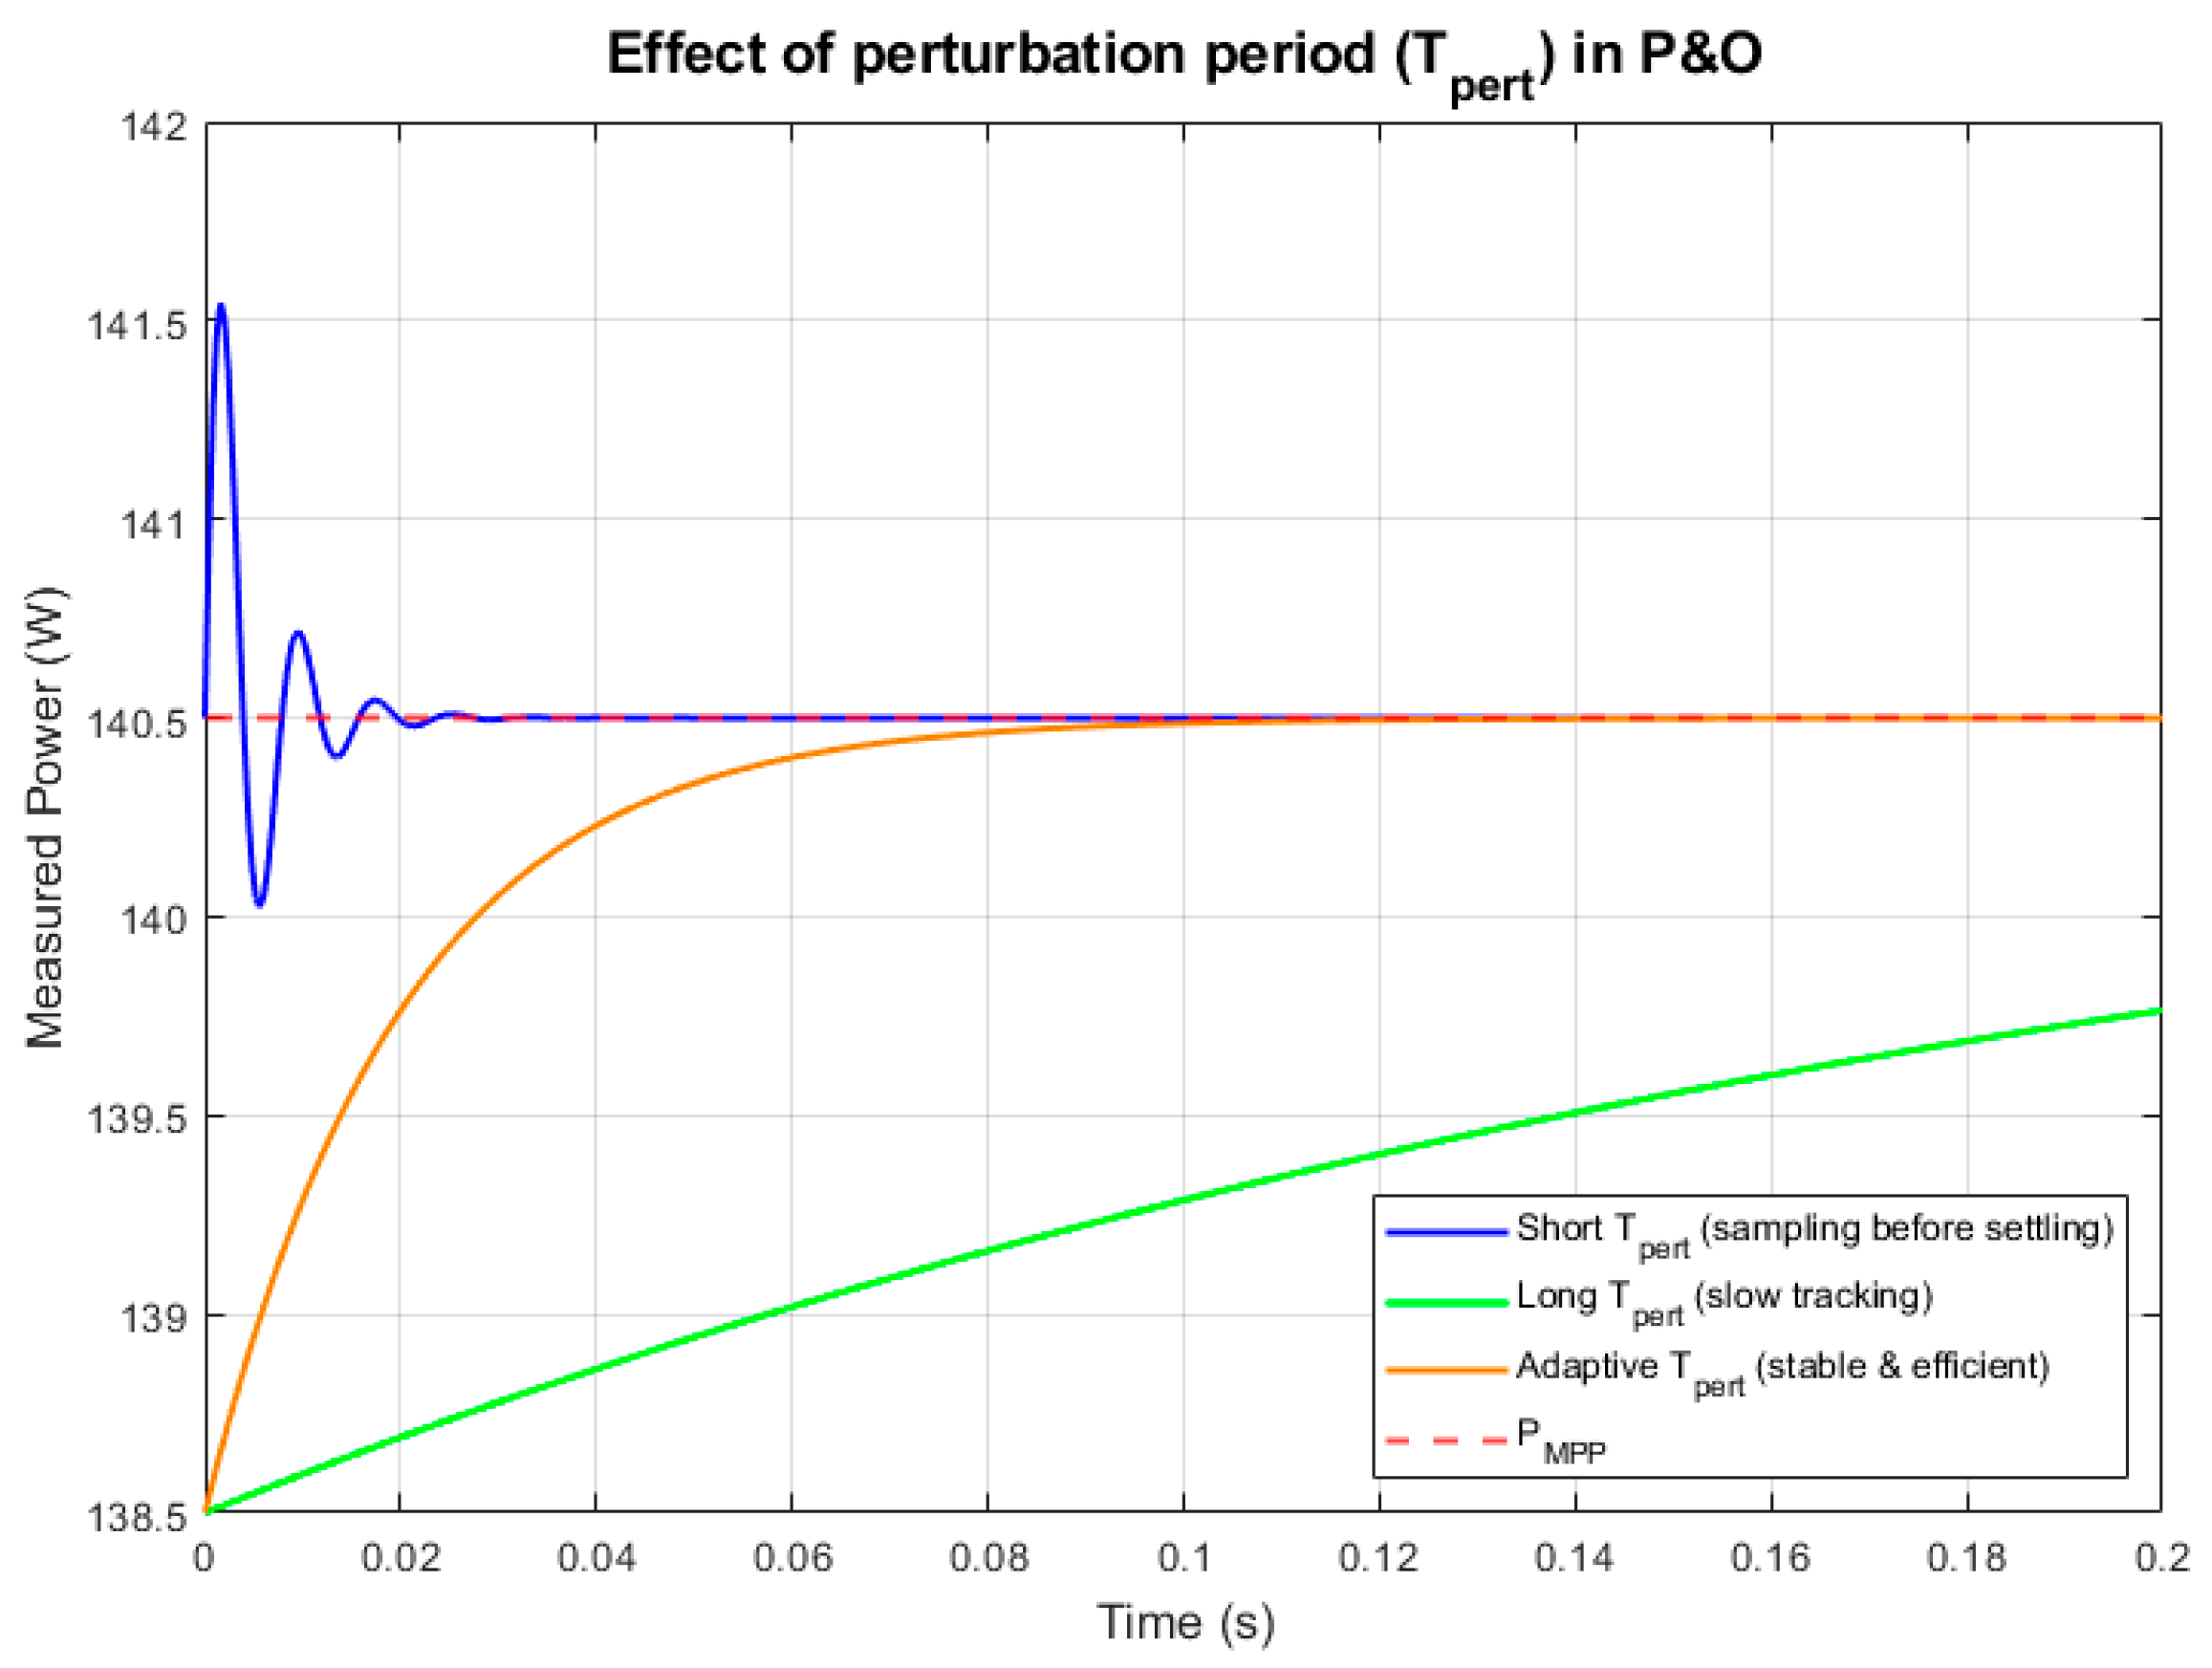
Figure 11 shows how the perturbation period (T
pert) affects the P&O algorithm. A short T
pert (blue curve) causes the controller to take samples before converter dynamics settle, leading to oscillations and instability near the MPP. A long T
pert (green curve) brings stability, but tracking becomes slow and convergence to the MPP is delayed. The adaptive T
pert strategy (orange curve) adjusts the sampling interval based on converter bandwidth and settling time, achieving both fast convergence and stable operation near the MPP.
3. Results
Integrating subsystems into the Simulink model allows a more detailed and realistic simulation of how the PV system works.
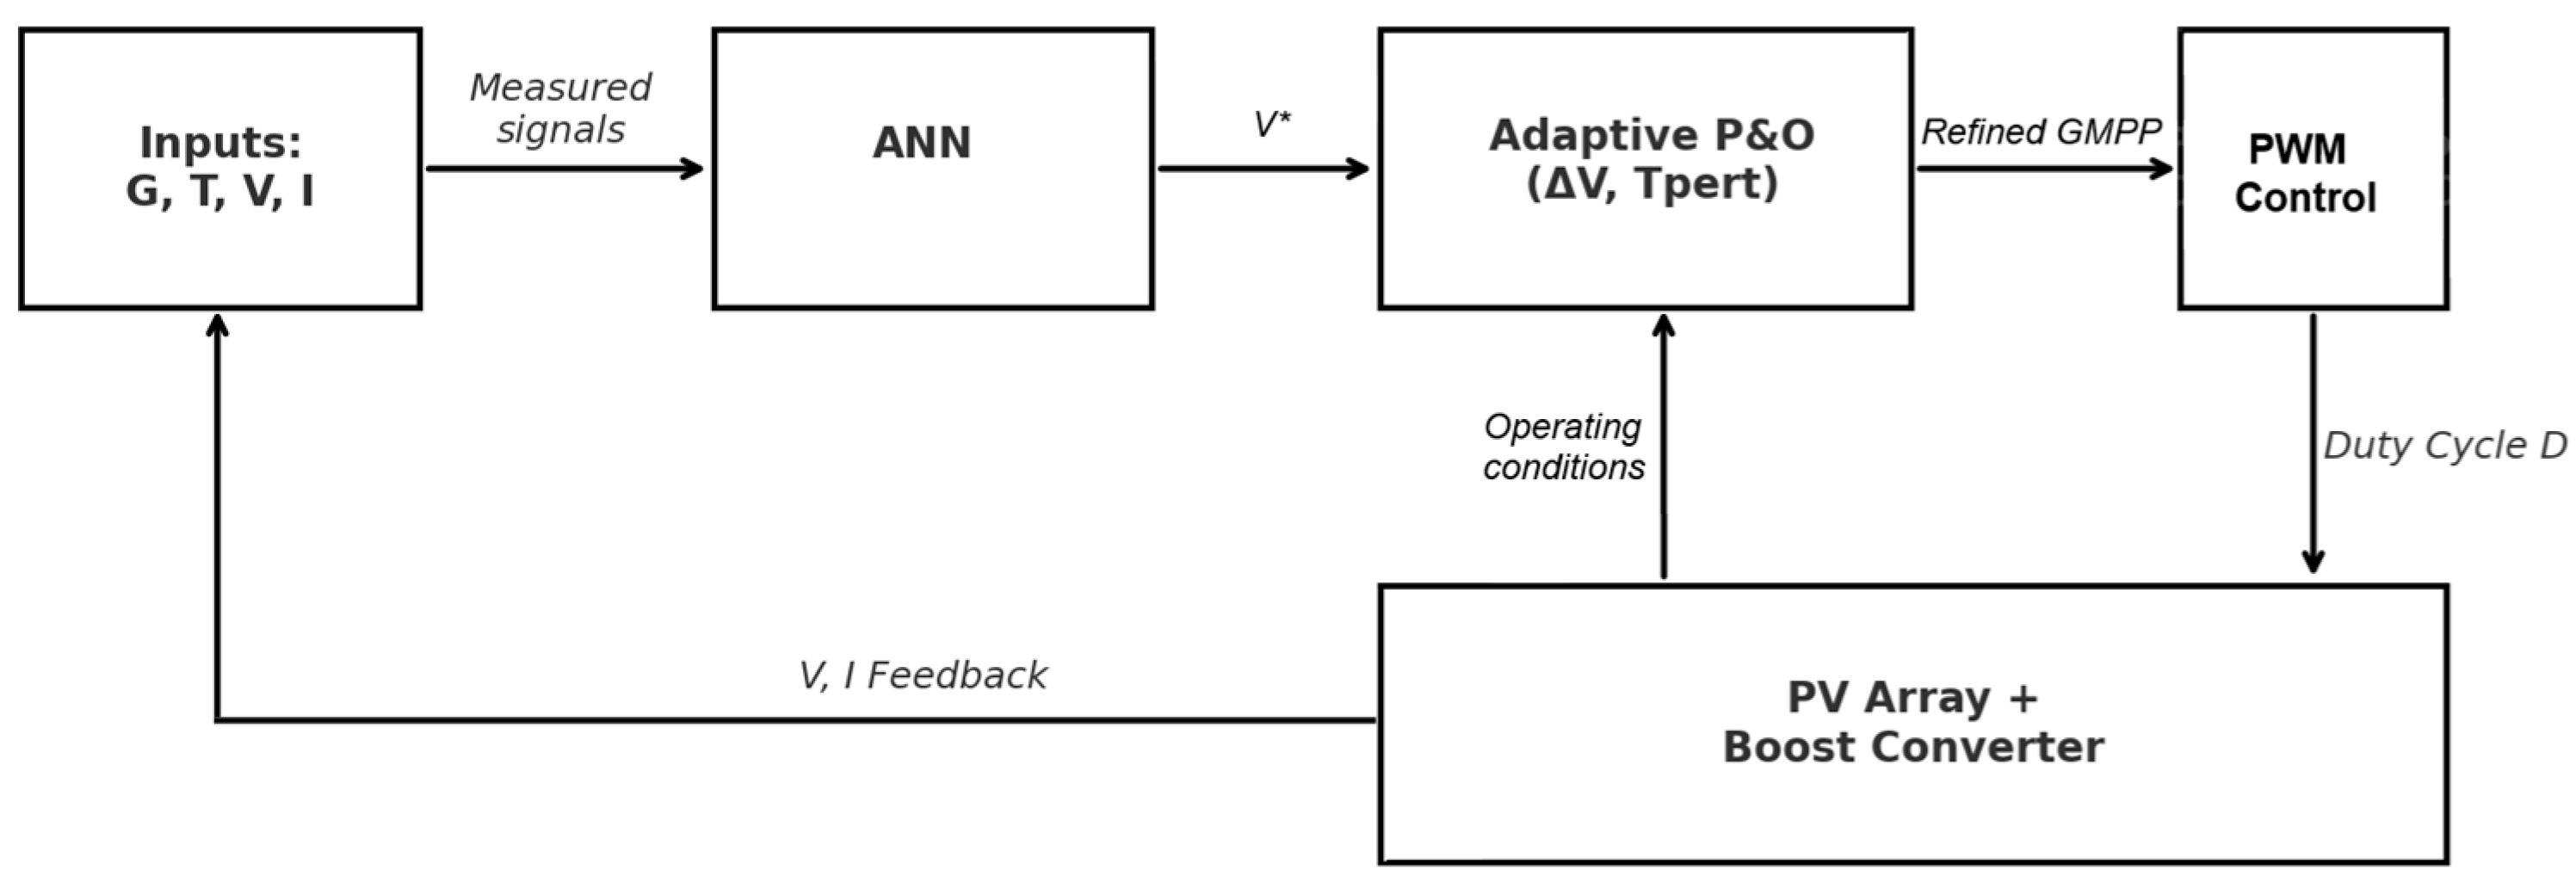
Figure 12 illustrates this setup: a PV array with a DC-DC boost converter is controlled by a system that utilizes both a neural network and an adaptive P&O algorithm. The PV array produces electricity from sunlight. The control system enhances performance by utilizing measurements such as PV current (I
pv), voltage (V
pv), and environmental data, including sunlight and temperature. The neural network estimates a starting reference voltage V*, defined as the predicted voltage at or near the GMPP, which the adaptive P&O algorithm fine-tunes with a variable adjustment method (T
pert) to find the GMPP. This setup enables the system to reach the maximum power point faster and remain stable when conditions change suddenly. The optimized output is used to create a duty cycle (D) in the PWM control block, which operates the boost converter. Ongoing voltage and current feedback keep the system steady and help maximize power output under changing conditions.
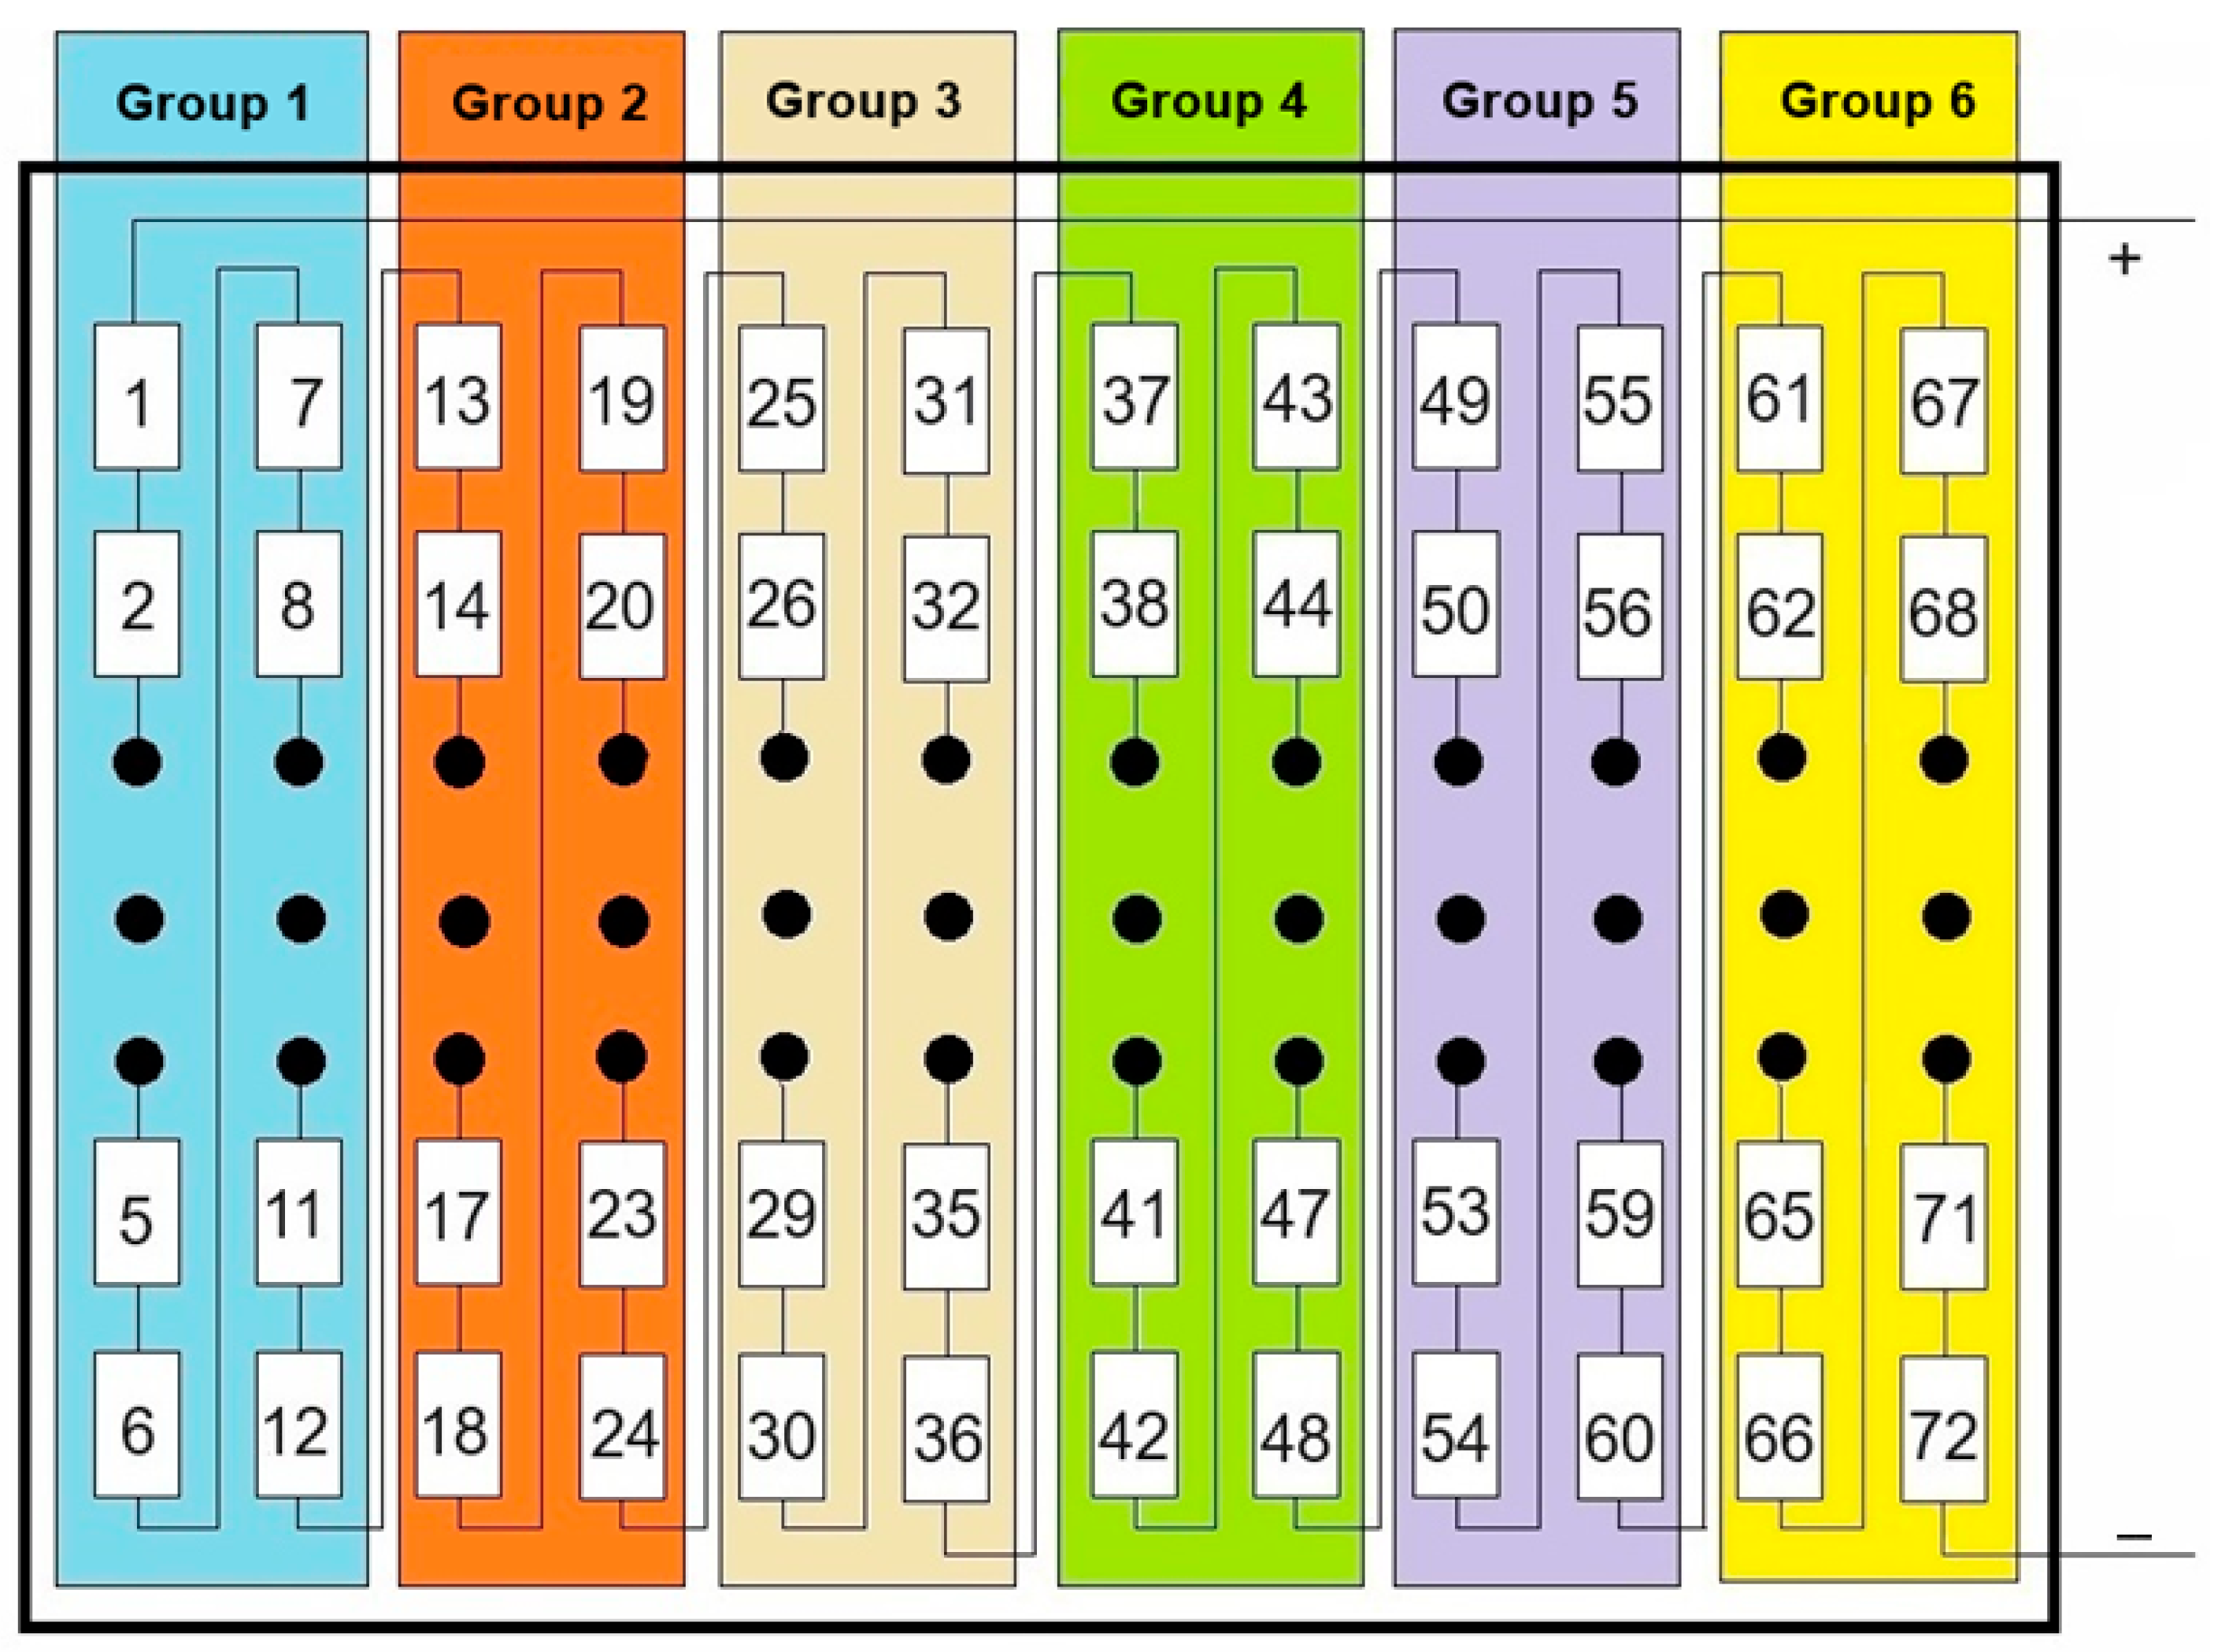
Different scenarios were designed to evaluate the PV array’s performance under dynamic partial shading, simulating real-world obstacles like fast-moving clouds or shifting shadows. These scenarios show how varying shading affects efficiency and help study how quickly and effectively the MPPT system adapts to changes in irradiance. This analysis gives insight into stability and overall energy efficiency. For this, the 72 PV panel cells were divided into six groups of 12 cells each, as shown in
Figure 13, allowing comparison to identify best practices for maximizing energy production when partial shading is unavoidable. The groups are:
Group 1: includes cells 1 to 12.
Group 2: includes cells 13 to 24.
Group 3: includes cells 25 to 36.
Group 4: includes cells 37 to 48.
Group 5: includes cells 49 to 60.
Group 6: includes cells 61 to 72.
Each group connects two cells in series, thereby maximizing the PV panel’s efficiency under partial shading. This arrangement also supports MPPT techniques, enabling more effective management of irradiance variations among groups. Below, several designed shading scenarios are detailed.
3.1. Scenario 1: Irregular and Uneven Shading
An irregular shadow covers cell groups unevenly and non-sequentially. For example, groups 3 and 5 (cells 25–36, 49–60) receive medium irradiance, while groups 1, 2 and 6 (cells 1–12, 13–24, 61–72) receive high irradiance. In contrast, group 4 (cells 37–48) receives low irradiance. Suddenly, all irradiance decreases by 100 W/m
2 and remains constant. This scenario could simulate the shadow from a tree, with dense leaves in some areas and lighter branches in others. Alternatively, it could represent an object suddenly blocking the panel, resulting in unpredictable and uneven shading. To illustrate these effects,
Figure 14 shows the irradiance pattern applied to the PV system, both with and without the inclusion of a neural network. Furthermore,
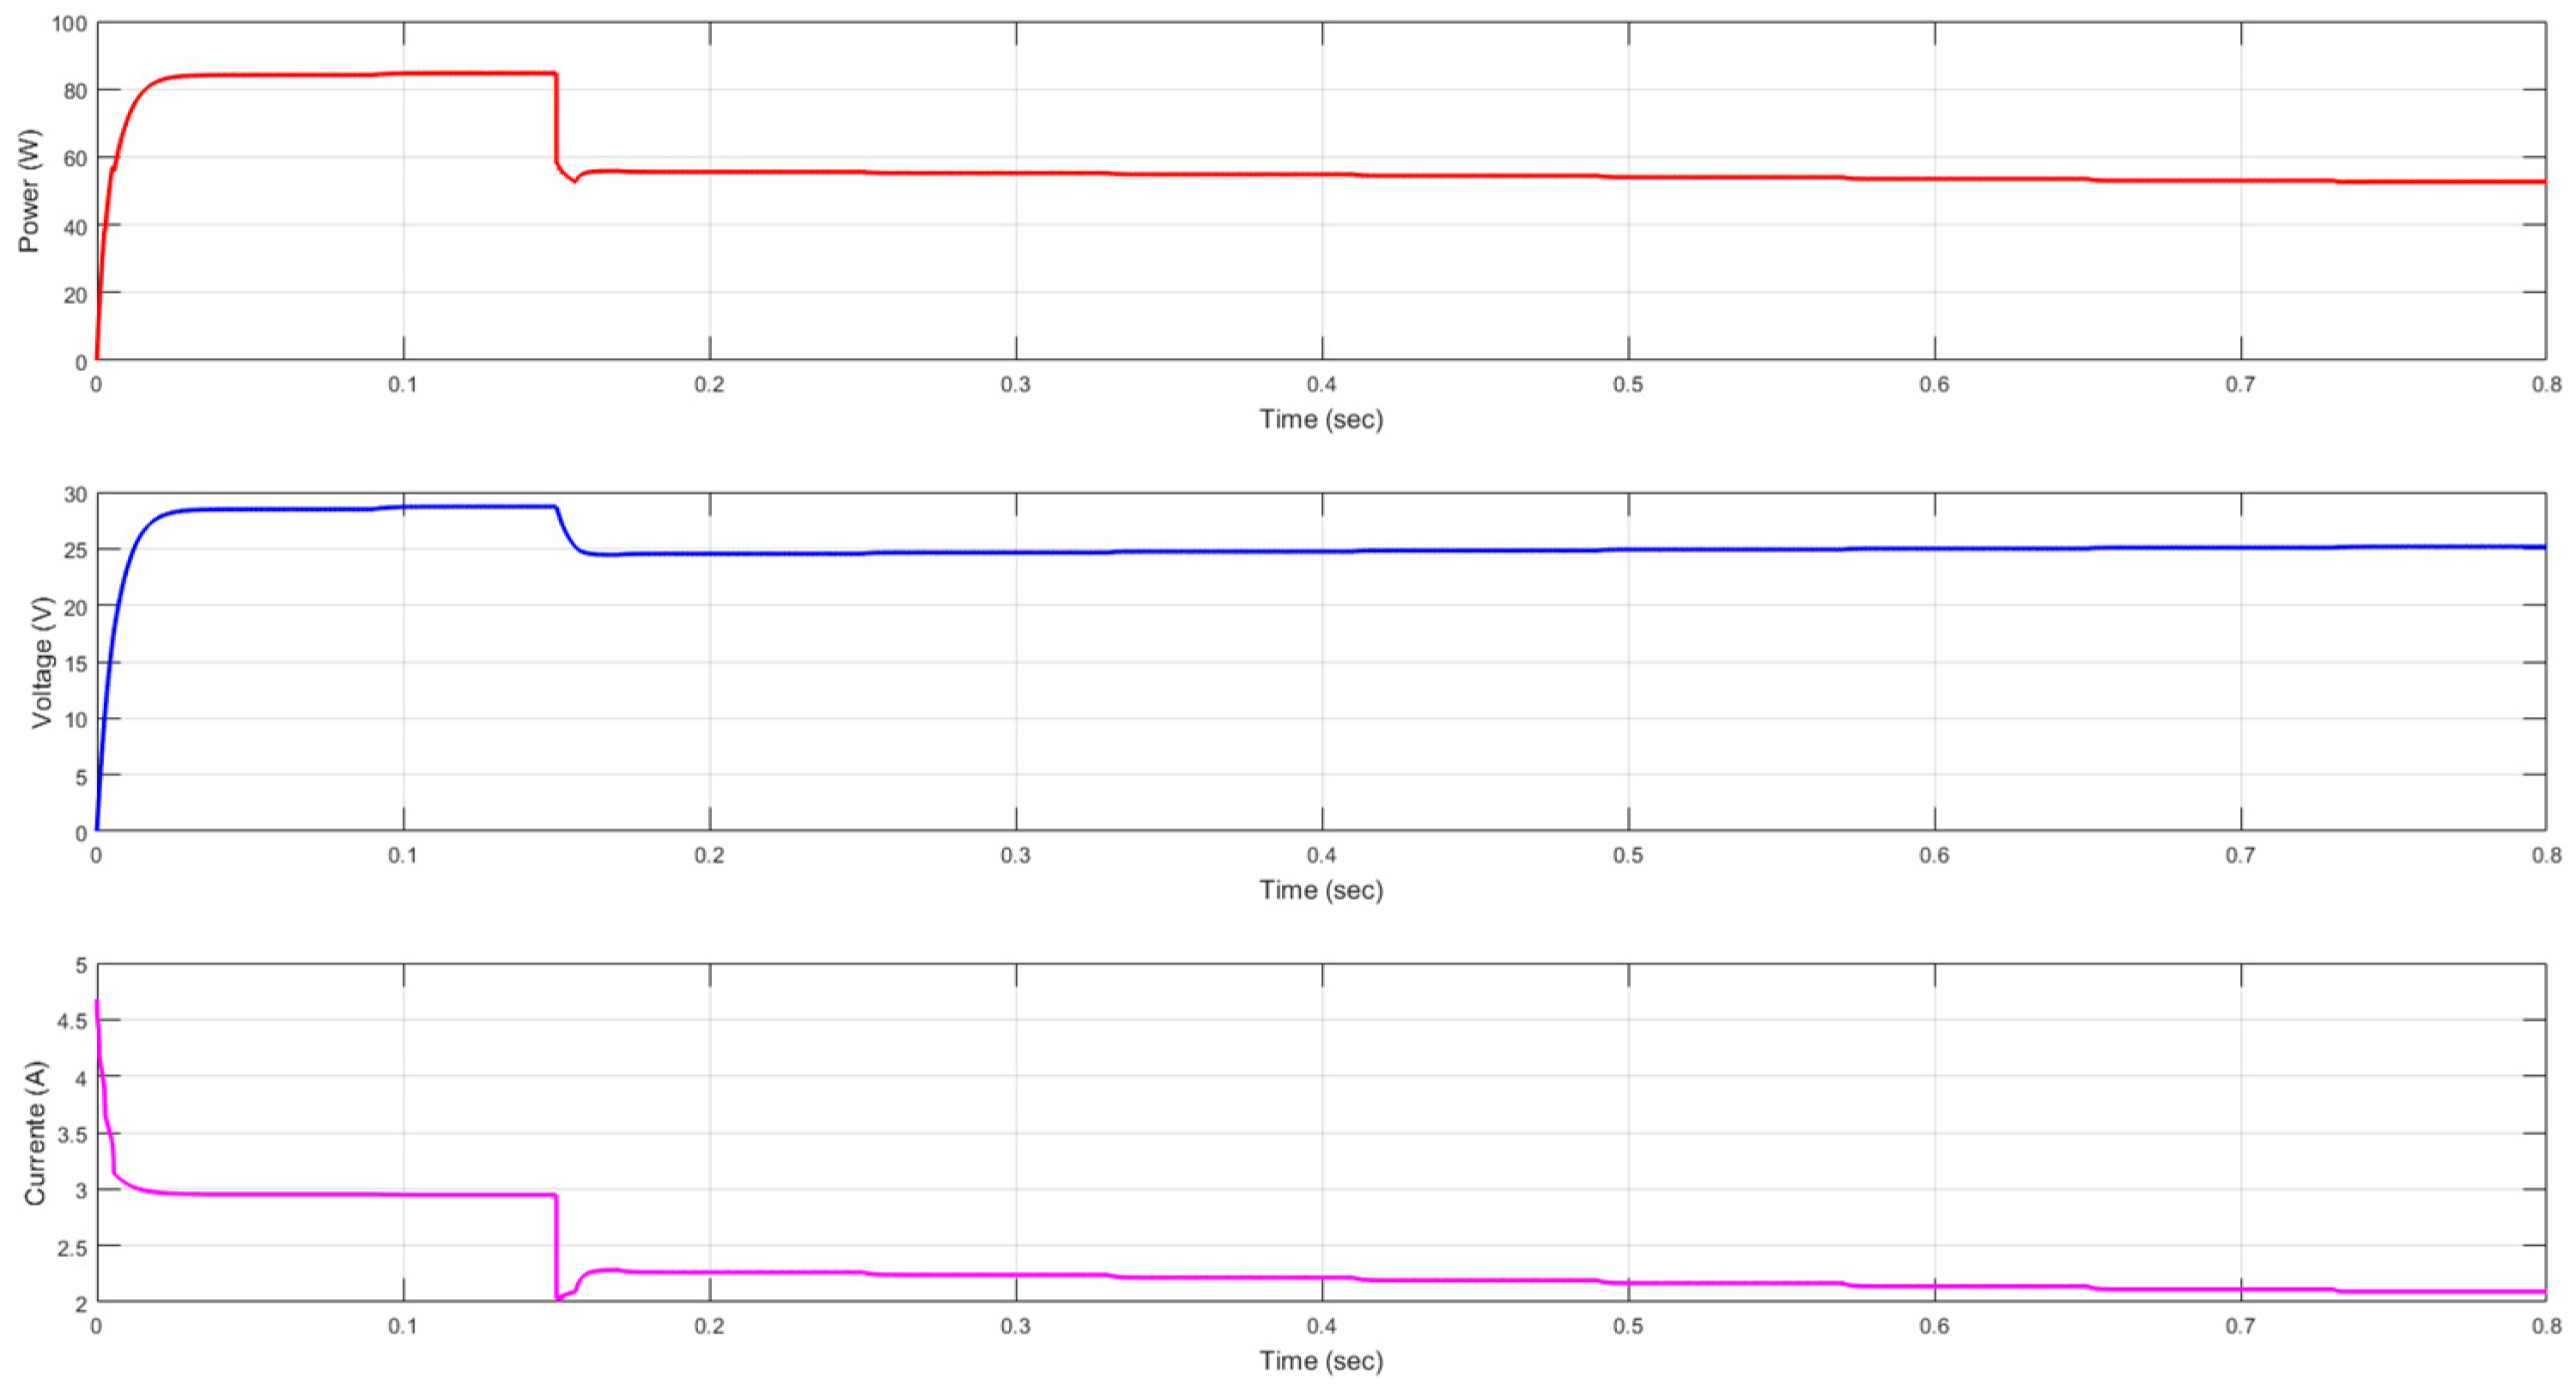
Figure 15 and
Figure 16 display system results for the P&O MPPT algorithm and the neural network implementation, respectively.
Results of scenario 1:
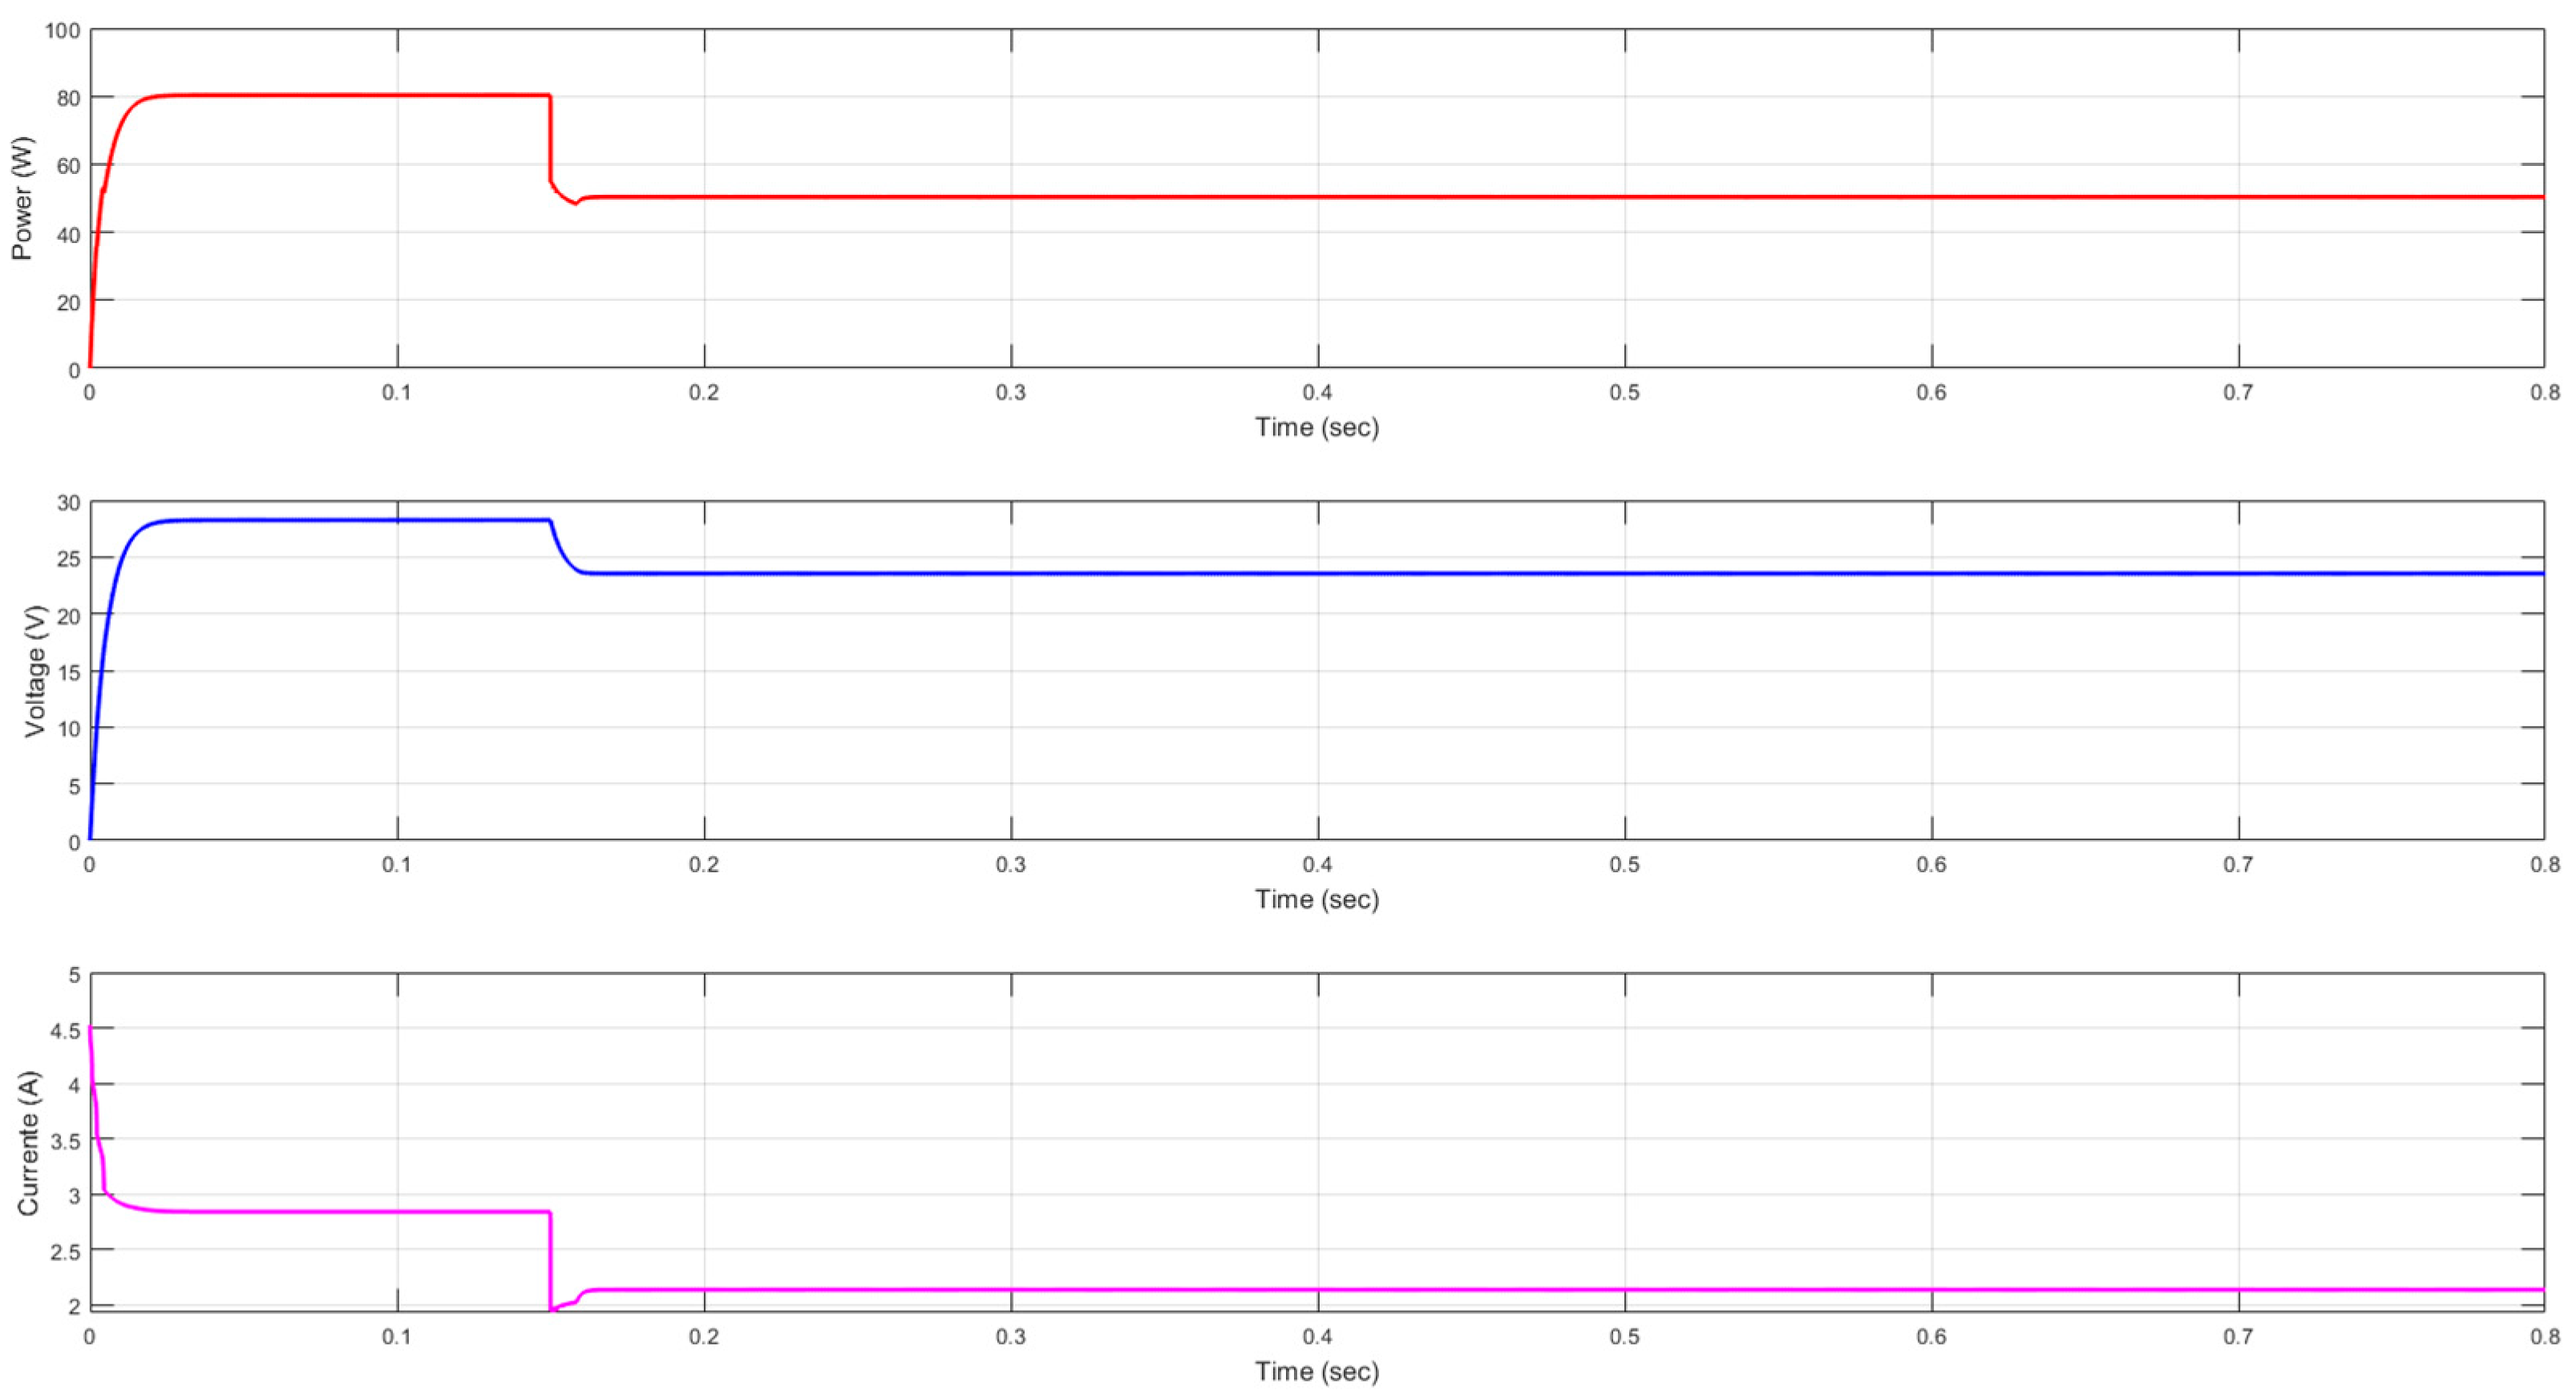
Adaptation to partial shading: The system in
Figure 15 shows limited adaptation. Oscillations and power drops indicate that the MPPT algorithm struggles to adjust effectively to irradiance changes, resulting in energy losses. In contrast,
Figure 16 shows improved adaptation, characterized by more stable power, voltage, and current. Power still fluctuates, but less severely and more predictably. This demonstrates that the neural network enables the system to respond more effectively to irradiance changes.
Stability:
Figure 15 shows that power fluctuates significantly over time, indicating the P&O algorithm struggles to remain stable during irradiance changes. This instability likely stems from a limited ability to adapt to rapid variations.
Figure 16, however, shows steadier power with fewer fluctuations. These results suggest that the neural network improves system stability and helps the MPPT algorithm stay near the maximum power point for a longer period.
Efficiency: In
Figure 15, the system is less efficient due to ongoing power fluctuations, which means it operates away from the best point and captures less energy.
Figure 16, in contrast, shows significantly higher efficiency and a steadier power output. With the neural network, the system captures more energy by staying closer to the maximum power point.
Response time:
Figure 15 illustrates a slow response to changing conditions, as evidenced by a prolonged power drop without recovery. This slow change hurts efficiency. In
Figure 16, power still drops, but the neural network helps the system recover more quickly and stabilize more effectively. This demonstrates that the neural network enhances adaptation to shading and accelerates the response to irradiance changes.
Graphical analysis confirms that the PV system utilizing the P&O algorithm, enhanced with a neural network, performs significantly better under partial shading conditions, achieving a 49% greater efficiency and an average 16% improvement in stability. This hybrid system rapidly reached the initial maximum power point in just 0.012 s and the final point at 0.16 s, whereas the system using only the P&O algorithm failed to reach the maximum power point entirely within the observation period. By reducing power fluctuations and enabling faster, more precise tracking, the neural network allows the system to operate more stably and efficiently, maximizing energy capture despite dynamic shading conditions.
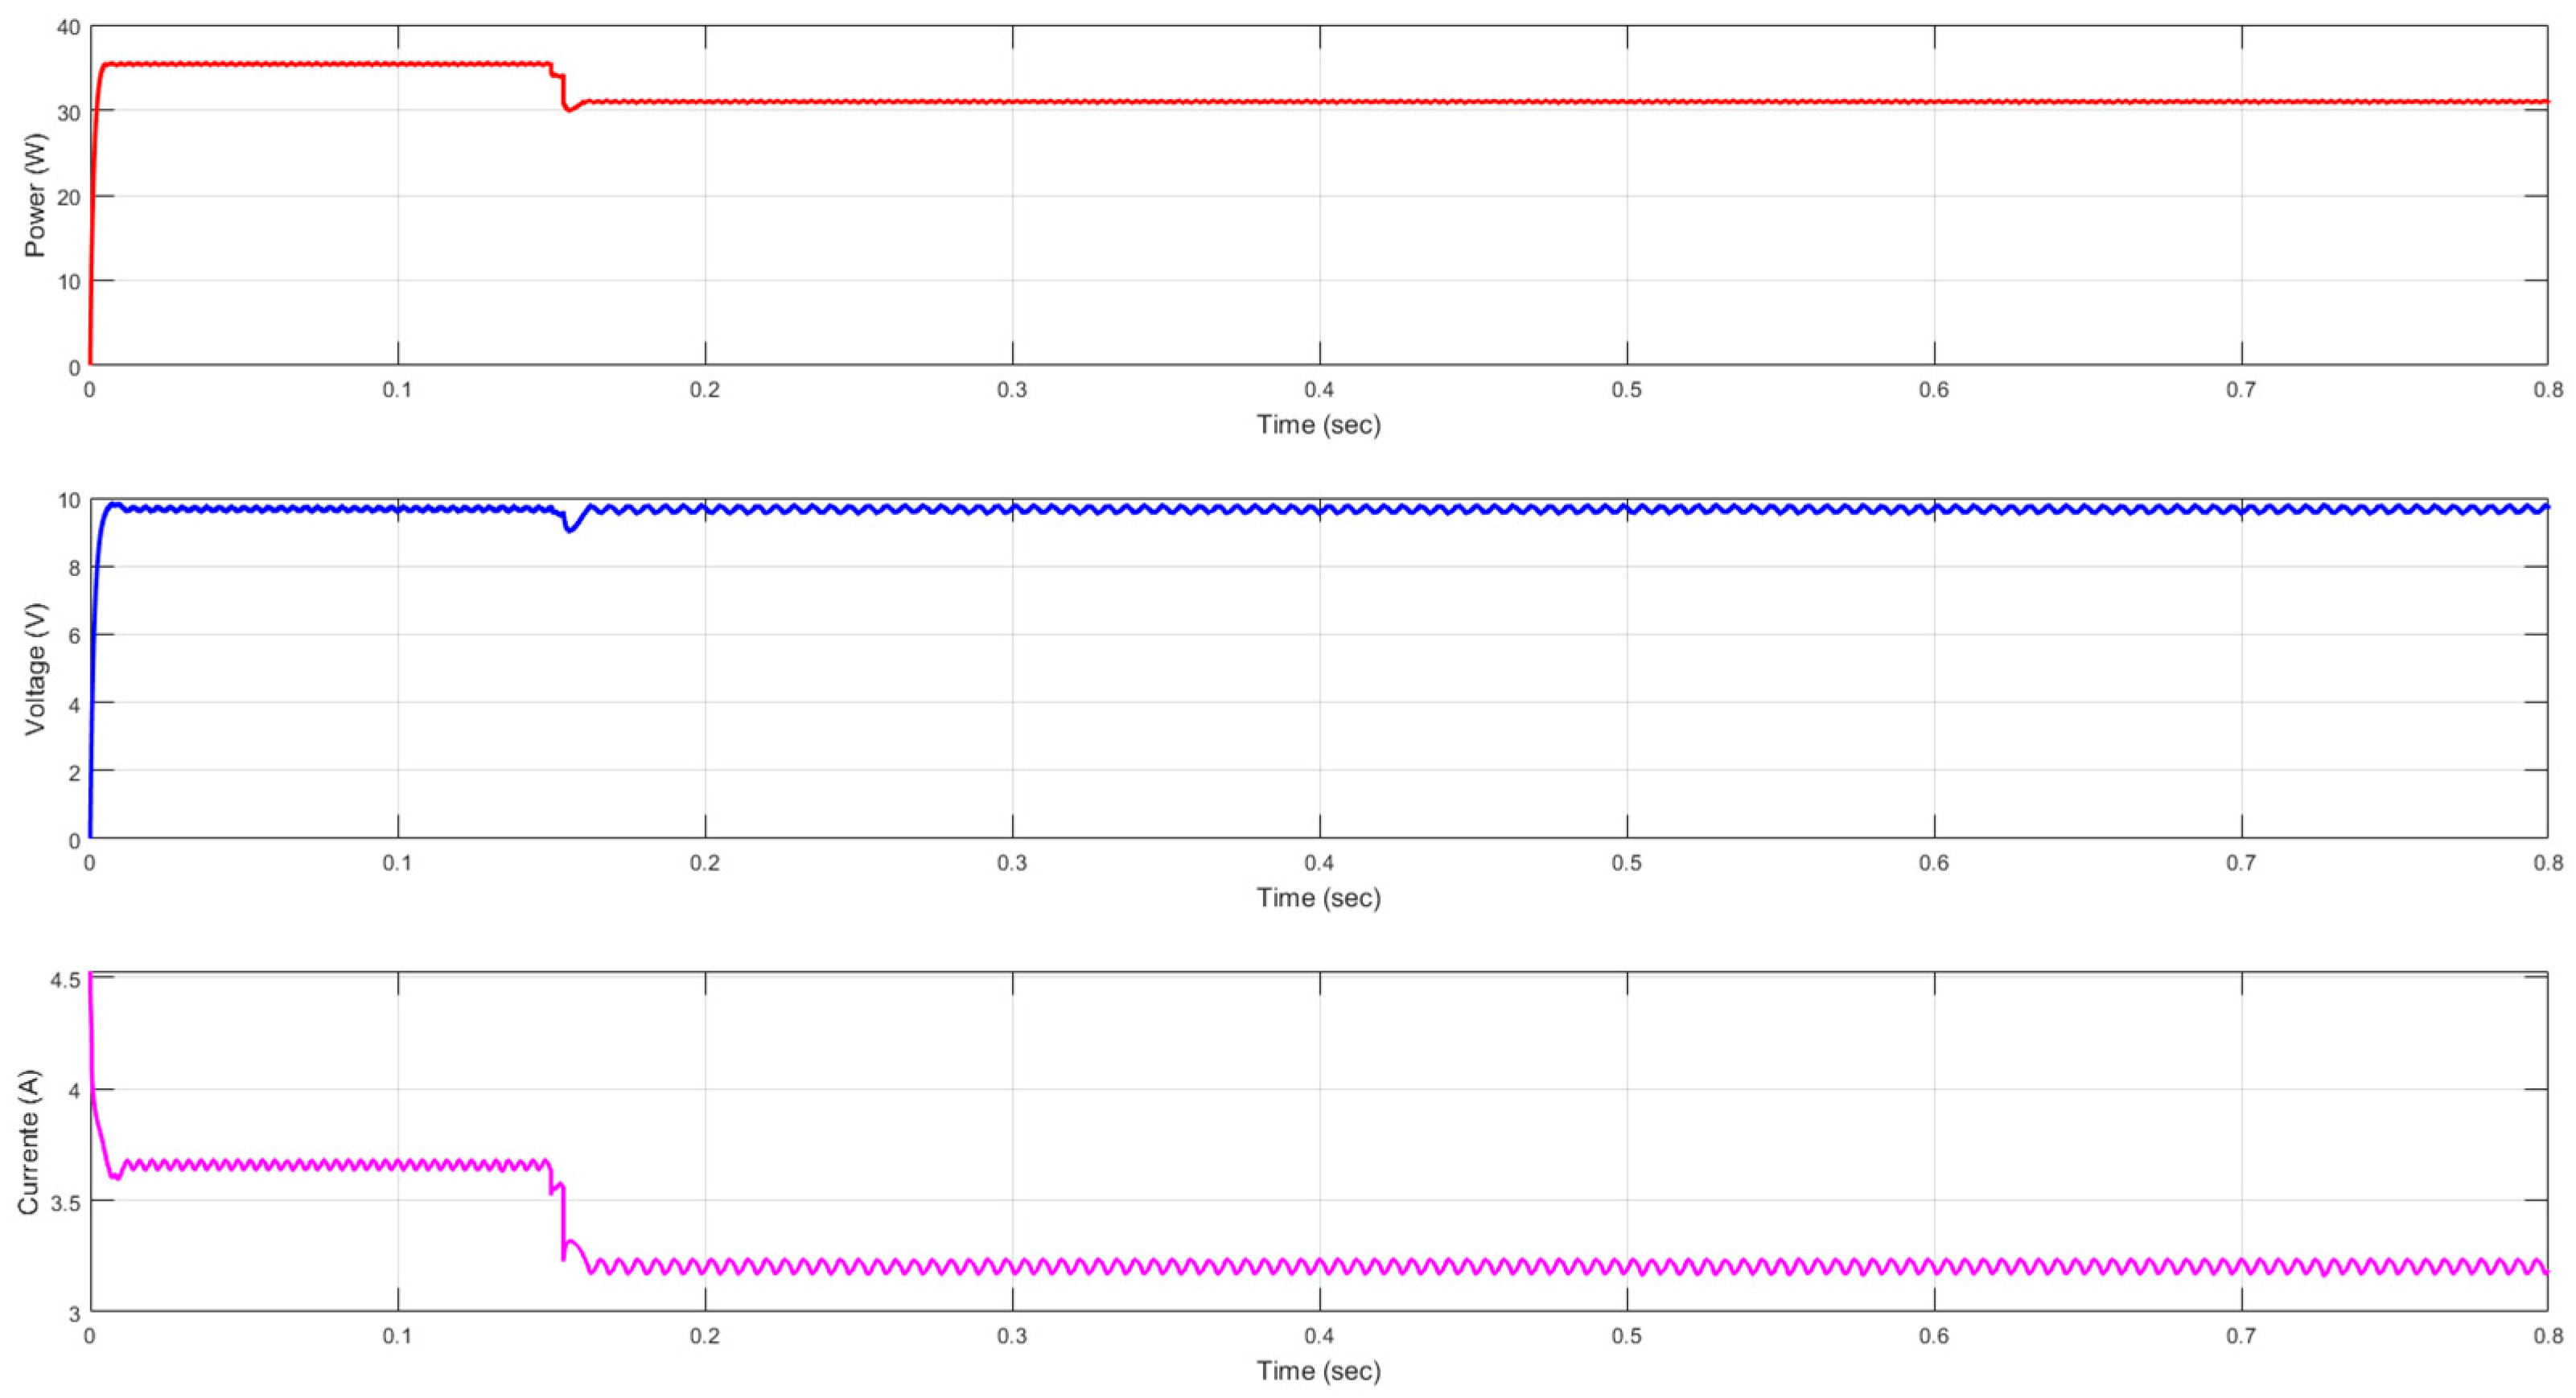
To validate the generality of the proposed ANN-based MPPT approach, experiments were conducted using a different PV module, the Future Solar Energy FSM572165.
Figure 17 shows the power, voltage, and current response under the partial shading scenario 1. The ANN detects and tracks the GMPP under these conditions, ensuring stable convergence and effective operation. Performance with FSM572165 matches baseline dynamics and accuracy, confirming adaptability, robustness, and scalability of the hybrid ANN–P&O method for diverse PV systems.
3.2. Scenario 2: Oscillating Shadow
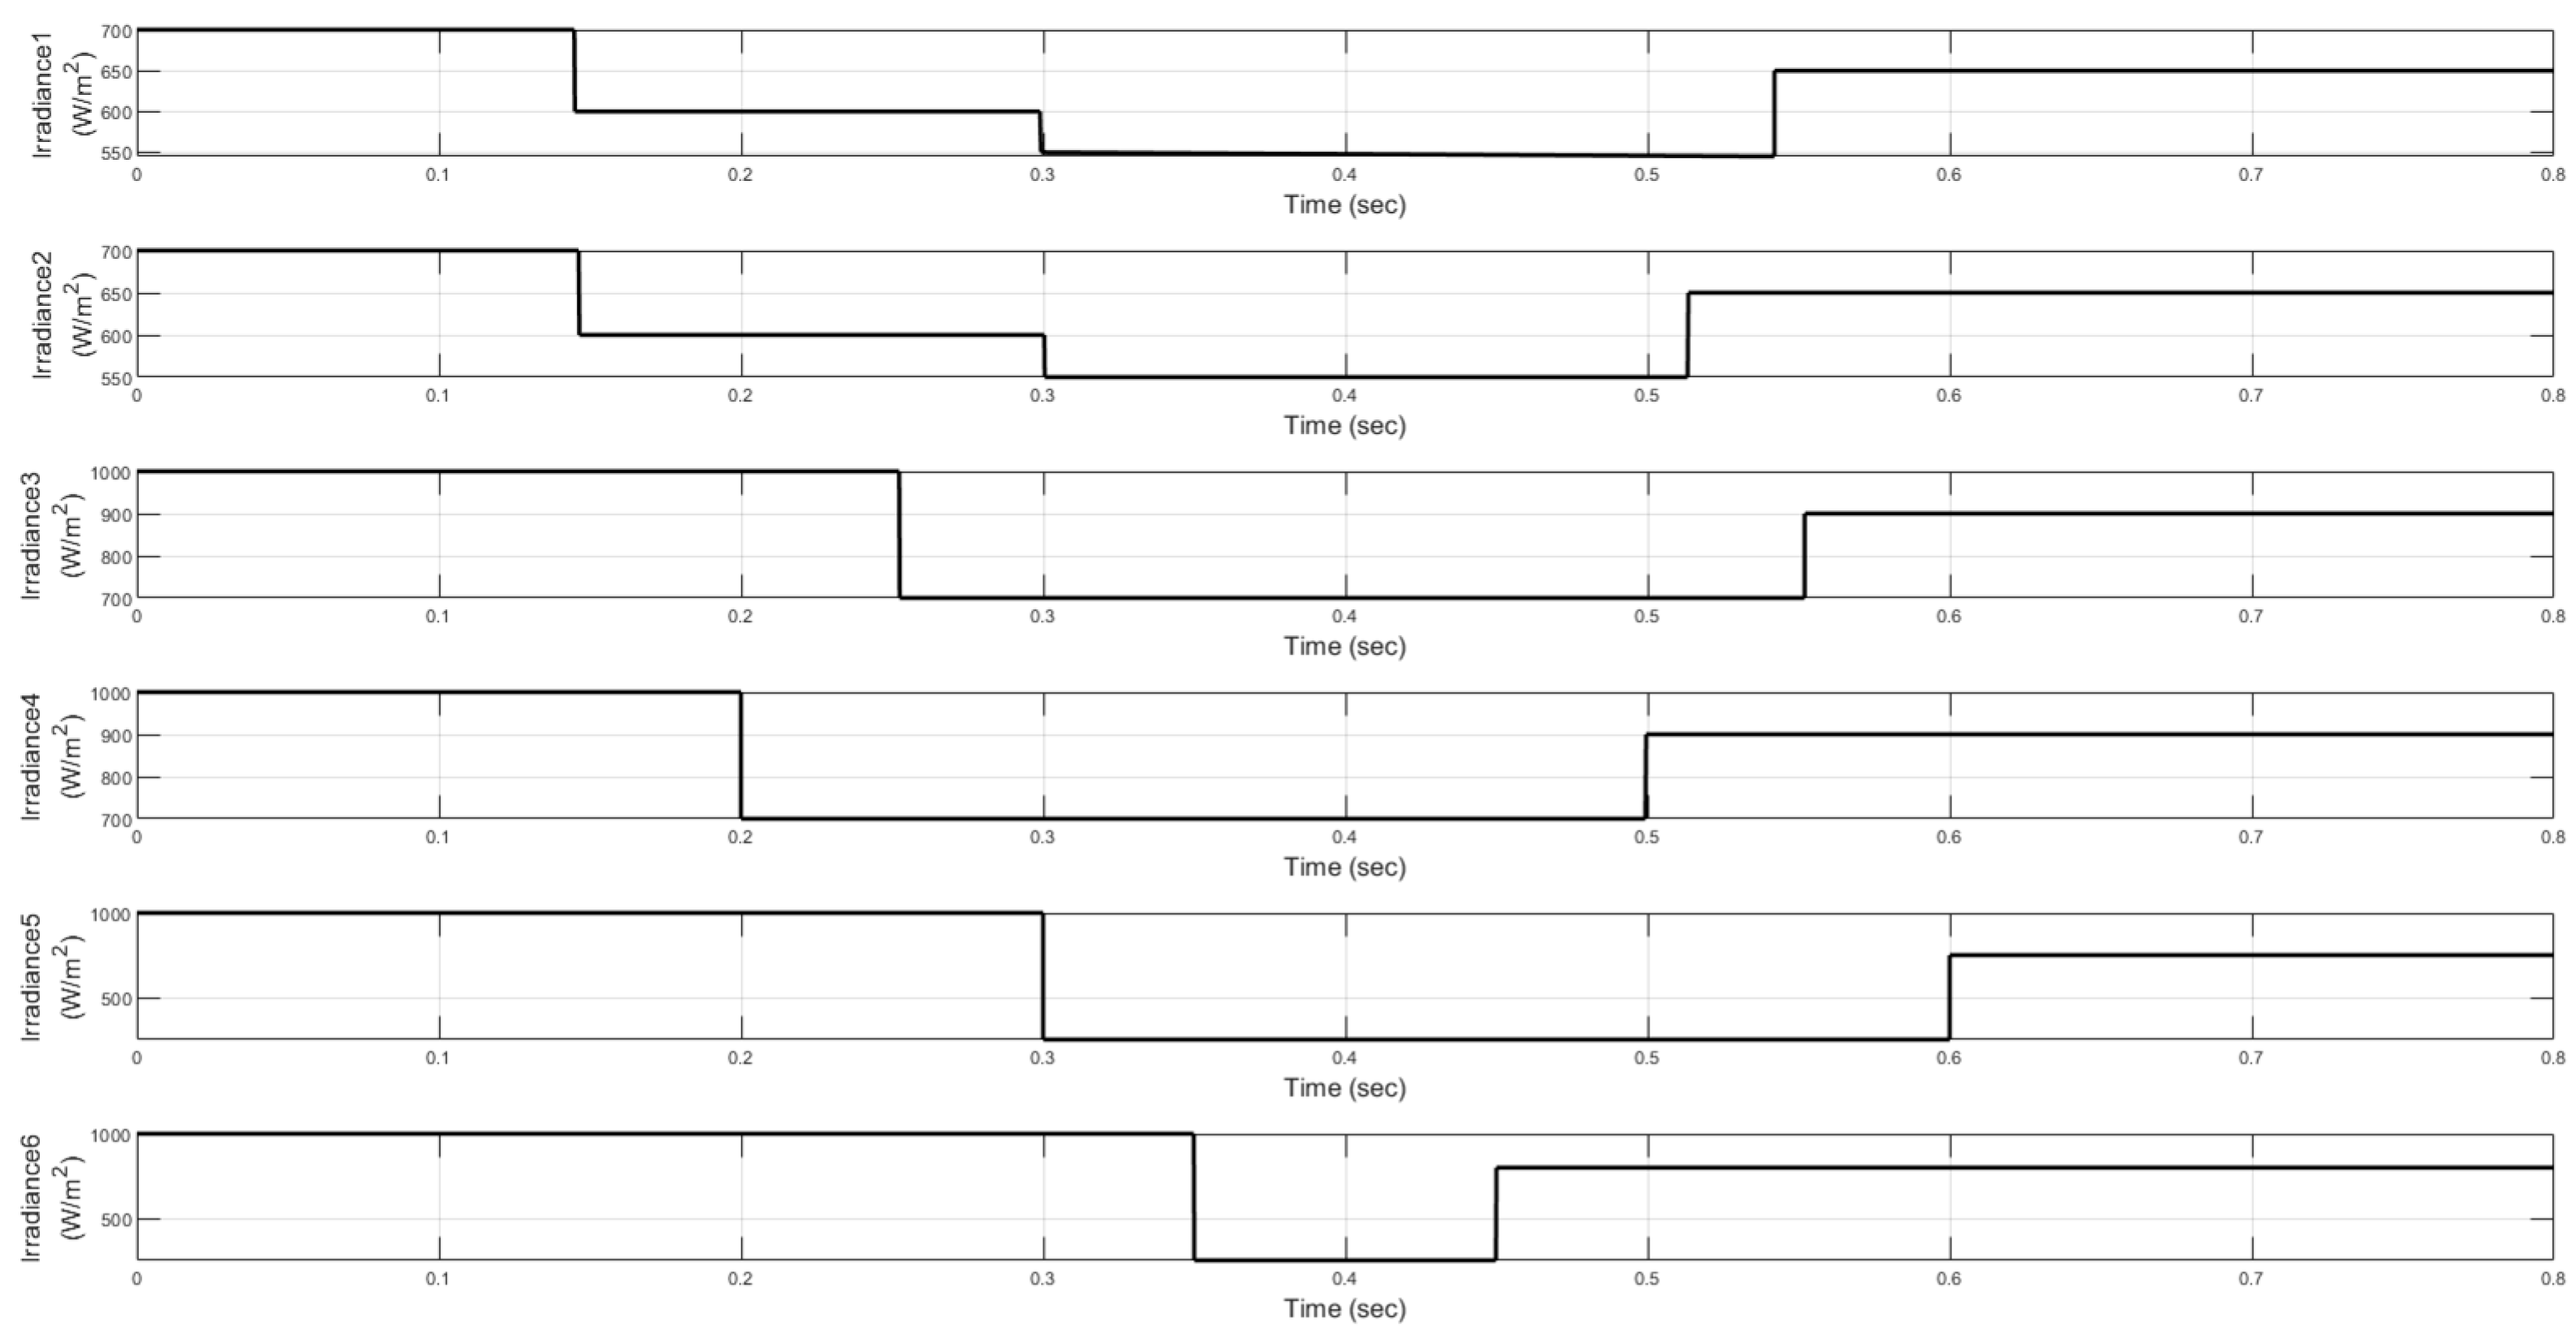
In this scenario, a long, oscillating shadow dynamically affects all cell groups at different times. It initially covers groups 1 and 2, then moves toward groups 3 and 4. While doing so, it partially shades groups 5 and 6. This simulates variable shadows cast by elements such as tree branches or cables moving in the wind.
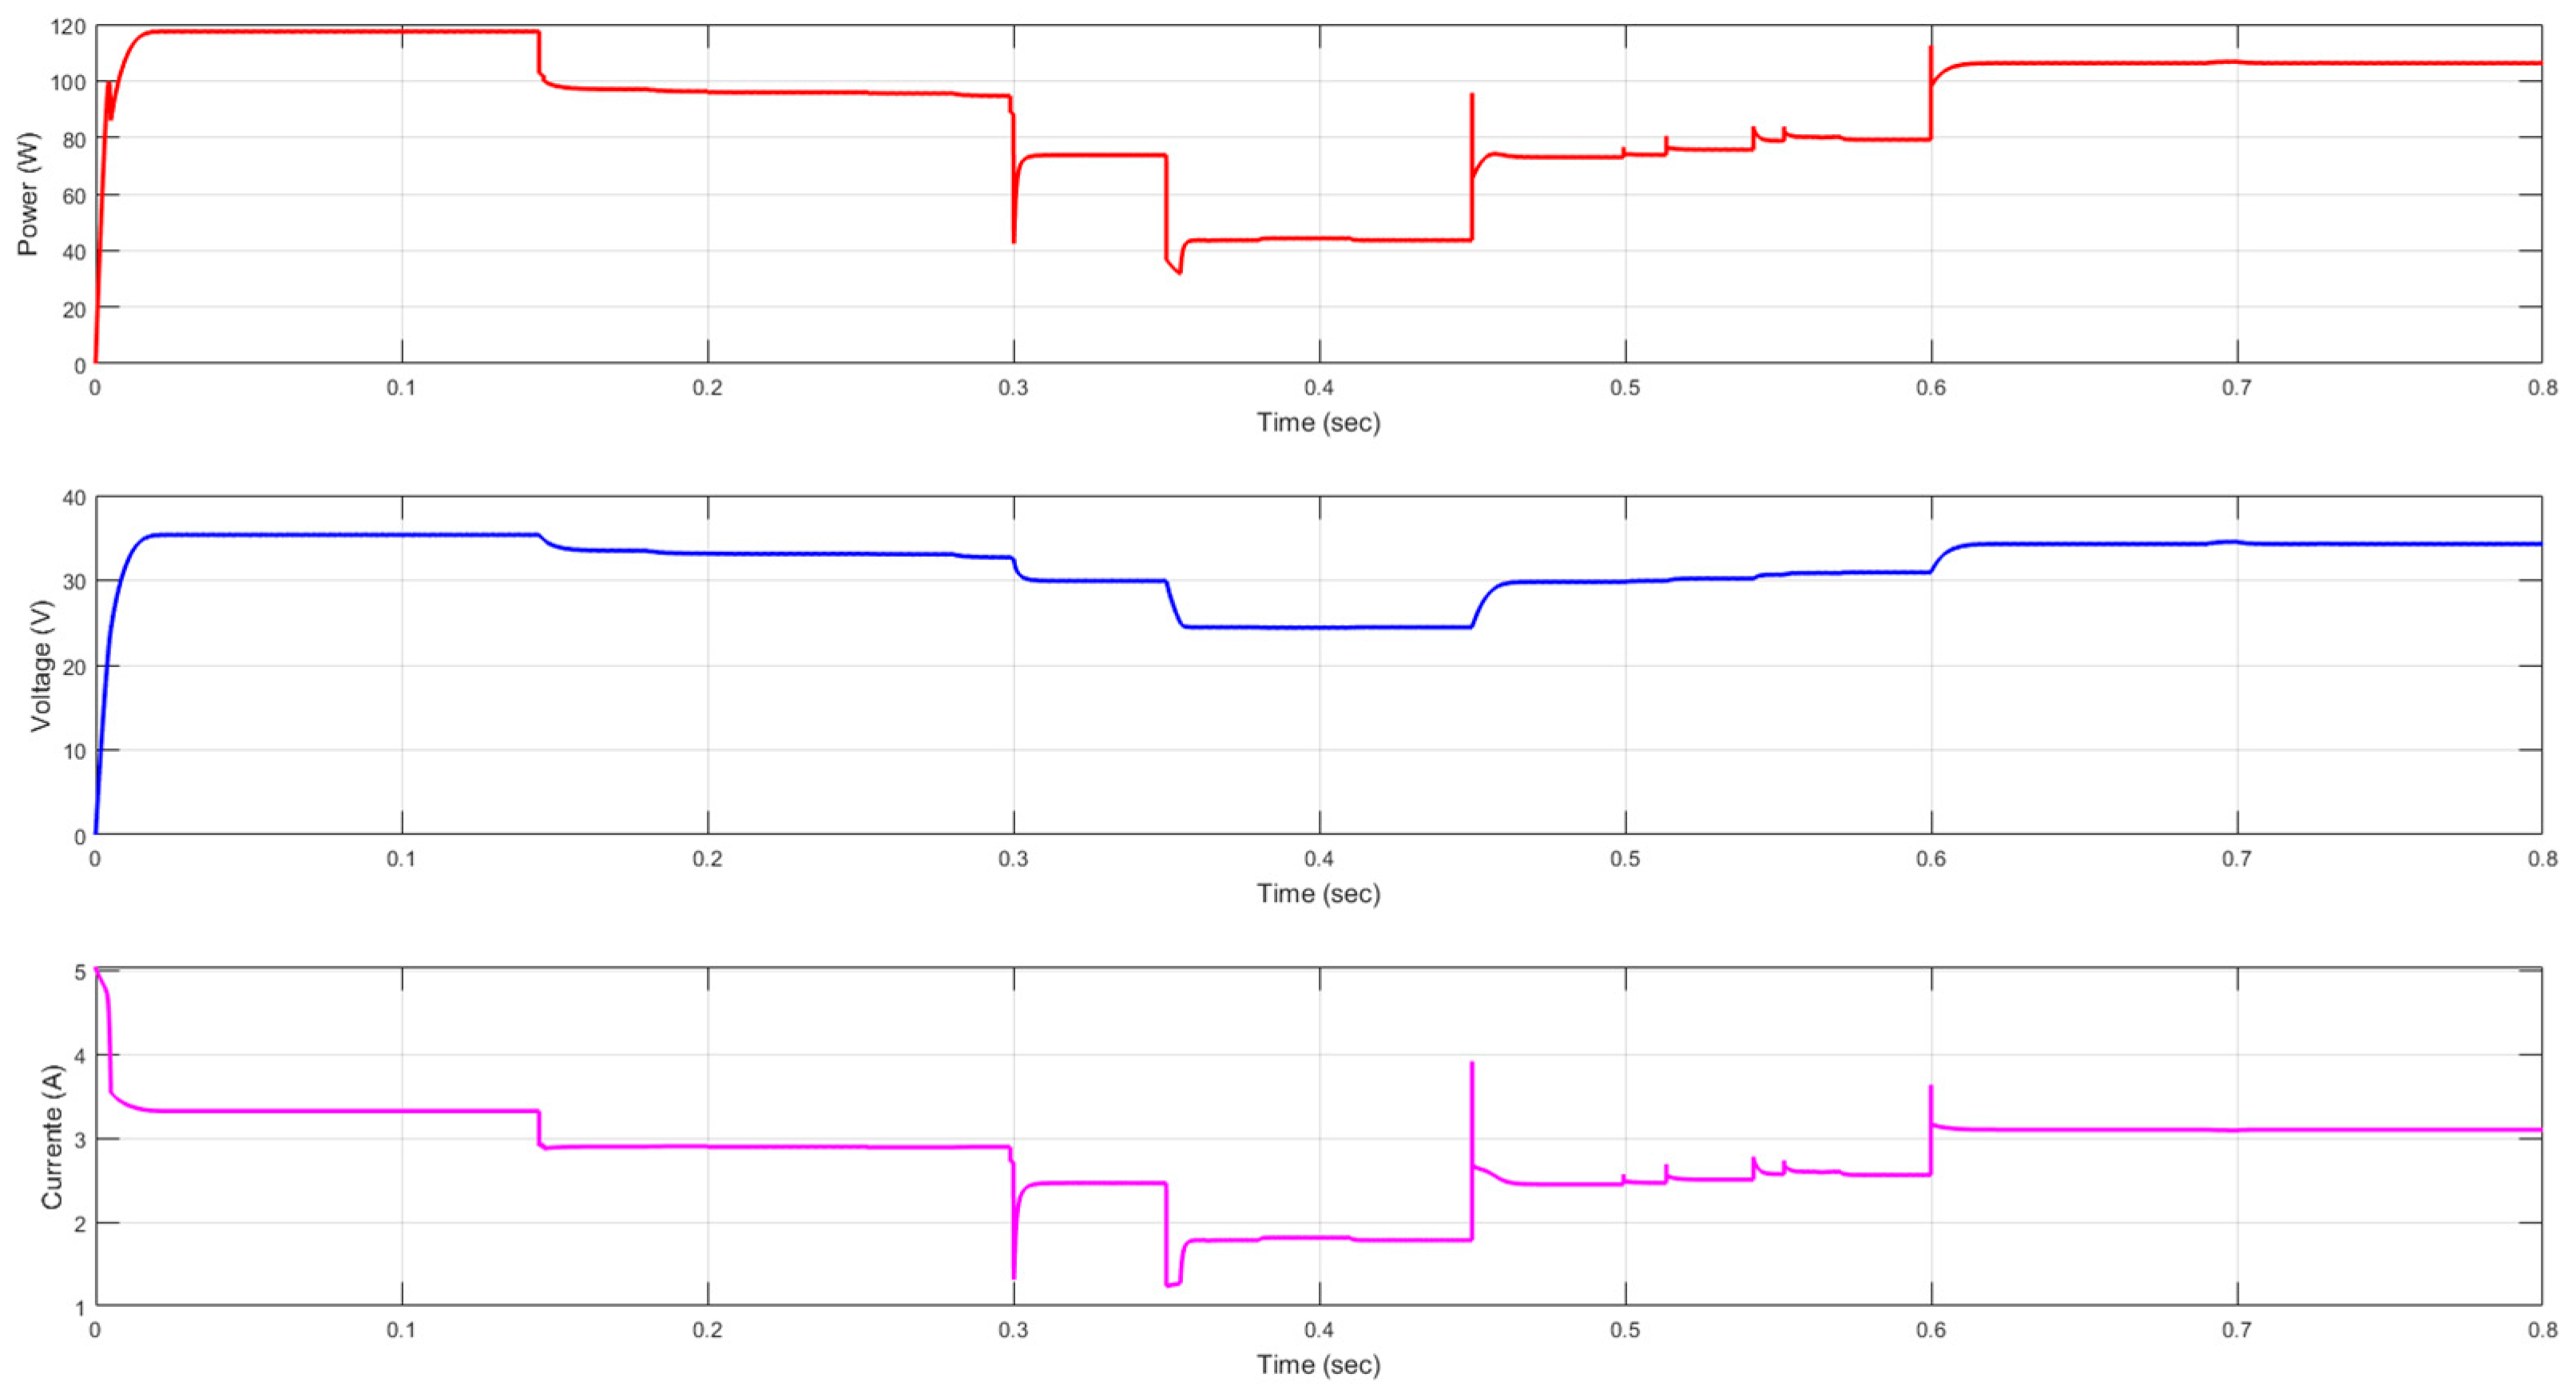
Figure 18 illustrates the irradiance pattern applied to the PV system under these conditions. The results compare the performance of the conventional P&O MPPT algorithm with that of the neural network-enhanced system, as detailed in
Figure 19 and
Figure 20.
Results of Scenario 2
Adaptation to partial shading: The MPPT with only the P&O algorithm (
Figure 19) struggles to quickly adapt, as seen in power fluctuations and lower efficiency. The MPPT supported by the neural network (
Figure 20) adapts more effectively, although some power drops occur; the system recovers and stabilizes faster, indicating improved adaptation.
Stability: As shown in
Figure 19, power exhibits significant fluctuations under varying irradiance, indicating instability with the P&O algorithm. In
Figure 20, fluctuations are less pronounced and more controlled. The neural network smooths transitions and mitigates oscillations, improving stability.
Efficiency:
Figure 19 illustrates lower efficiency, with significant power fluctuations leading to energy losses and reduced capture. In direct comparison,
Figure 20 demonstrates higher and steadier power, indicating that the neural network-supported system is more efficient and operationally effective than the standard system.
Response time:
Figure 19 shows a slower response, with significant fluctuations and oscillations in power when irradiance changes, causing energy loss during adjustment. In contrast,
Figure 20 illustrates a faster and more efficient response. Although challenges persist, the neural network anticipates changes and adjusts the MPPT more quickly, allowing for rapid recovery and reduced energy loss.
A quantitative analysis of the power graphs reveals that the MPPT system with neural network support (
Figure 20) demonstrates significant advantages over the P&O-only algorithm (
Figure 18), showing 20% greater stability and 15.6% higher efficiency on average. Furthermore, the neural network-enhanced system reaches the initial maximum power point 54% faster and the final maximum power point 14% faster than the conventional system. While both systems face challenges under irradiance variations, neural network implementation better maintains optimal power levels and adapts more effectively to changing partial shading conditions. As a result, it offers improved overall performance in terms of stability, efficiency, and response time.
To strengthen the benchmarking of the proposed hybrid ANN–P&O method, an alternative optimization-based MPPT technique was also considered. In this case, the Differential Evolution (DE) algorithm was selected due to its simplicity, robustness, and proven effectiveness in nonlinear optimization problems. DE is a population-based metaheuristic inspired by natural evolution. The algorithm starts with a population of candidate solutions representing possible operating points of the PV system. Each candidate is updated iteratively through three main steps: mutation, crossover, and selection [
32].
In the mutation stage, a new candidate (mutant vector) is generated by combining the weighted difference of two individuals with a third one. The crossover mechanism then recombines the mutant with the original candidate, controlled by a crossover probability. Finally, in the selection stage, the trial candidate replaces the original if it yields higher fitness, defined here as extracted PV power.
This iterative process allows DE to efficiently explore the solution space, avoiding local maxima that typically affects classical methods under partial shading. When applied to MPPT, DE dynamically adjusts the duty cycle of the DC–DC converter.
Figure 21 and
Figure 22, for scenarios 1 and 2, illustrate the effectiveness of the DE algorithm in MPPT under partial shading conditions. In scenario 1, DE achieves fast convergence to the GMPP, and after the initial transient, voltage and current remain stable. In contrast, scenario 2 features more complex shading, revealing the algorithm’s robustness: although oscillations appear in current and power due to rapid irradiance variations, the algorithm successfully stabilizes around the GMPP. This behavior aligns with the applied training strategy, where DE was configured with a population size of NP = 150, a scaling factor of F = 0.8, and a crossover rate of CR = 0.7, iterating for up to 3000 generations. The algorithm optimized a 15-dimensional feature space, including linear, quadratic, and cubic terms of voltage and irradiance, minimizing the mean squared error (MSE) to a value of approximately 0.001, with a correlation coefficient of approximately 0.99 between the predicted and actual data. These results confirm that DE provides accurate prediction and tracking of the GMPP even under dynamic conditions, serving as a reliable reference for validating the proposed hybrid ANN–P&O approach.
To enable a direct comparison among the tested MPPT strategies,
Table 1 presents the main quantitative metrics obtained under both uniform sunlight (irradiance) and partial shading scenarios. These metrics—tracking efficiency (how well the method follows the maximum power point), settling time (how quickly it stabilizes), stability index (the standard deviation to mean ratio, σ/μ, indicating consistency), and relative improvement in energy harvested—highlight distinct differences between methods.
In Scenario 1, which involves irregular and uneven shading, the classical P&O algorithm converges slowly and shows larger oscillations around the MPP, reducing energy harvesting efficiency. The ANN-based method, in comparison, improves tracking speed and stability, reaching the GMPP with minimal oscillations. The DE algorithm also accurately tracks the GMPP and achieves a similar final efficiency to the ANN but requires more computational time to converge.
Moving to Scenario 2, which features an oscillating shadow, the classical P&O algorithm is less stable and frequently mis-tracks under rapidly changing irradiance. The ANN-based approach, as in Scenario 1, maintains a fast response and high stability, adapting well to dynamic conditions. DE continues to outperform P&O but adapts more slowly than ANN, underscoring the robustness of the hybrid ANN–P&O scheme.
The classical P&O method delivers reliable performance under uniform irradiance. However, its efficiency and stability decrease significantly in partial shading. This happens because it cannot distinguish between local and global maxima. To address this, the proposed hybrid ANN–P&O approach, as shown in
Table 1, overcomes this limitation. It consistently maintains 98–99% tracking efficiency, ensures a fast response, and minimizes oscillations. As a result, harvested energy increases by 15–49% in all tested shading scenarios compared to conventional P&O. The hybrid method also matches the accuracy of intelligent algorithms, such as DE, while operating with lower computational demand. This demonstrates its practical suitability for real-time embedded implementation.
4. Discussion
Computational intelligence techniques, particularly ANNs, demonstrated significant improvements in MPPT under partial shading conditions. A detailed PV system model was developed in MATLAB to simulate P–V curves with multiple local peaks, allowing validation under four distinct shading scenarios. As a result, the ANN-based estimator showed strong predictive and adaptive capabilities, accurately identifying the global MPP across different irradiance patterns. When compared to the traditional P&O method, the hybrid ANN–P&O approach achieved faster convergence, reduced oscillations, and higher stability, especially under irregular or moving shadows, highlighting its potential for real-world applications. However, despite these advantages, some limitations were observed: neural networks demand greater computational resources and longer training times compared to conventional algorithms, and their accuracy is highly dependent on the quality and diversity of the training data. Taken together, these findings confirm the promise of ANNs in enhancing MPPT performance while emphasizing the need to balance accuracy with computational feasibility for practical deployment.
In the context of MPPT, many intelligent methods go beyond classical P&O and IC. Methods such as fuzzy logic, GAs, and PSO enhance tracking efficiency in partial shading by avoiding local maxima; however, each also presents practical issues. Fuzzy logic is fast and robust, but its set rules limit adaptability when conditions change quickly. GAs and PSO offer global optimization, but their repeated, population-based process increases computation and slows them down, making them less ideal for real-time embedded use. Similarly, sliding mode and model predictive control offer high efficiency but require precise models and substantial processing power. In contrast, the hybrid ANN–P&O method proposed here strikes a balance between accuracy, computational efficiency, and ease of implementation, making it a suitable choice for real-time applications under changing partial shading conditions.
Against this backdrop, the proposed hybrid ANN+P&O method balances accuracy, speed, and complexity. The ANN offers global awareness of the powerand oltage landscape and directs the search to the true GMPP, while the lightweight P&O ensures local refinement with minimal computational overhead. This synergy results in:
Higher tracking efficiency than FLC and comparable to GAs/PSO,
Faster convergence due to ANN initialization, and
Lower runtime complexity, since ANN inference is lighter than metaheuristics.
The proposed ANN+P&O hybrid algorithm is suitable for deployment. Its computationally intensive Levenberg-Marquardt training occurs offline. After training, the ANN operates in forward mode, requiring only basic operations, such as multiplication and addition, per inference. With two hidden layers of 10 neurons each, the online computational cost is low and remains within the capabilities of low-cost embedded devices, such as ARM Cortex-M microcontrollers or DSP-based power inverters. The trained weights occupy only a few kilobytes negligible for current platforms. No additional sensors are needed beyond standard voltage and current measurements.
For larger or high-performance systems, the algorithm can be parallelized or implemented on FPGAs. This enables real-time ANN inference and P&O routine execution with a deterministic response, ensuring seamless integration into grid-tied converters without compromising power quality. The approach scales by matching implementation to system size, supporting lightweight, online microcontroller-based MPPT modules for small systems and industrial FPGA solutions for utility-scale PV plants.
