Article

Design and Implementation of a Misalignment Experimental Data Management Platform for Wind Power Equipment

1
China Guanghe New Energy Holding Co., Ltd. Shaanxi Branch, Xi’an 710065, China
2
School of Mechanical Engineering, Xi’an Jiaotong University, Xi’an 710049, China
*
Author to whom correspondence should be addressed.
Energies 2025, 18(19), 5047; https://doi.org/10.3390/en18195047
Submission received: 5 July 2025 / Revised: 17 September 2025 / Accepted: 17 September 2025 / Published: 23 September 2025

Abstract

Key drivetrain components in wind turbines are prone to misalignment faults due to long-term operation under fluctuating loads and harsh environments. Because misalignment develops gradually rather than occurring instantly, reliable evaluation of structural designs and surface treatments requires long-duration, multi-sensor, and multi-condition experiments that generate massive heterogeneous datasets. Traditional data management relying on manual folders and USB drives is inefficient, redundant, and lacks traceability. To address these challenges, this study presents a dedicated misalignment experimental data management platform specifically designed for wind power applications. The innovation lies in its ability to synchronize vibration, electrostatic, and laser alignment data streams in long-term tests, establish a traceable and reusable data structure linking experimental conditions with sensor outputs, and integrate laboratory results with field SCADA data. Built on Laboratory Information Management System (LIMS) principles and implemented with an MVC + Spring Boot + B/S architecture, the platform supports end-to-end functions including multi-sensor data acquisition, structured storage, automated processing, visualization, secure sharing, and cross-role collaboration. Validation on drivetrain shaft assemblies confirmed its ability to handle multi-terabyte datasets, reduce manual processing time by more than 80%, and directly integrate processed results into fault identification models. Overall, the platform establishes a scalable digital backbone for wind turbine misalignment research, supporting structural reliability evaluation, predictive maintenance, and intelligent operation and maintenance.

1. Introduction

With the continuous growth of global wind power installed capacity, the reliability of key components such as gearboxes and motor bearings has become a core factor affecting the operation and maintenance costs of wind turbines [1]. Prior studies indicate that misalignment failure mechanisms are strongly influenced by both structural design and assembly accuracy. To simulate actual service conditions, researchers typically use misalignment simulation test benches to obtain multi-dimensional data such as misalignment coefficients, misalignment amplitudes, and acoustic emission signals [2,3,4,5,6]. However, as the scale of experiments expands, traditional data management methods—such as standalone storage and manual backups—are increasingly constrained by limited security, inefficient retrieval, and poor data sharing efficiency. Previous research has confirmed that introducing Laboratory Information Management Systems (LIMS) into the structural testing domain can significantly improve data management efficiency and reusability. Although preliminary feasibility has been shown for platforms built on the MVC/Spring Boot architecture in the field of misalignment testing, a specialized solution tailored to the wind power equipment industry remains urgently needed [7,8,9,10].
Recent studies further highlight the challenges and opportunities in this area. For example, federated learning has been applied to enable fleet-wide sharing of turbine condition information while preserving data privacy [11], and image-based anomaly detection methods have been developed to improve SCADA data quality by detecting and cleaning abnormal records [12]. Semi-supervised approaches have been explored for gearbox misalignment and imbalance diagnosis using heterogeneous sensor data [13], while yaw misalignment has been incorporated into drivetrain degradation modeling to inform fatigue and control strategies under constrained conditions [14]. These works underscore the increasing reliance on large-scale, heterogeneous, and long-duration datasets in wind power reliability research. Yet, no dedicated platform currently exists to unify multi-sensor misalignment experimental data into a traceable, scalable, and reusable framework.
In wind power equipment, misalignment issues caused by elastic supports are particularly prominent. Therefore, it is essential to conduct systematic misalignment testing during the design phase to provide a scientific basis for selecting appropriate structures and connection methods. By simulating misalignment behavior under real operating conditions, critical data support can be provided for mechanical design, structure selection, and surface treatment optimization. However, with increasing experiment scale and testing demands, traditional data management approaches face significant limitations—such as redundancy, low retrieval efficiency, and poor data reusability—that hinder both research efficiency and the further development of misalignment studies.
To address these challenges, this study builds a specialized data management platform based on the LIMS framework and the characteristics of misalignment experiments. The study first systematically analyzes the data features of misalignment tests, covering data structures and storage requirements for various experimental modes including reciprocating, rotary, impact, and fretting misalignment. Standardized classification and metadata management are then applied to ensure traceability and normalized storage of experimental data, laying a solid foundation for subsequent analysis and sharing. The platform developed provides an efficient tool for reliability research on key components of wind power equipment.
By implementing this platform, the wind power industry can be equipped with an efficient, secure, and scalable solution for managing misalignment experimental data, thereby promoting in-depth research into the reliability of critical components and supporting technological advancement and cost optimization.

2. Methods: Overall System Architecture Design

2.1. Process Description and Requirements Analysis

In this study, the term “Misalignment Experimental Data Management” refers to the systematic handling of the entire lifecycle of experimental data generated in wind turbine misalignment research. It encompasses six core operations: (1) experimental planning and sensor configuration, (2) multi-sensor data acquisition in laboratory and field environments, (3) structured storage and metadata modeling, (4) automated data processing and feature extraction, (5) visualization and reporting, and (6) integration of processed data into diagnostic and prognostic models.
To clarify the process that the platform serves, Figure 1 illustrates the end-to-end lifecycle of misalignment experimental data management. The process begins with experimental planning (defining objectives, selecting shaft/coupling structures, configuring sensor layouts), continues with data acquisition (collecting vibration, electrostatic, and laser alignment signals), followed by structured storage (batch import, metadata indexing, integrity verification), and concludes with visualization and reporting (plotting curves, statistical charts, automated reporting). This process description makes explicit that the functions and structure of the platform are directly derived from the demands of wind turbine misalignment research.
Structured data include fields such as Test ID (string), Turbine model (string), Sensor type (enumeration), and Experiment timestamp (datetime), which are stored in Oracle for traceability and efficient retrieval. Unstructured data encompass multi-source raw signals, including vibration time-series (.tdms), electrostatic signals (.csv), and laser alignment results (.txt), which are stored on NAS servers with hash-based verification to ensure integrity. These datasets originate from specific sensors: vibration probes, electrostatic induction sensors, and laser aligners, respectively. By systematically categorizing the data types, formats, and sources, the platform ensures transparent mapping between experimental operations and data lifecycle management.
Based on this process, the platform must satisfy the following requirements:
(1) Multi-role collaboration: Support for efficient cooperation among R&D engineers, test technicians, data analysts, and suppliers on a unified platform to ensure smooth data circulation and task assignment.
(2) Support for diverse experiment types: Coverage of various misalignment test scenarios involving drivetrain shafts with different connection forms under environments such as salt spray and sand-dust conditions, enabling simulation of complex working conditions.
(3) Complex sensor and data heterogeneity handling: In misalignment experiments, multiple sensors are typically used, including laser alignment tools, vibration sensors, and electrostatic induction sensors. These produce diverse types of data with distinct sampling rates and storage demands.
  • Laser alignment instruments provide direct displacement measurements but require turbine shutdown, making them suitable for offline validation only.
  • Vibration and electrostatic induction sensors enable online monitoring, but their signals must be processed through advanced feature extraction and pattern recognition algorithms to infer misalignment levels indirectly.
  • The platform must accommodate this multimodal sensing architecture and synchronize time series data for long-duration tests under varying wind loads.
(4) Long-term, high-volume data monitoring and management: Shaft misalignment is a slow-developing fault, often evolving over weeks or months. Hence, long-duration, continuous monitoring is essential for capturing degradation trends. Furthermore, misalignment severity cannot be reliably inferred from any single sensor modality. Reliable fault modeling requires massive experimental data, establishing mappings between sensor signals and fault states through repeated lab simulations. This imposes high demands on the platform’s storage architecture, data integrity, labeling, and retrieval performance.
(5) Traceability and version control: Support for rapid backtracking of original conditions and equipment parameters, providing a reliable data foundation for training service life prediction models.
(6) Secure data sharing: While ensuring confidentiality requirements from wind turbine manufacturers for critical data, the platform also allows anonymized datasets to be shared with academic partners to promote scientific collaboration.

2.2. Geographical Distribution and Collaboration Structure

To show how the process is distributed across different stakeholders, we added Figure 2, which schematically illustrates the collaboration between university laboratories (experimental design and prototype validation), field test stations (long-term monitoring and SCADA data acquisition), and enterprise partners (industrial validation and O&M feedback). These three entities interact through the central data management platform, which aggregates raw experimental data, synchronizes multimodal signals, and distributes processed results. Data flows are bidirectional: laboratories provide experimental data and receive processed reports, field stations deliver sensor/SCADA data and obtain real-time monitoring support, while enterprises contribute operational feedback and receive predictive fault models for maintenance planning.

2.3. Technical Framework

The platform is developed using the MVC architecture combined with Spring Boot. The frontend is built with HTML5/CSS and Thymeleaf, and the database uses Oracle. The system is deployed on private servers, where secure HTTPS access is enabled via an Nginx reverse proxy, ensuring both stability and data confidentiality [15,16,17]. The overall system architecture consists of three layers: the presentation layer, business layer, and data layer (as shown in Figure 3), customized to address the multi-sensor, high-frequency, long-term nature of misalignment monitoring in wind power systems.
(1) Presentation Layer: Offers user login, experiment dashboards, real-time visualization of sensor data (e.g., vibration amplitude, electrostatic signal strength), fault labeling interfaces, and data export functionalities. The interface supports role-specific views (technicians, analysts, R&D engineers) to enhance usability.
(2) Business Layer: Incorporates logic for user/project management, experimental batch scheduling, file parsing (for laser alignment logs, vibration waveform files, etc.), data cleaning pipelines, and feature extraction routines. A fault labeling module links specific data segments to misalignment stages for supervised learning and comparative analysis.
(3) Data Layer: Structured metadata such as test IDs, turbine configurations, and sensor layouts is stored in Oracle, while unstructured data—including vibration time-series, electrostatic signals, and laser alignment files—is saved on a local NAS. Data integrity during long-term tests is guaranteed through hash-based verification, which prevents corruption and ensures reproducibility across extended monitoring campaigns. Indexed retrieval by sensor type, test conditions, or misalignment level supports efficient data access and analysis.

2.4. Core Technologies

To meet the stringent requirements of long-term fault evolution tracking, multi-modal sensor fusion, and repetitive high-throughput experimentation in wind power drivetrain misalignment research, the platform adopts a series of advanced technologies to ensure stable and efficient operation in complex application scenarios [18,19,20,21,22]. Table 1 lists the core technologies and their specific applications and advantages in wind energy settings.
Misalignment faults in wind turbines are typically not instantaneous, but rather evolve gradually under fluctuating wind loads, thermal cycles, and cumulative torque variation. Hence, identifying such faults demands continuous monitoring with data-driven fault modeling based on long-span, labeled datasets—often acquired through repeated lab simulations. This calls for a platform that is not only technically robust but also designed for temporal, cross-sensor data correlation.

3. Methods: Key Functional Implementation

3.1. User and Permission Management

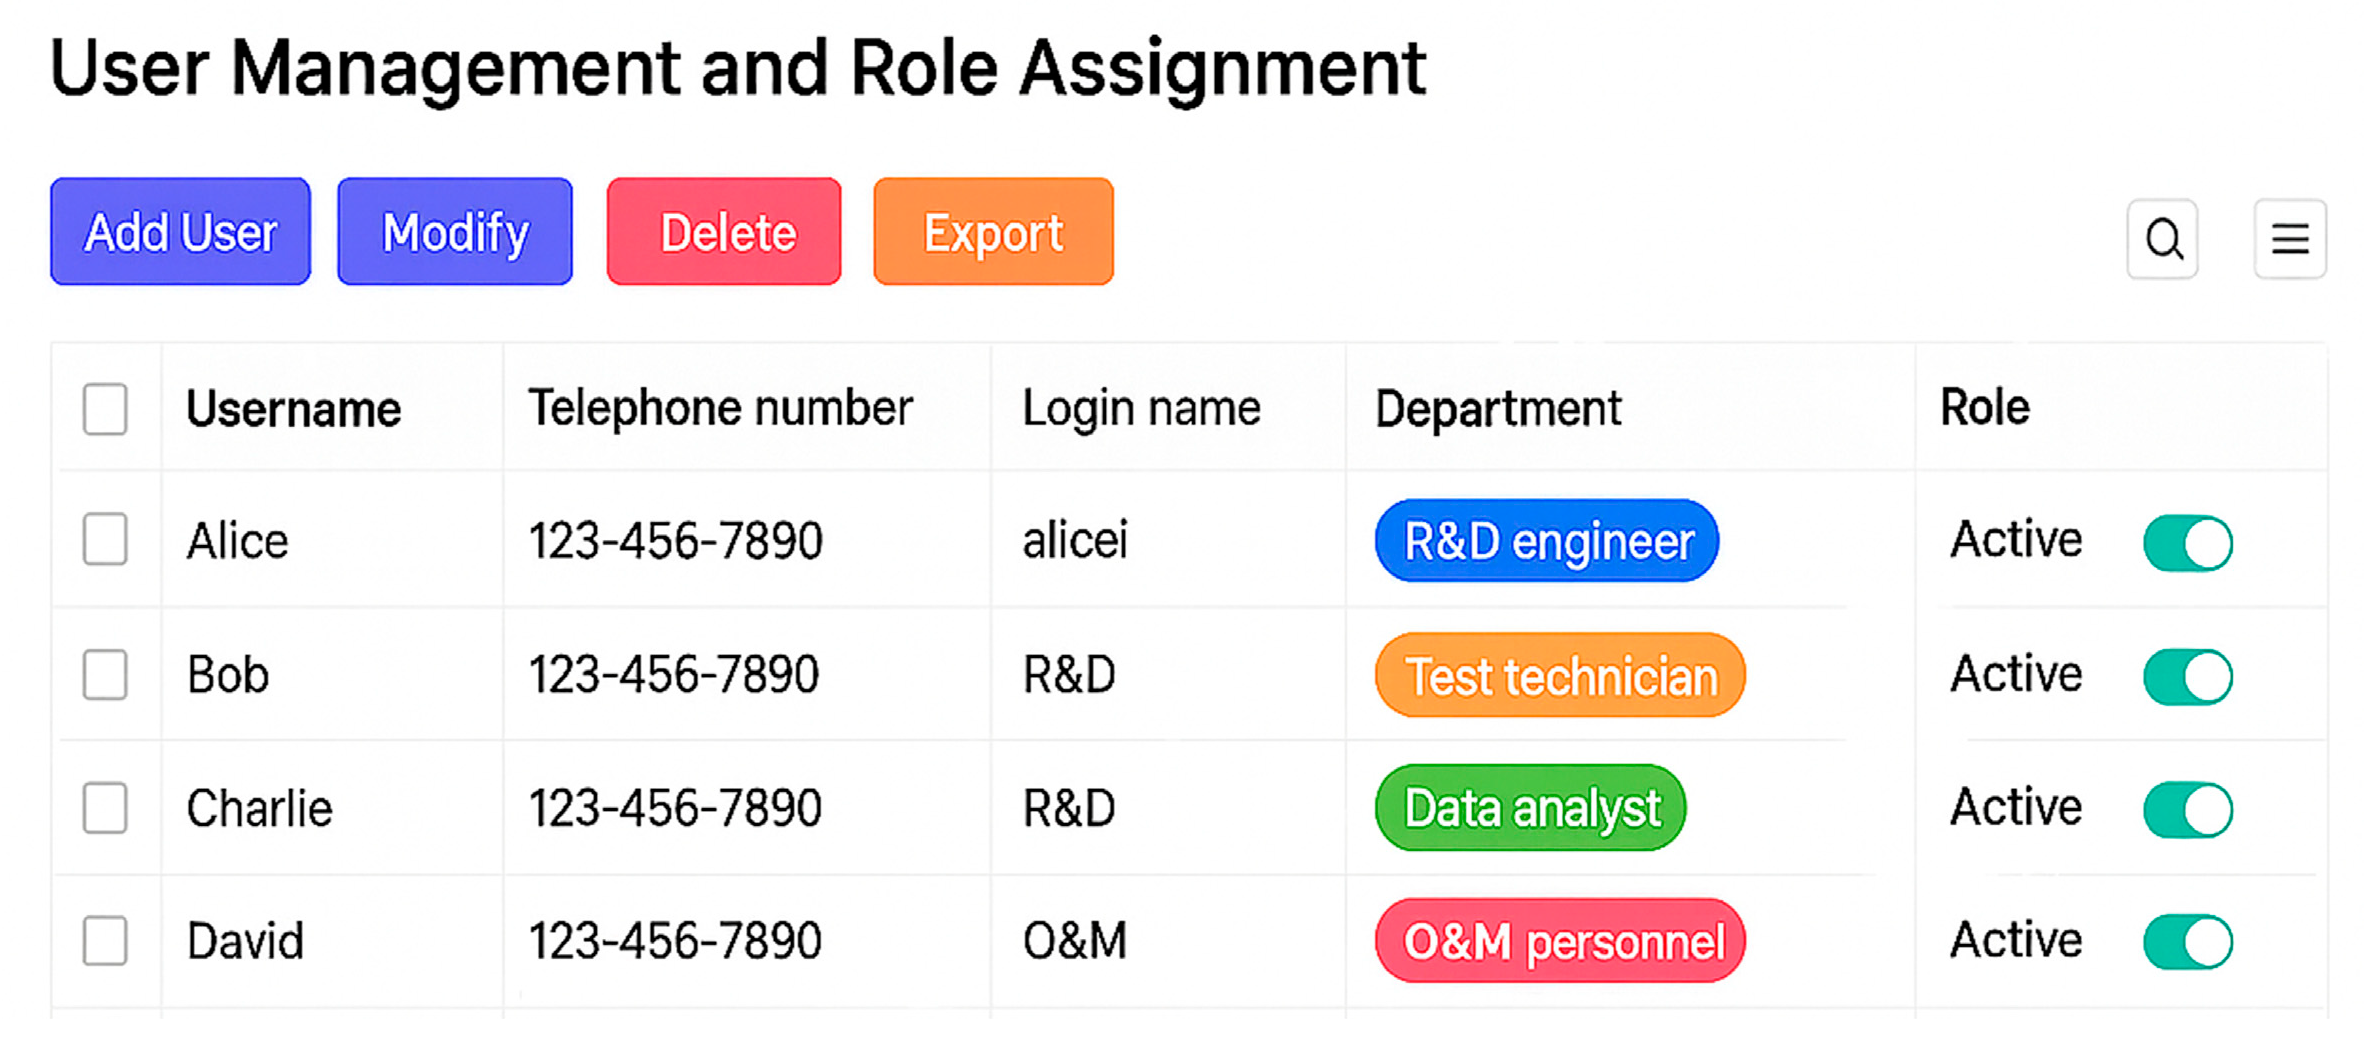
To support multi-role collaboration in wind turbine misalignment monitoring and diagnosis, the platform establishes a role system comprising R&D engineers, test technicians, data analysts, O&M personnel, and administrators. A dedicated “supplier” role is also defined to enable external collaboration. Based on an enhanced RBAC + JWT model, access control is enforced at the project, device, and component levels. This ensures sensitive data is isolated while supporting granular sharing in collaborative fault simulation experiments. The design accommodates long-term monitoring tasks that may span weeks and involve multi-source data from vibration, electrostatic, and laser alignment sensors, providing a secure and flexible working environment. Figure 4 illustrates the user registration interface, which supports secure role assignment and facilitates controlled access aligned with research or operational tasks. By aligning access rights with research or operational tasks, the platform ensures secure yet flexible collaboration across laboratory and field environments.

3.2. Full Lifecycle Management of Experimental Data

To address the complexity of long-term misalignment fault evolution and the diversity of sensor types in wind power applications, the platform supports full lifecycle data handling:
Data Acquisition and Import: The platform supports multiple data acquisition and import methods, as shown in Figure 5:
(1) Real-time acquisition enables direct streaming of sensor data—such as from laser alignment systems, vibration probes, and electrostatic induction sensors—via OPC-UA or serial interfaces. This ensures synchronization with dynamic operating conditions, including fluctuating wind loads or torque variations, which are essential for capturing the gradual evolution of misalignment faults.
(2) Batch import allows efficient uploading of large datasets (up to 5 GB per file) in formats such as CSV, TDMS, or Excel. This function is particularly suited to prolonged experimental campaigns or repeated fault-replication tests, where significant volumes of raw data are accumulated.
(3) Unified operation interface and metadata management: As shown in Figure 5, both real-time acquisition and batch import are integrated within the main operation interface. Data entry is initiated through the “Add” function, which employs a progressive form-based interface designed to streamline metadata submission and reduce user workload. The metadata management system follows the ISO/IEC 11179 standard [23] and organizes experimental information into three logical modules.
Data Storage: The platform uses a tiered storage strategy to accommodate different types of data:
(1) Structured data, including test IDs, turbine configurations, connection types, and sensor layouts, is stored in an Oracle database using a star schema model. This facilitates efficient multi-dimensional querying and traceability.
(2) Unstructured data, such as long-duration time-series from vibration sensors, electrostatic sensors, and laser alignment diagnostics, are stored on a NAS-based object storage system. Hash-based file verification ensures data integrity throughout extended experiments that may span several weeks.
(3) Multi-dimensional indexing supports data retrieval based on sensor type, operational condition (e.g., torque range, ambient vibration), or misalignment severity. This is essential for comparative analysis across different test rounds and equipment configurations.
Data Processing and Visualization: The platform features a built-in Python (Version: 3.9.18) script scheduler to automatically extract key metrics, such as misalignment rate, angular offset, and frequency-domain characteristics. These indicators are visualized using Highcharts, generating intuitive plots including time-series overlays, boxplots, and deviation maps. In particular, Figure 6 illustrates an example of electrostatic sensor signal visualization under misalignment, showing time-series waveforms, frequency spectrum, voltage RMS trend, and deviation maps. Such visual outputs are instrumental for understanding sensor behavior under misalignment conditions and for building empirical datasets for machine learning–based fault classification.

3.3. Data Sharing and Security

Misalignment test data, particularly from high-value wind turbine systems, is often confidential and subject to strict access control policies. To address these requirements, the platform introduces a multi-level data sharing and protection framework:
Four-tier access control includes public, department-level, project-specific, and private sharing modes. Sensitive identifiers (e.g., manufacturer names, structural dimensions) can be anonymized during export to enable scientific collaboration while preserving IP.
Data backups and recovery are managed using incremental backups and a Continuous Data Protection (CDP) strategy. The system guarantees a Recovery Point Objective (RPO) of 15 min, ensuring data survivability even during extended and mission-critical experiments.

4. Results and Discussion: Case Validation

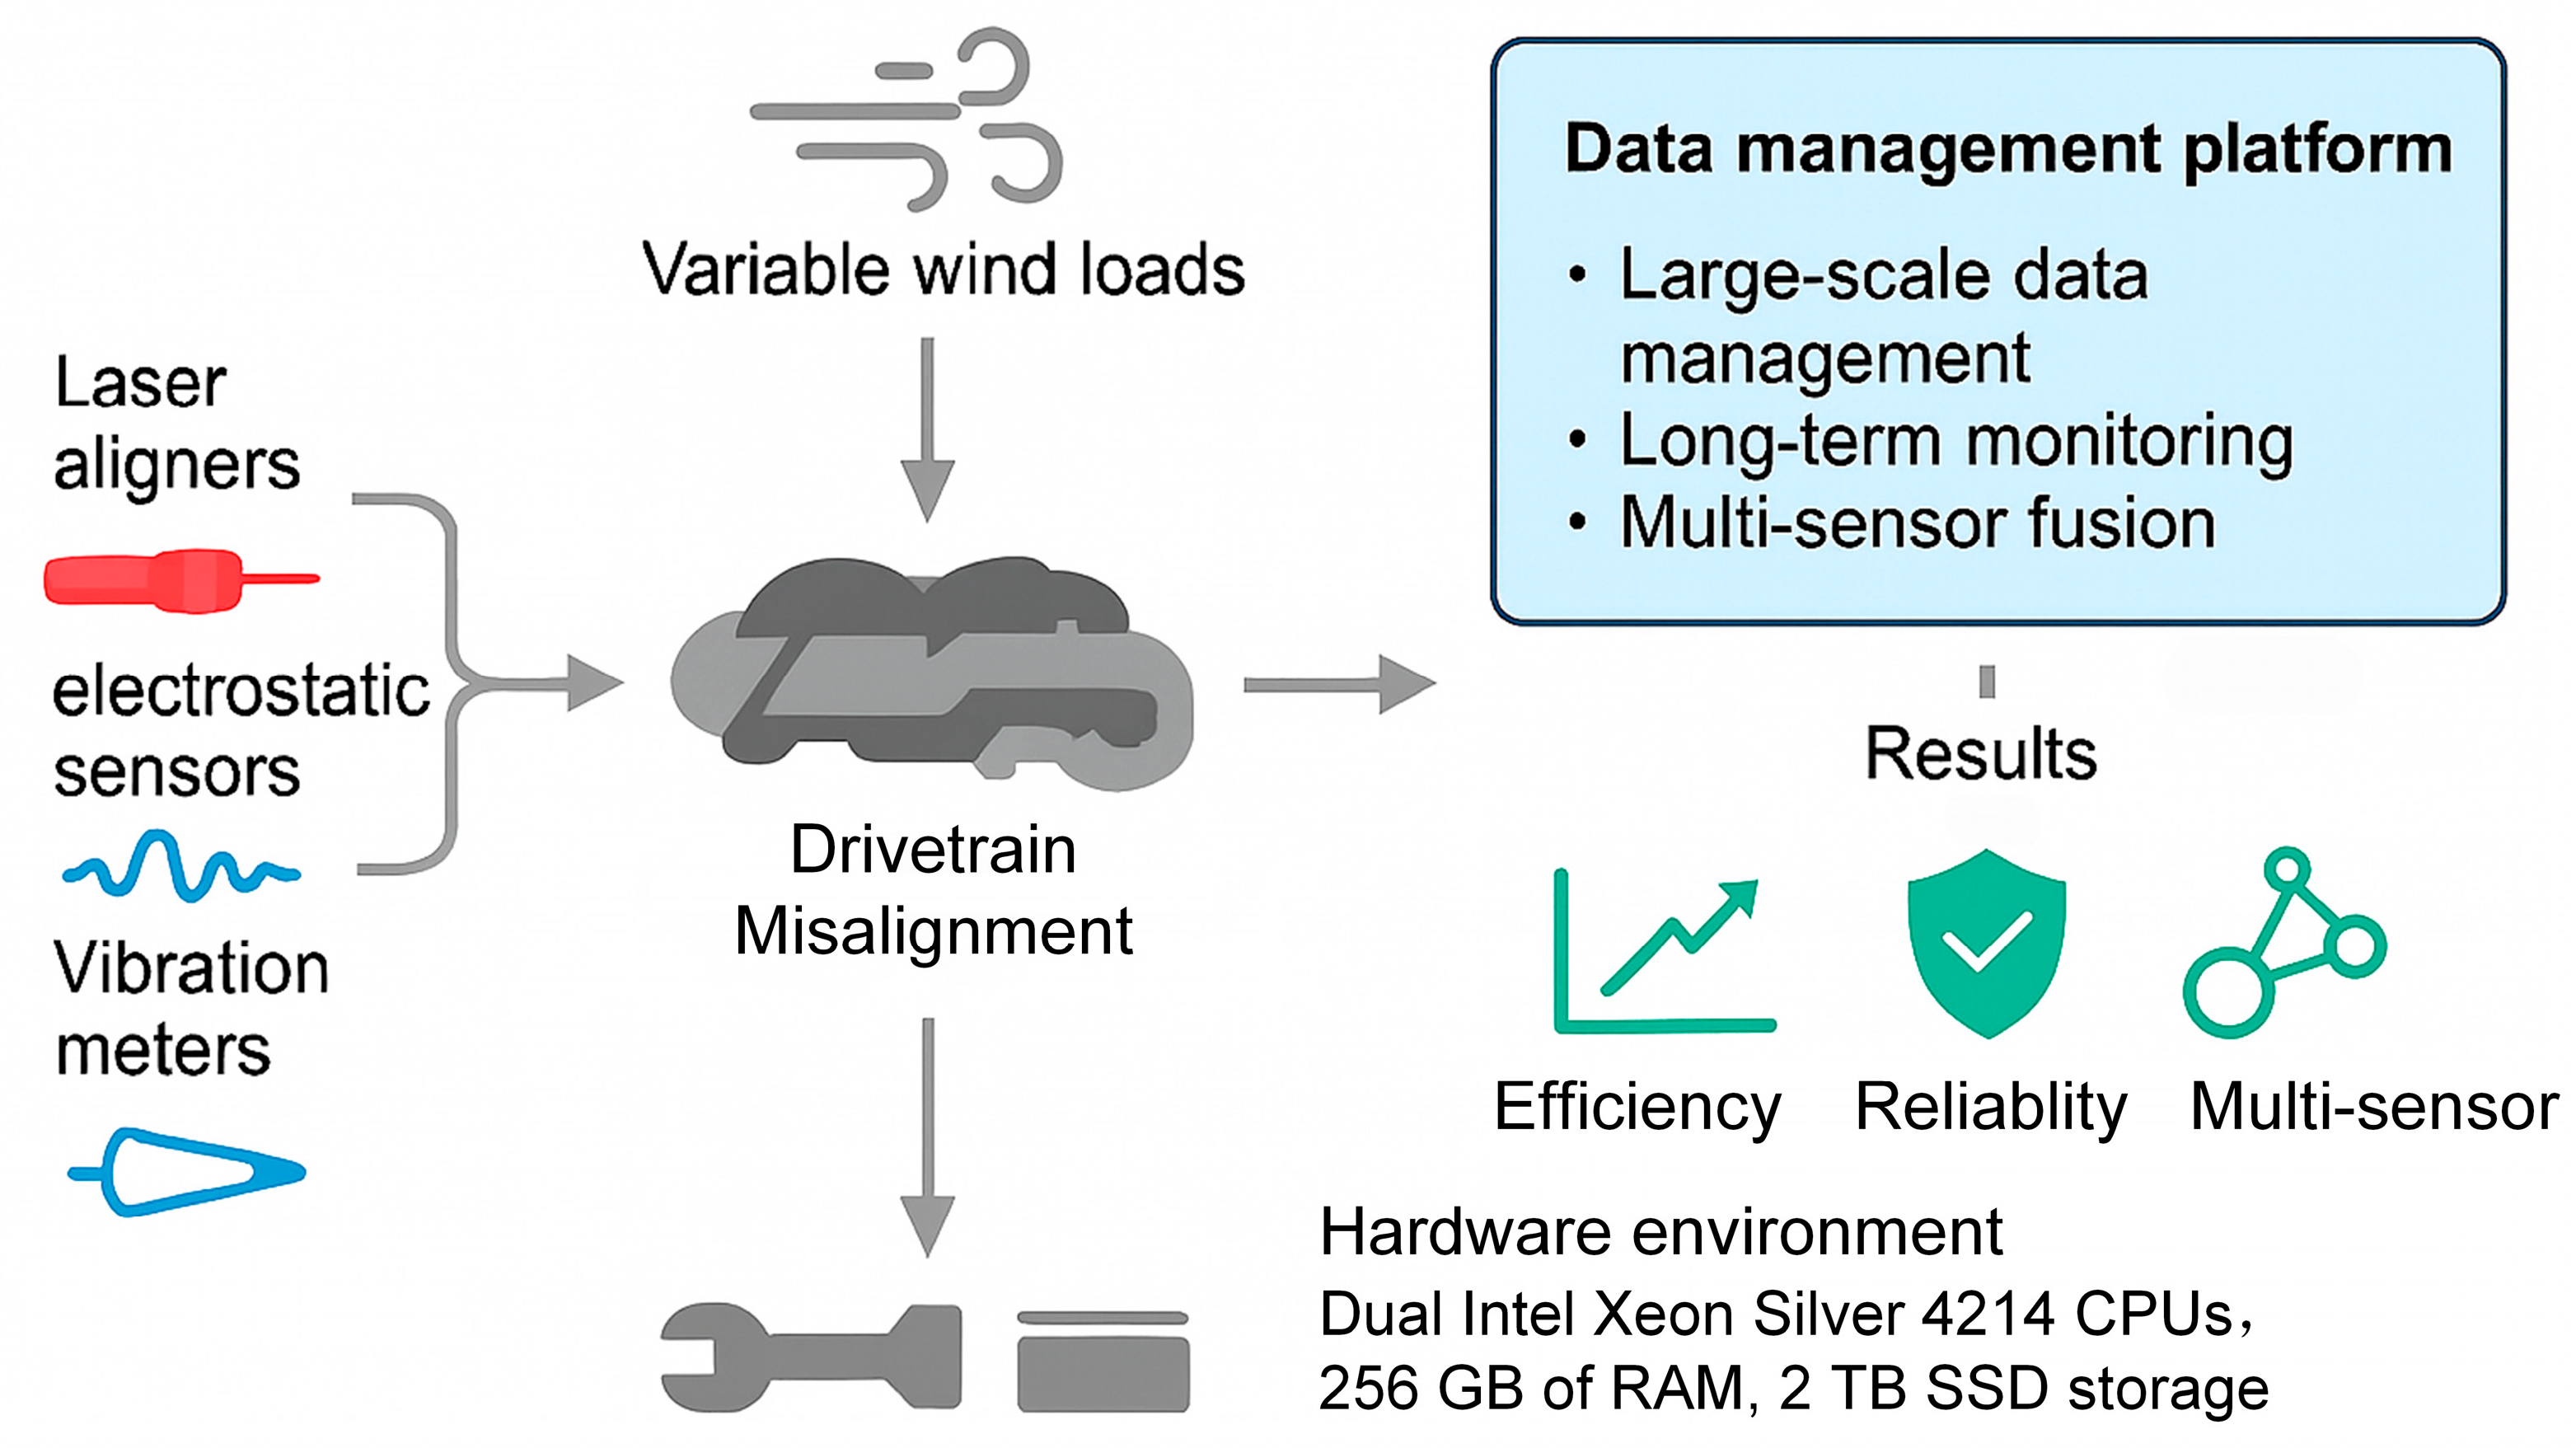
To validate the applicability of the proposed platform in wind power scenarios, it was deployed in a drivetrain misalignment testing program. Unlike generic laboratory tests, misalignment in wind turbines evolves gradually under variable wind loads, requiring long-term continuous monitoring and multi-sensor fusion to capture subtle degradation trends. The case study therefore highlights how the platform addresses these domain-specific requirements, including large-scale data management, traceability, and reusability for model development. Figure 7 provides a schematic overview of the validation workflow, covering the main stages from experimental setup and hardware environment to data import and result demonstration, with detailed content introduced in the following sections.

4.1. Database Construction

(1) Test Scope: The testing program was designed around a representative 1.8 MW onshore wind turbine drivetrain (Model: EN-106/1.8, manufactured by Envision, Shanghai, China), which is equipped with a FD1960YB three-stage gearbox (planetary + parallel shaft, manufactured by NGC), high-speed rolling bearings, and elastic coupling supports. This drivetrain configuration is widely adopted in commercial wind turbines, making it well-suited for simulating realistic engineering conditions. Based on this system, the testing program involved 36 coupling and shaft configurations under three torque load levels (nominal, underload, overload). Each configuration was tested for 10 continuous hours, generating a total of 2.4 TB of raw data. Data came from multiple heterogeneous sources:
The testing program involved 36 coupling and shaft configurations under three torque load levels (nominal, underload, overload). Each configuration was tested for 10 continuous hours, generating a total of 2.4 TB of raw data. Data came from multiple heterogeneous sources:
  • Laser alignment instruments, providing direct but offline displacement measurements,
  • Vibration sensors, offering high-frequency online monitoring of dynamic response, and
  • Electrostatic sensors, capturing electrostatic induction intensity variations associated with shaft misalignment.
(2) Hardware Environment: To ensure reproducibility of performance benchmarks, all data processing and storage tasks were conducted on a Dell PowerEdge R740 server, equipped with dual Intel Xeon Silver 4214 CPUs, 256 GB of RAM, 2 TB NVMe SSD storage, and 10 Gbps Ethernet. This configuration provided the necessary computational and I/O capacity to handle long-duration, high-frequency multi-sensor datasets typical of wind turbine misalignment experiments.
(3) Data Import and Structuring: The batch import module processed the entire dataset within 9 h, compared to nearly 5 days of manual sorting under legacy methods. Automatic tagging organized data by sensor type, load condition, and test configuration, creating a unified structure. The metadata model linked structured descriptors (e.g., turbine type, shaft geometry) with unstructured files (e.g., multi-GB vibration records), ensuring consistent traceability across the testing lifecycle.
(4) Search and Retrieval: Using Elasticsearch multi-condition queries, engineers could retrieve records such as “flexible coupling + overload + vibration channel 3” in under one second. This capability enabled rapid cross-case comparison and correlation analysis across long-term experiments.
(5) Reusability and Model Integration: The platform automatically generated diagnostic plots, such as misalignment coefficient vs. vibration RMS and electrostatic potential vs. angular offset, which were directly integrated into fault identification models. This eliminated over 80% of manual plotting and preprocessing effort, while building a reusable database for future machine learning and prognostic modeling.

4.2. Results and Discussion

(1) Efficiency Improvement: The platform improved data processing efficiency by 78% by automating import, tagging, indexing, and visualization. Long-duration datasets that once required manual intervention were handled seamlessly, allowing engineers to focus on analysis rather than file management.
(2) Reliability and Data Integrity: Because misalignment faults evolve gradually, continuous and reliable data capture is critical. During a one-year test, the platform achieved zero data loss, supported by dual-backup and CDP with a 15 min Recovery Point Objective (RPO). This ensured uninterrupted monitoring of gradual fault development.
(3) Multi-Sensor Fusion and Industrial Relevance: By integrating heterogeneous data sources, the platform enabled researchers to validate online indicators (vibration, electrostatic) against offline ground-truth laser measurements. Furthermore, its linkage with SCADA operational data (wind speed, torque, power curve) bridged laboratory simulations with real turbine behavior, enhancing the practical relevance of findings for field diagnostics and predictive maintenance.
(4) Software Performance Evaluation: To further verify the practicality of the platform, we conducted software-level performance tests on the major functional modules. As shown in Table 2, batch data import achieved a throughput of 320 GB/h, allowing a 2.4 TB dataset to be imported within 9 h. Metadata indexing and retrieval maintained sub-second response times (<0.8 s for indexing, <1.0 s for multi-condition queries), ensuring rapid access to experimental records. Automated plotting completed within 3 s per visualization, while role-based authorization requests responded in <0.5 s even under 50 concurrent users. Moreover, dual-backup and Continuous Data Protection (CDP) mechanisms achieved a 15 min Recovery Point Objective (RPO), with zero data loss during a 12-month trial.
Importantly, these results not only confirm the platform’s efficiency, reliability, and scalability under realistic misalignment testing workloads, but also demonstrate its scientific contribution: enabling large-scale, traceable, and reproducible experiments that were previously hindered by data fragmentation and inefficiency. By quantitatively proving that the system can manage industrial-scale misalignment datasets with both speed and integrity, the evaluation establishes a strong connection between the platform’s technical performance and its novelty in advancing wind turbine reliability research.
(5) Comparative Benchmarking: To the best of our knowledge, no dedicated platform currently exists for managing wind turbine misalignment experiments. This gap underscores the novelty of our work. To contextualize the performance of the proposed platform, we conducted a comparative analysis with representative systems from related domains, including industrial IoT time-series databases and digital twin solutions for wind energy. Since these platforms emphasize different aspects of performance—such as bulk data import efficiency, low-latency SCADA response, or multi-source real-time fusion—we present them as complementary rather than directly comparable. Table 3 summarizes the results, with a “Performance Dimension” column to clarify the focus of each system. The comparison highlights that our platform achieves superior import speed, lower retrieval latency, and optimized storage efficiency, while being specifically tailored to the long-term, multi-sensor, and high-volume requirements of wind turbine misalignment testing.
Scalability and Future Work: Currently, multi-laboratory concurrent writing still depends on manual configuration, which reduces scalability. Planned enhancements include Kubernetes-based orchestration for containerized deployment and Redis Stream pipelines for distributed, high-throughput data ingestion. These upgrades will support multi-site wind farm studies, enabling the platform to manage larger datasets and provide the foundation for digital twins of wind turbine drivetrains.
This validation confirms that the platform is not a generic data management system but one specifically tailored to the unique requirements of wind turbine misalignment research. It supports long-term continuous monitoring of gradual fault evolution, enables multi-sensor data fusion for comprehensive fault detection, provides traceable and structured storage to ensure reproducibility and reuse, and integrates seamlessly with operational SCADA systems to enhance field relevance. Together, these capabilities establish the platform as a scalable digital backbone for misalignment diagnostics, fault prognosis, and predictive maintenance in wind power equipment.

5. Conclusions

This study addresses the urgent demand for large-scale, multi-configuration misalignment testing in wind power drivetrains by developing a dedicated experimental data management platform tailored to the characteristics of wind turbine misalignment faults. Unlike generic systems, the platform is specifically designed to handle gradual fault evolution, heterogeneous sensor data, and long-duration monitoring requirements.
Built on a modern architecture that integrates LIMS principles, Spring Boot, and MVC design, the system provides full-process functionalities, including multi-sensor data acquisition, structured metadata management, high-throughput storage, automated feature processing, role-based collaboration, visualization, and secure sharing. These functions ensure that the platform can meet the stringent requirements of wind turbine reliability research.
Case validation confirmed the platform’s ability to efficiently manage multi-terabyte datasets, reducing manual sorting time by over 80%, and to directly integrate processed results into fault identification and prognostic models. Reliability is ensured through dual-backup and continuous data protection strategies, while scalability enables seamless integration with SCADA operational data, effectively linking laboratory simulations with field conditions.
By supporting cross-sensor fusion and traceable lifecycle management, the platform establishes a reusable knowledge base for fault evolution modeling and data-driven maintenance strategies. In conclusion, the platform is not merely a data management tool but a digital backbone for wind turbine misalignment research, providing practical, efficient, and secure support for structural reliability assessment, intelligent fault diagnosis, predictive maintenance, and smart O&M in the wind power industry.

Author Contributions

Conceptualization, Y.G.; Methodology, J.C. and P.L.; Software, J.C., Q.F., P.L. and Z.L.; Validation, Q.F.; Formal analysis, Q.F.; Investigation, J.C.; Data curation, P.L., B.Z. and Z.L.; Writing–original draft, J.C. and Z.L.; Writing–review & editing, Y.G.; Visualization, B.Z. and Z.L.; Supervision, Y.G.; Project administration, Y.G.; Funding acquisition, Y.G. All authors have read and agreed to the published version of the manuscript.

Funding

This research received no external funding.

Data Availability Statement

The original contributions presented in this study are included in the article. Further inquiries can be directed to the corresponding author.

Conflicts of Interest

Authors Jianlin Cao, Qiang Fu, Pengchao Li and Bingchang Zhao were employed by the company China Guanghe New Energy Holding Co., Ltd. Shaanxi Branch. The remaining authors declare that the research was conducted in the absence of any commercial or financial relationships that could be construed as a potential conflict of interest.

References

  1. Chen, X.F.; Guo, Y.J.; Xu, C.B.; Shang, H.B. Review of Fault Diagnosis and Health Monitoring for Wind Power Equipment. China Mech. Eng. 2020, 31, 175–189. [Google Scholar] [CrossRef]
  2. Cornel, J.; Gutiérrez Guzmán, F.; Jacobs, G.; Neumann, S. Condition Monitoring of Roller Bearers Using Acoustic Emission. Wind Energy Sci. 2021, 6, 367–376. [Google Scholar] [CrossRef]
  3. Qu, Y.Z.; He, D.; Yoon, J.; Van Hecke, B.; Bechhoefer, E.; Zhu, J.D. Gearbox Tooth Cut Fault Diagnostics Using Acoustic Emission and Vibration Sensors—A Comparative Study. Sensors 2014, 14, 1372–1393. [Google Scholar] [CrossRef]
  4. Jalan, A.K.; Patil, S.; Mittal, G. A Review on Fault Diagnosis of Misaligned Rotor Systems. Int. J. Perform. Eng. 2020, 16, 499–509. [Google Scholar] [CrossRef]
  5. Umbrajkaar, A.M.; Krishnamoorthy, A.; Dhumale, R.B. Vibration Analysis of Shaft Misalignment Using Machine Learning Approach under Variable Load Conditions. Shock Vib. 2020, 2020, 1650270. [Google Scholar] [CrossRef]
  6. Patil, S.; Jalan, A.K.; Marathe, A.M. Support Vector Machine for Misalignment Fault Classification under Different Loading Conditions Using Vibro-Acoustic Sensor Data Fusion. Exp. Tech. 2022, 46, 957–971. [Google Scholar] [CrossRef]
  7. Liu, Q.; Yang, K.; Feng, S.M. Application of LIMS Laboratory Information Management System in Testing Laboratory. Highlights Sci. Eng. Technol. 2023, 56, 572–576. [Google Scholar] [CrossRef]
  8. Kong, K.Y.G.; Dyer, K.; Payne, C.; Hamerton, I.; Weaver, P.M. Progress and Trends in Damage Detection Methods, Maintenance, and Data-driven Monitoring of Wind Turbine Blades—A Review. Renew. Energy Focus 2023, 44, 390–412. [Google Scholar] [CrossRef]
  9. Pratt, R.; Allen, C.; Masoum, M.A.S.; Seibi, A. Defect Detection and Classification on Wind Turbine Blades Using Deep Learning with Fuzzy Voting. Machines 2025, 13, 283. [Google Scholar] [CrossRef]
  10. Civera, M.; Surace, C. Non-Destructive Techniques for the Condition and Structural Health Monitoring of Wind Turbines: A Literature Review of the Last 20 Years. Sensors 2022, 22, 1627. [Google Scholar] [CrossRef]
  11. Duan, J.; van Kooten, G.C.; Islam, A.T.M.H. Calibration of Grid Models for Analyzing Energy Policies. Energies 2023, 16, 1234. [Google Scholar] [CrossRef]
  12. Ahn, S.-H.; Hyun, J.-H.; Choi, J.-H.; Lee, S.-G.; Kim, G.-G.; Bhang, B.-G.; Cha, H.-L.; Lim, B.-Y.; Choi, H.-J.; Ahn, H.-K. Load-Following Operation of Small Modular Reactors under Unit Commitment Planning with Various Photovoltaic System Conditions. Energies 2023, 16, 2946. [Google Scholar] [CrossRef]
  13. Maestro-Prieto, J.A.; Ramírez-Sanz, J.M.; Bustillo, A.; Rodríguez-Díez, J.J. Semi-Supervised Diagnosis of Wind-Turbine Gearbox Misalignment and Imbalance Faults. Appl. Intell. 2024, 54, 4525–4544. [Google Scholar] [CrossRef]
  14. Moghadam, F.K.; Gao, Z.; Chabaud, V.; Chapaloglou, S. Yaw Misalignment in Powertrain Degradation Modeling for Wind Farm Control in Curtailed Conditions. Front. Energy Res. 2024, 12, 1272967. [Google Scholar] [CrossRef]
  15. Meng, N.; Nagy, S.; Yao, D.F.; Zhuang, W.J.; Argoty, G.A. Secure Coding Practices in Java: Challenges and Vulnerabilities. In Proceedings of the 40th International Conference on Software Engineering (ICSE), Gothenburg, Sweden, 27 May–3 June 2018; pp. 739–749. [Google Scholar] [CrossRef]
  16. Islam, M.; Rahaman, S.; Meng, N.; Hassanshahi, B.; Krishnan, P.; Yao, D.F. Coding Practices and Recommendations of Spring Security for Enterprise Applications. In Proceedings of the 2020 IEEE Secure Development (SecDev), San Francisco, CA, USA, 28–30 September 2020; pp. 49–57. [Google Scholar] [CrossRef]
  17. Tahvonen, M. A minimal zero-downtime deployment using NGINX & Spring Boot. J. Web Oper. DevOps 2022, 5, 12–21. [Google Scholar]
  18. Gadban, F.; Kunkel, J. Analyzing the Performance of the S3 Object Storage API for HPC Workloads. Appl. Sci. 2021, 11, 8540. [Google Scholar] [CrossRef]
  19. Liu, Q.G.; Sun, X.Y. Research of Web Real-Time Communication Based on WebSocket. Int. J. Commun. Netw. Syst. Sci. 2012, 5, 797–801. [Google Scholar] [CrossRef]
  20. Gupta, Y.; Dewan, H.; Leekha, A. Real-Time Monitoring Using AJAX and WebSockets. J. Stat. Manag. Syst. 2020, 23, 125–134. [Google Scholar] [CrossRef]
  21. Bucko, A.; Vishi, K.; Krasniqi, B.; Rexha, B. Enhancing JWT Authentication and Authorization in Web Applications Based on User Behavior History. Computers 2023, 12, 78. [Google Scholar] [CrossRef]
  22. Navitsky, M. Developing a Spring Boot Application with Elasticsearch Integration. Elinext Tech. J. 2024, 1, 45–58. [Google Scholar]
  23. ISO/IEC 11179; Information Technology—Metadata Registries (MDR). International Organization for Standardization/International Electrotechnical Commission: Geneva, Switzerland, 2015.
  24. Oyucu, S.; Aksöz, A. Integrating Machine Learning and MLOps for Wind Energy Forecasting: A Comparative Analysis and Optimization Study on Türkiye’s Wind Data. Appl. Sci. 2024, 14, 3725. [Google Scholar] [CrossRef]
  25. Kandemir, E.; Hasan, A.; Kvamsdal, T.; Abdel-Afou Alaliyat, S. Predictive Digital Twin for Wind Energy Systems: A Literature Review. Energy Inform. 2024, 7, 68. [Google Scholar] [CrossRef]
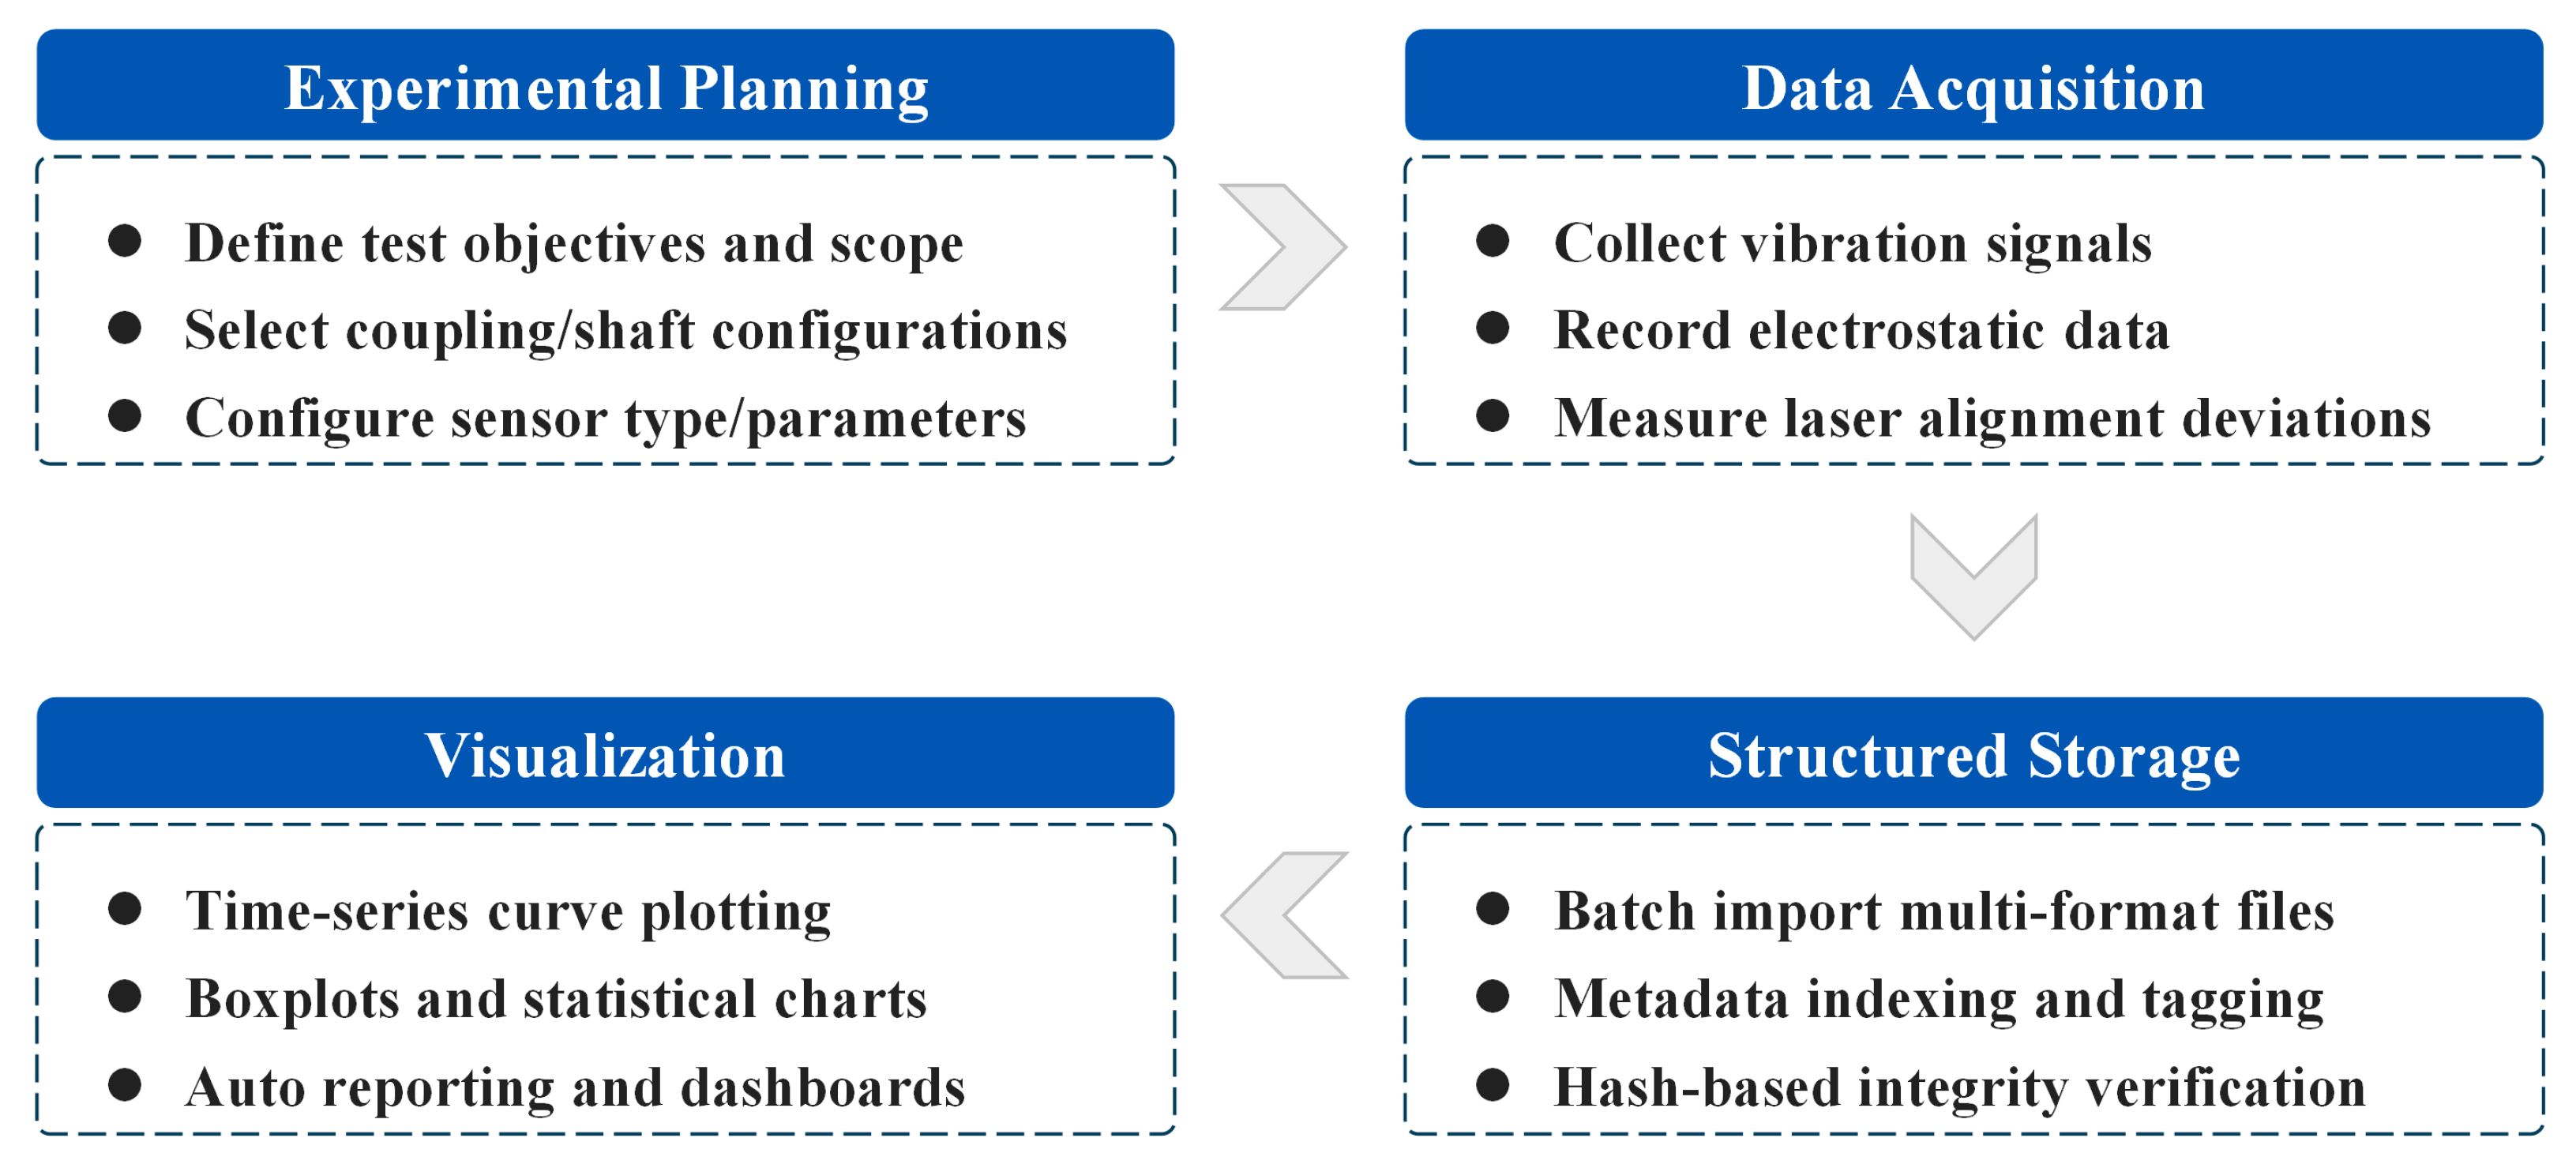
Figure 1. Process flowchart of misalignment experimental data management lifecycle.
Energies 18 05047 g001
Figure 2. Schematic of geographical distribution and collaboration structure among laboratories, field stations, enterprises, and the data management platform.
Energies 18 05047 g002
Figure 3. Overall System Architecture.
Energies 18 05047 g003
Figure 4. User Information Entry Interface.
Energies 18 05047 g004
Figure 5. Homepage of the Experimental Data Management Platform.
Energies 18 05047 g005
Figure 6. Electrostatic sensor signal under misalignment, automatically visualized by the platform through time-series, frequency spectrum, voltage RMS trend, and deviation map to capture both temporal and frequency-domain characteristics of fault evolution.
Energies 18 05047 g006
Figure 7. Case validation of the misalignment experimental data management platform.
Energies 18 05047 g007
Table 1. Core technologies and their applications.
TechnologyFunctionAdvantage in Wind Power Context
Spring Boot Auto-ConfigurationAuto-configuration of REST, JPA, SecurityAllows seamless access to APIs from diverse sensor devices (laser aligners, electrostatic sensors, vibration meters)
RBAC + JWTRole-based access control with stateless sessionsEnables collaborative fault labeling and data validation across roles
ElasticsearchMulti-dimensional tag-based searchMillisecond retrieval by test ID, sensor type, or misalignment condition
MinIO Object StorageAttachment managementEfficiently stores multi-gigabyte datasets from various sensors, including vibration, electrostatic, and laser alignment signals.
WebSocketReal-time data pushSupports live dashboards for tracking test progression and detecting abnormal deviations
Table 2. Comparative performance of data management platforms.
Test ModuleFunctionMetricResultRemarks
Data ImportBatch import (CSV/TDMS)Import speed320 GB/h (2.4 TB in 9 h)Verified under full load
Metadata ManagementTagging & version controlIndexing latency<0.8 s/queryStable with >1 M records
Search & RetrievalElasticsearch multi-conditionRetrieval latency<1.0 sConsistent across 100 queries
Visualization & PlottingAuto Python–Highcharts plottingPlot generation time<3 s/plotSupports multi-sensor overlays
Access ControlRBAC + JWTAuthorization response latency<0.5 s50 concurrent users supported
Backup & ProtectionDual-backup + CDPRecovery Point Objective (RPO)15 minZero data loss over 12 months
Table 3. Comparative performance of data management platforms.
Platform/SystemDomainPerformance Metric/ValuePerformance Dimension
Proposed platform (this study)Wind turbine misalignmentImport speed: 320 GB/h (2.4 TB in 9 h) Bulk data import & structuring efficiency
Industrial IoT MLOps latency [24]Wind Energy Real-time SystemsResponse latency: ~9 msLow-latency SCADA-integrated response
Predictive Wind Energy Digital Twin [25]Wind energy monitoring systemsMulti-source fusion capabilityReal-time integration of heterogeneous data
Disclaimer/Publisher’s Note: The statements, opinions and data contained in all publications are solely those of the individual author(s) and contributor(s) and not of MDPI and/or the editor(s). MDPI and/or the editor(s) disclaim responsibility for any injury to people or property resulting from any ideas, methods, instructions or products referred to in the content.