Article

Optimization Design and Experimental Verification of the Hydrogen-Powered Self-Propelled Plant Protection Machine

by
Liyou Xu
1,2,
Shuailong Hou
1,
Yanying Li
1,2,
Shenghui Lei
1,2 and
Mengnan Liu
1,2,3,*
1
College of Vehicle and Traffic Engineering, Henan University of Science and Technology, Luoyang 471003, China
2
State Key Laboratory of Intelligent Agricultural Power Equipment, Luoyang 471039, China
3
YTO Group Corporation R&D Center, Luoyang 471039, China
*
Author to whom correspondence should be addressed.
Energies 2025, 18(18), 4952; https://doi.org/10.3390/en18184952
Submission received: 19 August 2025 / Revised: 10 September 2025 / Accepted: 16 September 2025 / Published: 17 September 2025

Abstract

The design objectives for the overall parameters of the hydrogen-powered self-propelled plant protection machine are multiple, and the constraints are complex, making it difficult for single-objective optimization methods to achieve the optimal design. This paper designed the objective function with the goal of optimizing the full-cycle cost and system volume of the energy system. By analyzing the structural characteristics of the power system of the self-propelled plant protection machine, the optimization parameters were determined. A constraint model was developed by studying the operational performance of the self-propelled plant protection machine. The multi-objective particle swarm optimization algorithm was used to derive the multi-objective optimization algorithm for the power system parameters of the hydrogen-powered self-propelled plant protection machine. Parameter optimization and dynamic simulation were carried out using the Matlab/Simulink (2023a) platform, and the results of the designed optimization scheme were compared with the single-objective optimization scheme: the full-cycle cost and system volume decreased by 15.8% and 17.6%, respectively. Both optimization schemes are capable of meeting the plant protection operation load requirements. The fuel cell output efficiency and battery efficiency increased by 15.3% and 10.1%, respectively. The hydrogen consumption of the fuel cell, the equivalent hydrogen consumption of the battery, and the equivalent hydrogen consumption of the system decreased by 10.5%, 13.8%, and 10.8%, respectively. The design conducted performance tests on the prototype of the hydrogen-powered plant protection machine, and the results showed that the operational performance indicators, system equivalent hydrogen consumption, and simulation values had an absolute mean error of 2.418, verifying the optimization method.

1. Introduction

Against the backdrop of global warming, hydrogen power systems, due to their zero carbon emissions and high energy conversion efficiency, are gradually replacing traditional fuel-powered systems and becoming a key research direction in intelligent plant protection machinery [1,2,3,4,5]. Fuel cells have issues with a slow response and low power density, and accelerate aging under complex operating conditions [6,7,8,9]. Batteries, on the other hand, have a high power density and fast response characteristics. The hybrid power system combining both can overcome these shortcomings. The self-propelled plant protection machine needs to balance efficient operation [10,11,12,13,14], low-cost performance, and environmental adaptability during operation, with the three factors influencing each other. By optimizing the power system parameters, these issues can be effectively addressed [15,16].
Research on the application of hydrogen power in agricultural machinery is still largely concentrated on tractor platforms [5], with their system design and energy management having formed a relatively complete system. In self-propelled plant protection machinery, existing research mainly focuses on the chassis structure, operational control, and spraying systems, while the power system still primarily uses diesel engines or pure electric solutions.
Compared with the more mature hydrogen applications on tractor platforms, the optimization methods for hydrogen power systems for plant protection machinery are somewhat insufficient. Furthermore, although hydrogen-powered drone spraying technology has seen some applications, its power system structure and operating mode differ from those of self-propelled platforms, making it difficult to directly apply it to ground-based plant protection machinery. Against this backdrop, this study focuses on researching hydrogen power system parameter matching and optimization strategies for efficient plant protection operation scenarios, aiming to enhance their operational economy, adaptability, and sustainability.
Professor Paulson from the Prairie Agricultural Machinery Research Institute in Canada [17] improved the understanding of the spray system’s wake characteristics in plant protection machines. He validated the full-scale sprayer’s numerical model using fluid mechanics and measured the time-averaged velocity components and turbulence kinetic energy in the sprayer’s wake. Professor Fabula from Kansas State University in the United States [18] addressed the issue of spray application errors caused by the speed difference between the inner and outer sides of the boom during steering operations in wide-span agricultural sprayers. He used a steering compensation technology based on pulse-width modulation and dynamically adjusted the duty cycle, achieving an overall uniformity of 90% in field spraying. The automatic navigation system developed by Li Wei et al. [19] reduced the lateral position deviation to 0 m within 11 s and the heading angle deviation to 0 radians within approximately 11 s under a dual-wheel steering mode. In a four-wheel steering mode, the lateral position deviation was reduced to 0 m within 8 s, and the heading angle deviation was reduced to 0 radians within 8 s. At a speed of 3 km/h, the sprayer tracked the target path and stabilized in 5.84 s under the dual-wheel steering mode, while it took 4.08 s in the four-wheel steering mode. At a speed of 5 km/h, the sprayer in the four-wheel steering mode tracked the target path and stabilized in 3.75 s.
Hu Chenwei et al. [19] analyzed and designed a single-machine vertical axis air suspension system for large high-clearance self-propelled sprayers. The suspension structure was optimized through a stress analysis and finite element analysis, providing important support for its design and development. The sliding mode active disturbance rejection controller proposed by Liu Guohai et al. [20] significantly improved the attitude response speed and robustness of synchronously steered high-clearance sprayers. Simulation and field test results showed that the response time of the front and rear steering angles increased by 8.42% and 9%, respectively, while steady-state errors decreased by 2.96% and 3.15%, respectively, meeting the autonomous navigation operation requirements of sprayers in different environments. Relevant studies can optimize specific performance characteristics, such as the spraying uniformity, steering stability, and passing ability of self-propelled plant protection machines. However, the comprehensive performance optimization of hydrogen power systems has not been deeply explored.
This paper proposes an optimization method for the parameters of the hydrogen-powered self-propelled plant protection machine’s hybrid power system, systematically considering factors such as power matching of the energy system, energy balance, charging frequency, fuel cell output variation rate, and battery parameter fluctuations during plant protection operations. The method addresses the complex coupling relationships between the objective functions and optimizes the overall machine’s economy and spatial adaptability, aiming to improve the comprehensive performance of the hydrogen power system in self-propelled plant protection machines.

2. Analysis of Optimization Objects and Operational Characteristics

2.1. Analysis of Optimization Targets for the Power System

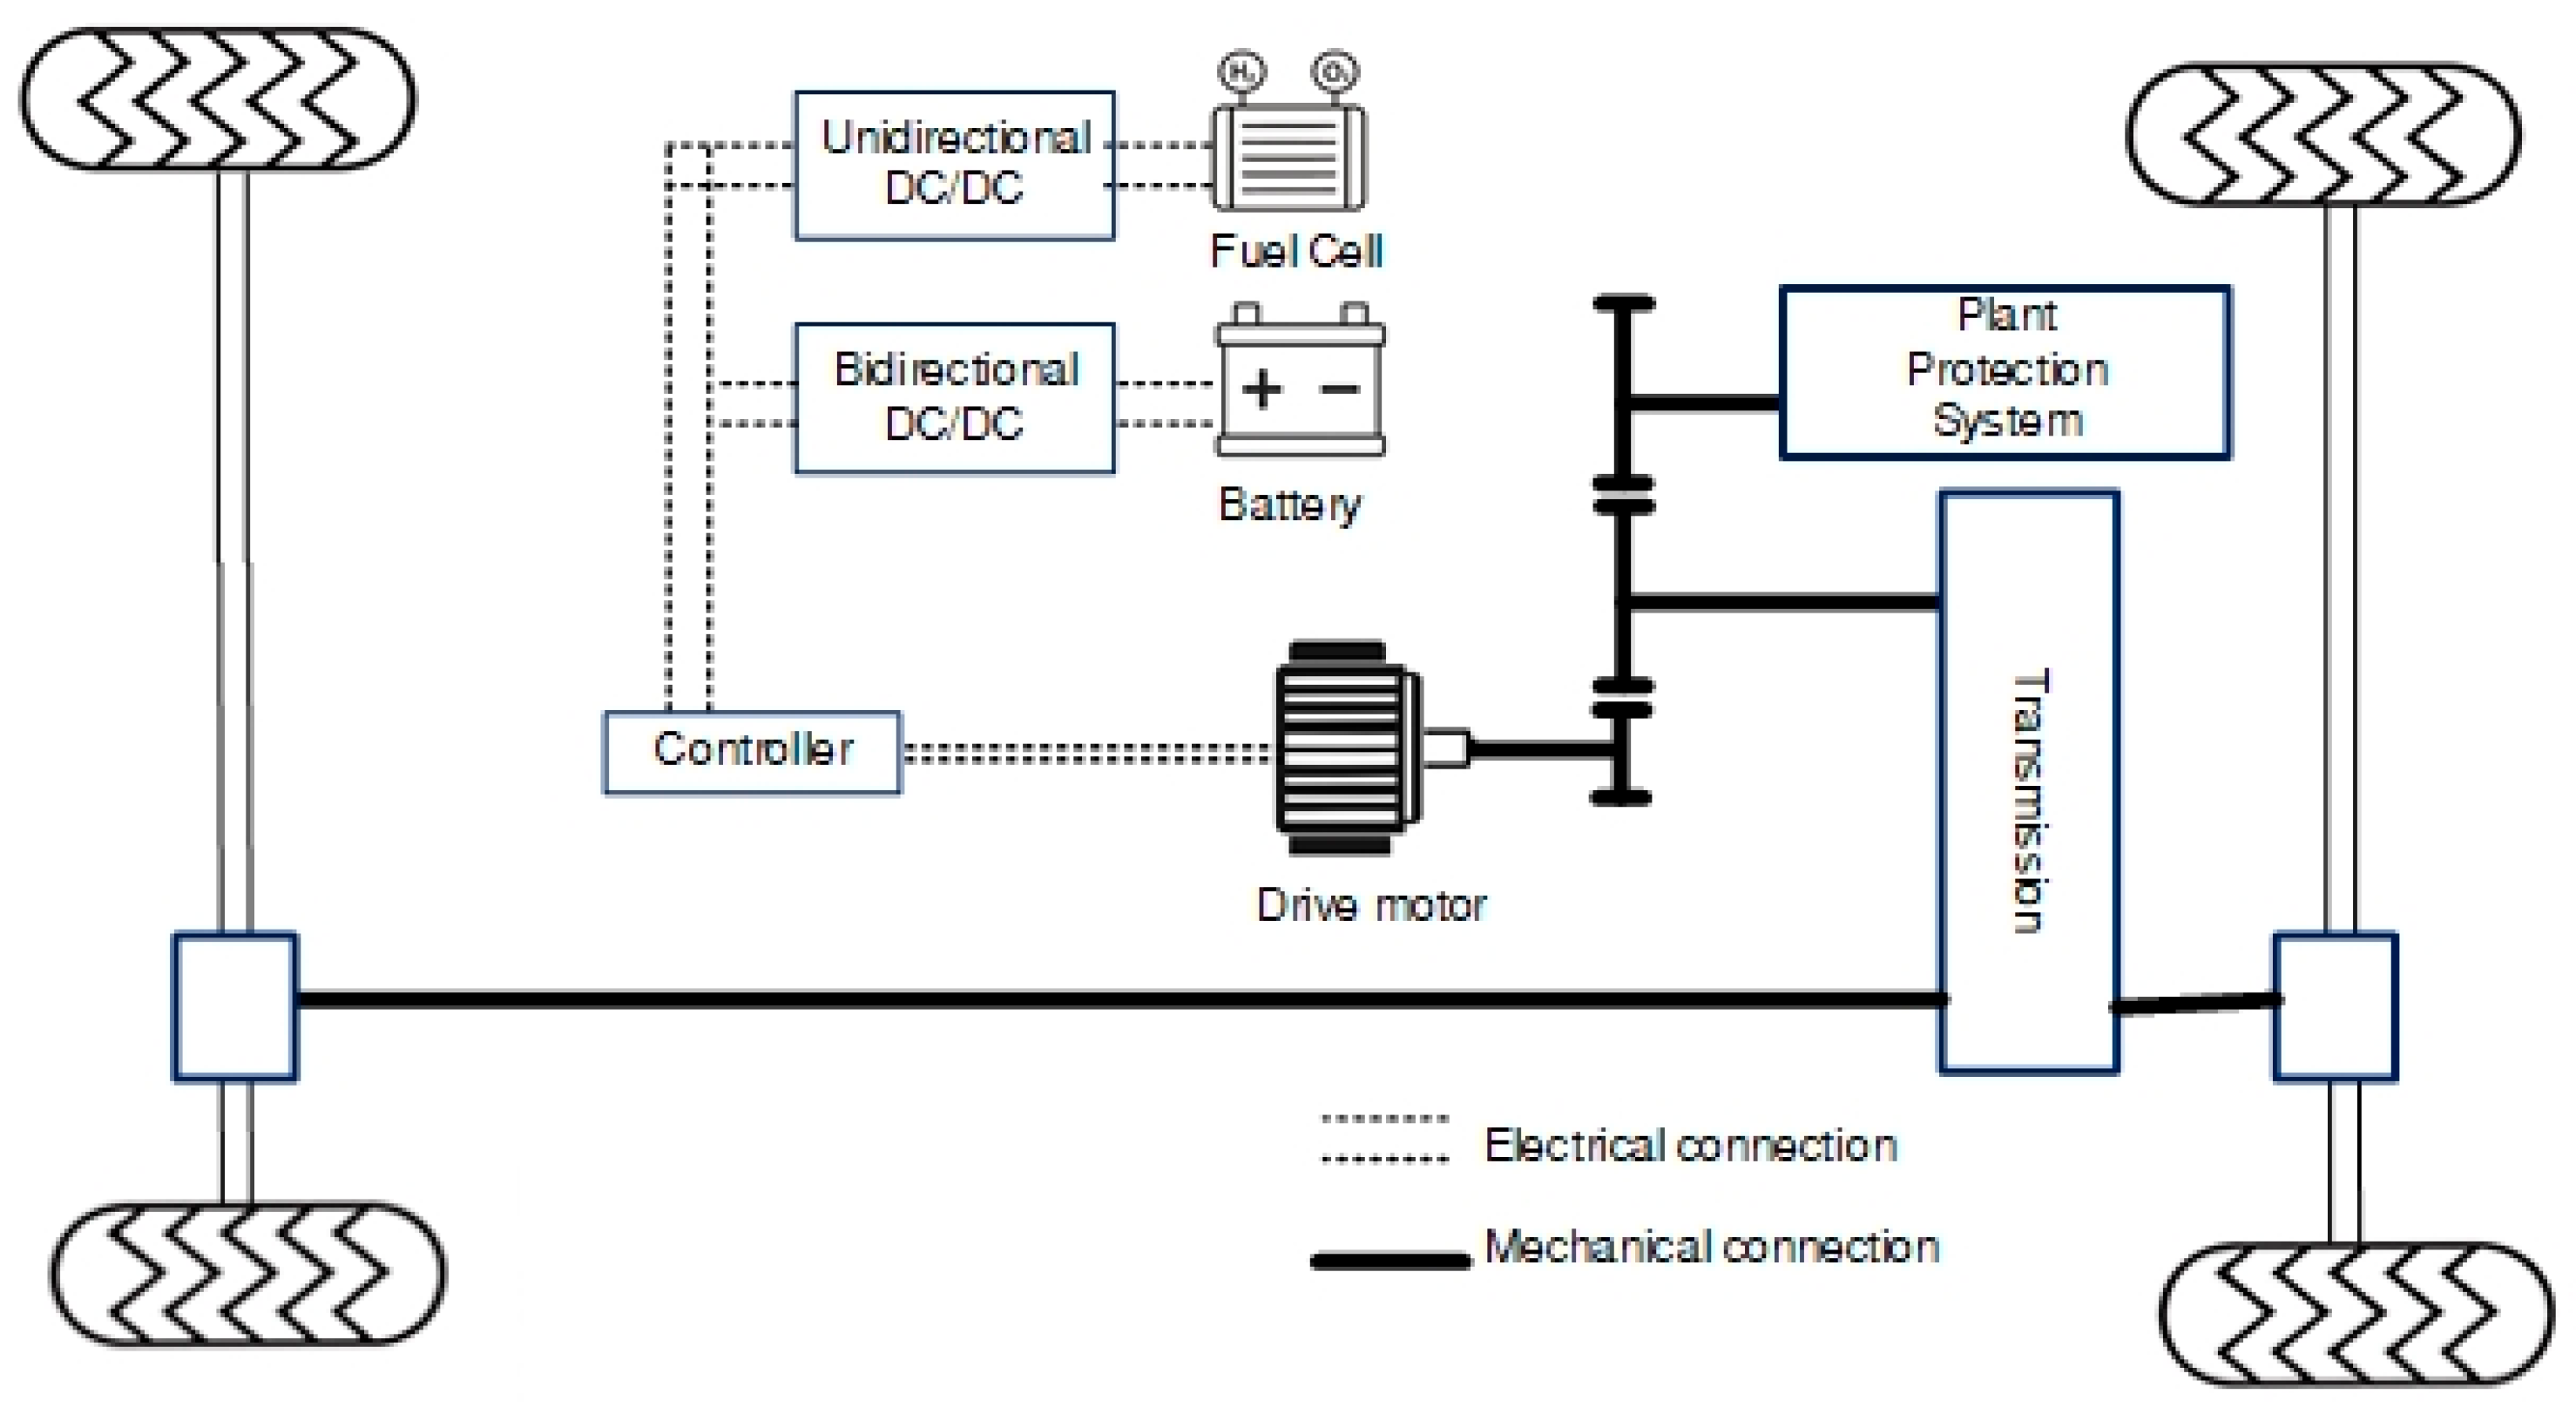
This study uses a hydrogen power system combining fuel cells and batteries, as shown in Figure 1. The energy sources are connected to the controller through DC/DC converters, which adjust the voltage of each energy source. The driving motor converts electrical energy into mechanical energy, which drives the transmission and plant protection system, enabling the machine to move and perform plant protection operations. The controller adjusts the duty cycle of the DC/DC converter according to the power demand of the load, thereby controlling the output of each energy source.

2.2. Power Demand for Plant Protection Machine Operations

2.2.1. Dynamic Modeling

The resistance during the operation of the self-propelled plant protection machine mainly includes rolling resistance, slope resistance, air resistance, acceleration resistance, and working device resistance. Its dynamic characteristics are closely related to the operating environment.
When applied to the operational conditions in flat farmland, the self-propelled plant protection machine mainly overcomes the rolling resistance caused by wheel tracks formed by the compression of the soil beneath the wheels during slow vehicle operation. Due to the slower working speed, other resistances are assumed to be negligible [21]. The calculation formula is as follows:
F f 1 = ( 3 Q ) 2 n + 2 2 n + 1 ( 3 n ) 2 n + 2 2 n + 1 ( n + 1 ) k 1 2 n + 1 D n + 1 2 n + 1 Q = 0.7 M b g 2
where F f 1 is the rolling resistance, N; Q is the vertical load on the driving wheel, N; D is the wheel diameter, m; k is the soil deformation modulus; n is the soil deformation index; M b represents the total mass of the hydrogen-powered self-propelled plant protection machine, kg; g represents gravitational acceleration, m/s2.
When applied in special environments, such as hilly and mountainous terrain, assume that the acceleration resistance is neglected. The calculation formula is as follows:
F i + F W + F f = m g sin θ + ρ C d A v 2 2 + m g f
where F i is the slope resistance, N; θ is the slope angle; ρ is the air density; C d is the wind resistance coefficient; A is the windward area, m2; v is the travel speed, km/h.
When applied to the field transfer conditions on flat farmland roads, with the terrain being flat and the machine maintaining a constant speed, it is assumed that the slope resistance and acceleration resistance are neglected:
F f 2 + F w = m g f + ρ C d A v 2 2
where f is the rolling resistance coefficient.

2.2.2. Power Demand Analysis

Based on the previously established dynamic model and considering the actual operating conditions of the self-propelled plant protection machine, it is assumed that the machine operates in the field at a speed of 8 km/h, transfers in the field at 16 km/h, and climbs a 40° slope at 6 km/h. The corresponding powers P 1 , P 2 , and P 3 are obtained using Equation (4).
P = F v 3600 η
The walking power of the self-propelled plant protection machine P d must meet:
P d > max ( P 1 , P 2 , P 3 )
The driving power of the self-propelled plant protection machine must also account for the power of the spraying system. The calculation formula is as follows:
P q = P d + P s p r i n k l e r
where P q , P d , and P s p r i n k l e r are the driving power, walking power, and spraying power, respectively, during the operation of the self-propelled plant protection machine, kW.

2.3. Operational Performance Evaluation Model

To achieve a quantitative assessment of the operational performance of the plant protection machine, this study introduces three key indicators: power stability, response speed, and spatial adaptability, and establishes a direct relationship between the power system parameters and operational characteristics. The calculation formula is as follows:
T r = max ( T r 1 , T r 2 ) Δ l = H a c t H min K s = 1 Δ P max P s p r i n k l e r
where K S represents the power stability degree of the power system, reflecting the system’s ability to maintain a stable power output under load changes or external disturbances; Δ P max and P s p r i n k l e r represent the maximum power fluctuation and the power required for spraying operations, kW; T r is the power system response time, reflecting the system’s ability to adapt to load changes and operation mode switching; T r 1 and T r 2 represent the power peak response time and climbing response time, s; Δ l is the spatial adaptability, reflecting the ability to adapt in different operating environments; H a c t and H min represent the actual ground clearance and the minimum ground clearance of the self-propelled plant protection machine, m.

3. Design of Optimization Methods

3.1. Design of the Objective Function

In the optimization of the hybrid power system for hydrogen-powered self-propelled plant protection machines, there is a conflict between the cost function and the volume of the energy system. Reducing costs may limit component selection, leading to an increase in the system volume, which affects the maneuverability and operational efficiency, while optimizing the volume may increase costs. Therefore, balancing cost and volume is crucial, especially in complex terrain, where both factors must be considered to ensure the optimal balance between economy and operational efficiency, which is as follows:
f ( x ) = min ( C t o t a l ) g ( x ) = min ( V t o t a l )
where f ( x ) and g ( x ) are the economic performance objective function and the spatial efficiency objective function of the hybrid power system, respectively.
Among them, the total lifecycle cost function of the energy system of the hydrogen-powered self-propelled plant protection machine [13], which includes the corresponding acquisition cost, replacement cost, and hydrogen consumption cost during the operational condition cycle.
C t o t a l = C 1 + C 2 + C 3
where C t o t a l , C 1 , C 2 , and C 3 represent the total lifecycle cost function, acquisition cost, replacement cost, and hydrogen consumption cost, respectively.
  • Acquisition cost:
The acquisition cost is shown in Equation (10) [22].
C 1 = f f , p n f P f + f b , p n b P b = f f , p n f P f + f b , c n b C b
where f f , p , f b , p , and f b , c represent the unit power price of the fuel cell, unit power price of the battery, and unit capacity price of the battery, RMB/kW; P b and P f are the rated power of the battery unit and fuel cell unit, kW; n b and n f are the number of battery units and fuel cell units, respectively; C b is the rated capacity of the battery unit, kW/h.
  • Replacement cost:
The replacement cost is shown in Equation (11) [23,24].
C 2 = q f f f , p n f p f + q b ( f b , p n b p b + f b , c n b C b )
where q f and q b represent the replacement cycles of the fuel cell and the battery, respectively.
  • Hydrogen consumption cost:
The hydrogen consumption cost is shown in Equation (12) [21,22,23].
C 3 = α h 2 m h 2
where α h 2 is the price of hydrogen consumption per unit, RMB/g; m h 2 is the equivalent hydrogen mass consumed by the hybrid power system, g.
Among them, the volume of the energy system of the hydrogen-powered self-propelled plant protection machine is shown in Equation (13):
V t o t a l = 𝜕 f ( n f c ) v f c n f c + 𝜕 b ( n b ) n b v b + v tan k m h 2
where 𝜕 f ( n f c ) and 𝜕 b ( n b ) are proportional constants (functions) that reflect the ratio between the unit quantity and the system; v f c and v b represent the volume of the fuel cell unit and the volume of the battery unit, m3; v tan k represents the volume of the hydrogen storage tank, m3.

3.2. Determination of Optimization Variables

After determining the structural design of the hybrid power system, the next step is to determine the series connection number of the fuel cell stack and the series and parallel connection numbers of the battery pack ( n b s and n b p ). Based on this, the task of parameter optimization for the hybrid power system is to adjust various system parameters to find a set of variable combinations ( X = [ n f c , n b s , n b p ] ) that can optimize the overall performance index, ensuring that the system meets the performance requirements, spatial adaptability, and low cost.

3.3. Constraints

During the system design process, to ensure that the self-propelled plant protection machine has sufficient driving power during operation, its energy system must meet the rated power requirements of the motor.
n f c P f η d f + n b s n b p P b _ max η d b P d η e m
where P f is the power of the fuel cell unit, in kW; η d f , η d b , and η e m represent the DC/DC efficiency of the fuel cell, the DC/DC efficiency of the battery, and the efficiency of the drive motor, respectively.
Throughout the entire continuous operation time, the energy provided by the power system should cover the total power consumption at each operating condition stage.
η d f η f η f τ P f c r a t e d d t + η d b η b n b e b P d d t
where η f τ is the ratio of the minimum power to the maximum power within the fuel cell’s lifespan, from the beginning to the end.
The number of batteries is closely related to the charging and discharging frequency. Too many batteries may increase the complexity of charge/discharge management and even affect the overall efficiency. Therefore, the following constraints can be established:
n f c C f + n b C b C max
where C f , C b , and C max represent the charge/discharge frequency of a single fuel cell, the charge/discharge frequency of the battery, and the maximum charge/discharge frequency the system can withstand, in cycles per hour.
The operating state of the fuel cell will be affected by control load disturbances, and constraints need to be applied to its power rate of change [25,26]. The details are as follows:
d P f c d t Δ P f c max
where Δ P f c max is the maximum allowable power variation rate of the fuel cell per unit time, kW/s.
To ensure system stability and battery lifespan, reasonable operating ranges must be set and controlled for the state of charge (SOC), voltage, and C-rate of the battery.
S b , l S b S b , u C b C b m U b , l U b U b , u
where S , e , C , and U represent the state of charge (SOC) value, capacity, C-rate, and voltage, with the subscript b indicating the battery. The subscripts l and u represent the lower and upper limits, respectively. C b m is the maximum charge/discharge C-rate of the battery.

3.4. Optimization Algorithm Design

Considering the comprehensive demands for convergence, solution set diversity, and computational efficiency in multi-objective optimization problems, mainstream algorithms, such as the Strength Pareto Evolutionary Algorithm (SPEA), Particle Swarm Optimization (PSO), and Non-dominated Sorting Genetic Algorithm (NSGA), all have limitations to varying degrees [16,17,18]. In contrast, the Multi-Objective Particle Swarm Optimization (MOPSO) algorithm combines the efficient search capabilities of particle swarm optimization with a multi-objective optimization framework. Through external archiving and crowding distance strategies, it ensures the distribution of the solution set and demonstrates a better search efficiency and convergence speed in high-dimensional, continuous variable spaces, making it suitable for rapid-response engineering applications.
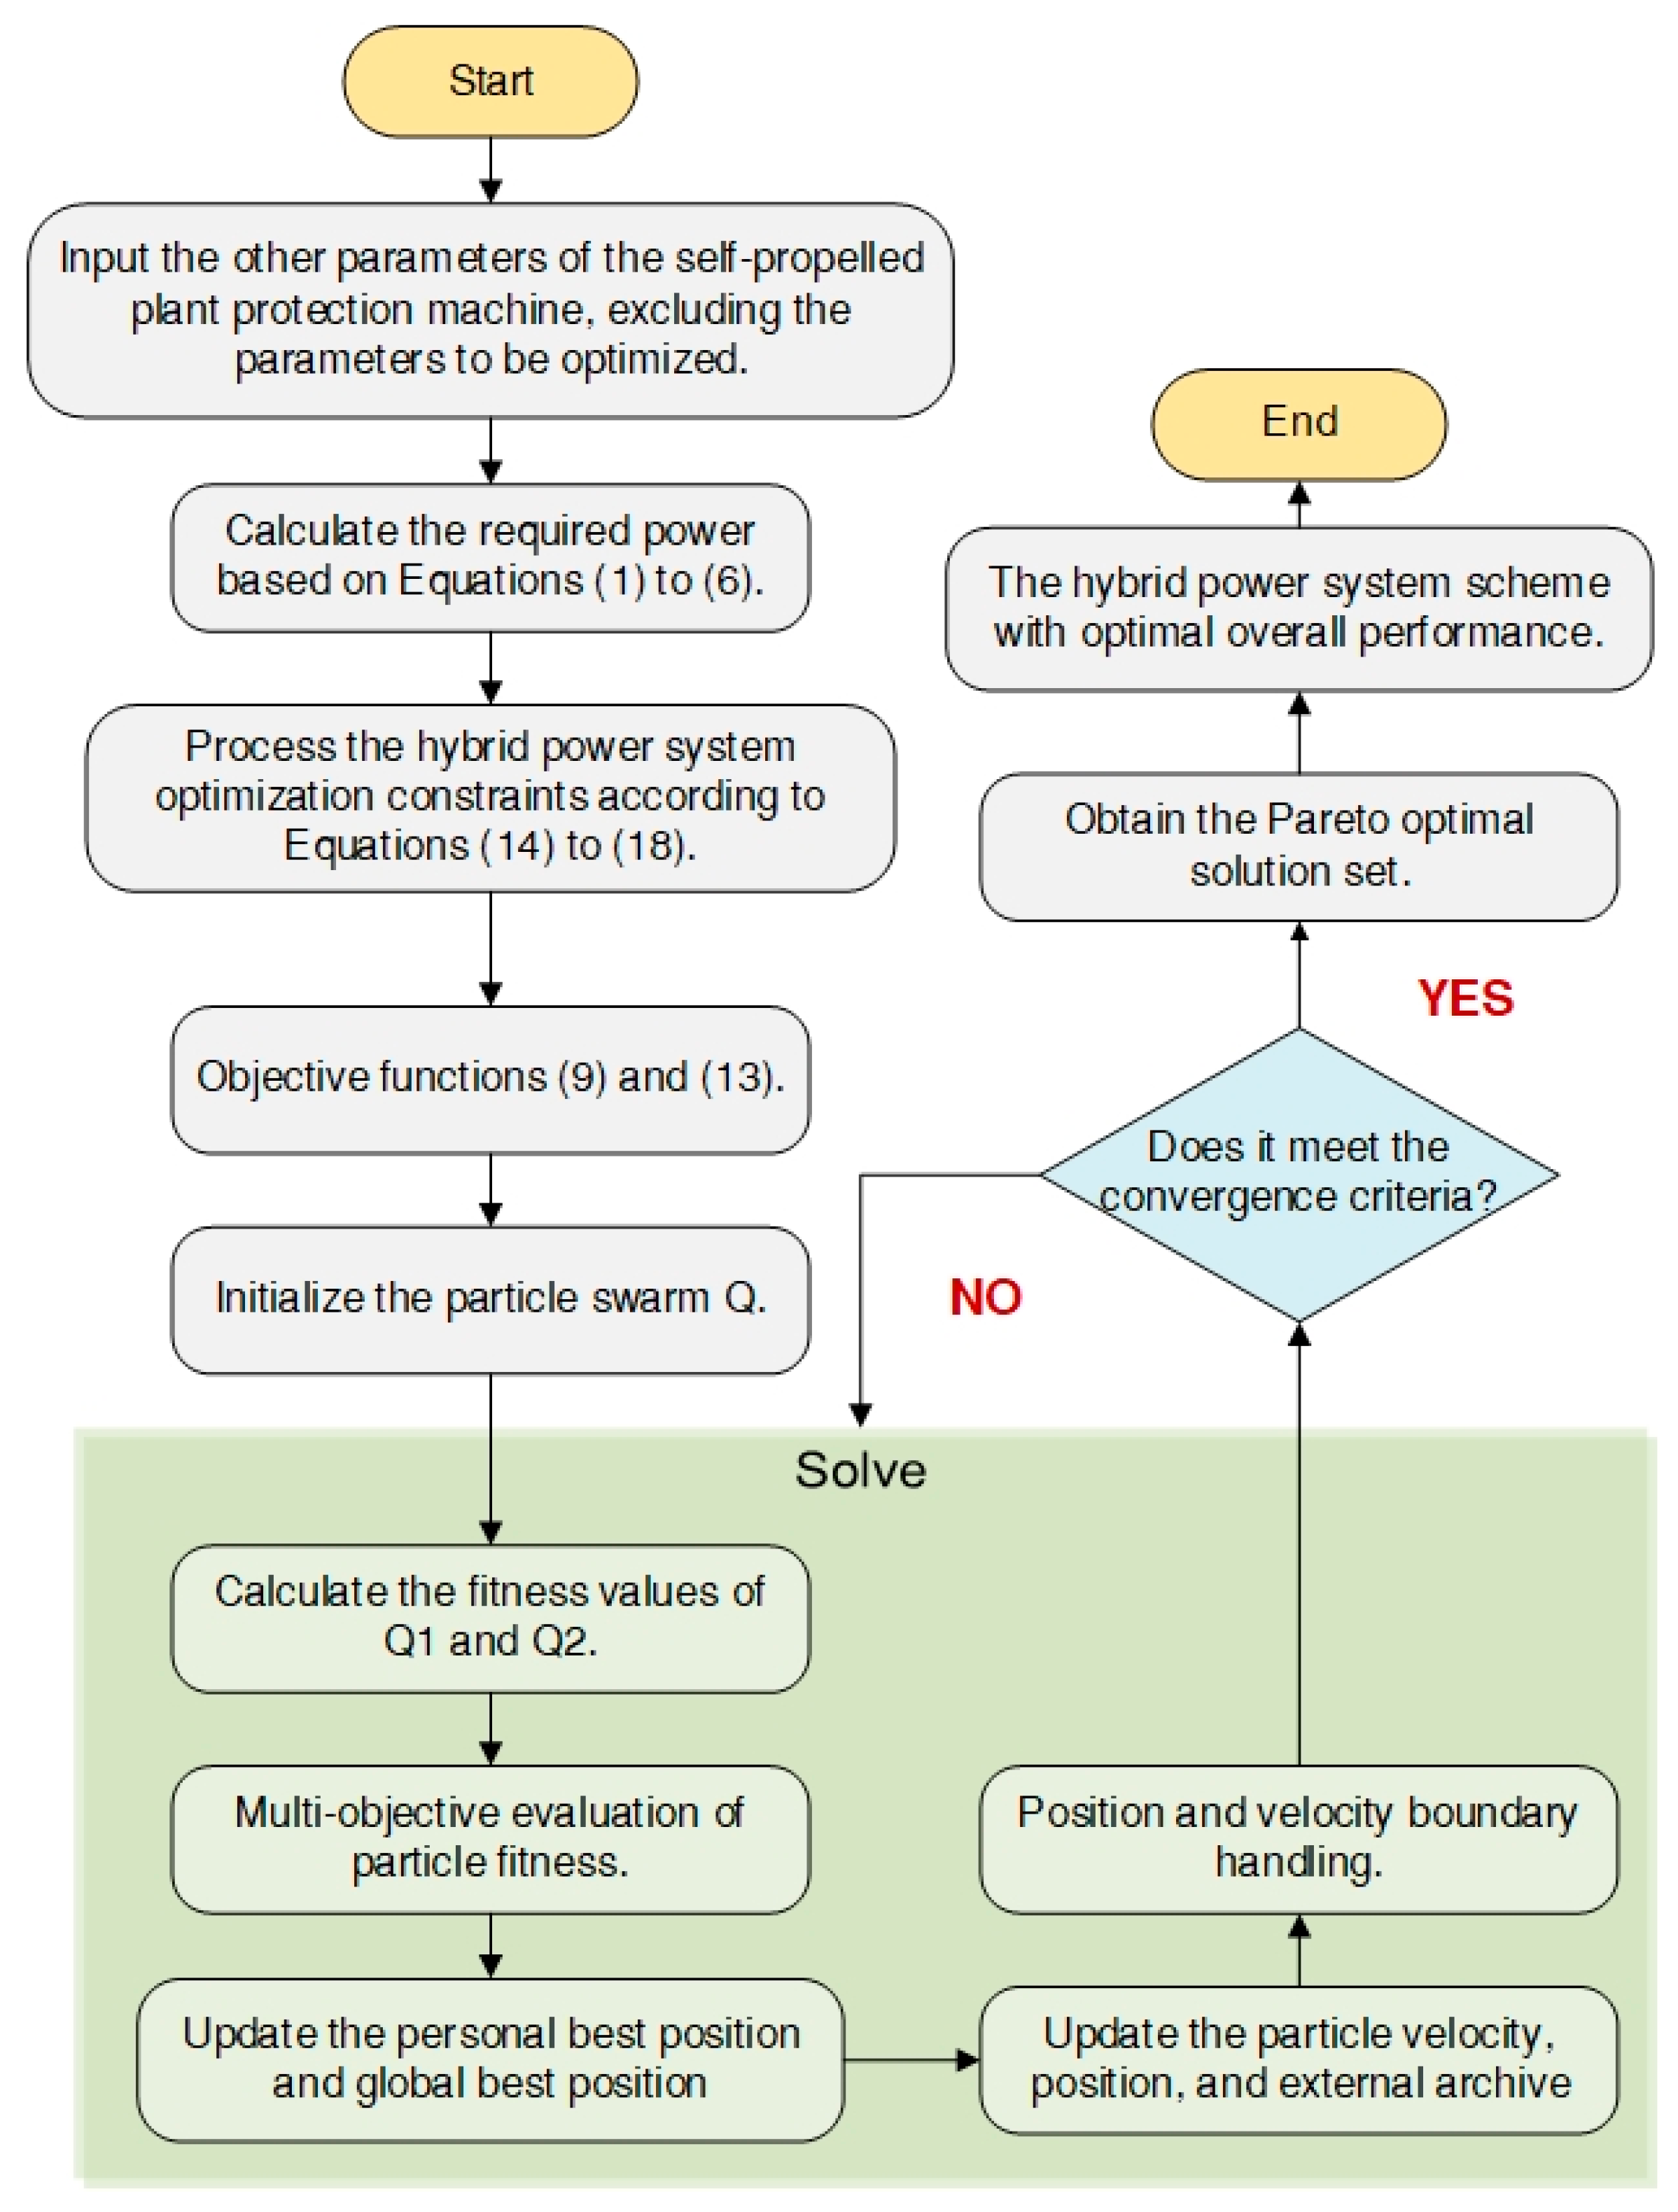
Based on the principles of the MOPSO algorithm and optimization objectives, the parameter optimization process for the self-propelled plant protection machine is established as shown in Figure 2, with the specific steps as follows [27,28,29,30].
  • Step (1):
Set the self-propelled plant protection machine’s power system parameters, constraints, and objective functions based on the content of Section 2.2, and introduce the MOPSO optimization algorithm.
  • Step (2):
Initialize the population RR, set the initial population size to 400, set the number of elements in the external archive to 50, set the inertia weight to 0.8, set both the individual learning factor and global learning factor to 3, set the maximum number of iterations to 700, and randomly generate the position and velocity information for each particle.
  • Step (3):
Calculate the fitness values of the two objective functions in Equation (10), and based on the Pareto dominance relationship, copy the non-dominated solutions from the population RR into the external archive.
  • Step (4):
Calculate the density information of the particles in the external archive within the search space, and use the roulette wheel selection method to choose the particles. The lower the particle density, the greater the probability of selection. The population searches for the optimal solution through the interaction of low-density and high-density particles.
  • Step (5):
Update the velocity and position of the particles, generate the next-generation population RR+1, and check if the boundary conditions are met or if the number of non-dominated solutions exceeds the capacity of the elite archive. If exceeded, remove individuals with a higher density based on the crowding distance.
  • Step (6):
Check if the number of iterations exceeds the maximum number of iterations. If exceeded, terminate the search; otherwise, return to step (2).

3.5. Analysis of the Optimization Results

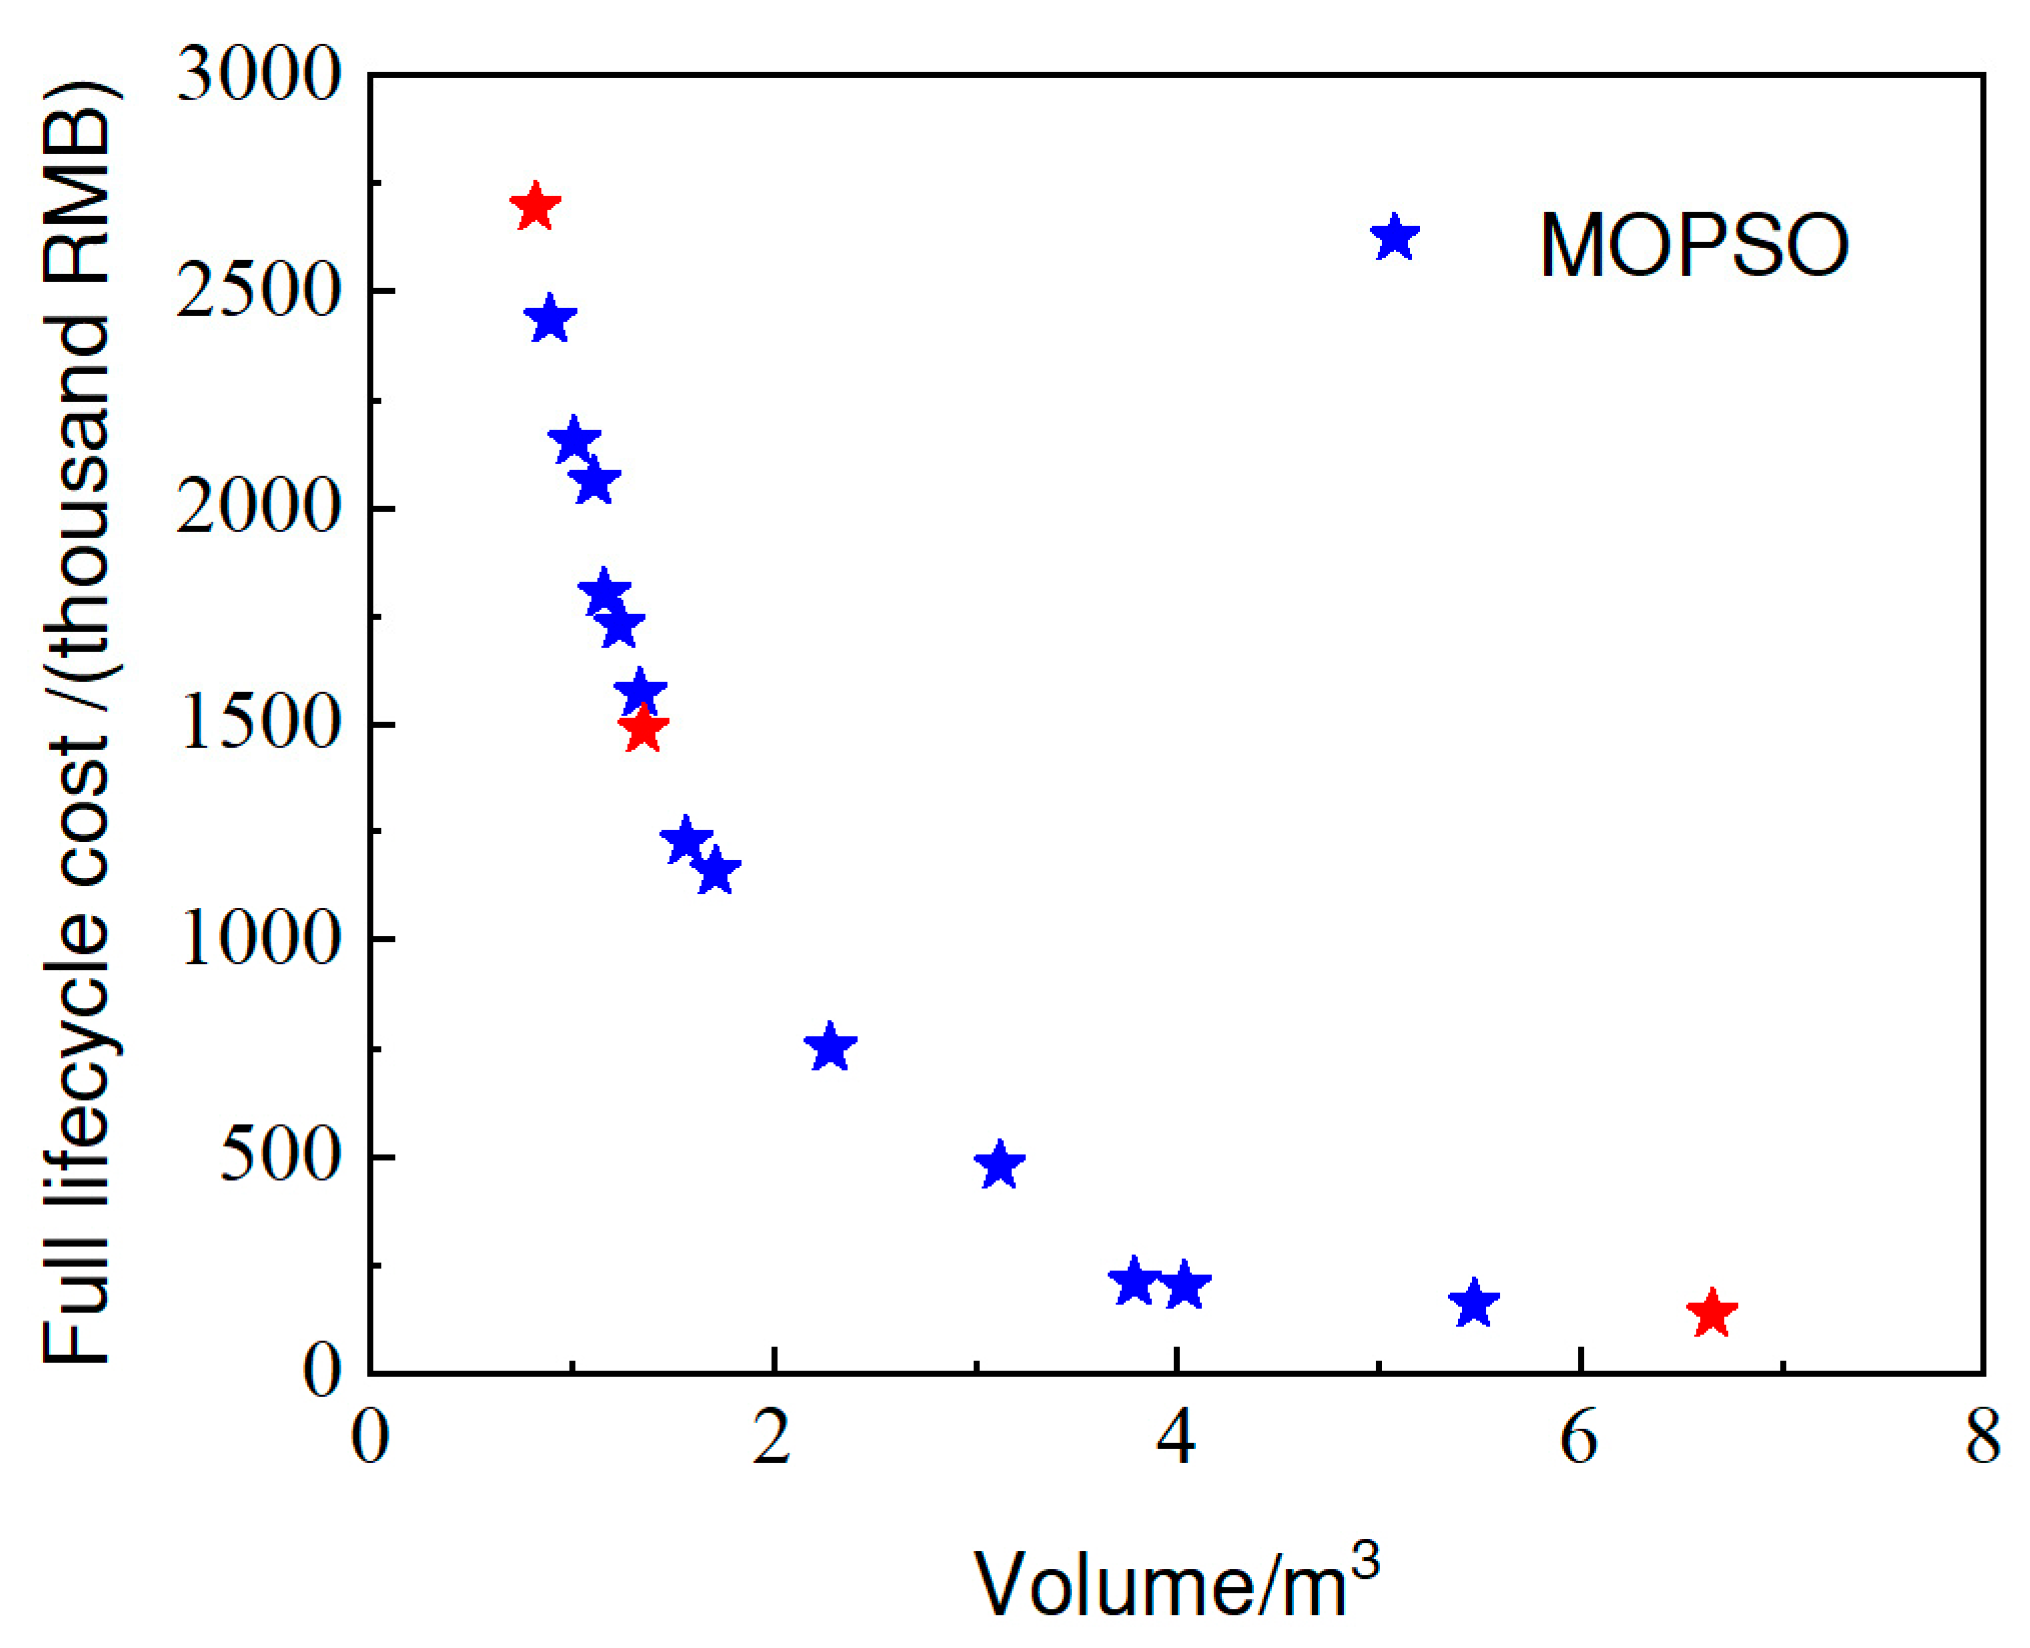
To verify the accuracy and fast response characteristics of the MOPSO optimization algorithm in the best configuration of the hydrogen-powered self-propelled plant protection machine’s hybrid power system, this study uses a single-objective optimization model based on the genetic algorithm (GA) and the energy system’s full lifecycle cost function as a control group. The resulting Pareto front is shown in Figure 3. As shown in Figure 3, the MOPSO algorithm can provide more solutions across a wider volume range, and these solutions demonstrate better optimization in terms of the expected lifecycle cost. As the volume increases, the cost gradually decreases, indicating that MOPSO can find a more ideal compromise solution between multiple objectives. This also reflects the MOPSO algorithm’s strong exploration ability in the solution space, allowing it to avoid local optima and obtain more diverse and effective optimization results. The recommended configuration of the self-propelled plant protection machine’s hybrid power system based on the Pareto front is shown in Table 1. The three red stars represent the three solutions corresponding to the minimum cost, minimum volume, and optimal solution respectively.

3.6. Sensitivity Analysis of Hydrogen Price on the Full Lifecycle Cost

To assess the market adaptability of the economic viability of hydrogen-powered plant protection machinery, this study conducts a sensitivity analysis of hydrogen prices based on the full lifecycle cost model (Equations (9)–(12)). The energy system configuration corresponding to the Multi-Objective Particle Swarm Optimization (MOPSO) algorithm was selected as the optimal design scheme, with its hydrogen consumption characteristics simultaneously adopted as the benchmark for system performance evaluation. The specific energy configuration scheme is shown in Table 2.

4. Simulation Experiment

4.1. Simulation Model Establishment

To verify whether the system configuration meets the design requirements of the self-propelled plant protection machine’s power system, this study used a specific model of the Dongfanghong self-propelled plant protection machine as the test subject and conducted online simulation experiments. The machine parameters are detailed in Table 3. Combining the content from Section 2.2 and Section 2.3, a hybrid power system model for the hydrogen-powered self-propelled plant protection machine was constructed on the Matlab/Simulink platform.

4.2. Working Condition Design

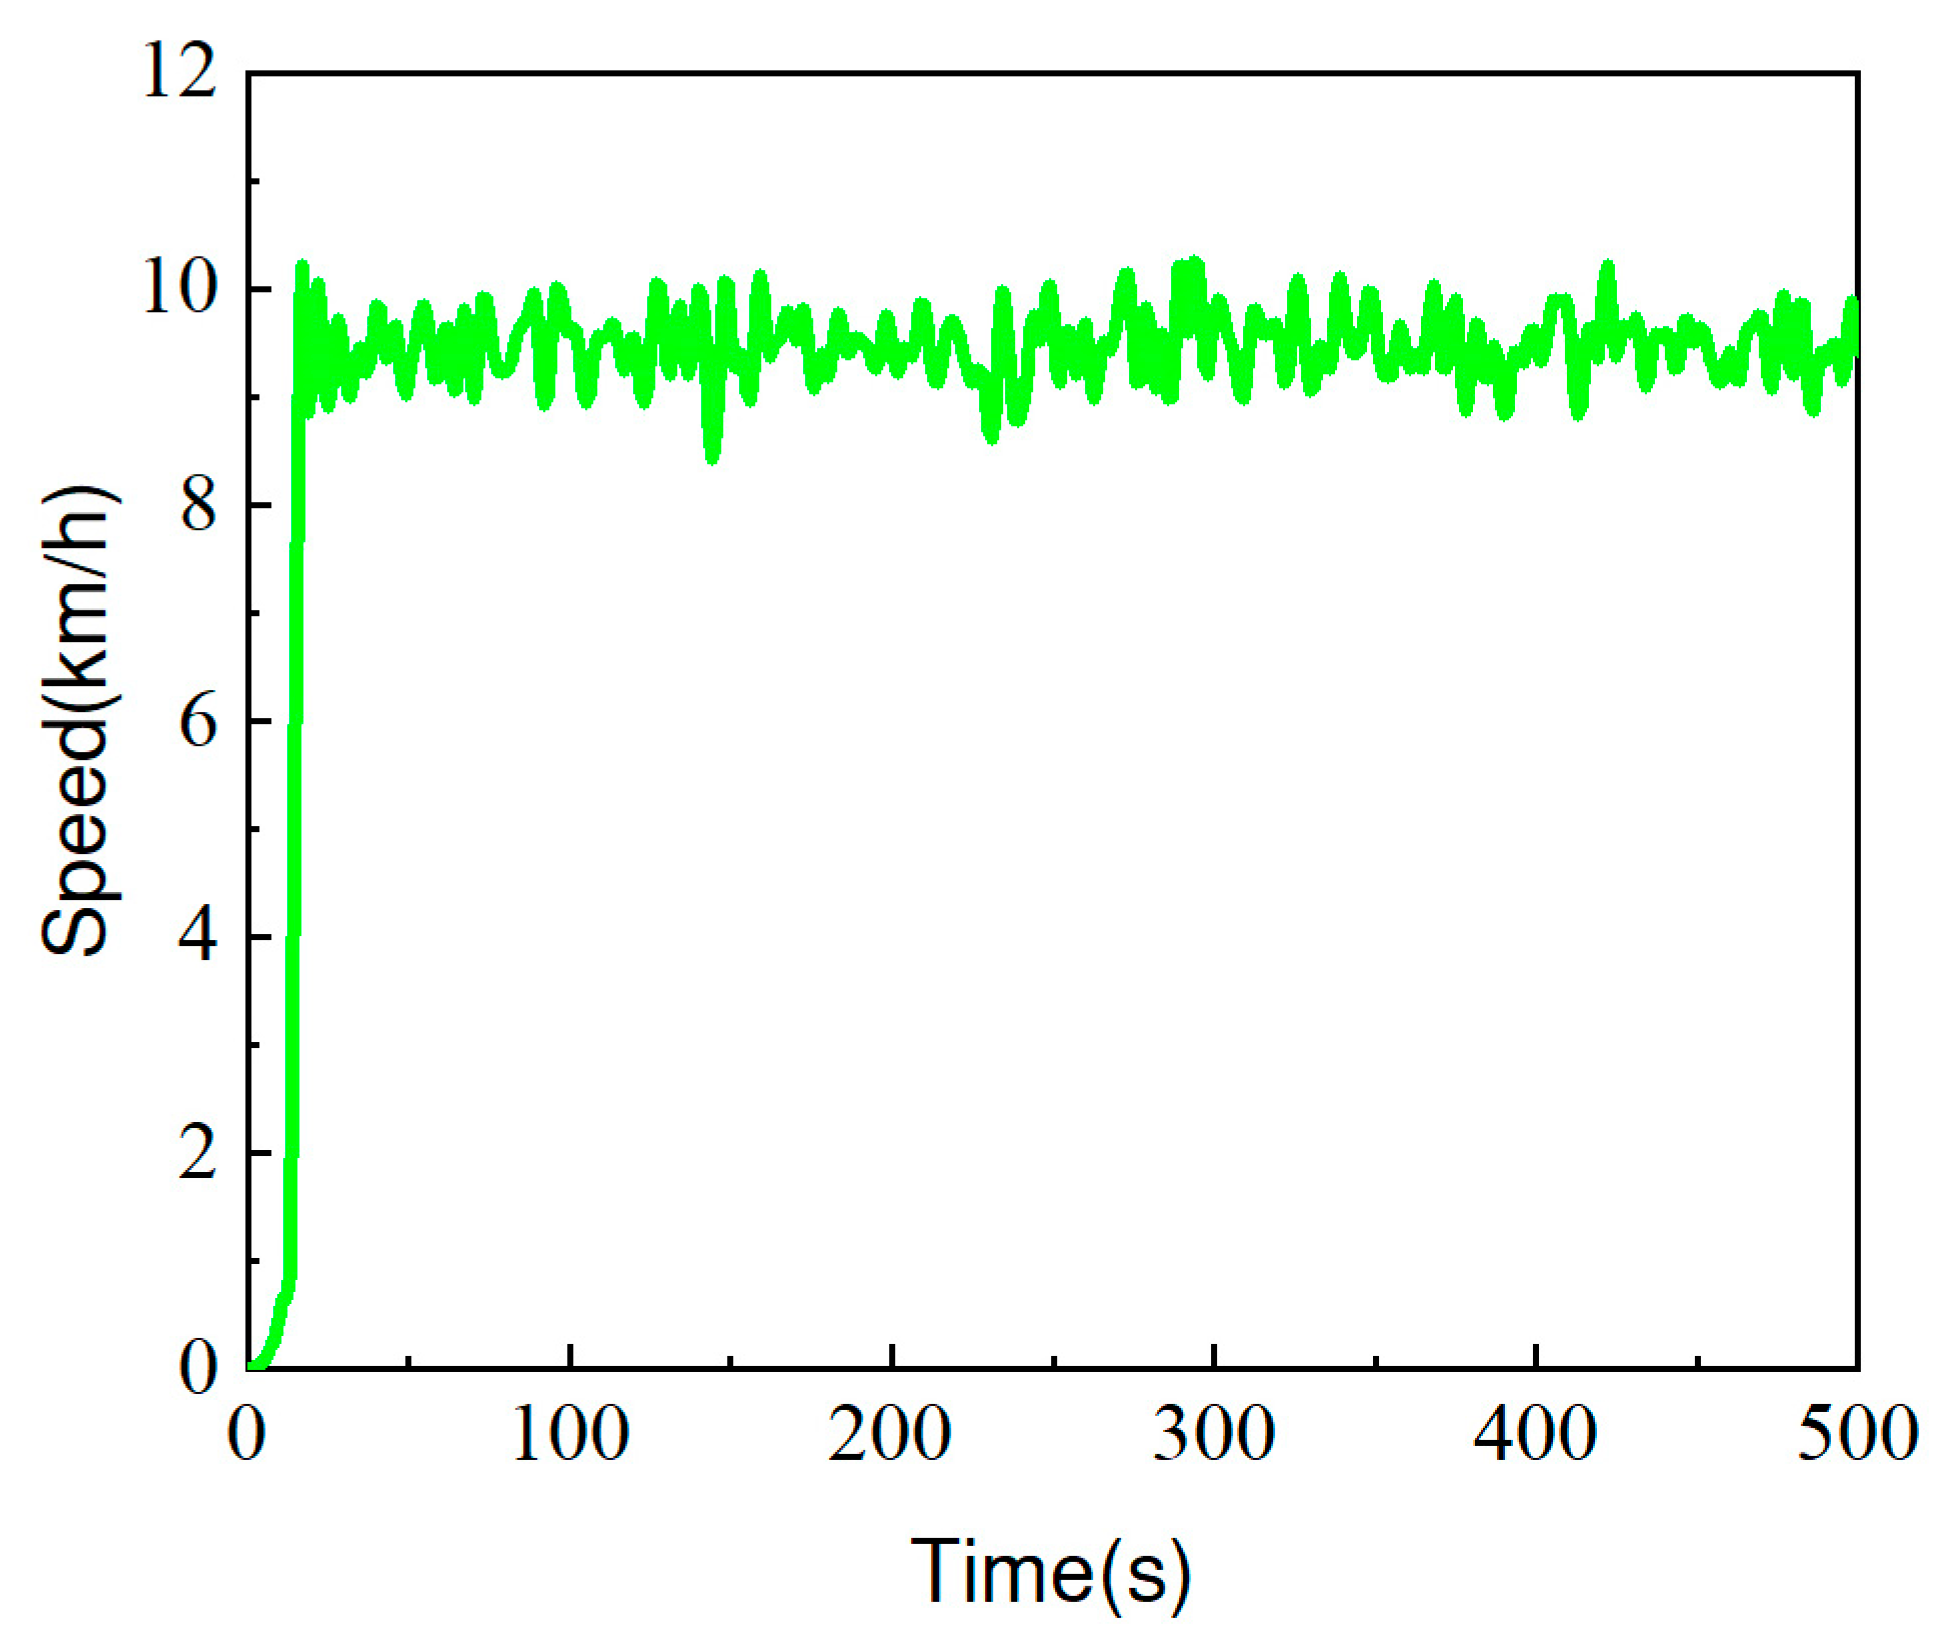
The plant protection working conditions designed in this study are based on the working condition data collected by the research group in previous studies. A typical farmland working scenario is simulated, combined with periodic load variations, to verify the engineering adaptability of the optimized solution under complex working conditions. The plant protection working conditions are shown in Figure 4.

4.3. Simulation Results Analysis

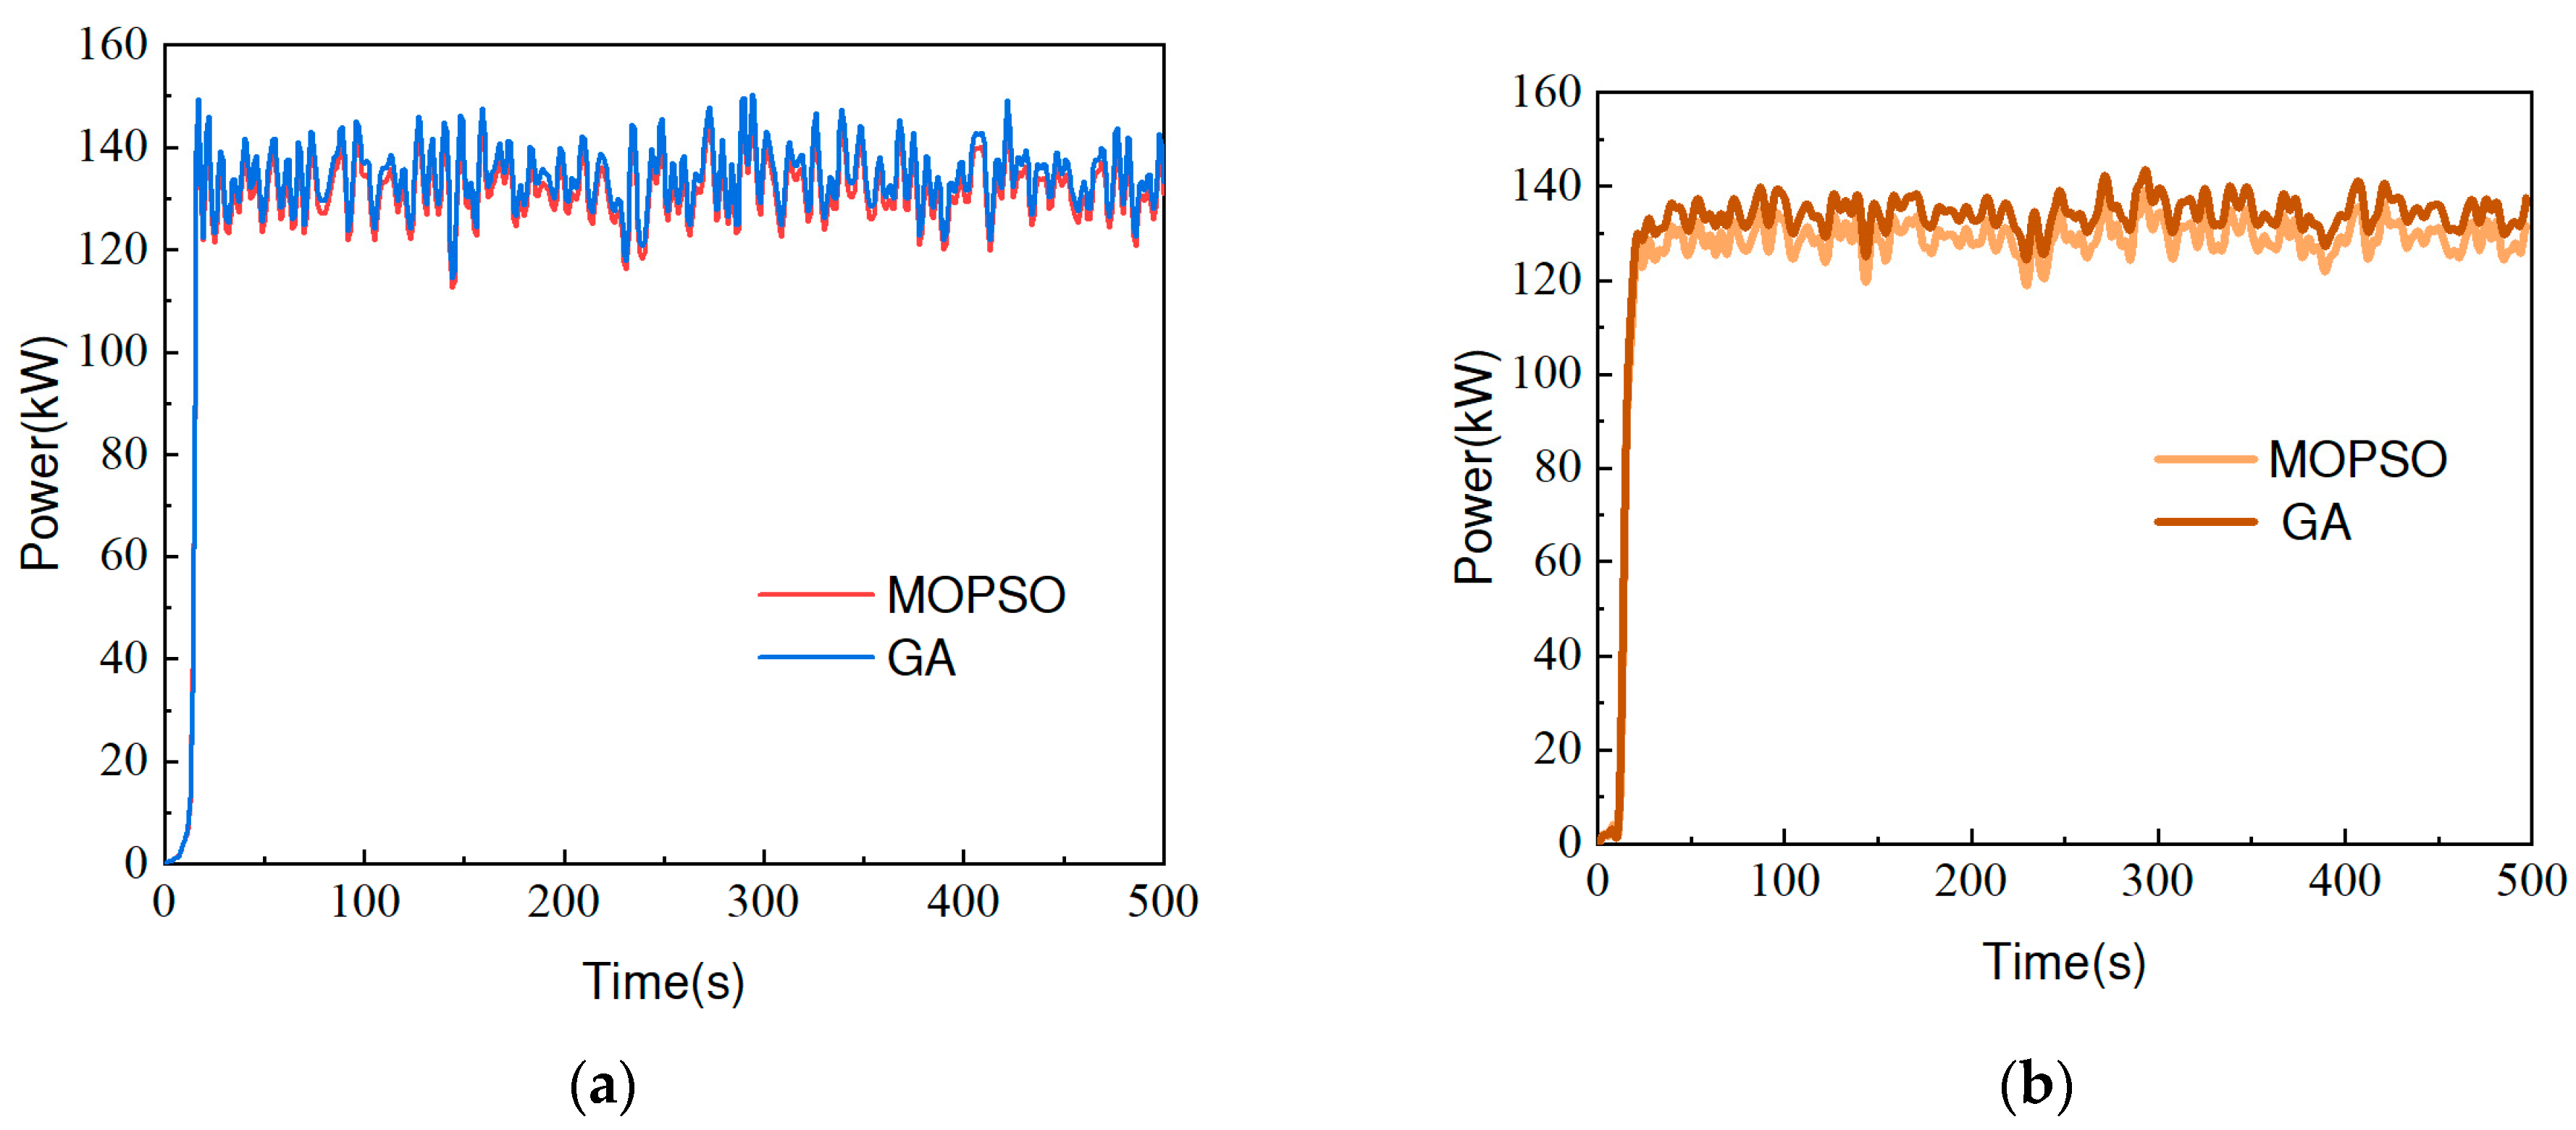
As shown in Figure 5, MOPSO and GA exhibit significant differences in power output characteristics. In Figure 5a, MOPSO can stably output 120–140 kW during periods of higher power demand, closely matching the target power, while GA fluctuates significantly and has a weaker synchronization capability. Figure 5b further shows that MOPSO’s power initially stabilizes between 120–140 kW, then maintains within the 125–135 kW range, with a rapid response and excellent regulation performance. In contrast, GA’s response is delayed, with a wider fluctuation range (117–145 kW) and lower overall operational efficiency.
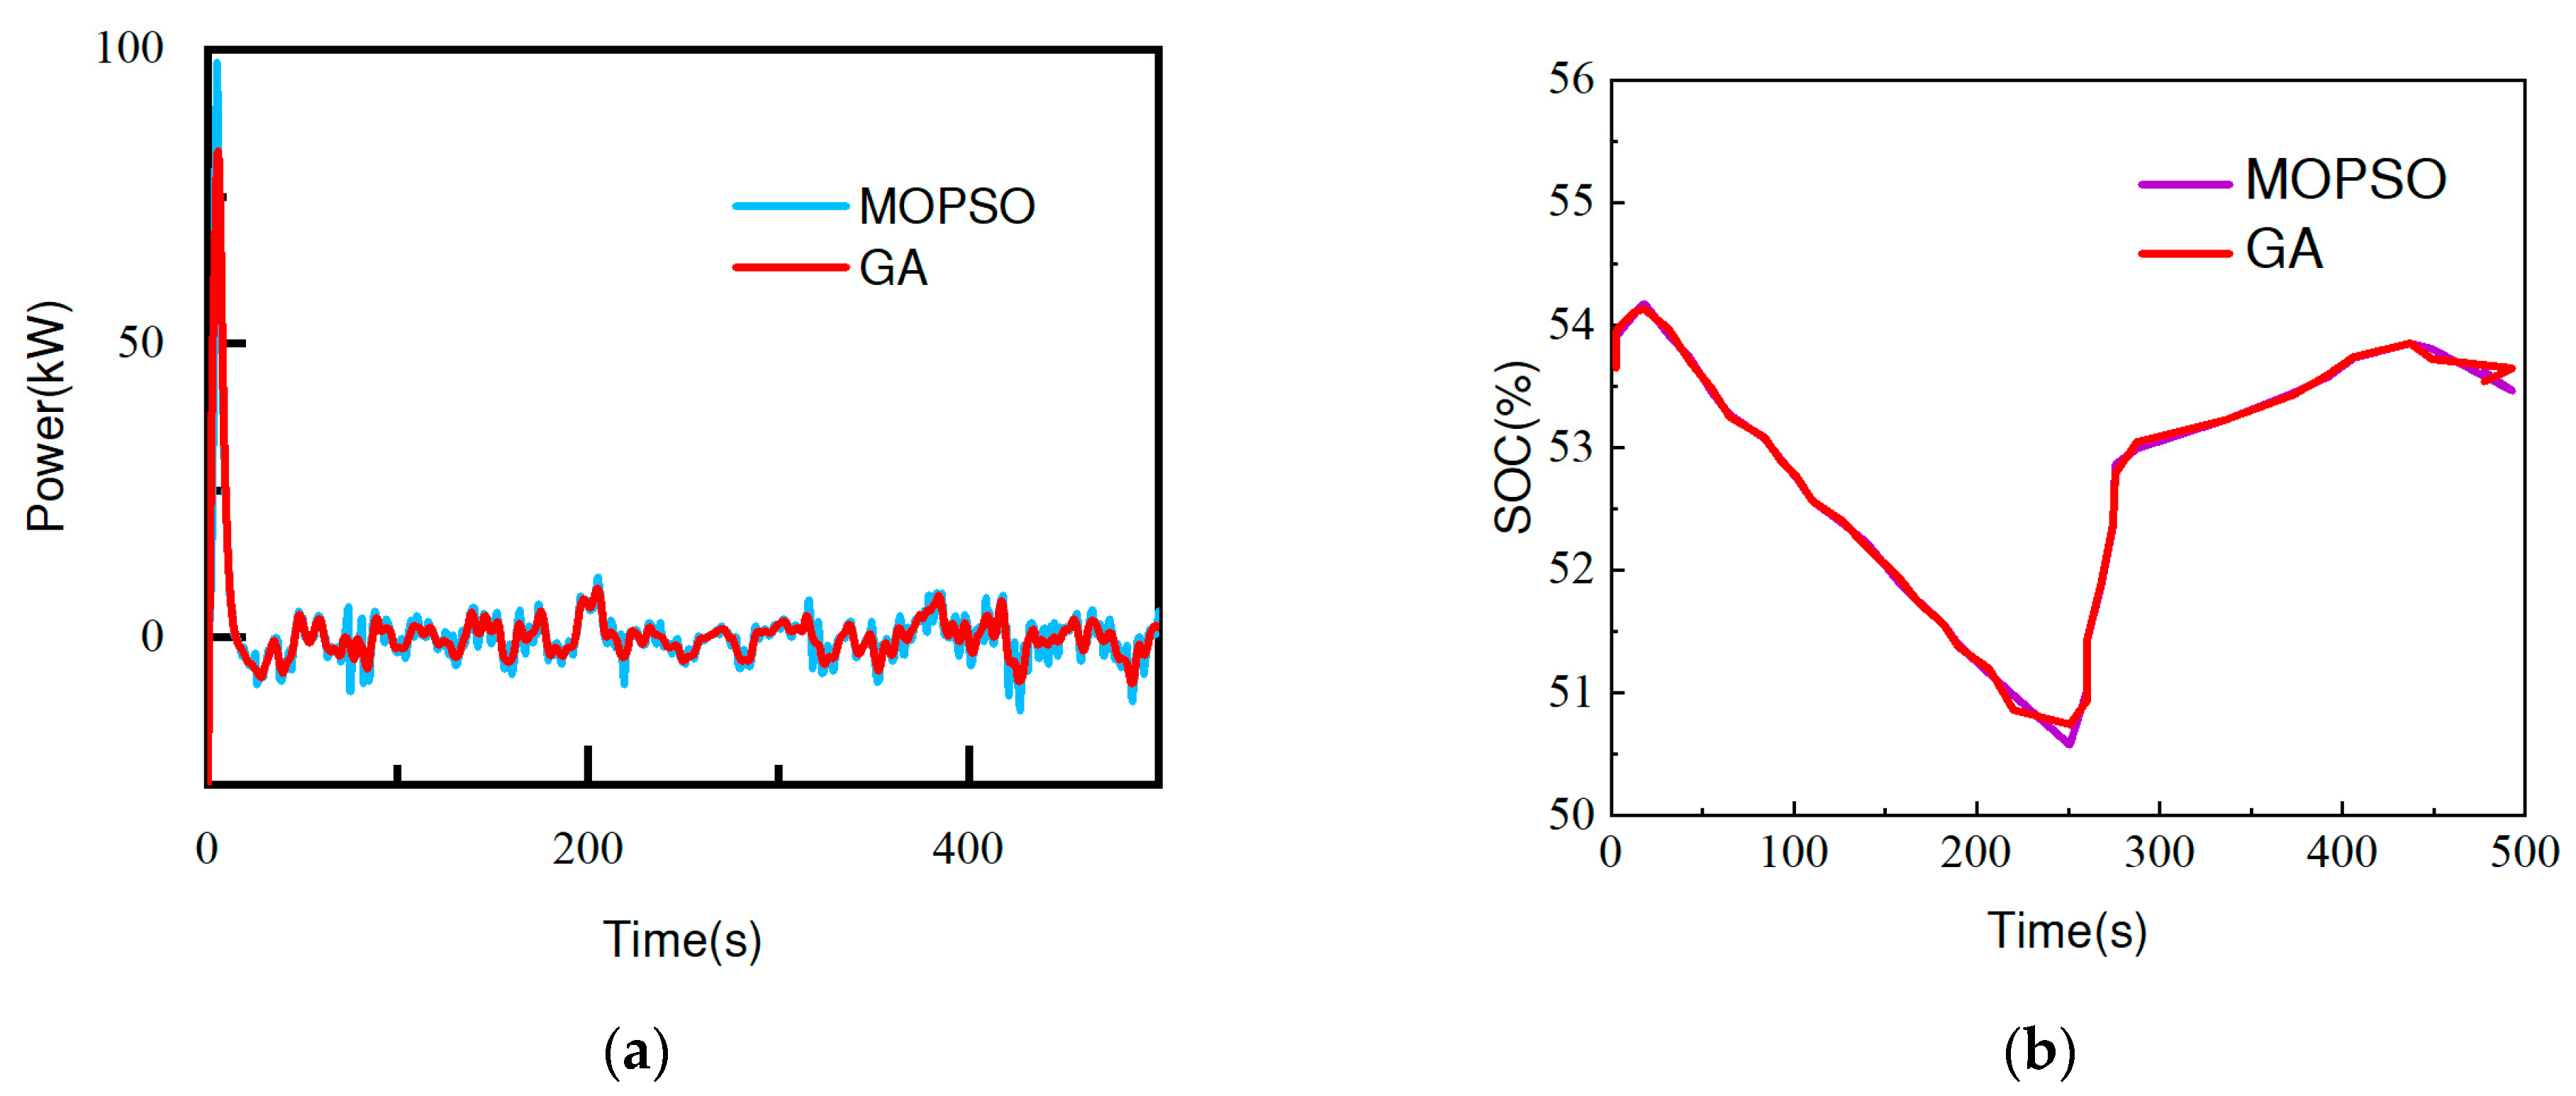
Figure 6 shows the variations in power, voltage, current, and SOC of the battery system in the hydrogen-powered self-propelled plant protection machine hybrid power system. MOPSO outperforms GA in controlling power (Figure 6a) and SOC (Figure 6b). MOPSO shows smaller power fluctuations, stronger voltage stability, smoother current regulation, and maintains stable SOC, while GA exhibits larger fluctuations during load changes. Overall, MOPSO optimizes system performance and extends battery life.
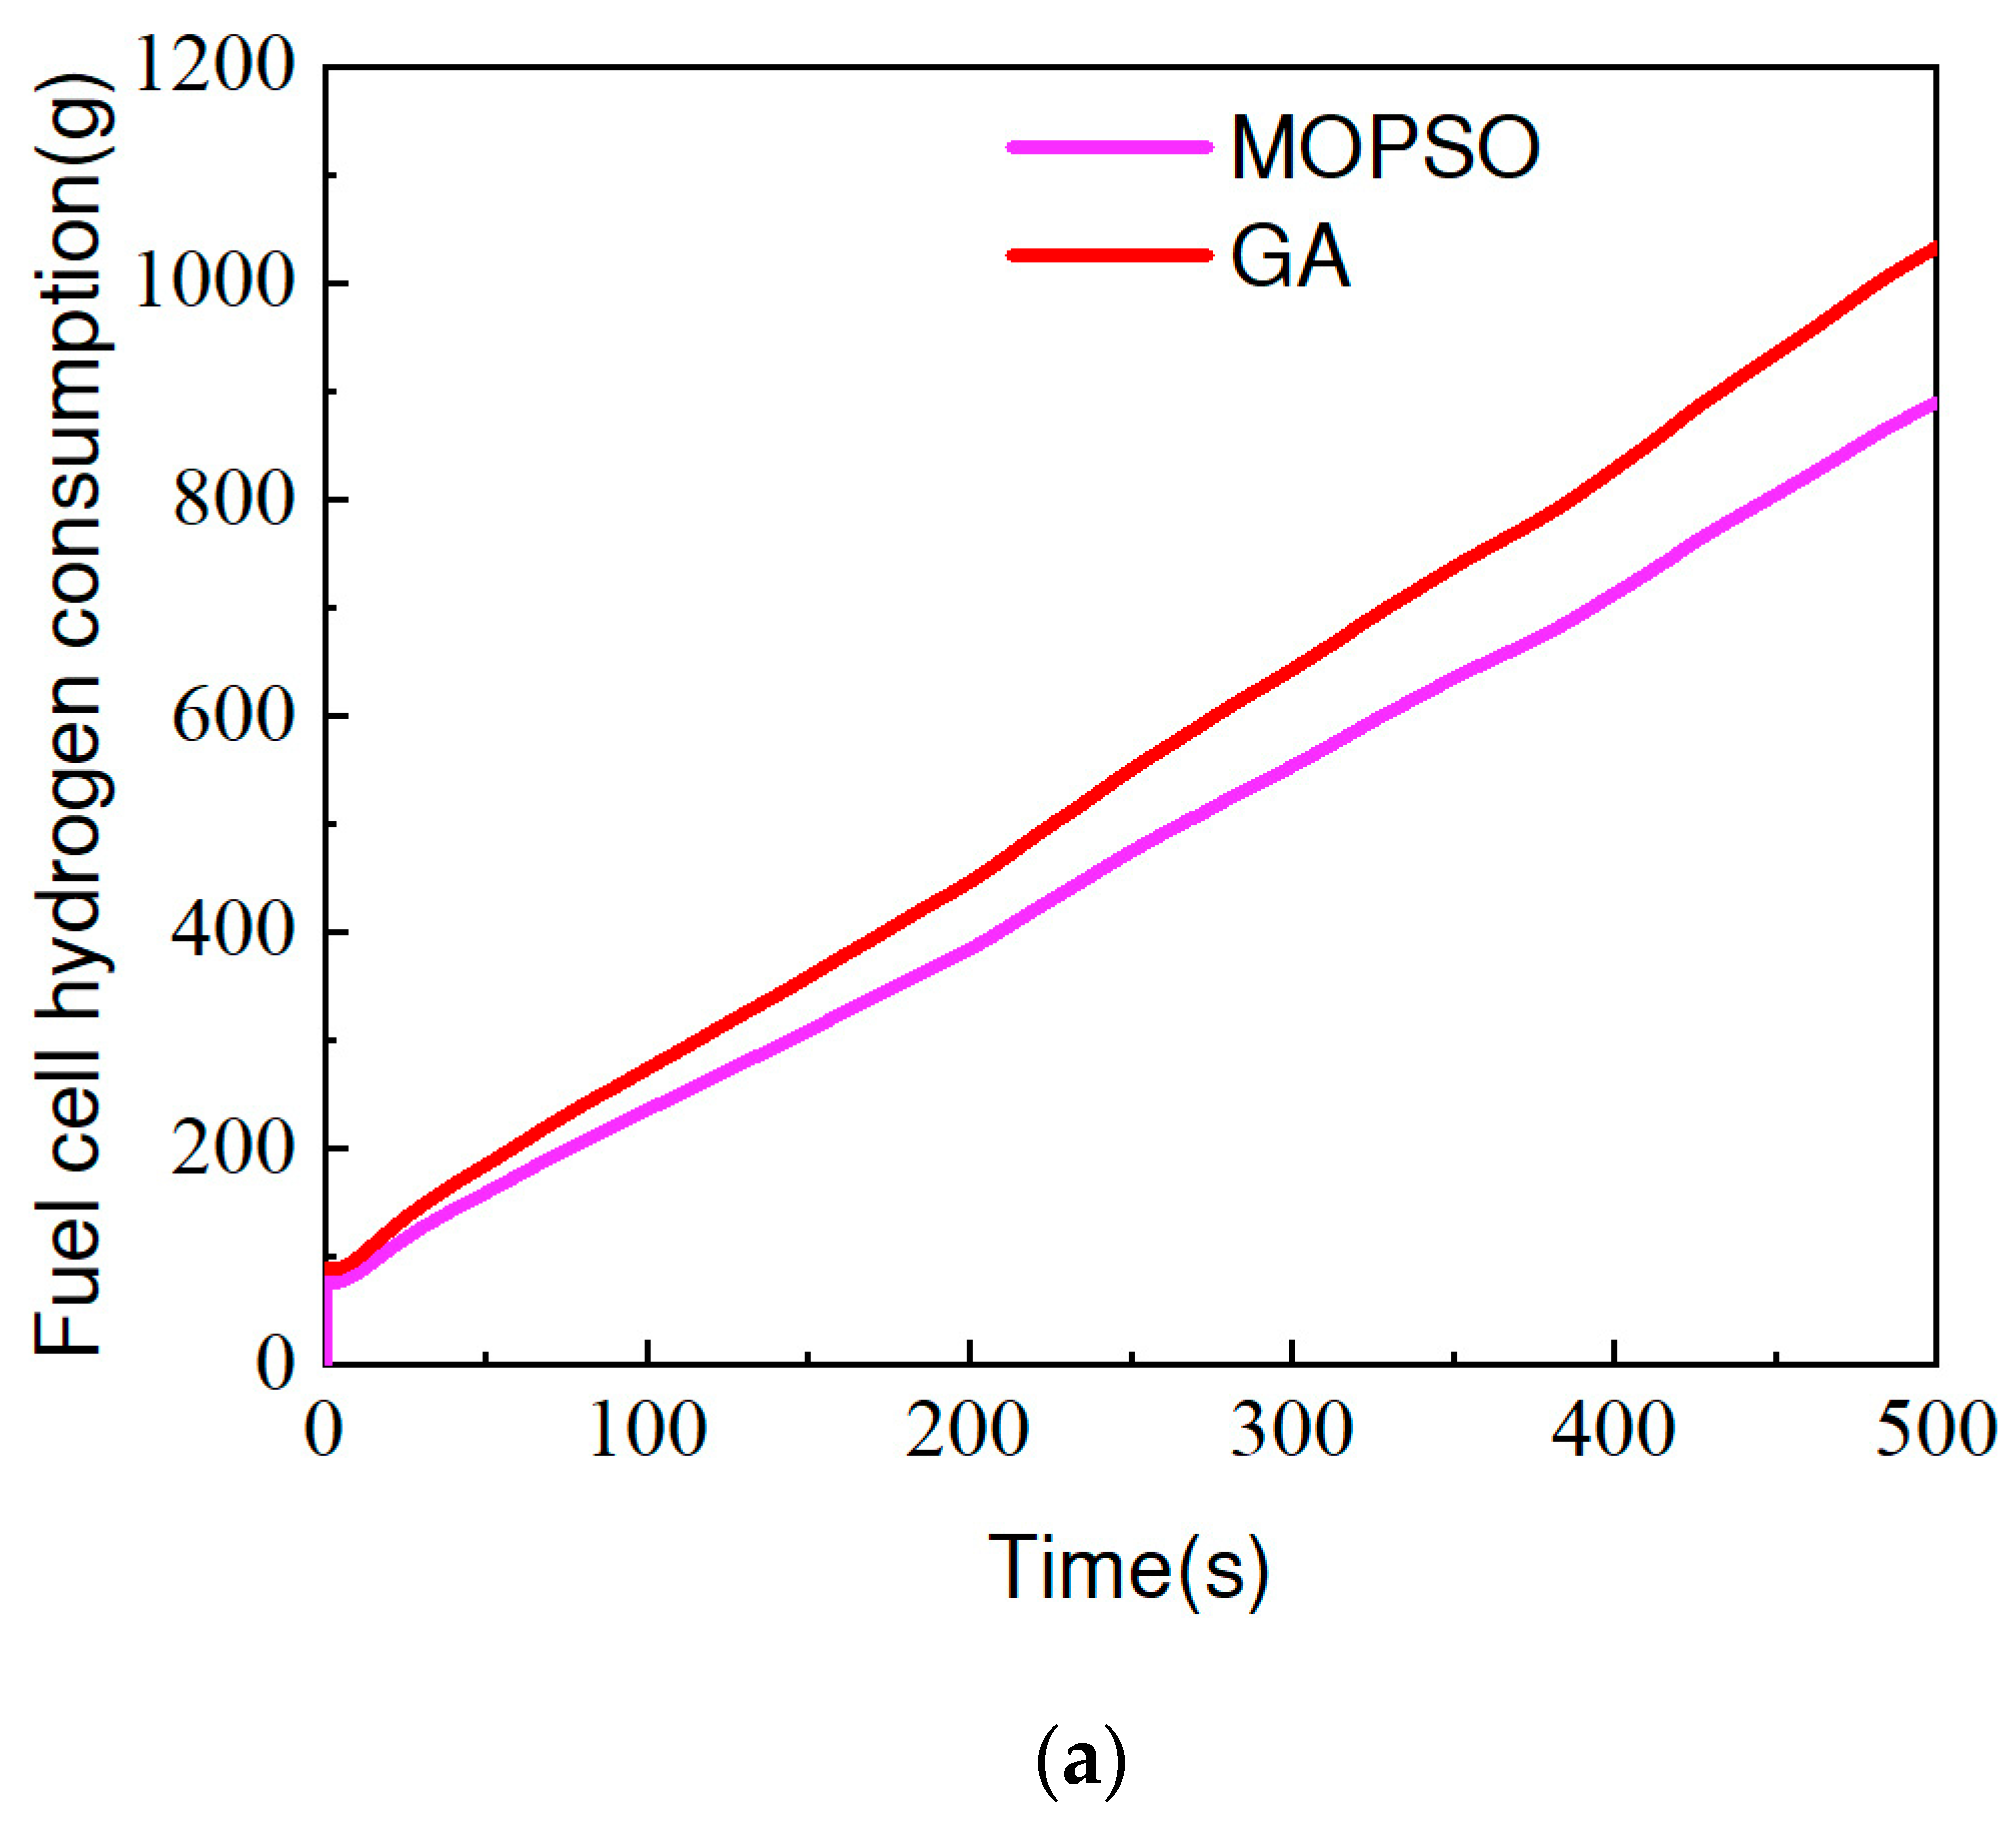
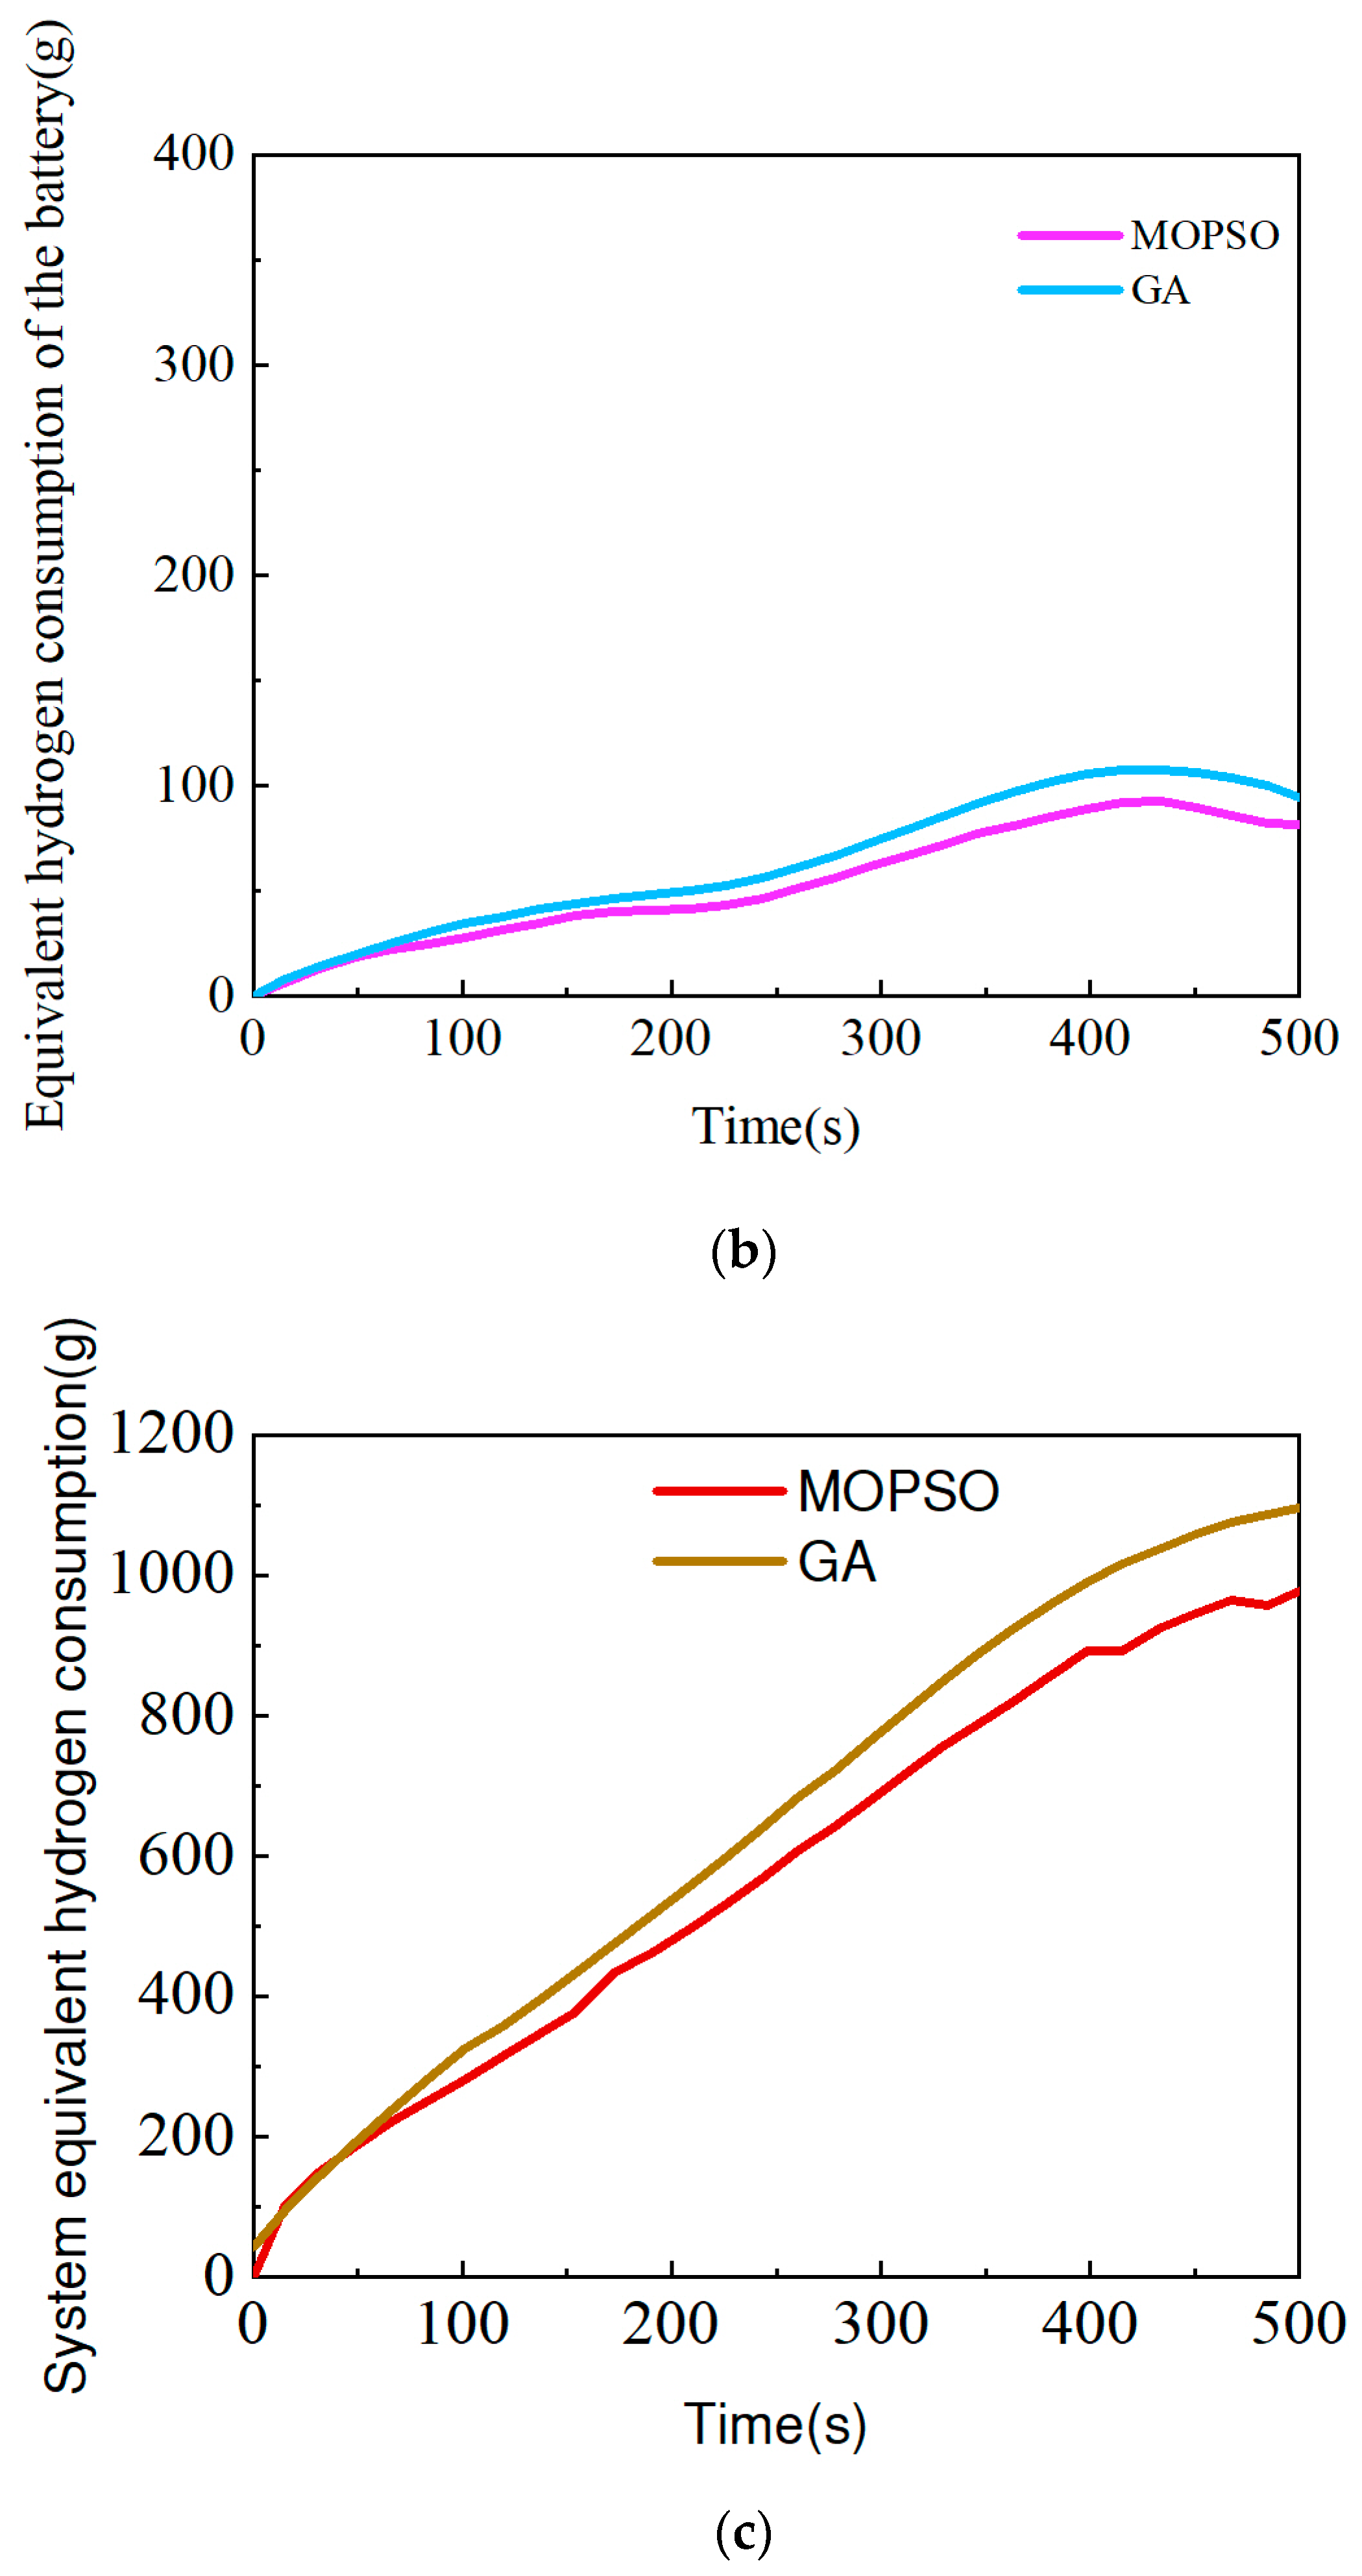
Figure 7a–c show the comparison between MOPSO and GA in fuel consumption, battery gas consumption, and hybrid system gas consumption. The results show that MOPSO outperforms GA in all three metrics. In terms of fuel consumption, MOPSO reduces it by about 10.5%; in battery gas consumption, it reduces it by about 13.8%; and in hybrid system gas consumption, it reduces it by about 10.8%. These data show that MOPSO significantly reduces energy consumption and improves the system operational efficiency, whereas GA fails to respond promptly to demand during several periods, leading to energy waste. Overall, MOPSO demonstrates a higher performance and efficiency in multi-objective optimization. The specific relevant hydrogen consumption is shown in Table 4 below.

5. Experimental Validation

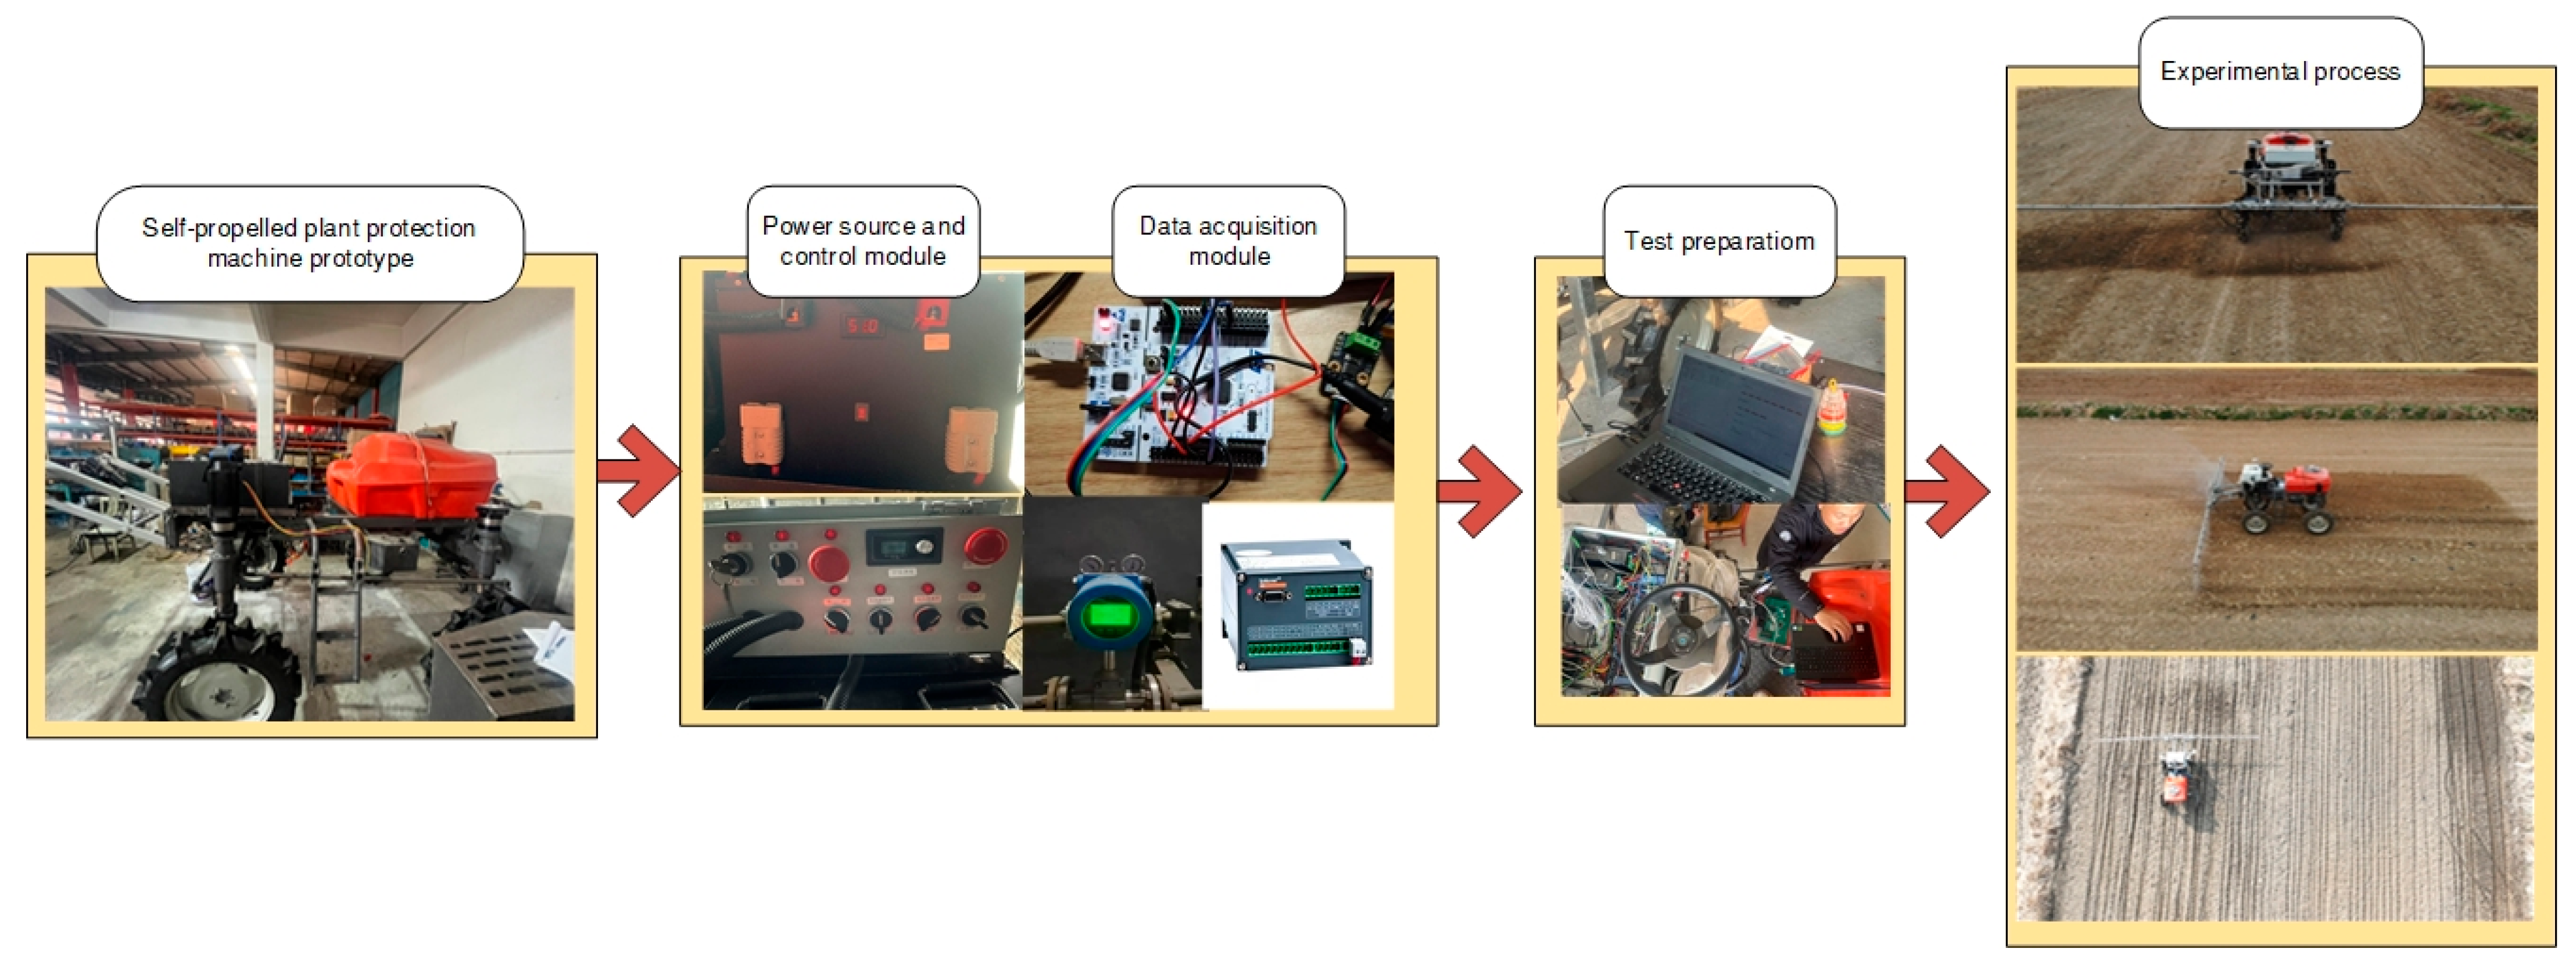
To verify the reliability of the simulation model, the research team conducted practical condition tests using a self-propelled plant protection machine prototype from Nanjing Agricultural University. The designed experiment was to perform plant protection operations in a dry field environment, measuring and recording the current and voltage of the fuel cell and battery, as well as the hydrogen flow. The specific experimental method involved installing power sensors, hydrogen flow meters, and current–voltage sensors to collect real-time data on the power output, hydrogen consumption, etc., of the fuel cell and battery. After correcting the measured data, a polynomial regression analysis of the discrete experimental data was performed using the least squares method to obtain continuous operational performance results. The experimental equipment and process are shown in the figure below.
The experiment was conducted at the Jiuming Agricultural Machinery Service Cooperative experimental base in Liuhe District, Nanjing, Jiangsu Province. The area is characterized by typical dryland soil, primarily sandy loam, with a moderate organic matter content and a pH value of approximately 6.8. The weather on the day of the experiment was clear, with an average temperature of 15.2 °C and a relative humidity of about 62%. The experimental area was flat with a neat field surface. The previous crop was maize, and the remaining straw has been returned to the soil. The soil moisture was suitable, and the overall environment met the agronomic requirements for dryland farming. The specific experimental process is shown in Figure 8 below.
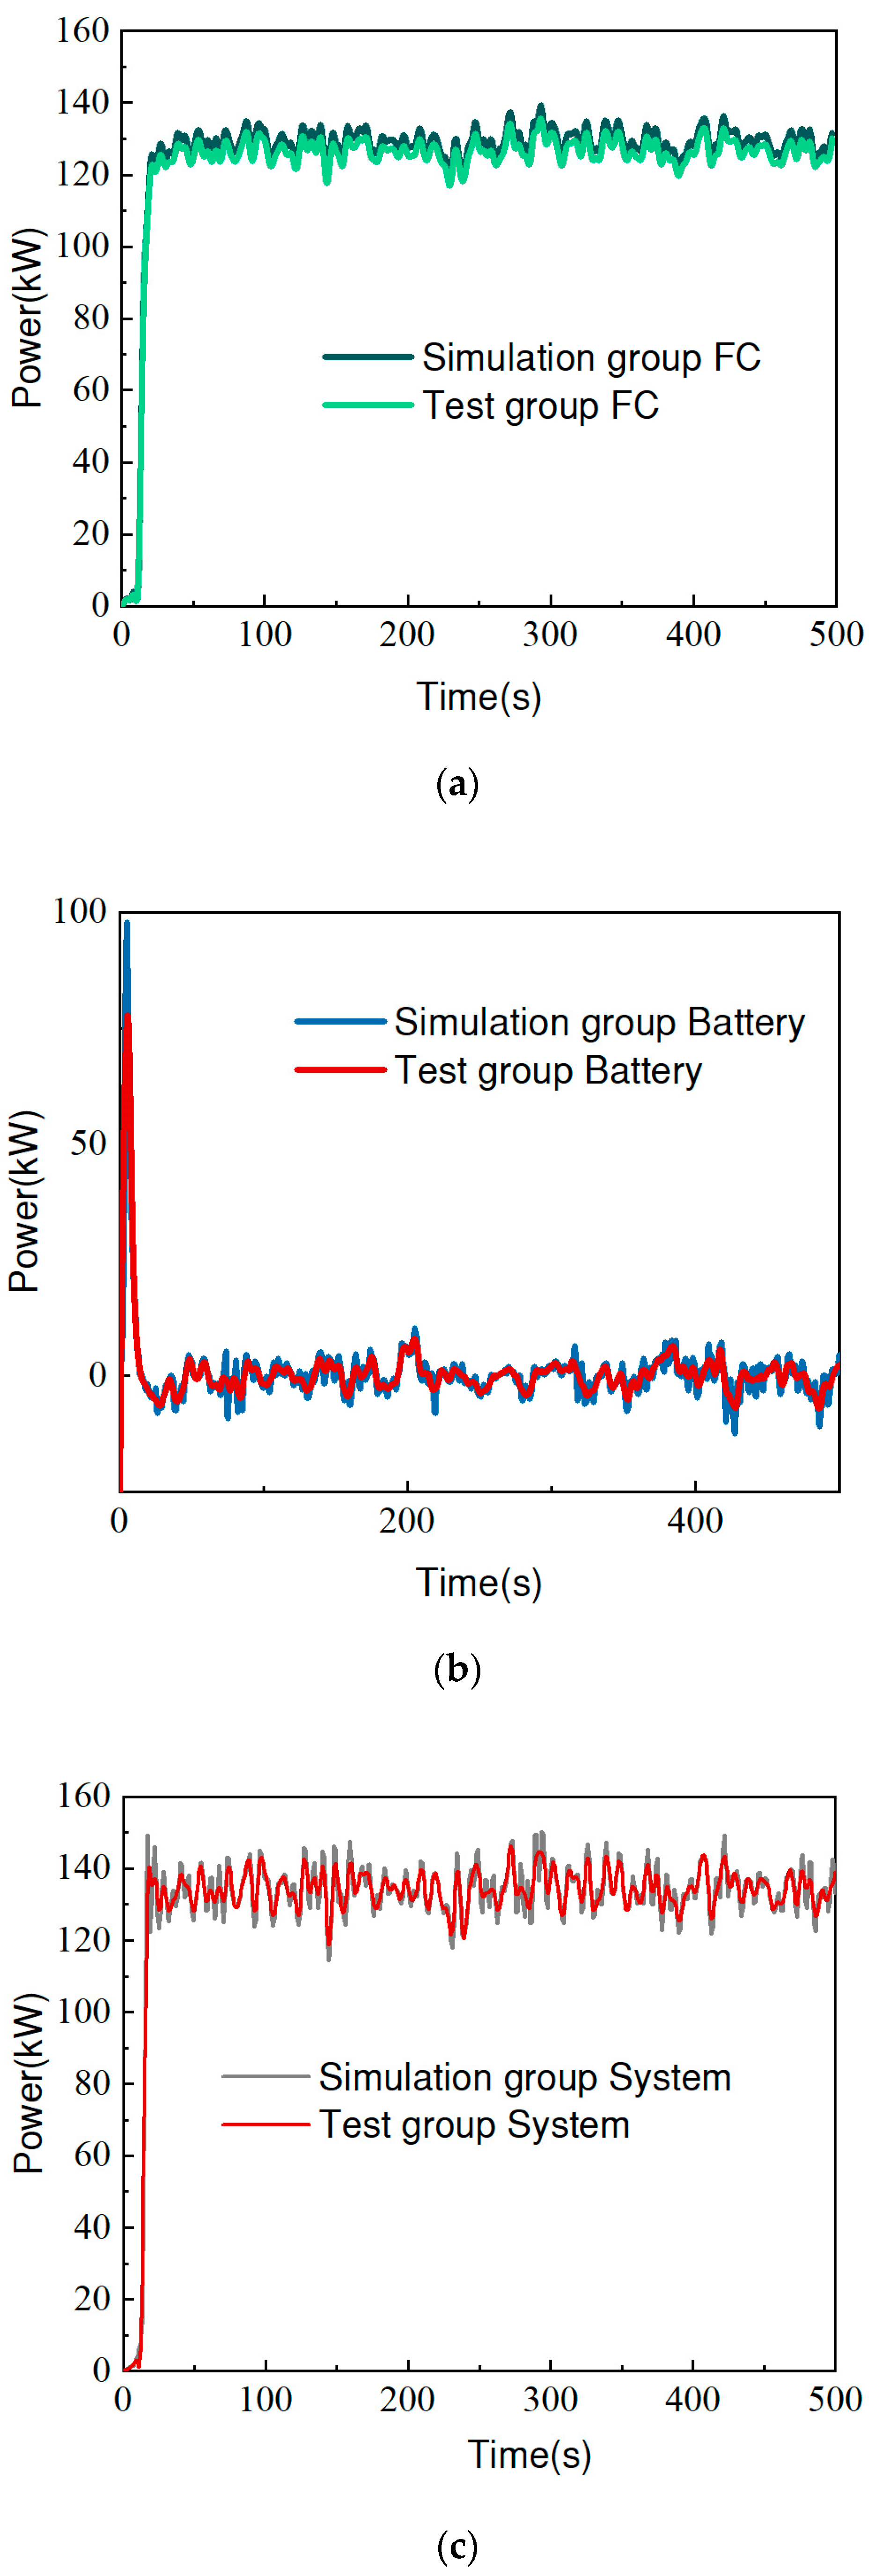
Figure 9 shows the power output of the self-propelled plant protection machine’s power system. It can be observed that during the 300–500 s time period, compared with the simulation data, the output power in the prototype test fluctuates more significantly, with a fluctuation range of about 0.6 kW, and the average output power deviates from the simulation value by approximately 0.04 kW. Based on the characteristic evaluation model established in Section 2.3, Table 5 presents the relevant data. The simulation group and the test group show a similar performance in terms of average output power, power stability, and response time. Specifically, the average output power of the simulation group is 137.68 kW, the power stability is 0.96, and the response time is 11.38 s. The average output power of the test group is 134.67 kW, the power stability is 0.91, and the response time is 13.83 s. The maximum voltage difference and fuel cell degradation rate for the simulation group are 46.89 mV and 6.21 µV/h, respectively, while for the experimental group, they are 51.32 mV and 8.33 µV/h.
According to the comparison between the simulation data and experimental data (Table 5), the mean absolute error (MAE) of the key performance indicators in this study is 2.418, indicating that the hydrogen power system shows a good consistency in major operational indicators. The simulation results are close to the measured data in terms of the average power, operational stability, and response speed, but there is some deviation in voltage fluctuations and fuel cell performance degradation.
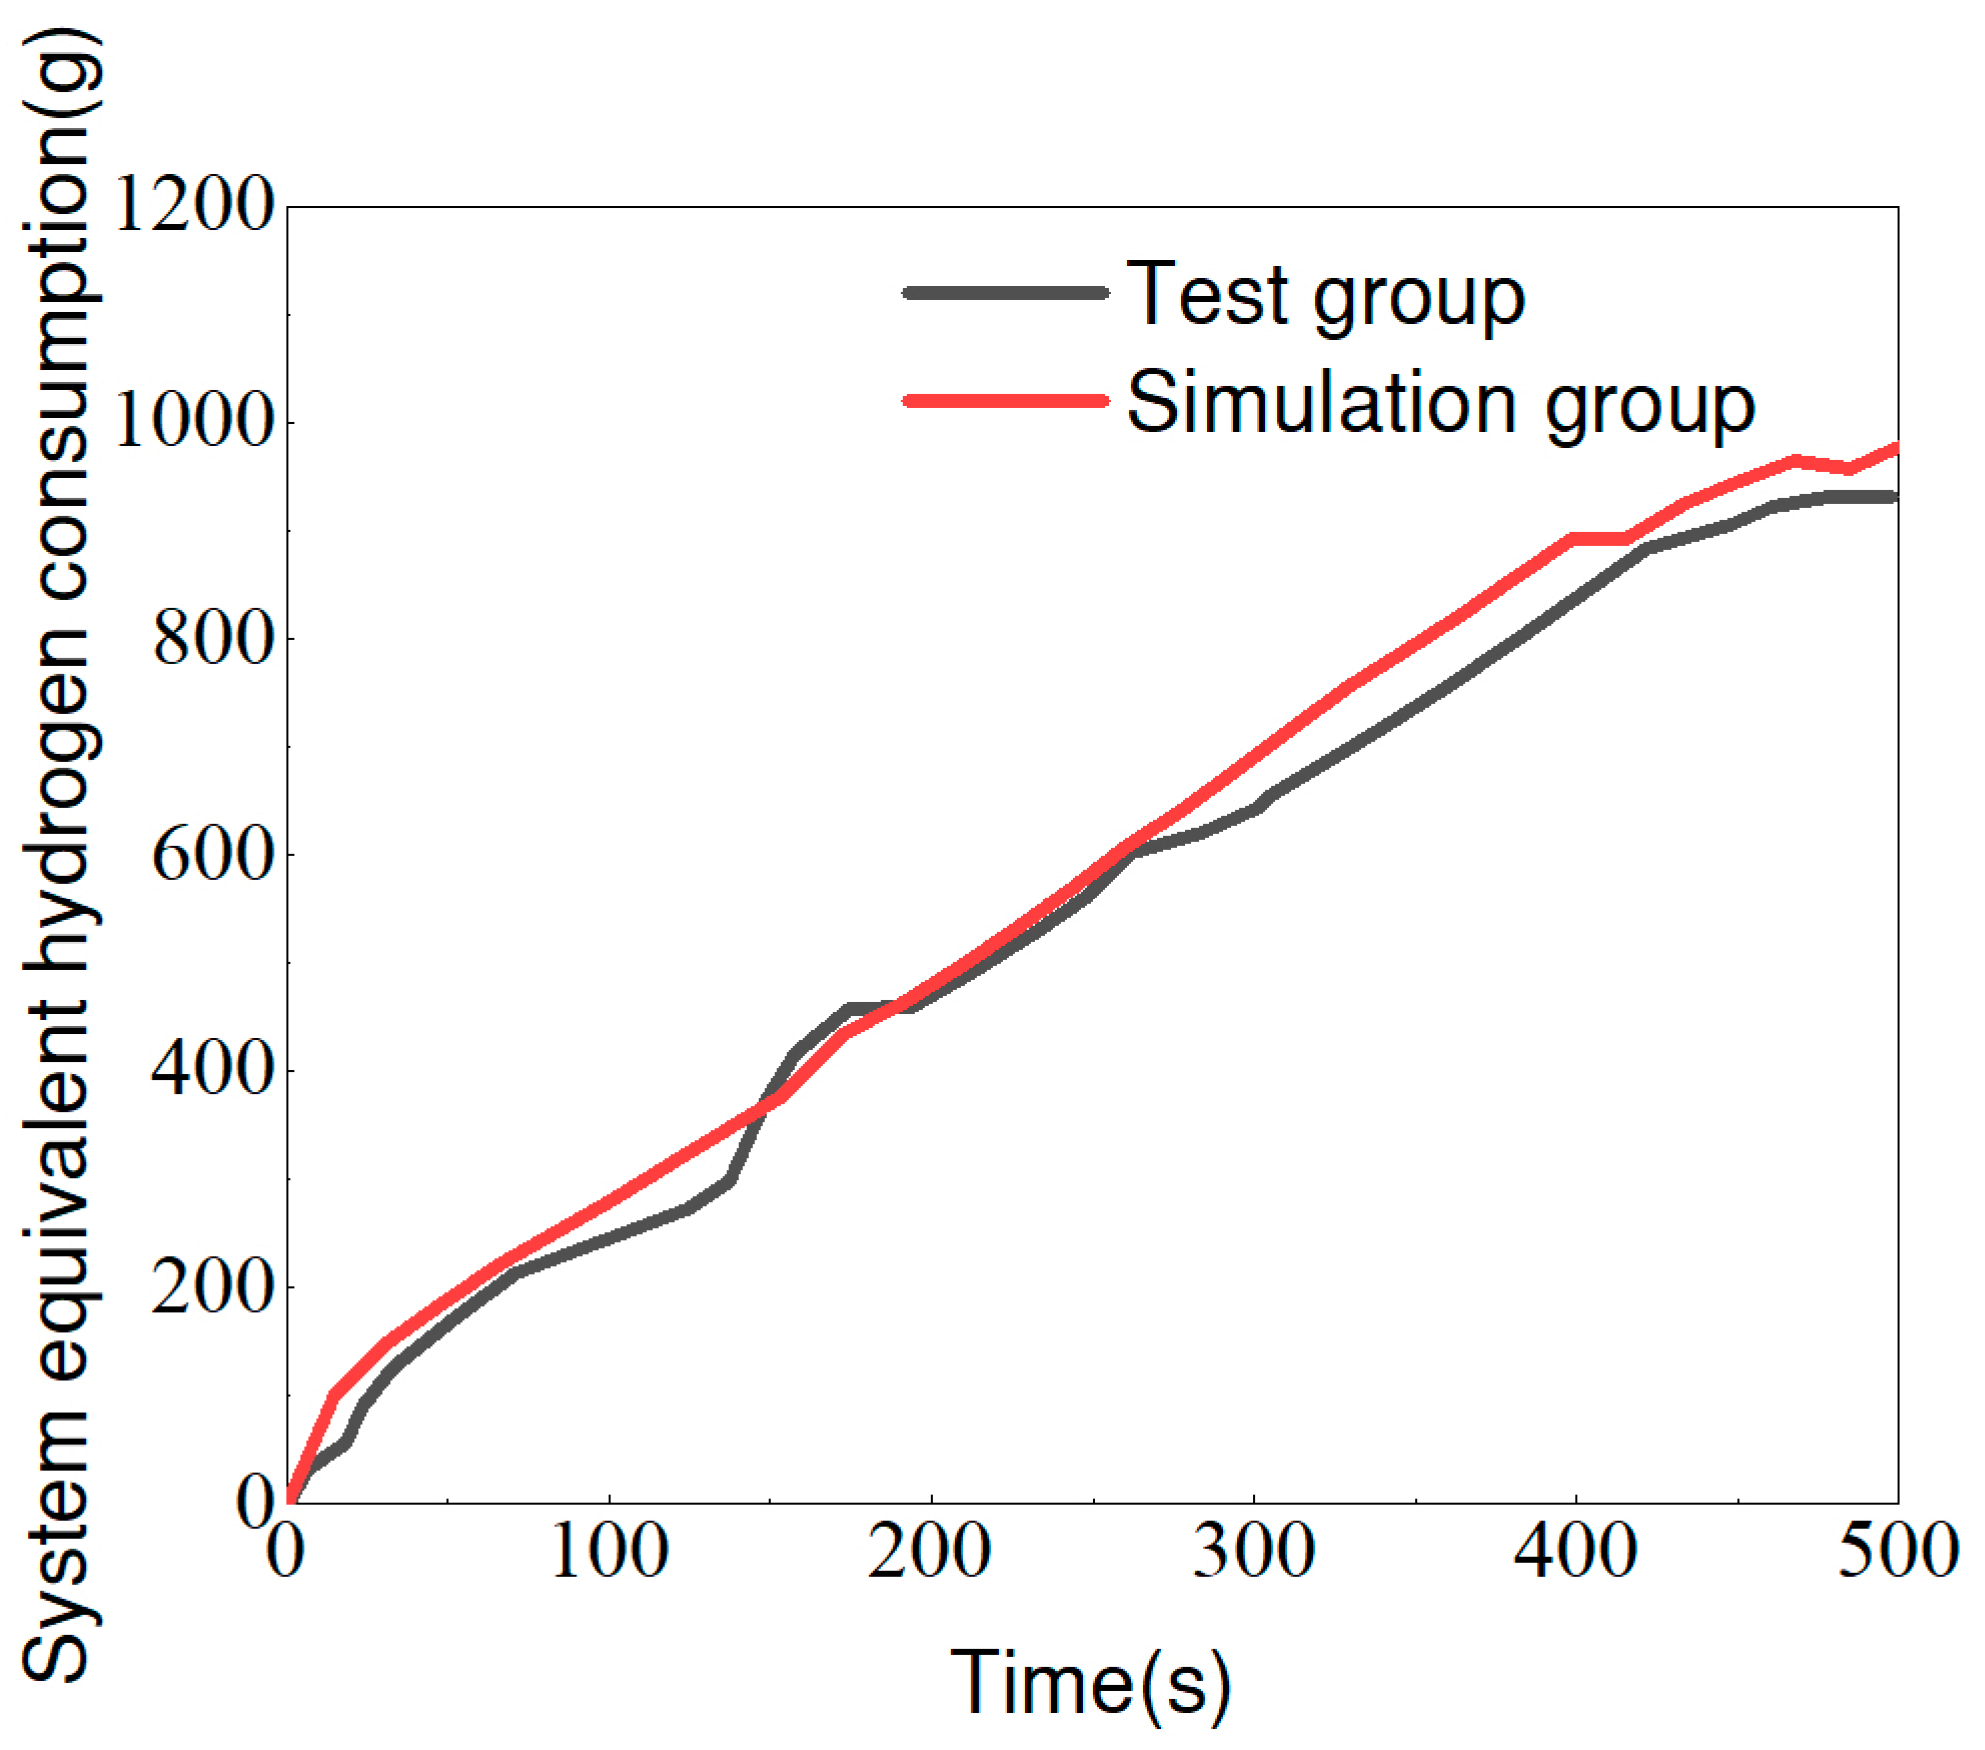
The accuracy of the simulation model was thoroughly validated by the hydrogen consumption test data shown in Figure 10. The test data and simulation data are highly fitted, with the hydrogen consumption of the simulation group being 977 g at 500 s, and 954 g for the test group, showing a minimal difference. This fully demonstrates the correctness and reliability of the simulation model in both the dynamic and steady-state phases.

6. Conclusions and Discussion

6.1. Conclusions

(1) Based on the operational characteristics and environmental features of the self-propelled plant protection machine, a parameter optimization model for the hydrogen-powered hybrid power system of the self-propelled plant protection machine was developed. This model uses the full-lifecycle cost function and the volume of the energy system as objective functions, considering key factors such as power matching, energy balance, structural parameters, fuel cell change rate, and battery parameter fluctuations during operation, with corresponding constraints set.
(2) The MOPSO algorithm was set as a multi-objective optimization algorithm, with the GA algorithm chosen as the control group. The optimization results show that the lifecycle cost function and volume of the energy system configuration obtained using the MOPSO algorithm decreased by 15.8% and 17.6%, respectively, compared with the control group.
(3) A dynamic model of the hydrogen-powered self-propelled plant protection machine was constructed on the Matlab/Simulink platform, and two power system configuration schemes were simulated and validated. The results show that both systems can meet the required output power under operational conditions. Under the premise of covering basic operating conditions, the power system optimized by the MOPSO algorithm shows improvements in key performance indicators, such as fuel cell system output efficiency and battery efficiency, which are about 15.3% and 10.1% higher than the GA algorithm optimization, respectively. The hydrogen consumption of the fuel cell, battery equivalent hydrogen consumption, and hybrid power system equivalent hydrogen consumption were reduced by 10.5%, 13.8%, and 10.8%, respectively.
(4) Practical tests were conducted using a self-propelled plant protection machine prototype. The test results show that, compared with the simulation data, the operational performance and equivalent hydrogen consumption of the self-propelled plant protection machine power system are highly consistent, with an absolute mean error of 2.418, validating the correctness of the simulation.

6.2. Analysis of the Impact of Real-World Constraints on Optimization Results

(1)
Dynamic impact of terrain variability on optimization parameters
Given that the terrain of the Huang-Huai-Hai Plain is not static and has significant slope variations, changes in complex terrain will significantly alter the power demand model, exceeding the rated output limit of the energy system in the optimization scheme, thereby causing the MOPSO fixed solution set to fail.
(2)
The need to revise the economic model due to hydrogen supply interruption
Considering that most areas of the Huang-Huai-Hai Plain are rural, hydrogen is typically transported by high-pressure gas hydrogen or liquid hydrogen. However, as the transport distance increases, the cost of transporting hydrogen per unit increases exponentially. For example, when the transport distance increases from 50 km to 200 km, the transport cost increases by 2.3 times [31,32]. This, on one hand, leads to the need for frequent hydrogen replenishment, shortening the endurance time and operational efficiency. On the other hand, it forces the hydrogen storage tank volume to increase, offsetting the volume optimization benefits of MOPSO.
(3)
The need to revise the economic model due to hydrogen supply interruption
The full lifecycle cost mentioned in the original text does not include hidden costs, such as fuel cell membrane electrode replacement and maintenance costs for battery thermal management systems. These hidden costs are usually not low and will affect the cost optimization benefits of MOPSO.
This study constructs a multi-objective optimization framework for hydrogen-powered self-propelled plant protection machinery, with the main optimization objectives being the full lifecycle cost of the energy system and the system volume. Through combining the simulation analysis and physical testing, the study verifies that this method effectively improves the overall economic efficiency and spatial adaptability of the machine while ensuring power performance.
Based on prototype measurement data and regional operational characteristics, the hydrogen-powered plant protection system is suitable for priority deployment in the intensive wheat field areas of the Huang-Huai-Hai Plain (such as in Henan, Shandong, and other provinces), with the potential to support the green transformation of the local agricultural economy.
The study not only provides a theoretical basis and engineering implementation path for the design of key parameters in hydrogen-powered plant protection machinery, but also offers valuable experience for the clean energy transformation of agricultural equipment, with positive implications for reducing agricultural carbon emission intensity and improving energy utilization efficiency. The research results align with the United Nations Sustainable Development Goals of Clean Energy (SDG 7) and Climate Action (SDG 13), providing a practical and economically adaptable system solution for green, low-carbon agriculture.


Author Contributions

Conceptualization, L.X., M.L., and S.H.; methodology, S.H.; software, S.H., S.L., and Y.L.; validation, L.X., S.H., and S.L.; formal analysis, S.H., and L.X.; investigation, S.H., and L.X.; resources, M.L.; data curation, Y.L.; writing—original draft preparation, S.H.; writing—review and editing, M.L., and L.X.; visualization, Y.L., S.H., and S.L.; supervision, M.L.; project administration, M.L.; funding acquisition, M.L., and L.X. All authors have read and agreed to the published version of the manuscript.

Funding

This research was funded by the National Key R&D Program Project, grant number 2022YFD2001203.

Data Availability Statement

The original contributions presented in the study are included in the article; further inquiries can be directed to the corresponding author.

Acknowledgments

We extend our gratitude to the aforementioned funding bodies for their generous support. Additionally, we thank the anonymous reviewers whose insightful comments and suggestions greatly enhanced the quality of this manuscript. We also would like to thank the students from Nanjing Agricultural University for providing the experimental prototype for our tests.

Conflicts of Interest

Author Mengnan Liu was employed by the YTO Group Corporation R&D Center. The remaining authors declare that the research was conducted in the absence of any commercial or financial relationships that could be construed as potential conflicts of interest.

References

  1. Lei, S.; Li, Y.; Liu, M.; Li, W.; Zhao, T.; Hou, S.; Xu, L. Hierarchical Energy Management and Energy Saving Potential Analysis for Fuel Cell Hybrid Electric Tractors. Energies 2025, 18, 247. [Google Scholar] [CrossRef]
  2. Martelli, S.; Martini, V.; Mocera, F.; Soma’, A. Life Cycle Assessment Comparison of Orchard Tractors Powered by Diesel and Hydrogen Fuel Cell. Energies 2024, 17, 4599. [Google Scholar] [CrossRef]
  3. Mocera, F.; Somà, A.; Martelli, S.; Martini, V. Trends and Future Perspective of Electrification in Agricultural Tractor-Implement Applications. Energies 2023, 16, 6601. [Google Scholar] [CrossRef]
  4. Martini, V.; Mocera, F.; Somà, A. Numerical Investigation of a Fuel Cell-Powered Agricultural Tractor. Energies 2022, 15, 8818. [Google Scholar] [CrossRef]
  5. Yang, H.; Sun, Y.; Xia, C.; Zhang, H. Research on Energy Management Strategy of Fuel Cell Electric Tractor Based on Multi-Algorithm Fusion and Optimization. Energies 2022, 15, 6389. [Google Scholar] [CrossRef]
  6. Lajunen, A. Evaluating Energy Consumption of Different Powertrain Technologies in Agricultural Field Operations. In Proceedings of the 2024 American Society of Agricultural and Biological Engineers Annual International Meeting, ASABE 2024, Anaheim, CA, USA, 28–31 July 2024; American Society of Agricultural and Biological Engineers: St. Joseph, MI, USA, 2024. [Google Scholar]
  7. Zhuang, T.; Yang, X.; Dong, X.; Zhang, T.; Yan, H.; Sun, X. Research Status and Development Trend of Large Self-Propelled Sprayer Booms. Nongye Jixie Xuebao/Trans. Chin. Soc. Agric. Mach. 2018, 49, 189–198. [Google Scholar] [CrossRef]
  8. Li, Y.; Liu, M.; Wang, Y.; Xu, L.; Lei, S. Energy Management Optimization and Validation of a Hydrogen Fuel Cell-Powered Agricultural Tractor Based on Hierarchical Dynamic Programming. IEEE Access 2024, 12, 21382–21401. [Google Scholar] [CrossRef]
  9. Wawer, T.; Stroink, A. Hydrogen-Powered Agriculture: Cost Analysis of Hydrogen Logistics in Rural Areas. In Proceedings of the 20th International Conference on the European Energy Market, EEM 2024, Istanbul, Turkey, 10–12 June 2024; IEEE Computer Society: Piscataway, NJ, USA, 2024. [Google Scholar]
  10. Durkin, K.; Khanafer, A.; Liseau, P.; Stjernström-Eriksson, A.; Svahn, A.; Tobiasson, L.; Andrade, T.S.; Ehnberg, J. Hydrogen-Powered Vehicles: Comparing the Powertrain Efficiency and Sustainability of Fuel Cell versus Internal Combustion Engine Cars. Energies 2024, 17, 1085. [Google Scholar] [CrossRef]
  11. Albatayneh, A.; Juaidi, A.; Jaradat, M.; Manzano-Agugliaro, F. Future of Electric and Hydrogen Cars and Trucks: An Overview. Energies 2023, 16, 3230. [Google Scholar] [CrossRef]
  12. Ala, G.; Colak, I.; Di Filippo, G.; Miceli, R.; Romano, P.; Silva, C.; Valtchev, S.; Viola, F. Electric Mobility in Portugal: Current Situation and Forecasts for Fuel Cell Vehicles. Energies 2021, 14, 7945. [Google Scholar] [CrossRef]
  13. Yang, F.; Xue, X.; Cai, C.; Sun, Z.; Zhou, Q. Numerical Simulation and Analysis on Spray Drift Movement of Multirotor Plant Protection Unmanned Aerial Vehicle. Energies 2018, 11, 2399. [Google Scholar] [CrossRef]
  14. Kurc, B.; Gross, X.; Szymlet, N.; Rymaniak, Ł.; Woźniak, K.; Pigłowska, M. Hydrogen-Powered Vehicles: A Paradigm Shift in Sustainable Transportation. Energies 2024, 17, 4768. [Google Scholar] [CrossRef]
  15. Hydrogen Nexus in a Sustainable Energy Future|Compendex. Available online: https://www.engineeringvillage.com/app/doc/?docid=cpx_6e3d6012ac3b02fabM4e1e2061377553&pageSize=25&index=6&searchId=0f64709e95aa446e92bff77f9c86a14c&resultsCount=13&usageZone=resultslist&usageOrigin=searchresults&searchType=Quick (accessed on 10 September 2025).
  16. Jia, X.; Xia, Y.; Yan, Z.; Gao, H.; Qiu, D.; Guerrero, J.M.; Li, Z. Coordinated Operation of Multi-Energy Microgrids Considering Green Hydrogen and Congestion Management via a Safe Policy Learning Approach. Appl. Energy 2025, 401, 126611. [Google Scholar] [CrossRef]
  17. Paulson, I.W.P.; Gerspacher, J.; Gagnon, B.J.; Landry, H.; Sumner, D.; Bergstrom, D.J. Experimental Characterization of the Aerodynamic Wake of a High-Clearance Sprayer with Changing Operating Parameters. J. ASABE 2022, 65, 665–679. [Google Scholar] [CrossRef]
  18. Fabula, J.V.; Sharda, A.; Mishler, B. Quantification of Self-Propelled Sprayers Turn Compensation Feature Utilization and Advantages during on-Farm Applications. Precis. Agric. 2022, 23, 1675–1687. [Google Scholar] [CrossRef]
  19. Li, W.; Shao, M.; Du, Y.; Li, Z.; Sun, Z.; Yang, F. Design and Verification of Automatic Navigation Control System for Large High Clearance Self-Propelled Sprayer. Proc. Inst. Mech. Eng. Part D J. Automob. Eng. 2024, 09544070241280403. [Google Scholar] [CrossRef]
  20. Liu, G.; Li, C.; Shen, Y.; Liu, H.; Zhang, Y.; Zhao, S. Sliding Mode Active Disturbance Rejection Control of Synchronous Steering High Clearance Sprayer. Nongye Jixie Xuebao/Trans. Chin. Soc. Agric. Mach. 2023, 54, 180–300. [Google Scholar] [CrossRef]
  21. Ministry of Machinery and Electronics Industry, Luoyang Tractor Research Institute. Tractor Design Handbook; Machinery Industry Press: Beijing, China, 1994. [Google Scholar]
  22. Fu, W.; Qi, H.; Dai, C.; Li, M.; Liu, Z.; Chen, W. Multi-Objective Matching Optimization for Hybrid Fuel-Cell Power System in Trams. Xinan Jiaotong Daxue Xuebao/J. Southwest Jiaotong Univ. 2020, 55, 604–611. [Google Scholar] [CrossRef]
  23. Xiao, W. Research on Parameter Optimization and Control Strategy of Hybrid Energy System for Electric Vehicles. Master’s Thesis, Wuhan University of Technology, Wuhan, China, 2022. [Google Scholar]
  24. Zhou, S. Optimization and Matching Design of Fuel Cell Hybrid Power System for Tram. Master’s Thesis, Southwest Jiaotong University, Chengdu, China, 2018. [Google Scholar]
  25. Liu, Y.; Sun, Z.; Chen, Z. Optimization of Fuel Cell Hybrid System Configuration via Modified Multi-Objective Particle Swarm Algorithm. In Proceedings of the 25th IEEE China Conference on System Simulation Technology and Its Application, CCSSTA 2024, Tianjin, China, 21–23 July 2024; Institute of Electrical and Electronics Engineers Inc.: Piscataway, NJ, USA, 2024; pp. 499–503. [Google Scholar]
  26. Yang, M.; Li, Q.; Cai, L.; Wang, T.; Chen, W. Multi-Objective Optimization Energy Management Method for Fuel Cell Hybrid Power System Considering Stack Performance Consistency. Zhongguo Dianji Gongcheng Xuebao/Proc. Chin. Soc. Electr. Eng. 2024, 44, 385–394. [Google Scholar] [CrossRef]
  27. Liu, M.; Zhou, Z.; Xu, L.; Zhao, J.; Yan, X. Multi-Objective Optimization and Design of Tractor Trailer Systems. Nongye Gongcheng Xuebao/Trans. Chin. Soc. Agric. Eng. 2017, 33, 62–68. [Google Scholar] [CrossRef]
  28. Mikaeeli, S.Z.; Aghanajafi, C. Optimization and Thermohydrodynamic Analysis of Five-Pad Tilting Pad Journal Bearing with MOPSO Algorithm. Ind. Lubr. Tribol. 2025, 77, 626–635. [Google Scholar] [CrossRef]
  29. Ling, Q.; Tan, K.; Wang, Y.; Li, Z.; Liu, W. Evolutionary Extreme Learning Machine Based on an Improved MOPSO Algorithm. Neural Comput. Appl. 2025, 37, 7733–7750. [Google Scholar] [CrossRef]
  30. Chaleshtori, A.E. A Novel Decision Fusion Approach for Sale Price Prediction Using Elastic Net and MOPSO. arXiv 2024, arXiv:2403.20033. [Google Scholar] [CrossRef]
  31. Zhang, X.; Fan, T.; Wu, Z.; Zheng, L. Cost Analysis and Suggestions for Hydrogen Supply Chain. Chem. Ind. Eng. Prog. 2022, 41, 2364–2371. [Google Scholar]
  32. Liu, K. Comprehensive Evaluation of Energy Efficiency, Cost, and Carbon Emissions of Green Hydrogen Integrated Application System. Master’s Thesis, Shandong University, Jinan, China, 2025. [Google Scholar]
Figure 1. Structural design of the hydrogen-powered self-propelled plant protection machine hybrid power system.
Energies 18 04952 g001
Figure 2. Parameter optimization process for the self-propelled plant protection machine.
Energies 18 04952 g002
Figure 3. Pareto front distribution diagram.
Energies 18 04952 g003
Figure 4. Plant protection working conditions.
Energies 18 04952 g004
Figure 5. (a) Output power of the hybrid power system; (b) Output power of the fuel cell.
Energies 18 04952 g005
Figure 6. (a) Power of the battery system; (b) SOC of the battery system.
Energies 18 04952 g006
Figure 7. (a) Fuel cell hydrogen consumption; (b) Battery equivalent hydrogen consumption; (c) Hybrid system equivalent hydrogen consumption.
Energies 18 04952 g007aEnergies 18 04952 g007b
Figure 8. Experimental equipment and procedure.
Energies 18 04952 g008
Figure 9. (a) Power output of fuel cell system status; (b) Power output of battery; (c) Power output of hybrid power system.
Energies 18 04952 g009
Figure 10. Hydrogen consumption data from the power system test.
Energies 18 04952 g010
Table 1. Recommended scheme for fuel cell hybrid power system.
ProjectSingle-Objective GATwo-Objective MOPSO
Fuel cell (unit)435389
Battery (unit)5342
Energy system volume (m3)1.641.35
Full lifecycle cost (10,000 RMB)176.78148.83
Spatial adaptability (m)0.210.33
Table 2. Sensitivity analysis of hydrogen price.
Hydrogen Price (RMB/kg)Energy Cost C3 (RMB)Full Lifecycle Cost (10,000 RMB)
2020.08148.8337
4040.16148.8357
6060.24148.8377
Table 3. Overall parameters of a certain model of the Dongfanghong self-propelled plant protection machine.
ParameterValue
Rated power (kW)≥140
Maximum travel speed (km/h)18
Maximum acceleration (m/s2)0.5
Ground clearance (m)≥1
Endurance time (h)≥80
Spray capacity (L)≥2500
Total vehicle weight (kg)14,500
Drive wheel diameter (m)1.05
Windward area A (m2)3.5
Table 4. Hydrogen consumption of each component in the power system.
AlgorithmFuel Cell (g)Battery (g)Power System (g)
MOPSO89681977
GA1002941096
Table 5. Operational performance test results of the power system.
Average Output Power (kW) Power Stability Response Time (s) Maximum Voltage Deviation (mV) Degradation Rate of Fuel Cells (ụV/h)
Simulation group137.680.9611.3846.896.21
Test group134.670.9113.8651.328.33
Disclaimer/Publisher’s Note: The statements, opinions and data contained in all publications are solely those of the individual author(s) and contributor(s) and not of MDPI and/or the editor(s). MDPI and/or the editor(s) disclaim responsibility for any injury to people or property resulting from any ideas, methods, instructions or products referred to in the content.