1. Introduction
The issues related to the environmentally friendly operation of gas turbines and boiler units are becoming increasingly important. At present, emission requirements in Kazakhstan are gradually aligning with international standards. In particular, the Program for the Transition to a Green Economy envisions that emissions from gas turbine units will become comparable to European levels [
1].
To meet these stringent requirements, various burner devices based on the micro-flare combustion method are currently being developed. This method relies on the principle of flame division into multiple smaller flames to ensure stable combustion.
This article presents the results of a study on three types of burner devices. Two of them utilize the principle of flame division through a large number of holes, while the other two rely on swirling flows created by blades for flame division. Given that a considerable body of research has focused on swirling flames, the authors concentrated their main analysis on burners employing perforated designs, such as micromix and similar combustion methods.
Numerous notable studies exist in this field. For instance, Di Nardo et al. [
2] investigated the combustion of a CH
4-H
2 mixture in a burner with a swirling flow. Their research showed that with a hydrogen content of 50%, the CO concentration was 23 ppmv, and the NOx concentration was 63 ppmv. Increasing the hydrogen concentration to 100% reduced NOx emissions to 42 ppmv, with a complete elimination of CO emissions. In the work by Lan et al. [
3], numerical simulations were performed on a burner with nozzles and hydrogen enrichment for industrial use. The results indicated high NO concentrations in the burner’s initial combustion zone. The exhaust gas showed NO concentrations up to 57 ppm and a temperature of 1094 K. Kardaś et al. [
4] studied a burner with nozzles and observed NO concentrations of 71 ppm and CO concentrations of 378 ppm.
Pacheco et al. [
5] examined a burner with swirl vanes set at a 45° angle during the combustion of methane and ammonia. When ammonia was not present in the fuel, both NOx and CO concentrations were below 50 ppm. Liu et al. [
6] analyzed a swirl burner with a swirl number of 0.85. The diffusion combustion regime resulted in low NO concentrations at the burner outlet. Combustion was observed to occur in a V-shaped zone formed at the burner’s mouth. Wu et al. [
7] conducted experimental studies on the combustion of ammonia and propane in a burner with a 40 mm diameter, equipped with six swirl vanes, a central tube, and both primary and secondary airflows. Their results showed CO concentrations below 400 ppm and NOx concentrations not exceeding 100 ppm, with the lowest values recorded at minimal ammonia content. Of particular interest is the study by Elbaz et al. [
8], who investigated a two-stage swirl burner fueled with LPG. Their findings demonstrated that varying the swirl angle significantly affects NOx concentrations in the exhaust gases.
Important conclusions were drawn in the study of perforated plate burners by Veetil et al. [
9]. The authors investigated various gas compositions during combustion at an equivalence ratio of φ = 0.8, using a hexagonal arrangement of holes with a diameter of 1 mm. Methane–propane and methane–hydrogen fuel mixtures were burned. The results showed that methane–propane mixtures yielded the lowest NOx concentrations, reaching 11.74 ppm. The studies by Konnov et al. [
10,
11] are also well known for investigating the combustion of various fuels in perforated burners. At φ = 0.7 and a distance of 20 mm from the burner, NO concentrations did not exceed 7 ppm. However, upon reaching stoichiometric conditions, NO concentrations increased to 60–70 ppm during methane combustion. Similar experiments were conducted with hydrogen mixed with CO and CO
2. At φ = 1.0, NO concentrations remained low, within 4–5 ppm. In the article by Fruzza et al. [
12], the results of flashback studies were presented for equivalence ratios φ = 0.6, 0.8, and 1.0, at fixed flame lengths and varying slit distances. The studies showed that flame stabilization is significantly influenced by the boundary layer near the wall. Furthermore, circular holes exhibited higher temperatures and steeper velocity gradients due to a greater area-to-volume ratio. Jager et al. [
13] studied flame stabilization during the combustion of premixed hydrogen and air. Their results showed that the positioning of the holes has a significant effect on flame behavior: in the central region, combustion was more efficient compared to the edges, owing to reduced flow pressure near the perimeter. G. Lopez-Ruiz et al. [
14] conducted research on micromix burners with hydrogen added to the airflow. The maximum NOx concentrations observed in such burners were 14 ppm. Takami et al. [
15] investigated a porous burner intended for use in gas turbines and boilers. The burner consisted of a ceramic plate with pores. Measurements of NOx concentrations at φ = 0.9 showed that concentrations reached 20 ppm at the lowest measurement height and up to 100 ppm at the highest point. Notably, the lowest NOx values were achieved at φ = 0.9.
In the work of Gao et al. [
16], studies were conducted on inert porous packings of different diameters. The experiments were carried out at equivalence ratios ranging from φ = 0.43 to 0.52. The results showed significant NOx concentrations at φ = 0.52 for a packing diameter of 110 mm. Of particular interest is the study by Abdelhafez et al. [
17], who investigated three types of perforated plates containing 61 and 37 holes with varying spacing. According to the results, the plate with 37 holes and a hole spacing of 7 mm exhibited the highest temperature. This was attributed to a larger volume of fuel entering each hole, resulting in a longer flame. In terms of flame stabilization, the configuration with 37 holes and smaller spacing performed better compared to the other designs.
Similar research was conducted by Hindasageri et al. [
18], who studied heat transfer at hole spacings ranging from 3 to 7 mm. Gamal et al. [
19] investigated the effect of perforated plates during LPG combustion. The study involved plates with different hole numbers and diameters. The results showed that the maximum surface temperature was achieved using a copper plate with the highest number of holes. Lee et al. [
20] studied combustion processes in a vertical multihole burner at φ = 0.7–0.75. At φ = 0.7, increasing the burner load led to a gradual rise in NOx concentrations, with a maximum value of 25 ppm. At φ = 0.75, the NOx concentration reached a peak of 38 ppm.
In the study by Araoye et al. [
21], the relationship between fuel–air mixing and both the number and diameter of burner holes was investigated. The results showed that at a short mixing distance (L/D = 5.0), significant over-mixing occurred with a hole diameter of 0.35 mm. Furthermore, a configuration with four holes of 0.35 mm diameter provided faster mixing than a configuration with six holes. Goswami et al. [
22] studied a burner featuring holes with a diameter of 0.3 mm and a spacing of 0.4 mm. Their research demonstrated that increasing the feed rate (i.e., pressure) of the fuel–air mixture led to a marked reduction in CO concentration and a corresponding increase in CO
2 concentration. Notably, at elevated pressures of 10 bar, flame temperatures reached up to 2250 K.
The novelty of this study lies in the direct experimental comparison of swirl-based and perforated multihole nozzles under identical operating conditions. In contrast to most previous works that focused on one configuration type, either swirl burners [
5,
6] or multihole designs [
21,
22], our study provides a systematic analysis of how geometry-driven mixing mechanisms affect NOx and CO emissions. To the best of our knowledge, such a combined experimental approach has not been reported before. This work, therefore, offers new insights for optimizing burner design toward low-emission combustion systems.
2. Materials and Methods
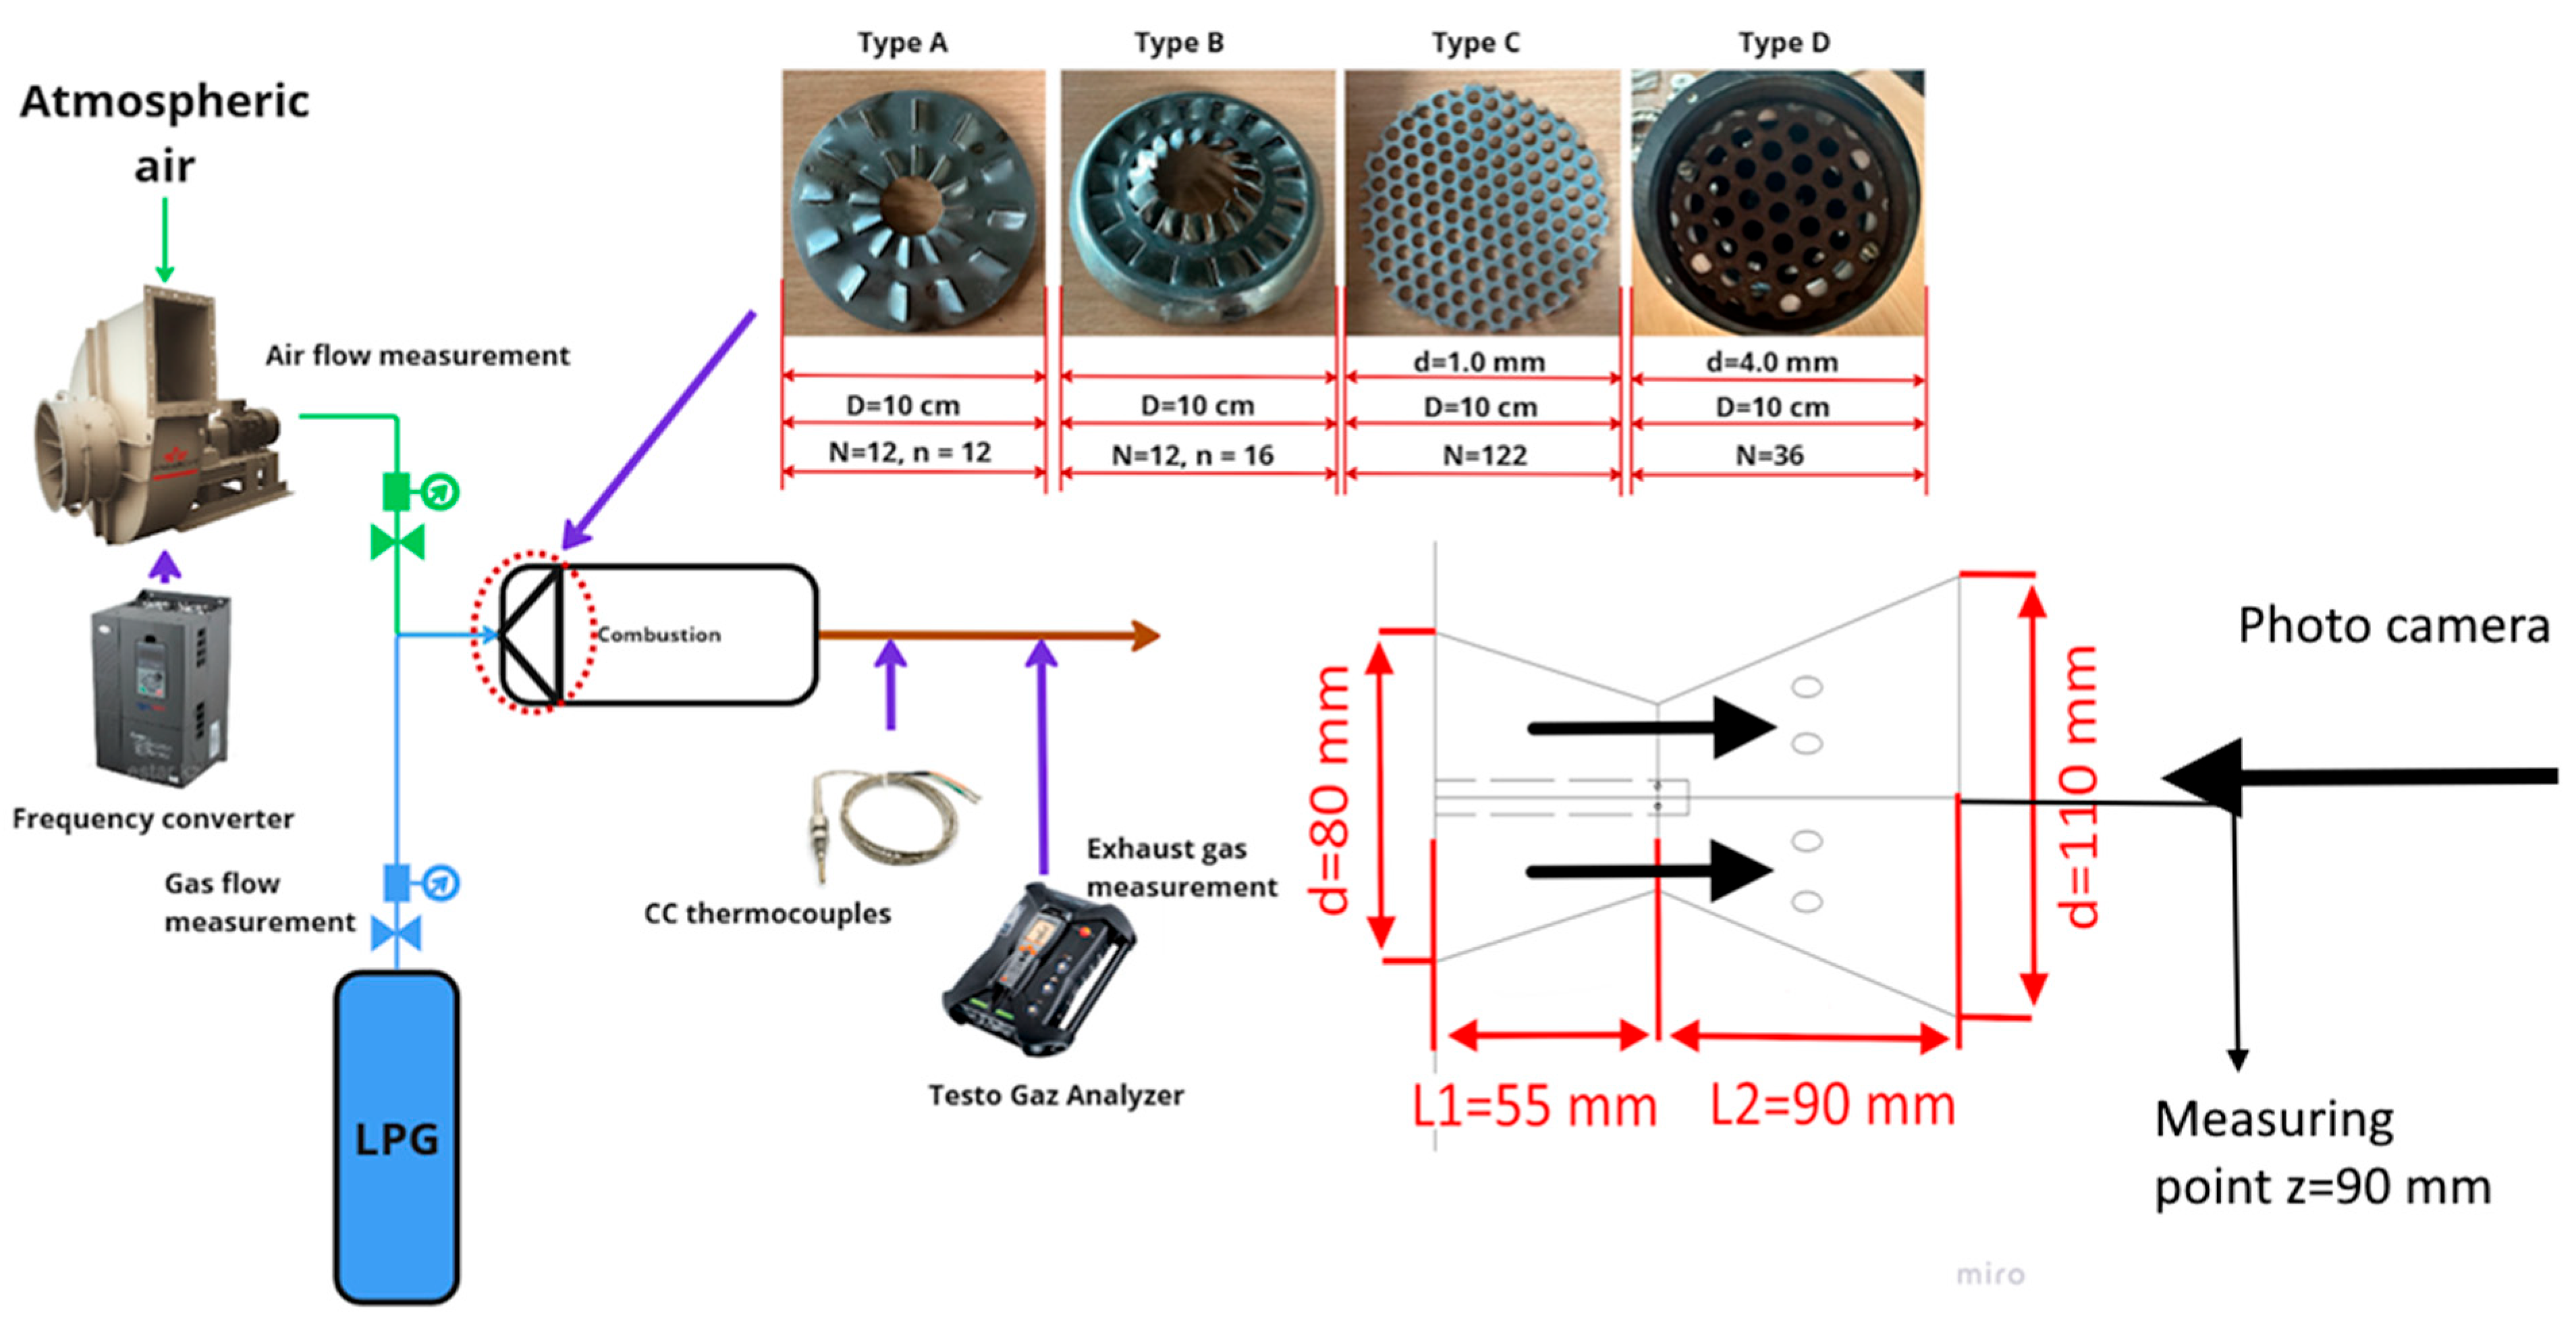
Figure 1 shows the experimental setup and the nozzles under investigation. All nozzles have the same diameter of 10 cm.
The experimental procedure was as follows: Fuel and air were supplied to the burner, after which ignition was initiated. Once steady-state combustion was established, temperature and gas composition measurements were taken. Flame and exhaust gas temperatures were measured with chromel–copel thermocouples located in the exhaust duct downstream of the burner. The measurements, therefore, represent averaged exhaust conditions rather than spatially resolved flame temperature fields. The detailed geometric parameters of the four nozzle configurations are summarized in
Table 1.
The swirl number S was computed as
where
and
evaluated on a plane immediately downstream of the vanes. Inputs were the measured inlet flow rates and the nozzle geometry (vane angle 45°, height 10 mm, width 5 mm). Auxiliary non-reacting 3D flow fields (COMSOLs) were used to obtain area-averaged
and
distributions for consistency checks. The resulting values are reported in
Table 1. Types A and B are swirl-stabilized nozzles with 45° vanes; Types C and D are multihole, non-swirling plates. To enable a consistent comparison, the swirl number S for Types A/B is used, and the perforated plates (Types C/D) are quantified using the porosity. In addition, we report a common open-area ratio α, which coincides with ε for perforated plates and is approximated by the central-orifice area fraction for the swirl nozzles. The corresponding values are listed in
Table 1.
The experimental conditions are presented in
Table 2, while the equipment used and the associated measurement error margins are listed in
Table 3.
Plate porosity was calculated as follows:
Exhaust composition was sampled on-axis at z = 90 mm downstream of the nozzle exit. Tests at z = 70 and 110 mm yielded the same qualitative trends; absolute differences remained within the measurement uncertainty. Flame images were used qualitatively. An apparent luminous flame length was estimated on steady frames as the axial distance from the exit to the 5% blue-channel intensity isoline, averaged over three images; the scale was calibrated with the known D = 100 mm.
To calculate the equivalence ratio, the following formula was used:
where
—is the equivalence ratio,
—fuel-to-air ratio,
—stoichiometry.
The Reynolds number was calculated with the following formula:
where
—velocity,
—diameter, and
—viscosity.
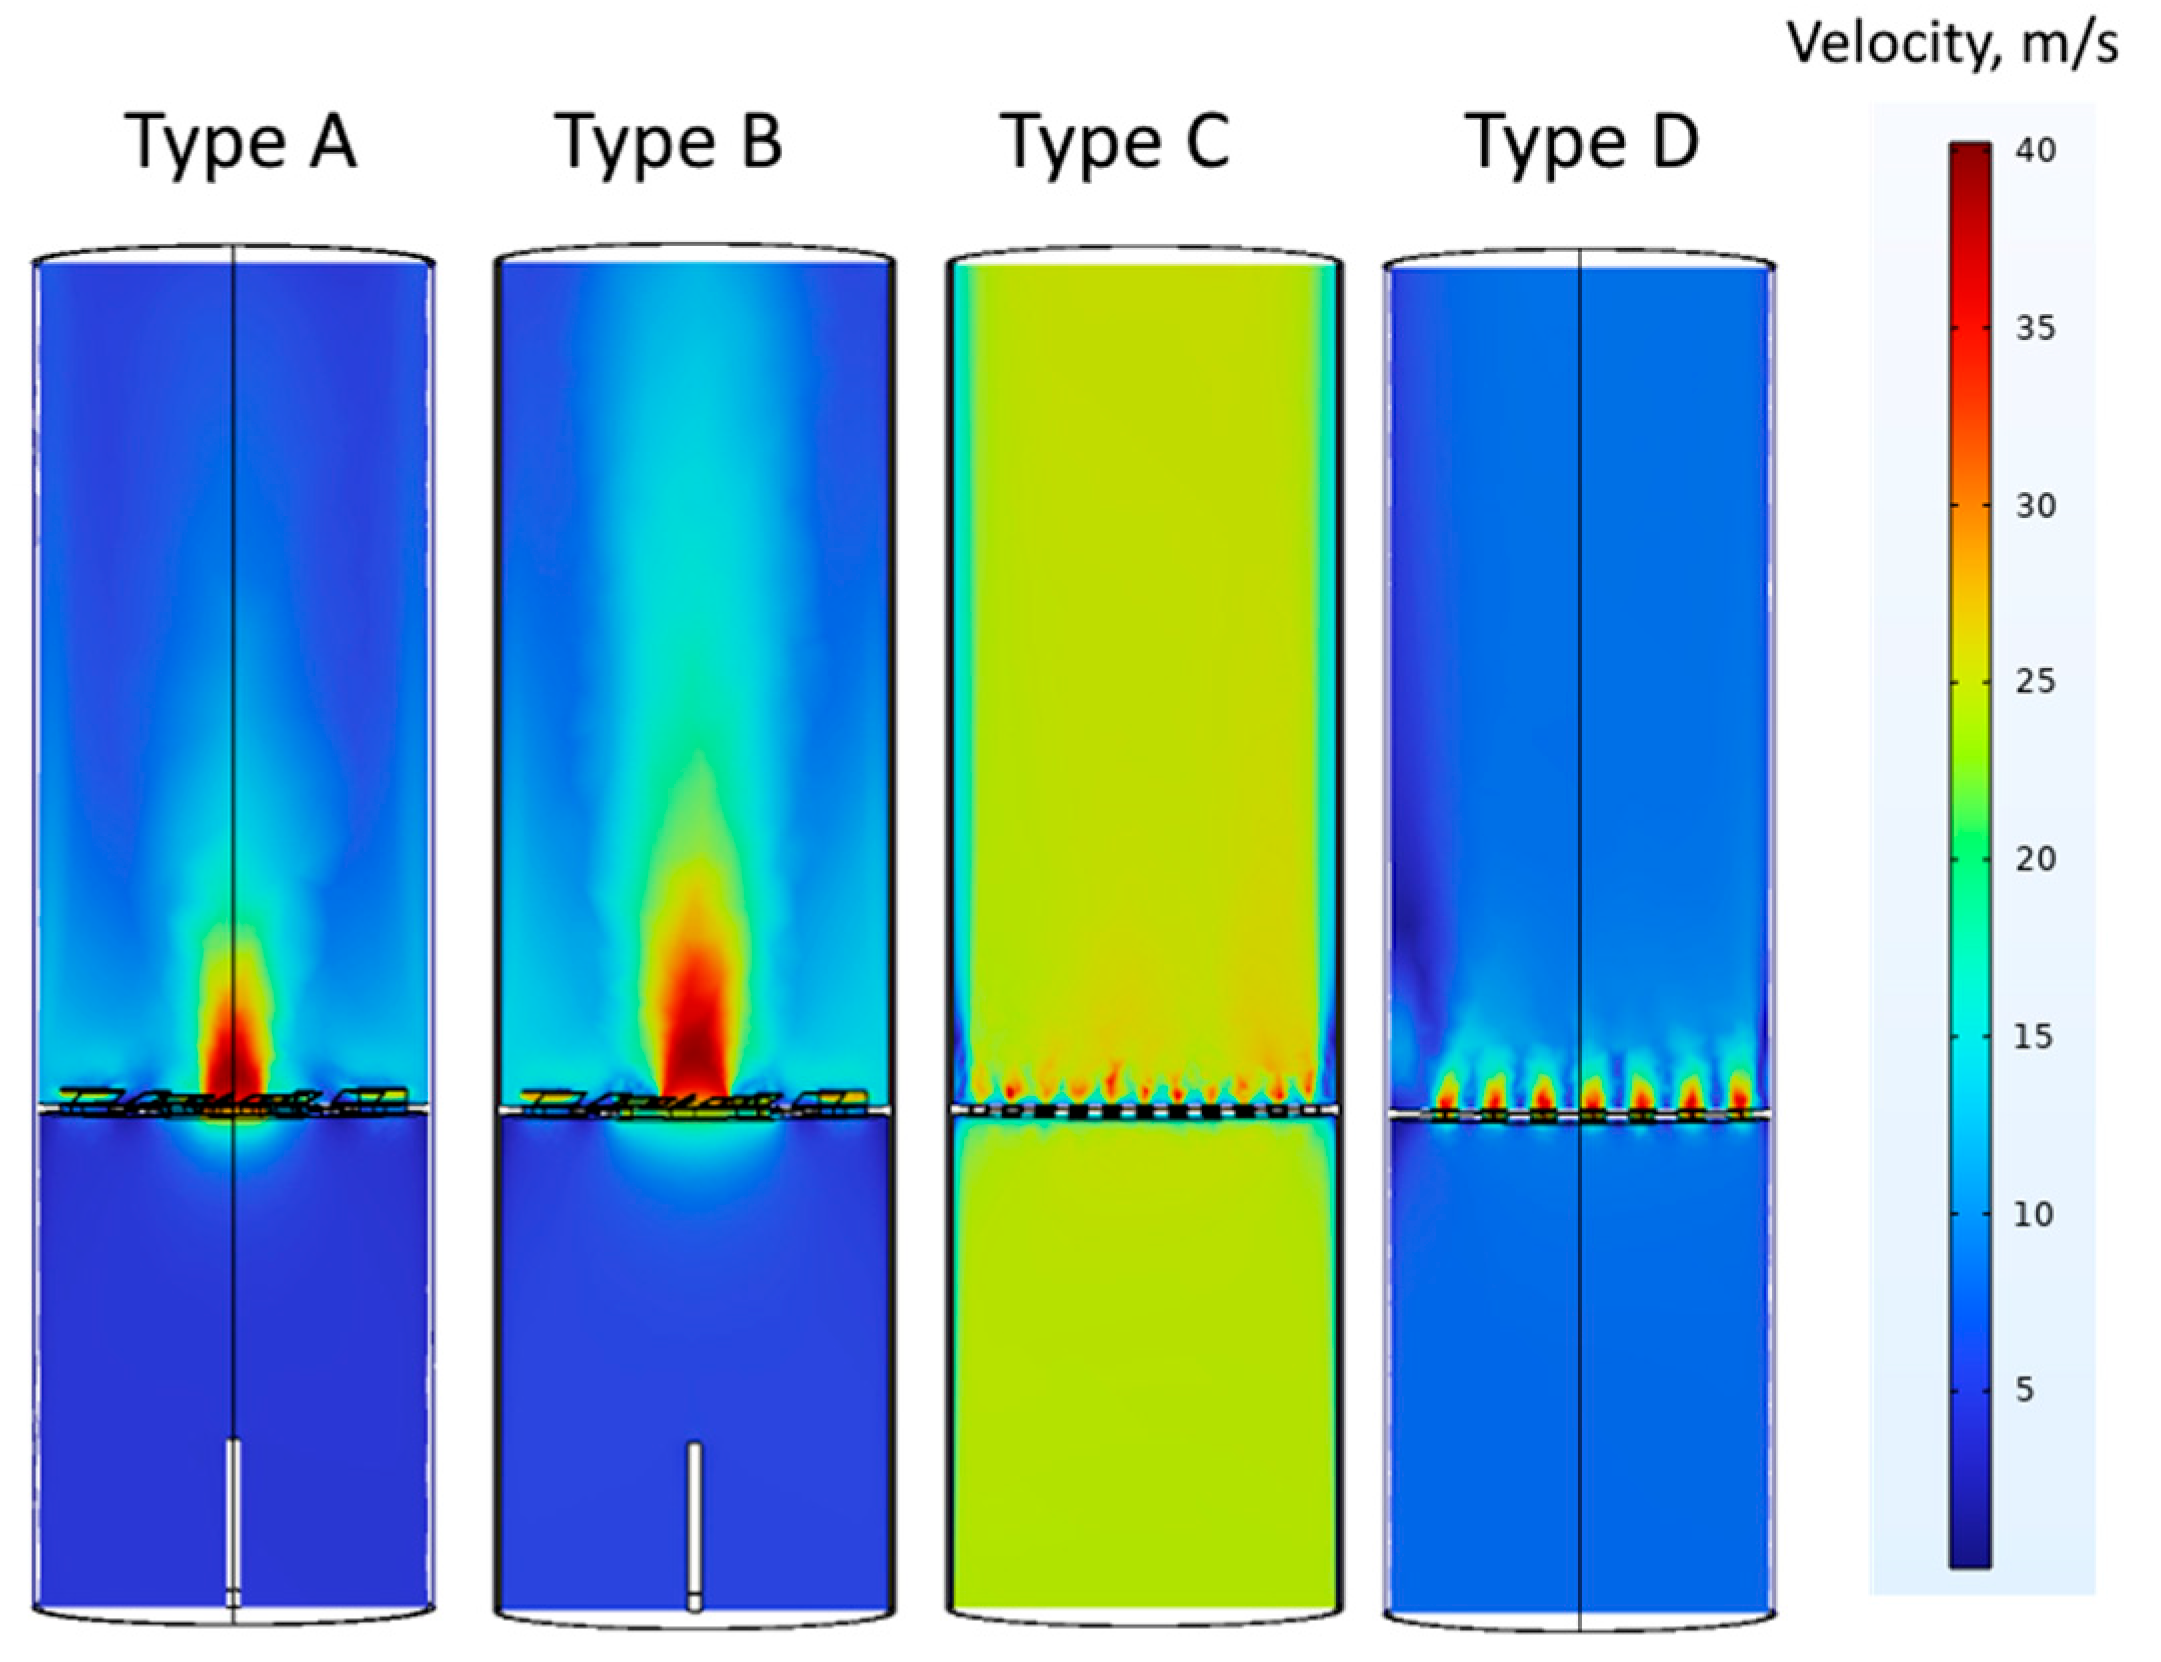
To qualitatively corroborate residence-time differences, steady incompressible 3D simulations were performed for nozzles A–D (
Table 1). Contours of velocity magnitude, |u| (m/s), with a common color scale, are provided in
Figure A1 to visualize jet confinement and recirculation. No chemistry or heat release was modeled.
Lean blow-off (LBO) was measured by decreasing the equivalence ratio in steps of Δφ ≈ 0.02 at fixed total flow. Blow-off was defined as global flame extinction without self-reignition within 3 s; events were verified with video (camera in
Figure 1) and by the gas analyzer signal returning to baseline.
3. Results
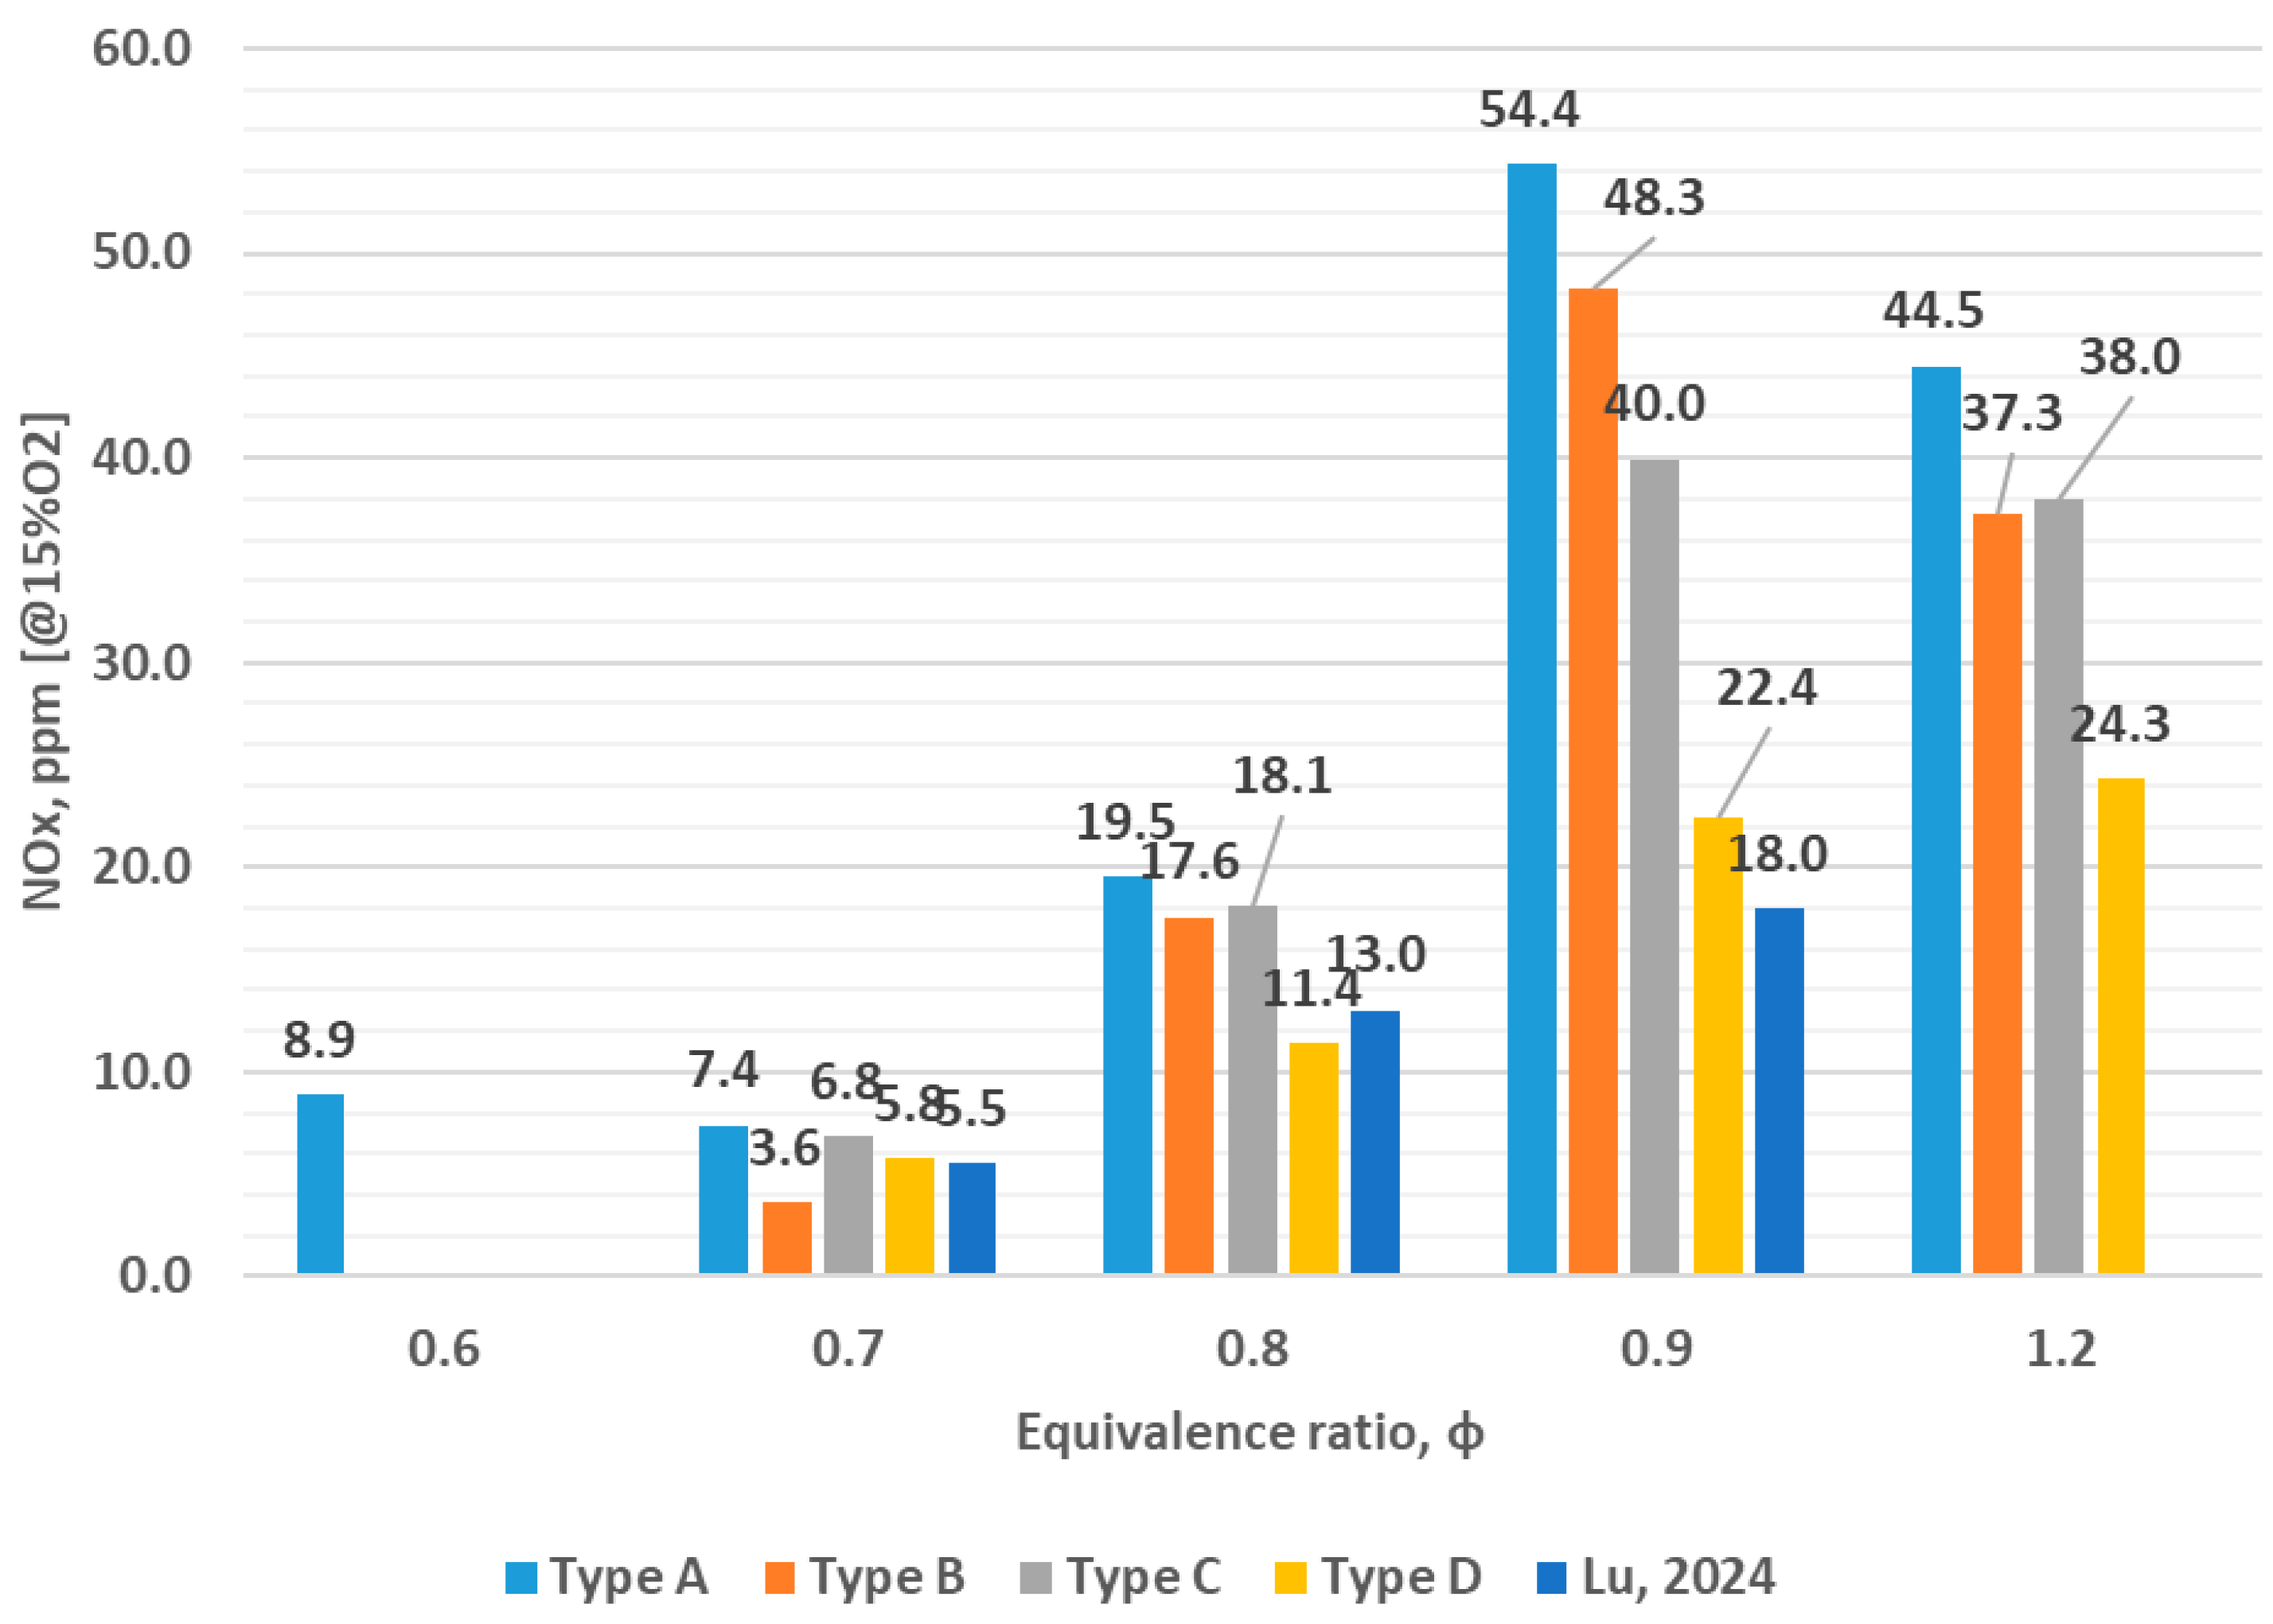
Figure 2 illustrates the dependence of NOx concentrations on the equivalence ratio (φ) for the four nozzle types. The highest NOx concentrations were observed with the type A nozzle. Notably, at φ = 0.6, flame extinction occurred for all nozzle types except type A. At this ratio, the NOx concentration for type A reached 8.9 ppm. As φ increased slightly, the NOx concentration decreased to 7.4 ppm, which may be attributed to a slight reduction in flame temperature due to increased air content. With a further increase in φ to 0.8, the NOx concentration rose to 19.5 ppm, and the maximum value of 54.4 ppm was recorded at φ = 0.9.
For the type B nozzle, a lower NOx concentration of 3.6 ppm was observed at φ = 0.7. Across all φ values, NOx concentrations for type B were on average 22% lower than those for type A. As noted in [
27], NOx formation occurs via several mechanisms, the primary one under combustion conditions being the thermal mechanism. This mechanism is influenced by factors such as residence time, temperature, and the degree of mixing. In the case of type A and B nozzles, the temperature and mixing characteristics significantly impact NOx formation. Based on the experimental data, all other conditions being equal, type B demonstrates lower NOx concentrations due to a stronger swirl, which enhances fuel–air mixing. This improved mixing reduces local high-temperature zones, thereby lowering overall flame temperature and NOx formation. Additionally, enhanced mixing leads to shorter burnout times for fuel particles. This conclusion is further supported by observed CO concentrations, which reflect incomplete combustion in cases of poor mixing.
For nozzle type C, the NOx concentration is consistently higher than that of type B across all equivalence ratios. At φ = 0.7, type C exhibits the second-highest NOx concentration after type A. As the equivalence ratio increases to 0.8, the NOx concentration for type C reaches 18.1 ppm. Overall, the obtained data indicate that increasing the number of nozzle holes results in higher NOx emissions. Similar findings on the influence of hole count were reported in [
28]. Furthermore, increasing the equivalence ratio to 0.9 leads to a further rise in NOx concentration, consistent with results presented in [
29].
The analysis indicates that the primary mechanisms of NOx formation are the residence time of gases in the high-temperature zone and the degree of fuel–air mixing. Among the tested configurations, the highest NOx concentrations were observed for type A, which can be attributed to the high flow resistance caused by the closed nozzle design and intense swirl of the flow [
27]. The combination of strong swirl (S ≈ 0.8) and geometric confinement (small open-area ratio, α) increases the effective residence time and raises the exhaust-gas temperature to ≈640 °C at φ ≈ 0.9, consistent with the higher NOx observed for Type A. Additionally, a high swirl intensity increases the residence time of combustion gases in the high-temperature region. These two factors—high temperature and prolonged residence time—contribute to the relatively high NOx emissions observed for type A.
Given that the fuel is LPG with no fuel-bound nitrogen, fuel NOx can be neglected. The measured NOx displays a maximum near φ ≈ 0.9 together with higher exhaust temperatures, which is consistent with thermal NOx formation via the extended Zeldovich mechanism [
27]. In contrast, prompt NOx is expected to contribute less under the present operating range, as indicated by the reduction in CH and CO near φ ≈ 0.9 and the temperature-driven NOx trends [
10,
11]. Therefore, thermal NOx is considered the dominant pathway in our experiments.
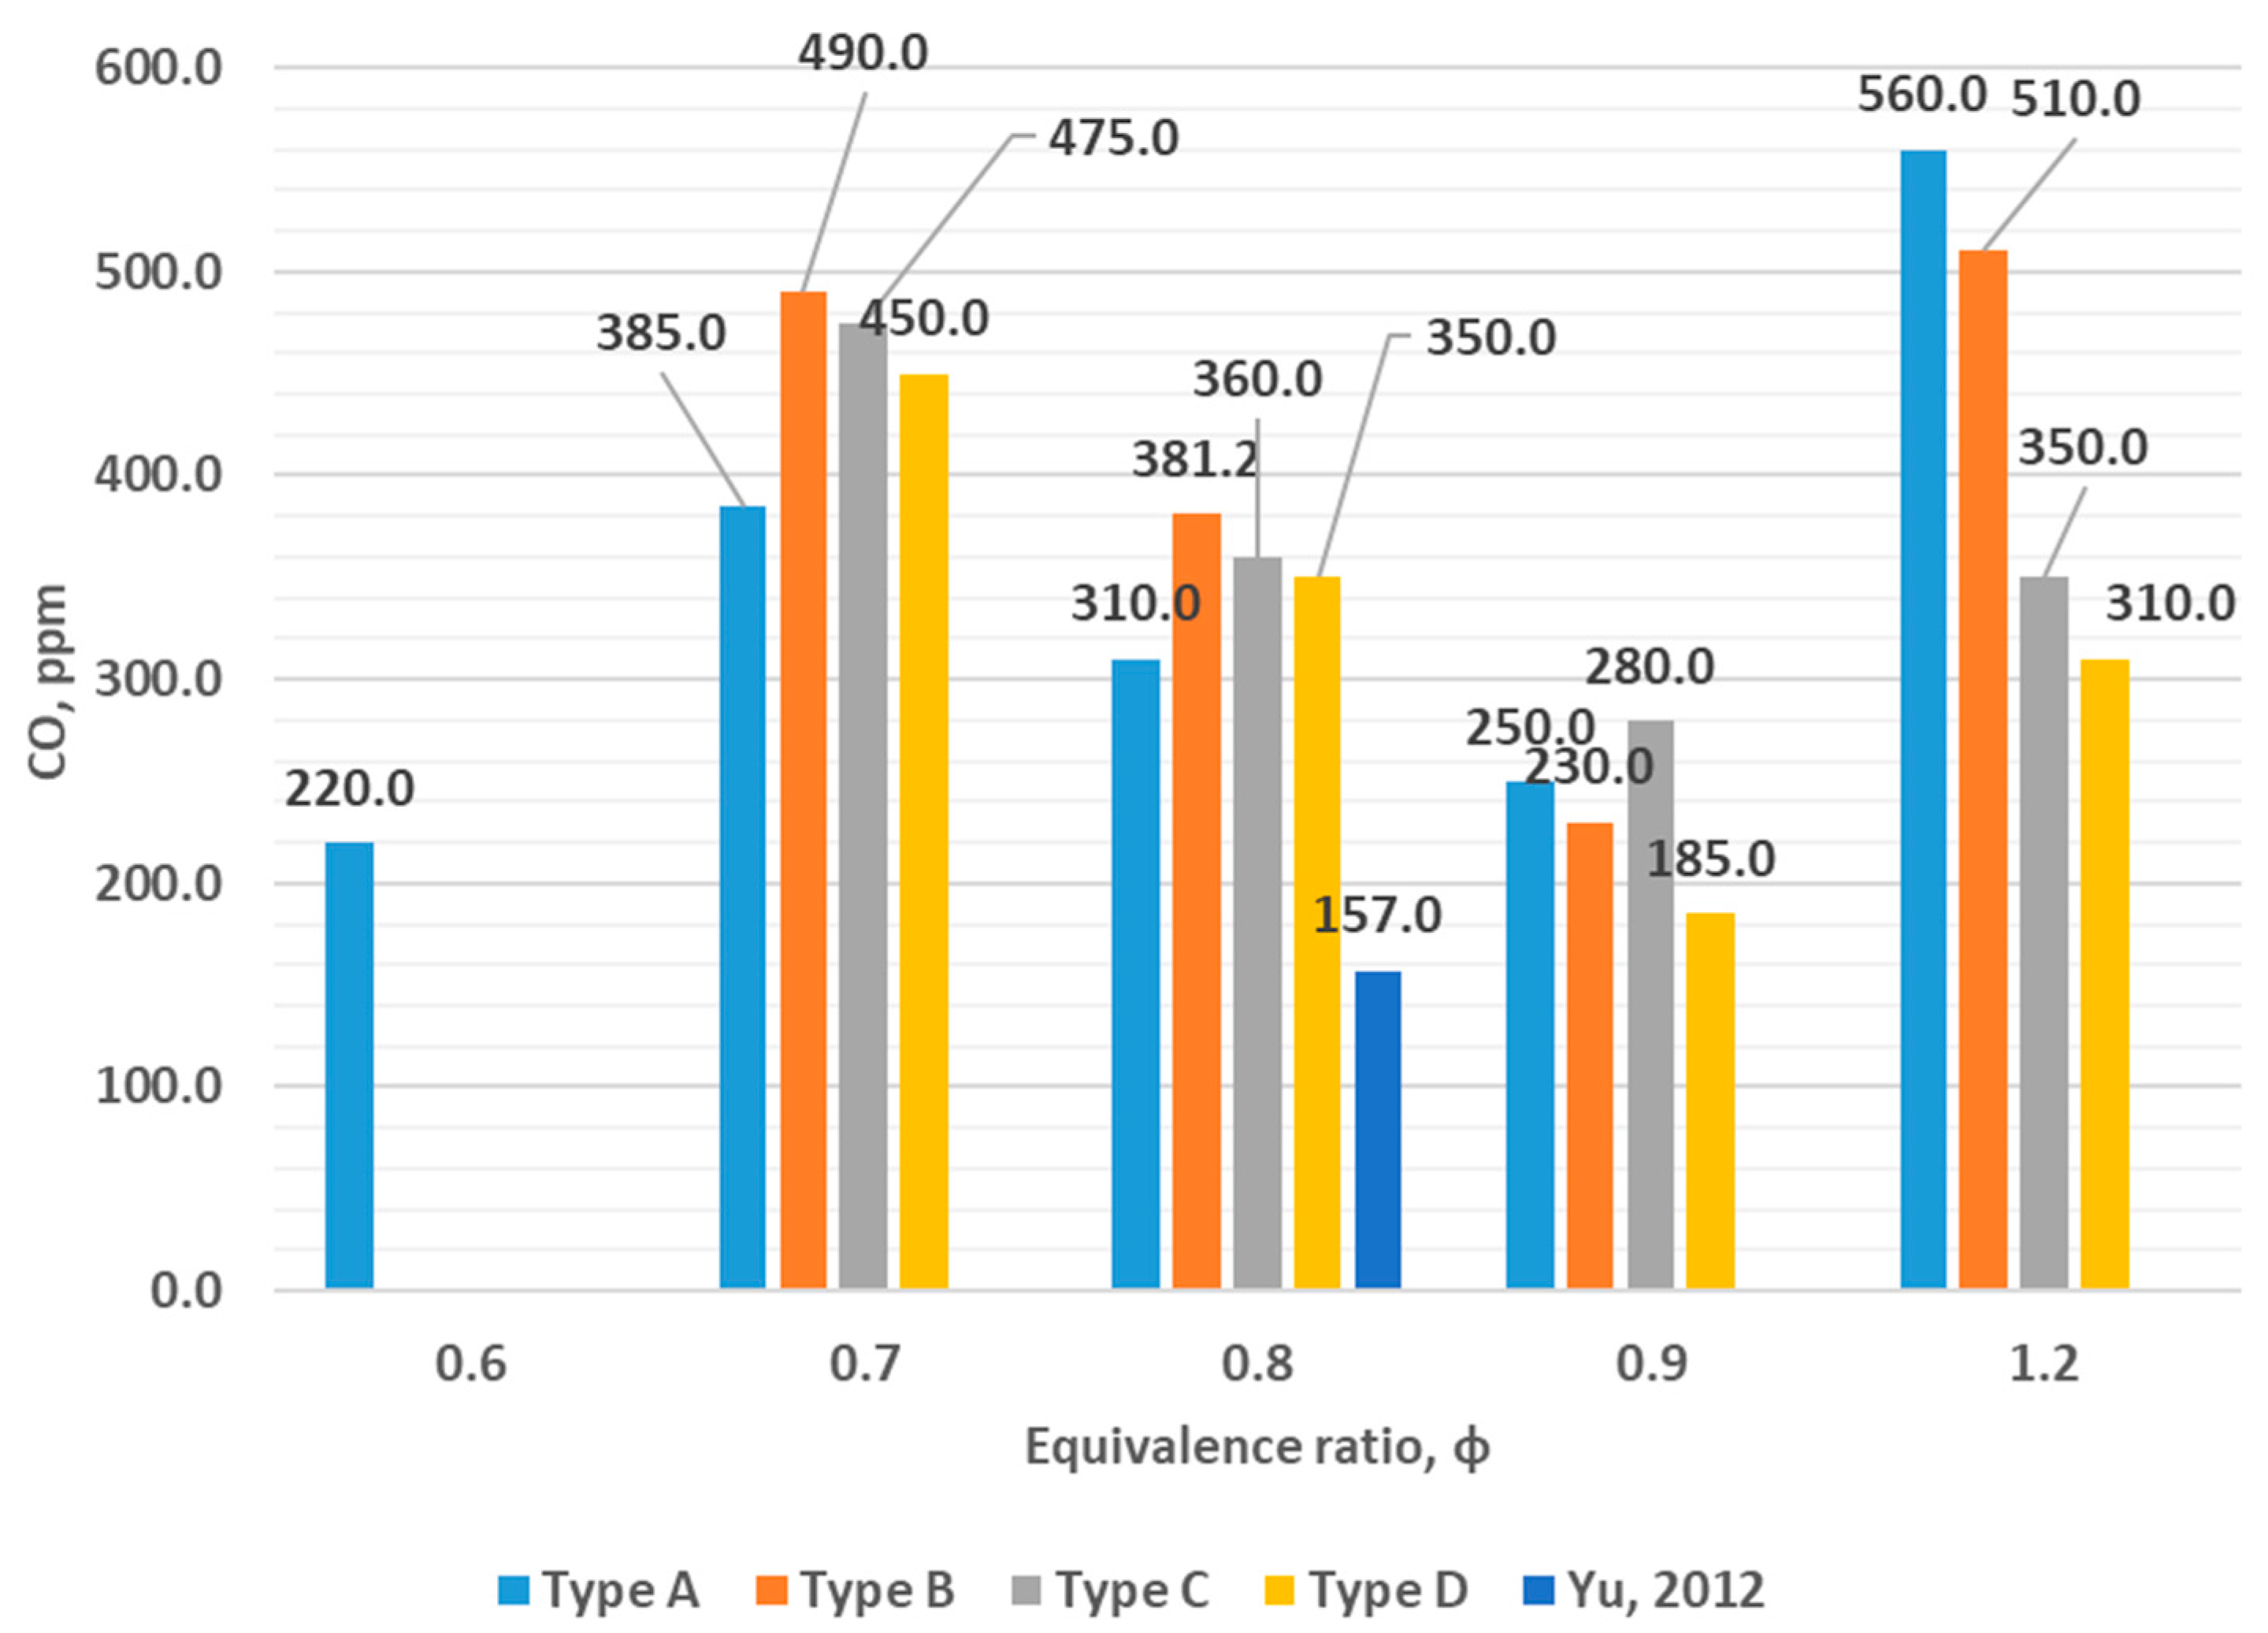
Figure 3 presents the dependence of CO concentration on the equivalence ratio and nozzle type. As shown in the figure, at φ = 0.6, the CO concentration for type A is 220 ppm. It was not possible to compare this with other nozzle types at the same equivalence ratio due to flame extinction. However, for type B, the highest CO concentration at φ = 0.6 was recorded at 490 ppm. As the equivalence ratio increases to φ = 0.7, the CO concentration rises across all nozzle types. For type A, the value increases to 385 ppm, while for types B, C, and D, the concentrations are 490 ppm, 475 ppm, and 450 ppm, respectively. Among these, type B exhibits the highest CO concentration. This can be explained by its lower aerodynamic resistance and insufficient flow swirl, which result from the burner geometry. The presence of a relatively large open space in the central part of the nozzle allows a portion of the flow to pass through without effective interaction, leading to poor fuel–air mixing and consequently incomplete combustion.
In the case of type C, the CO concentration is slightly higher than that of type D. This is attributed to the smaller hole diameters in type C, which, under the same pressure, lead to higher flow velocities and reduced residence time, causing more unburned fuel. When the equivalence ratio increases to φ = 0.8, a similar trend is observed. The CO concentrations increase further due to the higher proportion of fuel in the mixture, which promotes underburning. At φ = 0.9, the lowest CO concentrations are recorded. This is due to the approach toward the stoichiometric air–fuel ratio, which supports more complete combustion. In this mode, CO concentrations fall within the range of 185 to 280 ppm, with the lowest values observed for type D. These findings are consistent with the results reported by Yu et al. [
30], who also noted an increase in CO concentration with rising equivalence ratio. In their study of LPG combustion, maximum CO concentrations of 250–300 ppm were observed at φ = 0.85.
Figure 4 shows the CO
2 concentrations as a function of the equivalence ratio and burner nozzle type. As can be seen from the graphs, the highest CO
2 concentrations are observed at an equivalence ratio close to φ ≈ 1.0, corresponding to stoichiometric conditions. This mode ensures maximum fuel burnout. At φ = 0.6, low CO
2 concentrations are recorded, which can be attributed to significant incomplete combustion of the fuel. As the equivalence ratio increases to φ = 0.7, the CO
2 concentration rises, indicating improved combustion. The maximum CO
2 concentrations at φ = 0.7 are observed for type A, reaching 3.8%, while for types B, C, and D, the concentrations are 3.3%, 3.5%, and 2.4%, respectively. The lowest CO
2 values occur with type B, which is consistent with the lower NOx concentrations observed for this nozzle, both indicating incomplete combustion. Other nozzle types show slightly higher CO
2 concentrations under the same conditions. At φ = 0.8, type A continues to exhibit the highest CO
2 concentrations. For type B, CO
2 levels reach 3.2 ppm, which is slightly higher than at φ = 0.7. The results for types C and D are similar in trend and magnitude. As the equivalence ratio approaches stoichiometry, CO
2 concentrations increase by approximately 20–30% compared to their values at φ = 0.8, reflecting more complete fuel combustion.
However, a significant decrease in CO2 concentrations is observed at φ = 1.2. This reduction is explained by the insufficient amount of oxygen in the fuel–air mixture, which limits the combustion reaction rate compared to stoichiometric conditions, resulting in incomplete oxidation of the fuel.
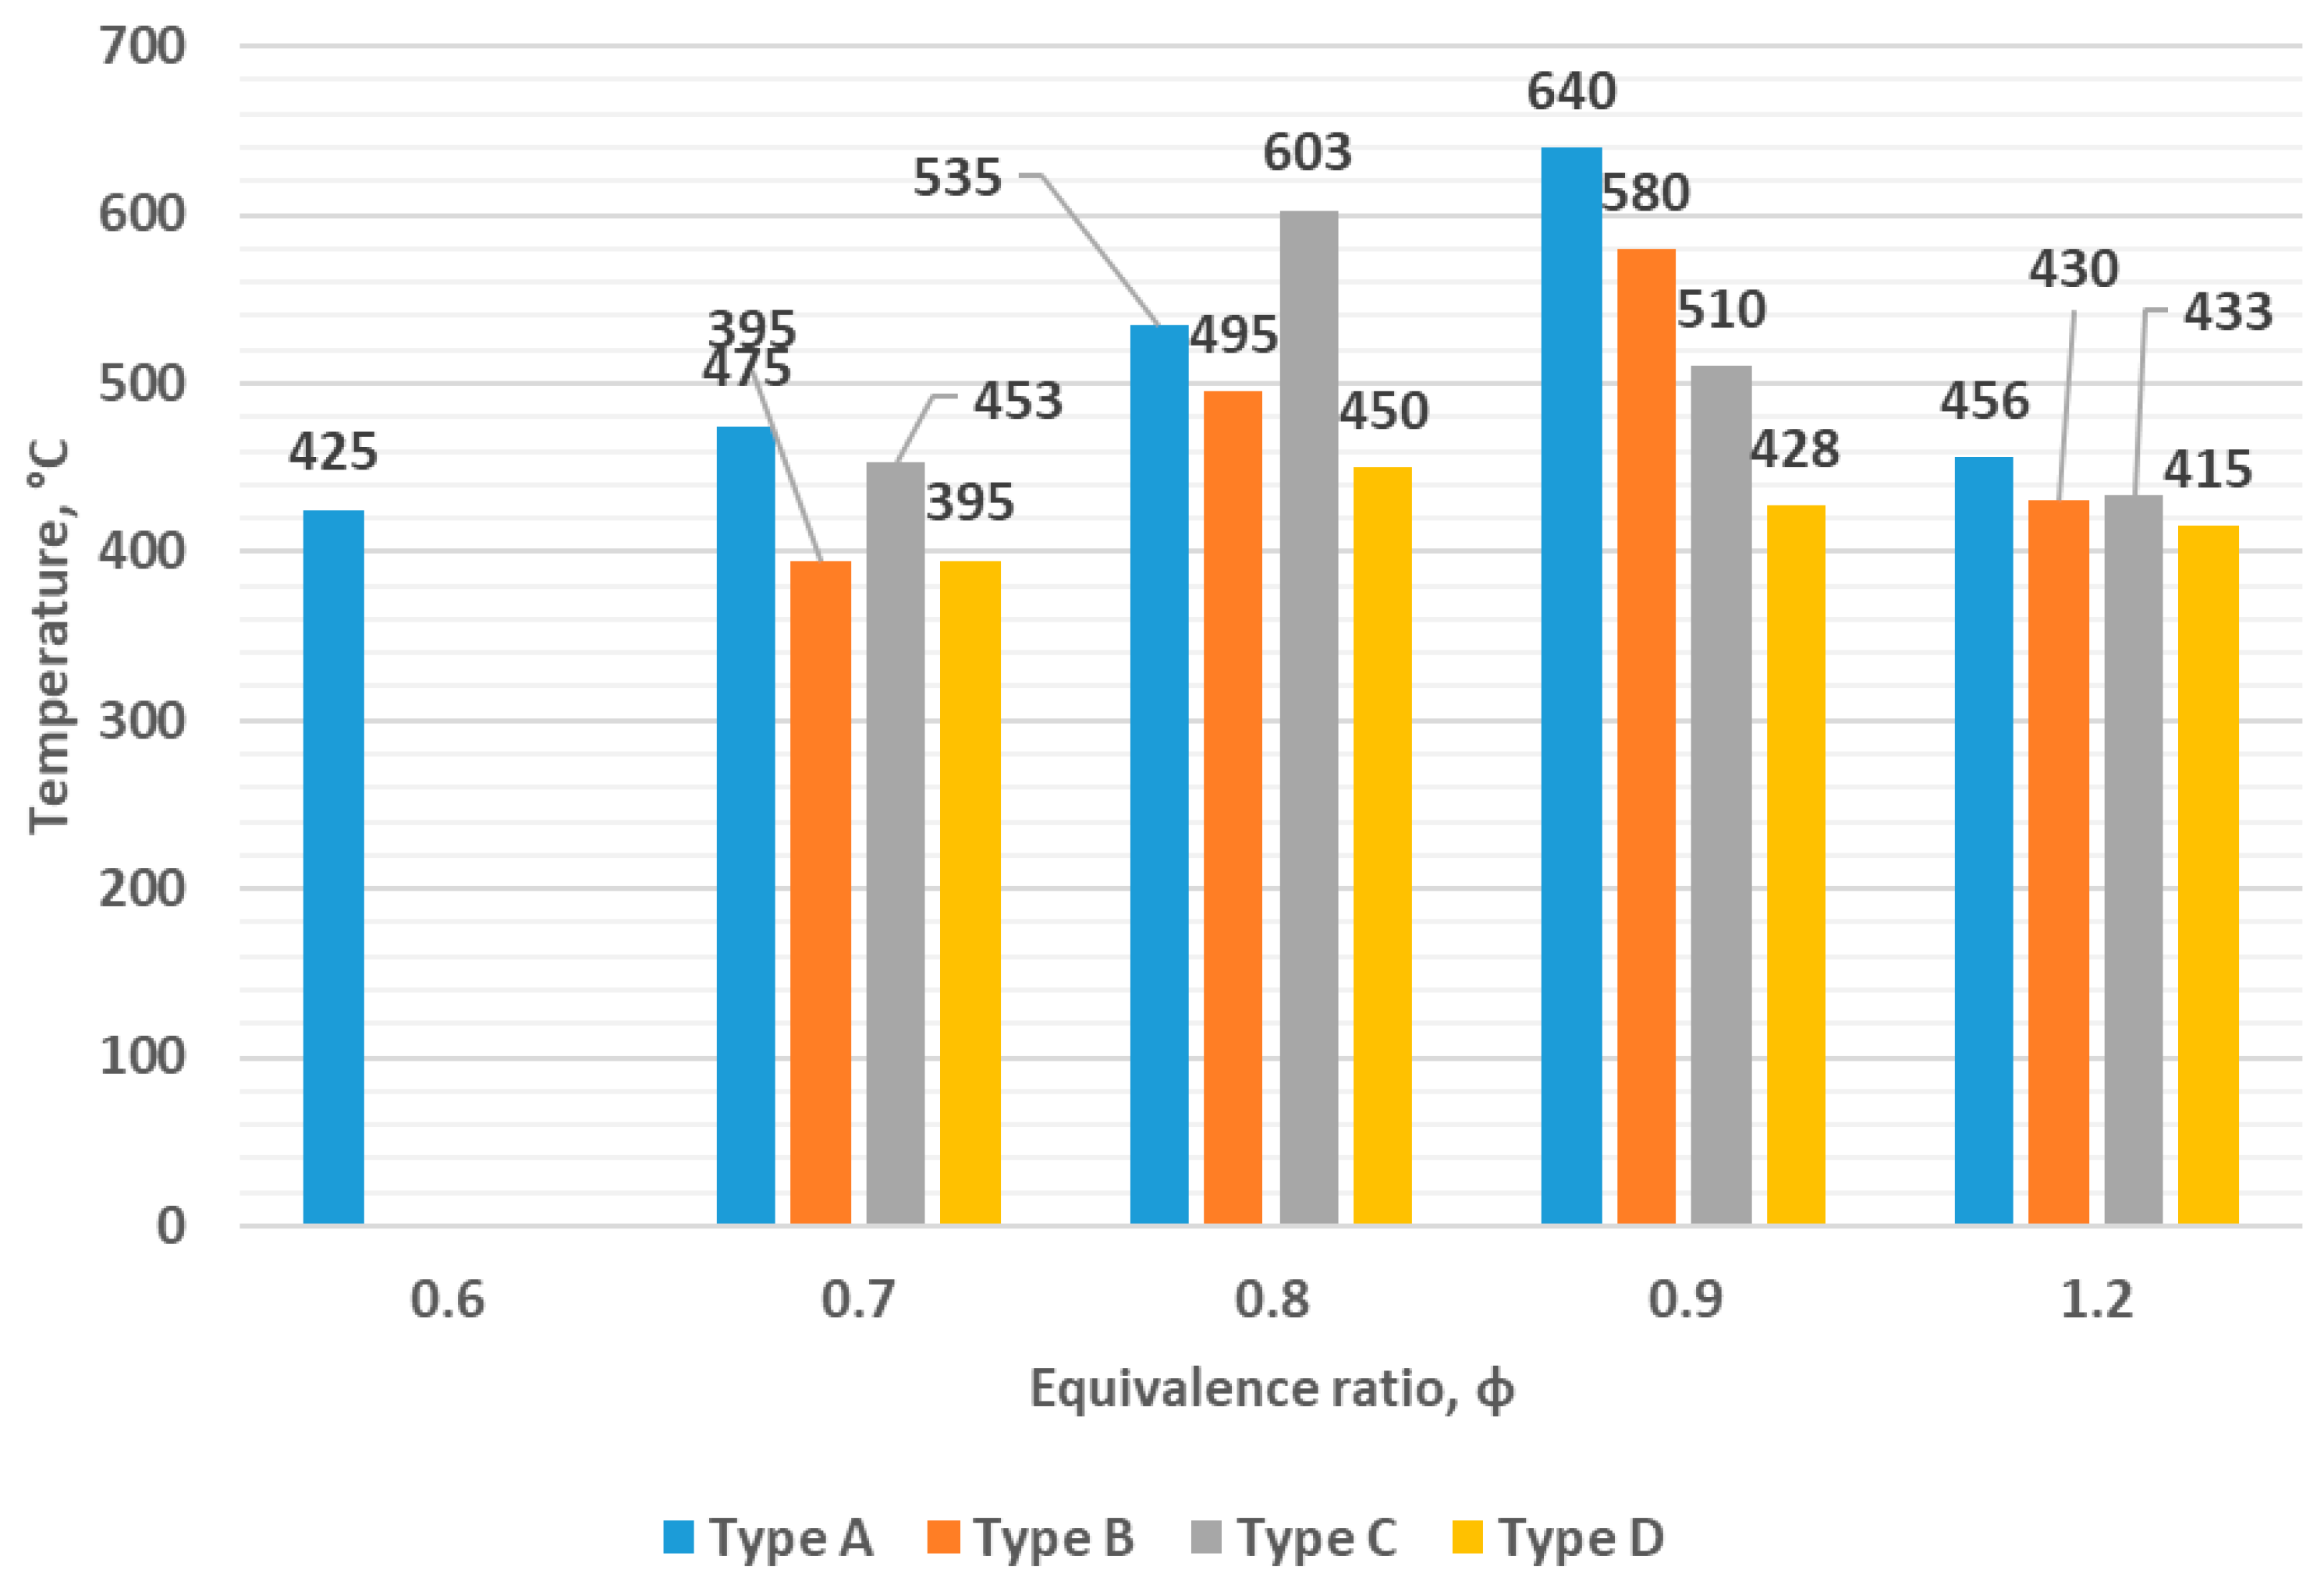
Figure 5 illustrates the relationship between exhaust gas temperature, nozzle type, and equivalence ratio. Overall, the highest temperatures are observed for the type A nozzle. This is attributed to the high heat release from combustion occurring in the central region of the burner. In this area, a long, high-temperature flame is formed due to limited swirl, which results in flame elongation and continued combustion in a narrow central zone. These conditions contribute significantly to the formation of nitrogen oxides, as confirmed by NOx measurements.
At φ = 0.6, stable combustion is observed only for the type A nozzle, accompanied by relatively high temperatures. This indicates strong flame stabilization. It is well established that diffusion flames exhibit enhanced stabilization [
27], which explains the elevated temperatures and associated emissions. At φ = 0.7, elevated temperatures are present for all nozzle types, with type A again exhibiting the highest values. This is due to diffusion-dominated combustion in the flame core. For burner type B, the exhaust gas temperature reaches 395 °C. In general, the relatively low temperatures observed correlate well with the measured NOx concentrations. For instance, at φ = 0.8, the exhaust temperature for type B increases to 453 °C.
At this equivalence ratio, the highest temperatures are still associated with burner type A. However, burner type C also demonstrates a significant temperature increase, which is attributed to an extended flame length resulting from fuel-rich conditions. The maximum exhaust temperatures occur near the stoichiometric equivalence ratio, as this regime supports complete fuel oxidation. Beyond stoichiometry, further increases in the equivalence ratio lead to reduced temperatures, primarily due to incomplete combustion in the presence of excess fuel despite sufficient oxidizer availability [
27].
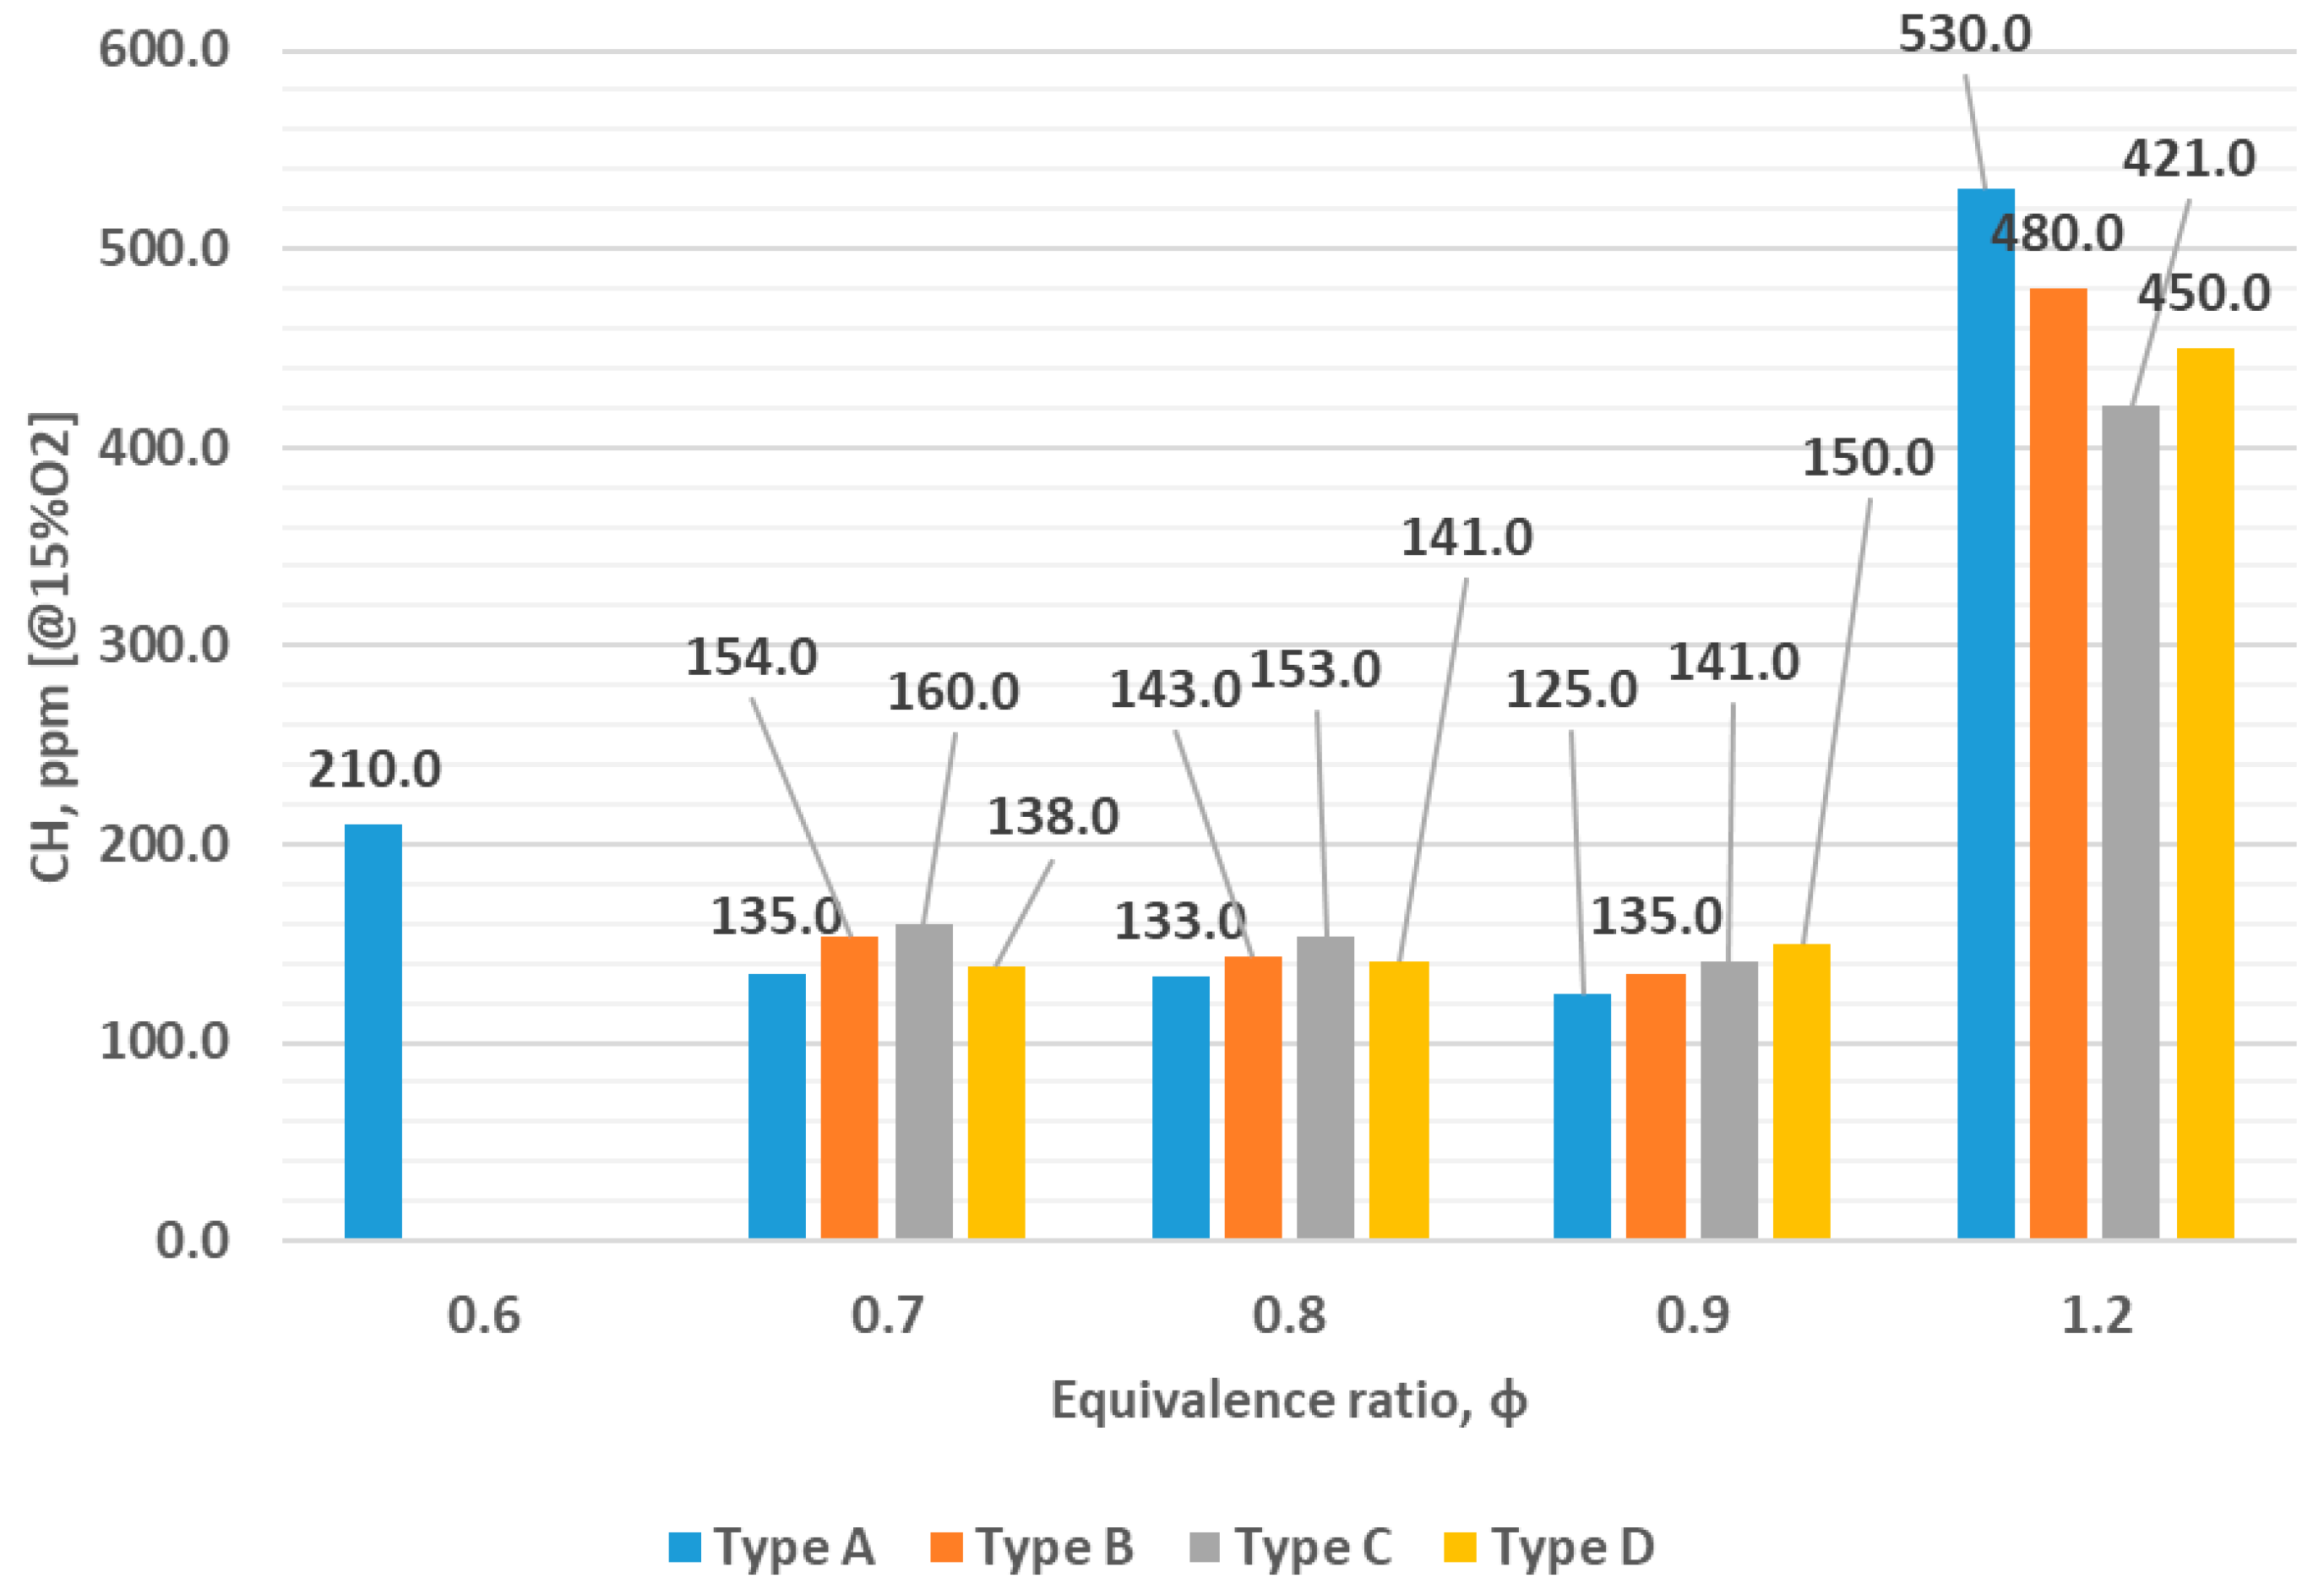
Figure 6 presents the dependence of unburned hydrocarbons (CHs) on the equivalence ratio and burner nozzle type. At φ = 0.7, the CH concentration for type A is 135 ppm. For type B, it is 154 ppm, while for types C and D, the concentrations are 160 ppm and 138 ppm, respectively. In general, the graph indicates that at relatively high air flow rates, the resulting velocities cause minor underburning of the fuel. As the equivalence ratio increases, the concentration of unburned hydrocarbons decreases slightly, due to improved combustion efficiency. Under these conditions, a considerable excess of air relative to fuel exists, which not only dilutes the mixture but also results in partial blowout of fuel from the combustion zone. Among all configurations, the type A burner shows the lowest CH concentrations.
The minimum CH concentrations are observed at φ = 0.9. This is attributed to the high degree of fuel burnout, which significantly reduces unburned hydrocarbon emissions. This observation is supported by an elevated exhaust-gas temperature of ≈640 °C and an increased NOx concentration of 54.4 ppmv measured downstream. When the equivalence ratio rises to φ = 1.2, a marked increase in CH concentration is observed, indicating substantial fuel underburning. As is well known, at φ = 1.2 the mixture contains a high proportion of fuel relative to available air, leading to oxygen deficiency and incomplete oxidation. Notably, in this mode, burner type A shows the highest CH concentrations, which is attributed to insufficient mixing of fuel and air. The presence of underburned fuel in this mode is further confirmed by elevated CO concentrations in the exhaust gases.
Figure 7 presents photographs of flame combustion for various nozzle types at different equivalence ratios. As seen in the images, high temperatures are present across all configurations, leading to visible heating of the metal components. At φ = 0.7, a blue flame is absent in all configurations except for nozzle type A. This indicates incomplete combustion, while the presence of a blue flame in type A suggests localized stoichiometric combustion in the central region.
As the equivalence ratio increases to φ = 0.8, a distinct blue flame becomes visible in the central part of the burner for all configurations, although it is least prominent in nozzle type D. The appearance of the blue flame in the remaining nozzle types indicates more efficient combustion conditions. At φ = 0.9, the flame burns with maximum brightness and stability, signifying the most effective combustion regime.
When the equivalence ratio is increased to φ = 1.2, the flame becomes unstable and partially interrupted. This disruption is caused by a deficiency of air in the fuel–air mixture, which leads to incomplete combustion and reduced flame intensity.
In steady images, we measure the axial distance from the exit plane to the point where the blue-channel intensity falls to 5% of its peak, averaged over three frames; the scale is set by the known 100 mm nozzle diameter in the field of view.
Quantitative lean blow-off limits are summarized in
Table 4: Type A sustained stable combustion down to φ = 0.60 ± 0.02, whereas Types B–D extinguished at φ = 0.66 ± 0.02, 0.68 ± 0.02, and 0.69 ± 0.02, respectively. These observations are consistent with the flame images in
Figure 7.
4. Discussion
The experimental studies conducted allow for several important conclusions. The analysis of nitrogen oxide (NOx) concentrations in the exhaust gases indicates that nozzle type A is the least effective in terms of minimizing NOx emissions. At an equivalence ratio (φ) of 0.9, all nozzle types exhibited their highest NOx concentrations. The maximum NOx level reached 54.4 ppm for type A, while the minimum was 22.4 ppm.
The study of carbon monoxide (CO) concentrations revealed a strong dependence on both the equivalence ratio and nozzle design. The lowest CO levels were observed at φ = 0.9, with concentrations of 250 ppm, 230 ppm, 280 ppm, and 185 ppm for nozzle types A, B, C, and D, respectively. Since CO formation is associated with incomplete fuel combustion, the highest concentrations were recorded at φ = 1.2, where excess fuel and a lack of oxidizer result in underburning.
Temperature measurements showed that the highest values occurred in a regime resembling diffusion combustion, especially with nozzle type A, which features a large central orifice. This configuration promotes localized high temperatures. In contrast, other nozzle types exhibited lower average temperatures due to more intensive mixing of fuel with air, which tends to smooth the temperature distribution. Overall, the highest temperatures were observed in combustion modes approaching stoichiometric conditions.
The mixing efficiency of the different nozzle types in this study was not evaluated through direct turbulence or flow-field measurements. Instead, it was assessed indirectly using exhaust gas composition (CO, CH) and combustion stability. Lower CO and CH concentrations in multihole nozzles (C and D) indicate more complete combustion, which is consistent with improved fuel–air mixing. Taking this shortcoming into account, the authors will subsequently conduct research using numerical modeling.
In practical terms, our results indicate that geometry-driven mixing should be used to temper peak flame temperatures while preserving complete burnout. Multihole nozzles achieve this naturally and therefore tend to reduce NOx compared with strongly confined swirl flames, whereas the latter benefit from moderating swirl intensity and promoting entrainment. Under our operating window the best compromise appeared near φ ≈ 0.9, where CO reached its minimum and NOx remained acceptable; in particular, the multihole configuration with larger and fewer orifices (Type D, ε ≈ 0.0576) exhibited the lowest CO at φ ≈ 0.9, consistent with more complete oxidation, while the highly confined swirl case (Type A) produced higher NOx due to longer effective residence and higher temperatures. When swirl is necessary, keeping S around 0.8 and using gentle air staging helps avoid localized hot spots.
