Abstract
Biogas, derived from human waste or industrial byproducts, is considered one of the most environmentally acceptable fuels. However, such fuels often exhibit relatively low efficiency, making it essential to develop technologies that facilitate their effective combustion. This article investigates the combustion of biogas with the addition of hydrogen at varying degrees of flow swirling. For this purpose, a burner was used in which methane, hydrogen and CO2 were mixed in a mixer. The studies revealed that increasing the proportion of hydrogen in biogas leads to an average 15% rise in the NOx concentration. Additionally, an increase in the degree of swirling has a positive effect on NOx generation. On the other hand, a higher proportion of hydrogen reduces the concentration of CO in the exhaust gases. The presence of ballast gases, such as CO2, generally results in relatively low NOx levels when combined with a high swirling number. The analysis of combustion products for CO2 indicates a 14% increase in CO2 proportion. The highest concentrations of CO2 were observed in biogas with the highest CO2 ballast content. In terms of reducing NOx and CO, SW = 1.3 is the most successful. On the other hand, this angle leads to an increase in the CO2 concentration.
1. Introduction
The use of traditional fuels remains the most common method of energy production worldwide [1]. According to statistics, traditional gas and coal currently account for more than 50% of global energy production [1]. However, the combustion of traditional fuels leads to significant emissions of nitrogen oxides, unburnt hydrocarbons, CO, CO2, and various other pollutants, depending on the type of fuel. In light of this, alternative fuels are becoming increasingly relevant. Examples include the combustion of ammonia by Sheykhbaglou et al. [2] with hydrogen additives, electrofuels [3], methanol [4], waste incineration [5], and biofuels [6]. In Kazakhstan, the issue of waste disposal is gaining significant attention. According to the concept of transitioning to a green economy [7], municipal solid waste (MSW) emissions amount to 222 kg per capita. By 2030, this figure is projected to increase by 44% compared to 2021 [7]. The same concept [7] emphasizes the need to adopt the best available technologies in waste management. Specifically, there is a focus on converting municipal solid waste into biogas for subsequent combustion. These technologies are well documented and discussed by Zupančič et al. [8].
Given this context, the utilization of biogas in burner devices is an important area of study. Moreover, with increasingly stringent regulations on harmful emissions, the use of hydrogen–biogas mixtures is particularly relevant.
In research conducted by Aiguo et.al. [9], combustion studies were performed in a micro-combustion chamber equipped with a DLE (Dry Low Emission) burner. Since biogas primarily consists of CO2, CH4, and N2, the authors achieved a significant reduction in NOx emissions. This reduction is attributed to the high CO2 content in biogas compared to traditional fuels, as CO2 acts as a ballast in the reactions responsible for nitrogen oxide formation. A similar effect is observed by Balasubramanian et al. [10] when recirculating exhaust gases into the combustion chamber. Studies on engine performance using various fuel options were conducted by De Simio et al. [11]. The analysis revealed that biogas has a significantly higher calorific value and produces relatively low concentrations of nitrogen oxides at medium engine loads. A study by Pandey et al. [12] on the addition of hydrogen to biogas in proportions of 5%, 10%, and 15% demonstrated that increasing the hydrogen content leads to a rise in the NOx concentration (measured in g/kWh). Specifically, the NOx concentration during pure hydrogen combustion is 7–8 g/kWh, while at a maximum hydrogen concentration of 15%, it reaches 12 g/kWh—an increase of 50%. However, the increase in the proportion of hydrogen also results in a reduction in unburnt hydrocarbons (UHCs). This is due to the high heat at which hydrogen combusts, which raises the temperature in the combustion zone, thereby increasing NOx formation. Emissions from the combustion of a hydrogen–biogas mixture were investigated by Buğrahan et al. [13]. Hydrogen was added in volume fractions ranging from 10% to 40%, with the biogas composition fixed at 50% CH4 and 50% CO2. The study revealed a significant decrease in the NOx concentration at hydrogen fractions of 30–40%. The authors also noted a substantial reduction in CO emissions, from 5300 ppm to 130 ppm. These findings indicate that increasing the proportion of hydrogen enhances the completeness of fuel combustion, leading to lower CO emissions. On the other hand, if the hydrogen–methane mixture is evenly distributed, it is possible to achieve a reduction in the NOx concentration. Studies on various biogas compositions with hydrogen volume fractions ranging from 5% to 25% by Amez et al. [14] showed that increasing the hydrogen content raises the temperature of the exhaust gases. Additionally, other results indicate that reducing the proportion of CO2 in biogas improves combustion stability. In terms of CO2 and NOx concentrations, an increase in the hydrogen proportion leads to higher CO2 levels and lower NOx emissions.
A study on the addition of hydrogen to biogas conducted by Zhen et al. [15] demonstrated improved flame stabilization and a reduction in the CO2 concentration as the proportion of hydrogen increased. In studies by Salman et al. [16], a mixture of biogas and hydrogen, with hydrogen comprising 5–20% of the fuel volume, was investigated. At a maximum hydrogen concentration of 20%, the CO2 concentration decreased by 56% compared to the baseline case. However, increasing the proportion of hydrogen also led to a higher heat release rate, which in turn increased NOx formation. Notably, the NOx concentration rose proportionally with the increase in hydrogen content. Similar studies were conducted by Mariani et al. [17], where the authors examined the combustion of a CH4 + CO2 + H2 mixture in a 4-stroke engine. The results indicated that the highest NOx concentrations (measured in g/kWh) occurred when using a mixture of 80% CH4 and 20% H2. In all cases, increasing the proportion of CO2 led to a reduction in the NOx concentration per unit of power. Another study on biogas combustion with hydrogen addition conducted by Nurmukan et al. [18], involving hydrogen proportions ranging from 0 to 40% by volume, found that increasing the hydrogen content improved flame stabilization across all tested conditions. Similarly, the addition of hydrogen to biogas was studied in the range of 0 to 50% by Benaissa et al. [19]. Studies have shown that adding hydrogen at 50% by volume leads to a reduction in the NOx concentration. This is attributed to a shorter flame and faster fuel burnout, which decreases the formation time of nitrogen oxides. Another significant finding is that the concentrations of CO and CO2 decrease as the proportion of hydrogen increases and the equivalence ratio decreases. In a study conducted by Gonzalez et al. [20], the impact on the laminar combustion rate and flame structure of biogas was investigated at an equivalence ratio of 1.0. The addition of hydrogen was found to increase the NO concentration while significantly reducing CO2 levels. Hosseini et al. [21] studied the flameless combustion of hydrogen-enriched biogas. The biogas composition was 40% CO2 and 60% CH4, with hydrogen volume concentrations ranging from 2% to 10%. The results indicated that a small proportion of hydrogen (below 4%) reduces the NOx concentration. However, when the hydrogen proportion exceeds 4%, NOx levels increase due to higher temperatures in the combustion zone and an elevated concentration of O radicals. Yilmaz et al. [22] studied the effect of the swirl number on the combustion characteristics in a natural gas diffusion flame.
Swirl numbers (SW) ranging from 0 to 0.6 with a step of 0.1 were used in this study. The results indicated that at SW > 0.4 in the axial direction, the concentration of CH4 (i.e., fuel) is significantly reduced. Similarly, the concentration of CO2 increases. Saqr et al. [23] investigated the effect of turbulence on the formation of NOx and soot. As demonstrated by the studies, an increase in turbulence leads to a significant reduction in soot by 16%. A decrease in the NOx concentration was also observed, attributed to the more effective dispersion of fuel across the combustion area. Elbaz et al. [24] studied the impact of different angles in a two-level burner. The research revealed that the degree of angle setting has a significant effect on combustion processes. Specifically, it was found that increasing the swirl angle of the flow in the internal cavity, along with an increase in the angle of the external cavity, results in an expansion of the recirculation zone. An enlarged recirculation zone leads to a reduction in the average temperature and, consequently, a decrease in the concentration of NOx. Wojciech et al. [25] investigated the oxidation of the hydrogen sulfide contained in biogas. The research demonstrated that an increase in the proportion of CO2 in the gases leads to a higher proportion of H2S oxidation to SO2.
The analysis highlights that the influence of flow swirl on the formation of nitrogen oxides, carbon monoxide, and carbon dioxide in various biogas compositions has not been sufficiently studied to date. Another critical area of research is the effect of hydrogen addition. In this article, a burner device is proposed in which hydrogen-enriched biogas of varying compositions is supplied. Additionally, the position of the outlet vanes in the burner was adjusted, affecting the degree of flow swirl.
2. Materials and Methods
To conduct experimental studies, a burner was developed, as shown in Figure 1. Table 1 provides the geometric dimensions of the burner device. The burner consists of inlet vanes set at a 45° angle, a fuel pipe equipped with fuel nozzles (each with a diameter of 2 mm), and outlet vanes at the burner exit. The angle of the outlet vanes can be adjusted within the range of 30° to 60°. During the study, the fuel was premixed and supplied through the fuel nozzles, while air was introduced through the inlet vanes.
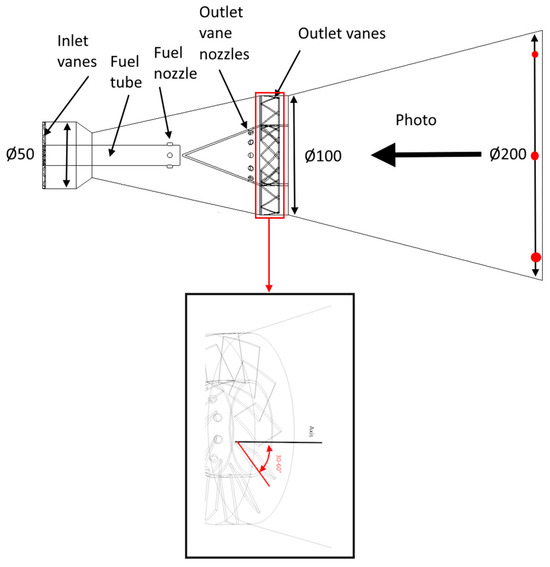
Figure 1.
Experimental burner.

Table 1.
The dimensions of the burner device [26].
It was assumed as a baseline that the burner angles would rotate from 0° to 90°. However, the extreme values (0° and 90°) indicate the complete closure of the outlet section. Therefore, three intermediate points were selected with a step of 15°. The composition of the biogas was chosen conservatively. Based on the literature analysis, the average composition of biogas is 50% methane (CH4) and 50% carbon dioxide (CO2). At the initial stage of the study, the authors decided to slightly modify the biogas composition by varying the methane content by ±10%.
To calculate the equivalence ratio values, the formula below was used:
where is the equivalence ratio, is the fuel-to-air ratio, and refers to the stoichiometry.
The volume fraction of hydrogen is calculated using Formula (2):
where —hydrogen fraction, —hydrogen flow, and —biogas flow.
The degree of flow swirl is calculated using Formula (3):
where —hub radius, —outer radius, and —angle of outlet vanes (30–60°).
The Reynolds number was calculated by the following formula:
where —velocity, —diameter, and —viscosity.
The combustion efficiency was calculated as follows:
Table 2 presents the experimental conditions. High-purity hydrogen was used in the experiments. The biogas flow rate remained constant, with only its composition being varied. The biogas compositions considered in the study are detailed in Table 3. As shown in the table, three compositions with different concentrations of CH4 and CO2 were examined. Table 4 provides the main performance indicators and measurement errors of the equipment used.
Table 2.
Experimental conditions [26].
Table 3.
Initial conditions.
Table 4.
Equipment and error margin [26].
Figure 2 illustrates the experimental setup, including the main measurement locations and devices. As shown in the figure, natural gas, hydrogen, and CO2 were mixed in a dedicated mixing chamber. The gas flow rates were monitored using flow meters (Flomec, Caringbah, Australia). After mixing, the gases were fed into the burner, where they were dispersed through fuel nozzles arranged radially around the fuel tube. Following the combustion process, the temperature was monitored using chromel–copel thermocouples, and the data were recorded with a multimeter. Subsequently, the gas composition was analyzed using a gas analyzer.
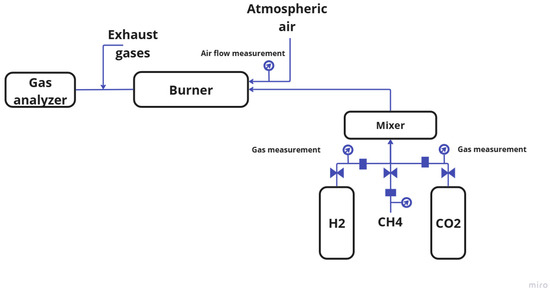
Figure 2.
Experimental setup and equipment.
The measurement error of the device was calculated using the following formula:
where denotes the relative error of the thermometers, denotes the relative error of the thermocouple, denotes the relative error of the NOx measurements, and denotes the relative error of the CO measurements [26].
The standard deviation of the measurements is calculated as follows:
where denotes the deviation of the measurements.
The standard deviation of the mean measurements is as follows:
The standard deviations of the measurements are presented in Table 5 [26].
Table 5.
Uncertainty analysis of the results [26].
3. Results and Discussion
3.1. NOx, CO2 and CO Emissions
The results of the study on the effect of the swirl number (SW) and hydrogen content on the NOx concentrations are presented in Figure 3. As shown in the figure, at SW = 0.4, the NOx concentration reaches its maximum for all cases. For Type 1, the NOx concentration increases from 21 to 32 ppm as the hydrogen proportion rises from 0% to 40%. This is attributed to the fact that Type 1 has the highest concentration of CH4, which increases the lower heating value (LHV) of the mixture. At a low SW value, the mixing of fuel with air is relatively slow, leading to the formation of localized high-temperature zones and, consequently, thermal nitrogen oxides. At SW = 0.8, a slight decrease in the NOx concentration is observed. The highest NOx concentrations still occur for Type 1, which has the highest methane concentration. Notably, at the maximum hydrogen concentration (40%), the NOx concentration values for all types converge. Similar trends are observed for SW = 1.3, although the concentration values are somewhat lower. This is due to the shorter flame length resulting from strong flow swirl and rapid fuel–air mixing, which ensures faster burnout. It is well known that nitrogen oxides are formed through several mechanisms, including thermal, prompt, NNH, and N2O mechanisms [27].
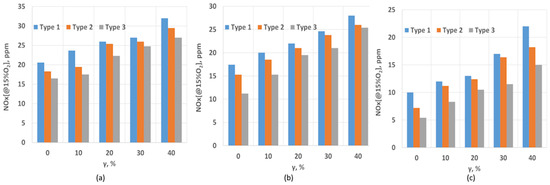
Figure 3.
NOx dependence on SW and hydrogen content: (a) SW = 0.4; (b) SW = 0.8; (c) SW = 1.3.
In the combustion of hydrogen–biogas mixtures, the key factors influencing NOx formation include the residence time of gases in the combustion zone, the flame temperature, and the efficiency of fuel–air mixing. Importantly, when hydrogen is added, the N2O formation mechanism becomes dominant at sufficiently high flame temperatures. This mechanism involves the “attack” of NO by O and H radicals, leading to an increase in N2O concentrations [28].
When fuel and air are insufficiently mixed, the flame lengthens, and the combustion products burn out in the flame’s tail, creating a high-temperature zone. On the other hand, a low swirl rate reduces the mixing of fuel, particularly the ballast effect of CO2, which would otherwise help lower NOx concentrations. The graphs indicate that the highest NOx concentrations occur in less swirling flows due to the extended time the gases spend in the high-temperature zone.
Figure 4 shows the dependence of the NOx concentration in the exhaust gases on the swirl number (SW). To plot the graph, a hydrogen concentration of 30% was selected. This was done to evaluate the effect of swirl and the biogas composition on the formation of nitrogen oxides. As seen in the figure, swirl significantly influences NOx concentrations. For Type 1, at a low SW value, the NOx concentration is 27 ppm, while at maximum swirl, it decreases to 17 ppm. A similar trend is observed for Type 2, where the maximum NOx concentration is 26 ppm, decreasing to 16.4 ppm at the highest swirl level. On average, increasing the swirl reduces NOx concentrations by 20%. Furthermore, increasing the swirl from SW = 0.8 to SW = 1.3 results in a 30% reduction in the NOx concentration. This reduction is attributed to the strong flow swirl, which enhances the mixing of fuel with the oxidizer, preventing the formation of localized high-temperature zones. Additionally, the faster combustion rate, facilitated by the addition of hydrogen, reduces the residence time of gases in the high-temperature zone, further lowering NOx formation.
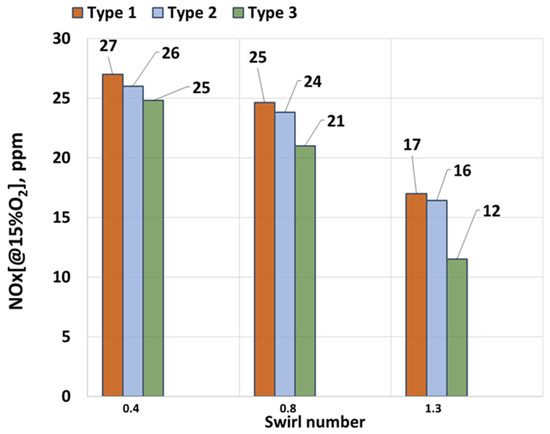
Figure 4.
NOx dependence on SW.
Figure 5 shows the dependence of the CO2 concentration in the exhaust gases on the volume fraction of hydrogen in the fuel. As seen in the figure, for SW = 0.4, the percentage of CO2 in the exhaust gases decreases as the proportion of hydrogen increases. At γ = 0%, the CO2 concentration is 12%, and with an increase to γ = 10%, the CO2 concentration decreases by 12%. In general, the proportion of CO2 in the exhaust gases decreases proportionally with the increase in hydrogen content. It is also important to note that an increase in the CO2 concentration leads to gas ballasting, which reduces the overall combustion temperature. For SW = 0.8, a similar trend is observed: an increase in the proportion of hydrogen results in a decrease in CO2 concentration. Specifically, increasing the hydrogen concentration from 0% to 10% reduces the CO2 proportion by 7%. This is because, at SW = 0.8, the improved mixing ensures a high combustion efficiency, and the addition of hydrogen leads to its combustion, which does not produce CO2. A comparable trend is observed for SW = 1.3. The highest proportion of CO2 is noted here due to the higher completeness of fuel combustion. However, in all cases, the CO2 concentration decreases as the proportion of hydrogen increases. As the proportion of hydrogen increases, hydrogen plays a larger role in the combustion process, and since hydrogen combustion does not produce CO2, its concentration in the exhaust gases decreases. Wei [29] demonstrated that increasing the proportion of hydrogen enhances the power output due to hydrogen’s higher energy content. Additionally, [16,30] show that increasing the proportion of hydrogen in CO2-ballasted gases leads to a reduction in the percentage of CO2 in the exhaust gases.
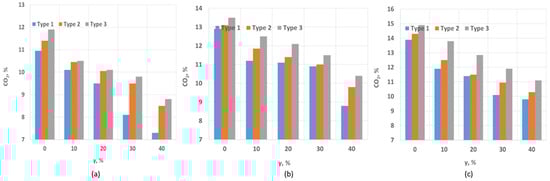
Figure 5.
CO2 dependence on SW and hydrogen content: (a) SW = 0.4; (b) SW = 0.8; (c) SW = 1.3.
Figure 6 shows the dependence of the CO2 concentration on the swirl number at a constant hydrogen fraction. As seen in the figure, the highest CO2 concentrations in the exhaust gases occur at the maximum swirl number. This is due to higher combustion completeness and improved contact between the fuel and oxidizer. The maximum CO2 concentrations are also observed for Type 2 fuel, which has the highest CO2 content. This is attributed to the additional generation of CO2 during the methane combustion process. The lowest CO2 concentrations are observed for Type 1 fuel across all cases. At a swirl number of 0.8, a slight decrease in the CO2 concentration is noted, resulting from reduced combustion completeness due to a smaller recirculation zone being formed behind the outlet vanes. This leads to flame elongation and the relatively insufficient mixing of fuel with air. At a swirl number of 0.4, the CO2 concentrations are minimal, as insufficient combustion occurs in a poorly developed recirculation zone.
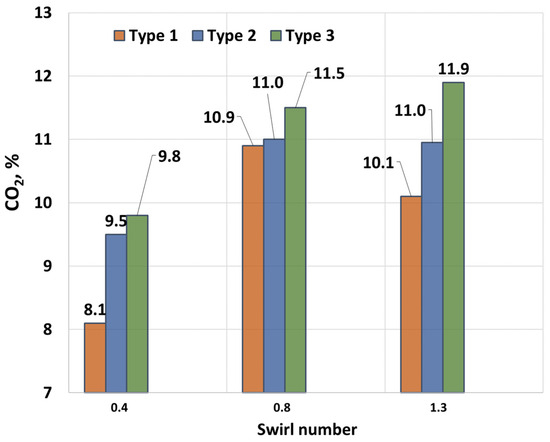
Figure 6.
CO2 dependence on swirl number.
Increasing the proportion of CO2 in biogas–H2 mixtures can lead to a decrease in the flame temperature [30], which can suppress the generation of CO. Moreover, a higher concentration of CO2 leads to the oxidation of CO through the following reaction: OH + CO = CO2 + H.
Figure 7 shows the dependence of the CO concentration on the hydrogen fraction and swirl number. As seen in the study results, the CO concentration is highest for Type 1, reaching 257 ppm at SW = 0.4. Types 2 and 3 exhibit slightly lower CO concentrations. Increasing the swirl number leads to a reduction in the CO concentration in the exhaust gases. This is primarily due to more efficient combustion, as a more developed recirculation zone improves the mixing of fuel with air. Another factor contributing to the decrease in the CO concentration is the hydrogen content. As is known, CO forms in “colder” zones due to incomplete oxidation reactions. Elevated temperature levels and a well-developed recirculation zone ensure complete combustion, minimizing CO formation. Similar conclusions can be drawn for SW = 1.3. A more developed recirculation zone ensures higher combustion completeness and elevated temperatures, as evidenced by the NOx concentration data. These factors collectively lead to a reduction in CO levels in the exhaust gases.
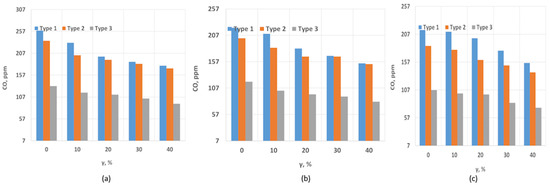
Figure 7.
CO dependence on SW and hydrogen content: (a) SW = 0.4; (b) SW = 0.8; (c) SW = 1.3.
As studies have shown, an increase in the proportion of methane leads to an increase in the size of the flame. The larger the flame size, the more the flame is subject to FWI, a long high-temperature zone and, accordingly, an increased high-temperature zone in which gases are located [30]. An increase in the proportion of CO2 leads to a decrease in the length of the flame and its size as a whole, which reduces the FWI effect and the time the gases stay in the high-temperature zone and then in the cold zone of the walls, which leads to a decrease in the concentration of CO. Moreover, studies by Wei [30] showed that the presence of free OH radicals in the combustion zone leads to the oxidation reaction OH + CO = CO2 + H. Similar results regarding the decrease in the concentration of CO with an increase in the proportion of hydrogen were found in [31,32,33].
Figure 8 shows the dependence of the CO concentration on the swirl number (SW). As seen in the figure, swirling significantly influences combustion processes, particularly reducing CO emissions. As previously discussed, increasing the swirl number raises the temperature in the combustion zone, which reduces the “cold” zones and enhances fuel–air mixing. For SW = 0.4, the maximum CO concentration is 187.5 ppm, while for SW = 0.8 and SW = 1.3, it decreases to 168 ppm and 165 ppm, respectively. Overall, flow swirling represents the most optimal technical solution for reducing CO emissions.
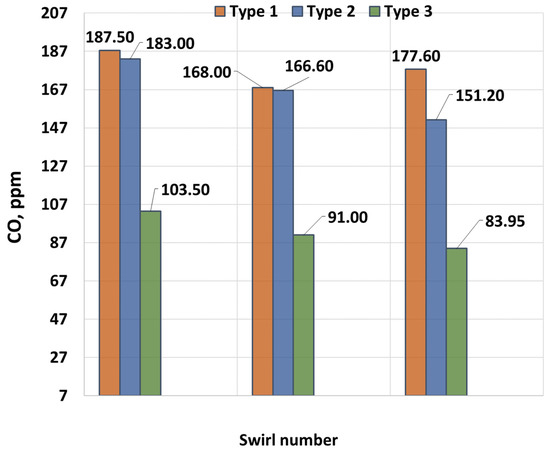
Figure 8.
CO dependence on SW.
As is known, flow swirl plays an important role in the formation of CO. However, the analysis of the effect of swirl shows that the highest concentrations occur with low swirl. This is due to the fact that with low swirl, the flame has a longer structure, which leads to a significant increase in the length of the torch and the formation of a cold air flow around the torch. This effect leads to the cooling of gases in the peripheral areas, which increases the concentration of CO. Moreover, the higher the concentration of CH4, the longer the torch, and the more carbon in the gas flow [30]. Accordingly, the maximum concentrations are inherent in gases with the maximum share of CH4.
3.2. Combustion Efficiency
Figure 9 and Figure 10 show the dependence of the combustion efficiency on the hydrogen fraction and swirl number (SW). As seen in the figures, the combustion efficiency is equally influenced by the flow swirl and hydrogen content. The highest combustion efficiency is achieved for Type 1 fuel. This is because the heat of combustion for this composition is higher than for the others, leading to a reduction in CO emissions, which is factored into the combustion efficiency calculations. More ballasted gases, on the other hand, lower the overall temperature, resulting in incomplete fuel combustion. When the swirl degree increases to SW = 0.8, the combustion efficiency improves due to better fuel–air mixing. As shown in the figure, increasing the hydrogen fraction also enhances the degree of fuel burnout. Notably, the absence of hydrogen results in relatively low combustion efficiency values. At a swirl degree of 1.3, the maximum combustion efficiency is observed. This is supported by NOx measurements, which increase due to higher temperatures resulting from more complete fuel burnout. Additionally, the rise in CO2 concentration indicates a complete combustion reaction. The maximum combustion efficiency of 99.5% is achieved at SW = 1.3 and a hydrogen concentration of γ = 40%. The oxygen content is presented in Figure 11.
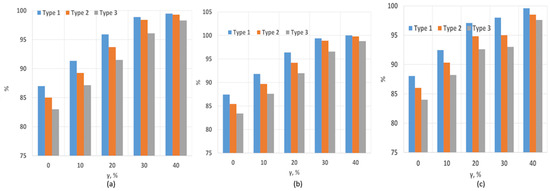
Figure 9.
Combustion efficiency dependence on SW and hydrogen content: (a) SW = 0.4; (b) SW = 0.8; (c) SW = 1.3.
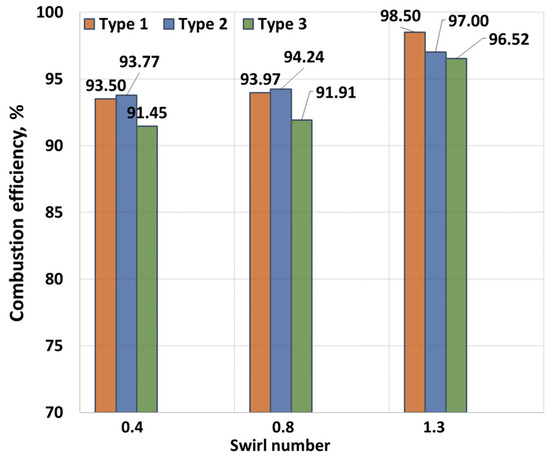
Figure 10.
Combustion efficiency dependence on SW.
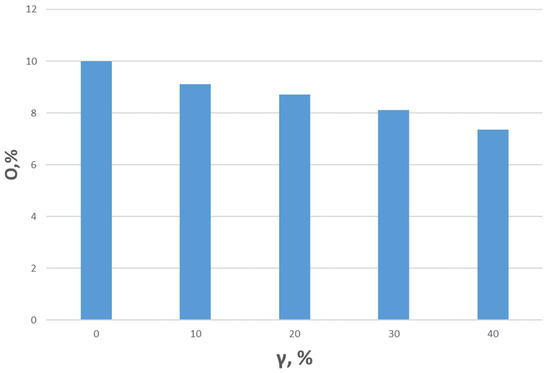
Figure 11.
O2 content relative to the hydrogen content in flue gases.
3.3. Flame Shape
Figure 12 shows photographs of the flame at varying hydrogen concentrations. As seen in the images, increasing the proportion of hydrogen leads to a significant rise in temperature. At the maximum hydrogen concentrations, the walls and blades of the burner device heated up considerably. Additionally, the partial “disappearance” of the blue flame was observed at the highest hydrogen concentration. In the first figure, a slightly blue flame is seen. It is evident that the flow is swirling. An increase in the proportion of hydrogen leads to an increase in the flame temperature, and incandescent particles are seen due to the high flame temperature. A significant concentration of hydrogen leads to a high flame temperature and the significant heating of the metal surfaces. A similar flame shape with swirling flow was seen in [24].
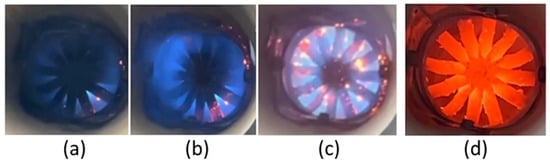
Figure 12.
Flame photos and dependence on hydrogen content: (a) 10% H; (b) 20% H; (c) 30% H; (d) 40% H.
4. Conclusions
In this study, an experimental investigation was conducted on the combustion of biogas with varying compositions, diluted with hydrogen to different degrees, and under varying flow swirl conditions. The study revealed that the highest NOx concentrations occur at minimal flow swirl for Type 1 biogas with a hydrogen proportion of 40%. Under these conditions, the NOx concentration in the exhaust gases reaches 32 ppm. Increasing the swirl number to 0.8 reduces the NOx concentrations to 28 ppm for the same gas composition. It was found that increasing the flow swirl reduces NOx concentrations by an average of 20%. Additionally, adding hydrogen leads to an increase in the NOx concentration. For biogas composed of 50% CH4 and 50% CO2, a 10% increase in the hydrogen content raises the NOx concentration from 20.58 ppm to 23.66 ppm, representing a 14% increase.
The CO concentration is highest for Type 1 biogas, reaching 257 ppm at SW = 0.4. Types 2 and 3 exhibit slightly lower CO concentrations. Increasing the swirl number reduces the CO concentrations in the exhaust gases, primarily due to more efficient combustion resulting from a well-developed recirculation zone, which improves fuel–air mixing.
At SW = 0.4, the percentage of CO2 in the exhaust gases decreases as the proportion of hydrogen increases. At a 0% hydrogen content, the CO₂ concentration is 12%. Increasing the hydrogen content to 10% results in a 12% decrease in the CO₂ concentration. In general, the proportion of CO2 in the exhaust gases decreases proportionally with the increase in the hydrogen content. It is also important to note that higher CO2 concentrations lead to gas ballasting, which reduces the overall combustion temperature.
The combustion efficiency is equally influenced by the flow swirl and hydrogen content. The highest combustion efficiency is achieved for Type 1 biogas, as its higher heat of combustion leads to lower CO emissions, which is factored into the efficiency calculations. More ballasted gases lower the overall temperature, resulting in incomplete fuel combustion. Increasing the swirl degree to SW = 0.8 enhances the combustion efficiency due to improved fuel–air mixing. Additionally, increasing the hydrogen fraction improves the degree of fuel burnout.
The study demonstrates that the most effective way to enhance the environmental friendliness of biogas combustion is through the addition of hydrogen and the use of swirl techniques. Maximum flow swirl ensures a high degree of fuel burnout but increases the concentrations of CO2 and NOx. Therefore, careful attention must be paid to the degree of swirl, which should be optimized for specific applications. Table 6 presents the main results of the study. The table displays the results for average values of flow swirl (SW = 0.8) and an average hydrogen concentration of 30%.
Table 6.
Results.
According to the technical regulations for boiler plants and gas turbines [34], it is necessary to enhance the requirements for the burner devices being developed, particularly regarding the concentrations of nitrogen oxides (NOx). The current upper limit for nitrogen oxides, as per the regulations, is 0.088 g/MJ.
In the future, these requirements are expected to become even more stringent. Based on the studies cited, it is essential to focus on the equivalence ratio and its impact on the formation of toxic substances. Additionally, future research should also prioritize flame stabilization.
Author Contributions
Conceptualization, G.A.K.; methodology, D.R.U. and A.M.D.; software, D.R.U. and K.S.I.; validation, A.M.D. and A.A.T.; formal analysis, A.S.T.; investigation, G.A.K. and A.M.D.; resources, A.M.D.; data curation, K.S.I.; writing—original draft preparation, D.R.U.; writing—review and editing, D.R.U. and A.A.T.; visualization, D.R.U. and A.S.T.; supervision, A.M.D.; project administration, A.A.T.; funding acquisition, G.A.K. and A.A.T. All authors have read and agreed to the published version of the manuscript.
Funding
This research received no external funding.
Data Availability Statement
Raw data can be provided by the corresponding author (D.R.U.) upon reasonable request.
Conflicts of Interest
The authors declare no conflicts of interest.
Abbreviations
The following abbreviations are used in this manuscript:
| SW | Swirl number |
| BG | Biogas |
References
- World Energy Review 2024, Eni. Available online: https://www.eni.com/content/dam/enicom/documents/eng/visione/wer/2024/World-Energy-Review-2024.pdf (accessed on 10 February 2025).
- Sheykhbaglou, S.; Dimitriou, P. Numerical Analysis of Combustion and Thermal Performance of a Bluff-Body and Swirl-Stabilized Micro-Combustor with Premixed NH3/H2/Air Flames. Energies 2025, 18, 780. [Google Scholar] [CrossRef]
- Goldmann, A.; Sauter, W.; Oettinger, M.; Kluge, T.; Schröder, U.; Seume, J.R.; Friedrichs, J.; Dinkelacker, F. A Study on Electrofuels in Aviation. Energies 2018, 11, 392. [Google Scholar] [CrossRef]
- Xiahou, M.; Lu, T.; Liu, H.; Wang, T.; Sun, K.; Pang, Z. Study on ignition process and control mechanism of pilot diesel-ignited high-pressure direct-injection methanol combustion with an eccentric configuration. Appl. Therm. Eng. 2025, 267, 125800. [Google Scholar] [CrossRef]
- Wang, T.; Liu, B.; Xue, Y.; Wang, W.; Chen, S. Effect of textile waste on incineration behavior of dyeing sludge: Combustion characteristics, gas emissions, kinetics. J. Clean. Prod. 2024, 435, 140619. [Google Scholar] [CrossRef]
- Zhao, X.; Ng, J.H.; Mong, G.R.; Mashruk, S.; Lee, C.T.; Fang, X.; Wong, K.Y.; Ooi, J.B.; Valera-Medina, A.; Chiong, M.C. Thermochemical analysis of premixed ammonia/biogas flames in a model gas turbine swirl combustion system. Renew. Energy 2024, 236, 121478. [Google Scholar] [CrossRef]
- On the Concept of the Transition of the Republic of Kazakhstan to a “Green Economy” Decree of the President of the Republic of Kazakhstan Dated 30 May 2013. No. 577. Available online: https://adilet.zan.kz/rus/docs/U1300000577 (accessed on 26 January 2025).
- Zupančič, M.; Možic, V.; Može, M.; Cimerman, F.; Golobič, I. Current Status and Review of Waste-to-Biogas Conversion for Selected European Countries and Worldwide. Sustainability 2022, 14, 1823. [Google Scholar] [CrossRef]
- Liu, A.; Yang, Y.; Chen, L.; Zeng, W.; Wang, C. Experimental study of biogas combustion and emissions for a micro gas turbine. Fuel 2020, 267, 117312. [Google Scholar] [CrossRef]
- Balasubramanian, D.; Venugopal, I.P.; Amudhan, R.; Wongwuttanasatian, T.; Nanthagopal, K. Chapter 6—Application of exhaust gas recirculation of NOx reduction in SI engines. In NOx Emission Control Technologies in Stationary and Automotive Internal Combustion Engines; Ashok, B., Ed.; Elsevier: Amsterdam, The Netherlands, 2022; pp. 155–187. [Google Scholar]
- De Simio, L.; Iannaccone, S.; Masi, M.; Gobbato, P. Experimental Study and Optimisation of a Non-Conventional Ignition System for Reciprocating Engines Operation with Hydrogen–Methane Blends, Syngas, and Biogas. Energies 2022, 15, 8270. [Google Scholar] [CrossRef]
- Pandey, V.; Shahapurkar, K.H.; Guluwadi, S.; Mengesha, G.A.; Gadissa, B.; Banapurmath, N.R.; Vadlamudi, C.; Krishnappa, S.; Khan, T.M.Y. Studies on the Performance of Engines Powered with Hydrogen-Enriched Biogas. Energies 2023, 16, 4349. [Google Scholar] [CrossRef]
- Alabaş, B.; Tunç, G.; Taştan, M.; Yilmaz, İ. Effect of oxygen enrichment of Biogas-Hydrogen mixtures in a premixed combustor on the combustion instability and emissions. Fuel 2023, 340, 127498. [Google Scholar] [CrossRef]
- Amez, I.; Castells, B.; Llamas, B.; Bolonio, D.; García-Martínez, M.J.; Lorenzo, J.L.; García-Torrent, J.; Ortega, M.F. Experimental Study of Biogas–Hydrogen Mixtures Combustion in Conventional Natural Gas Systems. Appl. Sci. 2021, 11, 6513. [Google Scholar] [CrossRef]
- Zhen, H.; Leung, C.W.; Cheung, C.S.; Huang, Z. Combustion characteristic and heating performance of stoichiometric biogas–hydrogen–air flame. Int. J. Heat. Mass. Transf. 2016, 92, 807–814. [Google Scholar] [CrossRef]
- Ahmed, S.A.; Zhou, S.; Tsegay, S.; Ahmad, N.; Zhu, Y. Effects of hydrogen-enriched biogas on combustion and emission of a dual-fuel diesel engine. Energy Sources Part A Recovery Util. Environ. Eff. 2020, 46, 5644–5659. [Google Scholar] [CrossRef]
- Mariani, A.; Unich, A.; Minale, M. Combustion of Hydrogen Enriched Methane and Biogases Containing Hydrogen in a Controlled Auto-Ignition Engine. Appl. Sci. 2018, 8, 2667. [Google Scholar] [CrossRef]
- Nurmukan, D.; Chen, T.J.M.; Hung, Y.M.; Ismadi, M.-Z.; Chong, C.T.; Tran, M.-V. Enhancement of biogas/air combustion by hydrogen addition at elevated temperatures. Int. J. Energy Res. 2020, 44, 519–1534. [Google Scholar] [CrossRef]
- Sabrina, B.; Belkacem, A.; Ali, S.M.; Sherif, S.; Aouachria, Z. Investigation on combustion characteristics and emissions of biogas/hydrogen blends in gas turbine combustors. Therm. Sci. Eng. Prog. 2022, 27, 101178. [Google Scholar]
- Gonzales, C.A.; Caballero, M.; Sandoval, L. Numerical Study of the Effect of hydrogen addition on the laminar flame speed and premixed flame structure of biogas. Int. J. Renew. Energy Res. 2018, 8, 1098–1104. [Google Scholar]
- Hosseini, S.E.; Bagheri, G.; Khaleghi, M.; Wahid, M.A. Study on the characteristics of hydrogen-enriched biogas co-flow flameless combustion. Recent Adv. Mech. Mech. Eng. 2015, 2015, 52–61. [Google Scholar]
- Yilmaz, İ. Effect of Swirl Number on Combustion Characteristics in a Natural Gas Diffusion Flame. J. Energy Resour. Technol. 2013, 135, 042204. [Google Scholar] [CrossRef]
- Saqr, K.M.; Aly, H.S.; Sies, M.M.; Wahid, M.A. Effect of free stream turbulence on NOx and soot formation in turbulent diffusion CH4-air flames. Int. Commun. Heat Mass. Transf. 2010, 37, 611–617. [Google Scholar] [CrossRef]
- Elbaz, A.M.; Moneib, H.A.; Shebil, K.M.; Roberts, W.L. Low NOX-LPG staged combustion double swirl flames. Renew. Energy 2019, 138, 303–315. [Google Scholar] [CrossRef]
- Jerzak, W.; Kuźnia, M.; Szajding, A. Experimental Studies and the Chemical Kinetics Modelling of Oxidation of Hydrogen Sulfide Contained in Biogas. Procedia Eng. 2016, 157, 222–229. [Google Scholar] [CrossRef]
- Dostiyarov, A.M.; Umyshev, D.R.; Aidymbayeva, Z.A.; Yamanbekova, A.K.; Duisenbek, Z.S.; Kumargazina, M.B.; Kartjanov, N.R.; Begimbetova, A.S. Comparative Study of the NOx, CO Emissions, and Stabilization Characteristics of H2-Enriched Liquefied Petroleum Gas in a Swirl Burner. Energies 2024, 17, 6132. [Google Scholar] [CrossRef]
- Sungwoo, P. Hydrogen addition effect on NO formation in methane/air lean-premixed flames at elevated pressure. Int. J. Hydrog. Energy 2021, 46, 25712–25725. [Google Scholar]
- Sungwoo, P. Pressure effect on NO emission in methane/air lean-premixed flames. J. Mech. Sci. Technol. 2019, 33, 3031–3038. [Google Scholar]
- Midhat, T.; Paul, H.; Nicos, L. The effect of varying EGR and intake air boost on hydrogen-diesel co-combustion in CI engines. Int. J. Hydrogen Energy 2017, 42, 6369–6383. [Google Scholar]
- Wei, Z.; Zhen, H.; Leung, C.; Cheung, C.; Huang, Z. Formations and emissions of CO/NO2/NOx in the laminar premixed biogas-hydrogen flame undergoing the flame-wall interaction: Effects of the variable CO2 proportion. Fuel 2020, 276, 118096. [Google Scholar] [CrossRef]
- Law, C.K.; Ishizuka, S.; Cho, P. On the opening of premixed Bunsen flame tips. Combust. Sci. Technol. 1982, 28, 89–96. [Google Scholar] [CrossRef]
- Schefer, R.W.; Wicksall, D.M.; Agrawal, A.K. Combustion of hydrogen-enriched methane in a lean premixed swirl-stabilized burner. Proc. Combust. Inst. 2002, 29, 843–851. [Google Scholar] [CrossRef]
- Rortveit, G.J.; Zepter, K.; Skreiberg, O.; Fossum, M.; Hustad, J.E. A comparison of low-NOx burners for combustion of methane and hydrogen mixtures. Proc. Combust. Inst. 2003, 29, 1123–1129. [Google Scholar] [CrossRef]
- Technical Regulations Requirements for Emissions into the Environment During Combustion of Various Types of Fuel in Boiler Units of Thermal Power Plants. Approved by the Resolution of the Government of the Republic of Kazakhstan Dated 14 December 2007. N 1232. Available online: https://law.gov.kz (accessed on 7 March 2025).
Disclaimer/Publisher’s Note: The statements, opinions and data contained in all publications are solely those of the individual author(s) and contributor(s) and not of MDPI and/or the editor(s). MDPI and/or the editor(s) disclaim responsibility for any injury to people or property resulting from any ideas, methods, instructions or products referred to in the content. |
© 2025 by the authors. Licensee MDPI, Basel, Switzerland. This article is an open access article distributed under the terms and conditions of the Creative Commons Attribution (CC BY) license (https://creativecommons.org/licenses/by/4.0/).