Article

Study on Determining the Efficiency of a High-Power Hydrogenerator Using the Calorimetric Method

1
Department of Engineering Sciences, Faculty of Engineering, Babes-Bolyai University, 400028 Cluj-Napoca, Romania
2
Department of Public Administration and Management, Faculty of Political, Administrative and Communication Sciences, Babes-Bolyai University, 400028 Cluj-Napoca, Romania
*
Author to whom correspondence should be addressed.
Energies 2025, 18(18), 4813; https://doi.org/10.3390/en18184813
Submission received: 27 July 2025 / Revised: 17 August 2025 / Accepted: 6 September 2025 / Published: 10 September 2025
(This article belongs to the Special Issue Novel and Emerging Energy Systems)

Abstract

The global energy crisis demands efficient electricity production solutions, especially for isolated communities where hydraulic energy can be harnessed sustainably. This paper presents a case study analyzing the efficiency of a 13,330 kW hydrogenerator, consisting of a bulb-type hydro-aggregate using the calorimetric method—a viable alternative when testing at nominal load is not feasible due to technical limitations. The method involves measuring the thermal energy absorbed by the cooling water under three operating conditions: no-load unexcited, no-load excited, and symmetric three-phase short-circuit. Measurements followed IEC standards and were conducted with high-precision instruments for temperature, flow, voltage, and current. The results quantify mechanical, ventilation, iron, and copper losses, as well as additional losses via radiation and convection. Thermal analysis revealed significant heat accumulation in the rotor and stator windings, indicating the need for improved cooling solutions. The calorimetric method enables efficiency evaluation without interrupting generator operation, offering a valuable tool for diagnostics, predictive maintenance, and informed decisions on modernization. Furthermore, integrating an intelligent operational control system could enhance efficiency and improve the quality of the supplied energy, supporting long-term sustainability in hydroelectric power generation.

1. Introduction

Considering the electricity crisis faced by all countries, increasing energy production and reducing energy consumption are requirements being implemented through various national and international strategies. In the case of isolated communities that do not benefit from electricity transport and distribution networks but have a flowing water source, establishing a micro-hydropower plant can solve the issue of electricity supply. Thus, pico-hydro energy systems are being developed and implemented, featuring one or two Pelton turbines with different numbers of buckets, which provide lighting for communities and power for small consumers [1].
A study conducted by the International Energy Agency (IEA) found that electricity consumption in industry accounts for 37% of global energy consumption, while approximately 30% of global energy is consumed in buildings [2].
Moreover, if we refer to electricity production, in 2019, about 11% of global primary energy came from renewable sources. Hydropower is included in renewable energy sources, and it is transformed in hydropower plants into electricity. This energy source accounts for over 60% of renewable energy production [3].
At the European level, through the REPowerEU plan, the goal for renewable energy production has been proposed to increase from the current 40% to 45% by 2030 [4]. This goal can be achieved through the construction of new small or large hydropower facilities, maintaining the operation of hydropower plants and micro-hydropower plants at high efficiency, as well as modernizing/repairing hydroenergy systems in various stages of construction or taken out of operation.
For both operating and new hydro-aggregates, it is necessary to determine the efficiency of each component (turbine, generator) as well as the overall efficiency of the hydro-aggregate. In the case of operating hydro-aggregates, determining efficiency can lead to solutions for more efficient operation of the entire system, considering that most hydropower plants have been in operation for a considerable time and that modern equipment and solutions available on the market can contribute to increased efficiency.
Since, in most cases, the rotor speed of the turbines in micro-hydropower plants ranges from 75 to 400 rpm, while the generator speed is often above 750 rpm, a mechanical transmission is necessary between these components. If the turbine has fixed blades and the generator is of the asynchronous type, then the efficiency of the hydro-aggregate is lower than that estimated by calculations. To eliminate this disadvantage and increase efficiency, a synchronous generator with permanent magnets directly coupled to the turbine can be used. With a synchronous generator, it is possible to control the turbine rotor speed based on the water flow that can be turbine-fed [5]. It has been demonstrated that, in the case of low-power turbines, hydro-aggregates have higher efficiency when equipped with permanent magnet generators compared to those with asynchronous generators [6].
Depending on the characteristics of the hydroenergy installation, the type of turbine, and the optimal design of the blades, a higher or lower efficiency of the entire hydroenergy system can be achieved [7,8]. Additionally, if the hydropower plant operates at a power level lower than its nominal power, its efficiency decreases due to significant losses occurring in the electric generator [9]. In this situation, increasing efficiency can be achieved by reducing the value of the stator voltage [10]. Other methods used to increase the efficiency of generators in hydroenergy systems include the use of autotransformers or frequency converters, each with its advantages and disadvantages [11].
Regardless of the type of generator used, its efficiency is very important in hydropower systems, necessitating the establishment of its efficiency by determining loss values, using provisions from current standards [12,13]. The loss values depend on the constructive type of the hydrogenerator and its operating mode.
Loss values are usually determined by testing the generator under no-load and short-circuit conditions, determining core losses, mechanical and ventilation losses, and copper losses [9]. The value of iron losses can be determined through magnetic circuit methods and finite element methods when the generator operates at no load [14], separately analyzing the various parts of the magnetic cores of the rotor and stator [15,16]. In the case of large synchronous generators, mechanical losses caused by friction in bearings can be determined by analyzing the variation in speed during mechanical and electrical braking [17].
When Roebel bars are used, internal circulating currents between conductors occur, causing additional losses, which represent approximately 2% of nominal losses [18]. Another category of additional losses is determined by the stamping of laminations, which can lead to an increase in iron losses of up to 4% in the case of high-power hydrogenerators [19]. All these additional losses should not be neglected, as they determine the decrease in the efficiency of the hydrogenerator.
A modern method used for determining losses consists of infrared thermography of the mechanical parts of the generator, aimed at identifying the heat emitted through them. The method involves the use of multiple sensors that communicate with the monitoring system, thereby reducing the time needed to determine efficiency compared to other methods used [20,21].
When determining the efficiency of the generator using the calorimetric method, it is considered that all losses in the machine are transformed into heat. Thus, the temperature and flow rate of the cooling fluid must be measured, along with the temperatures along the surface of the machine. Based on the heat transfer coefficient, the losses and input power, as well as the efficiency of the generator, are calculated [22,23,24]. Research has shown that the temperature on the rotor is higher than that in the stator. This fact was demonstrated through analysis with an infrared sensor installed on the stator side to measure the temperature of each rotor pole [25]. A similar study presents the same methodology for determining the efficiency of a 90 MW synchronous generator with apparent poles and a vertical axis. The results obtained from measurements were compared with those provided by the generator manufacturer [26]. Although the same methodology for determining generator efficiency is used, in the present case study, the calorimetric method is applied to a bulb-type generator. While the 90 MW generator dissipates part of its losses through cooling air, this type of hydro unit has a much lower capacity for heat evacuation via air, and the method for measuring the expelled air flow is less accurate than measuring the cooling agent—water—circulating through the cooling system’s pipes.
The same method is also used to determine the efficiency of a 60 MW hydrogenerator, where emphasis is placed on the arrangement of measuring equipment required for capturing the necessary parameters [27]. It was found that the performance and calibration of the measuring system significantly affect the quality of the measurements, potentially introducing errors of up to 5% [28].
The advantage of using the calorimetric method lies in the fact that it does not require stopping the hydro unit and does not require direct access to internal components, using only external sensors such as thermoresistances, thermal cameras, and flow meters. It has been demonstrated that this method allows for the determination of efficiency without affecting the operation of the facility, thus being useful for early fault detection and predictive maintenance [29].
If the cooling agent is water, to meet measurement uncertainty requirements, flow meters must be correctly installed, and the discharge of cooling water should be reduced to a low value so that the measurement uncertainty is within 3% [30].
To increase the efficiency of hydrogenerators, during the repair stage of hydro units, the use of modern materials and high-performance systems for controlling their operation is essential. Another method used to increase the efficiency of an asynchronous generator involves the automatic modification of the winding connections from a delta to a star connection [9].
In all cases of using electric generators, the waveforms of the voltages, currents, frequency variations, and harmonic levels must be monitored and analyzed, as any variation in load or water flow leads to a transient regime of the entire hydro unit, influencing the quality of the energy supplied to the consumer [31]. If an asynchronous generator is used in the hydroelectric system, which supplies electricity in an unbalanced system, the unbalanced system will negatively influence the performance of the generator and will also affect the quality of the supplied energy [32].
In situations where the micro-hydroelectric plant operates autonomously, the determination of the performance of the hydro unit must take into account the use of battery banks, as well as the inverter, necessary for controlling frequency during variations in load or water flow [33]. These components also influence the efficiency of the hydro unit.
The operation of the electric generator at maximum efficiency requires that an optimal choice of variable values be made from the design stage to ensure the fulfillment of this objective [34], followed by verification in the simulation stage.
If an Intelligent Energy Control System (IECS) is implemented at the micro-hydroelectric plant, used for adjusting the voltage and frequency supplied by the generator and for monitoring load variations, it ensures the quality indicators of the energy provided to the consumer, achieving maximum efficiency at different loads [35] and operating regimes, while ensuring safe operation [36].
This paper presents a case study in which the calorimetric method is applied to determine the efficiency of a high-power hydrogenerator, consisting of a bulb-type hydro-aggregate, presented in Figure 1.
In this figure, Ham represents the upstream water level and Hav represents the downstream level. The components are labeled as follows: 1—intake chamber; 2—turbine capsule; 3—guide apparatus; 4 and 5—turbine rotor and rotor chamber, respectively; 6—draft tube. The hydroelectric facility/arrangement housing the analyzed hydro unit is designed for low head and high flow rates. Initially, the plant featured a unique upstream bulb-type hydro unit (with the generator positioned upstream of the turbine rotor), built by a Romanian manufacturer. Given its long operational life, the need arose to improve the unit’s energy efficiency, leading to the generator’s refurbishment. Based on this upgrade, in situ measurements were conducted to determine efficiency, aiming to validate the guaranteed performance provided by the manufacturer using the most accurate method available.
This method is employed because it does not subject the hydrogenerator to demands that could jeopardize its proper functioning over time, and because load testing is not feasible due to the high power of the hydrogenerator. Determining the efficiency after a certain operational period is a mandatory requirement to identify any critical points and areas where intervention can ensure efficient long-term operation of the hydrogenerator.
For the analyzed hydrogenerator, cooling is ensured by using water as the cooling agent. Measurements were carried out for three operating conditions/regimes of the generator: no-load unexcited, no-load excited, and three-phase short-circuit. For these regimes, both transmitted and non-transmitted energy losses through the cooling systems were calculated.
This method is being applied for the first time in Romania. The existing research does not include studies where the calorimetric method is used to determine the efficiency of a bulb-type hydro unit cooled by water rather than air, as is typical for most hydrogenerators. The method was chosen for its higher precision since the water flow rate can be measured more accurately than air flow, especially considering the large surface area of the hydrogenerator.
The results obtained allow for the identification of critical energy loss areas and provide a complete picture of the thermal behavior of the generator. The study confirms that the calorimetric method is reliable, precise, and can be applied without disrupting the operation of the equipment, making it suitable for the periodic assessment of efficiency and for supporting decisions regarding maintenance and modernization of hydroelectric installations. The case study was not intended to certify the efficiency of the refurbished hydrogenerator but rather to validate its performance using the calorimetric method under specific operating conditions.

2. Testing Method

2.1. Generalities and Objectives in Determining Efficiency

Determining the efficiency of the generator using the calorimetric method involves measuring the temperature of the cooling agent, which can be either water or air.
In the presented case study, the cooling agent is water. This determination method was chosen because, under normal operating conditions, it was not possible to run the generator at its nominal parameters (voltage, current, power, and speed). The determination of efficiency was carried out in accordance with the provisions of the IEC standards 34-2, 34-2A, and 34-4, taking into account all losses from the generator, from its radial and radial–axial bearings [37,38,39].
To determine the efficiency of the generator, the same power factor value is maintained while the value of the active load is modified, and the efficiency is determined with the general formula
η G = P P + P
where ηG is the efficiency of the generator, P is its active power supplied by the generator, and ΣP represents the measured and calculated losses from the generator corresponding to the active power.
The operating regimes used for determining losses in the generator are
  • No-load unexcited operation (the excitation winding is not powered), when the generator operates at nominal speed;
  • No-load excited operation, when the excitation winding is powered at nominal voltage and the rotor speed is nominal;
  • Three-phase short-circuit operation, when the current value in the stator winding is at its nominal value.
Determining the generator’s efficiency involves carrying out measurements and con-structing characteristics such as
  • Measuring the ohmic resistances of the stator and rotor windings;
  • Measuring the flow rate and the inlet and outlet temperatures of the coolant in the cooling units;
  • Determining the nominal excitation current by directly measuring it at the generator’s nominal apparent power;
  • Determining the loss values in the axial and radial bearings of the generator;
Determining the adjustment characteristics of the generator by establishing the excitation current value at P = 0.25, 0.50, 0.75, 1.00, and 1.1% of the nominal current for nominal power factor and unit power factor.
Preliminary operations before measurements included the following:
  • Selecting and installing the measurement transducers according to the manufacturer’s technical specifications;
  • Connecting the transducers to the data acquisition systems;
  • Calibrating the equipment in accordance with required standards.

2.2. Measuring Devices Used

2.2.1. Devices for Measuring Electrical Quantities

Electrical measurements in the generator’s primary circuits were carried out using current transformers and shunts, along with measuring instruments that featured a precision class of at least 0.5 in alternating current circuits and a precision class of 0.5 in direct current circuits. For secondary circuits, measurements were made with devices having a precision class of 0.2.
To measure electrical parameters in the stator of the synchronous generator, the Chauvin Arnoux (France) CA8336 network analyzer was used, with a sampling rate of 256 samples per period, compliant with IEC 61000-4-30 Class B [40]. Measurements for the excitation winding were taken using the Chauvin Arnoux (France) CA PEL 113 logger. Instrument errors were as follows: voltage and current < 0.25%, power calculations (active, reactive, apparent) < 0.3%, and power factor < 1%.

2.2.2. Devices for Measuring Temperatures

To measure the cooling air, platinum thermoresistances are used. Thus, for each cooler unit, a PT 100 Ω thermoresistance at 0 °C is used to measure the temperature of the warm air, while the cold air temperature is measured with an identical thermoresistance placed in the middle of the cooler unit. The thermoresistances are mounted in copper sheaths to reduce the effect of air currents on measurement precision. The measurement error of the thermoresistances must be a maximum of ±0.5 °C at 0 °C and a maximum of ±0.35 °C at 100 °C.
The cooling water temperature at the inlet and outlet of the cooling circuit for the axial and radial bearings of the generator is measured using PT 100 Ω thermoresistances at 0 °C, adapted for mounting on pipes and for operation in water environments, with a precision of ±0.1 °C.
To measure temperatures in the stator windings of the generator, thermoresistances are also used, and the value taken into account is determined as the average value of the maximum measured temperatures.
To measure the temperatures of the generator casing, as well as the temperatures on the outer and inner surfaces of the generator pit, PT 100 Ω thermoresistances or laser measuring devices are used.
Ambient temperatures, air temperatures in the generator pit, in the machine room, and outside the generator pit are also measured using PT 100 Ω thermoresistances.

2.2.3. Devices for Measuring the Cooling Water Flow in Bearings

Ultrasonic flow meters are used to measure the cooling water flow for each of the separate cooler units, which are mounted on pipes. For remote monitoring, it is necessary for each flow meter to be equipped with an analog output in a unified current signal (4–20 mA) or voltage (0–10 V).
In the analyzed situation, the flows of 5 cooler units were monitored. The total flow of cooling water QA is determined as the sum of the flows of the “i” cooler units:
Q A = Q A i
Ultrasonic flowmeters were installed on the cooling system pipes, following the manufacturer’s installation guidelines. These MAGFLOW-type meters have an accuracy of ±0.5%, repeatability of 0.1%, and an auto-calibration function. Systematic errors considered during flow measurement included transducer repeatability ± 0.1%, transducer non-linearity ± 0.25%, and pipe length-induced error ± 0.2%.

2.3. Determination of Efficiency Using the Calorimetric Method

2.3.1. Determination of Losses Transmitted by the Cooling Agent Water

The determination of losses transmitted by the cooling agent water is carried out for three distinct operating modes of the hydrogenerator: no-load unexcited operation, no-load excited operation, and short-circuit operation.
For the determination of losses in no-load unexcited mode, the measured values of the cooling water flow rate and the temperatures of the water at the inlet and outlet of the cooler unit are used. By calculating the temperature difference between the hot water at the outlet and the cold water at the inlet of the cooler unit, the amount of heat released by the hot air from the generator, converted into power losses P10, is determined:
P 10 = Q A i 0 Δ T i 0 ρ A C p A
where
  • QAi0 is the flow rate of the cooling water through cooler unit i (L/min);
  • ΔTi0 is the temperature difference between hot and cold water i (°C);
  • ρA is the density of the cooling water (997 kg/m3);
  • CpA is the specific heat of water (4176 J/kg·°C).
The density of water ρA is selected according to the IEC 34-2A [38] provisions, and the average temperature of the cooling water TAm is calculated using the following formula:
T A m = T A C m + T A R m 2
where
  • TARm—average temperature of cold water, at the cooler inlet, was calculated for all cooler units (°C);
  • TACm—average temperature of hot water at the cooler outlet, was calculated for all cooler units (°C);
  • TAm—average temperature of the cooling water for all cooler units calculated from the average temperatures of cold and hot water (°C).

2.3.2. Determination of Non-Transmitted Losses Through the Cooling Agent

Some of the generator’s losses are not transmitted to the cooling agent—in this case, water. The losses that are not transmitted are losses due to radiation and convection P2 transmitted through the generator shields.
These losses are determined using the following formula:
P 2 = h i Δ T i 0 A i
where
  • P2—losses due to radiation and convection [W];
  • hi—heat transfer coefficient through surface i [W/m2·°C];
  • Ai—surface area i [m2];
  • ΔTi—the temperature difference between surface i and the ambient temperature at 1 m distance [°C].
The value of the coefficient hi is selected according to the IEC provisions, and in this case, it is 15 W/m2·°C.
The surfaces for which measurements are required are
  • A1—area of the downstream shield of the generator, with a value of 20.68 m2;
  • A2—area of the upstream shield of the generator, with a value of 17.33 m2.
For the upstream shield, temperatures were measured with 4 thermoresistances, and for the downstream shield, 2 thermoresistances were used. These temperature values were determined for each of the modes: no-load unexcited, no-load excited, and short-circuit. For the calculations, temperature values under stabilized conditions were used.
After calculating the heat transfer for each individual surface, the losses are determined by algebraic summation.

2.3.3. Determination of Separate Losses of the Generator

The determination of separate losses of the generator is also based on the three distinct operational modes of the hydrogenerator: no-load unexcited operation, no-load excited operation, and short-circuit operation.

3. Results

The measurements were taken on a bulb-type hydro unit. The hydrogenerator is directly and rigidly coupled to the hydraulic turbine via the rotor, with the entire unit submerged in water.
The nominal data of the generator are
  • Nominal apparent power, Sn = 13,330 kVA;
  • Nominal voltage, Un = 6300 V ± 5%;
  • Nominal stator current, In = 1221.6 A;
  • Nominal excitation voltage, UEn = 300 V;
  • Nominal excitation current, IEn = 288 A;
  • Speed, n = 107.1 r.p.m.;
  • Power factor, cosφ = 0.975.

3.1. Measurements for the No-Load Unexcited Operating Mode

For the no-load unexcited operation test of the generator, its rotor will be driven at nominal speed and maintained at this speed throughout the tests. During operation, temperature values will be monitored until the thermal steady-state condition in the generator is reached.

3.1.1. Determination of Mechanical and Ventilation Losses by Measuring Cold and Hot Water Temperatures in No-Load Unexcited Mode

The flow rates of the water that circulated through the five cooling units were as follows: 230 L/min, 200 L/min, 190 L/min, 215 L/min, 200 L/min (Table 1).
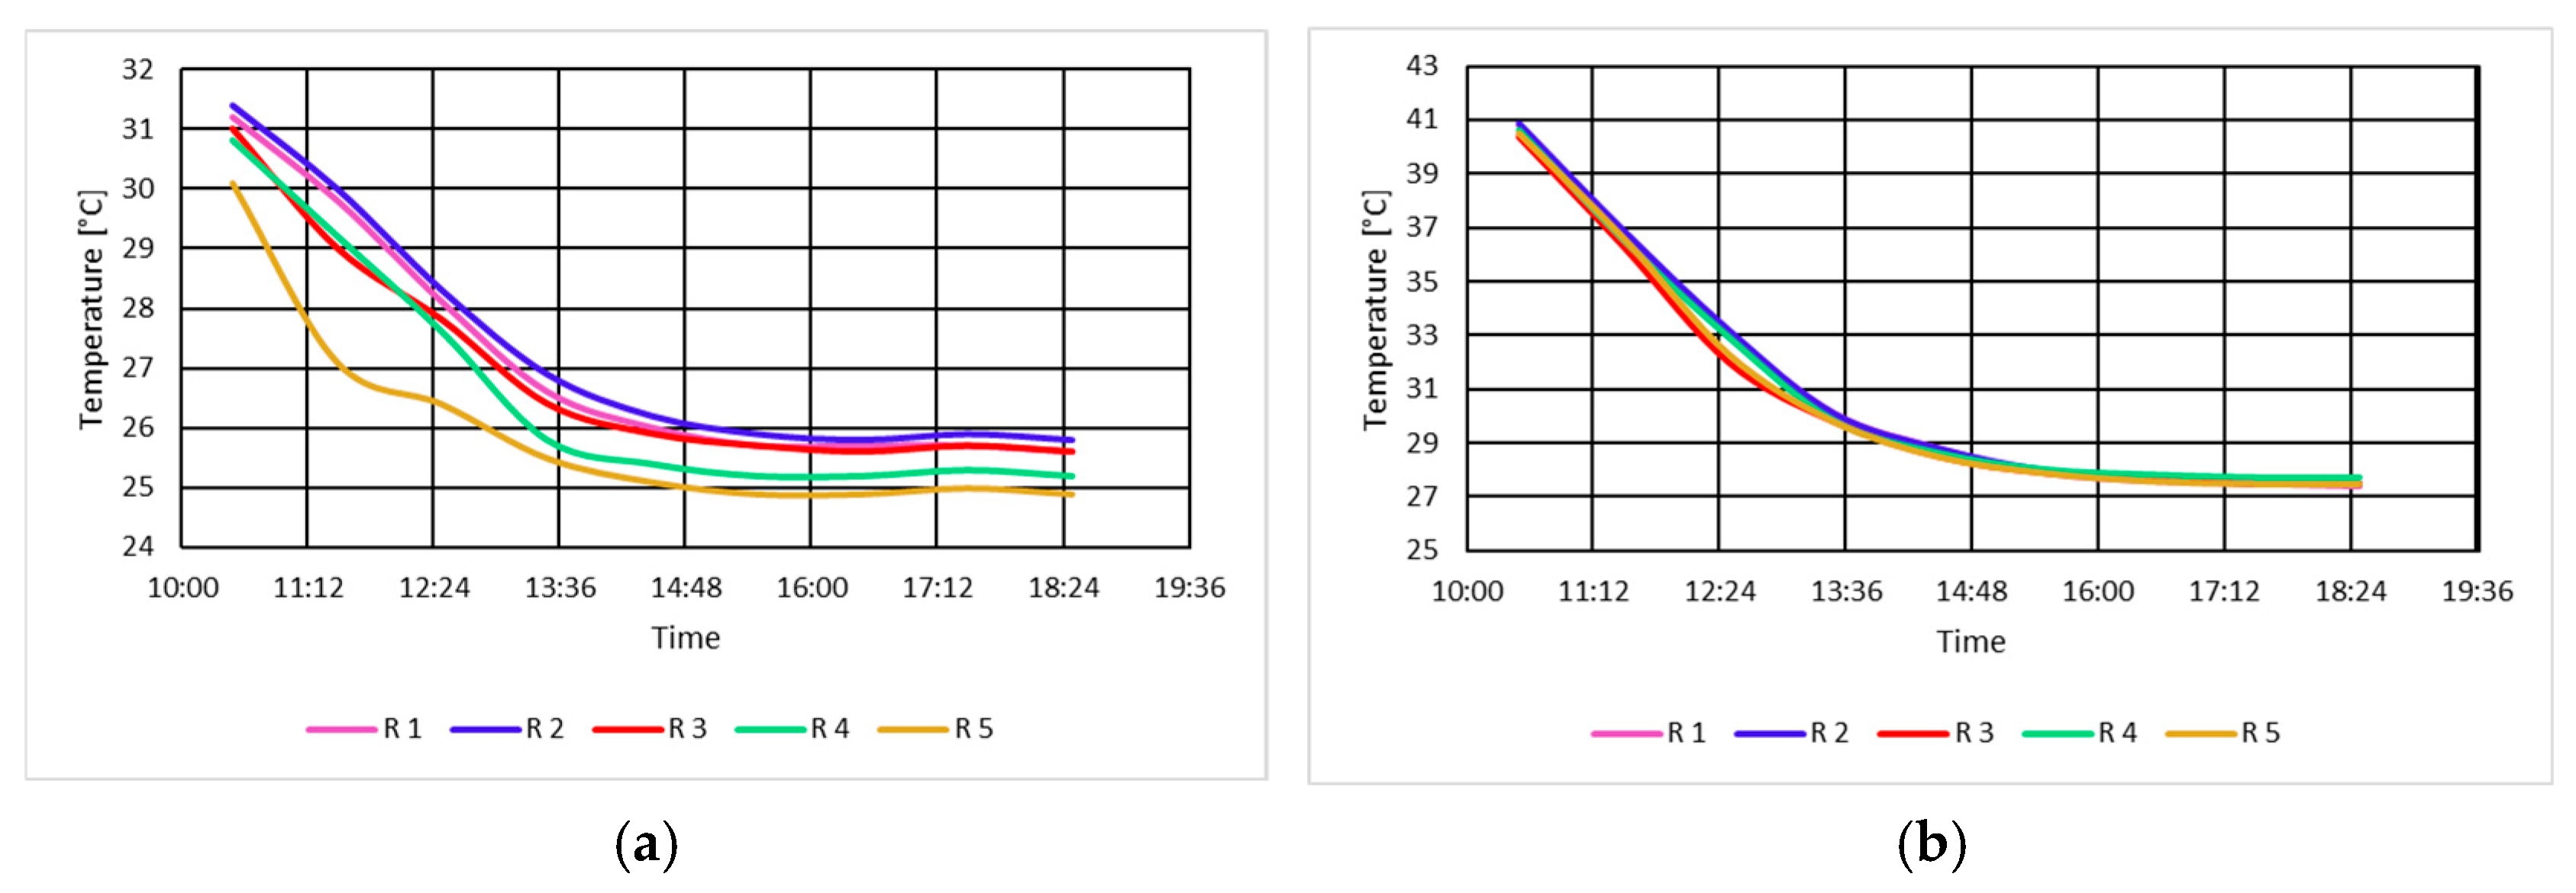
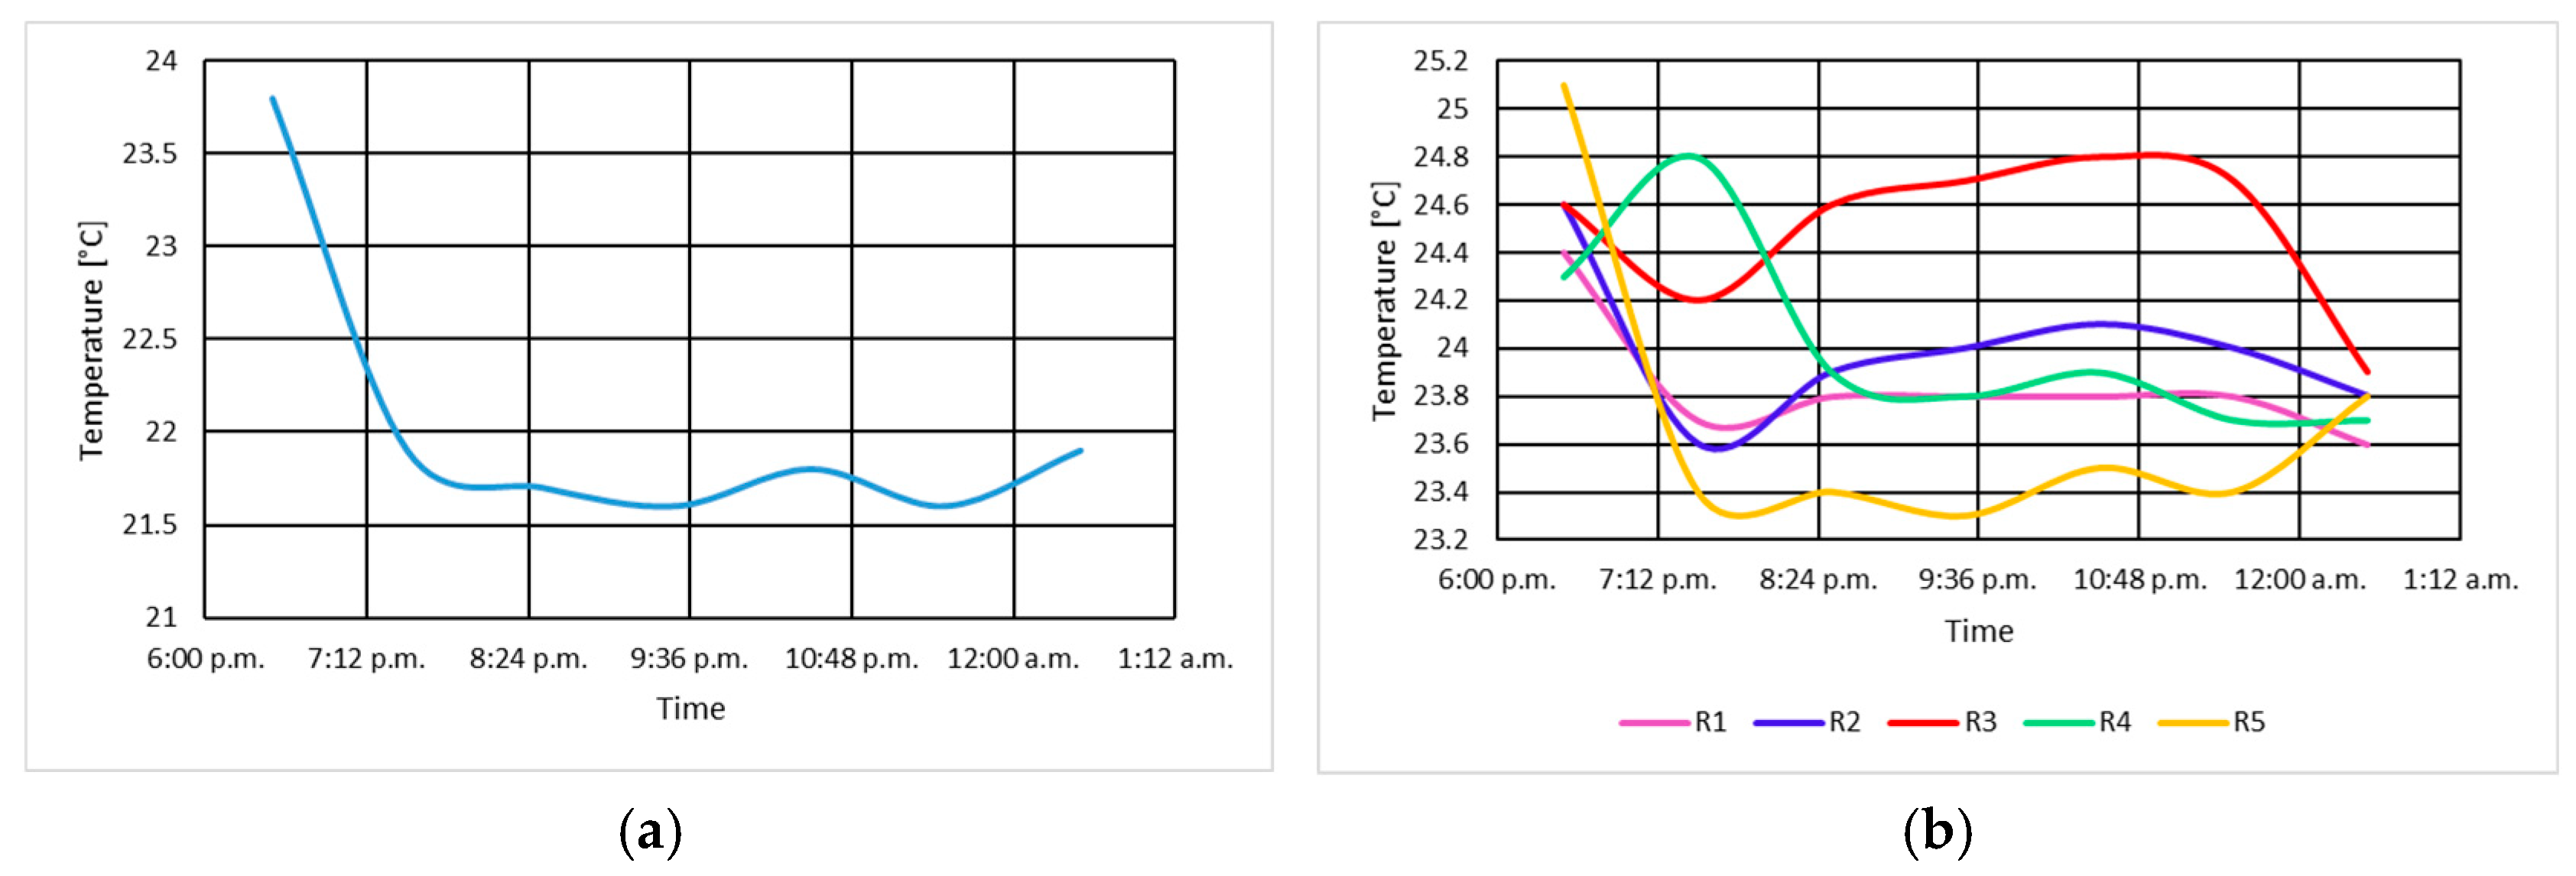
For each cooler unit, the average temperatures of the cold water at the inlet and hot water at the outlet were calculated. The time variation in the temperature of the cold water is presented in Figure 2a, and that of the hot water in Figure 2b. For all cooler units, the value of the cooling water temperature was the same, with measurements being taken every 60 min from 10:30 to 18:30.
The losses evacuated through the cooling water correspond to mechanical and ventilation losses, and their values corresponding to each cooler unit are presented in Table 1.
The total value of mechanical losses due to ventilation and friction with air determined in the no-load unexcited operation mode P10 is 49.788 kW.

3.1.2. Determination of Air Temperatures Through Cooler Units in No-Load Unexcited Mode

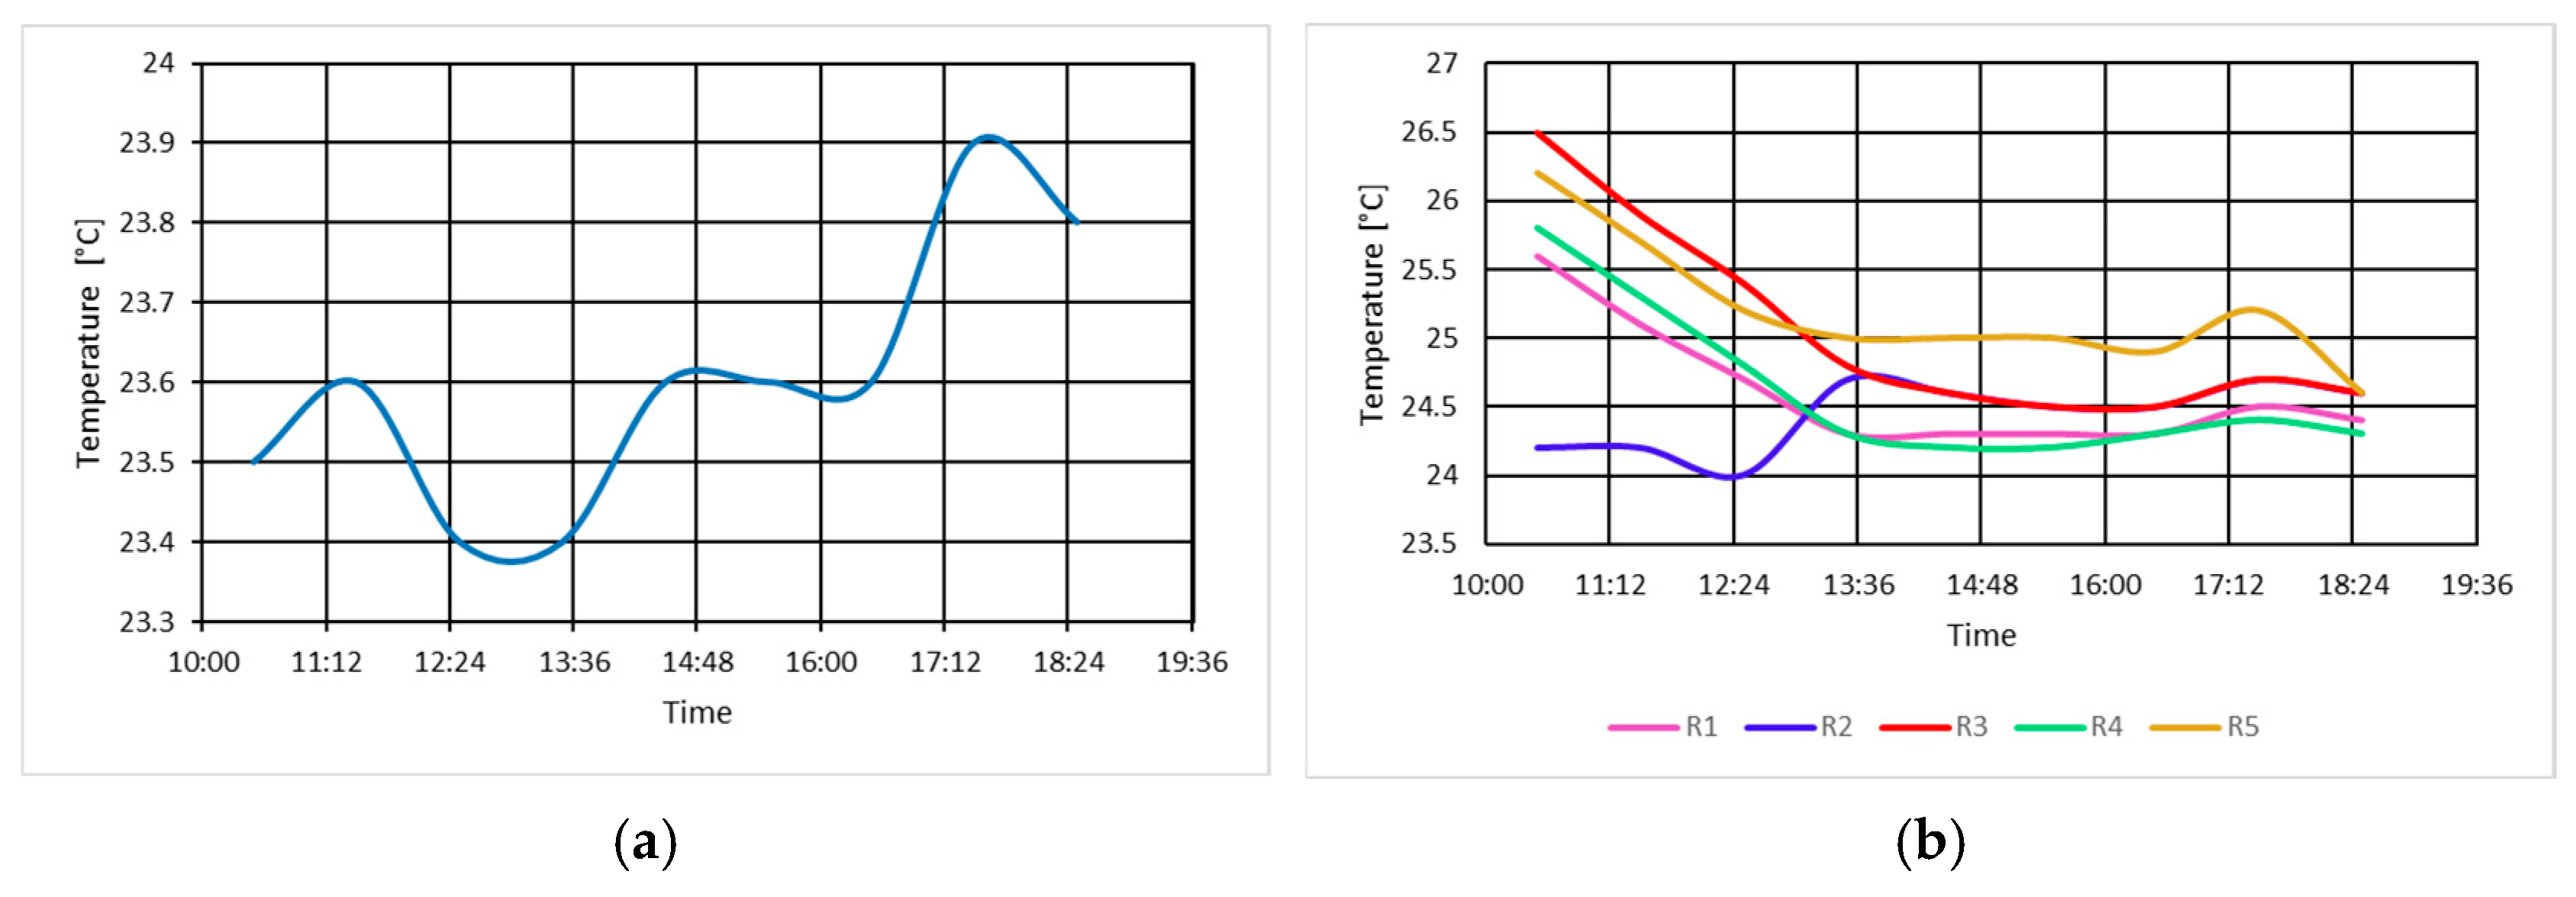
For this measurement, the temperature of the cold air entering the five cooler units and the hot air exiting the same cooler units was recorded. These measurements were taken at the same moments in time and intervals as those used for the cooling water temperature measurements. The variation in the temperatures of cold air TArr and the air at the outlet of the cooler units (hot air TArc) is presented in Figure 3a,b.
It is noted that toward the end of the monitoring period, the temperatures through the five cooler units stabilize. With the stabilized values of the temperatures of the cold air and the hot air, the average temperature for the cold air TmedArr = 25.42 °C and the average temperature for the hot air TmedArc = 27.52 °C were calculated.

3.1.3. Determination of Winding Temperatures in No-Load Unexcited Mode

For this measurement, the temperature of the rotor winding and the temperatures of the stator winding were recorded using the temperature monitoring system of the hydrogenerator located in the hydroelectric power plant. The measured temperature values were noted at the same intervals and during the same time periods as those used for measuring the water temperature in the cooler units.
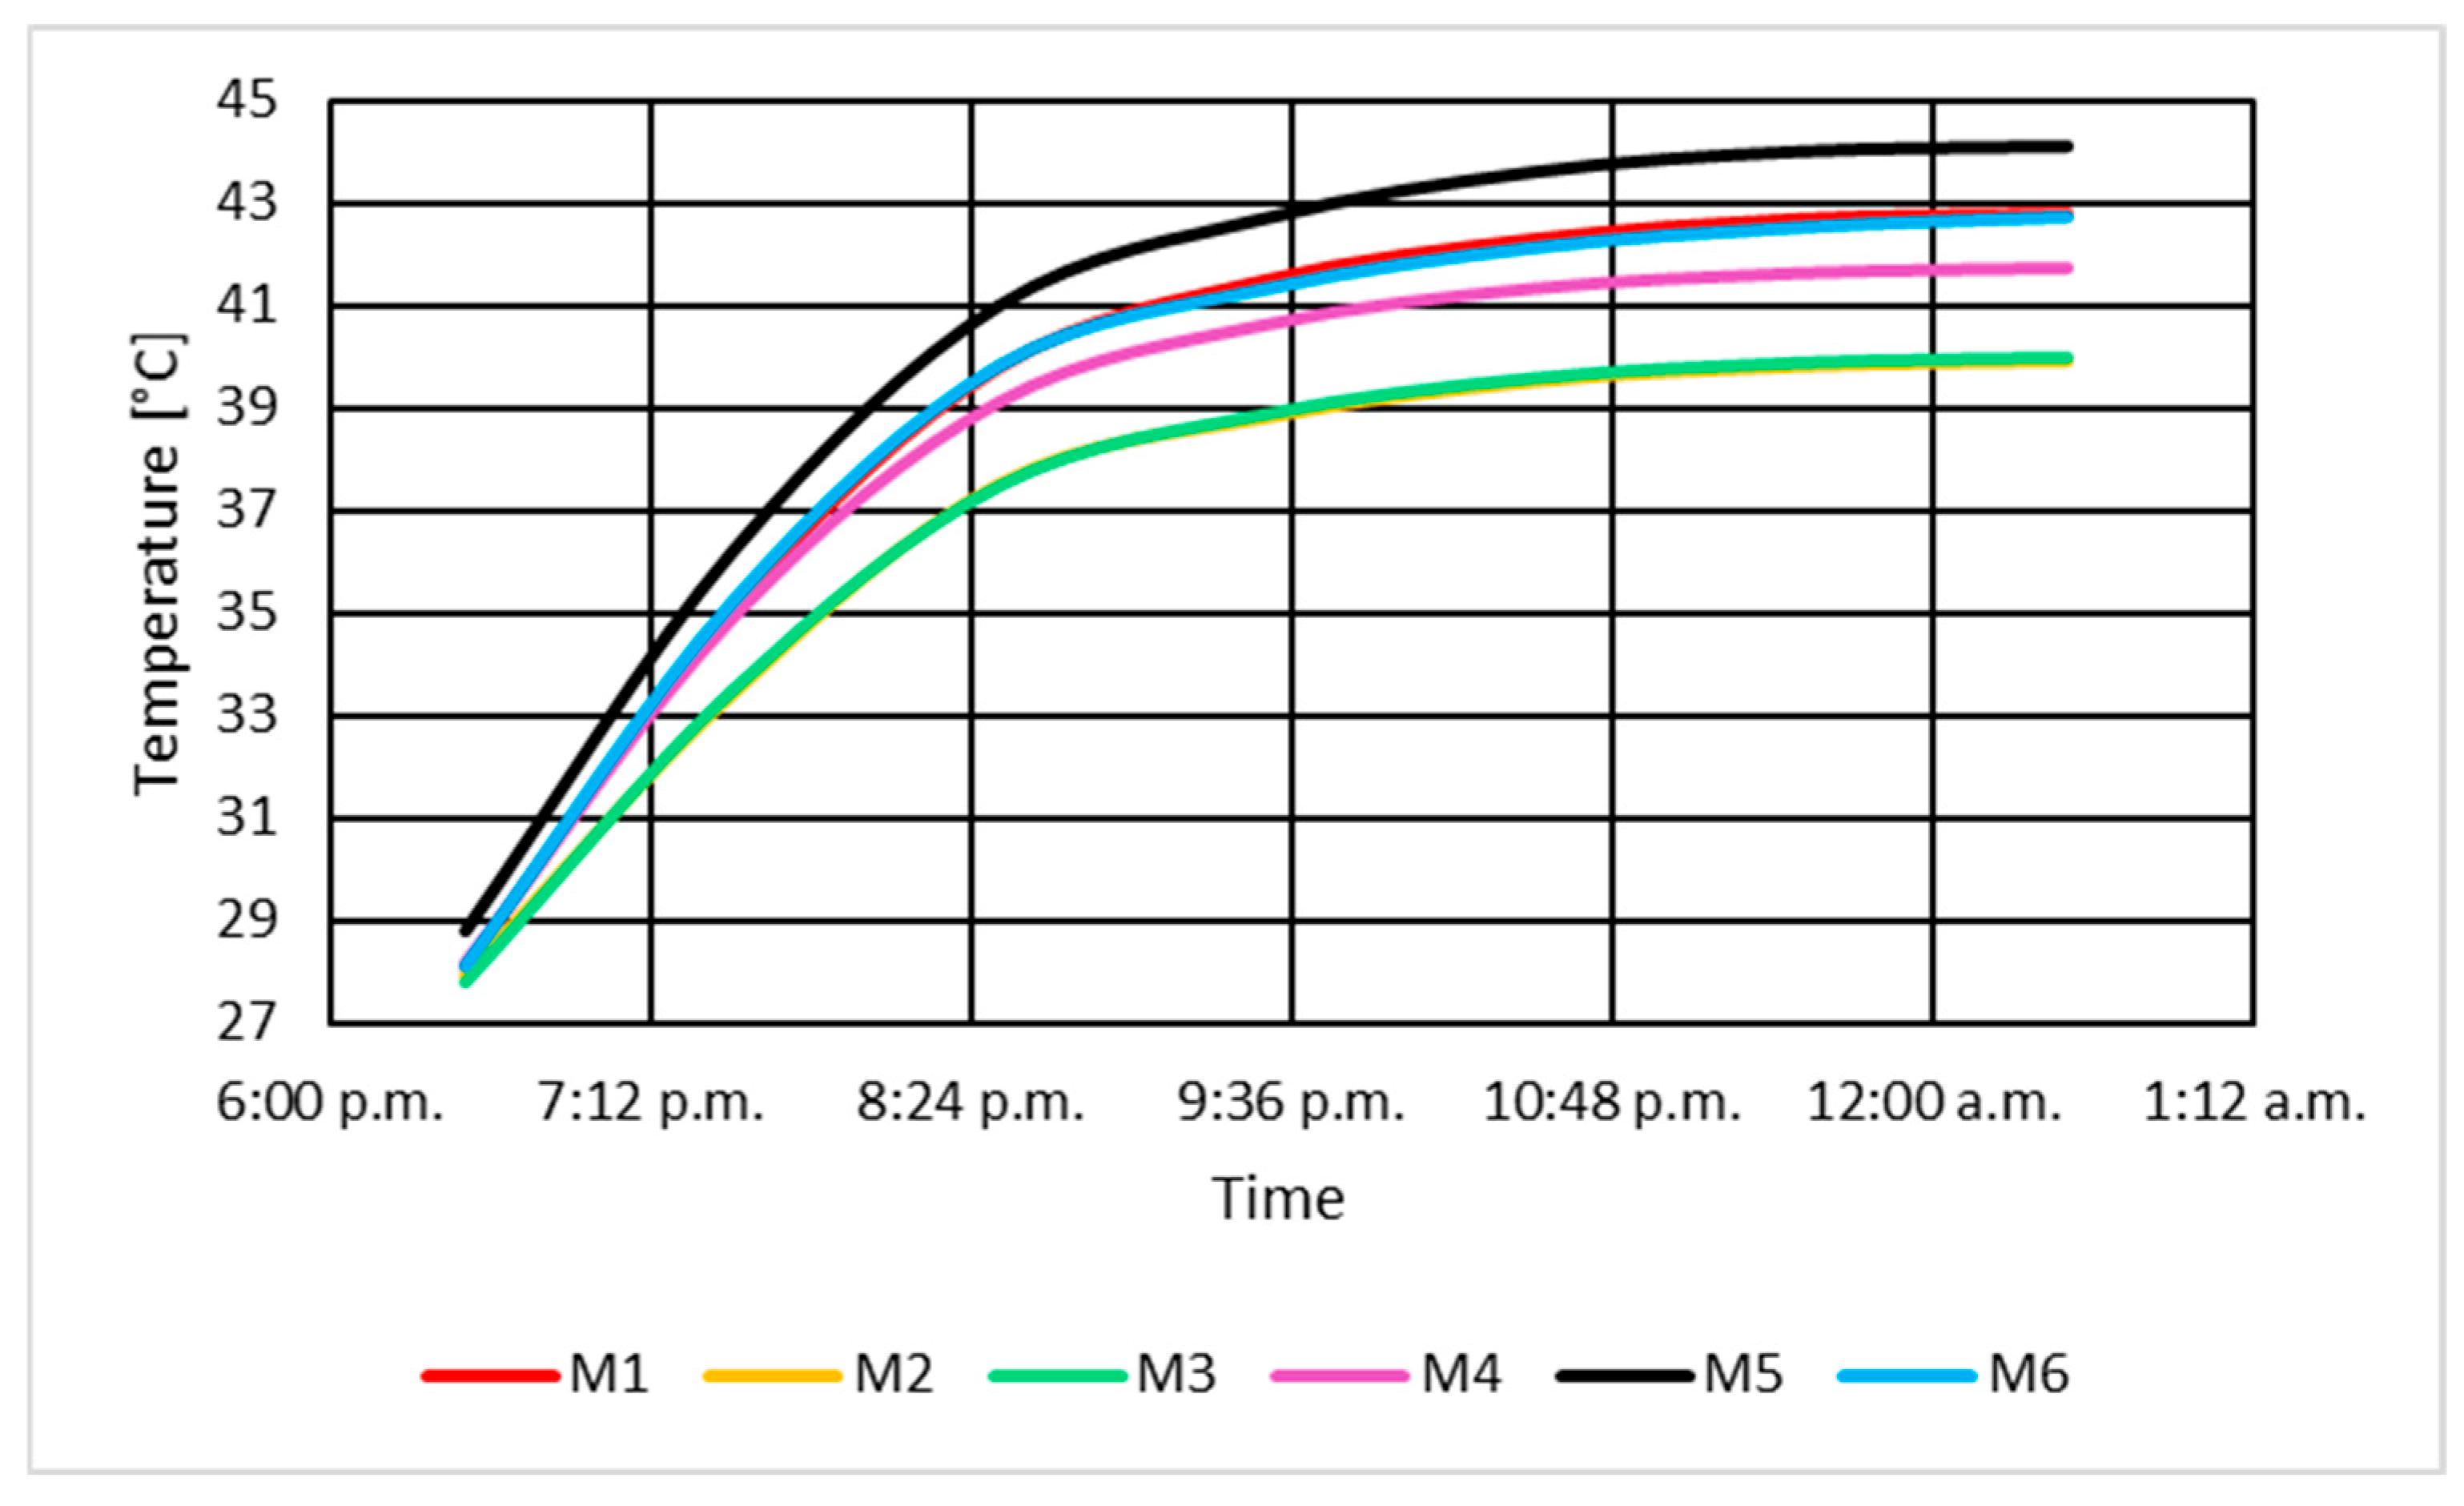
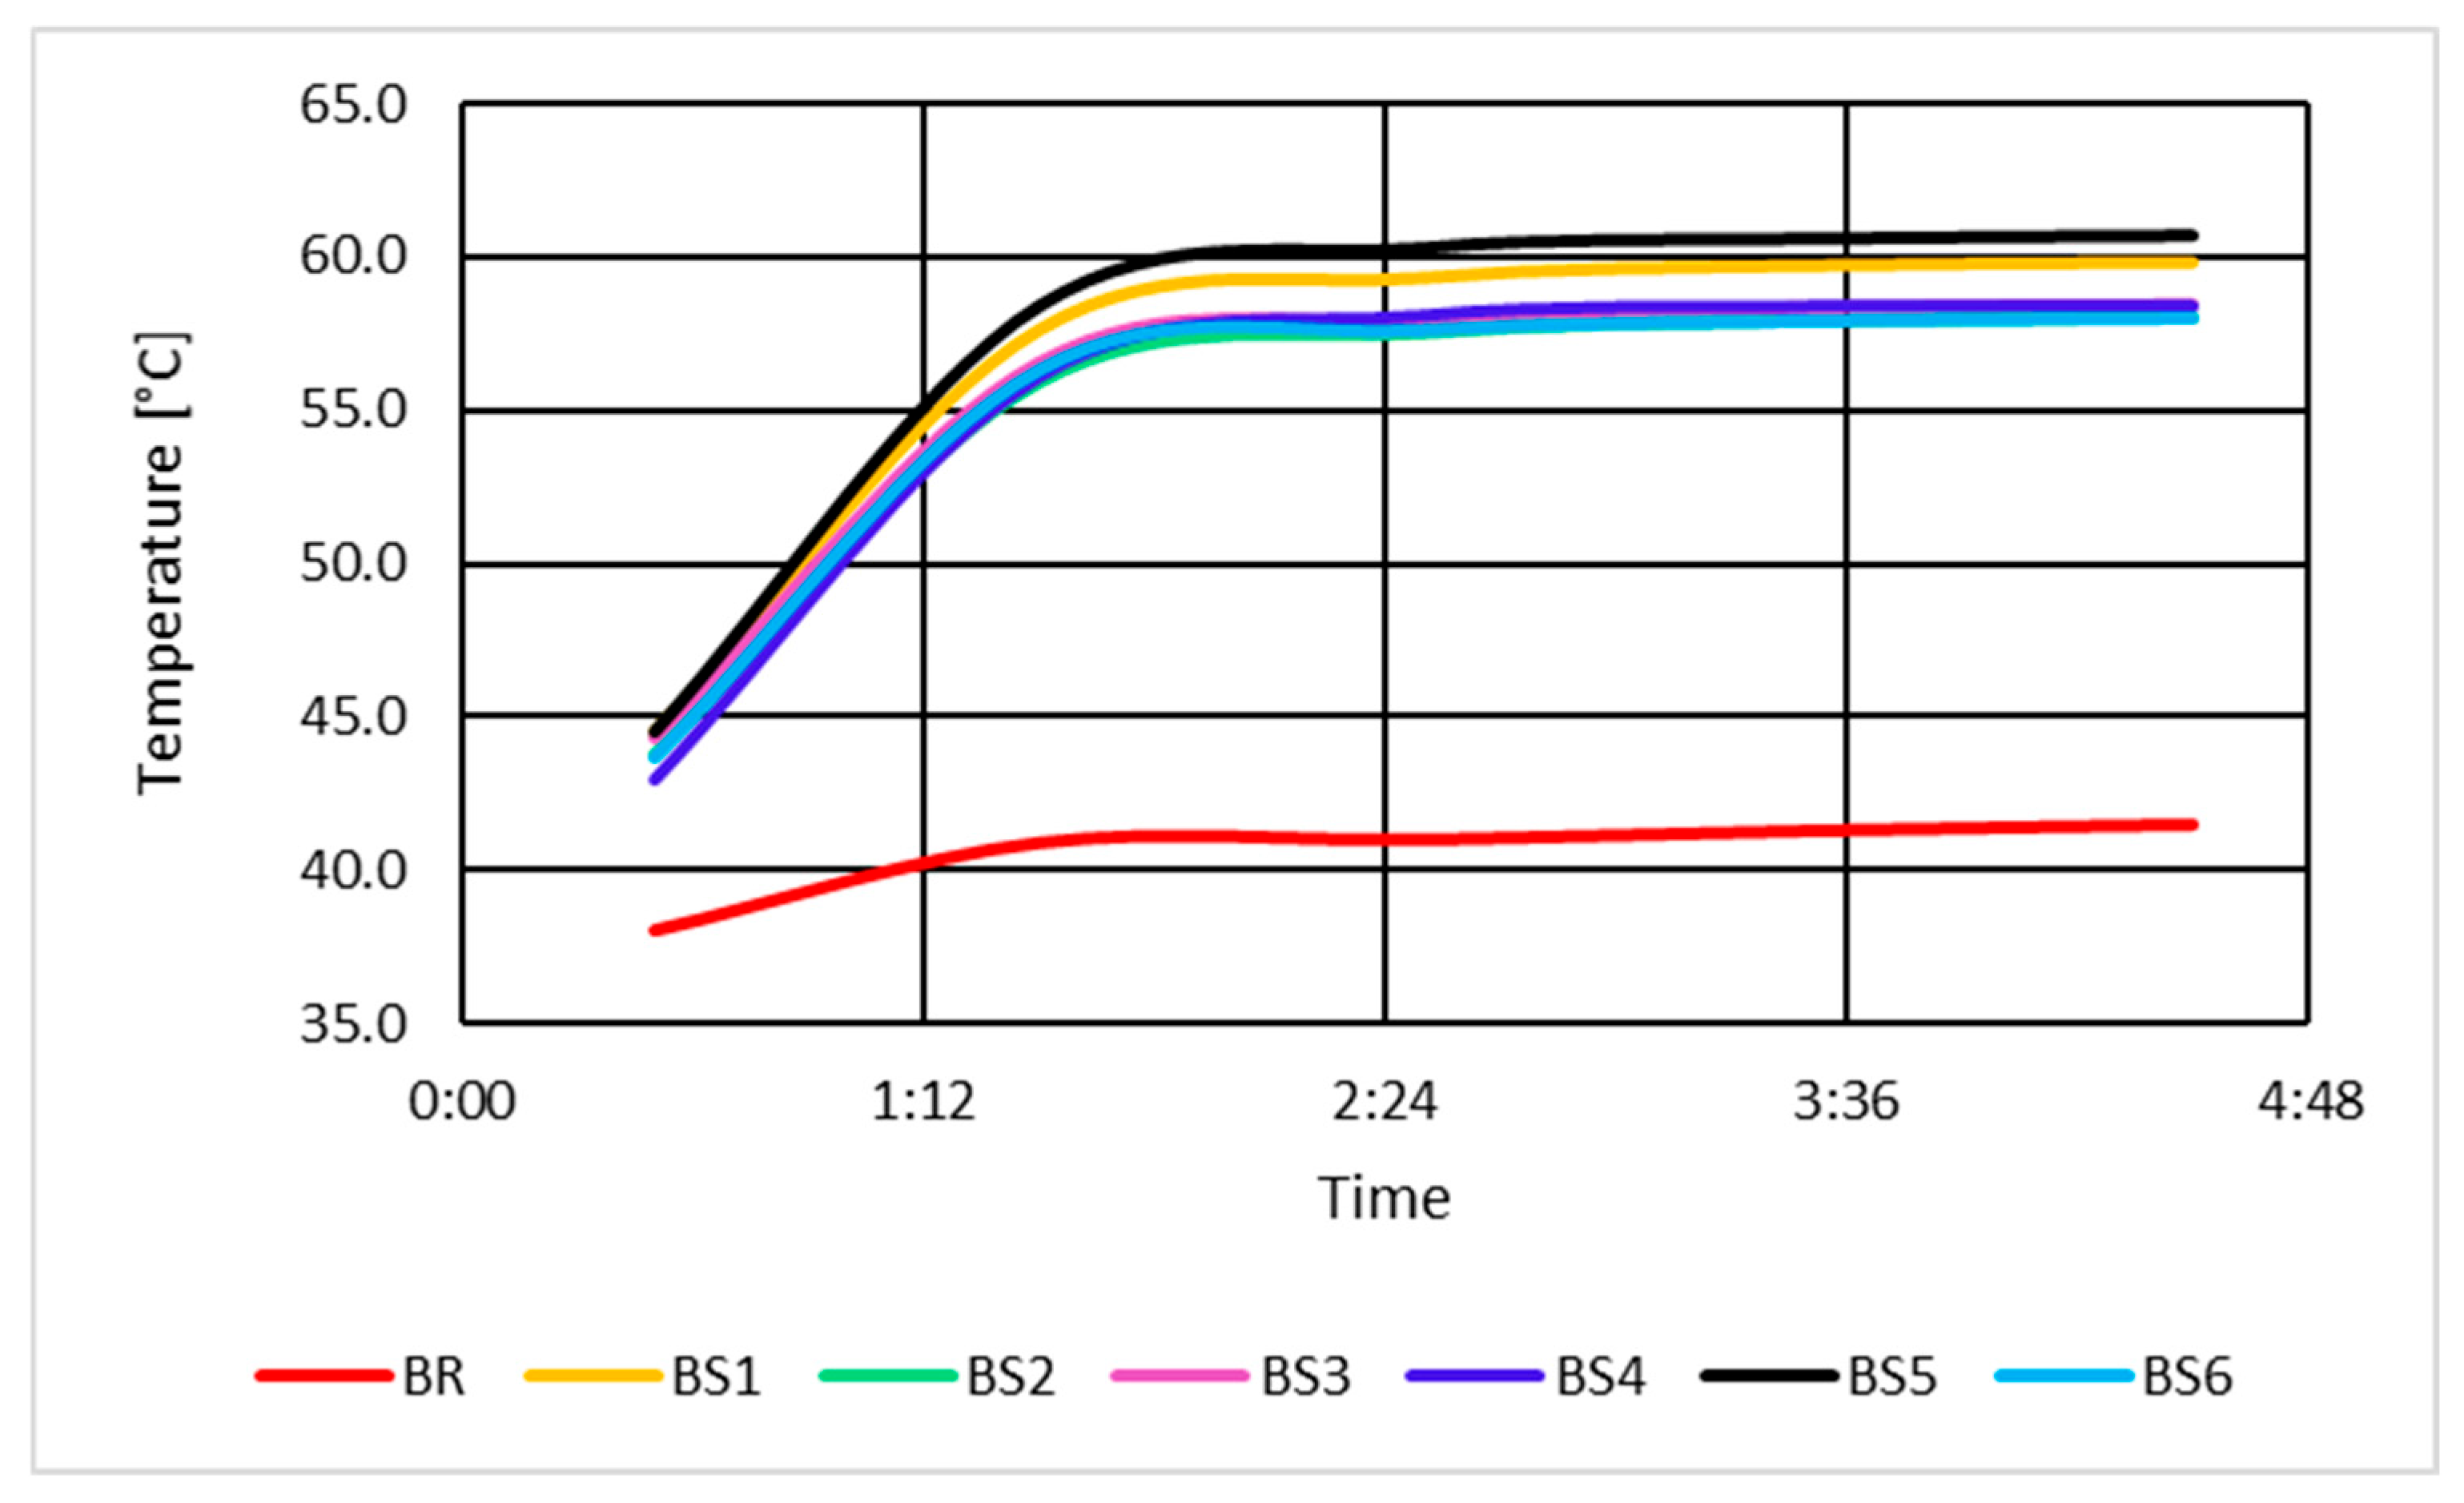
The variation in the temperatures of the stator winding BS, measured through thermoresistances, and the rotor winding BR is presented in Figure 4. It is observed that the temperature stabilizes at the rotor winding level TBR at a value of 28.1 °C, and at the stator winding level TBS at a value of 27.95 °C, which was obtained as the arithmetic mean of the last measured temperature values from the six thermoresistances.
In the no-load unexcited regime, at the beginning of the tests, the temperature measured in the rotor winding was lower than in the stator winding due to the temperature difference between the interior and exterior of the hydro unit and the ventilation caused by rotor movement. By the end of the test period, when stator temperatures stabilized, the rotor winding temperature also decreased and stabilized at a value close to that of the stator.

3.1.4. Determination of Magnetic Core Temperatures in No-Load Unexcited Condition

For this measurement, the temperature of the magnetic core was recorded using the measuring system integrated into the hydro unit. The same measurement period and time interval were maintained.
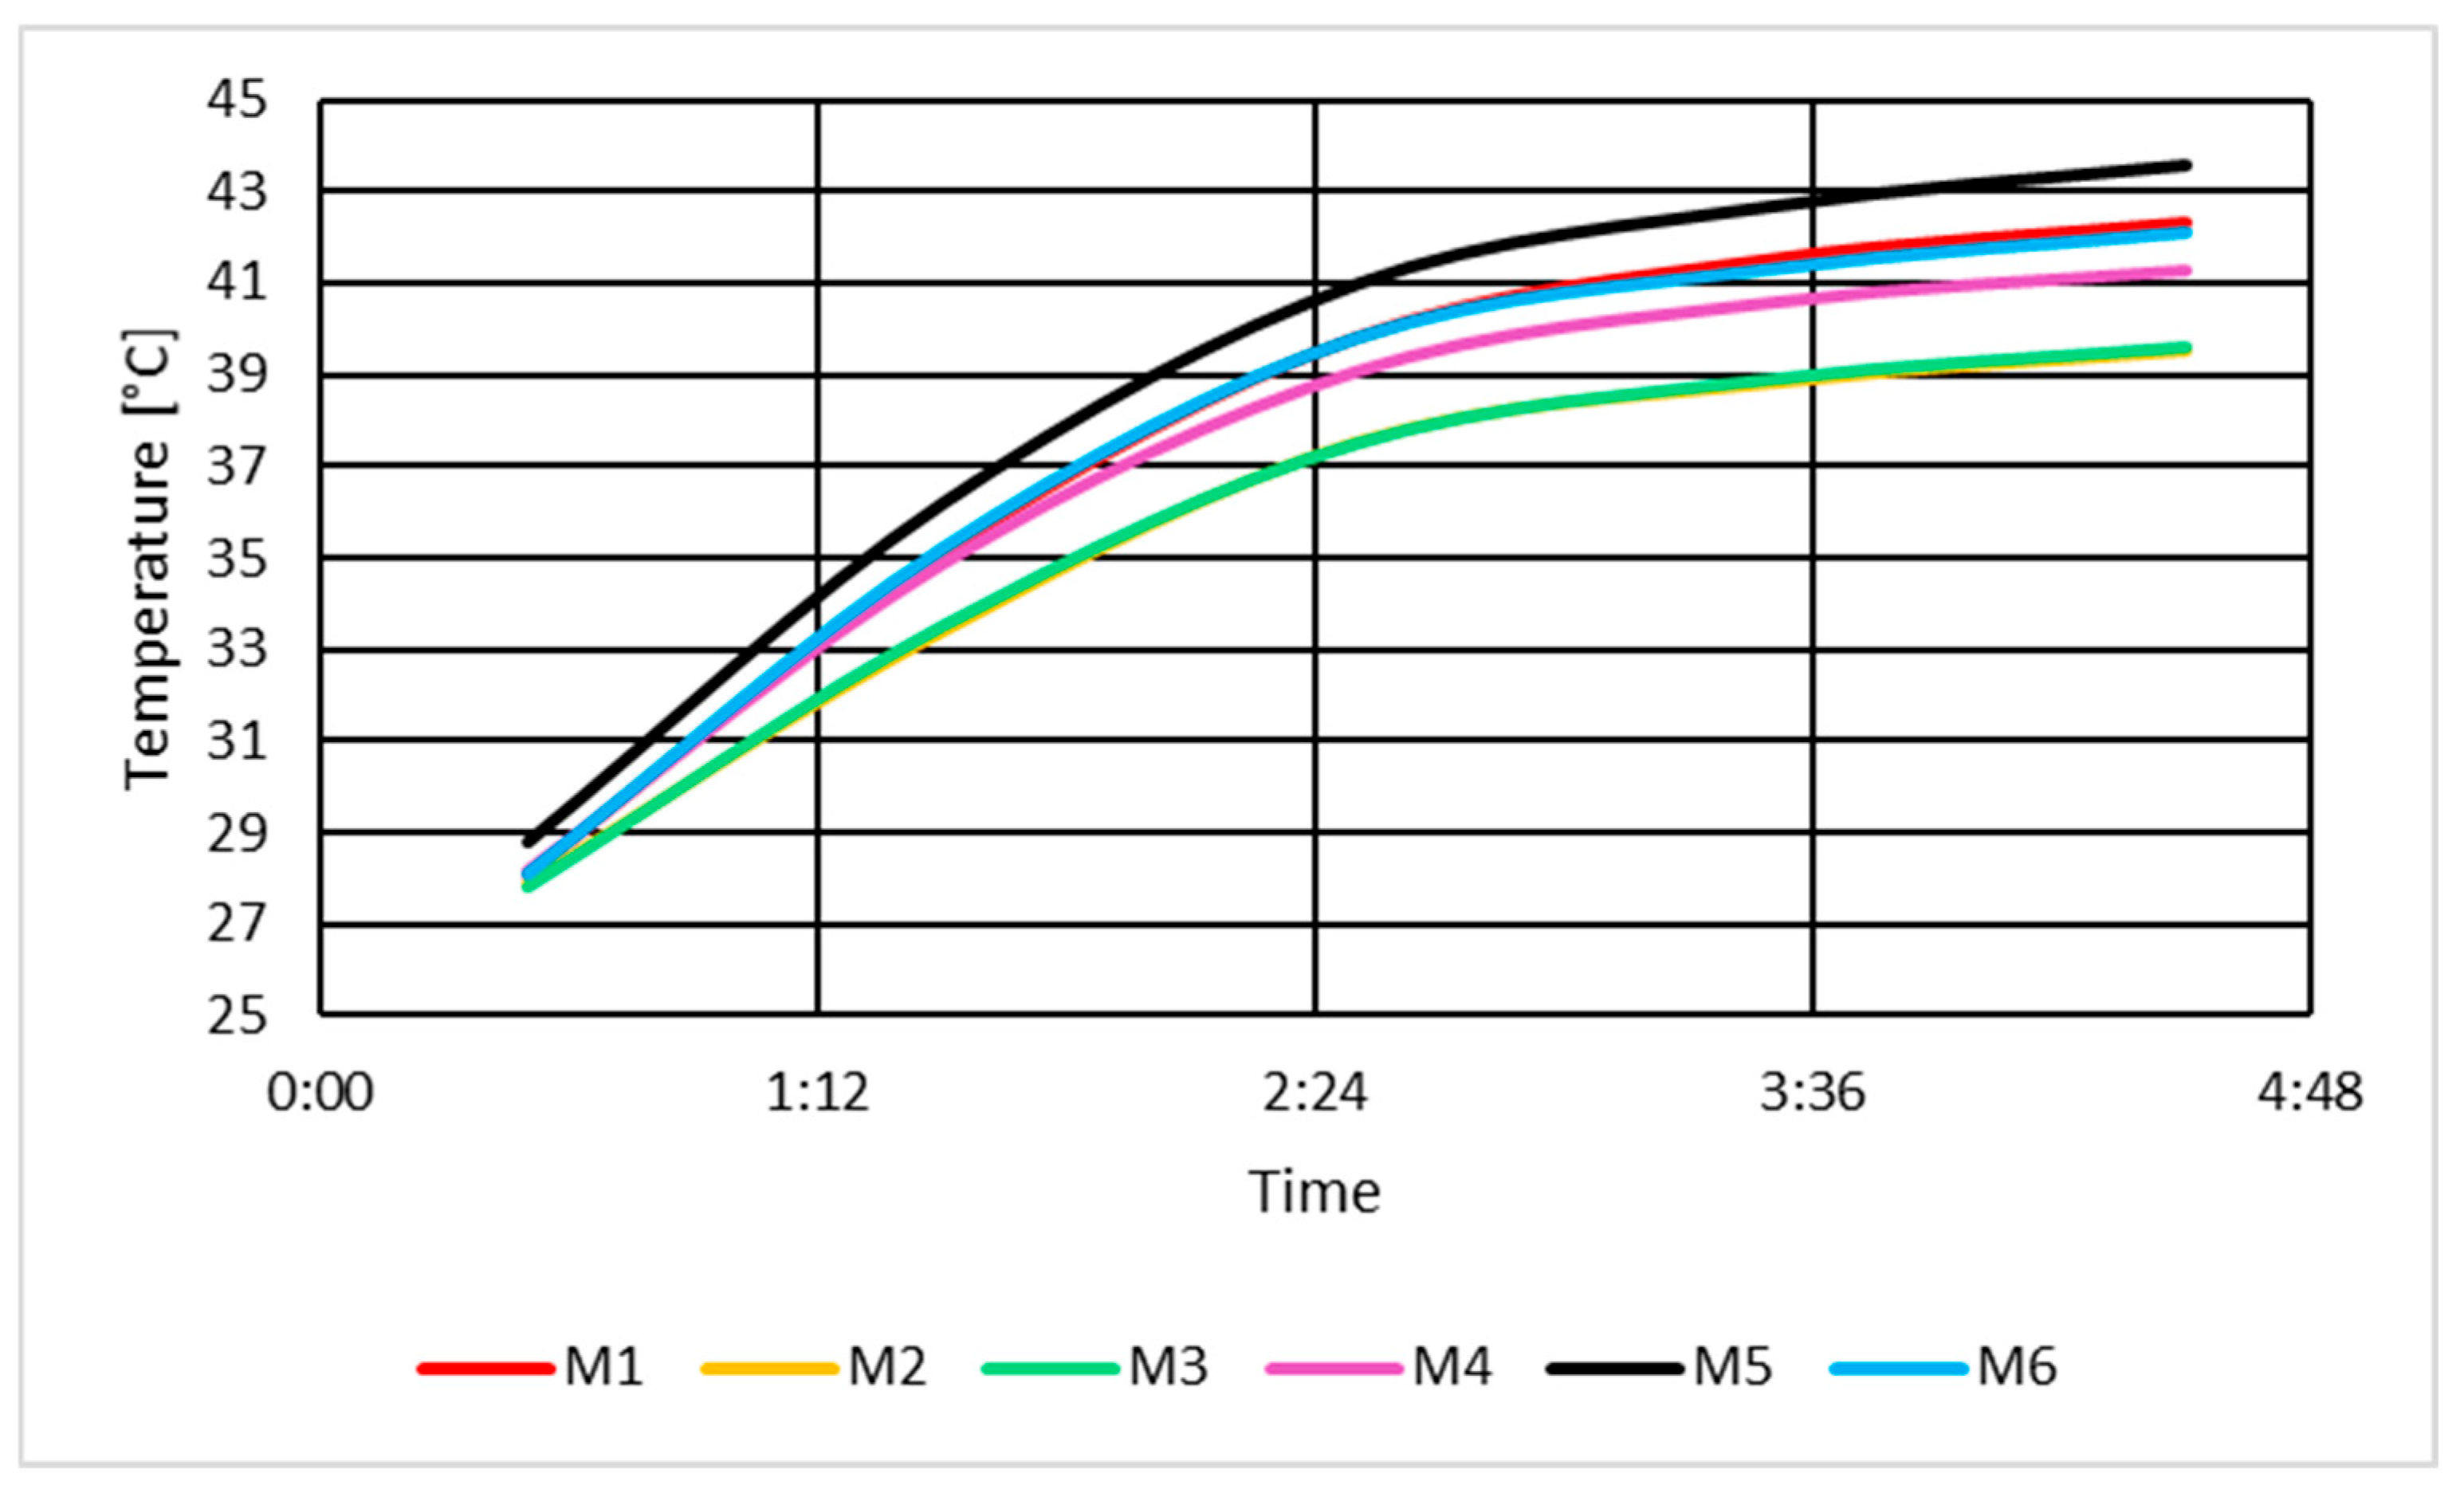
The variation in the magnetic core temperature TM is presented in Figure 5.
The stabilized temperature value at the level of the magnetic core (TM) was 28.15 °C, obtained as the arithmetic mean of the most recent measured temperature values.

3.1.5. Determination of Measured Temperatures at the Upstream Shield and 1 m from the Shield in No-Load Unexcited Condition

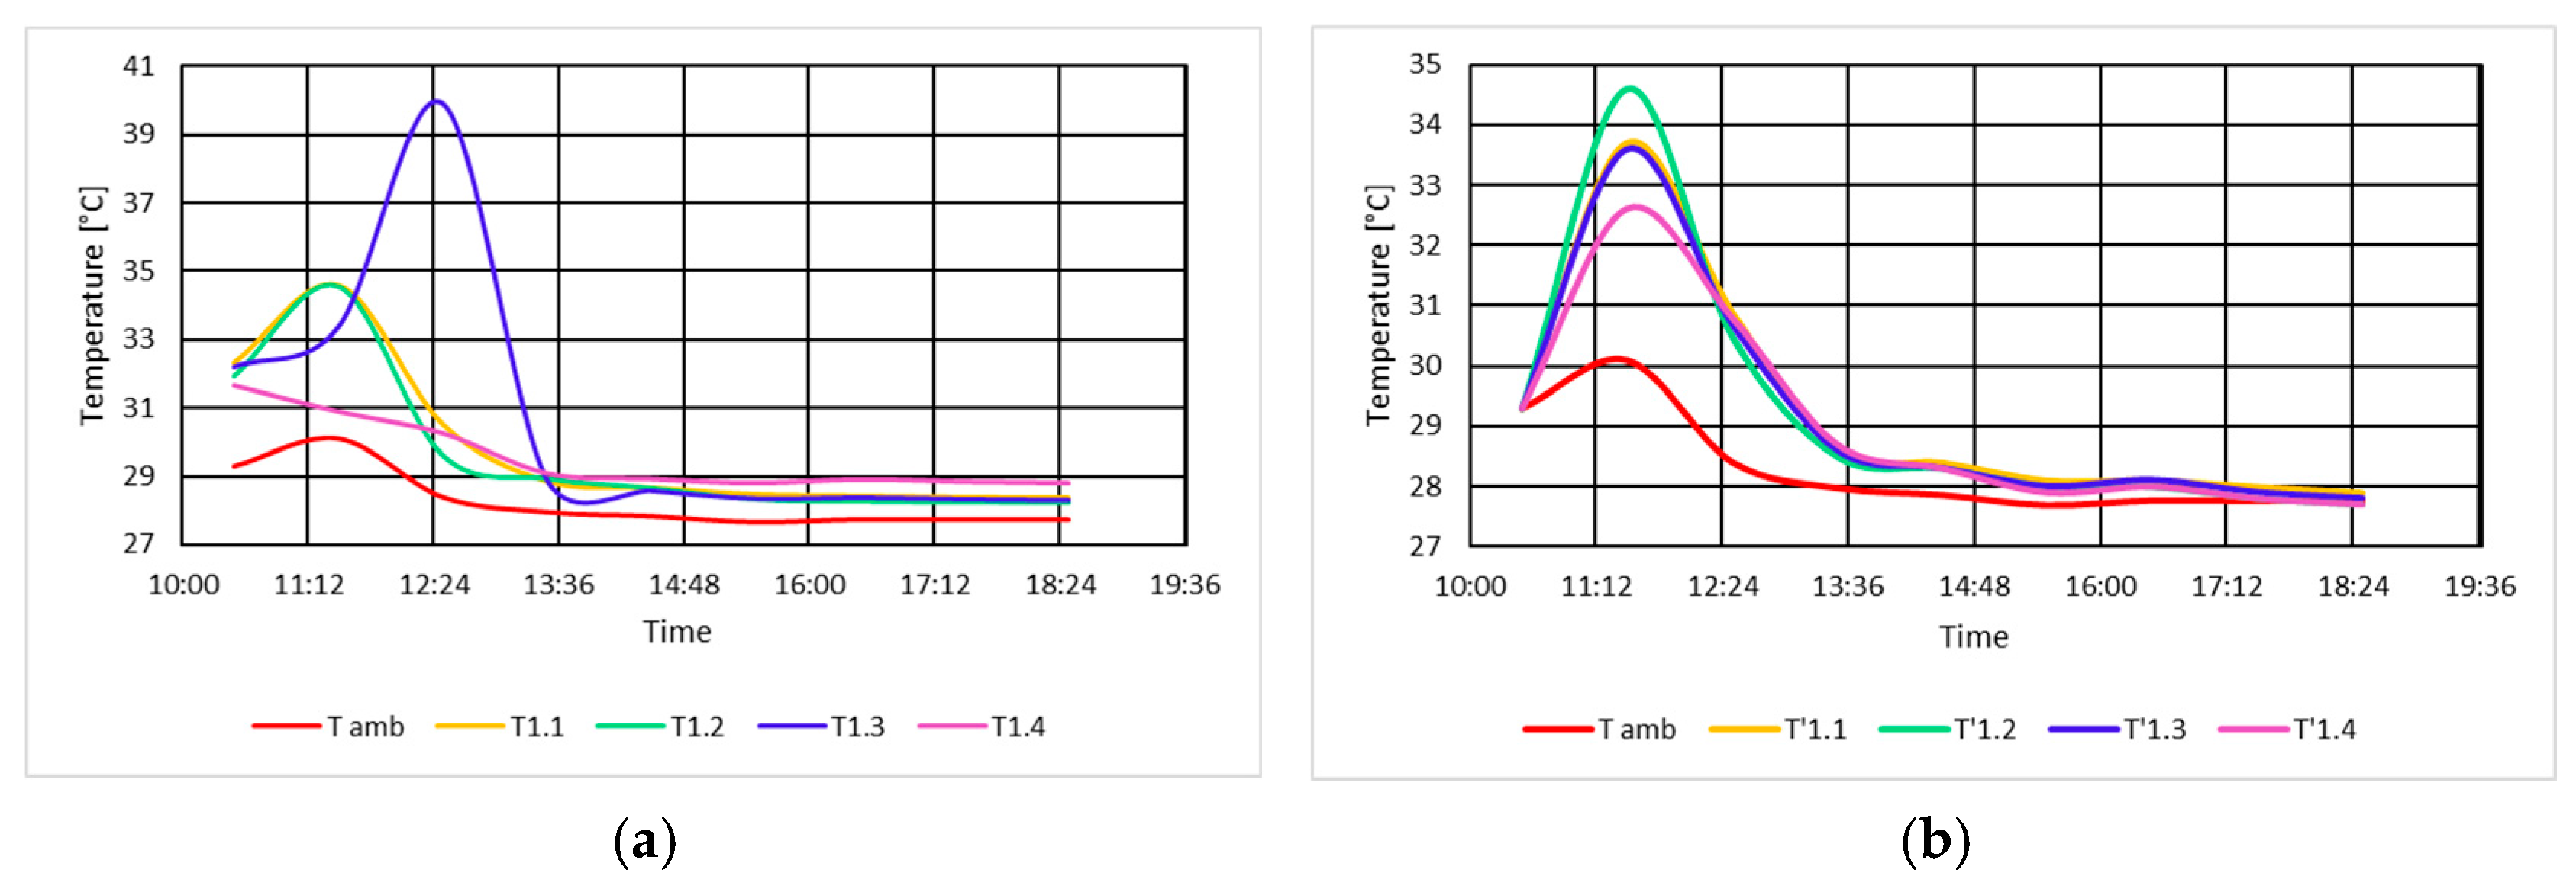
The variation in the ambient temperature and the temperatures measured at the upstream shield and 1 m from this shield is shown in Figure 6a,b.
For this shield, the average temperature T1m at the shield level in the stabilized condition was 28.43 °C, the average temperature at 1 m from the upstream shield T′1m was 27.78 °C, and the stabilized ambient temperature Tamb was 27.75 °C.

3.1.6. Determination of Measured Temperatures at the Downstream Shield and 1 m from the Shield in No-Load Unexcited Condition

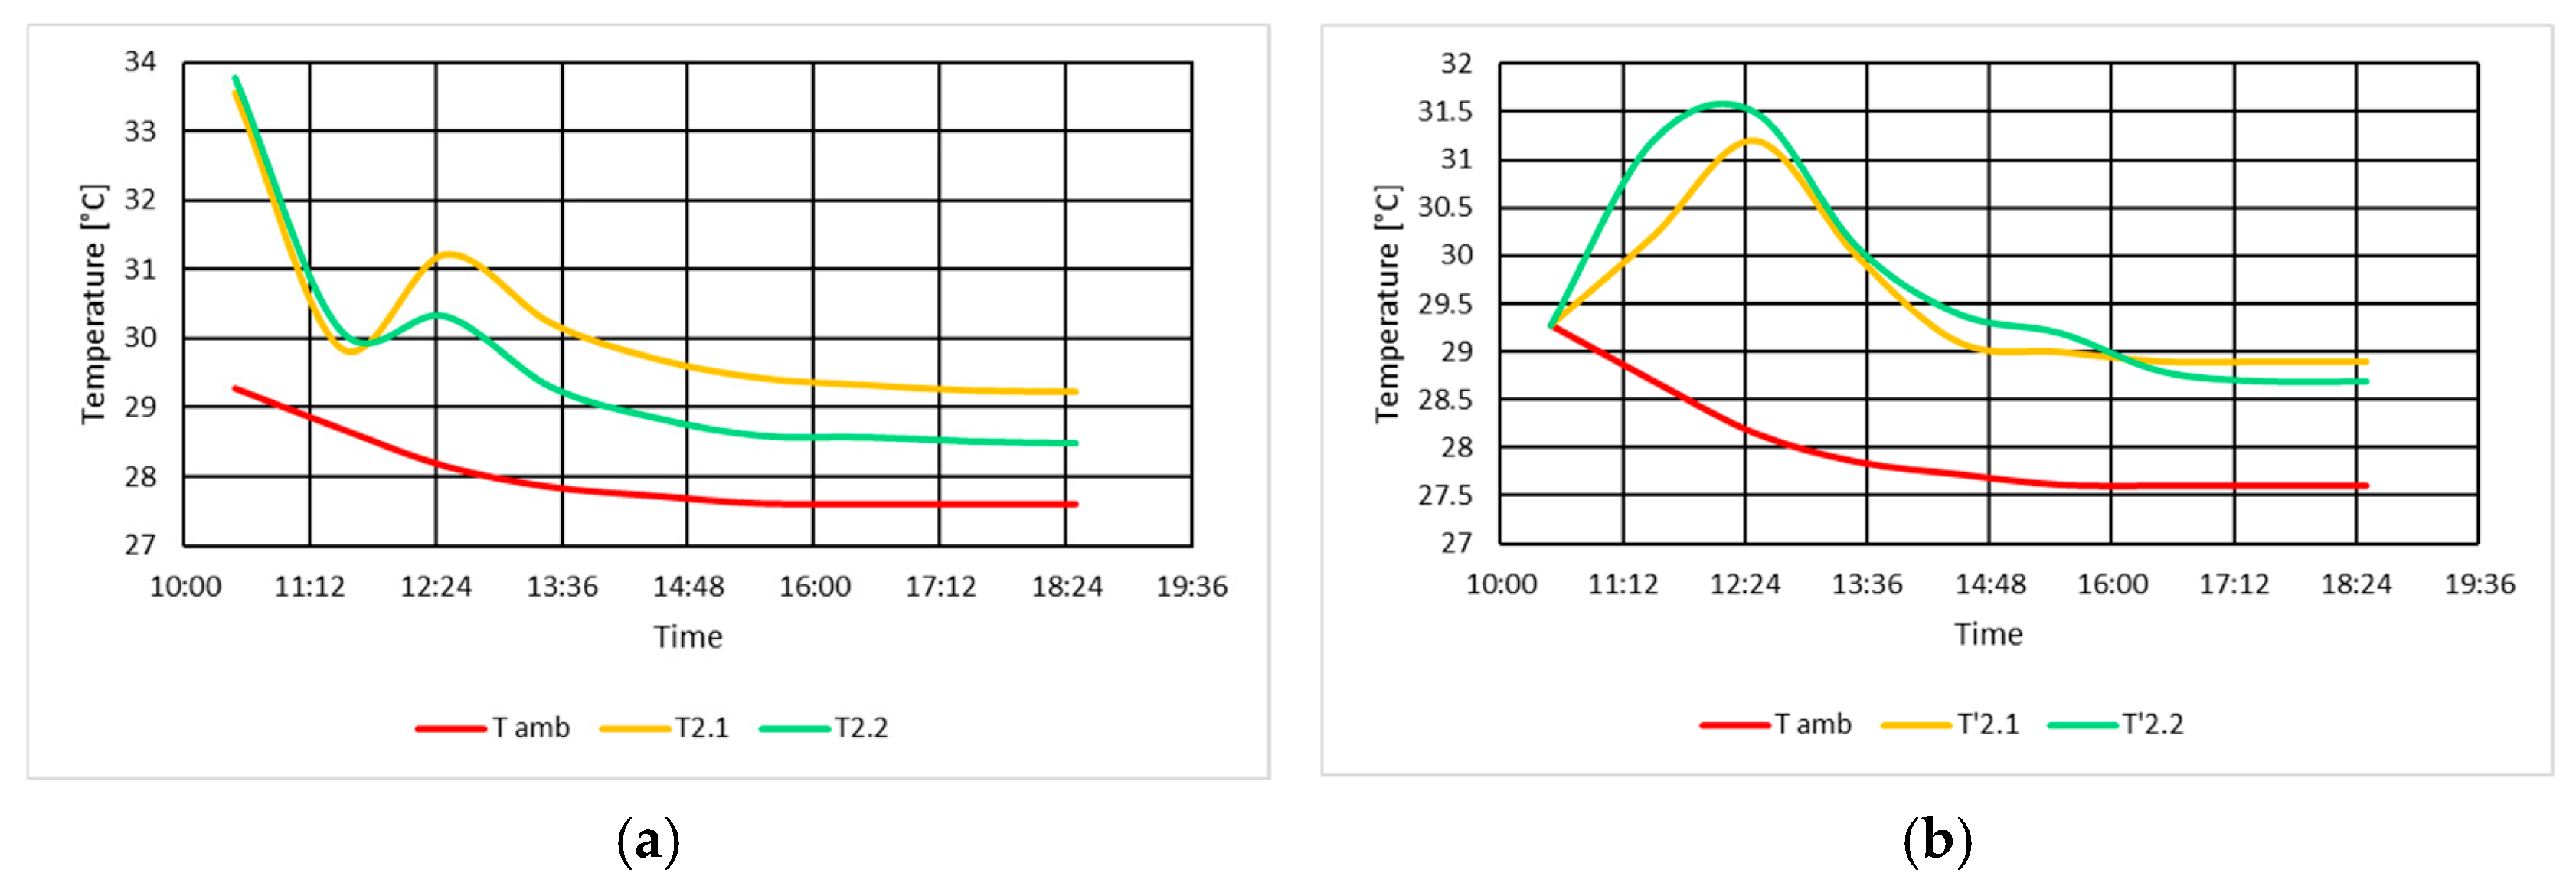
For the downstream shield, and at a distance of 1 m from it, the variation in the measured temperatures is presented in Figure 7a,b, along with the variation in the ambient temperature.
For this shield, the average temperature T2m at the shield level in the stabilized condition was 28.86 °C, the average temperature at 1 m from the downstream shield T′2m was 28.8 °C, and the stabilized ambient temperature Tamb was 27.6 °C.
For the no-load unexcited operating condition, the losses due to radiation and convection P20 through the two shields (upstream and downstream) are determined using the following formula:
P 20 = h 1 A 1 Δ T 1 + h 2 A 2 Δ T 2
where ΔT1 is calculated as the difference between the average temperature T1m at the upstream shield and the average temperature at 1 m from the upstream shield T′1m, and ΔT2 is calculated as the difference between the average temperature T2m at the downstream shield and the average temperature at 1 m from the downstream shield T′2m.
This results in
P 20 = 15 × 20.68 × 0.66 + 15 × 17.33 × 0.555 = 349   [W]

3.2. Measurements Conducted for the No-Load Excited Operating Condition

3.2.1. Determination of Mechanical and Ventilation Losses by Measuring Cold and Hot Water Temperatures in No-Load Excited Condition

To determine stabilized values of temperatures in this condition, the excitation winding of the generator is powered, and its rotor is driven at nominal speed.
Measurements were recorded at a 60 min interval from 18:30 to 0:30. The water flow rates circulating through the five cooler units were 225 L/min, 200 L/min, 185 L/min, 215 L/min, and 200 L/min (Table 2). At each time interval, the temperature of the cold water at the cooler unit inlet and the hot water at the outlet was measured.
The stabilized temperature values measured in the no-load excited condition are presented in Table 2.
The time variation in the cold water temperature is shown in Figure 8a, and that of the hot water in Figure 8b.
The losses associated with the no-load excited condition P10e are determined by the following formula:
P 10 e = Q A i 0 e Δ T i 0 e ρ A C p A
where
  • QAi0e—is the cooling water flow rate through cooler unit i (L/min) in the no-load excited condition;
  • ΔTi0e—is the temperature difference between hot and cold water for cooler unit i (°C) in the no-load excited condition.
The total value of mechanical losses due to ventilation and friction with air determined in the no-load excited operating condition P10e is 131.809 kW.

3.2.2. Determination of Air Temperatures Through Cooler Units in No-Load Excited Condition

To determine the air temperatures, the same five cooler units were used, where the temperature of the cold air at the cooler unit inlet and the hot air at the outlet was measured in the no-load unexcited condition. Measurements were conducted at the same time intervals as for the cooling agent water. The variation in the cold air temperature TArre and the air at the outlet from the cooler units (hot air TArre) for the no-load excited condition is presented in Figure 9a,b.
It is noted that towards the end of the monitoring period, the temperatures through the five cooler units stabilize. The calculated average value of the air temperature at the inlet to the cooler units was TmedArre = 26.7 °C, while the average temperature for the hot air was TmedArce = 33.86 °C.

3.2.3. Determination of Winding Temperatures in No-Load Excitation Mode

To determine the air temperatures, the same five cooler units were used, where the temperature of the cold air at the cooler unit inlet and the hot air at the outlet was measured in the no-load unexcited condition.
The temperature of the rotor winding and the temperatures of the stator winding were measured at the same measurement points and with the same instruments.
Figure 10 presents the variation in the stator winding temperatures BS and the rotor winding temperatures BR.
In no-load excitation mode, the stabilized temperature at the rotor winding level TBRe was 39.7 °C, and at the stator winding level TBSe was 39.97 °C—the value obtained as the arithmetic mean of the last measured temperatures on the stator winding.
In the no-load excited regime, the same trend was observed: the rotor winding temperature stabilized at a value similar to the stator winding temperature.

3.2.4. Determination of Magnetic Core Temperatures in No-Load Excitation Mode

The measurement of the magnetic core temperature of the generator in no-load excitation mode was carried out at the same measurement points and with the same instruments as in the case of no-load non-excitation mode. Figure 11 shows the variation in the temperatures measured between 18:30 and 00:30.
The stabilized temperature value at the magnetic core level, in no-load excitation mode, TMe was 41.87 °C, obtained as the arithmetic mean of the last measured temperatures.

3.2.5. Determination of Temperatures Measured at the Upstream Shield and 1 m from the Shield in No-Load Excitation Mode

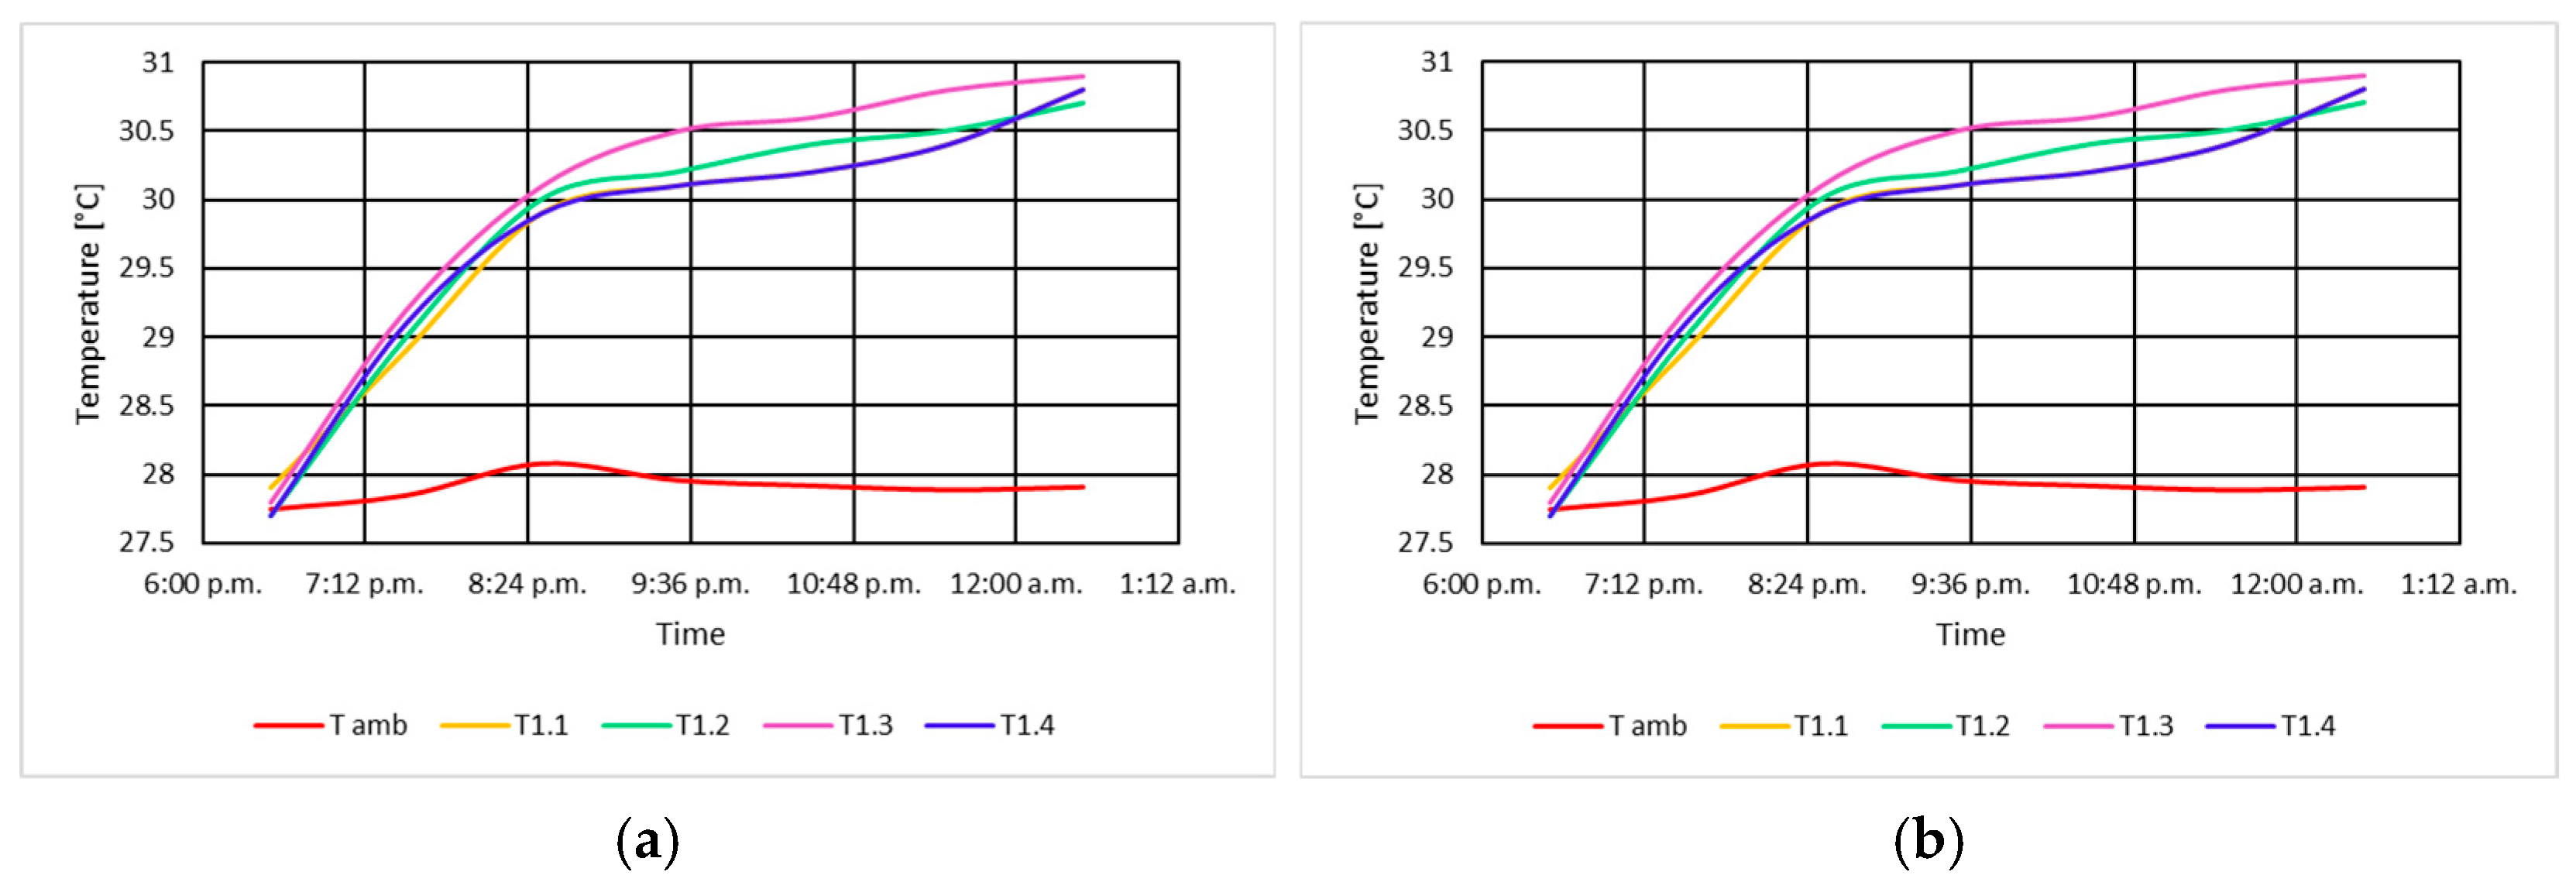
The variation in the ambient temperature and the temperatures measured at the shield upstream and 1 m from this shield, for the no-load excitation mode, is presented in Figure 12a,b.
The average temperature T1me in a stabilized mode at the shield level was 30.8 °C, while the average temperature 1 m from the upstream shield T′1me was 29.61 °C, and the stabilized ambient temperature Tamb was 27.91 °C.

3.2.6. Determination of Temperatures Measured at the Shield Downstream and 1 m from the Shield in No-Load Excitation Mode

For the no-load excitation regime, the variation in the temperatures measured for the downstream shield and at a distance of 1 m from it is presented in Figure 13a,b, along with the variation in the ambient temperature.
For the no-load excitation regime, the average temperature T2me at the shield level in stabilized mode was 31.9 °C, the average temperature 1 m from the downstream shield T′2me was 30.2 °C, and the stabilized ambient temperature Tamb was 28.25 °C.
For the no-load excitation operating mode, the losses through radiation and convection P20e through the two shields (upstream and downstream) are determined using the following Formula (6). Thus,
P 20 e = 15 × 20.68 × 1.2 + 15 × 17.33 × 0.555 = 814.155   [W]

3.3. Measurements Performed for the Short-Circuit Operating Mode

3.3.1. Determination of Mechanical and Ventilation Losses by Measuring the Temperatures of Cold and Hot Water in Short-Circuit Mode

For this regime, a symmetric three-phase short-circuit was made at the terminals of the stator winding of the generator, and the rotor was driven at nominal speed. Subsequently, the excitation winding was powered, adjusting the excitation current until the currents in the stator winding reached nominal values.
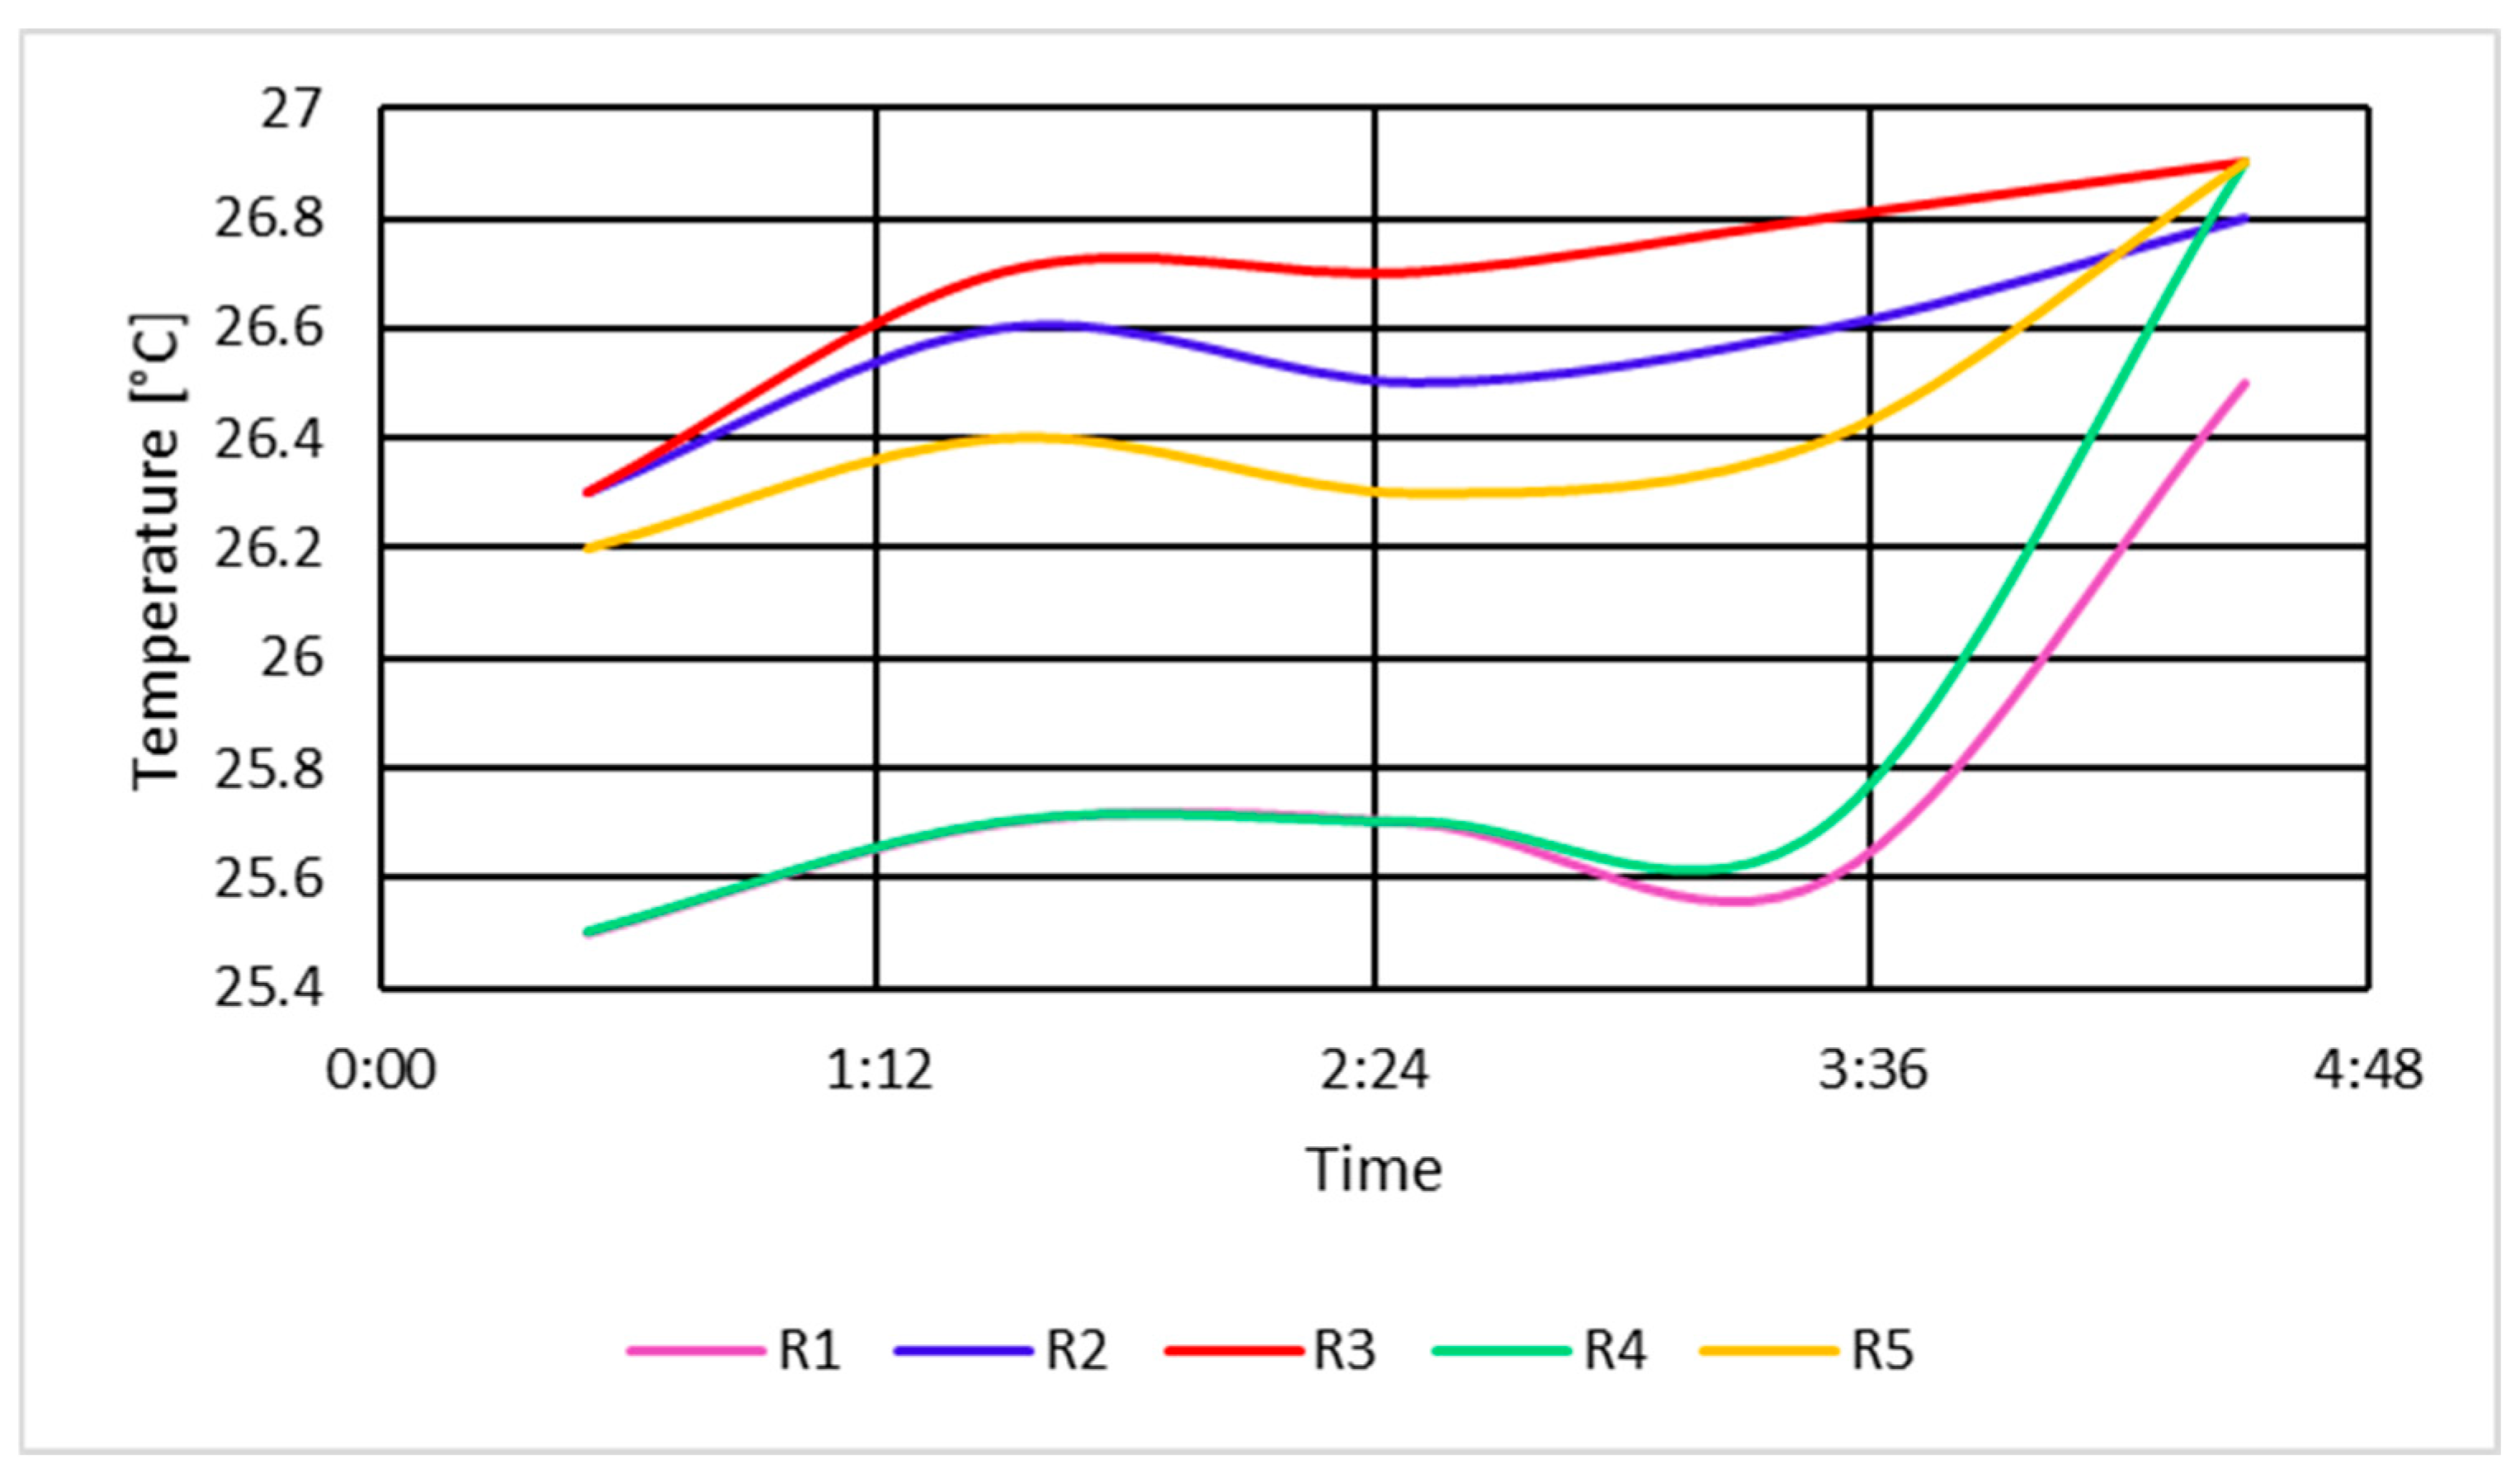
The same interval of 60 min was maintained between two successive measurements, with the measurement period being from 00:30 to 04:30. At each time interval, the value of the cold water temperature at the inlet of the cooler unit and the hot water temperature at the outlet was measured for each cooler unit. The variation over time of the hot water temperature is presented in Figure 14, with the cold water temperature being constant at 24.3 °C.
The losses associated with the short-circuit mode are determined by the following formula:
P 1 s c = Q A i s c Δ T i s c ρ A C p A
where
  • QAisc is the flow rate of cooling water through cooler unit i (L/min) in short-circuit mode;
  • ΔTisc is the temperature difference between hot and cold water for cooler unit i (°C) in short-circuit mode.
The stabilized temperature values measured during short-circuit operation are presented in Table 3, along with the flow rate values of water circulating through the five cooler units.
The total value of mechanical losses through ventilation and air friction determined in short-circuit mode P1sc is 180.753 kW.

3.3.2. Determination of Air Temperatures Through Cooler Units in Short-Circuit Mode

For this regime, the air temperature values at the inlet and outlet of the five cooler units were also determined. The measurements were made at the same time intervals and at the same moments as in the case of measuring the cooling agent water. The variation in the cold air temperature TArrsc and the air at the outlet of the coolers (hot air TArcsc) for the short-circuit regime is presented in Figure 15a,b.
For the short-circuit regime, the calculated average value of the air temperature at the inlet of the cooler units was TmedArrsc = 29.88 °C, while the average temperature for the hot air was TmedArcsc = 38.16 °C.

3.3.3. Determination of Winding Temperatures in Short-Circuit Mode

Similar to the other tests, the temperature of the rotor winding and the temperatures of the stator winding were measured at the same measurement points and with the same instruments. The variation in these temperatures is presented in Figure 16.
For this regime, the stabilized temperature at the rotor winding level TBRsc was 41.5 °C, while at the stator winding level TBSsc it was 58.97 °C, a value obtained as the arithmetic mean of the last measured temperatures on the stator winding.
In the short-circuit regime, the stabilized rotor winding temperature was lower than the stator winding temperature due to the lower current in the rotor winding compared to the stator winding.

3.3.4. Determination of Magnetic Core Temperatures in Short-Circuit Mode

For this regime, the values of the magnetic core temperature of the generator were measured at the same measurement points and with the same instruments as in the case of no-load excitation mode. The variation in the magnetic core temperatures is presented in Figure 17.
The stabilized temperature value at the magnetic core level TMsc was 41.4 °C, obtained as the arithmetic mean of the last measured temperature values.

3.3.5. Determination of Measured Temperatures at the Upstream Shield and 1 m from the Shield Under Short-Circuit Conditions

For operation under short-circuit conditions, Figure 18a,b show the variation in ambient temperature, as well as the temperatures measured at the upstream shield and 1 m from this shield.
For this shield, the average temperature T1msc at the shield level, under stabilized conditions, was 32.28 °C, the average temperature at 1 m from the upstream shield T′1msc was 31.1 °C and the stabilized ambient temperature Tamb was 28.7 °C.

3.3.6. Determination of Measured Temperatures at the Downstream Shield and 1 m from the Shield Under Short-Circuit Conditions

For the downstream shield, as well as at a distance of 1 m from it, the variation in measured temperatures is presented in Figure 19a,b, alongside the variation in the ambient temperature.
For this regime, the average temperature T2msc at the shield level, under stabilized conditions, was 34.6 °C, while the average temperature at 1 m from the downstream shield T′2msc was 33.4 °C.
For the short-circuit operation regime, losses due to radiation and convection P2sc through the two shields (upstream and downstream) are determined using the following Formula (6). This results in
P 2 s c = 15 × 20.68 × 1.2 + 15 × 17.33 × 1.2 = 684.18   [W]

3.4. Determination of the Separate Losses of the Generator

3.4.1. Determination of Losses During the Generator’s Operation in No-Load Unexcited Mode

According to standard IEC 34-2A [38], after reaching a stabilized thermal regime in the generator, the following are determined:
  • The amount of heat that the cooling water absorbs during passage through the cooler units, quantified as power losses P10;
  • The amount of heat transmitted through radiation and convection, quantified as P20 losses.
Thus, for the unloaded unexcited operation regime, ventilation losses Pv were determined using the following formula:
P v = P 10 + P 20 = 49.788 + 0.349 = 50.137   [kW]
where P10 represents the mechanical losses through ventilation and air friction determined during the no-load unexcited operation of the generator, while P20 represents the losses through radiation and convection through the two shields (upstream and downstream) determined for the same regime.

3.4.2. Determination of Losses During the Generator’s Operation in No-Load Excited Mode

For this operating regime of the generator, iron losses are determined. The test is performed at the nominal speed and at the nominal voltage of the generator.
After reaching the stabilized thermal regime in the generator IEC 34-2A, the following quantities are determined:
  • The amount of heat that the cooling water absorbs during passage through the cooler units, transformed into P10e power losses;
  • Losses through radiation and convection, quantified as P20e losses;
  • The voltage at the stator terminals of the generator;
  • The excitation voltage at the rotor terminals of the generator;
  • The excitation current of the generator.
For the operation in no-load excited mode, the iron losses PFe were determined using the following formula:
P F e = P 10 e + P 20 e P v I E 0 2 R E 0 e 40
where
  • P10e represents the mechanical losses through ventilation and air friction determined during the no-load excited operation of the generator;
  • P20e represents the losses through radiation and convection through the two shields determined for the same regime;
  • IE0 is the excitation current in no-load operation of the generator, which had a value of 186 A;
  • RE0e-20 is the resistance of the excitation winding at 20 °C, which in the analyzed case was 0.6941 Ω;
  • RE0e-40 is the resistance of the excitation winding at 40 °C during no-load operation of the generator, which in the analyzed case was 0.7485 Ω.
The value of iron losses PFe that resulted was:
P F e = 131.809 + 0.814 50.137 34.596 × 0.7485 = 56.591   [kW]

3.4.3. Determination of Losses During the Generator’s Operation in Short-Circuit Mode

In short-circuit mode, the losses in copper at the temperature of the winding corresponding to the regime, together with additional losses from the generator, are determined.
The test was performed for the operation of the generator at nominal speed maintained by the speed regulator and at the nominal current in the generator’s stator.
After reaching the stabilized thermal regime in the generator as per IEC 34-2A [38], the following quantities were determined:
  • The amount of heat that the cooling water absorbs during passage through the cooler units, transformed into P1sc power losses;
  • The amount of heat transmitted through radiation and convection, quantified in P2sc;
  • The voltages at the rotor terminals of the generator;
  • The current in the generator’s stator;
  • The excitation current of the generator;
  • The temperatures of the stator winding of the generator;
  • The resistance of the generator’s excitation winding at the temperature corresponding to the short-circuit regime;
  • The resistance of the stator winding in the R1sc phase corresponding to the short-circuit regime.
From the measurements performed on the generator in symmetric three-phase short-circuit, corresponding to the nominal current, the following results were obtained:
  • The excitation current in short-circuit mode, at nominal current, IEsc = 198 A;
  • The current through the stator winding in short-circuit mode, at nominal current, I1sc = 1221 A;
  • The resistance of the excitation winding at 20 °C, REsc-20 = 0.6941 Ω;
  • The resistance of the excitation winding at 42 °C, REsc-42 = 0.7539 Ω;
  • The resistance of the excitation winding at 75 °C, REsc-75 = 0.8438 Ω;
  • The resistance of the stator winding at 20 °C, R1sc-20 = 0.01662 Ω;
  • The resistance of the stator winding at 59 °C, R1sc-59 = 0.0192 Ω.
The copper losses in the stator winding PCu1 are determined using the following formula:
P C u 1 = m I 1 2 R 1 s c 59 = 3 × 1492.307 × 0.0192 = 85.957   [kW]
where m is the number of phases of the generator.
The copper losses in the rotor winding PCu2 are determined using the following formula:
P C u 2 = I E 2 R E s c 42 = 39.204 × 0.7539 = 29.556   [kW]
For the operation regime in short-circuit mode, the additional losses Psuplim were determined using the following formula:
P sup lim = P 1 s c + P 2 s c P v 3 I 1 s c 2 R 1 s c 59 I E s c 2 R E s c 42  
The value of the additional losses Psuplim that resulted was
P sup lim = 181.764 + 0.684 50.137 3 × 1490.841 × 0.0192 39.204 × 0.7539
P sup lim = 16.883   [kW]
The calculated value of mechanical losses Pm was 73.26 kW. The value of the total losses ∑P is determined as the sum of all losses, using the following formula:
P = P m + P F e + P C u 1 + P C u 2 + P suplim = 73.26 + 56.591 + 85.957 + 69.988 + 19.883
P = 302.679   [kW]

3.5. Determination of the Generator’s Efficiency

The determination of the generator’s efficiency is based on the measured and calculated losses under conditions for different values of nominal power 0.25·Pn, 0.5·Pn, 0.75·Pn, Pn, and 1.1·Pn, depending on the value of the power factor.
The efficiency value η was determined using the following formula:
η % = S n cos φ S n cos φ + P 100 = 97.724 %   [kW]
The values of the quantities used to determine the efficiency are presented in Table 4 for the nominal power factor.

4. Discussion

Determining the efficiency of a high-power hydrogenerator using the calorimetric method proved to be a feasible and reliable approach in the context of the impossibility of testing under load. The method is compatible with international standards (IEC 34-2, 34-2A, 34-4) and allows a comprehensive evaluation of energy losses through temperature, flow, and electrical parameter measurements, under real operating conditions. The results obtained are comparable to those mentioned in the literature, confirming that mechanical, ventilation, and iron losses represent a significant proportion of total losses, especially in no-load regimes. In short-circuit mode, the increase in temperature in the stator windings highlights the need for effective cooling solutions and constant monitoring.
As a method based on standardized provisions for determining efficiency via calorimetry, its novelty lies in applying it to a bulb-type hydro unit where cooling is primarily achieved using water as the cooling agent. In conventional hydrogenerators, air plays a significant role in cooling and loss reduction.
Table 5 presents the loss values and efficiency guaranteed by the manufacturer of the refurbished hydro unit, as listed in the technical manual provided upon delivery, alongside the values obtained from the conducted analysis.
It was found that the efficiency value determined via the calorimetric method and measured in situ is very close to the guaranteed value of the refurbished hydrogenerator, with a slight increase observed. This increase is attributed to reduced losses in the generator windings and magnetic core.
Compared to previous studies, where indirect or estimative methods dominate, this research offers a direct alternative, applicable without risks to operating equipment. Additionally, integrating an Intelligent Energy Control System (IECS) could contribute to maintaining high efficiency under variable load and flow conditions, supporting the transition to a more flexible and sustainable energy system.
Depending on the complexity of the intelligent energy control system, it can continuously acquire signals related to temperature, flow rate, current, and voltage values, thereby reducing the time needed to install measurement equipment for determining hydrogenerator efficiency. The downside of this system is the need for periodic verification, calibration, and standardization, which incurs additional costs. Merely acquiring and processing signals from the IECS does not allow for efficiency determination but only for continuous monitoring of operational status to prevent failures and improper functioning.
Future research directions may include applying the method in power plants of different capacities, testing under diverse climatic conditions, or incorporating it into predictive maintenance models based on data.

5. Conclusions

The study demonstrated that the calorimetric method is a viable solution for determining the efficiency of a high-power hydrogenerator when load testing is not possible.
The novelty lies in applying the efficiency determination method to a unique bulb-type hydro unit with a closed-circuit ventilation system, where permanent access to the capsule is possible via a vertical shaft from the upstream head. Additionally, for this type of hydro unit, cooling is achieved using water as the cooling agent, unlike most hydrogenerators that use air.
By applying this method in three distinct regimes (no-load unexcited, no-load excited, and short-circuit), the main thermal losses in the system were identified, highlighting critical energy zones. The increased temperature value in the rotor and stator windings indicates the accumulation of losses in the active electromagnetic areas, suggesting the need for more effective cooling systems. The results obtained can serve as a basis for repair, modernization, or optimization interventions in operational regimes.
Furthermore, the paper shows that evaluating efficiency during the operational phase is essential for increasing energy efficiency and ensuring safe and sustainable operation. Implementing an intelligent monitoring system could complement the calorimetric method and contribute to maintaining optimal efficiency over time. Therefore, the proposed methodology is not only useful but also necessary in the current context of sustainable development in the hydroenergy sector.

Author Contributions

Conceptualization, G.L. and E.S.; methodology, G.L.; validation, E.S., D.A. and C.P.C.; formal analysis, C.P.C.; investigation, G.L. and D.A.; resources, E.S. and C.P.C.; data curation, M.M.; writing—original draft preparation, E.S.; writing—review and editing, E.S. and C.P.C.; visualization, D.A., M.M. and C.P.C.; supervision, E.S. and G.L.; project administration, E.S., C.P.C. and M.M.; funding acquisition, E.S., C.P.C. and M.M. All authors have read and agreed to the published version of the manuscript.

Funding

The publication of this article was supported by the 2024 Development Fund of the UBB.

Data Availability Statement

The data presented in this study are available on request from the first author.

Conflicts of Interest

The authors declare no conflicts of interest. The funders had no role in the design of the study; in the collection, analyses, or interpretation of data; in the writing of the manuscript; or in the decision to publish the results.

Abbreviations

The following abbreviations are used in this manuscript:
IECInternational Electrotechnical Commission
IEAInternational Energy Agency
IECSIntelligent Energy Control System
ηGEfficiency of the generator
PActive power
ΣpLosses from the generator
PTSensor made of platinum
QATotal flow of cooling water
QAi0Flow rate of the cooling water through cooler unit
ΔTi0Temperature difference between hot and cold water
ρADensity of the cooling water
CpASpecific heat of water
TARmAverage temperature of cold water, at the cooler inlet, calculated for all cooler units
TACmAverage temperature of hot water at the cooler outlet, calculated for all cooler units
TAmAverage temperature of the cooling water for all cooler units
P2Losses due to radiation and convection transmitted through the generator shields
hiHeat transfer coefficient through surface
AiSurface area i
ΔTiTemperature difference between surface i and the ambient temperature at 1 m distance
A1Area of the downstream shield of the generator
A2Area of the upstream shield of the generator
SnNominal apparent power
UnNominal voltage
InNominal stator current
UEnNominal excitation voltage
IEnNominal excitation current
mNumber of phases of the generator
nSpeed
cosφPower factor
P10Total value of mechanical losses due to ventilation and friction with air determined in the no-load unexcited operation mode
TArrTemperatures of cold air
TArcTemperatures of hot air at the outlet of the cooler units
BSStator winding
BRRotor winding
TBRTemperatures of rotor winding in no-load unexcited stabilized condition
TBSTemperatures of stator winding in no-load unexcited stabilized condition
TMTemperatures of magnetic core in no-load unexcited stabilized condition
T1mAverage temperature at the upstream shield in no-load unexcited stabilized condition
T′1mAverage temperature at 1 m from the upstream shield in no-load unexcited stabilized condition
TambStabilized ambient temperature
T2mAverage temperature at the downstream shield in no-load unexcited stabilized condition
T′2mAverage temperature at 1 m from the downstream shield in no-load unexcited stabilized condition
P20Losses due to radiation and convection through the two shields (upstream and downstream)
P10eTotal value of mechanical losses due to ventilation and friction with air determined in the no-load excited condition
QAi0eCooling water flow rate through cooler unit i, in no-load excited condition
ΔTi0eTemperature difference between hot and cold water for cooler unit i, in no-load excited condition
TArreTemperatures of cold air in no-load excited condition
TArceTemperatures of hot air at the outlet of the cooler units in no-load excited condition
TBReTemperatures of rotor winding in no-load excited condition
TBSeTemperatures of stator winding in no-load excited condition
TM3Temperatures of magnetic core in no-load unexcited stabilized condition
T1meAverage temperature at the upstream shield in no-load excited stabilized condition
T′1meAverage temperature at 1 m from the upstream shield in no-load excited stabilized condition
T2meAverage temperature at the downstream shield in no-load excited stabilized condition
T′2meAverage temperature at 1 m from the downstream shield in no-load excited stabilized condition
P20eLosses due to radiation and convection through the two shields (upstream and downstream) in no-load excited condition
QAiscFlow rate of cooling water through cooler unit i in short-circuit mode
ΔTiscTemperature difference between hot and cold water for cooler unit i in short-circuit mode.
P1scTotal value of mechanical losses through ventilation and air friction determined in short-circuit mode
TArrscTemperatures of cold air in short-circuit condition
TArcscTemperatures of hot air at the outlet of the cooler units in short-circuit condition
TBRscTemperatures of rotor winding in short-circuit condition
TBSscTemperatures of stator winding in short-circuit condition
TMscTemperatures of magnetic core in short-circuit stabilized condition
T1mscAverage temperature at the upstream shield in short-circuit stabilized condition
T′1mscAverage temperature at 1 m from the upstream shield in short-circuit stabilized condition
T2mscAverage temperature at the downstream shield in short-circuit stabilized condition
T′2mscAverage temperature at 1 m from the downstream shield in short-circuit stabilized condition
P2scLosses due to radiation and convection through the two shields (upstream and downstream) in short-circuit condition
PvVentilation losses
PFeIron losses
IEscExcitation current in short-circuit mode
I1scCurrent through the stator winding in short-circuit mode
REsc-20Resistance of the excitation winding at 20 °C
R1sc-20Resistance of the stator winding at 20 °C
PCu1Copper losses in the stator winding
PsuplimAdditional losses
PmMechanical losses
∑PTotal losses
ηEfficiency
HamUpstream water level
HavDownstream level

References

  1. Yahya, A.K.; Munim, W.N.W.A.; Othman, Z. Pico-hydro power generation using dual pelton turbines and single generator. In Proceedings of the 8th IEEE International Power Engineering and Optimization Conference (PEOCO), Shah Alam, Malaysia, 24–25 March 2014. [Google Scholar]
  2. Reducing Global Energy Consumption. Available online: https://www.agg-net.com/resources/articles/ancillary-equipment/reducing-global-energy-consumption (accessed on 12 July 2022).
  3. Renewable Energy. Available online: https://ourworldindata.org/renewable-energy (accessed on 12 July 2022).
  4. REPowerEU: Affordable, Secure and Sustainable Energy for Europe. Available online: https://ec.europa.eu/info/strategy/priorities-2019-2024/european-green-deal/repowereu-affordable-secure-and-sustainable-energy-europe_en (accessed on 12 July 2022).
  5. Pistelok, P.; Baranski, M. Highly efficient synchronous generators with permanent magnets intended to small hydropower station. In Proceedings of the 5th International Conference on Clean Electrical Power (ICCEP), Taormina, Italy, 16–18 June 2015. [Google Scholar]
  6. Rozowicz, S.; Goryca, Z.; Peczkis, G.; Korczak, A. Pico hydro generator as an effective source of renewable energy. Prz. Elektrotechniczny 2019, 95, 200–204. [Google Scholar]
  7. Tanutwutthigorn, K.; Suntivarakorn, R. Efficiency improvement and economic analysis of micro hydro power plant by using twin vertical hydro turbine. In Proceedings of the 9th International Conference on Future Environment and Energy (ICFEE), Osaka, Japan, 9–11 January 2019. [Google Scholar]
  8. Pomoja, F.; Manescu, T.S.; Hopota, A. Improving efficiency of an micro-hydro aggregate using a banky 10 kw micro-turbine, by blade design optimization. In Proceedings of the 7th International Symposium on Machine and Industrial Design in Mechanical Engineering (KOD 2012), Balatonfured, Hungary, 24–26 May 2012. [Google Scholar]
  9. Rubes, O.; Cervinka, D. Efficiency optimization of small hydro power plant in low power operation. In Proceedings of the IEEE International Conference on Environment and Electrical Engineering and 2017 IEEE Industrial and Commercial Power Systems Europe (EEEIC/I&CPS Europe), Milan, Italy, 6–9 June 2017. [Google Scholar]
  10. Rubes, O.; Cervinka, D. Increasing the Efficiency of Induction Generator in Small Hydro Power Plant for Varying River Flow Rate. In Proceedings of the 12th International Conference on Mechatronics, Brno, Czech Republic, 6–8 September 2017. [Google Scholar]
  11. Rubes, O.; Knobloch, J.; Cervinka, D. Techniques to Increase the Efficiency of Small Hydro Power Plants with Induction Machine. In Proceedings of the IEEE International Conference on Environment and Electrical Engineering (EEEIC)/IEEE Industrial and Commercial Power Systems Europe (ICPS Europe), Palermo, Italy, 12–15 June 2018. [Google Scholar]
  12. IEEE Standard 115-2009; IEEE Guide Test Procedures for Synchronous Machines, Acceptance and Performance Testing and Parameter Determination for Dynamic Analysis. IEEE: New York, NY, USA, 2010.
  13. IEC 60034-2-2; Rotating Electrical Machines. Part 2-2: Specific Methods for Determining Separate Losses of Large Machines from Tests. IEC: Geneva, Switzerland, 2020.
  14. Li, W.L.; Liang, D.W.; Zhang, Y. Calculation of Iron Loss in Large Hydro-Generator under Non-Load. In Proceedings of the International Conference on Materials Science and Information Technology (MSIT 2011), Singapore, 16–18 September 2011. [Google Scholar]
  15. Merkhouf, A.; Guillot, E.; Hudon, C.; Desnoyers, M.; Aguiar, A.B.M.; Al-Haddad, K. Electromagnetic Loss Computation in Large Hydro Electrical Generator Using Different Existing Models. In Proceedings of the 20th International Conference on Electrical Machines (ICEM), Marseille, France, 2–5 September 2012. [Google Scholar]
  16. Aguiar, A.B.M.; Merkhouf, A.; Al-Haddad, K. Influence of the Air Gap Length on the Magnetic Core Loss in Large Hydro Generator. In Proceedings of the 20th International Conference on Electrical Machines (ICEM), Marseille, France, 2–5 September 2012. [Google Scholar]
  17. Ćalasan, M.; Ostojić, M.; Petrović, D. The retardation method for bearings loss determination. In Proceedings of the International Symposium on Power Electronics Power Electronics, Electrical Drives, Automation and Motion, Sorrento, Italy, 20–22 June 2012. [Google Scholar]
  18. Rehfeldt, A.; Fricke, T.; Schwarz, B.; Bresemann, E.; Ponick, B. Measurement of Sub-Conductor Circulating Currents in Roebel Bars of a Hydro Generator. In Proceedings of the 13th International Conference on Electrical Machines (ICEM), Alexandroupoli, Greece, 3–6 September 2018. [Google Scholar]
  19. Traxler-Samek, G.; Langmayr, D. Three-dimensional temperature distribution in large hydro-generators: Efficient simulation and optimization. Elektrotechnik Informationstechnik 2019, 136, 216–223. [Google Scholar] [CrossRef]
  20. Bortoni, E.C.; Siniscalchi, R.T.; Jardini, J.A. Hydro Generator Efficiency Assessment using Infrared Thermal Imaging Techniques. In Proceedings of the IEEE-Power-and-Energy-Society General Meeting, Minneapolis, MN, USA, 25–29 July 2010. [Google Scholar]
  21. Bortoni, E.C.; Siniscalchi, R.T.; Jardini, J.A. Determination of Hydro Generator Efficiency Using Infrared Thermal Imaging Techniques. IEEE Trans. Energy Convers. 2012, 27, 1134–1139. [Google Scholar]
  22. Bortoni, E.C.; Siniscalchi, R.T. Hydro generators losses measurement in accordance to IEEE-STD-115 and IEC-60034-2. In Proceedings of the 2012 IEEE Power and Energy Society General Meeting, San Diego, CA, USA, 22–26 July 2012. [Google Scholar]
  23. Baholo, B.; Mellor, P.H.; Howe, D.; Birch, T.S. An automated calorimetric method of loss measurement in electrical machines. J. Magn. Magn. Mater. 1994, 133, 433–436. [Google Scholar] [CrossRef]
  24. Bertalanic, Z.; Pavlica, M.; Maljkovic, Z. Analysis of hydro-generator’s losses determined by calorimetric method. In Proceedings of the XIX International Conference on Electrical Machines—ICEM 2010, Rome, Italy, 6–8 September 2010. [Google Scholar]
  25. Hudon, C.; Levesque, M.; Torriano, F.; Gingras, S.; Picard, J.; Petit, A. On-Line Rotor Temperature Measurements. In Proceedings of the 32nd Electrical Insulation Conference (EIC), Philadelphia, PA, USA, 8–11 June 2014. [Google Scholar]
  26. Guerrero, R.C.; Aller, J.M. Efficiency Calculation for a 90 MVA Vertical Shaft Hydro-Alternator using the Calorimetric Method. In Proceedings of the 2024 IEEE ANDESCON, Cusco, Peru, 11–13 September 2024. [Google Scholar]
  27. Indra, B.B.; Suresh, R. Generator Efficiency Measurement by Calorimetric Method: Case of UT3A HEP 60MW. Proc. IOE Grad. Conf. 2019, 7, 29–36. [Google Scholar]
  28. Rasilo, P.; Ekström, J.; Haavisto, A.; Belahcen, A.; Arkkio, A. Calorimetric System for Measurement of Synchronous Machine Losses. IET Electr. Power Appl. 2012, 5, 286–294. [Google Scholar] [CrossRef]
  29. Battisti, L.; Tieghi, L.; Fattahi, S. Heat-Loss Based Method for Real-Time Monitoring Method for Hydroelectric Power Plant Efficiency. Energies 2025, 18, 2586. [Google Scholar] [CrossRef]
  30. Xinjie, G.; Chunqiang, P.; Hongtao, L.; Xuhui, X.; Cuiwei, J. Measuring uncertainty of hydraulic generator efficiency by calorimetric method. In Journal of Physics: Conference Series, Proceedings of the 4th IAHR Asian Working Group Symposium on Hydraulic Machinery and Systems, Kashgar, China, 12–16 August 2023; IOP Publishing: Philadelphia, PA, USA, 2024; Volume 2752, p. 012218. [Google Scholar]
  31. Widiyanto, P.; Irasari, P.; Hikmawan, M.F. Suitability Analysis of Cross-Flow Turbine and Synchronous Generator Characteristics for Very Low Head Hydro Power Application. In Proceedings of the International Conference on Sustainable Energy Engineering and Application (ICSEEA)—Innovative Technology Toward Energy Resilience, Tangerang, Indonesia, 23–24 October 2019. [Google Scholar]
  32. Jiang, F.; Bo, Z.Q.; Li, R.M. Performance of induction generator in parallel with an unbalanced three phase system. In Proceedings of the 1998 International Conference on Power System Technology (POWERCON 98), Beijing, China, 18–21 August 1998. [Google Scholar]
  33. Safdar, I.; Sultan, S.; Raza, H.A.; Umer, M.; Ali, M. Empirical analysis of turbine and generator efficiency of a pico hydro system. Sustain. Energy Technol. Assess. 2020, 37, 100605. [Google Scholar] [CrossRef]
  34. Kunckel, S.; Klaus, G.; Liese, M. Calculation of eddy current losses and temperature rises at the stator end portion of hydro generators. In Proceedings of the International Conference on Electrical Machines (ICEM 2002), Brugge, Belgium, 26–28 August 2002. [Google Scholar]
  35. Valsan, V.; Kanakasabapathy, P. Design and Implementation of Smart Energy Management System for Stand-alone Micro-hydro Systems. In Proceedings of the IEEE International Conference on Technological Advancements in Power and Energy (IEEE TAP Energy)—Exploring Energy Solutions for an Intelligent Power Grid, United Nat Acad Impact, Kollam, India, 21–23 December 2017. [Google Scholar]
  36. Barboianu, I.; Grigoriu, M.; Popescu, M.C. Application Software for Analyzing the Dynamic Stability of Hydro-aggregates. Int. J. Comput. Sci. Netw. Secur. 2020, 17, 227–234. [Google Scholar]
  37. IEC 60034-2-1:2024; Rotating Electrical Machines—Part 2-1: Standard Methods for Determining Losses and Efficiency from Tests (Excluding Machines for Traction Vehicles). IEC: Geneva, Switzerland, 2024.
  38. IEC 60034-2A:1974; Rotating Electrical Machines—Part 2: Methods for Determining Losses and Efficiency of Rotating Electrical Machinery form Tests (Excluding Machines for Traction Vehicles)—Measurement of Losses by the Calorimetric Method. IEC: Geneva, Switzerland, 1974.
  39. IEC 60034-4:1967; Recommendations for Rotating Electrical Machinery (Excluding Machines for Traction Vehicles)—Part 4: Methods for Determining Synchronous Machine Quantities from Tests. IEC: Geneva, Switzerland, 1967.
  40. IEC 61000-4-30 Consolidated version; Electromagnetic Compatibility (EMC)—Part 4-30: Testing and Measurement Techniques—Power Quality Measurement Methods. IEC: Geneva, Switzerland, 2021.
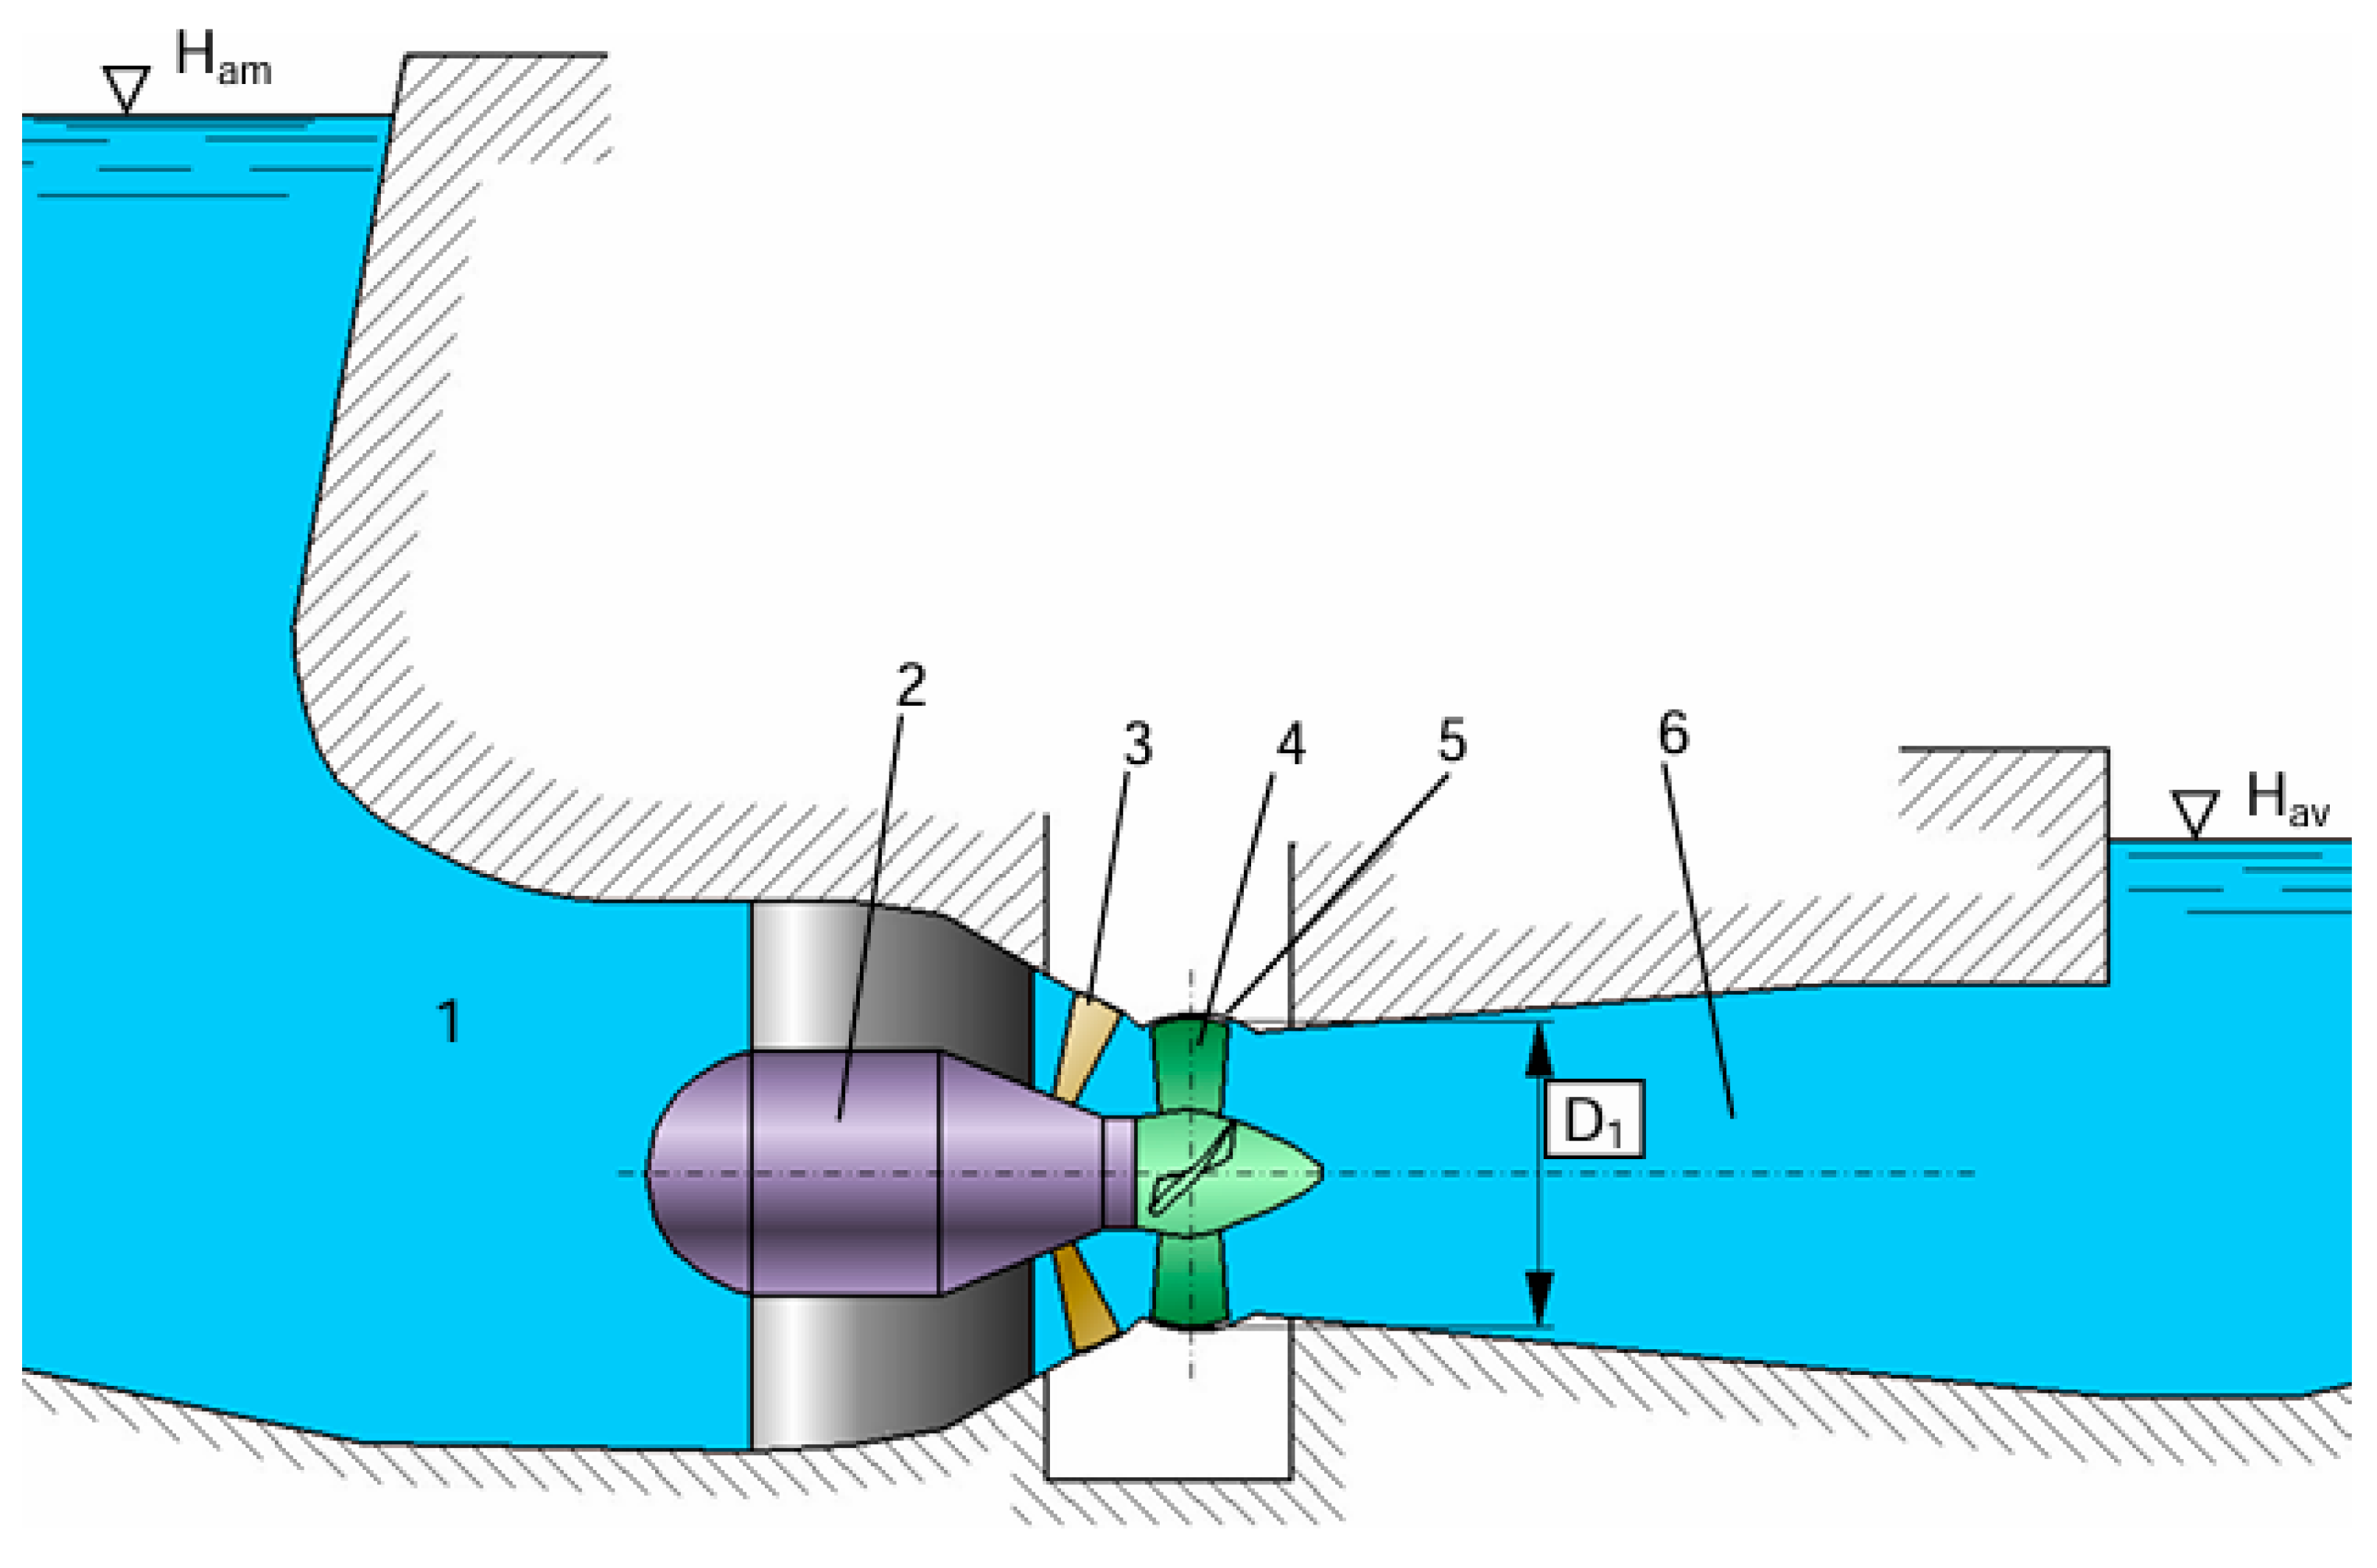
Figure 1. Cross-section view of a hydroelectric facility with a bulb-type turbine.
Energies 18 04813 g001
Figure 2. Variation in the cooling agent temperature during the generator operation in no-load unexcited mode: (a) water at the inlet of the cooler unit; (b) water at the outlet of the 5 cooler units.
Energies 18 04813 g002
Figure 3. Variation in the cooling agent temperature during the generator operation in no-load unexcited mode: (a) air at the inlet of the cooler unit; (b) air at the outlet of the 5 cooler units.
Energies 18 04813 g003
Figure 4. Variation in generator winding temperatures in no-load unexcited condition.
Energies 18 04813 g004
Figure 5. Variation in magnetic core temperatures of the generator in no-load unexcited condition.
Energies 18 04813 g005
Figure 6. Variation in temperatures measured for the upstream shield in no-load unexcited condition: (a) at the shield level; (b) at a distance of 1 m from the upstream shield.
Energies 18 04813 g006
Figure 7. Variation in temperatures measured for the downstream shield in no-load unexcited condition: (a) at the shield level; (b) at a distance of 1 m from the downstream shield.
Energies 18 04813 g007
Figure 8. Variation in cooling agent temperature during generator operation in no-load excited condition: (a) water at cooler unit inlet; (b) water at outlet from the 5 cooler units.
Energies 18 04813 g008
Figure 9. Variation in the cooling agent temperature during the generator’s no-load excitation operation: (a) air at the inlet of the cooler unit; (b) air at the outlet of the 5 cooler units.
Energies 18 04813 g009
Figure 10. Variation in the generator winding temperatures in no-load excitation mode.
Energies 18 04813 g010
Figure 11. Variation in the magnetic core temperatures of the generator in no-load excitation mode.
Energies 18 04813 g011
Figure 12. Variation pattern of the measured temperatures for the upstream shield, under no-load excitation conditions: (a) at the level of the shield; (b) at a distance of 1 m from the upstream shield.
Energies 18 04813 g012
Figure 13. Variation pattern of the measured temperatures for the downstream shield, under no-load excitation conditions: (a) at the level of the shield; (b) at a distance of 1 m from the downstream shield.
Energies 18 04813 g013
Figure 14. Variation in the water temperature at the outlet of the cooler units during generator operation in short-circuit.
Energies 18 04813 g014
Figure 15. Variation pattern of the cooling agent’s temperature during generator operation in short-circuit conditions: (a) air at the entrance of the cooler units; (b) air at the exit of the cooler units.
Energies 18 04813 g015
Figure 16. Variation in the generator winding temperatures in short-circuit mode.
Energies 18 04813 g016
Figure 17. Variation module of the magnetic core temperatures of the generator under short-circuit conditions.
Energies 18 04813 g017
Figure 18. Variation in measured temperatures for the upstream shield under short-circuit conditions: (a) at the shield level; (b) at a distance of 1 m from the upstream shield.
Energies 18 04813 g018
Figure 19. Variation in measured temperatures for the downstream shield under short-circuit conditions: (a) at the shield level; (b) at a distance of 1 m from the downstream shield.
Energies 18 04813 g019
Table 1. Values of losses during no-load unexcited operation based on flow rate and water temperatures through each cooling unit.
Cooling Unit NumberWater Flow Rate [L/min]Water Temperature [°C]Losses
P1i0 [kW]
Ti0AcTi0ArΔTi0
123024.423.80.69.576
220024.623.80.811.103
319024.623.80.810.548
421524.323.80.57.460
520024.623.80.811.103
Total losses P10 [kW]49.788
Table 2. Values of losses during operation in no-load excited condition based on flow rate and water temperatures through each cooler unit.
Cooling Unit NumberWater Flow Rate [L/min]Water Temperature [°C]Losses
P1i0e [kW]
Ti0AceTi0AreΔTi0e
122523.621.91.726.542
220023.821.91.926.369
318523.921.92.025.675
421523.721.91.826.854
520023.821.91.926.369
Total losses P10e [kW]131.809
Table 3. Values of losses during short-circuit operation based on flow rates and water temperatures through each cooler unit.
Cooler Unit NumberWater Flow Rate
[L/min]
Water Temperature [°C]Losses
P1isc [kW]
TiAcscTiArscΔTisc
123026.524.32.235.112
220026.824.32.534.696
319026.924.32.634.279
421526.924.32.638.790
521026.924.32.637.888
Total losses P1sc [kW]180.764
Table 4. Values of the generator’s quantities at cosφ = 0.975.
QuantityU.M.0.25·Pn0.5·Pn0.75·PnPn1.1·Pn
Apparent powerkVA3332.566659997.513,33014663
Active powerkW3249.196498.389747.5612,996.7514,296.43
Stator voltageV63006300630063006300
Stator currentA305.4610.8916.21221.61343.76
Excitation currentA224243274288315
Mechanical losseskW73.2673.2673.2673.2673.26
Iron losseskW56.59156.59156.59156.59156.591
Stator copper losseskW5.37221.48948.35185.957104.008
Rotor copper losseskW42.33949.82663.34969.98899.225
Additional lossesKW1.0554.2209.49616.88320.427
Total losseskW178.617205.386251.047302.679353.511
Efficiency%94.78996.93697.48997.72497.586
Table 5. Manufacturer-guaranteed values vs. values obtained through research.
QuantityU.M.Values
GuaranteedEvaluated
Mechanical losseskW6573.26
Iron losseskW65.2556.591
Stator copper losseskW98.8985.957
Rotor copper losseskW81.4969.988
Additional lossesKW11.30316.833
Total losseskW321.946302.676
Efficiency%97.5897.724
Disclaimer/Publisher’s Note: The statements, opinions and data contained in all publications are solely those of the individual author(s) and contributor(s) and not of MDPI and/or the editor(s). MDPI and/or the editor(s) disclaim responsibility for any injury to people or property resulting from any ideas, methods, instructions or products referred to in the content.