Article

Further Development of an OpenFOAM LT-PEMFC Toolbox and Its Validation on an Automotive Fuel Cell Design

Zentrum für Sonnenenergie- und Wasserstoff-Forschung Baden Württemberg (ZSW), Lise-Meitner-Straße 24, 89081 Ulm, Germany
*
Author to whom correspondence should be addressed.
Current address: Forschungszentrum Allgäu (FZA), Hochschule für Angewandte Wissenschaften Kempten, Bahnhofstr. 61, 87435 Kempten, Germany.
Energies 2025, 18(18), 4793; https://doi.org/10.3390/en18184793
Submission received: 28 May 2025 / Revised: 25 July 2025 / Accepted: 18 August 2025 / Published: 9 September 2025
(This article belongs to the Special Issue Hydrogen Production and Utilization: Challenges and Opportunities)

Abstract

Over the past two decades, several add-on modules for computational fluid dynamics (CFD) software focusing on modelling electrochemical processes and two-phase effects within fuel cells have been described in the literature. Most of these models are based on custom-written code that is not openly accessible to everyone. Furthermore, several commercial CFD codes offer specific modules for modelling fuel cells. Here, code modification is difficult to achieve. This work analyses and further develops the PEMFC toolbox of Kone et al. for use in OpenFOAM to simulate low temperature (LT-)PEM fuel cells. This model is freely available under the GNU GPLv3 licence. The present work focuses on enhanced physical and electrochemical modelling and improved user-friendliness. The major improvements compared to the original toolbox will be detailed in the article, together with the first results obtained. The improved PEMFC toolbox is validated using experimental data from an automotive fuel cell stack design. Furthermore, these results are compared to the original Kone model, and a commercially available CFD model. The improved toolbox reproduces both the experimentally measured polarisation curve and the current density distribution quite accurately, producing results that are fairly comparable to the more sophisticated commercial model.

1. Introduction

Polymer electrolyte membrane fuel cells (PEMFCs) play an important role in the transition to climate-neutral mobility, especially for heavy-duty applications. In an electrochemical process, the gaseous fuel hydrogen on the anode side and oxygen on the cathode side react to form water, generating electric energy. The main components of a fuel cell stack are bipolar plates (BPP), usually made of metal or graphite composite, the gas diffusion layer (GDL), and the catalyst-coated membrane (CCM). The GDL consists of the substrate and microporous layer (MPL). The GDL ensures a good oxygen supply from the channel to the reaction layer and helps to remove liquid water. To manufacture the CCM, a proton exchange membrane (PEM) is coated on both sides with a catalyst layer (CL). The reactions take place at the so-called three-phase boundary of reactant gases, where an ion-conducting phase and a catalyst particle are connected to an electron-conducting phase.
Computational fluid dynamic (CFD) methods describing fluid flows, sources, and sinks have become standard tools in the design phase of fuel cell bipolar plates, cf. [1,2], which serve to provide a homogeneous distribution of reactant gases and coolant fluid. Design variations for optimisation can be performed in a relatively short time, contributing to a reduction in the overall development costs. More sophisticated models that allow electrochemical processes within PEMFCs to be described are well-documented in the literature [3,4,5,6,7,8,9,10,11,12,13,14,15,16,17,18,19,20,21,22,23,24,25,26,27,28,29,30,31,32,33,34,35,36,37,38,39,40,41,42,43,44,45,46,47,48]. Such advanced tools can lead to a deeper understanding of fundamental processes within a fuel cell. Typical tasks for these kinds of models include simulating the current density distribution, membrane humidification, and detailed and realistic reactant concentration distributions, including possible locations of starvation and liquid water accumulation. The differences between such detailed 3D PEMFC models for use within CFD software predominantly consist of the modelling depth, e.g., the consideration of liquid water transport phenomena, modelling electrochemical reactions and the membrane, the type of basic CFD software used (open-source or commercial), and whether the model is freely available. One of the first CFD models employing a Tafel-like equation for calculating local current density effects was published by Dutta et al. [3,4] in 2000, using ANSYS® Fluent (version 4.48). Generally, theoretical models that describe the relevant chemistry and physics resemble the equations used in more recent models, including the present one. Nevertheless, the underlying CFD codes are not open source, and numerical stability sometimes hampers practical applications. Readers interested in the historical development of such models are referred to the review of Weber and Newman [5]. In their review, Kone et al. provided a brief overview of the pioneering and more recently published CFD models, focusing on 3D multiphase flow [6]. Of course, more extensive and very recent reviews covering such models can be found in the relevant literature, e.g., the review article of Jahnke et al. [7]. Some of the relevant publications are summarised below and supplemented by the latest publications. Berning et al. [8,9] describe a 3D multiphase and multicomponent model for the commercial CFD code CFX (version 4.3, 2002) [10]. This model is implemented using a set of custom-written user subroutines and accounts for a fully three-dimensional transport mechanism on the anode and cathode sides, as well as a two-phase model that includes phase change. As the model was developed using custom-written user subroutines, it is not available free of charge. Other improved models have been developed for the commercial software ANSYS® Fluent [11], as evidenced in the work of Schwarzet al. [12,13,14] (based on [15]) and Wang et al. (2006, Fluent version 6.0.12) [16], although these are not yet generally practically usable, because the custom-written code has not been published, e.g., on GitHub. The authors focused on different topics. Schwarz et al. described an improved PEMFC model by implementing a multiple thin-film agglomerate model. This enabled transport mechanisms (diffusion, liquid water, and ionomer) to move through the pore structure of the CL to be modelled. Wang et al. adapted the former models of Wang and co-workers [17,18,19] to include non-isothermal effects. With these additions, their model now captured the interactions between two-phase flow and thermal transport. Mazumder and Cole described a 3D mathematical model of PEM fuel cells for the commercial CFD code CFD-ACE+ [20,21]. They considered the effect of liquid water on cell performance. They also explained the challenges involved in modelling two-phase effects within fuel cells. However, this CFD software appears to be discontinued; the latest release was published in 2022 by the ESI Group [22].
In addition to custom-written user subroutines, most commercial CFD code now offers manufacturer-provided add-on modules for modelling fluid mechanical and electrochemical processes within PEM fuel cells. These models can be directly used (via software licensing) without the need for additional custom-written code. Scholz et al. [23,24] developed the most recent version of the PEMFC add-on module for ANSYS® Fluent. This model enabled a non-isothermal three-dimensional modelling of most of the relevant processes, such as the Butler–Volmer equations, the Springer-based membrane model [25], and liquid water effects. Windarto and Lim recently published one of the latest articles on the Fluent PEMFC module, in which they conducted a validation using experimental data. A similarly extensive PEMFC model is available in the software AVL FIRETM [27,28,29,30] (versions: n/a, FIRE® v2014, FIRETM M 2020 R1, FIRETM M 2023 R2). Regarding performance and steady-state modelling, it provides functionality that is fairly comparable to the Fluent model and, in some aspects, even slightly more extensive. However, the AVL FIRETM model has undergone significant development in recent years, incorporating the most relevant degradation effects of PEM fuel cells. These include chemical degradation models for ionomer degradation, carbon corrosion, platinum dissolution, particle detachment and agglomeration, and particle size redistribution. This significantly enhances the value to the model. D’ Adamo et al. [31,32] present a numerical model and the associated simulation results, which were obtained using the Siemens Simcenter STAR-CCM+ software (version 2020.2) [33]. In this model, the electrochemical reaction is modelled at the interface between the electrode and the membrane. The Springel model for the membrane is included, as are multi-phase and non-isothermal effects. Another widely used model in the field of PEM fuel cells is the Fuel Cell and Electrolyzer Module of the versatile COMSOL Multiphysics® [34] simulation environment. Several validation studies have been conducted for this model, e.g., the work of Mohanty et al. [35] (version 5.4) or Mojica et al. [36], which demonstrated good agreement.
The main disadvantages of these commercial tools are the high licensing costs and the lack of unrestricted user-defined code modification. Open-source CFD codes, such as OpenFOAM [37,38], offer advantages in this respect. The source code is completely accessible under the GNU General Public Licence [37]. An additional plus is the high degree of parallelisation, which is independent of available parallel processor licences. Several toolboxes and models have been published for modelling fuel cells in OpenFOAM. One of the most well-known models is the openFuelCell project [39,40,41] for modelling solid oxide fuel cells (SOFC). This model has been adapted to high-temperature PEMFC [42] and later to low-temperature PEMFC, published 2023 by Weber et al., for use with OpenFOAM® v2112 [43]. The model of Weber et al. describes the electrochemistry by an activation overpotential using a two-dimensional Tafel equation, which is applied only to the cathode side. Liquid water transport in porous media is also considered. The authors of the present paper conducted some simulation tests on this model to evaluate its usability. Unfortunately, the model showed inconsistencies in the mass balance; so, it was not analysed further. In 2023, an improved version of the openFuelCell project was published as openFuelCell2 [44,45]. This toolbox was developed to simulate electrochemical devices, such as fuel cells and electrolysis cells. The electrochemical modelling is more advanced than the model by Weber et al. It involves modelling the electronic and proton transport through the relevant parts of the fuel cell. Furthermore, the well-known Springer model is employed to describe water transport through the membrane, while liquid water transport is modelled in porous structures and gas channels. However, the model does not explicitly include a coolant flow field, which directly impacts the thermal management of the fuel cell. An extension of the PEM fuel cell model of openFuelCell2 is described by Bulgarini et al. [46]. Their implementation takes into account the reduction in catalytic activity due to platinum oxide (PtOx) formation.
Another toolbox for modelling low-temperature PEMFC in OpenFOAM is the work of Kone et al. [47], published in 2018 for use with OpenFOAM-4.x. This model is also based on the original openFuelCell project. It enables 3D modelling of the fluid (single-phase) and thermal processes of a fuel cell, while the electrochemical reaction is described in 2D. Kone et al. have also published an advanced toolbox that considers liquid water transport [48]. Compared with the OpenFuellCell2 model, the electrochemical model by Kone et al. is simpler, as it does not explicitly consider the water transport through the membrane. Thus, each of the aforementioned OpenFOAM models has its respective advantages. However, in their present state, none of them completely fulfill the requirements for modelling the relevant physics and chemical reactions of fuel cells and managing numerical stability.
In the following, the new OpenFOAM ZSW PEMFC toolbox developed starting from the Kone model [47] is presented in detail and compared to the original model. Furthermore, it is validated against experimental performance data obtained using a short stack featuring a design relevant for automotive applications. Additionally, the results are compared to data obtained for the same cell employing the commercial CFD software ANSYS® Fluent. The Fluent PEMFC module was used as a second simulation model for comparison, as it is a widely used CFD tool in academia and industry. The authors are fully aware that it is just one among several commercially available up-to-date CFD fuel cell models. It was chosen because the authors have it available and are familiar with it. Furthermore, a good database of reference data is accessible to the authors, which could be employed for the study. This does not express a preference for this model over any of the other commercially available models.

2. Materials and Methods

This chapter presents the OpenFOAM PEMFC model of Kone et al. and explains the improvements implemented in the framework of the present study. Finally, a comparison is made between the two models and the commercial ANSYS® Fluent model.

2.1. Original Toolbox of Kone et al.

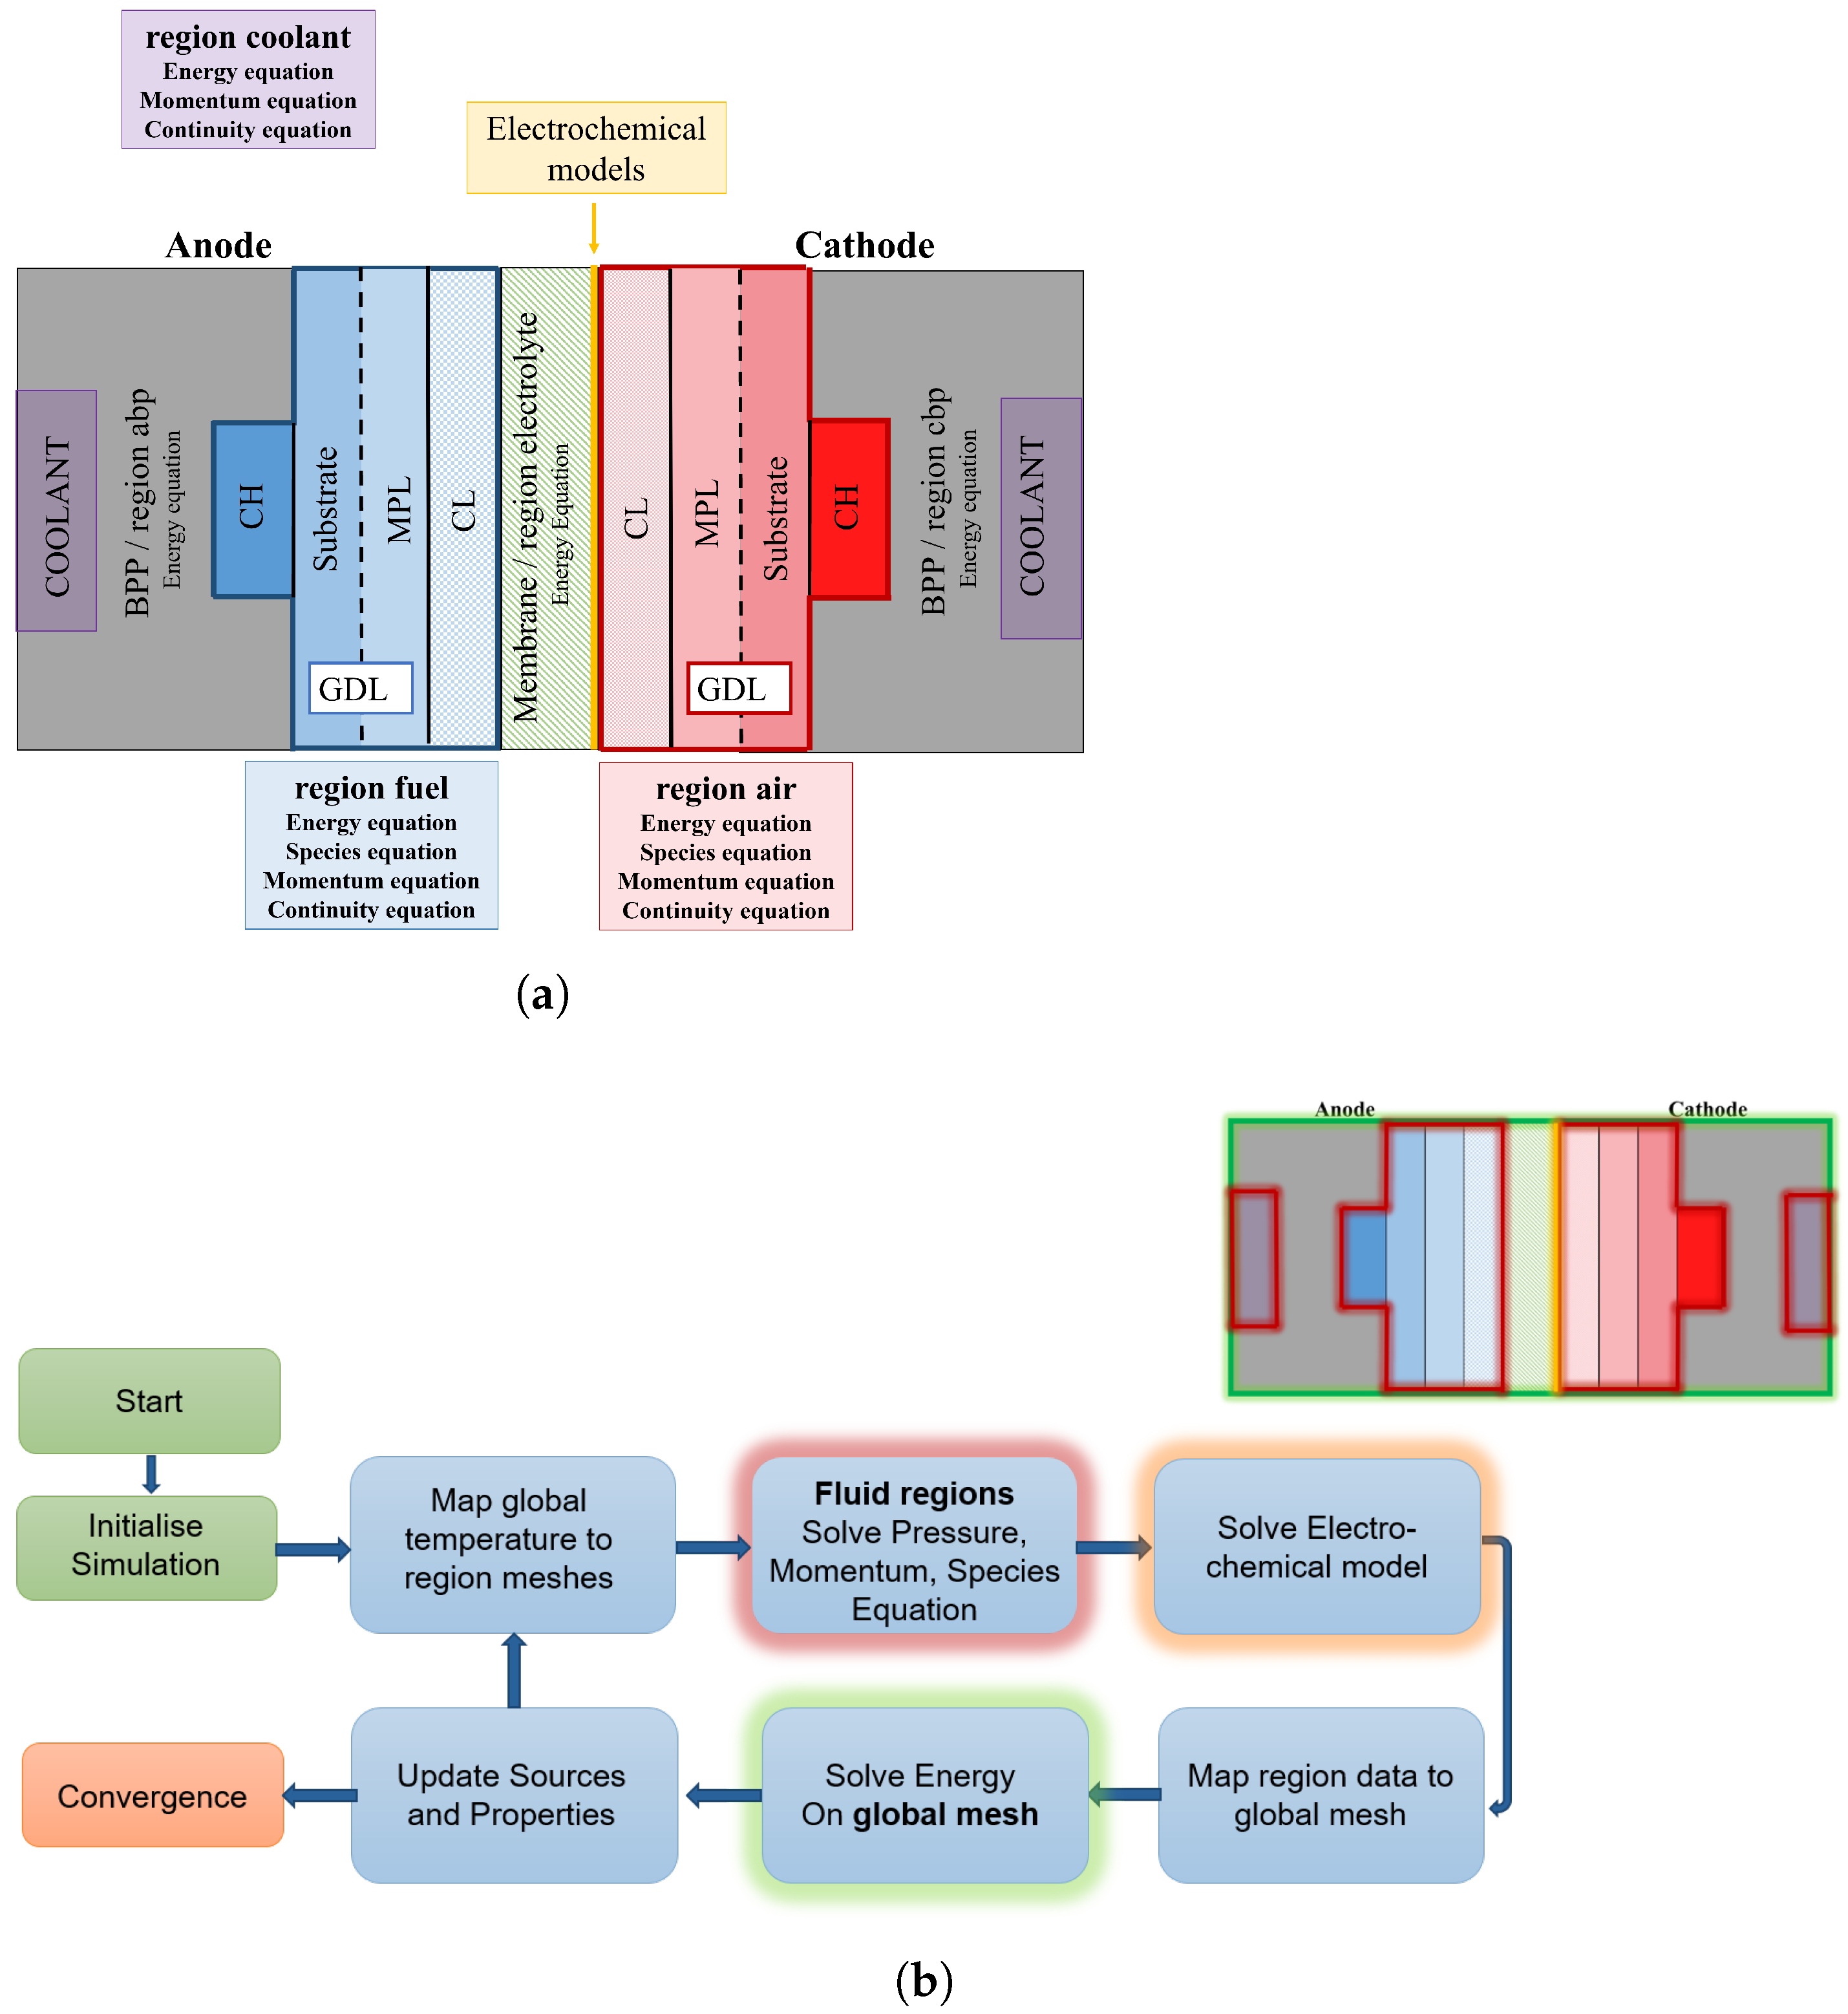
The basic structure and the simulation procedure of the toolbox described in this work are adapted from the model of Kone et al. [47]. This model considers the three-dimensional thermal and gas transport processes within the BPP, GDL, CL, and membrane. The electrochemical processes are modelled in 2D and are localised at the interface between the cathode CL and the membrane. The coolant flow field is not explicitly considered in the original model. The model uses the multi-region approach of OpenFOAM, as well as a so-called parent–child mesh approach. This involves preparing a global mesh containing all parts of the simulation model, in which the energy equation (Equation (5)) is calculated. The global mesh is additionally split into separate child meshes for the cathode fluid zones (region air: flow field, GDL, CL), the anode fluid zones (region fuel: flow field, GDL, CL), the bipolar plates (region abp and cbp), and the membrane (region electrolyte). In Figure 1a, the defined regions and child meshes, respectively, are illustrated. In the fluid regions, air and fuel, the continuity (Equation (1)), momentum (Equation (2)) and species equations y i (Equations (3), and (4)) are solved. These equations are standard formulations commonly employed in CFD code. Thus, commonly used symbols are used in all the formulas below. For clarity, all symbols are explained in the nomenclature list at the end of the article.
· ρ U = S m
· ρ U U = p + · μ U + S M
· ρ U y i = · ρ D y i + S i
y n = 1 i = 1 n 1 y i
· ρ c p U T = · k T + S E
The electrochemical quantities modelled at the interface between the cathode CL and the membrane are assigned to the electrolyte region. The following assumptions are made in the electrochemical modelling:
  • Steady-state operating conditions;
  • Gas flow: laminar and incompressible and ideal gas;
  • Fuel cell components: all isotropic and homogeneous;
  • Membrane: fully humidified and impermeable to reactant gases and water;
  • Anode: the electrochemistry, i.e., activation overpotential and mass transport losses are neglected;
  • Ohmic heating is neglected.
The current density i is calculated using a root finding method (Ridders’ method [49]) based on the cell voltage equation (Equation (6)). This method requires two bound endpoints featuring opposite signs for the values of the respective function. For the lower endpoint, a current density of 1 A/m2 is set (the resulting cell voltage is certainly > 0). The upper endpoint is defined as the limiting current density according to Equation (9) (reliably resulting in a cell voltage < 0 in the model). Of course, the experimentally determined limiting current density is typically measured at positive cell potentials, e.g., in a range between 300 and 50 mV [50,51]. Therefore, the definition of the limiting current density given by Equation (9) should be perceived as model-internal only. It should be considered as a useful endpoint for the Ridders’ method rather than as a physical term. For determining the cell voltage, the model considers activation, ohmic, and mass transport losses. This section describes the main electrochemical models that are no longer used in the present work. All other model equations are described in Table 1. In the Kone model, activation losses η a c t are modelled on the cathode side using the Tafel equation (Equation (7)). The ohmic overpotential η o h m is calculated using an ohmic resistance R o h m (see Table 1). The mass transport resistance is described by a concentration overpotential η c o n (Equation (8)), which depends on a user-defined constant c and the limiting current density i L (Equation (9), [52]).
V c e l l = E N e r n s t η a c t η o h m η c o n
η a c t = R T α z F ln i i 0
η c o n = c ln i L i L i
i L = z · F · D O 2 · y O 2 · ρ M W O 2 · δ d i f f
The general simulation procedure of the toolbox is described in Figure 1b. After initialisation, the simulation loop of the conservation equations (Equations (1)–(5)) and the electrochemical model as sketched is performed until convergence is achieved.

2.2. Modification of the Original Toolbox

Some inconsistencies were detected when the simulation results of the Kone solver version 1 published in May 2018 (downloaded from https://unnc.digitalcommonsdata.com/datasets/3gz7pxznzn/1, accessed on 13 November 2020) were analysed. To obtain meaningful results, some corrections are required, which will be described below. Due to the incorrect implementation of the Darcy–Forchheimer equation (see Table 1) for modelling gas flow in porous media (GDL, CL), the flow is not influenced by the porous structure. Consequently, the mass fraction y i , respectively, the mole fraction x i in the catalyst layer are overestimated in the simulation, which significantly affects the current density distribution.
A second problem relates to the gas mixture on the anode side (region: fuel). The original code is only useful for a gas mixture of the two components hydrogen and water vapour, because the anode humidity is calculated based on the mole fraction of the inert species ( y i equation is not solved, Equation (4) is valid) defined for the mixture. However, due to hydrogen recirculation, in reality, nitrogen is present in the fuel gas mixture when automotive fuel cell systems are operating. This is also reflected in the most recent sets of automotive test bench stack operating conditions, which are intended to more closely reflect reality. Since the anode gas now may comprise more than one non-reacting gases, two y i equations (Equation (3)) must be solved, and it can no longer be assumed that the water mass fraction is used for the closing condition (Equation (4)). Thus, when nitrogen is considered in the anode gas mixture in the original model and defined as an inert species, the nitrogen mole fraction may be mistakenly used to calculate the humidity. Small corrections to the electrochemical models were required to address this issue.
Moreover, the formulation of the limiting current density i L (see Table 1) is employed incorrectly in the original toolbox. As the diffusion length, the thickness of the GDL is used ( δ d i f f = δ G D L ), whereby the oxygen concentration ( y O 2 ) relates to the interface of the cathode CL to the membrane. Consequently, the diffusion resistance of the GDL is considered twice, resulting in an overly low limiting current. Therefore, the concentration losses, which are modelled by the overpotential η c o n (Equation (8)), are overestimated. To obtain physically reasonable results, the thickness of the cathode catalyst layer δ C L , C is used as the diffusion length ( δ d i f f = δ C L , C ). Additionally, this flaw in the calculation of the limiting current density may lead to instability in the Ridders’ root finding method. Due to the low i L , in some cases, the bound endpoints do not correspond to different signs of the cell potential, causing the Ridders’ method to fail. See also the discussion in Section 2.1 above concerning the use of the limiting current i L . The intermediate state of the model resulting from the aforementioned corrections is used for model comparison in Section 3.2.

2.3. Further Development of the PEMFC Toolbox

At the outset of further developing the PEMFC toolbox, the model was adapted to a newer version of OpenFOAM (OpenFOAM-7.x, 2019). To improve the accuracy of the thermal transport, the coolant flow field is now explicitly implemented as an additional fluid region. The continuity and momentum equations are solved in this region. Furthermore, the GDL is divided into two parts: the substrate and the MPL. This enables the different material properties of these layers to be considered. A schematic description of the final model is shown in Figure 1a. The regions of the parent–child approach (regions: coolant, air, fuel, abp, cbp, electrolyte) are also illustrated there.
Several adaptations are made to the electrochemical model to improve the accuracy. An overview of the formulation can be found in Table 1. Still, the current density is calculated using the Ridders’ method based on cell voltage Equation (10). Compared to the original Kone model, in addition to the the cathode side ( η a c t , C ), the activation losses on the anode side ( η a c t , A ) are considered. On both sides, a hyperbolic sine approximation of the Butler–Volmer equation (basic formulation: Equation (11)) is used. This approximation is valid when the anodic and cathodic transfer coefficients are equal ( α a = α c ). Mass transport losses are no longer defined by the concentration overpotential η c o n . Instead, the influence of the reactant concentration on the cell performance is modelled directly within the Butler–Volmer equation using the concentration dependence ( C / C r e f ) of the exchange current density. The reference concentration C r e f is directly related to the reference exchange current density i 0 r e f .
In the energy equation, the volumetric source term that describes the waste heat due to the reaction is defined within the electrolyte region. To obtain a volumetric term, the 2D current density must be divided by the membrane thickness. In the original Kone toolbox, the current density is divided by the total thickness of the anode and cathode GDL, plus the thickness of the CCM. Consequently, the source term is too low and does not accurately reflect the actual effects.
V c e l l = E N e r n s t η a c t , C η a c t , A η o h m
i = i 0 · C C C r e f , C γ · e α a z F R T η e α c z F R T η
Another model adjustment relates to the hydrogen crossover. In a real PEM fuel cell, a small amount of hydrogen inevitably diffuses through the membrane from the anode to the cathode, where it reacts directly with oxygen. In this case, no usable current is produced. This effect can be described by an internal current or rather leakage current i L e a k . This leakage current is mainly responsible for the cell voltage at open circuit being lower than the Nernst potential E N e r n s t . In the electrochemical model, this leakage current is implemented in the activation overpotential η a c t , C of the cathode side.
As described in Section 2.1, the Kone toolbox assumes a fully humidified membrane. Under normal operating conditions, this assumption may frequently not hold true. In particular, the dry inflow gases desiccate the membrane at the gas inlets. Therefore, a very simplified model is implemented for the membrane water content λ , which is still more realistic. In the Springer equation (see Table 1) for calculating the water content as water activity a, the average of the relative humidity values of the anode and cathode sides is employed (see Table 1).
In addition to the modifications concerning electrochemical and thermal processes, several additional code implementations improve the user-friendliness of the toolbox. The two standard OpenFOAM utilities, fvOptions and postProcessing, are added. Among other things, users now can specify fixed values in fvOptions. This option is particularly helpful when simulating the full cell area of an application-relevant fuel cell design, as it supports convergence. The postProcessing functionality allows users to observe simulation variables during the simulation progress. Additionally, post-processing of results is possible without running the solver.
This final OpenFOAM ZSW PEMFC toolbox is used for the simulations described in the next Section 3. A breakdown of the comparison of the original Kone model and the ZSW PEMFC toolbox is shown in Table 2. This table also includes a comparison with the PEMFC module of the commercial CFD code ANSYS® Fluent. Compared to this commercial model, the model described here is still somewhat simpler. In the Fluent implementation, the explicit 3D modelling of electron and proton transport, as well as the realisation of the water transport mechanism over the membrane via conservation equations, notably increase the accuracy. The detailed formulation of the Fluent model is not described here. It is documented in [23] and in the ANSYS® Fluent Theory Guide [24]. Nevertheless, to evaluate the performance of the OpenFOAM PEMFC toolbox, a comparison of the simulation results obtained using the new model to the results obtained employing Fluent will be presented below.
Table 1. Summary of the equations that describe the electrochemical models in the OpenFOAM PEMFC toolbox.
DescriptionExpression
Darcy–Forcheimer equation [53] S M = μ K U + 1 2 ρ F i j U 2
Binary diffusion coefficient [54] D i j = 10 4 · 10 3 · T 1.75 1 M W i + 1 M W j p V i 1 / 3 + V j 1 / 3 2
Diffusion coefficient mixture [55] D i m i x = 1 x i j i x j D i j
Effective diffusion coefficient [56] D i e f f = 1 1 ϵ τ D i m i x + 1 ϵ τ D i K n u d
Knudsen diffusion [57] D i K n u d = 97 · d P 2 T M W i 1 / 2  
Species mass flux reaction [52] m ˙ R e a c t a n d , i = ± M W i · i z F  
Source term energy equation [41,47] S E = i δ M e m η T Δ S 0 z F
Standard cell potential [58] E 0 = Δ G 0 z F = Δ H 0 T Δ S 0 z F
Nernst potential [41] E N e r n s t = E 0 + R T z F ln Q
Reaction coefficient [41] Q = x i , E d u c t υ i x i , P r o d u c t υ i
Cathode activation overpotential [23,58,59] η a c t , C = R T z α F sinh 1 i + i L e a k 2 · i 0 , C · C C C r e f , C γ
Anode activation overpotential [23,59] η a c t , A = R T z α F sinh 1 i 2 · i 0 , A · C A C r e f , A γ
Exchange current density [60] i 0 = i 0 r e f exp E a c t R 1 T 1 T r e f
Molar concentration C = y i ρ M W i
Ohmic overpotential [52] η o h m = R o h m · i
Ohmic resistance R o h m = 1 σ i · δ M e m + 2 · δ S u b 1 ϵ S u b σ S u b + 2 · δ M P L 1 ϵ M P L σ M P L + 2 · δ C L 1 ϵ C L σ C L + 2 · δ B P P 1 σ B P P + R C
Ionic conductivity [25] σ i = 0.5139 λ 0.326 exp 1268 · 1 303 1 T
Membrane water content [25] λ = 0.043 + 17.18 a 39.85 a 2 + 36 a 3 0 < a < 1 14 + 1.4 a 1 1 a 3
Water activity [25] a = 0.5 · x H 2 O , A · p A p s a t , A + x H 2 O , C · p C p s a t , C
Saturation pressure [25] log 10 ( p S a t / 101325 ) = 2.1794 + 0.02953 T 273.15 9.1837 e 5 T 273.15 2 + 1.4454 e 7 T 273.15 3
Table 2. Comparison of the original and final versions of the PEMFC toolbox and the commercial PEMFC module in ANSYS® Fluent.
ANSYS® FluentToolbox of Kone et al. [47]Final Toolbox
Transport equation electric and protonic potential3D2D simplified, η o h m approach2D simplified, η o h m approach
Membrane model3D transport equation (e-Drag, Diffusion)fully humidified 2Dexplicit balance of relative humidity 2D
Liquid phase modelsimplified saturation approach--
Electrochemical modellingButler–Volmer approachonly Cathode, TafelButler–Volmer (sinh)
Hydrogen crossoverx-x
Anisotropic material parametersx--
Explicit heat transport by coolant channelx-x

2.4. Experiments

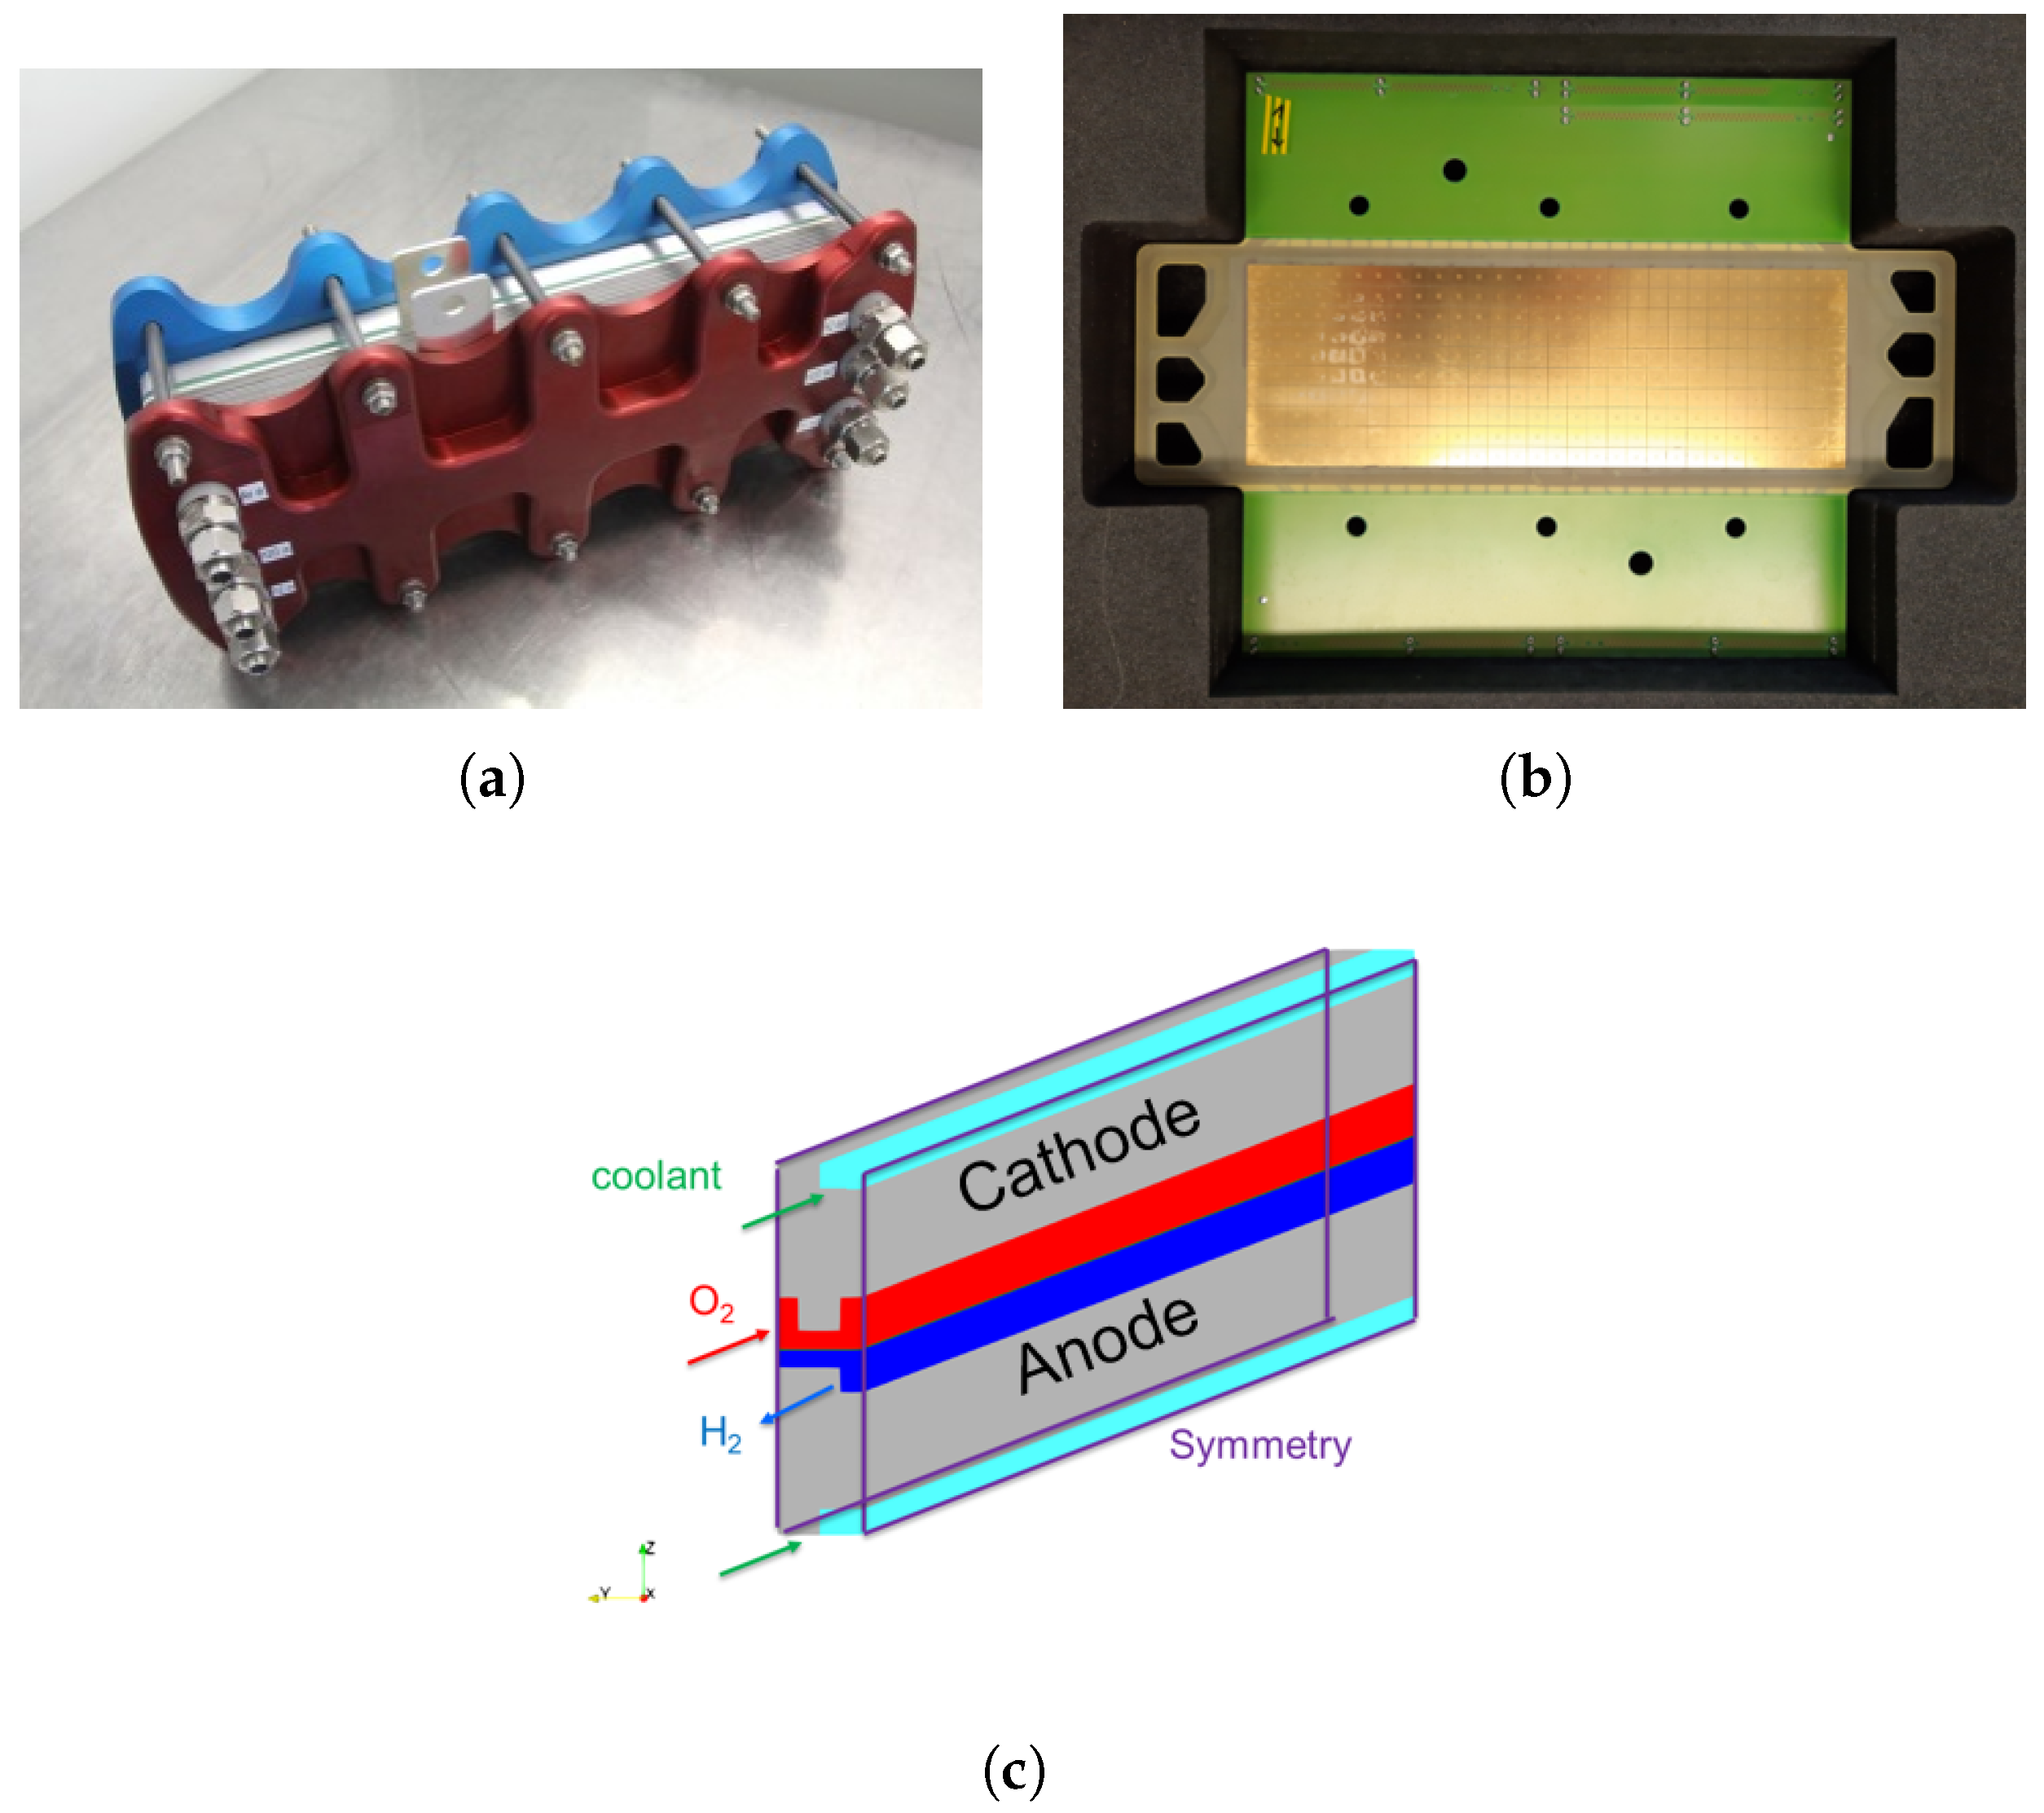
For the model validation of the improved OpenFOAM PEMFC toolbox, the 300 cm2 active area automotive fuel cell stack design developed at the Zentrum für Sonnenenergie- und Wasserstoff-Forschung Baden Württemberg (ZSW) is used. The graphite composite bipolar plates of this design feature a parallel flow field comprising 50 anode and 100 cathode straight channels. A Freudenberg H23C9 GDL and a commercial CCM with platinum loading of 0.1 mgPt/cm2 on the anode and 0.4 mgPt/cm2 on the cathode is used. The experimental setup consists of a 5-cell short stack, which has a device for locally resolved current density measurement (provided by the company S++, Murnau, Germany) included, cf. Figure 2a,b. The measurement device provides a resolution of 300 (30 × 10) segments for the current density and 150 (15 × 10) segments for the temperature. It is positioned between cells 3 and 4. A detailed description of the experimental setup can be found in Koprek et al. [61]. Koprek et al. present an accelerated durability test (ADT) and several in situ and ex situ results at the beginning of test (BOT) and end of test (EOT). Here, the BOT results of Koprek et al. are employed to validate the OpenFOAM PEMFC toolbox; the EOT and degradation-relevant data are not used. The experimental data (BOT) can be retrieved from the Zenodo platform [62]. In the stack test, the cathode and anode sides are operated in counter-flow configuration. The coolant follows the flow direction of the cathode gas. The operating conditions, summarised in Table 3, are based on typical automotive conditions. On the anode side, a gas mixture of 70% H2 and 30% N2 is used to simulate real operation, in which N2 accumulation due to H2 recirculation occurs. Specifically, the current–voltage (U-I) characteristic curve (polarisation curve) measured at the beginning of the test (BOT) and the current density and temperature data of the S++ device obtained from the work of Koprek et al. are used to validate the model. The polarisation curve was measured both upward, i.e., starting at the lowest current density, and downward, i.e., beginning at the highest current density. The slight difference between these two curves is due to the inherently different initial conditions for both curves, respectively. Specifically, a different initial membrane humidity can be assumed. This effect is clearly related to the dwell times applied in the experiment. On the test bench, the U-I curves are measured at a specific time resolution. Average values of cell voltage over time are calculated once a stable state is reached. Simultaneously, current density and temperature distributions are recorded by the S++ device. For each segment of the device, time-resolved data (every second) are obtained for current (300 segments) and temperature (150 segments). To evaluate the data, time-averaged values are calculated for each segment in an analogous way to the cell voltage values. The current data for each segment are divided by the segment area to obtain the current density distribution.

2.5. Single-Channel Simulation Model

A single-channel model of this design is prepared for the simulations (see Figure 2c). This model represents the repeating unit of the straight channels in the active area. It has dimensions of 1 mm in width and 300 mm in length. It consists of two half cathode channels and one half anode channel. Symmetry boundary conditions are defined at the borders. The material properties of the Freudenberg H23C9 according to Table 4 are employed. Unfortunately, except for the platinum loading, no data are available from the manufacturer for the CCM. Therefore, the parameters from the literature and empirical values are used. The exchange current density i 0 is used as a fitting parameter to obtain the experimentally measured cell voltage at a given current density of 0.1 A/cm2. Due to the differing levels of model complexity between the ZSW PEMFC toolbox, the original Kone toolbox, and the Fluent PEMFC module, some parameters differ slightly between the models. A summary of the used parameters can be found in Table 4 and Table 5. In both OpenFOAM PEMFC models, homogeneous and isotropic materials are assumed. Therefore, for these models, the through-plane (TP) material properties are always used for the isotropic material parameters. For the Fluent simulations, anisotropic GDL properties are employed, cf. Table 4. For the graphite composite bipolar plates, a thermal conductivity of 20 W/m/K and an electric conductivity of 2000 S/m are assumed.

3. Results and Discussion

3.1. Grid Independence Study

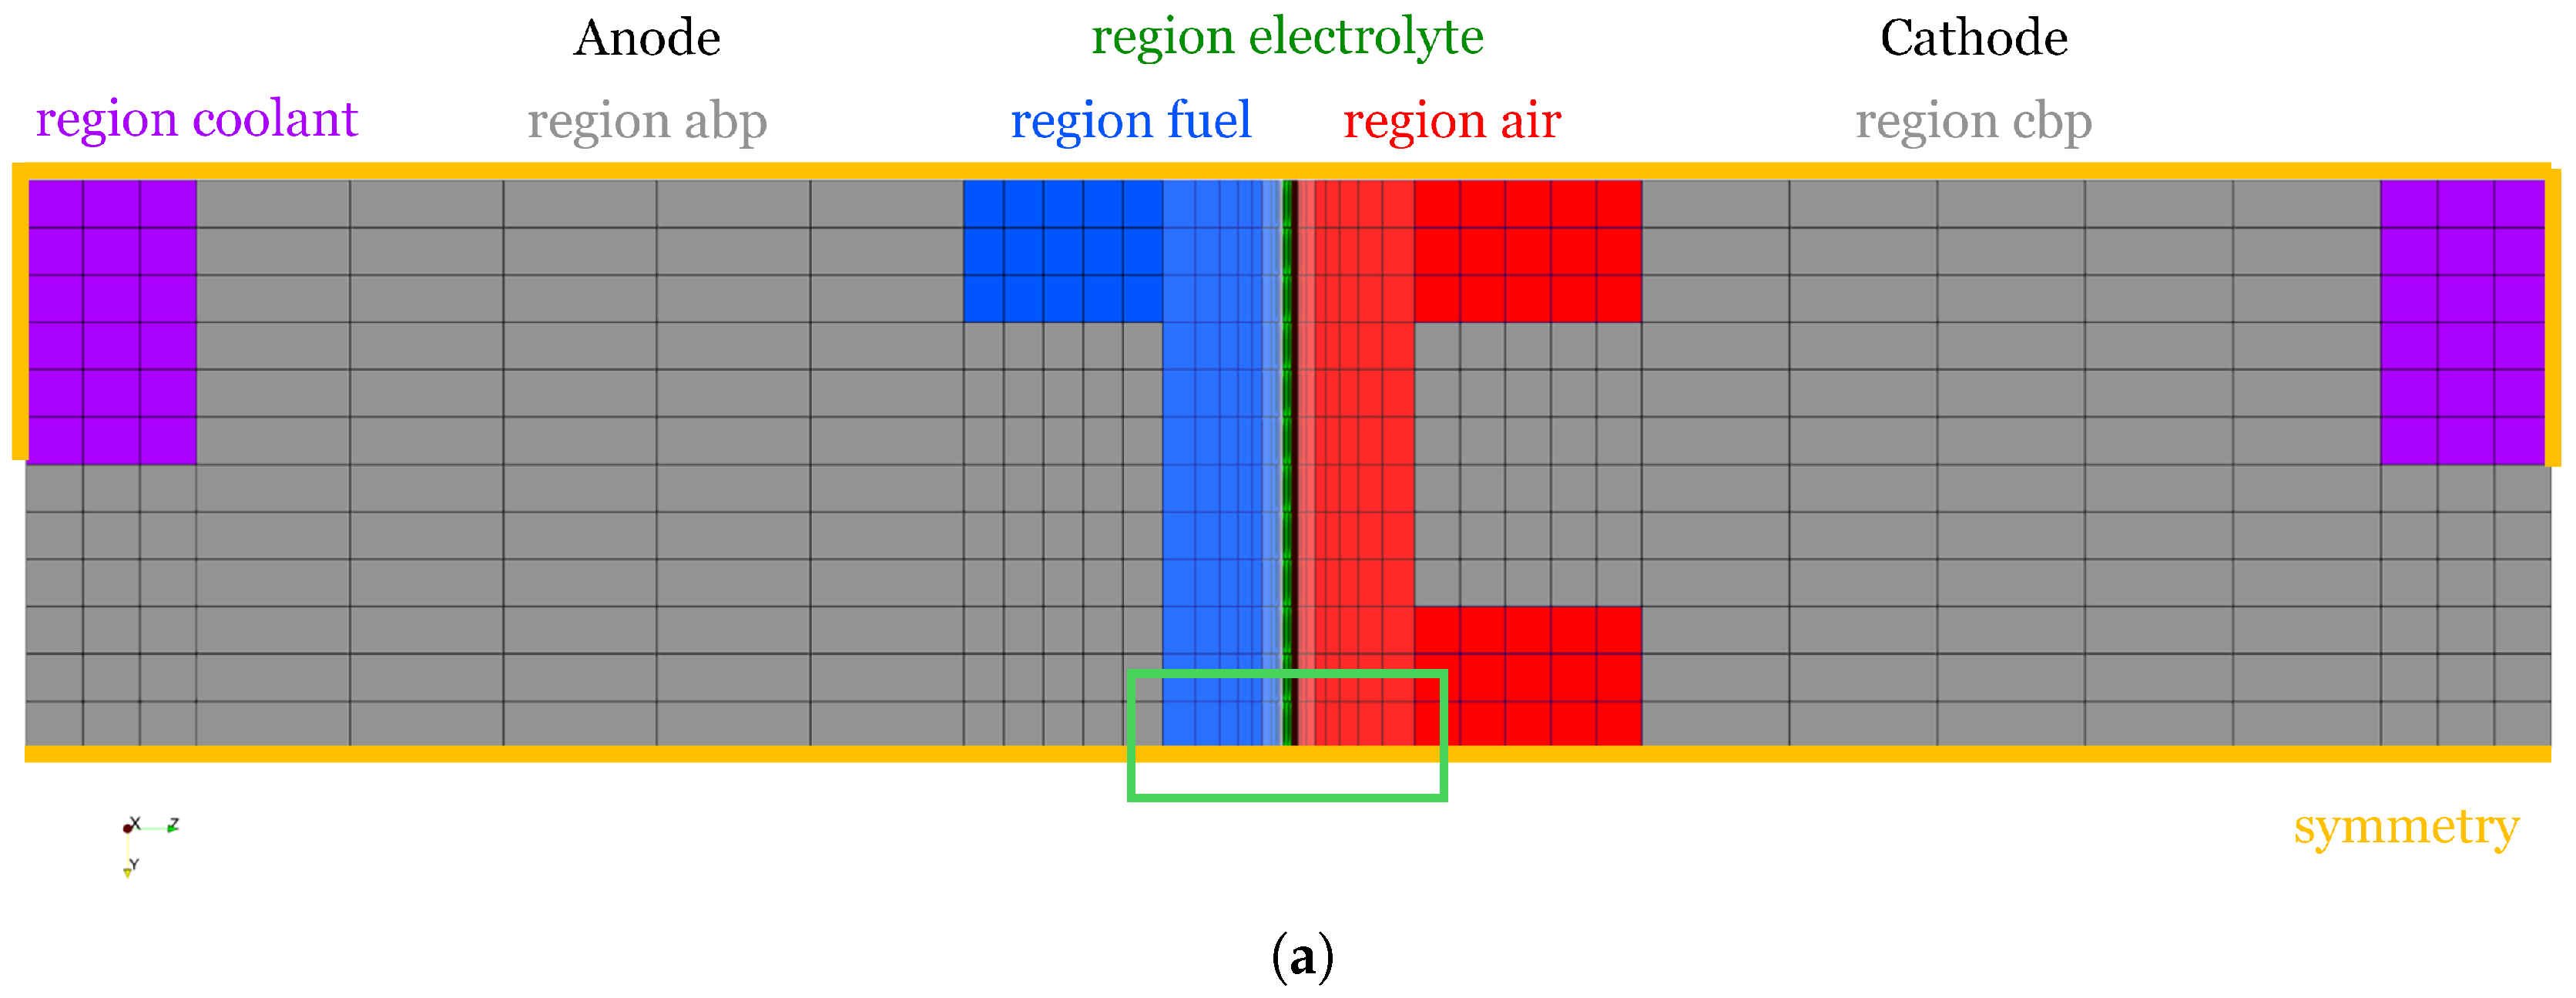
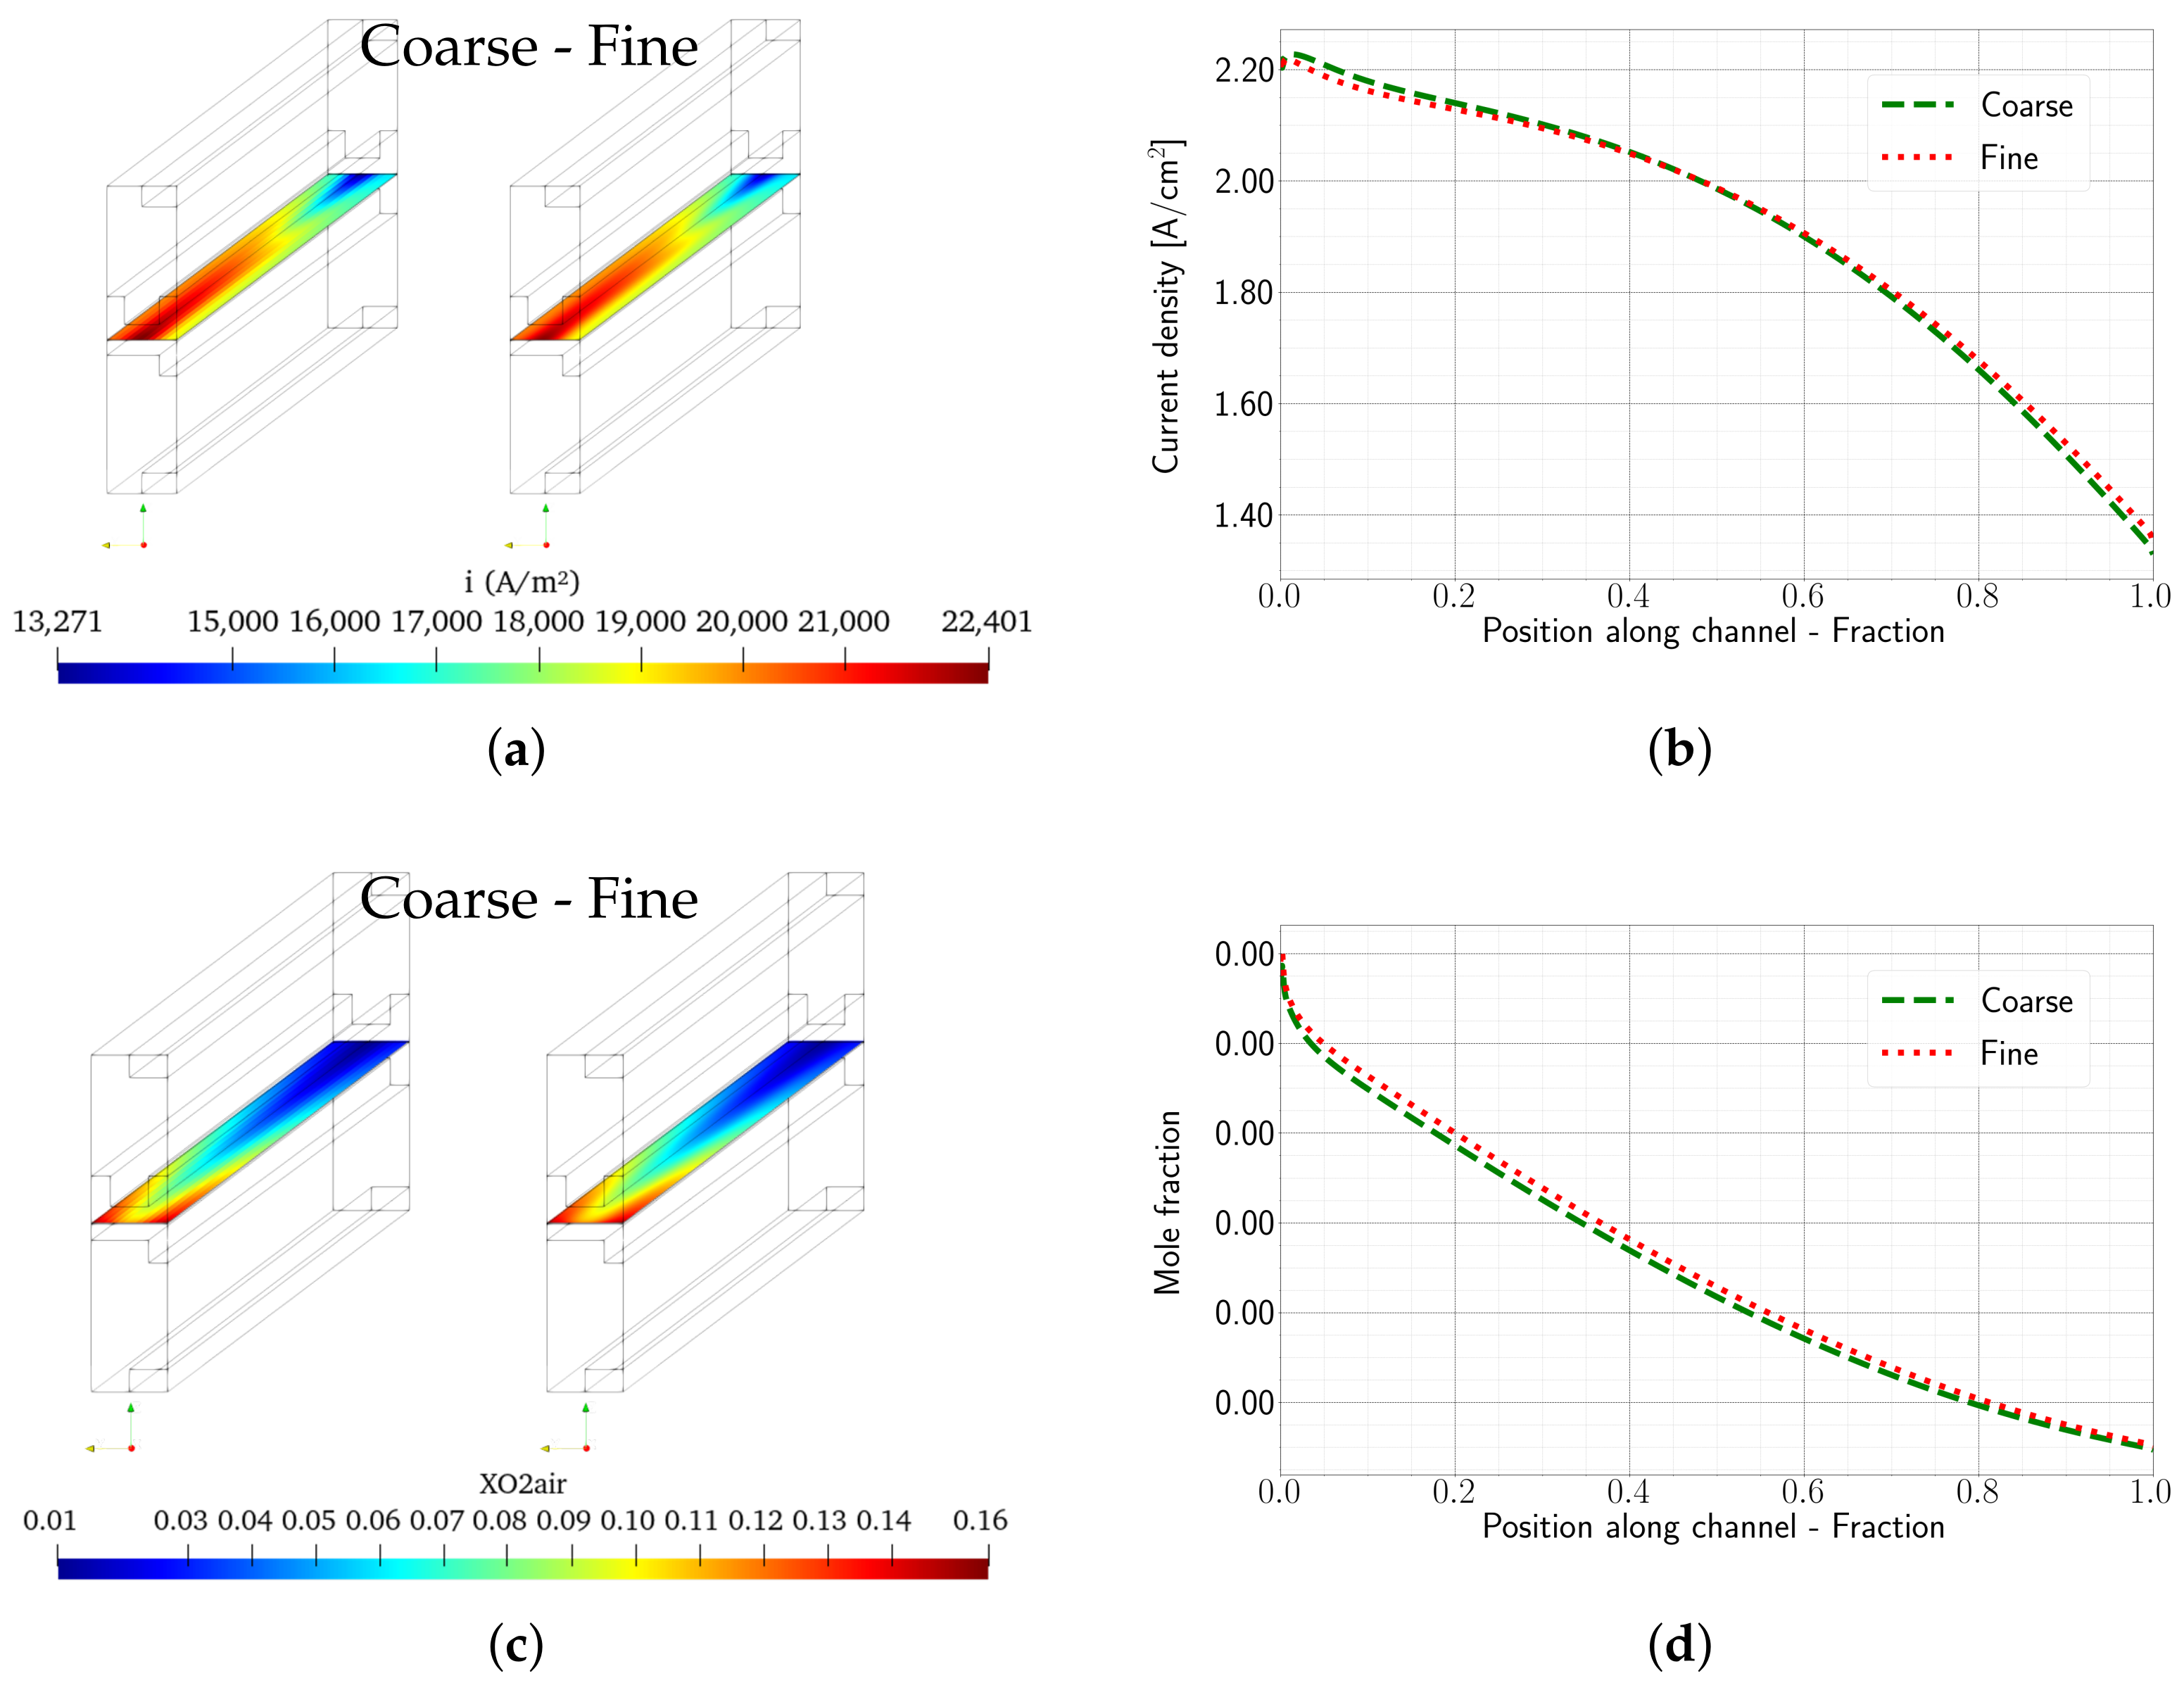
At the beginning of this study, a grid-independence study was performed using the OpenFOAM ZSW PEMFC toolbox. The mesh regions of this single-channel model are defined according to Figure 1a. Two different meshes, coarse and fine, were prepared using the OpenFOAM utility blockMesh. With this utility, the entire geometry is created from several hexahedra, which are defined by the CAD coordinates. The coarse mesh (see Figure 3) has a base mesh resolution of 3 × 5 elements in the half channel cross section (yz) of the anode and cathode channels and is refined in the z-direction towards the membrane (see Figure 3b). Along the channel length, 300 cells are defined. Overall, the coarse mesh consists of 636,000 cells. For the fine mesh, the channel cross section is increased to 10 × 16 elements, while the number of cells along the channel length remains unchanged. The effect of the grid resolution in the channel length direction is minimal and is therefore not investigated in more detail. The mesh is also refined in the GDL substrate (12 cells), the MPL (9 cells), and the CL (12 cells). Finally, the fine mesh comprises 5.12 million cells. Due to the higher cell count of the fine mesh, the required computational effort and time increase, necessitating parallelisation. The results of the grid-independence study at an operating point of 1.9 A/cm2 are summarised in Figure 4. To assess the grid independence, the ionic current density in the membrane and the O2 mole fraction in the middle of the cathode catalyst layer are analysed. These are two of the most important parameters for evaluating fuel cell performance. Comparable results are obtained on both meshes. The curves shown in Figure 4b,d result from post-processing along the virtual middle line of the simulation model along the channel. Comparing both curves, only small differences can be observed. The resulting cell voltages are 0.602 V for the fine mesh and 0.601 V for the coarse mesh, which is numerically a very good agreement.
The fine mesh is selected to validate the ZSW PEMFC model using experimental data and to compare simulation data obtained using the ANSYS® Fluent PEMFC module, due to its superior convergence properties. Furthermore, due to the higher complexity of the Fluent model, particularly with regard to the liquid phase model, a fine mesh resolution is essential. For the original Kone toolbox, however, a simulation on the fine mesh is not feasible due to a programming error that produces unusable results in parallel simulations. A serial simulation on the fine mesh results in very long unacceptable computing times.

3.2. Validation and Comparison with Original Toolbox of Kone

As described above, experimentally measured polarisation curves (U-I curves) and locally resolved temperature and current density data are available to validate the simulation models. The cell voltage of the downward curve is used to fit the exchange current density at one load point corresponding to 0.1 A/cm2. One branch of the polarisation curve is selected as the time-dependent aspects of the experiment that cannot be reproduced in the stationary simulations (cf. above for a description of the upward and downward curves). To simulate the polarisation curves using the OpenFOAM toolboxes and the Fluent PEMFC module, specific load points from the measured U-I curves are selected as sampling points: 0.03 A/cm2, 0.1 A/cm2, 0.3 A/cm2, 0.7 A/cm2, 1.3 A/cm2, and 1.9 A/cm2. These load points are simulated by starting with predefined initial values (OpenFOAM) or a converged simulation of a lower current density (Fluent) and then manually adjusting the boundary conditions of the simulation (mass flow rates and cell voltage or current density, respectively). In the case of Fluent, the cell voltage is adapted iteratively until the target current density value is reached. For the OpenFOAM toolboxes, the calculation procedure, described in Figure 1b, is performed for each current density point. Here, a target current value is set, and the cell voltage is automatically adapted until this target value is reached.
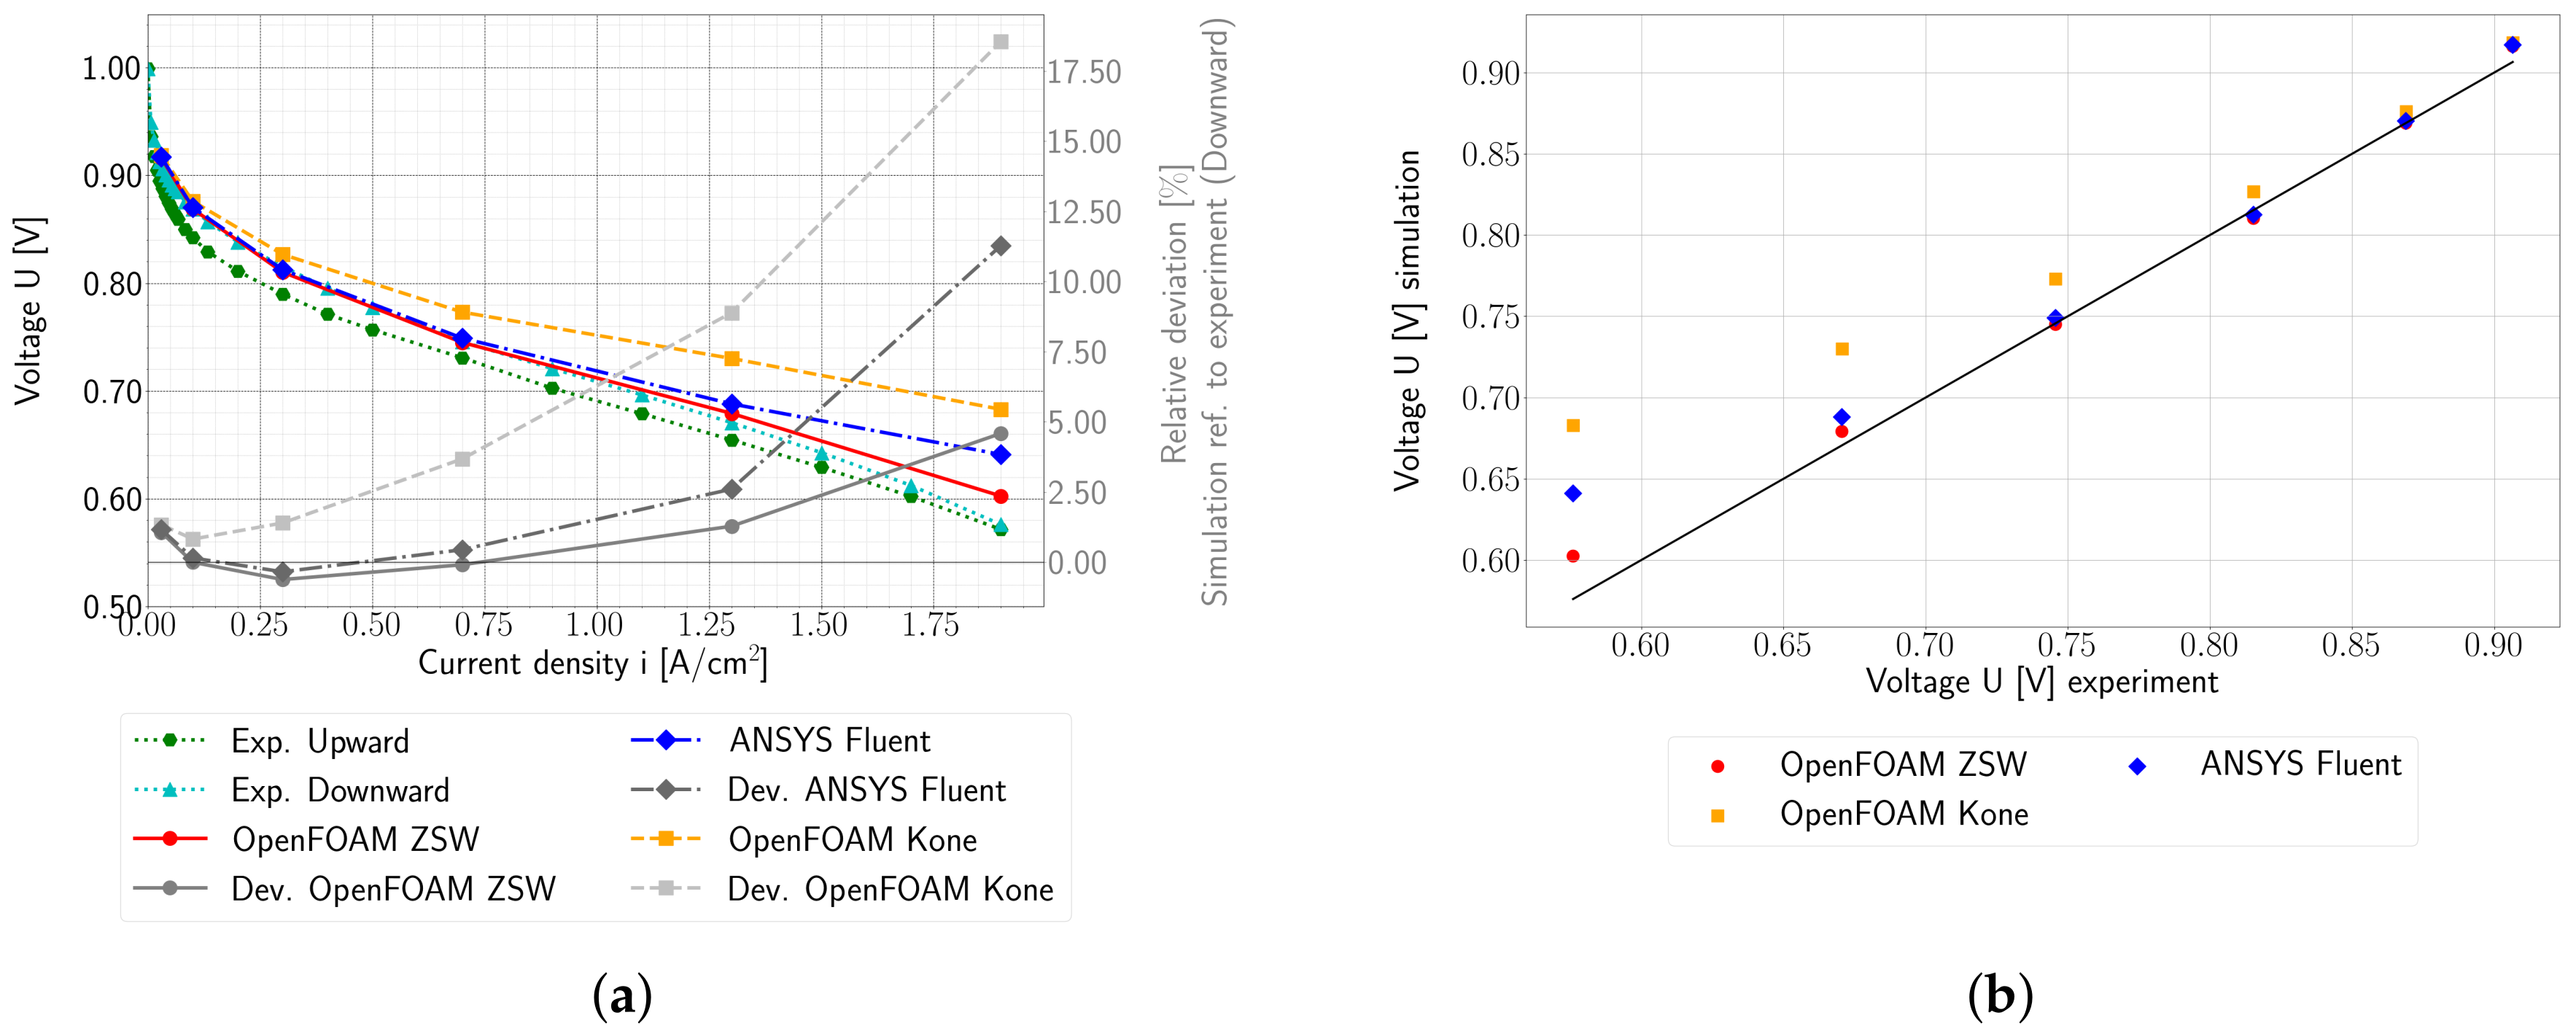
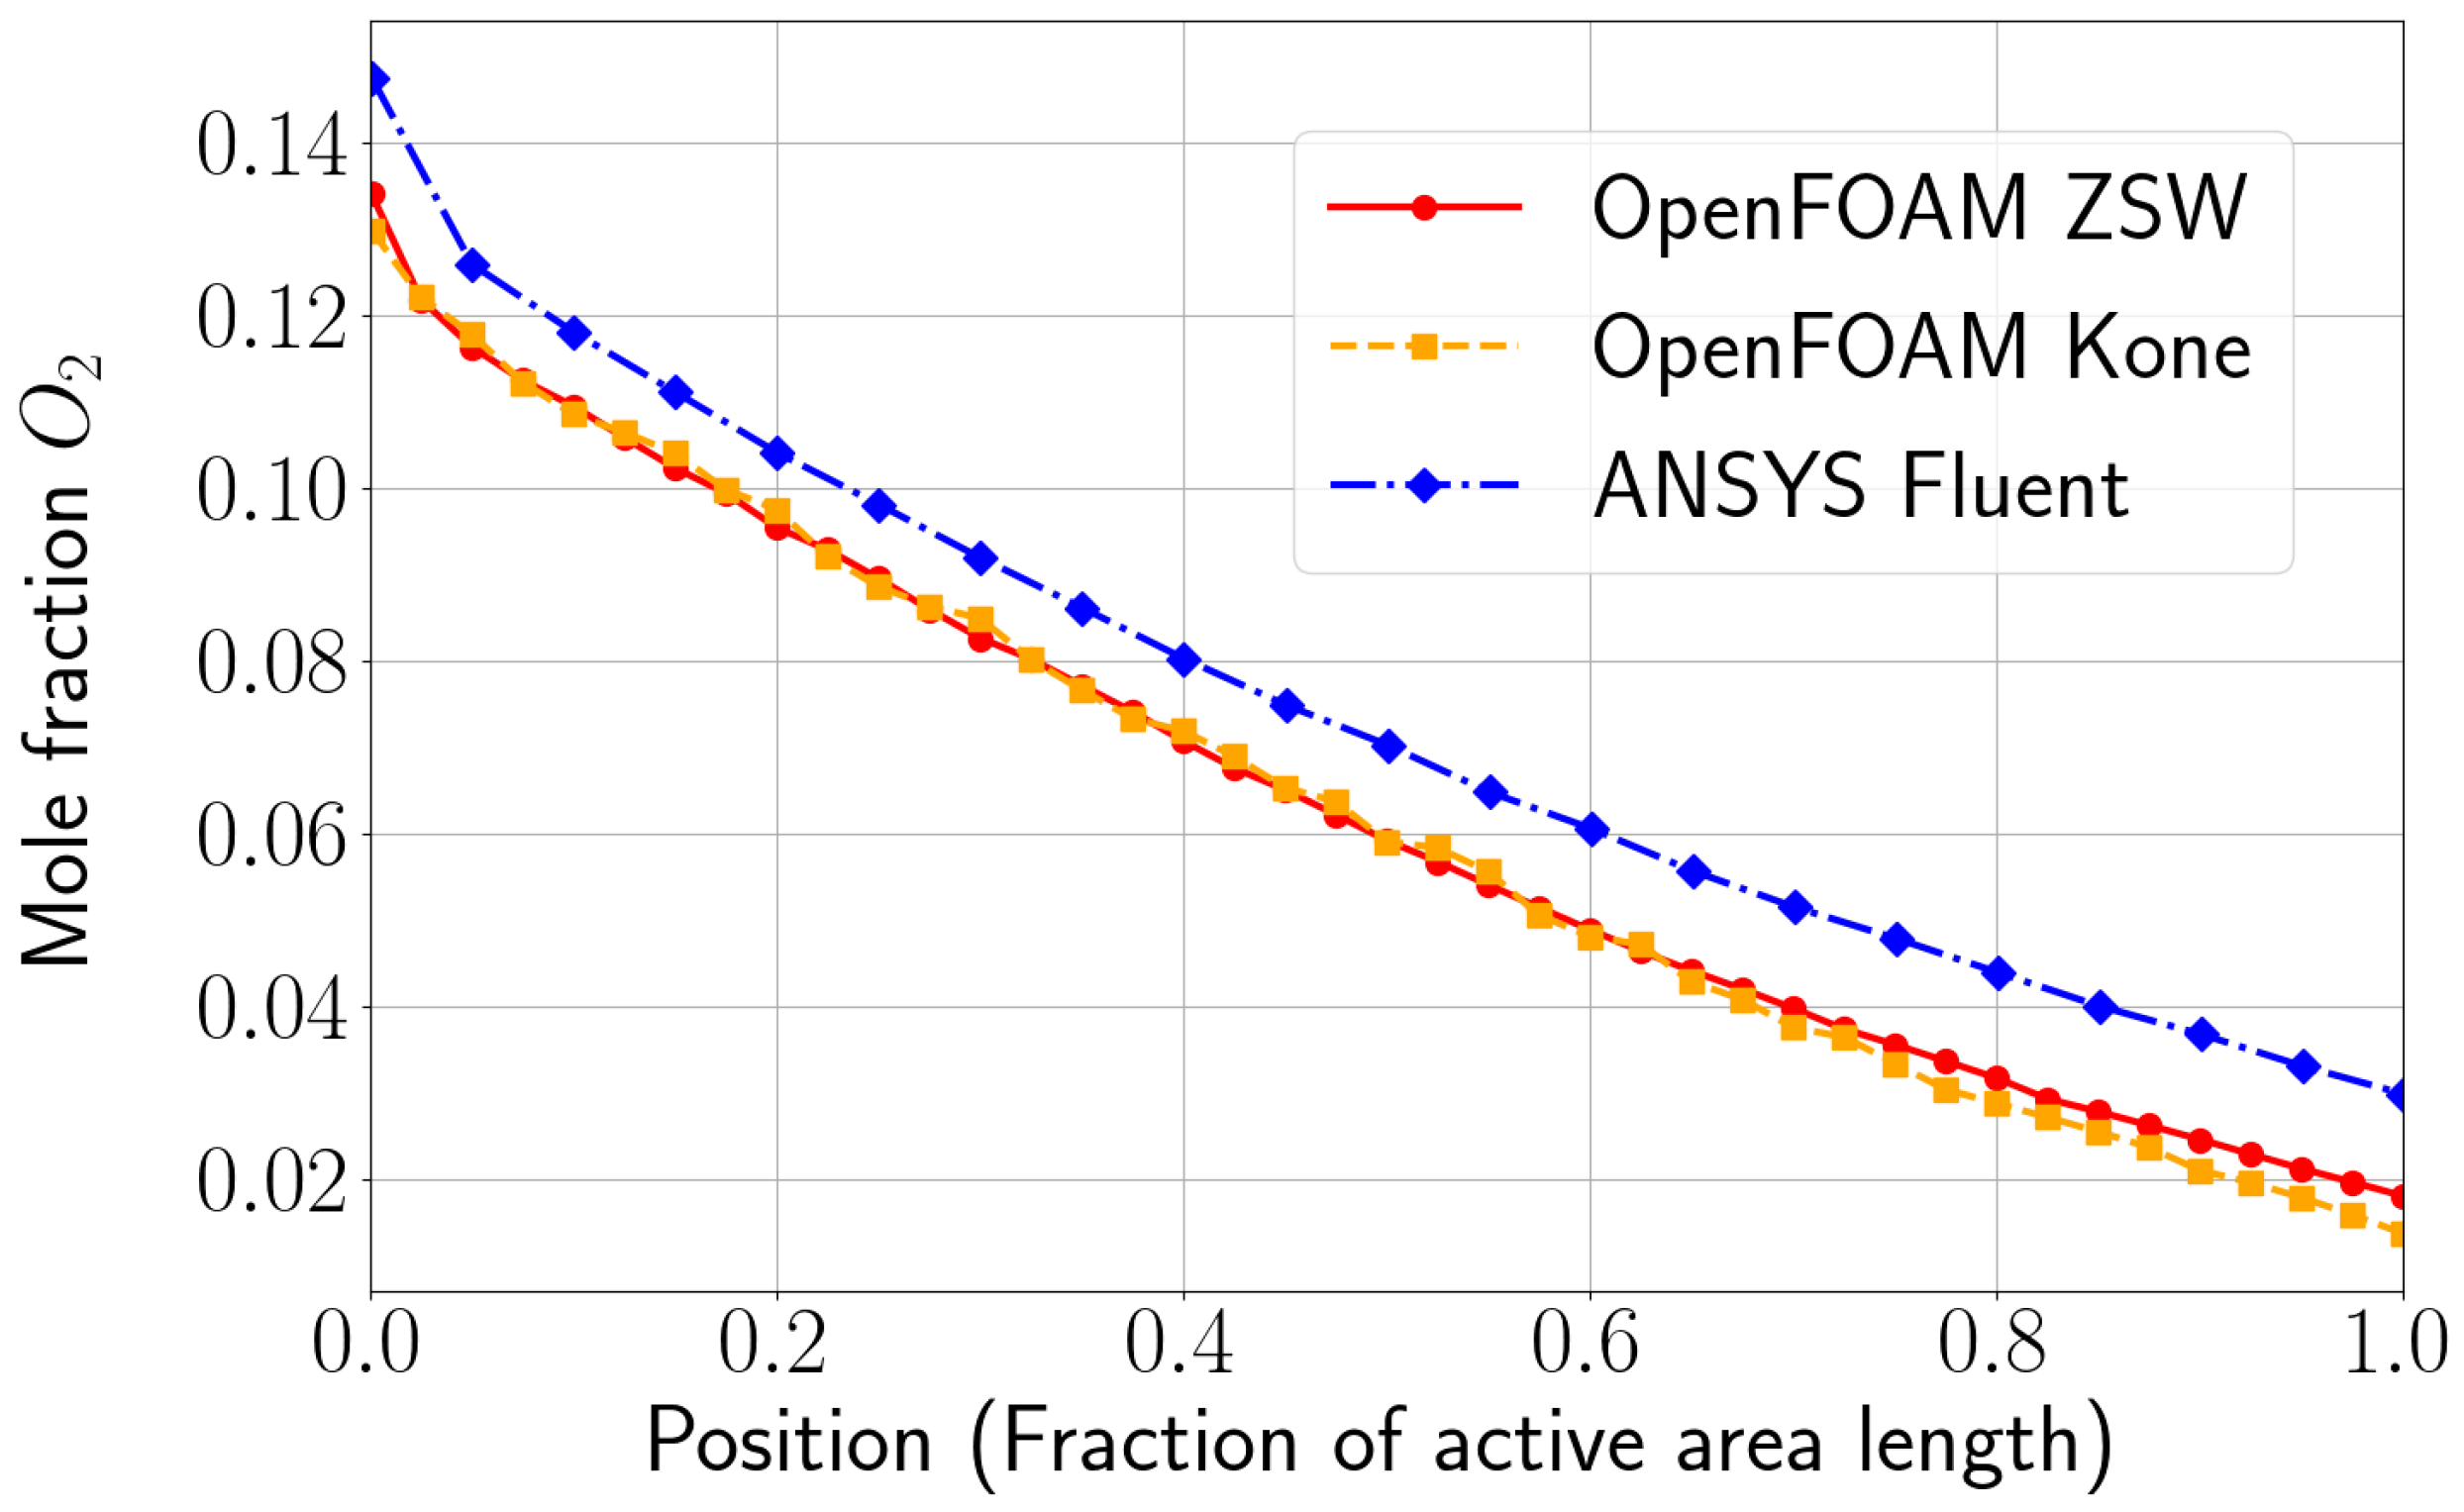
As illustrated in Figure 5a, the modified ZSW OpenFOAM PEMFC toolbox accurately reproduces the experimentally measured curve. The relative deviation from the experimentally measured cell voltage is below ±5% for all load points considered. The root mean square error (RMSE) is relatively small (12 mV). The largest difference in cell voltage (4.6%) can be observed at 1.9 A/cm2. By comparison, the Fluent PEMFC module produces similar results at lower currents up to 1.3 A/cm2. The deviation from the experimentally measured cell voltage in each point is also relatively low (<3%). At 1.9 A/cm2, the difference from the experimental curve is 11.2%, which is higher than in the OpenFOAM simulation. Overall, the Fluent PEMFC module also produces good results compared to the experimental U-I curve (RSME = 28 mV). The scatter plot furthermore (see Figure 5a) illustrates the performance of the two models. The main deviations cluster at lower cell voltage (higher current densities). For both models, the mass transport losses are not fully reproduced, with the OpenFOAM toolbox showing a slight advantage. One possible explanation for the difference in cell voltage between these two simulation models is the difference in O2 mole fractions in the cathode CL (see Figure 6). The two models describe the effective diffusion coefficients in the porous zones differently. The Fluent model uses the Bruggeman correlation, whereby the bulk diffusion coefficient is influenced by porosity by a factor of ϵ 1.5 . The OpenFOAM model uses an alternative approach, which is well described in the literature, e.g., [64]. Here, the diffusion coefficient is corrected by the fraction of porosity and tortuosity ϵ / τ . For the Freudenberg H23 substrate (which is represented by ϵ = 0.64 and τ = 1.5 , see Table 4), the resulting effective diffusion coefficient is higher in the Fluent case than in the OpenFOAM case, finally resulting in a higher mole fraction in the cathode CL. Apparently, both models clearly overestimate the cell voltage at the highest load point. One possible explanation for this discrepancy between the simulation results and the experiments is related to the presence of liquid water in the GDL. A larger quantity of water is produced at higher current densities, which can lead to flooding of the GDL and hinder gas diffusion to the reaction layer. Consequently, the cell performance decreases. Currently, this effect is not considered in the OpenFOAM toolbox. The liquid phase model implemented in the Fluent PEMFC module is possibly too simplistic. Presumably, it neither accurately reflects the effects of flooding nor the subsequent decrease in gas diffusion. This means that the aforementioned overestimation of diffusivity still dominates the result.
There is a clear systematic difference between the original Kone PEMFC toolbox and the experimentally measured pole curve (see Figure 5b). The model under-represents the ohmic resistance of the cell. Consequently, the deviation from the experimentally measured cell voltage increases from 1.4% at 0.3 A/cm2 to 8.8% at 1.3 A/cm2. This is mainly due to the assumption that the membrane is constantly fully humidified, which results in an underestimation of the membrane resistance. The mass transport resistance is also under-represented in the Kone toolbox. With a relative deviation of 18.6% for the cell voltage at 1.9 A/cm2, the Kone model exhibits the highest deviation from experiment of all models investigated here (see Table 6). The RSME of 52 mV is also higher than that observed for the other two models. The O2 mole fraction in the cathode CL is comparable to that in the OpenFOAM ZSW toolbox. This is consistent, as both models use the same method to calculate the effective diffusion coefficient in porous media.
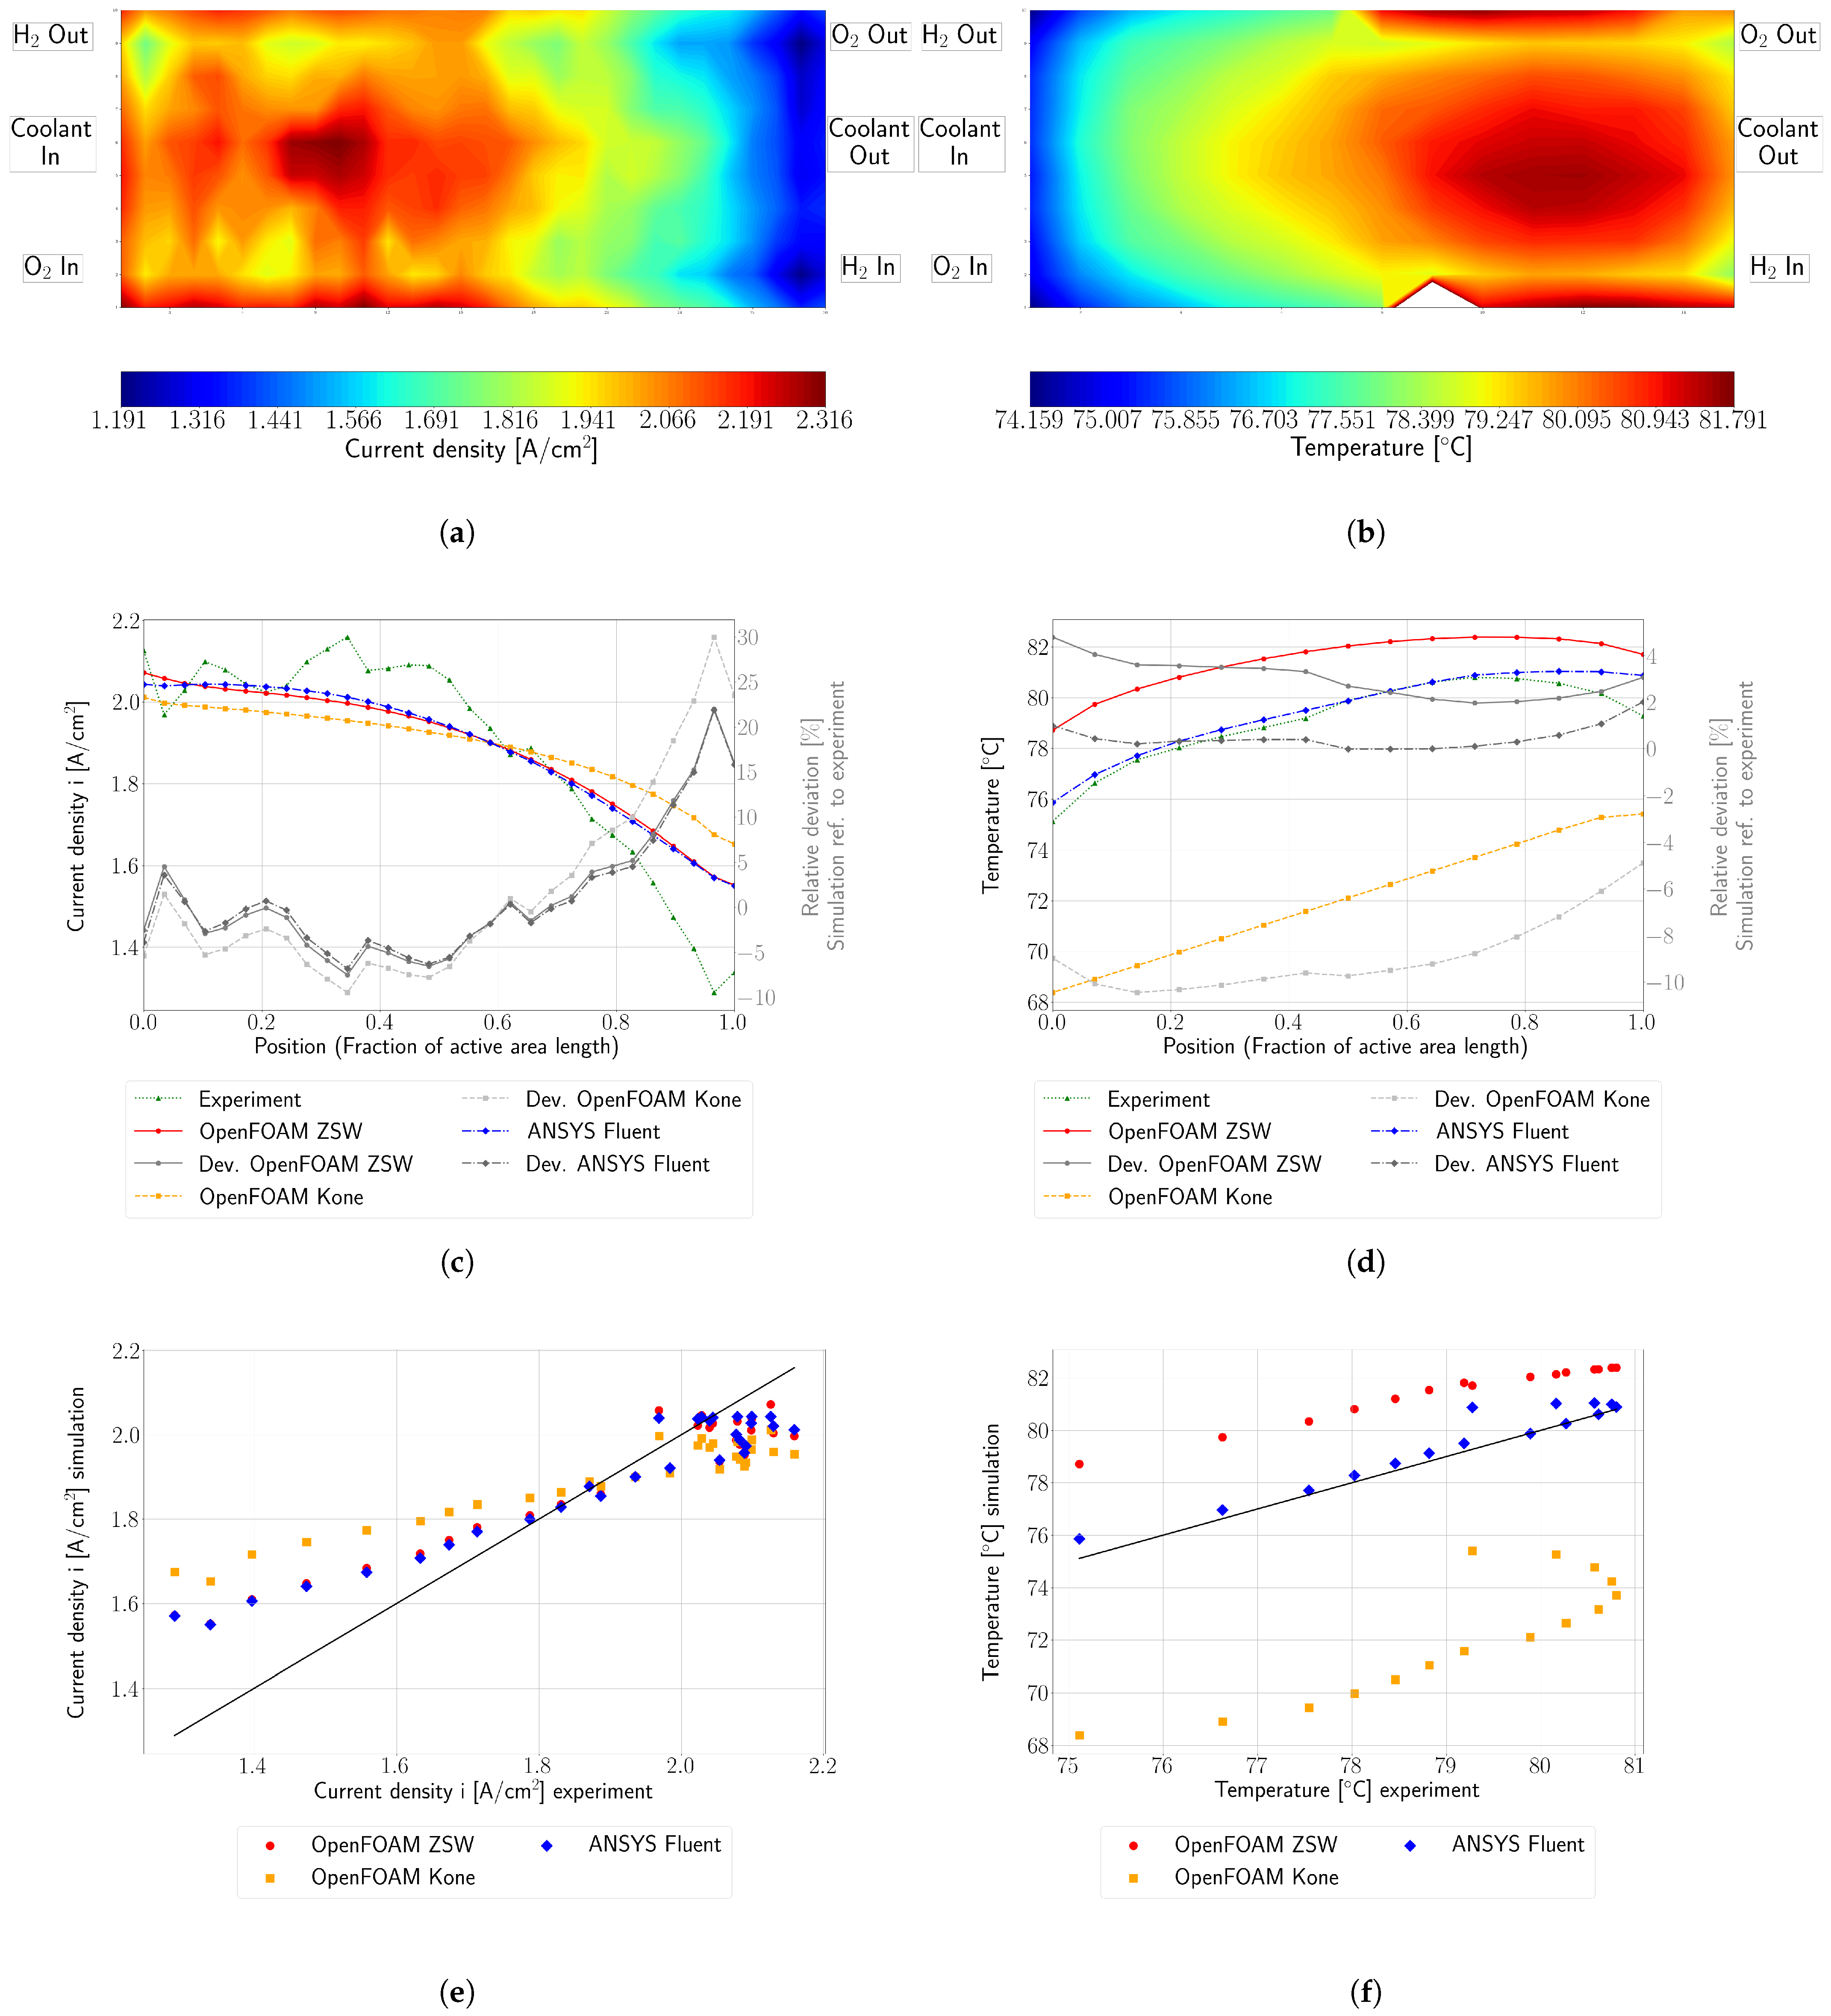
The experimentally measured 2D current density and temperature fields are displayed in Figure 7a,b. The time-averaged data for each segment are illustrated (current density: 300 data points; temperature: 150 data points). The current density decreases gradually from the cathode inlet to the outlet and additionally varies slightly across the channels. To validate the simulation models, for each position along the channel, an averaged value of the experimental data is calculated over the 10 segments in the direction perpendicular to the channels, respectively. This results in 30 data points for the current density field and 15 data points for the temperature field. To post-process the simulation data, the cell values of the membrane cross section (current density) and the BPP cross section (temperature) are exported. To validate the data against the experimental results, the average values corresponding to the segments of the S++ device are calculated. This yields 30 data points for the current density and 15 for the temperature, enabling comparison with the experimental data. The resulting current density and the temperature curves are shown in Figure 7c,d. The relative deviation of the simulation data from the experimental measurements is also plotted. Furthermore, the scatter plots of Figure 7e,f provide an additional representation of the deviation between the experimental and simulated data. In terms of current density, the ZSW toolbox produces results that are similar to those of the Fluent PEMFC module. Both models reproduce the general trend of the experimental curve, with the current decreasing from the cathode inlet to the cathode outlet. The RSME for both models is around 0.10 A/cm2 (see Table 6), which is an acceptable result. However, differences from the experimental curves are clearly visible, especially at the cathode outlet (position = 0.8–1), where the lowest current density values are observed. Here, the relative deviation from the experimental data is >5% and the simulation results show a lower gradient than the experimental data. One possible explanation is that the membrane resistance due to the dry anode inlet gas in counter-flow configuration is underrepresented in the simulation models. Another possible reason is that the models do not sufficiently consider the potential accumulation of liquid water near the cathode outlet. Such an accumulation of liquid water on the cathode side could prevent the reactant gas from reaching the CL particles, where the reaction occurs. The results obtained using the original OpenFOAM PEMFC toolbox of Kone et al. differ slightly from those obtained using the ZSW toolbox and Fluent. Clearly, the overall slope obtained by the Kone model is lower. The relative deviation from the experimental data, as well as the RSME, is much higher. Again, this is probably due to the assumption of a fully wetted membrane, which, in a spurious way, makes the membrane water content and resistance more homogeneous. Consequently, the current density appears to be more homogeneous.
Some experimental inconsistencies can be observed in the measured temperature field (see Figure 7b). The maximum value between oxygen and hydrogen inlet, which is not displayed in colour, appears to be a measurement artefact. The decrease from the border segments to the neighbouring ones observed going further towards the hydrogen inlet is also most probably caused by the S++ device and does not represent a real effect. The Fluent PEMFC module accurately reproduces the experimental results (see Figure 7d,f). The relative deviation from the experimental curve is in the range of ±2%, and the RMSE is relatively low (0.55 K). The OpenFOAM ZSW PEMFC toolbox, however, overestimates the temperature curve by approx. 2 K (RMSE = 2.44 K). The difference between these two models is due to their different depths of modelling. In the case of the OpenFOAM toolbox, the properties of the components are defined as isotropic. From practical experience, it can be expected that correctly representing the TP values would have a greater impact on the overall conduction properties. Thus, in the simulation, for the GDL substrate the TP values are used both in-plane (IP) and TP. Therefore, the IP thermal conductivity is underestimated, and the IP temperature gradient is too high. Consequently, the temperature is slightly, though systematically, overestimated. In the case of the Fluent simulation, in contrast, the different IP and TP thermal conductivities are correctly reflected. Due to the higher IP heat flux, the temperature field is more homogeneous.
In contrast, the original OpenFOAM toolbox of Kone et al. shows an overall lower temperature of approximately 7 K (RMSE = 7.1 K) compared to the experimental curve. As described in Section 2.2, the calculation of the source term in the energy equation describing the waste heat of the fuel cell is implemented incorrectly, resulting in the model underestimating the temperature.

3.3. Some Computational Aspects

A simple performance test was conducted to evaluate the performance of the ZSW OpenFOAM PEMFC toolbox. To achieve this, the time required to reach a converged solution, starting from an initialised simulation setup, was measured. For this purpose, the load point at 1.9 A/cm2 from the polarisation curve was selected. The performance test was conducted using an Intel ® Xeon ® Gold 6154 CPU. A comparison was made between the ZSW OpenFOAM PEMFC toolbox and the PEMFC module of ANSYS® Fluent using the fine mesh (5.12 million cells) on 20 cores. However, the comparison with the original OpenFOAM toolbox could only be based on a single-core simulation using the coarse mesh (636,000 cells), cf. Section 3.1 above. The results are summarised in Table 7. Notably, the difference in the number of iterations required to reach convergence between the Fluent simulation (1300 iterations) and the OpenFOAM simulation (250 iterations) is significant. This difference arises from the different numerical schemes used by Fluent and OpenFOAM. Further numerical details are beyond the scope of this article. Nevertheless, the OpenFOAM case takes almost twice as long as the Fluent simulation. Furthermore, when the two OpenFOAM toolboxes are compared, it is mainly the improved and extended electrochemical models of the ZSW toolbox that lead to a doubling of the simulation time compared to the original toolbox of Kone et al. The number of iterations remains the same.

4. Conclusions

This paper describes the further development of an existing toolbox for simulating transport and electrochemical processes within LT-PEM fuel cells, using the open-source CFD code OpenFOAM (version OpenFOAM-7.x). Compared to the original model by Kone et al. [47], the main improvements are a more detailed electrochemical modelling through the implementation of the Butler–Volmer equation on both the anode and cathode sides, a more precise thermal model obtained by adding explicit modelling of the coolant channel, and a more realistic representation of membrane resistance including a correction of the water balance. Furthermore, the user-friendliness has been enhanced by incorporating the OpenFOAM utilities fvOption and postProcessing.
The model was validated using experimental data obtained from a fuel cell stack representative for automotive applications. The OpenFOAM ZSW PEMFC toolbox realistically reproduces the experimentally measured polarisation curves, with only minor deviations at higher current densities. While the model provides a reasonable representation of the current density distribution, minor differences are still evident. Nevertheless, significant improvements and a better consistency with the experimental data were achieved compared to the original toolbox developed by Kone et al. Compared to the PEMFC module of the commercial CFD software ANSYS® Fluent, very similar results were obtained with the new model for the cases considered here.
The original scope of the present work was to analyse and further develop the single-phase model of Kone et al. When further development for this work began, this model was the only available toolbox for simulating LT-PEMFC in OpenFOAM, and it provided a good starting point. To avoid any numerical issues, the liquid phase models were disregarded during the initial development stages. The authors explicitly acknowledge that more advanced models are described in the literature for several aspects (cf. Section 1). Furthermore, the significant influence of the liquid phase effects on the operation of fuel cells is undeniable. However, the present model aims to combine advanced numerically stable electrochemical modelling of PEM fuel cells with an open-source approach. The aim of this work was to strike a balance between sophisticated modelling and the availability of an open-source code base, while ensuring numerical stability, in order to create a practical and usable performance model for the open-source CFD code OpenFOAM. Nevertheless, the implementation of several more advanced models, such as a 3D representation of the membrane and two-phase modelling, is pending, and the current model does not account for the effect of ageing. Furthermore, the predictability of current density in particular requires further attention. A comparison with the openFuelCell2 model [44], which was recently published for use in OpenFOAM, is planned for the future. Depending on the outcome, further development will focus on the most promising model. The ZSW PEMFC toolbox, including an example intended for code validation and a tutorial case, is available for use on GitHub (https://github.com/EC-SIM/OpenFoamZSWPemfcToolbox under the GPL-3.0 open-source license; accessed date: 27 June 2024). It is suitable for both scientific tasks and as a design tool for fuel cells.
Author Contributions

Conceptualisation, S.S., F.W., L.J. and J.S.; methodology, F.W. and S.S.; software, S.S.; validation, S.S. and M.S.; investigation, F.W. and S.S.; resources, S.S., M.S. and F.W.; data curation, S.S.; writing—original draft preparation, S.S.; writing—review and editing, J.S., F.W., M.S. and L.J.; visualisation, S.S.; supervision, L.J. and J.S. and F.W.; project administration, L.J.; funding acquisition, L.J. All authors have read and agreed to the published version of the manuscript.

Funding

Funding of the project “AutoStack Industrie” (grant number: 03B10103) by the Federal Ministry of Transport and Digital Infrastructure (BMVI) is gratefully acknowledged. “AutoStack Industrie” is a joint initiative of the German automotive and supply industry.

Data Availability Statement

The original contributions presented in this study are included in the article. Further inquiries can be directed to the corresponding author(s). The program code of the model and the case containing the fuel cell setup presented in the article are publicly available (code + example provided) on GitHub (https://github.com/EC-SIM/OpenFoamZSWPemfcToolbox) (accessed on 8 September 2025).

Acknowledgments

The authors wish to acknowledge very helpful discussions with M. Messerschmidt on the historical evolution of PEMFC CFD models.

Conflicts of Interest

The authors declare no conflicts of interest.

Nomenclature

α charge transfer coefficient
δ i thickness of layer i
m ˙ mass flow rate
ϵ porosity
η a c t activation overpotential
η c o n concentration overpotential
η o h m ohmic overpotential
γ concentration exponent
λ membrane water content
μ dynamic viscosity
ρ density
σ electronic conductivity
τ tortuosity
υ i stoichiometric coefficient
awater activity
C i molar concentration of species i
c p specific heat capacity
D i diffusion coefficient of species i
d P pore diameter
E 0 reversible open cell voltage
E a c t activation energy
E N e r n s t Nernst potential
FFaraday constant
F i j Forchheimer constant
G 0 Gibbs free energy
H 0 reaction enthalpy
icurrent density
i 0 exchange current density
i L limiting current density
i L e a k leakage current density
Kpermeability
kthermal conductivity
M W i molecular weight of species i
ppressure
p s a t saturation pressure
Qreaction coefficient
Runiversal gas constant
R o h m ohmic resistance
S 0 reaction entropy
S i source term
Ttemperature
Uvelocity
V i diffusion volumina of species i
V c e l l cell voltage
x i molar fraction of species i
y i mass fraction of species i
zamount of exchanged electrons

Abbreviations

The following abbreviations are used in this manuscript:
CFDcomputational fluid dynamics
PEMFCpolymer electrolyte membrane fuel cell
GDLgas diffusion layer
CCMcatalyst-coated membrane
BPPbipolar plate
CLcatalyst layer
MPLmircoporous layer
ZSWZentrum für Sonnenenergie- und Wasserstoff-Forschung Baden-Württemberg
SOFCsolid oxide fuel cells
ADTaccelerated durability test
BOTbeginning of test
EOTend of test
TPthrough-plane
IPin-plane
RMSEroot mean squared error

References

  1. Wilberforce, T.; El-Hassan, Z.; Khatib, F.; Al Makky, A.; Mooney, J.; Barouaji, A.; Carton, J.G.; Olabi, A.G. Development of Bi-polar plate design of PEM fuel cell using CFD techniques. Int. J. Hydrogen Energy 2017, 42, 25663–25685. [Google Scholar] [CrossRef]
  2. Gopi, K.H.; Nambi, A.; Rajalakshmi, N. Design and Development of Open Cathode PEM Fuel Cell—Flow Analysis Optimization by CFD. Fuel Cells 2020, 20, 33–39. [Google Scholar] [CrossRef]
  3. Dutta, S.; Shimpalee, S.; Van Zee, J. Three-dimensional numerical simulation of straight channel PEM fuel cells. J. Appl. Electrochem. 2000, 30, 135–146. [Google Scholar] [CrossRef]
  4. Dutta, S.; Shimpalee, S.; Van Zee, J. Numerical prediction of mass-exchange between cathode and anode channels in a PEM fuel cell. Int. J. Heat Mass Transf. 2001, 44, 2029–2042. [Google Scholar] [CrossRef]
  5. Weber, A.Z.; Newman, J. Modeling transport in polymer-electrolyte fuel cells. Chem. Rev. 2004, 104, 4679–4726. [Google Scholar] [CrossRef]
  6. Kone, J.P.; Zhang, X.; Yan, Y.; Hu, G.; Ahmadi, G. Three-dimensional multiphase flow computational fluid dynamics models for proton exchange membrane fuel cell: A theoretical development. J. Comput. Multiph. Flows 2017, 9, 3–25. [Google Scholar] [CrossRef]
  7. Jahnke, T.; Futter, G.; Latz, A.; Malkow, T.; Papakonstantinou, G.; Tsotridis, G.; Schott, P.; Gérard, M.; Quinaud, M.; Quiroga, M.; et al. Performance and degradation of Proton Exchange Membrane Fuel Cells: State of the art in modeling from atomistic to system scale. J. Power Sources 2016, 304, 207–233. [Google Scholar] [CrossRef]
  8. Berning, T.; Lu, D.; Djilali, N. Three-dimensional computational analysis of transport phenomena in a PEM fuel cell. J. Power Sources 2002, 106, 284–294. [Google Scholar] [CrossRef]
  9. Berning, T.; Djilali, N. A 3D, Multiphase, Multicomponent Model of the Cathode and Anode of a PEM Fuel Cell. J. Electrochem. Soc. 2003, 150, A1589. [Google Scholar] [CrossRef]
  10. ANSYS, Inc. Ansys CFX, Turbomachinery CFD Software. 2025. Available online: https://www.ansys.com/products/fluids/ansys-cfx (accessed on 23 July 2025).
  11. ANSYS, Inc. Ansys Fluent, Fluid Simulation Software. 2025. Available online: https://www.ansys.com/products/fluids/ansys-fluent (accessed on 23 July 2025).
  12. Schwarz, D.H.; Djilali, N. 3D Modeling of Catalyst Layers in PEM Fuel Cells: Effects of Transport Limitations. J. Electrochem. Soc. 2007, 154, B1167. [Google Scholar] [CrossRef]
  13. Schwarz, D.H.; Djilali, N. Three-dimensional modelling of catalyst layers in PEM fuel cells: Effects of non-uniform catalyst loading. Int. J. Energy Res. 2009, 33, 631–644. [Google Scholar] [CrossRef]
  14. Schwarz, D.; Beale, S. Calculations of transport phenomena and reaction distribution in a polymer electrolyte membrane fuel cell. Int. J. Heat Mass Transf. 2009, 52, 4074–4081. [Google Scholar] [CrossRef]
  15. Li, S.; Becker, U. A Three Dimensional CFD Model for PEMFC. In Proceedings of the 2nd International Conference on Fuel Cell Science, Engineering and Technology, Rochester, NY, USA, 14–16 June 2004; pp. 157–164. [Google Scholar] [CrossRef]
  16. Wang, Y.; Wang, C.Y. A Nonisothermal, Two-Phase Model for Polymer Electrolyte Fuel Cells. J. Electrochem. Soc. 2006, 153, A1193. [Google Scholar] [CrossRef]
  17. Wang, Z.; Wang, C.; Chen, K. Two-phase flow and transport in the air cathode of proton exchange membrane fuel cells. J. Power Sources 2001, 94, 40–50. [Google Scholar] [CrossRef]
  18. Pasaogullari, U.; Wang, C.Y. Two-Phase Modeling and Flooding Prediction of Polymer Electrolyte Fuel Cells. J. Electrochem. Soc. 2005, 152, A380. [Google Scholar] [CrossRef]
  19. Meng, H.; Wang, C.Y. Model of Two-Phase Flow and Flooding Dynamics in Polymer Electrolyte Fuel Cells. J. Electrochem. Soc. 2005, 152, A1733. [Google Scholar] [CrossRef]
  20. Mazumder, S.; Cole, J.V. Rigorous 3-D Mathematical Modeling of PEM Fuel Cells: I. Model Predictions without Liquid Water Transport. J. Electrochem. Soc. 2003, 150, A1503. [Google Scholar] [CrossRef]
  21. Mazumder, S.; Cole, J.V. Rigorous 3-D Mathematical Modeling of PEM Fuel Cells: II. Model Predictions with Liquid Water Transport. J. Electrochem. Soc. 2003, 150, A1510. [Google Scholar] [CrossRef]
  22. ESI Group. Search Results ACE+ Suite. 2025. Available online: https://myesi.esi-group.com/search?search=ace (accessed on 23 July 2025).
  23. Scholz, H. Modellierung und Untersuchung von Flutungsphänomenen in Niedertemperatur-PEM-Brennstoffzellen; Volkswagen Aktiengesellschaft AutoUni-Schriftenreihe Band 82; Logos Verlag Berlin GmbH: Berlin, Germany, 2015; ISBN 978-3-8325-4122-4. [Google Scholar]
  24. ANSYS, Inc. Ansys Fluent Theory Guide; Release 2024 R2. Available online: https://ansyshelp.ansys.com/public/account/secured?returnurl=/Views/Secured/corp/v242/en/flu_th/flu_th_models_fuelcells.html (accessed on 26 August 2025).
  25. Springer, T.E.; Zawodzinski, T.; Gottesfeld, S. Polymer electrolyte fuel cell model. J. Electrochem. Soc. 1991, 138, 2334. [Google Scholar] [CrossRef]
  26. Windarto, C.; Lim, O. Numerical investigation on the performance of proton exchange membrane fuel cell metallic bipolar plate with decussate flow channel configurations. Int. J. Hydrogen Energy 2025, 101, 1093–1104. [Google Scholar] [CrossRef]
  27. Fink, C.; Fouquet, N. Three-dimensional simulation of polymer electrolyte membrane fuel cells with experimental validation. Electrochim. Acta 2011, 56, 10820–10831. [Google Scholar] [CrossRef]
  28. Fink, C.; Karpenko-Jereb, L.; Ashton, S. Advanced CFD Analysis of an Air-cooled PEM Fuel Cell Stack Predicting the Loss of Performance with Time. Fuel Cells 2016, 16, 490–503. [Google Scholar] [CrossRef]
  29. Fink, C.; Gößling, S.; Karpenko-Jereb, L.; Urthaler, P. CFD Simulation of an Industrial PEM Fuel Cell with Local Degradation Effects. Fuel Cells 2020, 20, 431–452. [Google Scholar] [CrossRef]
  30. Fink, C.; Edjokola, J.M.; Telenta, M.; Bodner, M. Modeling of Catalyst Degradation in Polymer Electrolyte Membrane Fuel Cells Applied to Three-Dimensional Computational Fluid Dynamics Simulation. Fuel Cells 2024, 24, e202300237. [Google Scholar] [CrossRef]
  31. d’Adamo, A.; Riccardi, M.; Borghi, M.; Fontanesi, S. CFD modelling of a hydrogen/air PEM fuel cell with a serpentine gas distributor. Processes 2021, 9, 564. [Google Scholar] [CrossRef]
  32. Riccardi, M.; d’Adamo, A.; Vaini, A.; Romagnoli, M.; Borghi, M.; Fontanesi, S. Experimental validation of a 3d-cfd model of a pem fuel cell. In Proceedings of the 75th National ATI Congress, #7 Clean Energy for All, Rome, Italy, 15–16 September 2020; EDP Sciences: Les Ulis, France, 2020; Volume 197, p. 05004. [Google Scholar] [CrossRef]
  33. Siemens Digital Industries Software. Simcenter STAR-CCM+ CFD Software. 2025. Available online: https://plm.sw.siemens.com/de-DE/simcenter/fluids-thermal-simulation/star-ccm/ (accessed on 23 July 2025).
  34. COMSOL. COMSOL Multiphysics, Fuel Cell & Electrolyzer Module. 2025. Available online: https://www.comsol.de/fuel-cell-and-electrolyzer-module (accessed on 23 July 2025).
  35. Mohanty, S.; Desai, A.N.; Singh, S.; Ramadesigan, V.; Shaneeth, M. Effects of the membrane thickness and ionomer volume fraction on the performance of PEMFC with U-shaped serpentine channel. Int. J. Hydrogen Energy 2021, 46, 20650–20663. [Google Scholar] [CrossRef]
  36. Mojica, F.; Rahman, M.A.; Mora, J.M.; Ocon, J.D.; Chuang, P.Y.A. Experimental Study of Three Channel Designs with Model Comparison in a PEM Fuel Cell. Fuel Cells 2020, 20, 547–557. [Google Scholar] [CrossRef]
  37. The OpenFOAM Foundation. OpenFOAM. 2025. Available online: https://openfoam.org/ (accessed on 23 July 2025).
  38. OpenCFD Ltd. OpenFOAM. 2025. Available online: https://www.openfoam.com/ (accessed on 23 July 2025).
  39. openFuelCell Project. openFuelCell. Available online: https://openfuelcell.sourceforge.io (accessed on 23 July 2025).
  40. Jeon, D.; Beale, S.; Choi, H.; Pharoah, J.; Roth, H. Computational study of heat and mass transfer issues in solid oxide fuel cells. In Proceedings of the 21st International Symposium on Transport Phenomena, Kaohsiung City, Taiwan, 2–5 November 2010; pp. 2–5. [Google Scholar]
  41. Beale, S.B.; Choi, H.W.; Pharoah, J.G.; Roth, H.K.; Jasak, H.; Jeon, D.H. Open-source computational model of a solid oxide fuel cell. Comput. Phys. Commun. 2016, 200, 15–26. [Google Scholar] [CrossRef]
  42. Cao, Q.; Beale, S.B.; Reimer, U.; Froning, D.; Lehnert, W. The Importance of Diffusion Mechanisms in High Temperature Polymer Electrolyte Fuel Cells. ECS Trans. 2015, 69, 1089. [Google Scholar] [CrossRef]
  43. Weber, N.; Knüpfer, L.; Beale, S.B.; Lehnert, W.; Reimer, U.; Zhang, S.; Ferreira-Aparicio, P.; Chaparro, A.M. Open-source Computational Model for Polymer Electrolyte Fuel Cells. OpenFOAM® J. 2023, 3, 26–48. [Google Scholar] [CrossRef]
  44. Zhang, S.; Hess, S.; Marschall, H.; Reimer, U.; Beale, S.; Lehnert, W. openFuelCell2: A new computational tool for fuel cells, electrolyzers, and other electrochemical devices and processes. Comput. Phys. Commun. 2024, 298, 109092. [Google Scholar] [CrossRef]
  45. Zhang, S.; Yu, S.; Peters, R.; Beale, S.B.; Marschall, H.; Kunz, F.; Eichel, R.A. A new procedure for rapid convergence in numerical performance calculations of electrochemical cells. Electrochim. Acta 2023, 472, 143275. [Google Scholar] [CrossRef]
  46. Bulgarini, M.; Della Torre, A.; Baricci, A.; Grimaldi, A.; Marocco, L.; Mereu, R.; Montenegro, G.; Onorati, A. Computational Fluid Dynamic Investigation of Local Flow-Field Conditions in Lab Polymer Electrolyte Membrane Fuel Cells to Identify Degradation Stressors and Performance Enhancers. Energies 2024, 17, 3643. [Google Scholar] [CrossRef]
  47. Kone, J.P.; Zhang, X.; Yan, Y.; Adegbite, S. An open-source toolbox for PEM fuel cell simulation. Computation 2018, 6, 38. [Google Scholar] [CrossRef]
  48. Kone, J.P.; Zhang, X.; Yan, Y.; Adegbite, S. An Open-Source Toolbox for Multiphase Flow Simulation in a PEM Fuel Cell. Comput. Inf. Sci. 2018, 11, 10–34. [Google Scholar] [CrossRef]
  49. Ridders, C. A new algorithm for computing a single root of a real continuous function. IEEE Trans. Circuits Syst. 1979, 26, 979–980. [Google Scholar] [CrossRef]
  50. Simon, C.; Hasché, F.; Gasteiger, H.A. Influence of the Gas Diffusion Layer Compression on the Oxygen Transport in PEM Fuel Cells at High Water Saturation Levels. J. Electrochem. Soc. 2017, 164, F591. [Google Scholar] [CrossRef]
  51. Simon, C.; Kartouzian, D.; Müller, D.; Wilhelm, F.; Gasteiger, H.A. Impact of Microporous Layer Pore Properties on Liquid Water Transport in PEM Fuel Cells: Carbon Black Type and Perforation. J. Electrochem. Soc. 2017, 164, F1697. [Google Scholar] [CrossRef]
  52. Barbir, F. PEM Fuel Cells-Theory and Practice; Elsevier Inc.: Amsterdam, The Netherlands, 2005. [Google Scholar]
  53. Hafsteinsson, H.E. Porous Media in OpenFOAM; Chalmers University of Technology: Gothenburg, Sweden, 2009. [Google Scholar]
  54. Gesellschaft, V. VDI-Wärmeatlas, 10th ed.; Springer: Berlin/Heidelberg, Germany, 2006. [Google Scholar]
  55. Fairbanks, D.; Wilke, C. Diffusion coefficients in multicomponent gas mixtures. Ind. Eng. Chem. 1950, 42, 471–475. [Google Scholar] [CrossRef]
  56. Welty, J.; Rorrer, G.L.; Foster, D.G. Fundamentals of Momentum, Heat, and Mass Transfer; John Wiley & Sons: Hoboken, NJ, USA, 2020. [Google Scholar]
  57. Geankoplis, C.J. Transport Processes and Unit Operations, 3rd ed.; Hall Press: Hoboken, NJ, USA, 1993. [Google Scholar]
  58. Larminie, J.; Dicks, A. Fuel Cell Systems Explained, 2nd ed.; John Wiley & Sons Ltd.: Hoboken, NJ, USA, 2003. [Google Scholar]
  59. Vijay, P.; Tadé, M.O. Improved approximation for the butler-volmer equation in fuel cell modelling. Comput. Chem. Eng. 2017, 102, 2–10. [Google Scholar] [CrossRef]
  60. Wang, Y.; Chen, K.S. PEM Fuel Cells: Thermal and Water Management Fundamentals; Momentum Press: New York, NY, USA, 2013; ISBN-13 978-1-60650-247-1. [Google Scholar]
  61. Koprek, M.; Schlumberger, R.; Wachtel, C.; Wilhelm, F.; Messerschmidt, M.; Scholta, J.; Hölzle, M. Local ageing effects of polymer electrolyte fuel cell membrane electrode assemblies due to accelerated durability testing. Fuel Cells 2022, 22, 271–283. [Google Scholar] [CrossRef]
  62. Koprek, M.; Schlumberger, R.; Wachtel, C.; Wilhelm, F.; Messerschmidt, M.; Scholta, J.; Hölzle, M. Underlying Data Version 1.0 for the Publication ‘Local Ageing Effects of Polymer Electrolyte Fuel Cell Membrane Electrode Assemblies Due to Accelerated Durability Testing’. Available online: https://zenodo.org/records/16420237 (accessed on 25 June 2025).
  63. Freudenberg Gas Diffusion Layers; Technical Data; Freudenberg Performance Materials SE & Co. KG.: Weinheim, Germany, 2018; Available online: https://fuelcellcomponents.freudenberg-pm.com/-/media/Files/fuelcellcomponents,-d-,freudenbergpm,-d-,com/FPM_technical_data_sheet_gdl_ENG_2018-07-04.pdf (accessed on 28 August 2025).
  64. Zenyuk, I.V.; Parkinson, D.Y.; Connolly, L.G.; Weber, A.Z. Gas-diffusion-layer structural properties under compression via X-ray tomography. J. Power Sources 2016, 328, 364–376. [Google Scholar] [CrossRef]
Figure 1. (a) Schematic description and (b) simulation procedure of the OpenFOAM ZSW PEMFC toolbox.
Energies 18 04793 g001
Figure 2. (a) ZSW 300 cm2 automotive stack design, (b) locally resolved current density measurement device, and (c) single channel simulation model of ZSW stack design (active area).
Energies 18 04793 g002
Figure 3. ZSW 300 cm2 design single channel model, with mesh resolution using the example of the coarse grid; (a) global mesh with marked region meshes according to Figure 1a (abp: anode BPP; cbp: cathode BPP) and (b) mesh resolution in GDL and CCM (green box of (a)).
Energies 18 04793 g003aEnergies 18 04793 g003b
Figure 4. Results of grid study at 1.9 A/cm2: (a) current density at the mid-section of the membrane, (b) current density of the membrane along the midline of the channel model, (c) mole fraction O2 at the mid-section of cathode CL, (d) mole fraction O2 of cathode CL long the midline of the channel model.
Energies 18 04793 g004
Figure 5. Polarisation curve: (a) comparison of simulation results and experimental data [61,62]; grey colours: relative deviation from experiment (downward), and (b) scatter plot of cell voltage.
Energies 18 04793 g005
Figure 6. Simulation data at 1.9 A/cm2: comparison of average (across the direction of flow) mole fraction O2 of cathode CL along the the channel model.
Energies 18 04793 g006
Figure 7. Experimental [61,62] and simulation data at 1.9 A/cm2: (a) experimentally measured current density and (b) temperature field, (c) comparison of mean current density curve along channel inclusive relative deviation of simulation to experimental data, (d) comparison of mean temperature curve along channel inclusive relative deviation of simulation to experimental data, (e) scatter plot of current density, and (f) scatter plot of temperature.
Energies 18 04793 g007
Table 3. Automotive operating conditions of experiment and simulations.
CathodeAnode
Pressure at stack outlet (bara)2.02.2
Gas temperature at stack inlet (°C)7373
Stoichiometry1.61.6
Dew point (°C)5348.5
Gas composition100% Air30% N2; 70% H2
Min. gas flow (A/cm2)0.6
Temperature coolant at stack inlet (°C)68
Coolant flow rate stack (L/min)4
Table 4. Material properties used for the Freudenberg H23C9 GDL [63]; when available, parameters are taken from the product data sheet.
Substrate H23MPL C9
Permeability in-plane (m2)1.70 × 10−121.38 × 10⁻¹⁵
Permeability through-plane (m2)2.75 × 10−121.38 × 10⁻¹⁵
Porosity0.640.56
Pore diameter (m)26.4 × 10⁻⁶
Thermal conductivity in-plane (W/m/K)5.51 (only Fluent)
Thermal conductivity through-plane (W/m/K)0.51
Electric conductivity in-plane (S/m)7143 (only Fluent)
Electric conductivity through-plane (S/m)500
Tortuosity1.5 (OpenFOAM)
Table 5. Electrochemical parameters used in the simulation models.
ZSW OpenFOAM PEMFC ToolboxOpenFOAM Toolbox of Kone et al.ANSYS® Fluent PEMFC Module
Cathode reference exchange current density (A/m2)0.150.060.026
Anode reference exchange current density (A/m2)1000-10000
Anode and cathode reference concentration (kmol/m3)0.034-0.034
Anode and cathode reference temperature (K)353.15353.15353.15
Charge transfer coefficient for anode and cathode0.50.50.5
Cathode activation energy (J/mol)67 × 10367 × 10367 × 103
Anode activation energy (J/mol)17 × 103-17 × 103
Leakage current (A/m2)0-0
Table 6. RMSE in the sense of the deviation of the simulated data from the experimentally measured results.
ZSW OpenFOAM PEMFC ToolboxOpenFOAM Toolbox of Kone et al.ANSYS® Fluent PEMFC Module
U-I curve (Figure 5)12 mV52 mV28 mV
Current density curve
(Figure 7c)
0.112 A/cm20.162 A/cm20.107 A/cm2
Temperature curve
(Figure 7d)
2.44 K7.10 K0.55 K
Table 7. Comparison of computational calculation time for the original and final versions of the PEMFC toolbox and the commercial PEMFC module in ANSYS® Fluent @ 1.9 A/cm2.
ANSYS® FluentToolbox of Kone et al.Final Toolbox
Parallel core simulation using fine mesh on 20 cores2.1 h 1300 iterations-3.8 h 250 iterations
Single core simulation using coarse mesh-0.7 h 250 iterations1.7 h 250 iterations
Disclaimer/Publisher’s Note: The statements, opinions and data contained in all publications are solely those of the individual author(s) and contributor(s) and not of MDPI and/or the editor(s). MDPI and/or the editor(s) disclaim responsibility for any injury to people or property resulting from any ideas, methods, instructions or products referred to in the content.