Article

Theoretical Approaches to the Heating of an Extensive Homogeneous Plate with Convective Cooling

1
Faculty of Electrical Engineering, Czestochowa University of Technology, Al. Armii Krajowej 17, PL-42-200 Czestochowa, Poland
2
Faculty of Science & Technology, Jan Dlugosz University in Czestochowa, Al. Armii Krajowej 13/15, PL-42-200 Częstochowa, Poland
*
Authors to whom correspondence should be addressed.
Energies 2025, 18(17), 4785; https://doi.org/10.3390/en18174785
Submission received: 13 July 2025 / Revised: 14 August 2025 / Accepted: 3 September 2025 / Published: 8 September 2025
(This article belongs to the Section J1: Heat and Mass Transfer)

Abstract

The article presents a mathematical description of the thermal phenomena occurring both inside and on the surfaces of a homogeneous plate subjected to an external heat flux on one side. Analytical formulae for thermal excitation, with a given duration and constant power, are derived, enabling the determination of temperature increases on both the heated and unheated surfaces of the plate under specific heat transfer conditions to the surroundings. Convective heat transfer, with individual heat transfer coefficients on both sides of the slab, is considered; however, radiative heat loss can also be included. The solution of the problem obtained using two methods is presented: the method of separation of variables (MSV) and the Laplace transform (LT). The advantages and disadvantages of both analytical formulae, as well as the impact of various factors on the accuracy of the solution, are discussed. Among others, the MSV solution works well for a sufficiently long time, whereas the LT solution is better for a sufficiently short time. The theoretical considerations are illustrated with diagrams for several configurations, each representing various heat transfer conditions on both sides of the plate. The presented solution can serve as a starting point for further analysis of more complex geometries or multilayered structures, e.g., in non-destructive testing using active thermography. The developed theoretical model is verified for a determination of the thermal diffusivity of a reference material. The model can be useful for analyzing the method’s sensitivity to various factors occurring during the measurement process, or the method can be adapted to a pulse of known duration and constant power, which is much easier to implement technically than a very short impulse (Dirac) with high energy.

1. Introduction

Mathematics is the queen of all sciences, its favorite is truth, and simplicity and obviousness its attire […]”. This is the first excerpt from a maxim attributed to the Polish astronomer and mathematician Jan Śniadecki, who lived at the turn of the 18th and 19th centuries [1]. Its significance for other scientific disciplines is impossible to underestimate, as mathematics provides essential tools for the description and analysis of phenomena in fields such as physics, chemistry, biology and more. This is the case, for instance, with heat transfer processes, which, in the case of inhomogeneous or anisotropic materials with different geometries, boundary and initial conditions, are characterized by immense complexity [2,3,4,5], and, in most cases, their solution is possible only in an approximate manner using numerical methods [6,7]. Hence, to comprehend the fundamental phenomena, they are often simplified to more straightforward cases for which, with sufficient effort, overcoming the challenges and complexities of mathematics—as highlighted in the second part of the aforementioned sentence “…but the tabernacle of this Monarch is planted with thorns, which one must pass through; it offers no allure, except to minds devoted to truth and willing to confront difficulties”—an analytical solution may be derived [7,8,9]. Please note that this sentence may not be perfect and clear due to translation from old-fashioned Polish.
The authors were motivated to write this article by their work on modifying the widely known pulse, sometimes called the “flash” method, in the literature for determining the thermal diffusivity of solids, e.g., metal alloys [10,11] or composites [12], originally proposed by Parker [13], later developed by Watt [14] and subsequently standardized in the American ASTM E1461 standard [15]. It is based on the analytical solution of the one-dimensional heat diffusion (transient conductivity) equation, as derived by Carslow and Jaeger [16]. However, it is only valid under a number of conditions, including the shape of the heat pulse generated by the triangular-shaped laser, or the assumption—unrealizable in practice—that no heat is transferred from the test body to the environment. The complete list of assumptions specified in the standard is categorized into three groups, as follows [13,15]:
A.
  • Energy in a very thin layer absorption of pulse,
  • Homogeneity and isotropy of the slab material,
  • Invariance of the property with temperature under experimental conditions;
B.
  • Uniform absorption of the pulse at the front surface,
  • Infinitesimally short duration of the pulse;
C.
  • One-dimensional heat flow,
  • No heat loss from the surfaces of the slab.
The factors in group A are related to the properties of the test object, and for many materials, these conditions can be considered to be fulfilled. Another two factors (B) impose considerable conditions on the apparatus employed to generate the thermal excitation. They are satisfied with the laser but not with other types of heat sources encountered in practice. The final assumptions (C) justify the use of a one-dimensional model that excludes heat loss, simplifying the derivation of mathematical formulae and, consequently, the formula for diffusivity, which is based solely on a single time instant from the temperature rise curve and slab thickness. It must be acknowledged that ASTM E1461 provides methods to partially compensate for selected factors, such as non-idealities in the shape of the laser pulse or heat losses to the surroundings, particularly those from radiated energy, which become apparent in the later heating phase, especially for thick plates. However, to maintain the accuracy of the method for determining thermal diffusivity within a few percent points, or to apply it under technical conditions, the experimental conditions must be carefully analyzed each time to ensure they are as close as possible to those specified by the standard, such as the dimensions of the material sample. This fact, along with the acknowledgement of the limitations of “improvements to the method” developed over the years [17,18,19,20], justifies the need to derive a generalized analytical solution to the one-dimensional heat diffusion equation. This solution would enable the technically simpler implementation of thermal excitation in the form of a rectangular pulse with known duration and constant power, considering heat loss to the surroundings via convection, independently for both sides of the tested material—i.e., from the heated side (lamp) and the temperature measurement side (thermal imaging camera, pyrometer). Another advantage of the proposed solution should be that it allows for the determination of temperature rise in any cross-section of the plate, whether on its surfaces or within its structure.
Over decades, many researchers have put in a lot of effort and work proposing extensions to the original Parker proposal. The authors of work [21] proposed a solution using two methods: the method of separation of variables and Laplace transform (but neglecting heat losses). Degiovanni’s method considers equal heat losses on the front and rear surfaces. Using this technique, he simultaneously corrected the effect of finite pulse time and the effect of heat losses [22]. Derivation of the partial time method and the time moment method in detail was provided by [23]. Formulae for the error in determining the partial times in the presence of noise and data sampling and their effect on the diffusivity error were also given. Experimental validation of these formulae was conducted. The authors of [23] also proposed substituting different B i 1 and B i 2 values with a single Bi value. In order to perform the same correction, Degiovanni and Laurent proposed a method, which uses the 0 and −1 order temporal moments of the defined temperature range of the ascending part of the experimental curve [24]. Researchers from the Bureau National de Metrologie—Laboratoire National d’Essais in France have developed their own benchbased on the partial time moment method. Uncertainties of thermal diffusivity have been calculated according to the metrological rules given in the “Guide to the Expression of Uncertainty in Measurement” [25,26]. Chihab et al. determined thermal diffusivity, B i 1 and B i 2 in parallel. A sensitivity analysis of the model for multiple factors was also performed [27]. Formulae for both surfaces of the plate were derived using Green’s function. A method for determining diffusivity and also Biot numbers based on temperature increase curves for both walls was provided. When using IR cameras, simultaneous temperature measurement on both sides is quite cumbersome. The authors did not account for radiative losses in their model, but they did account for a finite pulse duration. As in other publications, they assumed the pulse shape to be a perfect rectangle. The model was compared with Parker’s model and Degiovanni’s partial time method (three points) [28].
The present paper has two main objectives. The first objective is to develop a low-computational-burden mathematical model of the physical behavior and discuss its properties. The second is to deliver the implementation of this model for easy dissemination and use. Two solutions are derived from scratch: one using the method of separation of variables and the other through the Laplace transform. The paper is organized as follows. Section 2 presents the assumptions and the governing equations along with a brief review of similar problems encountered in the literature. In Section 3, the main results obtained using the aforementioned methods are presented, while the derivations are provided in the Appendix A and Appendix B. In Section 4, the results are discussed and compared. Among other factors, the sensitivity of the solutions to various variables and their influence on accuracy are investigated. The mathematical model presented below is indirectly the result of authors’ experience gained in work on modeling thermal phenomena in various fields, including non-destructive testing using the thermography method [29] or electrical engineering [30]. For easier reproducibility and practical use of theoretical equations, the Matlab code was created and added as Appendix D. One of the possible applications of the developed model is the determination of thermal diffusivity using the “flash” method. Section 5 is related to the description of a preliminary experiment with the PMMA plate. A summary of the obtained results and conclusions are presented in the final section.

2. Mathematical Model

2.1. Problem Definition

The heating of a homogeneous extensive slab (Figure 1) is considered under the following assumptions:
  • The slab has constant material parameters: thermal conductivity ( λ ), specific heat ( c p ) and density ( ρ );
  • The thickness of the slab ( d ) is constant and significantly smaller than its lateral dimensions;
  • Heating occurs unilaterally and uniformly with a heat flux in the form of a rectangular pulse, having an intensity Q h and duration t h , switched on at time t = 0 ;
  • The heat transfer between the plate and its surroundings occurs via convection, with a heat transfer coefficient α 1 on the heated side and α 2 on the opposite side;
  • The initial temperature of the plate T 0 is equal to the ambient temperature T a , which is constant in both time and space.
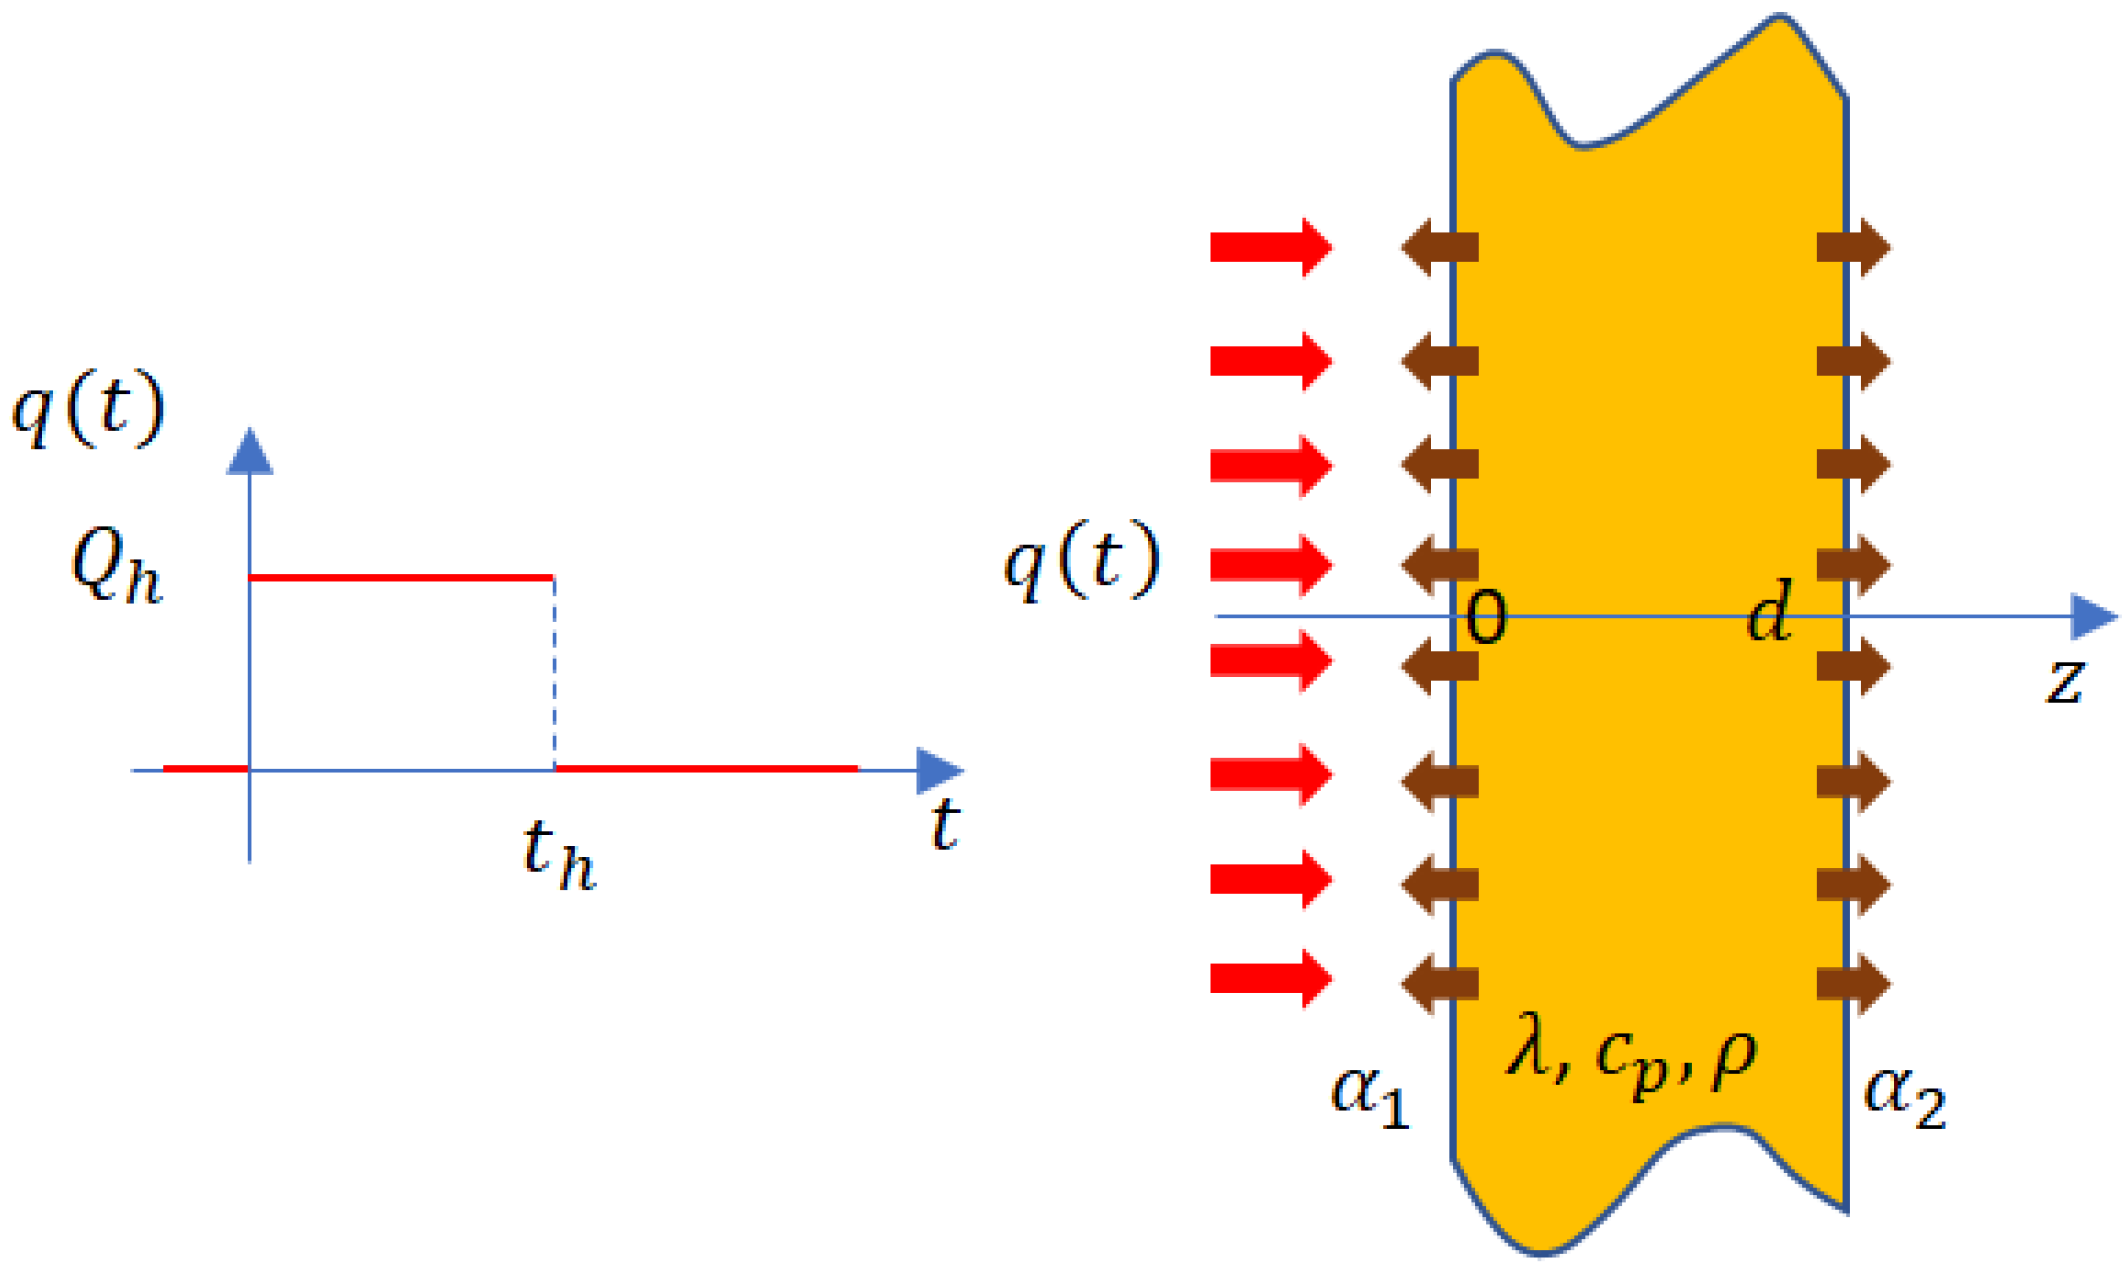
Figure 1. An extensive plate subjected to single-sided heating by a rectangular pulse (red and brown arrows symbolize heating flux and energy dissipation, respectively).
Energies 18 04785 g001

2.2. Governing Equations

Under the considered conditions, the temperature distribution in the plate is governed by the diffusion equation [31]:
2 T 1 a T t = 0 ,
where a = λ / c p ρ is the thermal diffusivity; T is the temperature; t is the time. At the heated surface (also referred to as the front surface), heat transfer occurs due to the flow of heat q t into the plate, as well as convective cooling, which is described by the following equation:
λ T n = q t + α 1 T T a ,
where the heat flux is expressed by the following formula
q t = Q h p t , t h ,                 p t , t h = 1 t 1 t t h ,
with 1 t as the Heaviside unit step function. By contrast, on the unheated surface (also referred to as the rear or back surface), heat transfer occurs only through convection:
λ T n = α 2 T T a .
The initial temperature of the plate is defined as follows:
T t = 0 = T 0 .
Originally, the heat transfer coefficients α 1 and α 2 describe convection. However, they can also be considered as substitutive heat transfer coefficients, which include radiative components, too. For example, Equation (4) could be understood as follows:
λ T n = α 2 c T T a + α 2 r T 4 T a 4 = α 2 T T a ,
where α 2 c and α 2 r are the convective and radiative heat transfer coefficients, and
α 2 = α 2 c + α 2 r T + T a T 2 + T a 2
is a substitutive heat transfer coefficient. Then, for temperature T = T a + Δ T , where Δ T T a , it follows that
α 2 = α 2 c + α 2 r T a 3 1 + 6 Δ T T a + 4 Δ T T a 2 + Δ T T a 3 α 2 c + α 2 r T a 3 .
Hence, radiation can be considered by using the substitutive heat transfer coefficient instead of the convective one. Moreover, if α 2 r is sufficiently small (e.g., for low-emissivity bodies and low temperatures), the radiation effects can be neglected. Similar considerations can be performed for Equation (2).

2.3. Literature Review for Solutions to Similar Problems

Different formulations of the problem can be found in the literature. The simplest case involves a semi-infinite slab maintained at a temperature T m , and it is discussed in many works, such as [32]. In the notation adopted here, the formula for the temperature at any point of the slab takes the following form:
T z , t = T 0 + T m T 0 erfc z 2 a t ,
where erfc x = 1 erf x   is the complementary Gaussian error function [33]. Not only does the formula neglect the finite thickness of the slab, but it also assumes a constant surface temperature at z = 0 equal to T m . The same reference also provides a formula for heating a semi-infinite plate with a constant heat flux Q h :
T z , t = T 0 + 2 Q h λ a t 1 π exp z 2 4 a t z 2 a t erfc z 2 a t .
These formulae were derived under the assumption of no convective heat transfer between the plate and the surroundings. A formula accounting for convective heat transfer can be found, for example, in [34]:
T z , t = T 0 + T m T 0   erfc z 2 a t exp α λ z + α λ 2 a t   erfc z 2 a t + α λ a t ,
where α is the heat transfer coefficient, and T m is the temperature of the step excitation on the plate surface, which is related to the heating flux Q h (it can be shown that T m T 0 = Q h / α ). By calculating the limits of the above formula as α 0 and α , we obtain Equations (7) and (6), respectively.
However, Formula (8) does not account for the finite thickness of the slab. Such a slab, with one surface held at a constant temperature T m and the other insulated, was considered, among others, in [6]. Assuming that these surfaces are z = 0 and z = d , respectively, the formula for the temperature distribution takes the following form:
T z , t = T 0 + T m T 0 1 4 π n = 1 1 2 n 1 sin 2 n 1 π z 2 d exp 2 n 1 2 π 2 4 d 2 a t .
An alternative form of this formula is given as follows:
T z , t = T 0 + T m T 0 erfc z 2 a t + n = 1 1 n erfc 2 n d + z 2 a t erfc 2 n d z 2 a t .
It is evident that as d , the last expression is simplified to Formula (6). However, Formulae (9) and (10) are not suitable for convective heat transfer, as they do not provide information regarding the heat transfer coefficient α . The case of convective heat transfer through one of the surfaces is discussed, for example, in [2,5,6,8]. Assuming that the convective exchange involves surface at z = 0 , one obtains the following:
T z , t = T 0 + T m T 0 1 n = 1 2 sin μ n μ n + cos μ n sin μ n cos μ n d z d exp μ n 2 a t d 2 ,
where μ n 0 is the n -th root of equation cot μ n = λ α d μ n , while T m is the excitation temperature. In the case of heating flux Q h , the relationship T m T 0 = Q h / α holds. When α , one obtains μ n = 2 n 1 π / 2 , and the presented equation takes the form of Formula (9). The above formula also describes the temperature distribution in a slab with thickness of 2 d , heated on both sides.
Based on the above review of the theoretical formulae related to an extensive slab, it can be seen that they do not account for the general case considered, where convective heat exchange with different coefficients is assumed on both sides of a finite-thickness slab subjected to unilateral heating in the form of a rectangular pulse of finite duration. Additionally, the proposed model enables the determination of temperature variation over time at any point in the slab (along the z -axis), thereby including both the front or back side. However, in the current version, the solution neglects the increase in air temperature in the immediate vicinity of the slab [35] and only approximates the radiative losses. The theoretical solution obtained further allows for the analysis of the influence of various factors and heating conditions encountered in measurement practice. It can also be used to adapt the well-known method for determining thermal diffusivity, as mentioned in the Introduction section and in Parker’s work, to real experimental conditions, particularly when the assumptions of no heat release to the surroundings by the tested material and thermal forcing in the form of a zero-duration pulse are not met. A pulse of constant amplitude (power) and controlled duration is technically easier to realize, allowing this method to be used under technical conditions that impose lower demands on the apparatus. In the following section, the relevant theoretical relationships will be derived.

3. Results

3.1. Preliminary Remarks

It will be useful to introduce the following designations:
T h = Q h d λ , T = d 2 a , B i 1 = α 1 d λ , B i 2 = α 2 d λ ,
with the following interpretations: temperature determining the intensity of heating, time determining the rate of the diffusion process and the Biot numbers determining the intensity of the convective heat transfer process on both sides of the plate. If z denotes the distance from the heated surface, as shown in Figure 1, then, considering the assumptions and the previously mentioned designations, the following dimensionless quantities can be introduced:
ϑ = T T 0 T h , ζ = z d , 𝓉 = t T , 𝓉 h = t h T ,
defining, respectively, the relative temperature rise above the ambient temperature, the relative distance from the heated surface, the relative time (usually referred to as the Fourier number F o ) and the relative heating time. Simple transformations allow Formulae (1), (2), (4) and (5) to be expressed in a dimensionless form, as follows:
2 ϑ ζ 2 ϑ 𝓉 = 0 , ϑ ζ ζ = 0 = B i 1 ϑ ζ = 0 p 𝓉 , 𝓉 h , ϑ ζ ζ = 1 = B i 2 ϑ ζ = 1 , ϑ 𝓉 = 0 = 0 .
By solving the above equations for ϑ ζ , 𝓉 , the theoretical value of the temperature at any point on the plate and any time can be determined:
T z , t = T 0 + T h ϑ z d , t T .
The solution to Equations (14) can be obtained using the method of separation of variables (MSV) or Laplace transform (LT) or other methods. Both approaches will be briefly outlined below, as they lead to different forms of the solution. Although mathematically equivalent, these solutions are expressed in different formulae, each characterized by distinct advantages and disadvantages that define their respective scopes of application. The solutions obtained were implemented and tested in Wolfram Mathematica, as well as in Matlab 2023a.

3.2. Solution Obtained by Method of Separation of Variables

To solve Equation (14) by employing the method of separation of variables, it is most convenient to distinguish between the heating period ( 0 < 𝓉 < 𝓉 h ) with a constant flux   Q h , in which p 𝓉 , 𝓉 h = 1 , and the post-heating period 𝓉 > 𝓉 h , in which p 𝓉 , 𝓉 h = 0 . The solution to problem (14) is then expressed as follows:
ϑ ζ , 𝓉 ; B i 1 , B i 2 = ϑ s s ζ n = 0 ϑ n cos ν n ζ β n e ν n 2 𝓉 for   0 𝓉 𝓉 h , n = 0 ϑ n cos ν n ζ β n 1 e ν n 2 𝓉 h e ν n 2 𝓉 𝓉 h for 𝓉 > 𝓉 h ,
where
ϑ s s ζ = 1 + B i 2 1 ζ B i 1 + B i 2 + B i 1 B i 2
represents the steady-state component, the constants ν n (eigenvalues) satisfy the following equation:
ν n = n π + arctan B i 1 ν n + arctan B i 2 ν n ,
the constants β n are given by the formula
β n = arctan B i 1 ν n ,
and the expansion coefficients ϑ n can be expressed as follows:
ϑ n = 2 1 ν n 1 B i 1 2 + ν n 2 B i 1 B i 1 2 + ν n 2 + B i 2 B i 2 2 + ν n 2 + 1 .
Details of the derivation for the above formulae can be found in Appendix A.
The solution obtained encompasses the cases discussed in the literature. For instance, during the heating stage, assuming no heat transfer through the rear surface ( B i 2 = 0 ), Equations (18) and (19) yield ν n = n π + β n and tan ν n = B i 1 / ν n , followed by   sin ν n = 1 n B i 1 / B i 1 2 + ν n 2 and   cos ν n = 1 n ν n / B i 1 2 + ν n 2 . Therefore, Formula (16) can be rewritten as follows:
ϑ ζ , 𝓉 ; B i 1 , 0 = 1 B i 1 1 2 n = 0 1 n sin ν n ν n + sin ν n cos ν n cos ν n ζ 1 n π e ν n 2 𝓉 .
By considering the designations (12), through the relationship cos ν n ζ 1 n π = 1 n cos ν n ζ 1 , up to the identifications T h / B i 1 = T m T 0 and ν n = μ n + 1 , we obtain Equation (11).
It is important to note that in the lossless case   B i 1 = B i 2 = 0 , the appropriate limit of Formula (16) must be adopted, as its direct application would result in division by zero. This is evident from Formula (17), which yields ϑ s s in such a case, indicating that the steady state does not exist. This is because in the absence of cooling and with continuous energy supplied by the flux Q h , the temperature would increase indefinitely over time. Although the absence of cooling is a non-physical scenario, it is reasonable to neglect cooling during the initial stage of heating. Therefore, deriving an expression for the temperature rise under these conditions would be useful. Although the obtained Solution (16) is not directly applicable in this case, it is formally correct in the limit B i 1 = B i 2 0 , as shown below:
ϑ ζ , 𝓉 ; 0,0 = 1 3 ζ + 1 2 ζ 2 + 𝓉 2 π 2 n = 1 1 n 2 cos n π ζ e n 2 π 2 𝓉 for 0 𝓉 𝓉 h , 𝓉 h + 2 π 2 n = 1 1 n 2 cos n π ζ 1 e n 2 π 2 𝓉 h e n 2 π 2 𝓉 𝓉 h for 𝓉 > 𝓉 h .
The 𝓉 term in the expression for 𝓉 < 𝓉 h denotes the unlimited temperature rise over time during the heating stage, assuming it lasts indefinitely. In contrast, the 𝓉 h term in the formula for 𝓉 > 𝓉 h denotes the steady-state component of the relative temperature rise in the absence of cooling. It corresponds to the temperature rise Δ T max = T h 𝓉 h , which represents the maximum temperature rise of the rear side of the slab. Under convective cooling conditions, it will be less than Δ T max . This value can also be expressed as Δ W h / c p m , where Δ W h = Q h S t h represents the energy supplied to the slab with mass m by its front surface S during heating for time t h .

3.3. Solution Obtained by Means of Using the Laplace Transform

The disadvantage of Solution (16) is that it requires the determination of eigenvalues ν n by solving Equation (18). Since the equation is transcendental, it can only be solved numerically. Although obtaining approximate solutions is not particularly difficult, the absence of an explicit formula is rather unsatisfactory. In addition, a significant number of terms in the series must be considered during the initial moments when 𝓉 1 (see Section 4.1.2). This can be avoided by solving Equations (14) using the Laplace transform, which leads to the following result:
ϑ ζ , 𝓉 ; B i 1 , B i 2 = 1 𝓉 n = 0 ϑ ˜ n ζ , 𝓉 1 𝓉 𝓉 h n = 0 ϑ ˜ n ζ , 𝓉 𝓉 h ,
where the components ϑ ˜ n represent the so-called heat waves. The components with even indices represent the “waves” propagating through the slab from the heated side to the unheated side after n -fold “reflection” from the boundary surfaces of the slab. In turn, the components with odd indices are “waves” traveling in the opposite direction after n -fold “reflection” from the boundary surfaces. The first sum refers to the waves generated by switching on the heating as a unit step, and the second sum refers to the waves generated by applying a negative unit step after time 𝓉 h , i.e., switching off the heating flux. These are not waves in the strict sense, as each one appears immediately; however, as n increases, the magnitude of the wave decreases. Rather, they represent the solution to Problem (14) as an expansion in terms of functions different from those given in Formula (16) obtained by the MSV. The two lowest-order waves generally take the following form:
ϑ ˜ 0 ζ , 𝓉 = 1 B i 1 erfc ζ 2 𝓉 J ζ , 𝓉 , B i 1 ,
ϑ ˜ 1 ζ , 𝓉 = 1 B i 1 erfc 2 ζ 2 𝓉 + B i 1 + B i 2 J 2 ζ , 𝓉 , B i 1 2 B i 1 J 2 ζ , 𝓉 , B i 2 B i 1 B i 2 ,
where J is an auxiliary function defined as follows
J x , 𝓉 , B i = exp B i x + B i 2 𝓉 erfc x 2 𝓉 + B i 𝓉 ,
and the complementary error function is denoted as erfc. The formulae for the subsequent waves become increasingly complex. A detailed derivation of the relationships discussed above is provided in Appendix B.
The advantage of the solution in Equation (23) is that it eliminates the need to solve the transcendental Equation (18), as the Biot numbers are explicitly incorporated into the formula. Moreover, in the initial heating period, it is sufficient to consider only the first few waves of the lowest order, as the others have not yet had a significant impact on the result. It is essential to note that ϑ ˜ 0 does not provide information regarding the cooling of the back surface or the thickness of the plate; such details are incorporated in the next waves. One disadvantage of the described approach is the increasing complexity of the formulae representing the subsequent waves. A second disadvantage is that when B i 1 and B i 2 are equal to or coincide with 0, the limits of the given formulae must be considered, as 0/0 expressions arise in such cases. For example, when B i 1 = B i 2 = B i 0 , Expression (25) becomes
ϑ ˜ 1 ζ , 𝓉 = 4 𝓉 π exp 2 ζ 2 4 𝓉 1 B i erfc 2 ζ 2 𝓉 + 1 B i 4 B i 𝓉 2 2 ζ J 2 ζ , 𝓉 , B i .
In the special case of no cooling, where B i 1 = B i 2 = 0 , all the waves assume a relatively simple form, as follows:
ϑ ˜ n ζ , 𝓉 ; 0,0 = 2 π 𝓉 K ζ n 2 𝓉 ,
where ζ n = n + 1 + 1 n 2 ζ 1 / 2 (this quantity denotes the total relative distance from the heated side considering the successive reflections from the plate boundaries), and K is an auxiliary function defined as follows:
K x = exp x 2 π x erfc x .
The case examined here includes those discussed in the literature. For example, if the plate has infinite thickness, only one wave ϑ ˜ 0 exists in the solution, as the others cannot arise (no back side, no reflection on it). In addition, if the heating time is infinite, the solution takes the form of Equation (8). In the limiting case where α 1 = 0 , Relationship (7) is obtained.

4. Discussion

4.1. Analysis of the Solution Obtained Using the Method of Separation of Variables

4.1.1. Values of the Components of the Solution

An analysis of Expression (18) reveals the relation n π ν n < n + 1 π , with ν n = n π obtained when B i 1 = B i 2 = 0 . Thus, for fixed values of the Biot numbers, successive values of ν n increase. Moreover, the eigenvalues ν n are symmetric with respect to B i 1 and B i 2 . By differentiating Equation (18) with respect to B i 1 or B i 2 , one obtains d ν n / d B i 1 > 0 , and similarly, d ν n / d B i 2 > 0 . Thus, the greater the values of B i 1 and B i 2 , the greater the value of ν n for a given n . More remarks on Equation (18) and its solution are presented in Appendix C.
It follows from Expression (19) that 0 β n < π / 2 , with   β n = 0 for B i 1 = 0 . By calculating the derivatives of β n with respect to B i 1 and B i 2 , one obtains a positive and a negative value, respectively (assuming B i 1 > 0 ). Thus, the value of β n increases as B i 1 increases and decreases as B i 2 increases (assuming B i 1 > 0 ). Since ν n + 1 > ν n , the relation β n + 1 β n holds for fixed values of the Biot numbers, and β n 0 as n .
By analyzing the values of coefficients ϑ n defined in Equation (20), it can be observed that for fixed Biot numbers, they decrease as n increases. For zero Biot numbers, the values are 2 / n 2 π 2 , and they decrease as the Biot numbers increase. The steady-state component ϑ s s also decreases, which is expected, as larger Biot numbers lead to stronger cooling, and therefore, a smaller temperature rise.

4.1.2. Analysis of the Truncation Error in Solution (16)

The numerical calculations based on Equation (16) require truncation of the infinite series to a finite number of terms, which introduces a numerical error. Let ϑ N denote Solution (16), with the series truncated to N terms (from 0 to N 1 ). Figure 2a,b present the waveforms of ϑ N on the front and back side, respectively, for the exemplary values of Biot numbers and several values of N . It follows that the shorter the time from the start of heating, the more terms of the series must be considered. The successive terms of Solution (16) for 𝓉 < 𝓉 h take the form ϑ n cos ν n ζ β n exp ν n 2 𝓉 . Taking into account that ϑ n > 0 , exp ν n 2 𝓉 > 0 , cos β n > 0 , cos ν n β n ~ 1 n (see Formulae (A4) and (A5)), it can be concluded that all terms of the series are positive on the front surface, whereas consecutive terms on the back surface alternate in signs (alternating series). Inside the plate ( 0 < ζ < 1 ), some terms of the series will be positive, while others will be negative. Therefore, for the same value of N , the truncation error is greatest on the front surface and smallest on the rear surface.
Since the successive terms of the series contain the factor exp ν n 2 𝓉 , they decrease rapidly over time, and the rate of decrease increases as n grows. Therefore, the largest error due to truncation of the series will occur at 𝓉 = 0 . Hence, the estimate of the absolute error in the value of ϑ N during the heating stage is
e ϑ = ϑ N ζ , 𝓉 ϑ ζ , 𝓉 ϑ N ζ , 0 ϑ ζ , 0 = 0 = ϑ s s ζ n = 0 N 1 ϑ n cos ν n ζ β n .
The value of this expression, as a function of the number of terms N , for selected values of the Biot numbers is illustrated in Figure 2c. It shows that the value of e ϑ is clearly greater on the front surface compared to the back surface. The error on the front surface is positive (truncation of the series leads to an underestimation). In contrast, on the back surface, it alternates between positive and negative, resulting in alternating underestimation or overestimation. As the number of terms N increases, the absolute value of the series’ truncation error decreases at a relatively slow rate. This indicates that for very small values of 𝓉 , a considerable number of terms must be included. However, as time increases, the error decreases rapidly due to the factors exp ν n 2 𝓉 .
Figure 2c demonstrates that as the values of the Biot numbers decrease, the series’ truncation error increases. As shown in Section 4.1.1, smaller Biot numbers lead to smaller values of eigenvalues ν n , resulting in a slower attenuation of the transient components, which include factors exp ν n 2 𝓉 , and consequently, a larger truncation error for a given 𝓉 . Moreover, smaller values of Biot numbers are associated with larger values of the coefficients ϑ n , leading to a larger value of the truncated elements of the series. As a result, smaller Biot numbers correspond to larger truncation errors for a given N .
Analogous analysis of the initial moments after switching off the heating flux leads to similar conclusions. The error arising from truncation of the series for 𝓉 > 𝓉 h will reach its maximum at time 𝓉 h + (cf. Figure 2a,b). Thus, it can be concluded that the absolute error of series’ truncation is greatest at the front side, shortly after the heating flux is switched on or off. However, it decreases rapidly over time, and the rate of this decrease is faster for higher values of the Biot numbers.

4.2. Analysis of the Solution Represented by Heat Waves

4.2.1. Influence of Successive Waves on the Solution Presented in Equation (23)

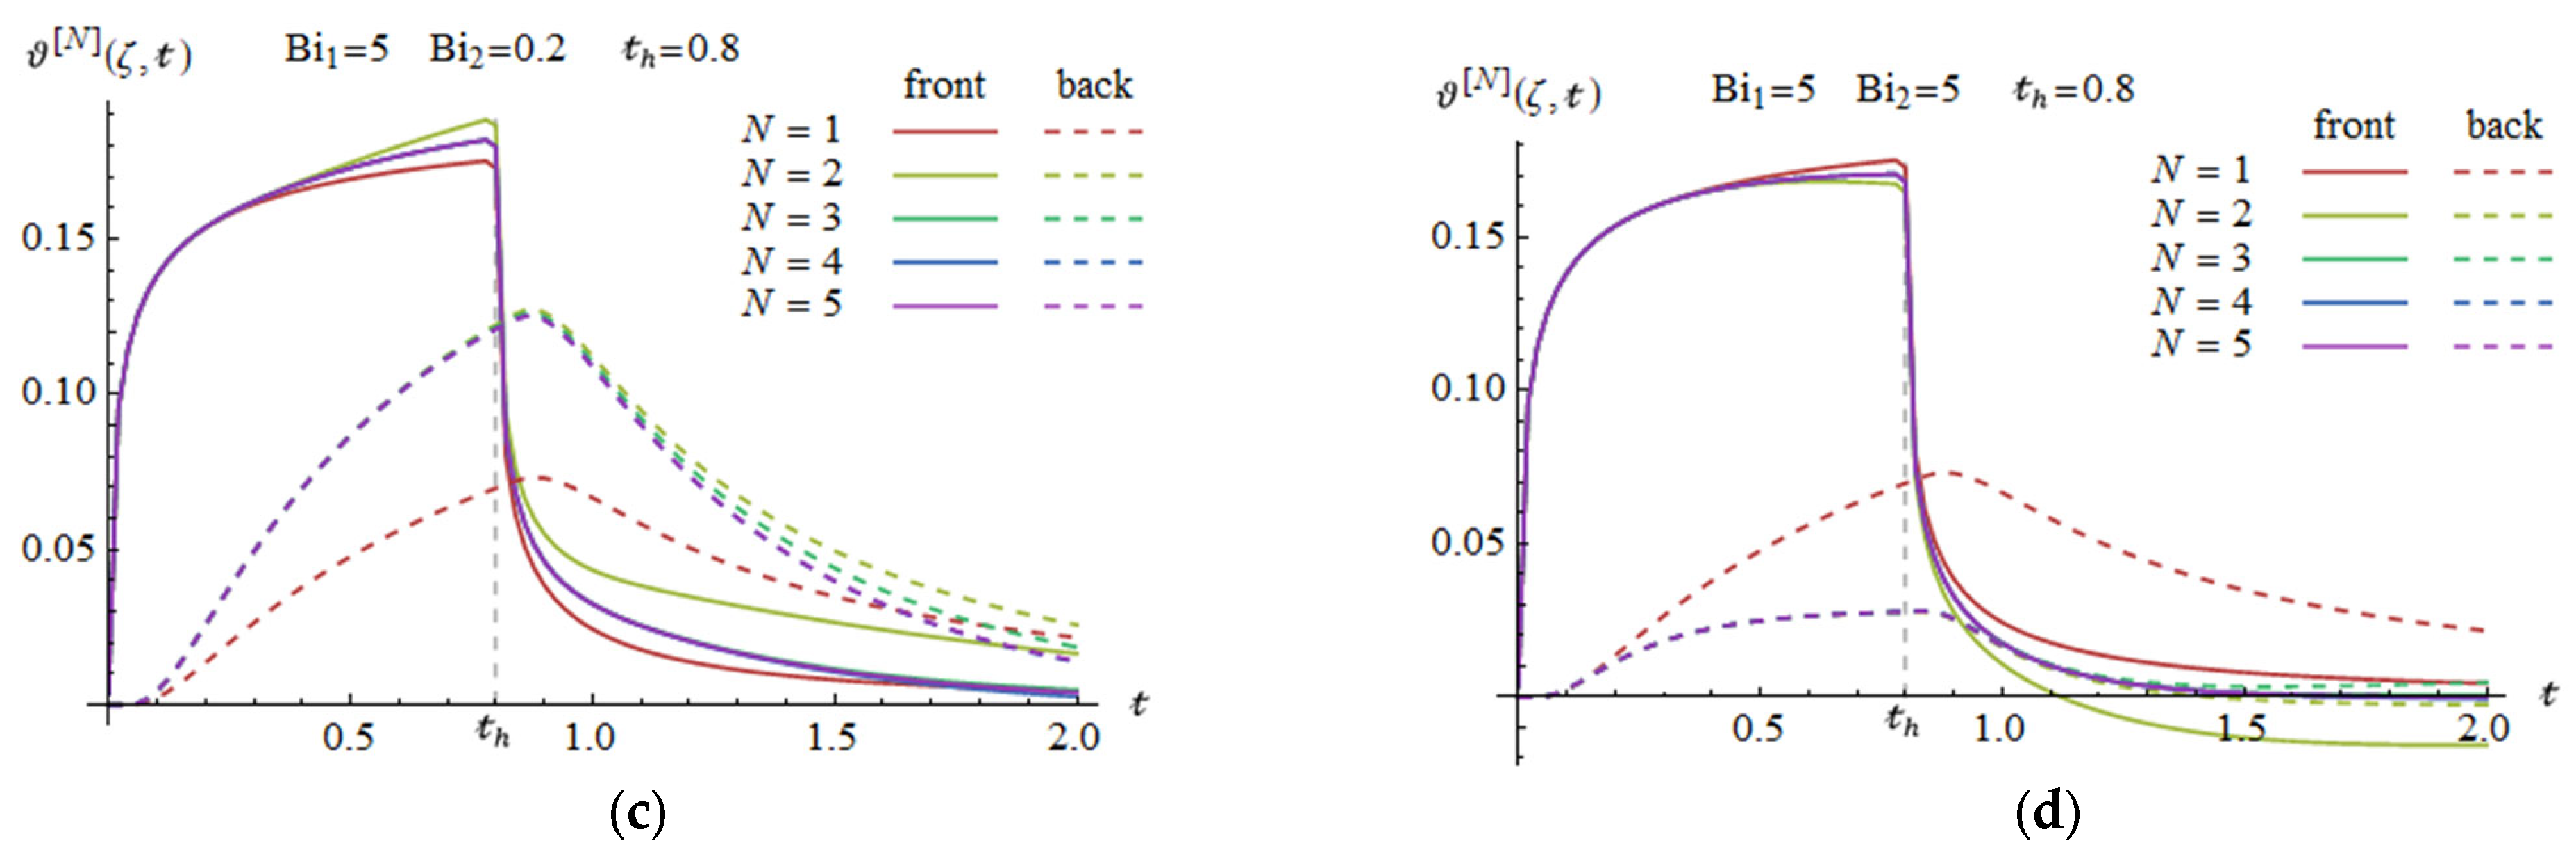
The numerical calculations based on Equation (23) can only consider a finite number of waves. Let ϑ N denote the solution containing the N lowest-order waves (from 0 to N 1 ). Figure 3 shows the waveforms ϑ N on the plate surfaces for various values of N for selected values of Biot numbers, corresponding to weak or strong cooling of the front and back surfaces. It can be observed that the corrections made by successive waveforms become significant as time increases; moreover, for a given time, the successive waveforms become smaller. For sufficiently small times 𝓉 on the front surface, considering only a zero-order wave is sufficient, while on the rear surface, a wave of order 1 must be considered additionally. As time 𝓉 grows, more waves must be considered. Under the specified conditions, the traces for N = 4 and N = 5 virtually coincide, i.e., the wave values ϑ ˜ n for n 5 are negligibly small. As a result, the approximation ϑ 5 can be considered a sufficiently accurate approximation of the exact value of   ϑ .
As shown in Figure 3, the differences between the graphs of ϑ N = 5 and ϑ N < 5 are more significant in cases with smaller Biot numbers. This means that the impact of successive waves becomes greater as the values of B i 1 and B i 2 decrease. Furthermore, by comparing the differences ϑ 1 ϑ 5 for a fixed time on the front and back surfaces, it can be seen that they are smaller on the front surface (the difference between the brown and purple continuous lines is smaller than that between the corresponding dashed lines), whereas the differences ϑ 2 ϑ 5 are smaller on the back surface (the difference between the dark yellow and purple continuous lines is greater than that between the corresponding dashed lines). In general, an odd number of lowest-order wavelets causes a smaller error on the front surface than on the back surface, whereas an even number of wavelets has the opposite effect. This can be explained by the fact that even order waves propagate toward the rear surface, and truncation of even-order and higher-order waves consequently has a stronger effect on the front surface than on the rear surface. Similarly, odd-order waves propagate toward the front surface, which results in their greatest impact on the rear surface.

4.2.2. Approximations for Short Times

In order to analyze the behavior of ϑ for 𝓉 1 , it is useful to apply the solution expressed by the ϑ ˜ n waves. However, the mathematical form of these waves is complex. Therefore, the expressions for the individual waves can be expanded into power series with respect to 𝓉 . If n = 0 and ζ = 0 , one obtains
ϑ ˜ 0 0 , 𝓉 = 𝓉 π 2 π u + 4 3 u 2 π 2 u 3 + 8 15 u 4 π 6 u 5 + O u 6 ,
where u = B i 1 𝓉 , and if n > 0 or ζ > 0 , then
ϑ ˜ n ζ , 𝓉 = 𝓉 π exp 1 u n u n 3 + n + c n B i 1 + n + s n B i 2 ζ n 2 u n 2 + O u n 3
where u n = 4 𝓉 / ζ n 2 , c n = cos 2 n π / 2 = 1 + 1 n / 2 , s n = sin 2 n π / 2 = 1 1 n / 2 .
However, it should be emphasized that the second expansion is only sufficiently accurate for very small values of 𝓉 , when the corresponding value of u n is sufficiently small. The above power series indicate that during the initial heating period, the value of the wave ϑ ˜ 0 ( 0 , 𝓉 ) is proportional to 𝓉 , whereas for n > 0 or ζ > 0 , the value of the wave ϑ ˜ n is proportional to 𝓉 3 / 2 exp ζ n 2 / 4 𝓉 , and thus, it effectively approaches zero.

4.2.3. Numerical Evaluation of the Function J

To calculate the value of J ζ n , 𝓉 , B i given by Equation (26), it is necessary to calculate exp B i ζ n + B i 2 𝓉 and erfc ζ n / 2 𝓉 + B i 𝓉 and then multiply them. This does not pose any difficulties, provided that the arguments of the exp and erfc functions are sufficiently small.
However, when the arguments are larger, this may be problematic. The reason is that the erfc of larger arguments approaches zero, and numerical evaluation may result in a value of zero due to the finite length of real number representation in computers. In such cases, the evaluation of J is likely to fail. Additionally, the evaluation of exp may result in numerical overflow. For example, suppose that B i = 100 , ζ n = 1 , and 𝓉 = 4 . The arguments of exp and erfc are then 40,100 and 200.25, respectively, and their values are approximately 1.62∙1017,415 and 1.64∙10−17,418, respectively. Such numbers typically cannot be represented in computers; therefore, the computations will fail, causing computation failure. However, the value of J is around 0.0026.
The example presented above highlights the importance of carefully evaluating the J value. For sufficiently large values of the argument of the erfc function, it is recommended that the asymptotic expansion of   erfc x e x 2 / π x for   x be employed. By applying this to Equation (26), the following result is obtained:
J ζ n , 𝓉 , B i 2 𝓉 π 2 B i 𝓉 + ζ n exp ζ n 2 4 𝓉               for             ζ n 2 𝓉 + B i 𝓉 .
The relative error of this approximation is less than 0.5% for ζ n / 2 𝓉 + B i 𝓉 > 10 .

4.3. Comparison of the Two Solutions

Formulae (16) and (23) are mathematically rigorous, allowing for the study of the temperature course at any point of the slab at any time, for various convective cooling conditions on both sides. However, their mathematical features differ, as demonstrated in Table 1.
The solution provided by MSV, as presented in Equation (16), takes a simple mathematical form; however, it requires solution of the transcendental Equation (18) for different values of B i 1 and B i 2 . In contrast, the solution derived from the Laplace transform, as described in Equation (23), contains heat waves characterized by a complex mathematical form, but the parameters B i 1 and B i 2 are explicitly present in the solution.
Although the resulting expressions are correct for any time instant 𝓉 0 , depending on the time considered, one expression proves to be more convenient than the other one. For small values of 𝓉 , the heat-wave solution may be more convenient, as only a few heat waves of the lowest order need to be included; the others have not yet had sufficient time to significantly affect the result. Solution (16), by contrast, may require the inclusion of many terms, with the number of terms growing as the value of relative time 𝓉 becomes smaller and smaller. This is visible in Figure 2, where the relationship between the number of terms of the series (16) and the relative error of the solution is presented. The opposite situation occurs for large values of time 𝓉 . The solution (16) becomes more efficient because functions exp ν n 2 𝓉 decrease rapidly over time, causing successive terms to become less significant. As a result, the series can be truncated to a few terms. As time passes, Formula (23) requires the consideration of additional waves, as the values of higher-order waves may be significant, particularly for small values of B i 1 and B i 2 (see Figure 3).

4.4. Effect of Cooling Conditions on Relative Temperature Rise

4.4.1. Curves of Relative Temperature Rise on Slab Surfaces

Figure 4 presents plots of the relative temperature rise on the front surface ( ζ = 0 ) and rear surface ( ζ = 1 ) for selected parameter values. During the initial heating phase, the relative temperature rise, ϑ , on the front surface is large, being proportional to 𝓉 , while on the rear surface in the initial moments, ϑ 0 , indicating a clear delay in the temperature change.
In the heating stage, for B i 1 = B i 2 = 0 , the relative temperature rise increases asymptotically with the relative time 𝓉 in a linear manner, as presented in Equation (22). When the heating flux is switched off, the relative temperature rise asymptotically approaches a fixed value equal to 𝓉 h . However, if at least one of the Biot numbers is non-zero, energy dissipation occurs, and once the heating ends, the relative temperature rise asymptotically declines to zero over time. It should be noted that swapping the roles of B i 1 and B i 2 generally alters the value of ϑ at each point on the plate, but it has no impact on the back side temperature, i.e., ϑ 1 , 𝓉 ; B i 1 , B i 2 = ϑ 1 , 𝓉 ; B i 2 , B i 1 , as demonstrated by the analysis of Equation (16).
Furthermore, Figure 4b clearly shows that the relative temperature rise at the rear surface reaches maximum ϑ 1 max after time 𝓉 1 max > 𝓉 h . The values of 𝓉 1 max and ϑ 1 max increase as the Biot numbers decrease. In the limiting case, when B i 1 = B i 2 = 0 , 𝓉 1 max = and ϑ 1 max = 𝓉 h are obtained. Figure 5 shows the effect of heating time ( 𝓉 h ) and cooling conditions on 𝓉 1 max and ϑ 1 max under the assumption B i 1 = B i 2 = B i . As presented in Figure 5a, for short heating pulses ( 𝓉 h < 0.1 ) and relatively low cooling intensity ( B i < 10 ), the time 𝓉 1 max is approximately inversely proportional to log B i . In turn, in Figure 5a, it can be observed that under low cooling conditions ( B i < 0.1 ), the maximum temperature rise ϑ 1 max is close to 𝓉 h .

4.4.2. Temperature Differences Between the Front and Rear Sides

Figure 6 illustrates the difference in the relative temperature rise between the front and rear surfaces, i.e., Δ ϑ = ϑ ζ = 0 ϑ ζ = 1 , for several heating pulse durations 𝓉 h . Four cases corresponding to different cooling conditions were considered: (a) weak cooling of both sides; (b) weak cooling of the front side and strong cooling of the back side; (c) strong cooling of the front side and weak cooling of the back side; and (d) strong cooling of both sides. During the heating stage, the temperature of the front side is greater than that of the rear side, i.e., Δ ϑ > 0 . The weaker the cooling of the heated side, the higher the value of Δ ϑ (cf. cases (a) versus (c) and (b) versus (d)). Furthermore, as the cooling of the back side becomes stronger, the value of Δ ϑ increases (cf. cases (b) versus (a) and (d) versus (c)). This can be explained by the fact that weaker cooling of the front side causes a greater increase in the temperature of the heated side, whereas strong cooling of the rear side leads to a smaller increase in the temperature of the rear side, thereby resulting in larger temperature differences on both sides of the plate. The temperature equalization process occurs most rapidly under the conditions of strong, uniform cooling of the plate (case (d)—purple line), whereas it is slowest when significant differences exist between the cooling conditions of the two surfaces of the plate (cases (b) and (c)).
When the heating flux is switched off ( 𝓉 > 𝓉 h ), the temperature of the front surface decreases rapidly, while the temperature of the rear surface continues to rise due to thermal inertia and then decreases. After a certain time period, the temperature equalizes on both sides of the slab ( Δ ϑ 0 ) and reaches ambient temperature ( ϑ 0 ) . If B i 1 B i 2 , the equalization occurs at a non-negative value of Δ ϑ (cf. cases (a), (b) and (d)). However, for B i 1 > B i 2 , strong cooling of the front surface and weak cooling of the rear surface may lead to a temperature inversion over time ( Δ ϑ < 0 , cf. case (c)). Temperature equalization occurs most rapidly under the conditions of strong bilateral cooling (case (d)). On the other hand, the process is slowest when there is a substantial difference in the cooling conditions between both sides of the slab (cases (b) and (c)).

5. Experimental Verification—Estimation of Thermal Diffusivity

To verify the mathematical model, it was used to determine thermal diffusivity. The idea is to use the measured temperature curve and find such parameter values of the model that best fit the measurements. However, a practical use of the presented model requires the knowledge of several parameters, including Biot numbers, which are often unknown. As a result, it is necessary to search “blind” through many combinations of model parameters for which the curve best fits the measurement curve. A consequence of this is the need for a computer implementation of the model. To ease the measurement, the model given in Equations (15)–(20) was implemented as Matlab code (see Appendix D), and some measurements with the PMMA material were conducted. The value of the thermal diffusivity coefficient of the test sample was a = 0.115·10−6 m2/s, determined in reference laboratories of CUT and JDUC universities. The unknown sought parameters, i.e., a and Biot numbers B i 1 and B i 2 , were determined using a curve fitting method. An example of temperature change and normalized temperature for the case of a lamp on 100% power (i.e., 2500 W), 10 s heating time and plate thickness d = 2.1 mm is shown in Figure 7. The sampling frequency was ca. 30 Hz. The heating phase was followed by the cooling phase, with a visible effect of heat loss (the descending part of the curve). The uncertainty of thermal diffusivity estimation was −4.5% when using the MSV solution.

6. Summary

The main result of the study is the formulation of a mathematically rigorous solution expressed in two forms, allowing for the analysis of temperature values at any point of the plate at any given time for different convection cooling conditions on both sides. By comparing the mathematical properties of the two solutions, the following conclusions can be drawn:
  • The solution obtained by applying the MSV is mathematically uncomplicated, whereas the solution described by heat waves is highly complex, especially for higher-order waves;
  • In the limiting case of non-cooling conditions, both solutions require the use of a specific form; moreover, the heat-wave solution also demands a specific form if the cooling conditions are identical on both sides of the plate;
  • The truncation error of the number of terms in the solution obtained by applying the MSV decreases rapidly over time after the heating pulse is switched on or off; therefore, the solution is most appropriate for sufficiently long times after the last change in boundary conditions;
  • The wave number truncation error increases over time after the heating pulse is switched on; as a result, this solution is most effective for times that are sufficiently short after the first change in boundary conditions;
  • The truncation error in both cases increases as the Biot numbers become smaller;
  • The truncation error in the MSV method is smaller on the back side.
Furthermore, analysis of the relative temperature rise in the slab leads to the following conclusion:
  • The temperature value at the rear surface remains invariant due to the B i 1 B i 2 swap;
  • The time required to reach maximum on the rear surface and the value of this maximum decrease as the Biot numbers increase;
  • The temperature equalization between the slab sides occurs more slowly as the difference between the Biot numbers becomes greater.
The conclusions drawn from the above theoretical considerations can be useful in heat transfer analysis of more complex systems considered in areas of non-destructive testing (NDT) using active infrared thermography for material inspection in reflection or transmission mode, depending on the possibility to excite and observe material sides, although this would be a challenging task. For known thermal diffusivity of the tested material, the thickness of the plate or its loss, treated as a flaw, can be estimated easily. Another potential application involves using the developed models to determine thermal diffusivity, as mentioned in the Introduction section of this article. The models consider both the heating and cooling stages of the material, with a specified time of thermal excitation. The value of thermal diffusivity can be determined by fitting the experimental curves with the model curves for the front or back surface of the tested material even if Biot numbers are unknown. Such experimental studies confirming the practical value of the obtained formulae and conclusions are currently in progress as a part of research project entitled “Standardisation of defect dimensioning procedure by active infrared thermography” (Supplementary Materials), and some exemplary results are presented in this paper. In general, more results and a discussion will be presented in our future paper.

Supplementary Materials

The following supporting information can be downloaded at: https://polskametrologia.pcz.pl/en/—project objectives and progress (accessed on 1 July 2025).

Author Contributions

Conceptualization, S.G. and T.K.; methodology, P.J. and T.K.; formal analysis, W.M.; writing—original draft preparation, P.J.; writing—review and editing, S.G. and W.M.; visualization, P.J.; supervision, W.M.; project administration, S.G. All authors have read and agreed to the published version of the manuscript.

Funding

The work was financed by the state budget funds allocated by the Minister of Education and Science (Poland) under the “Polish Metrology II” framework. The project number is PM-II/SP/0003/2024/02 with a total grant of PLN 910,690.00.

Data Availability Statement

Data are available upon request due to restrictions. The data presented in this study are available upon request from the corresponding author due to the ongoing research project and doctoral dissertation.

Conflicts of Interest

The authors declare no conflicts of interest. The funders had no role in the design of the study; in the collection, analyses, or interpretation of data; in the writing of the manuscript; or in the decision to publish the results.

Appendix A. Derivation of Formulae (16) and (22)

The standard MSV procedure leads to the following general solution of the first Equations (14):
ϑ ζ , 𝓉 = A 0 + B 0 ζ + ν 0 A ν cos ν ζ + B ν sin ν ζ exp ν 2 𝓉 ,
where A 0 , B 0 , A ν , B ν and ν are arbitrary expressions independent of ζ and 𝓉 . If 𝓉 < 𝓉 h , then the boundary condition for ζ = 0 yields B 0 = A 0 B i 1 1 and ν B ν = B i 1 A ν . By substituting B i 1 / ν = tan β , the solution is expressed as
ϑ ζ , 𝓉 = A 0 + A 0 B i 1 1 ζ + ν 0 A ν cos β cos ν ζ β exp ν 2 𝓉 .
In the next step, the boundary condition for ζ = 1 results in the following relationships:
A 0 = 1 + B i 2 B i 1 + B i 2 + B i 1 B i 2 ,                     tan ν β = B i 2 ν .
The latter Equation can be transformed into Equation (18), leading to the solution given by Equation (16) for 𝓉 < 𝓉 h , where ϑ s s ζ and β n are defined by Equations (17) and (19), respectively, and ϑ n = A ν n / cos β n . Then, the zero initial condition yields ϑ s s ζ = n = 0 ϑ n cos ν n ζ β n . The expansion of ϑ s s ζ into Fourier series with respect to the orthogonal sequence cos ν n ζ β n leads to Formula (20) for the coefficients ϑ n . The following relationships can be helpful in the analysis of the solution:
sin β n = B i 1 B i 1 2 + ν n 2 ,                   cos β n = ν n B i 1 2 + ν n 2 ,
sin ν n β n = 1 n B i 2 B i 2 2 + ν n 2 ,                 cos ν n β n = 1 n ν n B i 2 2 + ν n 2 .
In turn, for 𝓉 > 𝓉 h , the general solution takes the form given by Equation (A1); however, the boundary conditions lead to the conclusion that A 0 = 0 . The constant of separation of variables, ν , satisfies the second Equation (A3), and as a result, the eigenvalues ν n are identical to those for 𝓉 < 𝓉 h . Considering the continuity of temperature for 𝓉 = 𝓉 h across the plate, this finally leads to Equation (16).
Formula (22) can be obtained by setting B i 1 = B i 2 = ϵ and considering the limit of Expression (16) when ϵ 0 . Using arctan x x x 3 / 3 for   x 1 , we obtain the approximations ν 0 2 ϵ 1 ϵ / 12 and β 0 2 ϵ 1 + ϵ / 12 / 2 . Regarding n > 0 , we have ν n n π + 2 ϵ / n π and β n ϵ / n π . After considering the above and calculating the limit of Expression (16) when   ϵ 0 , Formula (22) is derived.

Appendix B. Derivation of Formula (23)

Application of the Laplace transform to Equations (14) yields:
2 Θ ζ 2 s Θ = 0 , Θ ζ ζ = 0 = B i 1 Θ ζ = 0 P s , Θ ζ ζ = 1 = B i 2 Θ ζ = 1 ,
where Θ ζ , s = L ϑ ζ , 𝓉 , P s = L p 𝓉 , 𝓉 h = 1 e s 𝓉 h / s . The general solution of the first Equation is presented as follows:
Θ ζ , s = A e s ζ + B e s ζ ,
where A and B are arbitrary expressions that are independent of ζ . By introducing boundary conditions, we obtain
Θ ζ , s = P s s s + B i 1 e s ζ + Γ 2 e 2 ζ s 1 Γ 1 Γ 2 e 2 s ,
where
Γ 1 = s B i 1 s + B i 1 , Γ 2 = s B i 2 s + B i 2 .
Determination of the inverse transform of Expression (A8) involves considerable complexity. Two approaches are available: (a) determining all poles and their residues; (b) using the formula for the sum of a geometric series. It can be demonstrated that the expression obtained using method (a) is identical in form to that obtained using MSV (Equation (16)). On the other hand, in method (b), using the formula 1 q 1 = l = 0 q l for the sum of an infinite geometric series and assuming   q = Γ 1 Γ 2 e 2 s , Expression (A8) can be rewritten in the following form:
Θ ζ , s = l = 0 Γ 1 l Γ 2 l P s s + B i 1 e 2 l + ζ s + l = 0 Γ 1 l Γ 2 l + 1 P s s + B i 1 e 2 l + 2 ζ s .
It is convenient to introduce the designations as follows:
Θ 2 l = P s Γ 1 l Γ 2 l s + B i 1 e 2 l + ζ s , Θ 2 l + 1 = P s Γ 1 l Γ 2 l + 1 s + B i 1 e 2 l + 2 ζ s ,
Therefore, we obtain Θ ζ , s = n = 0 Θ n . Each individual term Θ n is interpreted as a heat wave. Waves with even numbers ( n = 2 l ,   l = 0,1 , 2 , ) propagate from the heated surface to the unheated one, while waves with odd numbers ( n = 2 l + 1 ,   l = 0,1 , 2 , ) propagate in the opposite direction. The primary wave Θ 0 ζ ,   s can be rewritten as
Θ 0 ζ , s = P s s + B i 1 t h e   a m p l i t u d e   o n t h e   f r o n t   s i d e   × e ζ s . t h e   a t t e n u a t i o n   w h e n   t r a v e l i n g   t o w a r d t h e   b a c k   s i d e
Its value decreases as ζ increases, ultimately reaching   Θ 0 1 , s = P s e s / s + B i 1 on the rear surface. Part of the heat transported by this wave is released to the surroundings (if B i 2 > 0 ), while the remainder is reflected and travels back toward the heated surface. This interpretation is confirmed by the following form of the first-order reflected wave:
Θ 1 ζ , s = P s s + B i 1 t h e   a m p l i t u d e   o n   t h e   f r o n t   s i d e × e s i s   d e c r e a s e d o n   t h e   b a c k   s i d e × Γ 2 a n d   r e f l e c t e d o n   t h e   b a c k   s i d e × e 1 ζ s . a n d   a t t e n u a t e d w h e n   t r a v e l i n g   b a c k t o   t h e   f r o n t   s i d e
Similarly, further components can be analyzed. The relationships Θ 2 l + 1 = Θ 2 l 1 , s Γ 2 e 1 ζ s and Θ 2 l = Θ 2 l 1 0 , s Γ 1 e ζ s are satisfied, demonstrating that successive waves reflect from the front and back surfaces with reflection coefficients Γ 1 and Γ 2 , respectively. This produces a sequence of waves propagating forward (away from the heated surface) and backward (toward the heated surface). The successive waves are attenuated due to an exponential factor related to the total distance they travel and the fact that only part of the wave is reflected. Therefore, the successive waves show a continuous decrease in their values.
In order to determine the time-domain form of the heat waves, we begin by using the time delay theorem. Since   P s = 1 e s 𝓉 h / s , we obtain the originals of the subsequent waves:
ϑ n ζ , 𝓉 = ϑ ˜ n ζ , 𝓉 1 𝓉 ϑ ˜ n ζ , 𝓉 𝓉 h 1 𝓉 𝓉 h ,
where 1 𝓉 is the Heaviside unit step, and ϑ ˜ n ζ , 𝓉 = L 1 Θ ˜ n ζ , s , with
Θ ˜ 2 l ζ , s = Γ 1 l Γ 2 l s s + B i 1 e 2 l + ζ s ,               Θ ˜ 2 l + 1 ζ , s = Γ 1 l Γ 2 l + 1 s s + B i 1 e 2 l + 2 ζ s .
By adding up all the waves ϑ n ζ , 𝓉 , Formula (23) is obtained.
To find functions ϑ ˜ n , the Efros theorem can be used [36,37]: if τ is a constant, L 1 G s e τ p s = g 𝓉 , τ , and L 1 F s = f 𝓉 , then
L 1 G s F p s = 0 g 𝓉 , τ f τ d τ .
This represents a generalization of the convolution transform theorem, which is obtained for p s = s . In the case of Θ ˜ n waves, it is assumed that G s = 1 / s and p = s , which results in g 𝓉 , τ = exp τ 2 / 4 𝓉 / π 𝓉 [38] and F p = K n p e ζ n p , where
ζ n = n + ζ ,             K n = 2 l p = p B i 1 l p B i 2 l p p + B i 1 l + 1 p + B i 2 l
for forward waves ( n = 2 l ), and
ζ n = n + 1 ζ ,             K n = 2 l + 1 p = p B i 1 l p B i 2 l + 1 p p + B i 1 l + 1 p + B i 2 l + 1
for backward waves ( n = 2 l + 1 ).
Using the time delay theorem again, we obtain f 𝓉 = L 1 F p = k n 𝓉 ζ n 1 𝓉 ζ n , where k n 𝓉 = L 1 K n p . Since K n p is a rational function of p , its inverse Laplace transform can be effectively expressed using the residue theorem, as shown below:
k n 𝓉 = p r e s p = p K n p e p 𝓉 ,
where the summation involves all poles p of function K n p . Consequently, Formula (A16) yields
ϑ ˜ n ζ , 𝓉 = 1 π 𝓉 ζ n k n τ ζ n exp τ 2 4 𝓉 d τ = p ϑ ˜ n p ζ , 𝓉 ,
where
ϑ ˜ n p ζ , 𝓉 = 1 π 𝓉 ζ n r e s p = p K n p e p τ ζ n exp τ 2 4 𝓉 d τ .
In the last formulae, the lower limit of integration is changed from 0 to ζ n because f τ = 0 for τ < ζ n . If the multiplicity of the pole p equals m , then, using the residuum formula and changing the order of integration and differentiation, we obtain
ϑ ˜ n p ζ , 𝓉 = 1 m 1 !   d m 1 d p m 1   K n p p p m 1 π 𝓉 ζ n exp p τ ζ n τ 2 4 𝓉 d τ p = p .
It should be emphasized that if m = 1 , the differentiation is omitted, and if m < 1 , the whole expression equals 0. The integral occurring in this expression can be calculated by expressing the exponent as τ 2 p 𝓉 2 / 4 𝓉 + p 2 𝓉 p ζ n and then substituting u = τ 2 p 𝓉 / 2 𝓉 . This results in the following:
1 π 𝓉 ζ n exp p τ ζ n τ 2 4 𝓉 d τ = exp p 2 𝓉 p ζ n 2 π u n e u 2 d u = exp p 2 𝓉 p ζ n erfc ζ n 2 𝓉 p 𝓉 = J ζ n , 𝓉 , p ,
where function J is given by Formula (26). Thus,
ϑ ˜ n p ζ , 𝓉 = 1 m 1 !   d m 1 d p m 1 K n p p p m J ζ n , 𝓉 , p p = p .
Function K n p has three poles: p 0 = 0 (single), p 1 = B i 1 ( l + 1 -fold) and p 2 = B i 2 ( l -fold for K 2 l and l + 1 -fold for K 2 l + 1 ). Thus, the respective expressions for the forward and backward waves are described by the following formulae:
ϑ ˜ 2 l ζ , 𝓉 = 1 B i 1 erfc ζ 2 l 2 𝓉 + 1 l !   d l d p l   p B i 1 l p B i 2 l p p + B i 2 l J ζ 2 l , 𝓉 , p p = B i 1 + 1 l 1 !   d l 1 d p l 1   p B i 1 l p B i 2 l p p + B i 1 l + 1 J ζ 2 l , 𝓉 , p p = B i 2 ,
ϑ ˜ 2 l + 1 ζ , 𝓉 = 1 B i 1 erfc ζ 2 l + 1 2 𝓉 + 1 l !   d l d p l   p B i 1 l p B i 2 l + 1 p p + B i 2 l + 1 J ζ 2 l + 1 , 𝓉 , p p = B i 1 + 1 l !   d l d p l   p B i 1 l p B i 2 l + 1 p p + B i 1 l + 1 J ζ 2 l + 1 , 𝓉 , p p = B i 2 .
Substituting l = 0 in the above expressions, Formulae (24) and (25) are obtained, respectively. They are correct, provided that all three poles 0, B i 1 , B i 2 are different; otherwise, the multiplicity of the poles must be adjusted accordingly. For example, if B i 1 = B i 2 = B i > 0 , one obtains
ϑ ˜ n ζ , 𝓉 = 1 n B i erfc ζ n 2 𝓉 + 1 n !   d n d p n   p B i n p J ζ n , 𝓉 , p p = B i ,
and if B i 1 = B i 2 = 0 , then   K n p = p 2 , which means that there is only one pole p = 0 with a multiplicity of 2. As a result, all waves take the form as follows:
ϑ ˜ n ζ , 𝓉 =   d d p J ζ n , 𝓉 , p p = 0 = 2 p 𝓉 ζ n J ζ n , 𝓉 , p + 2 𝓉 π exp ζ n 2 4 𝓉 p = 0 ,
which leads to Formula (28).

Appendix C. Notes on Eigenvalues

Equation (18) is obtained from Condition (4), which leads to
tan ν arctan B i 1 ν = B i 2 ν .
By applying arctan to both sides and taking into account the periodicity of the tangent, one obtains the following equation:
ν = g ν ,
where
g ν = n π + arctan B i 1 ν + arctan B i 2 ν .
The graphical interpretation of Equation (A30) is presented in Figure A1.
Figure A1. Graphical interpretation of Equation (A30) for several combinations of B i 1 and B i 2 .
Energies 18 04785 g0a1
Equation (A30) has infinitely many solutions. If ν is a solution, then ν is also a solution; however, only positive solutions can be considered because the terms for ν and ν in Equation (A2) can be combined together. Hence, the solutions can be numbered ν 0 , ν 1 , ν 2 , … and ν n 0 . In the simplest approach, they can be obtained using simple iterations:
ν n , k = g ν n , k 1 ,
where ν n , k is the k -th approximation of ν n . It should be observed that putting any ν 0 into this expression results in g ν I n = n π , n + 1 π . Hence, we can start with any ν n , 0 0 , and all the successive approximations ν n , k will fall into the interval. The convergence can be discussed using the Banach fixed-point theorem for contractive mapping, which results in the following sufficient condition:
g ν q < 1 for ν I n ,
where q is the Lipschitz constant
q = max ν I n g ν .
In the case considered,
g ν = B i 1 ν 2 + B i 1 2 B i 2 ν 2 + B i 2 2 ,
and we require that g ν < 1 for ν I n . This inequity is satisfied for ν > ν ^ B i 1 , B i 2 , where ν ^ 1 for any B i 1 0 and B i 2 0 . Hence, the simple iterations are convergent for n > 0 , because then, ν n , k n π > ν ^ . The error of k -th approximation can be estimated as follows:
ν n , k ν n < q 1 q ν n , k ν n , k 1 ,
where the Lipschitz constant equals
q = g n π .
The simple iterations work well for n > 0 , because then, q < 1 (because ν n n π > ν ^ ). Regarding n = 0 , the condition q < 1 is not satisfied for all B i 1 and B i 2 (see the reddish region in Figure A1). However, even then, convergence occurs, although it is much slower. Therefore, it is recommended to use other methods, e.g., Newton–Raphson, which leads to the following iterative formula:
ν n , k = ν n , k 1 ν n , k 1 g ν n , k 1 1 g ν n , k 1 .
Note that the denominator is greater than 1 (the lower the n the greater the denominator), which means that the convergence for any n and any initial point ν n , 0 is quicker than that for simple iterations. The error can be estimated as follows:
ν n , k ν n ν n , k g ν n , k 1 g n + 1 π < ν n , k g ν n , k .
As n increases, g n + 1 π 0 , and the procedure is almost equivalent to simple iterations at this point.
In conclusion, for n > 0 , it is sufficient to use simple iterations, but for n = 0 , it is recommended to use the Newton–Raphson method. The initial value ν n , 0 can be assumed as any positive value, but a reasonable one is ν n , 0 = n π + π / 2 .

Appendix D. Model Implemented in Matlab Code

  • % ---- Matlab code ----
  • % heating and cooling of a homogeneous plate of a given thickness
  • % as subjected to a constant force on the front side by rectangular pulse of known duration
  • % method of separation of variables used to solve the problem
  • % v1.0 created on 10 August 2025
  • % plate parameters:
  • % d—thickness, m
  • % a—thermal diffusivity, m2/s
  • % lambda—thermal conductivity, W/(m*K)
  • % conditions:
  • % To—initial temperature, °C
  • % v—air velocity, m/s
  • % power—forcing flux intensity, W
  • % area—effective area of irradiation, m2
  • % freq—sampling frequency, Hz
  • % outputs: temperature increase over time for
  • % dzeta = 0—heated (front side),
  • % dzeta = (0,1)—inside the plate
  • % dzeta = 1—unheated (back) side
  • % th = 2—heating time, sec
  • % tc = 58—cooling time sec
  • % ---------------------------------------------------
  • % PMMA—an example of material and parameters of measurements
  • a = 1.05e-7; % PMMA
  • lambda = 0.15; % PMMA
  • d = 0.001;
  • To = 25;
  • power = 2500;
  • area = 0.2*0.2;
  • freq = 29.97;
  • th = 10; % heating time in sec
  • tc = 50; % cooling time in sec
  • v = 0.2;
  • dzeta = 1; % 0—for heated (front) side, 1—for unheated (back) side
  • % --- calculations ---
  • Alfa = 12.12 − 1.16*v + 11.6*sqrt(v);
  • alfa1 = alfa % heat transfer coefficient, W/(m2*K)
  • alfa2 = alfa
  • Bi1 = alfa1*d/lambda + 0.001; % Biot number (Equation (12))
  • Bi2 = alfa2*d/lambda + 0.001;
  • tt = th + tc; % total time, sec
  • Th = power*d/lambda; % ((Equation (12))
  • tau = d^2/a; % ((Equation (12))
  • tg = th*round(freq); % number of samples for heating phase
  • N_terms = 20;
  • theta_ss = (1+Bi2*(1-dzeta))/(Bi1+Bi2+Bi1*Bi2); % ((Equation (17))
  • % ny = n*pi+atan(Bi1/ny)+atan(Bi2/ny); ((Equation (18))
  • f = @(ny, n, Bi1, Bi2) ny—n*pi—atan(Bi1/ny)- atan(Bi2/ny);
  • for n = 0:N_terms-1,
  • If n == 0
  • initial_value = n*pi + pi/2; % (conclusion from Appendix C)
  • end
  • [ny, fval, exitflag, output] = fsolve(@(ny) f(ny, n, Bi1, Bi2), initial_value);
  • ny_n(n + 1) = ny;
  • beta = atan(Bi1/ny); % ((Equation (19))
  • beta_n(n + 1)=beta;
  • theta = 2/(ny*sqrt(Bi1^2 + ny^2))/(Bi1/(Bi1^2 + ny^2) + Bi2/(Bi2^2 + ny^2) + 1); % ((Equation (20))
  • theta_n(n + 1) = theta;
  • psi = cos(ny*dzeta-beta);
  • psi_n(n + 1) = psi;
  • end
  • % heating phase
  • for t = 0:th*round(freq) − 1
  • theta(t + 1) = theta_ss-sum(theta_n.*psi_n.*exp(-ny_n.^2*t/tau/freq));
  • end
  • % cooling phase
  • for t = th*round(freq):tt*round(freq)-1
  • theta(t + 1) = sum(theta_n.*psi_n.*(1-exp(-ny_n.^2*tg/tau/freq)).*exp(-ny_n.^2*(t-tg)/tau/freq));
  • end
  • temp = To + Th*theta; % ((Equation (15))
  • plot(temp);
  • %—end of code -

References

  1. Śniadecki, J. Pisma Rozmaite Jana Śniadeckiego. Tom 3 Zawierający Listy i Rozprawy w Naukach, (Various Writings of Jan Śniadecki. Volume 3 Containing Letters and Treatises in Sciences); Nakładem I Drukiem Jana Zawadzkiego Typografa Imperatorskiego Uniwersytetu: Vilnius, Lithuania, 1818; p. 205. Available online: https://bc.radom.pl/dlibra/publication/39788/edition/38555/content (accessed on 12 July 2025). (In Polish)
  2. Hobler, T. Ruch Ciepła i Wymienniki, (Heat Movement and Exchangers), 5th ed.; WN-T: Warsaw, Poland, 1979. (In Polish) [Google Scholar]
  3. Wark, K., Jr. Thermodynamics; McGraw-Hill Book Company: New York, NY, USA, 1998. [Google Scholar]
  4. Taler, J. Teoria i Praktyka Identyfikacji Procesów Przepływu Ciepła, (Theory and Practice of Identifying Heat Flow Processes); Ossolineum: Wrocław, Poland, 1995. (In Polish) [Google Scholar]
  5. Minkina, W. Theoretical Basics of Radiant Heat Transfer–Practical Examples of Calculation for the Infrared (IR) Used in Infrared Thermography Measurements. Quant. InfraRed Thermogr. J. 2021, 18, 269–282. [Google Scholar] [CrossRef]
  6. Szargut, J. (Ed.) Modelowanie Numeryczne pól Temperatury, (Numerical Modeling of Temperature Fields); WN-T: Warsaw, Poland, 1992. (In Polish) [Google Scholar]
  7. Vavilov, V.; Burleight, D. Infrared Thermography and Thermal Nondestructive Testing; Springer Nature: Cham, Switzerland, 2020. [Google Scholar]
  8. Wiśniewski, S.; Wiśniewski, T.S. Wymiana Ciepła, (Heat Transfer); WN-T: Warsaw, Poland, 1997. (In Polish) [Google Scholar]
  9. Gryś, S.; Minkina, W. Noninvasive Methods of Active Thermographic Investigation: Short Overview of Theoretical Foundations with an Example of Application. Energies 2022, 15, 4865. [Google Scholar] [CrossRef]
  10. Miculescu, M.; Cosmeleata, G.; Branzei, M.; Miculescu, F. Thermal diffusivity of materials using flash method applied on CoCr alloys. U.P.B. Sci. Bull. 2008, 70, 71–81. [Google Scholar]
  11. Kochanowski, K.; Oliferuk, W.; Płochocki, Z.; Adamowicz, A. Wyznaczanie dyfuzyjności cieplnej stali austenitycznej przy wykorzystaniu aktywnej termografii w podczerwieni, (Determination of thermal diffusivity of austenitic steel by active thermography in mobile telephony). Arch. Metall. Mater. 2014, 59, 893–897. (In Polish) [Google Scholar] [CrossRef]
  12. Wróbel, G.; Rdzawski, Z.; Muzia, G.; Pawlak, S. The application of transient thermography for the thermal characterisation of carbon fibre/epoxy composites. J. Achiev. Mater. Manuf. Eng. 2009, 36, 49–56. [Google Scholar]
  13. Parker, W.J.; Jenkins, R.J.; Butter, C.P.; Abbot, G.L. Flash method of determining thermal diffusivity, heat capacity and thermal conductivity. J. Appl. Phys. 1961, 32, 1679–1684. [Google Scholar] [CrossRef]
  14. Watt, D.A. Theory of Thermal Diffusivity of Pulse Technique. Br. J. Apply. Phys. 1966, 17, 231. [Google Scholar] [CrossRef]
  15. ASTM Standard E 1461–01; Standard Test Method for Thermal Diffusivity by the Flash Method. ASTM: West Conshohocken, PA, USA, 2022.
  16. Carslow, H.S.; Jaeger, J.C. Conduction of Heat in Solids; Oxford University Press: New York, NY, USA, 1959. [Google Scholar]
  17. Cape, J.A.; Lehman, G.W. Temperature and Finite Pulse-Time Effects in the Flash Method for Measuring Thermal Diffusivity. J. Appl. Phys. 1963, 34, 1909. [Google Scholar] [CrossRef]
  18. Taylor, R.E.; Cape, J.A. Finite Pulse-Time Effects in the Flash Diffusivity Technique. Appl. Phys. Lett. 1964, 5, 212. [Google Scholar] [CrossRef]
  19. Larson, K.B.; Koyama, K. Correction for Finite-Pulse-Time Effects in Very Thin Samples using the Flash Method of Measuring Thermal Diffusivity. J. Appl. Phys. 1967, 38, 465. [Google Scholar] [CrossRef]
  20. Clark, L.M.; Taylor, R.E. Radiation Loss in the Flash Method for Thermal Diffusivity. J. Appl. Phys. 1975, 46, 714–719. [Google Scholar] [CrossRef]
  21. Boulaoued, I.; Amara, I.; Mhimid, A. Experimental Determination of Thermal Conductivity and Diffusivity of New Building Insulating Materials. Int. J. Heat Technol. 2016, 34, 325–331. [Google Scholar] [CrossRef]
  22. Degiovanni, A. Correction de longueur d’impulsion pour la mesure de la diffusivité thermique par méthode flash (x). Int. J. Heat Mass Transf. 1987, 30, 2199–2200. (In French) [Google Scholar] [CrossRef]
  23. Maillet, D.; André, S.; Degiovanni, A. Les erreurs sur la diffusivité thermique mesurée par méthode flash: Confrontation théorie-expérience (Errors of thermal diffisivity measurement: Confrontation theory-experience). J. Phys. III Fr. 1993, 3, 883-809. (In French) [Google Scholar]
  24. Degiovanni, A.; Laurent, M. Une nouvelle technique d’identification de la diffusivité thermique pour la méthode flash. Rev. Phys. Appl. 1986, 21, 229–237. [Google Scholar] [CrossRef]
  25. Hay, B.; Filtz, J.R.; Hameury, J.; Rongione, L. Uncertainty of thermal diffusivity measurements by laser flash method. Revue Française de Métrologie. Int. J. Thermophys. 2005, 26, 1883–1898. [Google Scholar] [CrossRef]
  26. Hay, B.; Filtz, J.R.; Hameury, J.; Rongione, L. Estimation de l’incertitude de mesure de la diffusivité thermique par méthode flash-Application à cinq matériaux homogènes (Uncertainty assessment of thermal diffusivity measurements by flash method-Application to five homogeneous materials). Rev. Fr. Metrol. 2008, 14, 3–11. (In French) [Google Scholar]
  27. Chihab, Y.; Garoum, M.; Laaroussi, N. Thermophysical Characterization of Earthen Materials using the Flash Method. Int. J. Innov. Technol. Explor. Eng. 2019, 8, 2534–2542. [Google Scholar] [CrossRef]
  28. Chihab, Y.; Garoum, M.; Laaroussi, N. A New Efficient Formula for the Thermal Diffusivity Estimation from the Flash Method Taking into Account Heat Losses in Rear and Front Faces. Int. J. Thermophys. 2020, 41. [Google Scholar] [CrossRef]
  29. Gryś, S.; Minkina, W.; Vokorokos, L. Automated characterisation of subsurface defects by active IR thermographic testing–Discussion of step heating duration and defect depth determination. Infrared Phys. Technol. 2015, 68, 84–91. [Google Scholar] [CrossRef]
  30. Zaręba, M.; Szczegielniak, T.; Jabłoński, P. Influence of the Skin and Proximity Effects on the Thermal Field in a System of Two Parallel Round Conductors. Energies 2023, 16, 6341. [Google Scholar] [CrossRef]
  31. Orlande, H.R.B.; Fudym, O.; Maillet, D.; Cotta, R.M. (Eds.) Thermal Problems and Inverse Techniques; CRC Press: Boca Raton, FL, USA, 2011. [Google Scholar]
  32. Bayazitoğlu, Y.; Özişik, M.N. Elements of Heat Transfer; McGraw-Hill Book Company: New York, NY, USA, 1988. [Google Scholar]
  33. Abramowitz, A.; Stegun, I.A. Handbook of Mathematical Functions with Formulas, Graphs, and Mathematical Tables; Dover Publications, Inc.: New York, NY, USA, 1972. [Google Scholar]
  34. Vavilov, V. Теплoвые метoды кoнтрoля структур и изделий радиoэлектрoники, (Thermal Methods of Control of Structures and Products of Radio Electronics; Радиo и связь, (Radio and Communication): Moscow, Russia, 1984. (In Russian) [Google Scholar]
  35. Monnier, J. Free convection with radiative thermal transfer of grey bodies: Analysis and approximation by finite element methods. Math. Models Methods Appl. Sci. 2000, 10, 1383–1424. [Google Scholar] [CrossRef]
  36. Efros, A.M. Some applications of operational calculus in analysis. Mat. Sb. 1935, 42, 699–705. [Google Scholar]
  37. Osiowski, J. Zarys Rachunku Operatorowego, (Outline of Operational Analysis); WN-T: Warsaw, Poland, 1981. (In Polish) [Google Scholar]
  38. Gradshteyn, I.S.; Ryzhik, I.M. Tables of Integrals, Sums, Series and Products, 17th ed.; Elsevier Academic Press: Cambridge, UK, 2007. [Google Scholar]
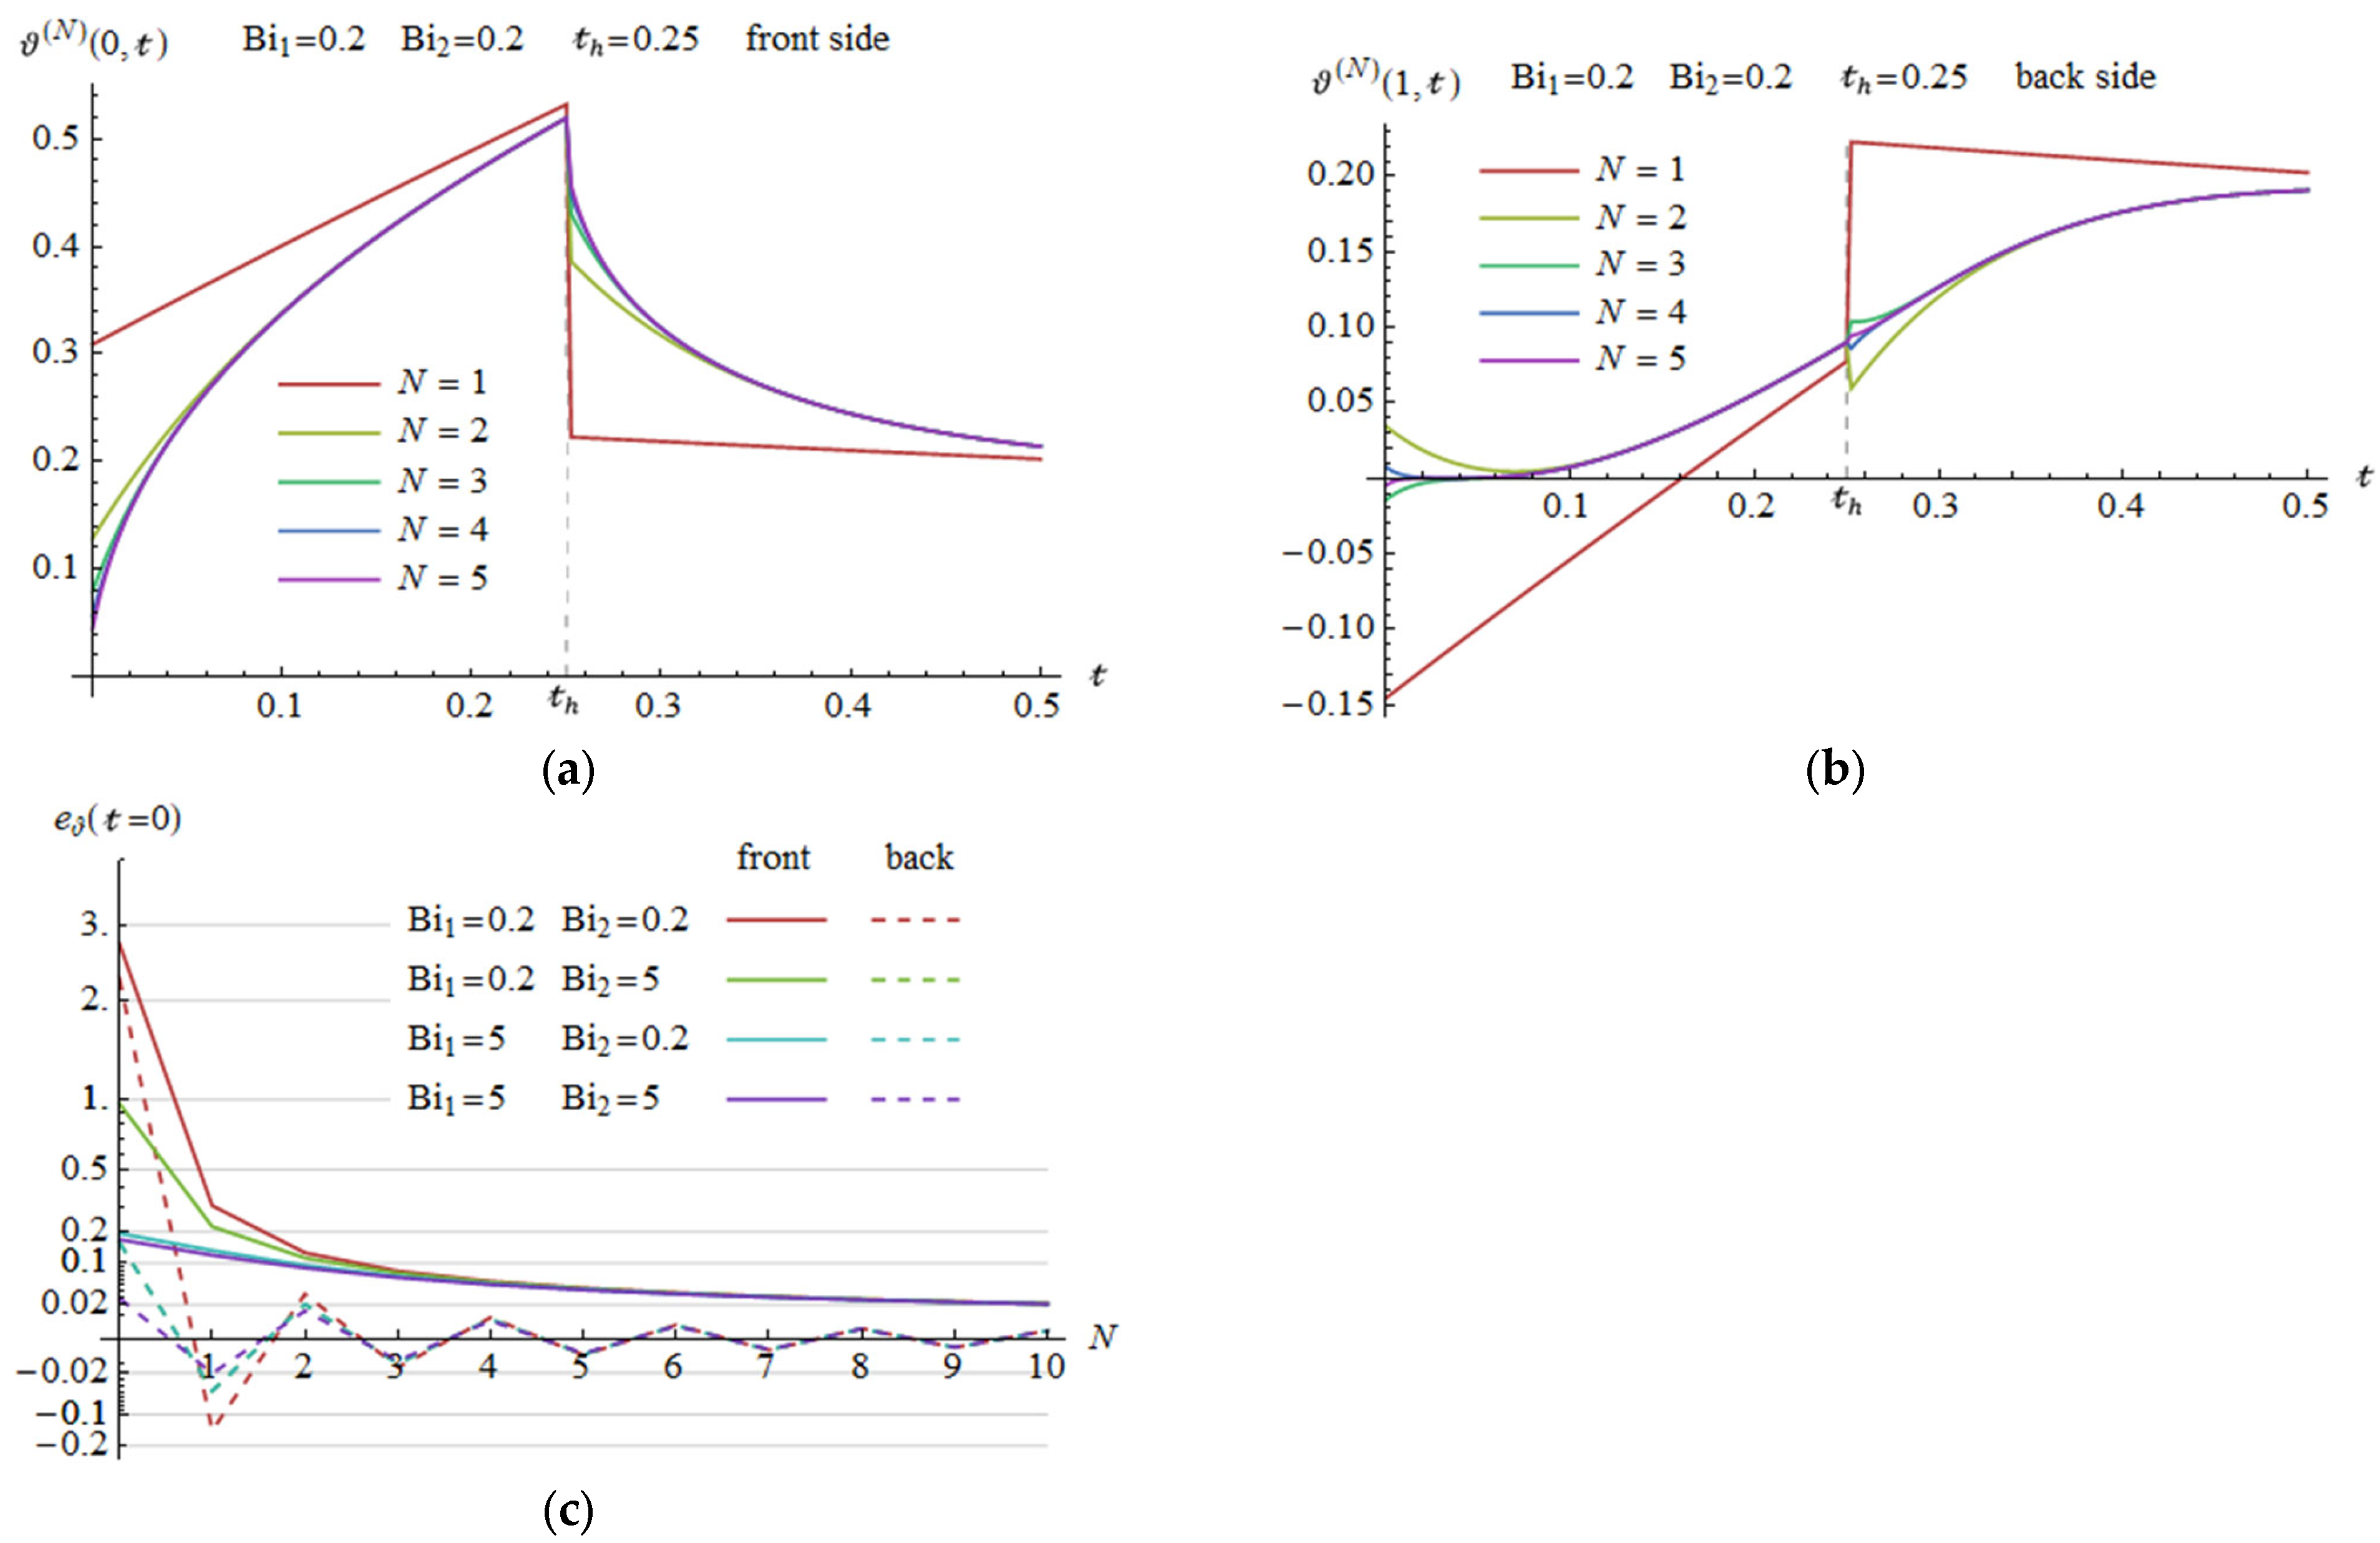
Figure 2. Illustration of the error associated with truncation of the infinite series (16) to a finite number of terms   N . (a) Approximate waveforms of the front surface temperature for selected values of N ; (b) Approximate waveforms of the back surface temperature for selected values of N ; (c) Truncation error of the series e ϑ at time 𝓉 as a function of N for selected Biot numbers (Note: The scale on the vertical axis is non-linear).
Energies 18 04785 g002
Figure 3. Approximate temperature waveforms of the front and rear surfaces corresponding to selected Biot numbers. (a) Weak cooling of both sides of the plate; (b) Weak cooling of the front surface and strong cooling of the rear surface; (c) Strong cooling of the front surface and weak cooling of the rear surface; (d) Strong cooling of both surfaces.
Energies 18 04785 g003aEnergies 18 04785 g003b
Figure 4. Relative temperature rise on the front (a) and back (b) side of the plate during heating by a rectangular pulse with relative duration 𝓉 h = 0.3 for selected B i 1 and B i 2 values.
Energies 18 04785 g004
Figure 5. Dependence of time to reach the maximum on the back side 𝓉 1 max (a) and the value of this maximum ϑ 1 max (b) with respect to the function of the heating pulse duration 𝓉 h and Biot numbers, assuming B i 1 = B i 2 .
Energies 18 04785 g005
Figure 6. Temperature difference between the front and back surfaces for varying heating times 𝓉 h and selected cooling conditions. (a) Weak cooling of both surfaces; (b) Weak cooling of the front surface and strong cooling of the rear surface; (c) Strong cooling of the front surface and weak cooling of the rear surface; (d) Strong cooling of both surfaces.
Energies 18 04785 g006
Figure 7. Temperature change and normalized temperature for the back side (10 s heating time, 100% lamp power, i.e., 2500 W).
Energies 18 04785 g007
Table 1. Comparison of the properties of the solutions obtained.
FeatureMSV Solution (16)Heat-Wave Solution (23)
Mathematical accuracyYes
Generality of the solutionA specific formula is required
for the case Bi1 = Bi2 = 0
Specific formulae are required when Bi1
and Bi2 are equal or coincide with 0
Mathematical complexityLow—simple, identical formulae
for all terms of the series
High—formulae of increasing complexity
for successive heat waves
Dependence
on Bi1 and Bi2
Implicit—a transcendental equation must be solved to determine the eigenvaluesExplicit
Truncation error
versus time
With a shorter time after the heating is switched on or off, a greater number of terms is requiredThe longer the time after the heat is switched on, the more waves are required
Truncation error versus the observation pointThe front/rear surface results
in the largest/smallest value
An odd/even number of waves results in a smaller error on the front/rear surface
Truncation error versus the Biot numbersAs the Biot numbers decrease, the truncation error increases
Application scopeA sufficiently long time after switching the heating on or off (the impact of successive terms gradually decreases)A sufficiently short time after the heating is switched on (the impact of successive waves increases over time)
Disclaimer/Publisher’s Note: The statements, opinions and data contained in all publications are solely those of the individual author(s) and contributor(s) and not of MDPI and/or the editor(s). MDPI and/or the editor(s) disclaim responsibility for any injury to people or property resulting from any ideas, methods, instructions or products referred to in the content.