Article

Off-Design Performance Modeling of the Natural Gas-Fired Allam Cycle

by
Federico D’Ambrosio
1,
Lorenzo Colleoni
2 and
Silvia Ravelli
1,*
1
Department of Engineering and Applied Sciences, University of Bergamo, Viale Marconi 5, 24044 Dalmine, Italy
2
Independent Researcher, 24040 Bonate Sopra, Italy
*
Author to whom correspondence should be addressed.
Energies 2025, 18(17), 4771; https://doi.org/10.3390/en18174771
Submission received: 19 August 2025 / Revised: 3 September 2025 / Accepted: 5 September 2025 / Published: 8 September 2025

Abstract

This work focuses on modeling the performance of the natural gas-fired Allam cycle under off-design conditions. Key thermodynamic parameters, such as turbine inlet pressure (TIP), turbine inlet temperature (TIT), and turbine outlet temperature (TOT), were evaluated at part-load and varying environmental conditions. In the former case, different control strategies were implemented in the simulation code (Thermoflex®) to reduce the power output. In the latter case, the impact of ambient temperature (Tamb) on the minimum cycle temperature (Tmin) was evaluated. The ultimate goal is to predict the thermal efficiency (ηth) and its decrease due to partial load operation and warm climate, without thermal recovery from the air separation unit (ASU). With the most efficient partial load strategy, ηth decreased from 50.4% at full load to 40.3% at about 30% load, at nominal Tmin. The penalty caused by the increase in Tmin due to hot weather, up to Tamb = 30 °C, was significant at loads above 60%, but limited to 0.5 percentage points (pp).

1. Introduction

According to the International Energy Agency [1], approximately 60% of the global electricity production in 2024 still originated from fossil fuels, including coal, oil, and natural gas (NG). The latter grew the fastest and reached a new all-time high in 2024, although the amount of new renewable power capacity installed worldwide set a new annual record. The reason is the growth in global energy demand (2.2% in 2024) due to the increase in air conditioning needs, the shift to electrification of production processes and end-uses, and the spread of digitalization, data centers, and artificial intelligence [2]. At the same time, total energy-related CO2 emissions reached a new all-time high of 37.8 Gt, with the largest contribution to this growth coming from NG.
As the objectives of the Paris Agreement are far from being achieved, there is a pressing need for innovative solutions, even considering the expected upward trend in electricity demand over the next three years [3]. The Allam cycle [4] is perfectly suited to this purpose. The fuel is NG, but stack CO2 emissions are close to zero thanks to oxy-combustion. In simple words, burning NG with pure oxygen (instead of air) results in a flue gas composed almost entirely of CO2 (because dilution with nitrogen is avoided), which serves as a working fluid. More specifically, electricity is generated by a high-pressure, low-pressure ratio, recuperated, direct-fired, trans-critical Brayton cycle while capturing carbon emissions. The working fluid in a semi-closed loop is CO2 obtained from burning NG with pure oxygen in an oxy-combustor, followed by a turbine. Downstream of expansion, the exhaust enters a recuperator (hot side) and a water separator; the resulting fluid, consisting mainly of CO2, is recycled back into the combustor after re-pressurization and reheating in the recuperator (cold side). A small amount of excess CO2 is removed downstream of compression so that a high-pressure, high-purity CO2 stream is available for sequestration or any subsequent use [5]. An integral part of this system is the ASU that supplies high-purity oxygen to the combustor. NET Power LLC took charge of the Allam cycle demonstration power plant in the city of La Porte (Harris County, Texas, USA). The 50 MWth facility began testing in 2018, and more than 1500 total plant operating hours have been accumulated [6]. NET Power LLC is also leading a consortium to build the first utility-scale project capable of generating 300 MWel near Midland-Odessa by the second half of 2027 and the first half of 2028; the project is called “Permian” [7]. On the other hand, numerous efforts have focused on modeling the Allam cycle with the goal of predicting and/or optimizing its performance. Through a detailed review of the published literature [8], it was found that the values of ηth ranged from 49 to 58.9%, with the maximum claimed by the inventor [9]. Indeed, the Allam cycle was recognized as the most efficient among oxy-fuel cycles [10]. The way was laid out by Scaccabarozzi et al. [11], who obtained ηth of 55.35% by simulating the entire cycle in Aspen Plus to accurately mimic the peculiarities of CO2 under supercritical conditions. Many other theoretical studies followed, including various aspects, such as the following:
  • The comparison with the Graz cycle [12], for which ηth was estimated to be slightly higher than the Allam cycle (53.5% vs. 52.7%);
  • Economic feasibility [13], which was assessed as “quite competitive” in terms of total specific investment costs (about 1300 USD/kW);
  • The exergo-economic analysis [14], from which exergetic efficiency and cost of electricity were equal to 50.1% and 91.7 EUR/MWh, respectively;
  • Size effect on cycle performance [15], which remains relatively high (ηth > 51%) in the net power range of 400 to 100 MWel;
  • Sensitivity to the thermal power recovered from the ASU [15]. The case without heat integration is impacted by 3 pp lower ηth than the base case with heat recovery from the ASU main compressor cooler (about 50% vs. 53%).
All the works cited above are true to the original Allam cycle scheme, running on NG, at full load. Instead, part-load analysis has been the subject of a limited number of theoretical investigations, again based on thermodynamic models for predicting ηth. Scaccabarozzi et al. [16] suggested a control strategy based on closing the variable inlet guide vanes (IGVs) of the recycle compressor to reduce the mass flow rate of the recycle stream without stalling. Under the assumption of fixed fuel input, a reduction in pressure ratio (β) is expected, resulting in an increase in TOT, which is acceptable within the limits dictated by the recuperator material. At a maximum TOT of 850 °C, in the 100–40% load range, the cycle (excluding the ASU) provides a less steep decrease in ηth than a standard combined cycle. This promising outcome, obtained by neglecting part-load variations of ASU, compressor, and turbine efficiency, was then confirmed by Zaryab et al. [17], who took into account the off-design performance maps of compressors, pumps, and turbines. They conceived a control mode using both minimum cycle pressure (pmin) variations and variable IGVs and diffuser guide vanes (DGVs), together with partial turbine admission. The results reveal that the load can be lowered by up to 15% with a ηth of 41.6%, compared with the nominal value of ηth = 54.9%. While the Allam cycle seems suitable for flexible operating schedules with limited efficiency decay, integration with the ASU can be problematic in the presence of ramps and load variations. Although flexible and robust control schemes must be implemented in a dynamic environment, Fernandes et al. [18] concluded that the Allam cycle coupled with an ASU is controllable even in a tightly integrated configuration.
Another challenge to be addressed is related to the deterioration of cycle performance in hot weather conditions. In fact, in the Allam cycle, ηth is significantly affected by Tmin, which refers to the compressor inlet temperature, directly impacting the energy consumption of CO2 compression [19]. As noted by Mitchell et al. [20], a Tmin of 17 °C could be achieved with mechanical draft air cooling towers for Tamb of 8 °C. It is clear that warmer climates may raise the Tmin level, resulting in a penalized ηth. Xie et al. [21] reported that ηth decreases by 0.42% for every 1 °C increase in Tamb. Specifically, when Tamb is below 20 °C, the impact on ηth is small, whereas ηth decreases significantly at Tamb above 20 °C. When Tamb rises from 15 °C to 40 °C, ηth drops from 54.58% to 43.96%. Crespi et al. [22] proposed the use of dopants to increase the critical temperature of CO2 as a solution to maintain high ηth values even in hot climates. They computed ηth in excess of 50% for Tmin values as high as 50 °C when the working fluid is a CO2 blend with 15–25% vol of selected dopants, such as hexafluorobenzene (C6F6) and titanium tetrachloride (TiCl4). It should also be remembered that the ASU is affected by environmental conditions; the power required by the main air compressor increases linearly with Tamb according to Fernandes et al. [23].
The scientific literature summarized here shows that, compared with the dozens of papers that have addressed the Allam cycle in recent years, according to a growing interest [8], there are few that focus on off-design conditions. Instead, the latter are of utmost importance from the perspective of integrating the Allam cycle with other generation systems, including renewables, with the goal of meeting electricity demand as environmental conditions change. This study aims to provide an estimate of the performance of the Allam cycle, without thermal recovery from the ASU, under realistic operating conditions implying reduced load and variable Tamb. In fact, managing off-design efficiency is a key challenge for real-world Allam cycle operation, with the aim of providing clean and dispatchable energy to supplement or eventually replace conventional combined cycles in the near future. It is a logical continuation of an earlier work (by the same corresponding author) devoted to modeling and subsequent optimization of the design operating point [24]. Validation against the (few) available academic studies lends value to the proposed off-design characterization under the assumption of steady-state modeling. The simulation code is the same as in [24], but in an updated release (Thermoflex®—Version 32, Thermoflow Inc., Jacksonville, FL, USA).

2. Brief Review of the Optimized Cycle at Design Point

This section briefly recalls the design features of the Allam cycle outlined in [24], with its main parameters (Table 1), final layout (Figure 1), and complete thermodynamic characterization (Table A1), in terms of pressure (p), temperature (T), enthalpy (h), and mass flow rate (m). The following list sets out the main technical hypotheses:
  • The turbine was split into seven stages, the first four being cooled; uncooled adiabatic efficiency was set to progressively increase from the first to the seventh stage in the range between 90% and 93%. The number of stages is consistent with the guidelines contained in [25], representing a compromise between expansion efficiency and cooling flow.
  • The recuperator was split into three (two-stream) heat exchangers in series, where heat transfer occurs at constant heat capacity, in accordance with the software’s limitations. Nevertheless, the correct temperature difference values on the cold and hot sides were obtained. This approach was also successfully adopted in [20].
  • The cold source required for any cooling process was not specified, as was performed by the cycle developers in the original document [26]. The removal of heat to achieve the desired output temperature was simply taken for granted. This applies to both the flue gas stream, which is cooled to reach the Tmin downstream of the recuperator, and the intercooled, two-stage compression of the recirculated CO2 stream.
  • Power requirements of the ASU to produce high-purity (99.5%) oxygen were estimated without going into the details of the chemical process, which is actually a common practice. The resulting specific consumption (SCASU) of 1330 kJ/kgO2 is in line with values collected by Reale [8], ranging from 1049 to 1447 kJ/kgO2, with most predictions clustering around 1300 ± 50 kJ/kgO2 [27]. In short, a multistage intercooled compression configuration was assumed for both ambient air and oxygen, with two and five stages; the outlet pressure is set by the distillation column and combustor, respectively.
With a target of 300 MW net electric power, ηth of 50.4% was achieved by decoupling heat recovery from the ASU, thus prioritizing flexible solutions for oxygen supply (in fact, a dedicated co-located ASU may not be available). It was verified that the resulting (net) ηth is consistent with results from the existing literature, when excluding the ASU from heat recovery [15,25]. For further reassurance on the validity of this prediction, one can cite the latest progress report by Marshall et al. [28], which stated “The detailed design of a 300 MWel, utility scale oxy-fuel turbine has been completed for purposed operation in the sCO2 direct fired Allam-Fetvedt cycle, targeting near-zero emissions and a 50% system efficiency, based on the fuel lower heating value (LHV)”. Furthermore, the maximum allowable temperature constraints at the hot end of the recuperator and at the turbine inlet—set at 750 and 1200 °C, respectively—were met [26].
Table 1. Allam cycle configuration at design point [24].
Design ParameterValue
Minimum cycle temperature (°C)17
Turbine inlet pressure (bar)303
Turbine inlet temperature (°C)1194
Turbine inlet flow (kg/s)840
Turbine outlet pressure (bar)30
Turbine outlet temperature (°C)728
Turbine coolant mass fraction 1 (%)12
Turbine exhaust flow (kg/s)942
Expansion power (MW)447
CO2 compression power (MW)73
Fuel input (MW)597
Recuperator heat transfer (MW)797
ASU penalty (%LHV)10.66
Fuel compressor power (MW)3.9
Net electric efficiency (%)50.4
1 Relative to turbine inlet flow.
Figure 1. Schematic diagram of the natural gas-fired Allam cycle (component numbers are written in black; stream numbers are indicated in red/orange boxes). Source: [24].
Energies 18 04771 g001

3. Off-Design Model and Assumptions

Particular attention was paid to turbomachinery off-design behavior, which can be accurately dealt with by Thermoflex® software. Instead, SCASU is equal to the design value. The total power requirement was simply scaled with the mass flow rate of oxygen (mO2) delivered. Likewise, changes in oxy-combustor efficiency when moving away from the design point were not considered. Given the lack of experimental data on supercritical CO2 (sCO2) oxy-fuel combustion, it has always been assumed that the purity of the CO2 working fluid is maintained by complete combustion, which is based on diffusion technology, as NOx emissions are eliminated [9]. For all heat exchangers, off-design calculations are based on the thermal resistance scaling method. While simple, it is quite accurate, without the need for constructive details.

3.1. Compressors

Following the steps outlined by Zaryab et al. [17], the operating characteristics of sCO2 centrifugal compressors were considered at a constant rotational speed (n) in order to avoid the need for expensive, large-size inverters. The processed flow rate was regulated using IGV and DGV to extend the compressor operating range while preventing surge and maintaining high efficiency. However, it should be acknowledged that a reduction in the intake flow rate by 30 to 50% can still result in a substantial decline in efficiency, thereby approaching the compressor’s surge limit. The sCO2 compressor’s operating map was retrieved from the Atlas Copco Gas booklet [29] and adapted to the case under consideration. The design point on the map was associated with the nominal operating conditions of each compressor, in terms of processed corrected flow (CF) and β. Additional parameters needed to implement the performance map in the code are the corrected speed (CS) and polytropic efficiency (ηy), with Tref = 288.15 K and pref = 1.013 bar as follows:
C F = m T i n T r e f M W p i n p r e f
β = p o u t p i n
C S = n T r e f T i n
Each map consists of a series of performance curves built on the parameters below, normalized by corresponding design values as follows:
C F C F d
C S C S d
β β d
η y η y η y d
On each CS curve, 10 points were defined with values from Equations (4), (6) and (7). Moreover, for each CS line, the maximum β, normalized by the design pressure ratio (βd), was required to define the surge line. The procedure was repeated for each IGV position; the final outcome is depicted in Figure 2. The design point is indicated by the (blue) cross; also evident are the opening (−5°) and closing (20°) angles of the IGV, as well as the surge line. Levels of normalized ηy are indicated on each contour line.

3.2. Turbine

The axial flow configuration is well established for the turbine on an MW scale. The performance map of the turbine imposes a constant flow function (FF), defined as follows:
F F = C m p i n R M W γ T i n 2 γ + 1 γ + 1 γ 1
Since the turbine behaves like a choked nozzle, there is an almost proportional relationship between inlet flow (m) and inlet pressure (pin) for a given inlet temperature (Tin). Consequently, reducing the turbine inlet flow (and, therefore, the load) decreases the cycle maximum pressure, which has a negative impact on ηth. However, this issue can be mitigated by adopting inlet pressure control strategies, such as using a throttling valve or variable-section admission. On the other hand, a “controlled” admission turbine is less efficient than a standard turbine.
The cooled expansion efficiency of each turbine stage (ηce) was selected as the performance indicator, thus accounting for enthalpy and pressure losses induced by coolant mixing with the mainstream, as explained in [24], with reference to El-Masri’s model [30]. If the stage is uncooled, ηce and isentropic efficiency (ηis) coincide. For off-design calculations of ηis, the following functional relationship was used with the aim of linking stage efficiency to flow function as follows:
η i s , o d = η i s , d f F F o d F F d η
where ηis,od is the uncooled isentropic efficiency at off-design, ηis,d is the uncooled isentropic efficiency at design condition, f denotes a functional dependence, FFod is the flow function at off-design, and FFd is the design flow function. The last term represents a degradation of efficiency, which is automatically defined by the code for gas turbine stages.

4. Results

Sets of simulations were run with a wide load range by applying different control logics. Firstly, model validation is provided to ascertain that the cycle thermodynamic behavior at part-load is consistent with the (few) data available in the published literature. This is extremely important since the field of exploration is almost new. The original results are reported for different control modes, highlighting the advantages and weaknesses of each solution. Subsequent to the identification of the optimal part-load strategy, the influence of Tamb on cycle behavior was examined.

4.1. Validation

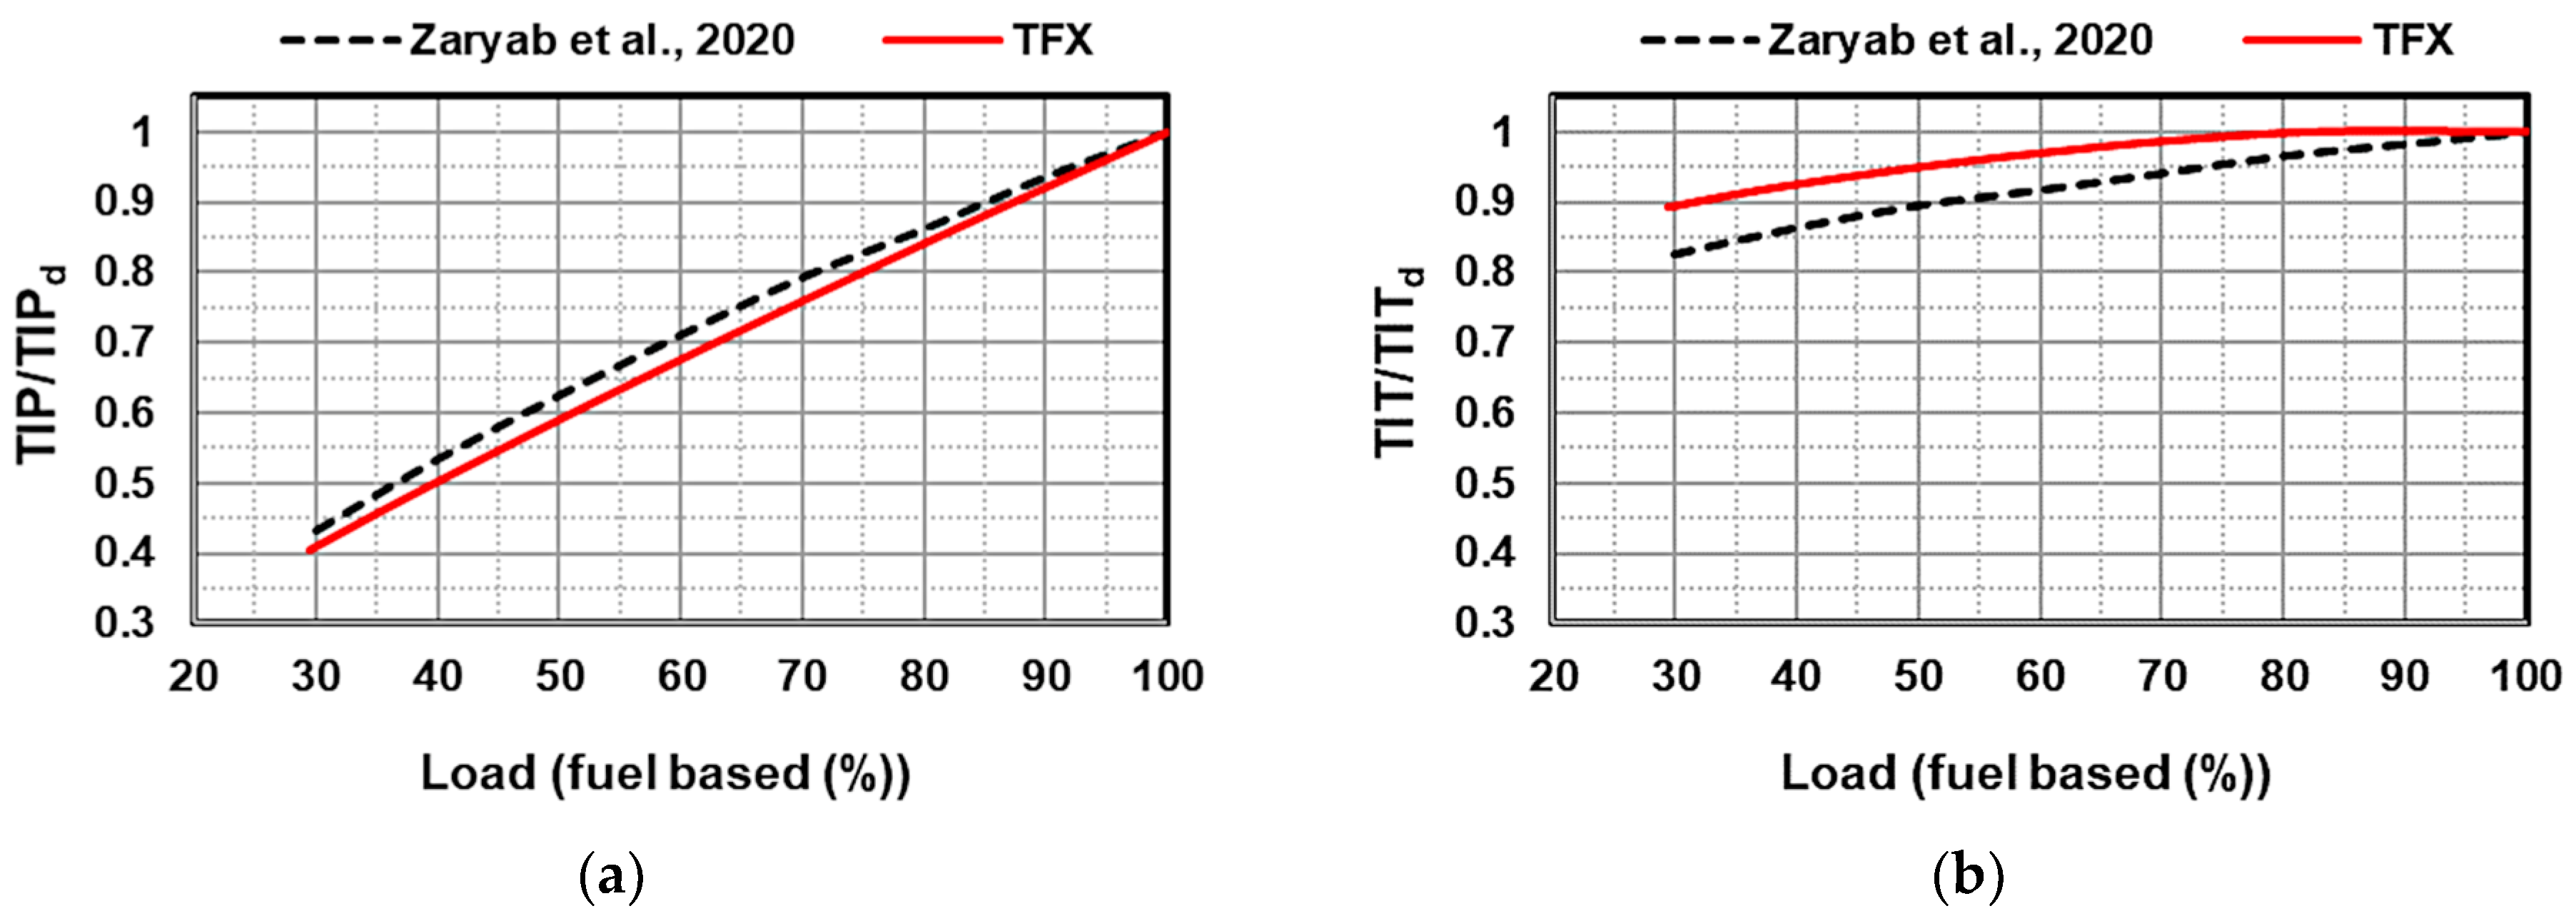
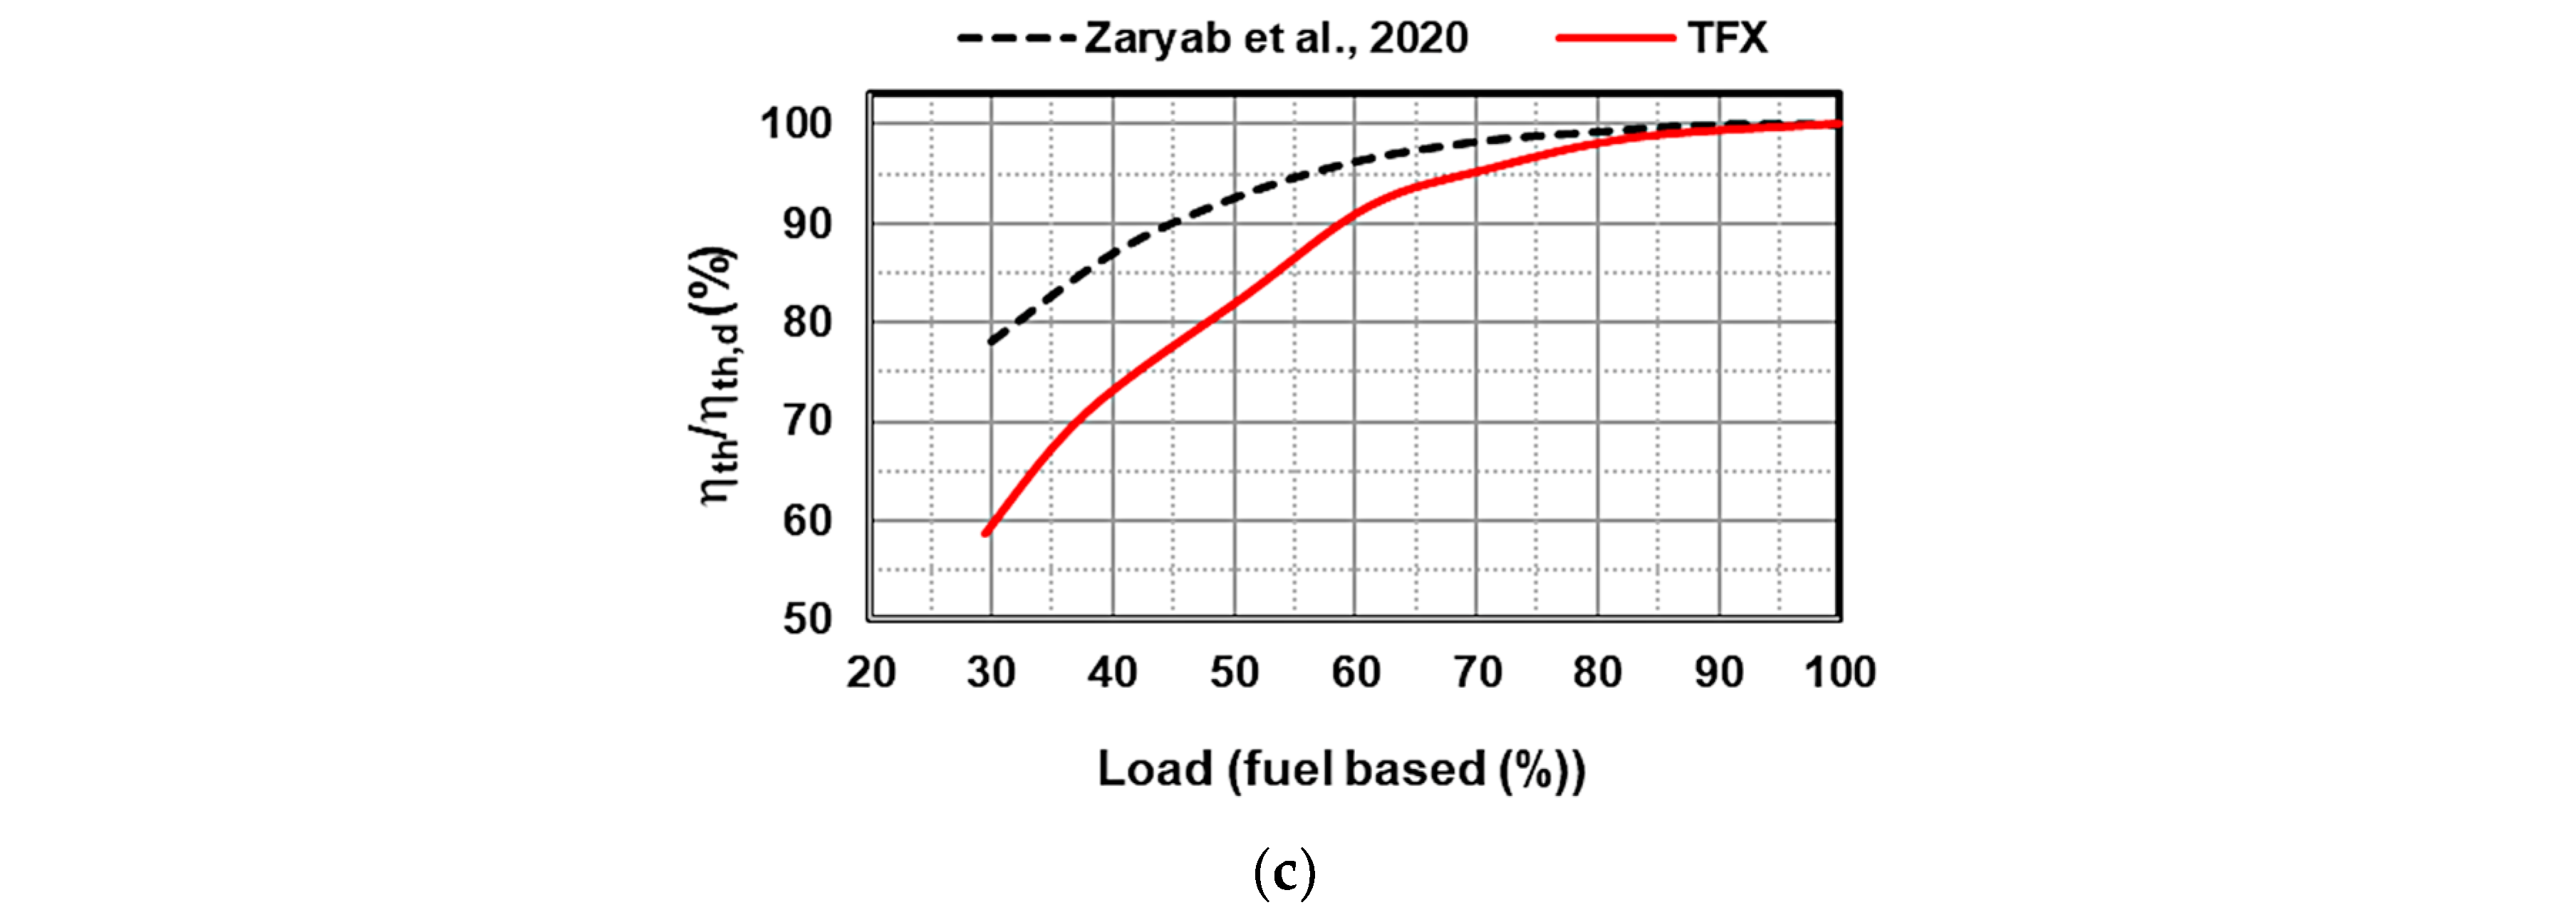
The so-called variable control (VC) mode defined in [17] was taken as the reference for validation. Specifically, pmin remains fixed at the design value, while the recirculating CO2 mass flow rate is modulated by the IGV and DGV of the compressors so as to reduce the load while keeping TOT constant, equal to the nominal value. The turbine operates at full admission, according to Equation (8). The key parameters used to validate the study are TIP, TIT, and ηth; they are presented in dimensionless form to facilitate the comparison with [17]. Also note that the load percentage is based on the fuel thermal input, for consistency with [17]. Predictions from the Thermoflex® model are indicated below with the acronym TFX.
Starting from the conditions at the turbine inlet, Figure 3a shows that TIP decreases linearly while lowering the load due to the reduction in the recirculating CO2 stream, which is consistent with the full admission operation. The simulated slope of the line corresponds to that in [17]. Figure 3b refers to TIT, which also decreases at reduced load. This is due to the fact that, as the recirculating flow decreases due to IGV closure, TOT tends to rise. Therefore, it is necessary to reduce TIT to maintain a constant TOT. As a consequence, the difference between the predictions and [17] becomes increasingly significant as the load decreases. One reason for this can be found in the different modeling of turbine expansion at part-load, given the lack of information (Equation (9) in this study vs. Equation (4) in [17]). However, the largest discrepancy at the lowest load is still acceptable. The results in terms of cycle performance are depicted in Figure 3c. It is true that the lower the load, the lower the ηth, but the expected decline of ηth is much more evident in this study than in [17]. This could be linked to the current assumptions of no heat recovery from the ASU and, above all, to the accounting of losses in ηce for all turbine stages at part-load, as indicated in El-Masri GASCAN code [31]. Conversely, in [17], variations in turbine stage ηis at part-load were neglected in the case of full admission, resulting in a more optimistic scenario.

4.2. Part-Load Strategies

The investigated part-load control modes concerned not only the inlet conditions of the compressor and turbine, within the limits dictated by their respective performance maps, but also the permissible temperature levels to preserve the integrity of crucial components. The basic framework, labeled “IGV+VC”, implied that IGVs at the compressor inlet are progressively closed in order to reduce the intake flow rate, hence, the plant load. Contextually, TIT is maintained at the design value as long as the rising TOT does not exceed 750 °C, indicated by Allam et al. [26] as an upper limit of the operating temperature at the hot end of the regenerator. Once TOT has reached the maximum permissible threshold, it is maintained constant by lowering TIT while further reducing the load by closing the IGV until the minimum compressor inlet flow. In short, the control strategy at relatively high loads is similar to IGV control in conventional gas turbines, followed by a VC mode that, unlike in Section 4.1, is set to the maximum permissible TOT (750 °C) instead of the design TOT. It follows that higher TIT can be maintained at lower loads, compared to [17], with a beneficial effect on ηth. All this was combined with control modes for turbine inlet conditions as follows:
  • In the basic version, “IGV+VC” mode prescribes a full admission turbine with sliding pressure control. By reducing the inlet pressure, the turbine can operate efficiently while accommodating a smaller inlet mass flow, according to Equation (8).
  • In the intermediate version, a control valve is used at the turbine inlet to maintain the design pressure, whatever the load, by throttling the flow entering the first stage. Note that, if the pressure at the turbine inlet was to slide above the set point, the throttle valve would be wide open, with zero pressure loss. However, this solution may entail operational challenges, as valves are incapable of withstanding the elevated temperatures at the combustor outlet without specialized cooling. Furthermore, the spatial availability for installation is constrained.
  • The most advanced solution involves applying nozzle control to modulate the flow area at the inlet of the stage group to maintain design point pressure, regardless of the inlet mass flow rate. This can be achieved by swiveling nozzle vanes, for example. Although costly, this solution could be feasible since the turbine is not directly connected to the compressor shaft.
It is also essential to note that both CO2 delivery pressure and pmin were maintained at nominal values (78 bar and 28 bar, respectively) in all cases. Similarly, the turbine coolant mass fraction relative to the turbine inlet flow was kept constant at 12%.
A comparison of the simulation outputs for each strategy was conducted (see Table 2 for better clarity), with the load computed as the ratio of the actual net power output to the design value. Priority was given to the impact of load change on the main cycle parameters to direct the discussion towards ηth. The next step is a more in-depth assessment of turbine stages’ behavior, which includes quantifying what is theoretically assessed in Section 3.2.

4.2.1. Main Thermodynamic Parameters

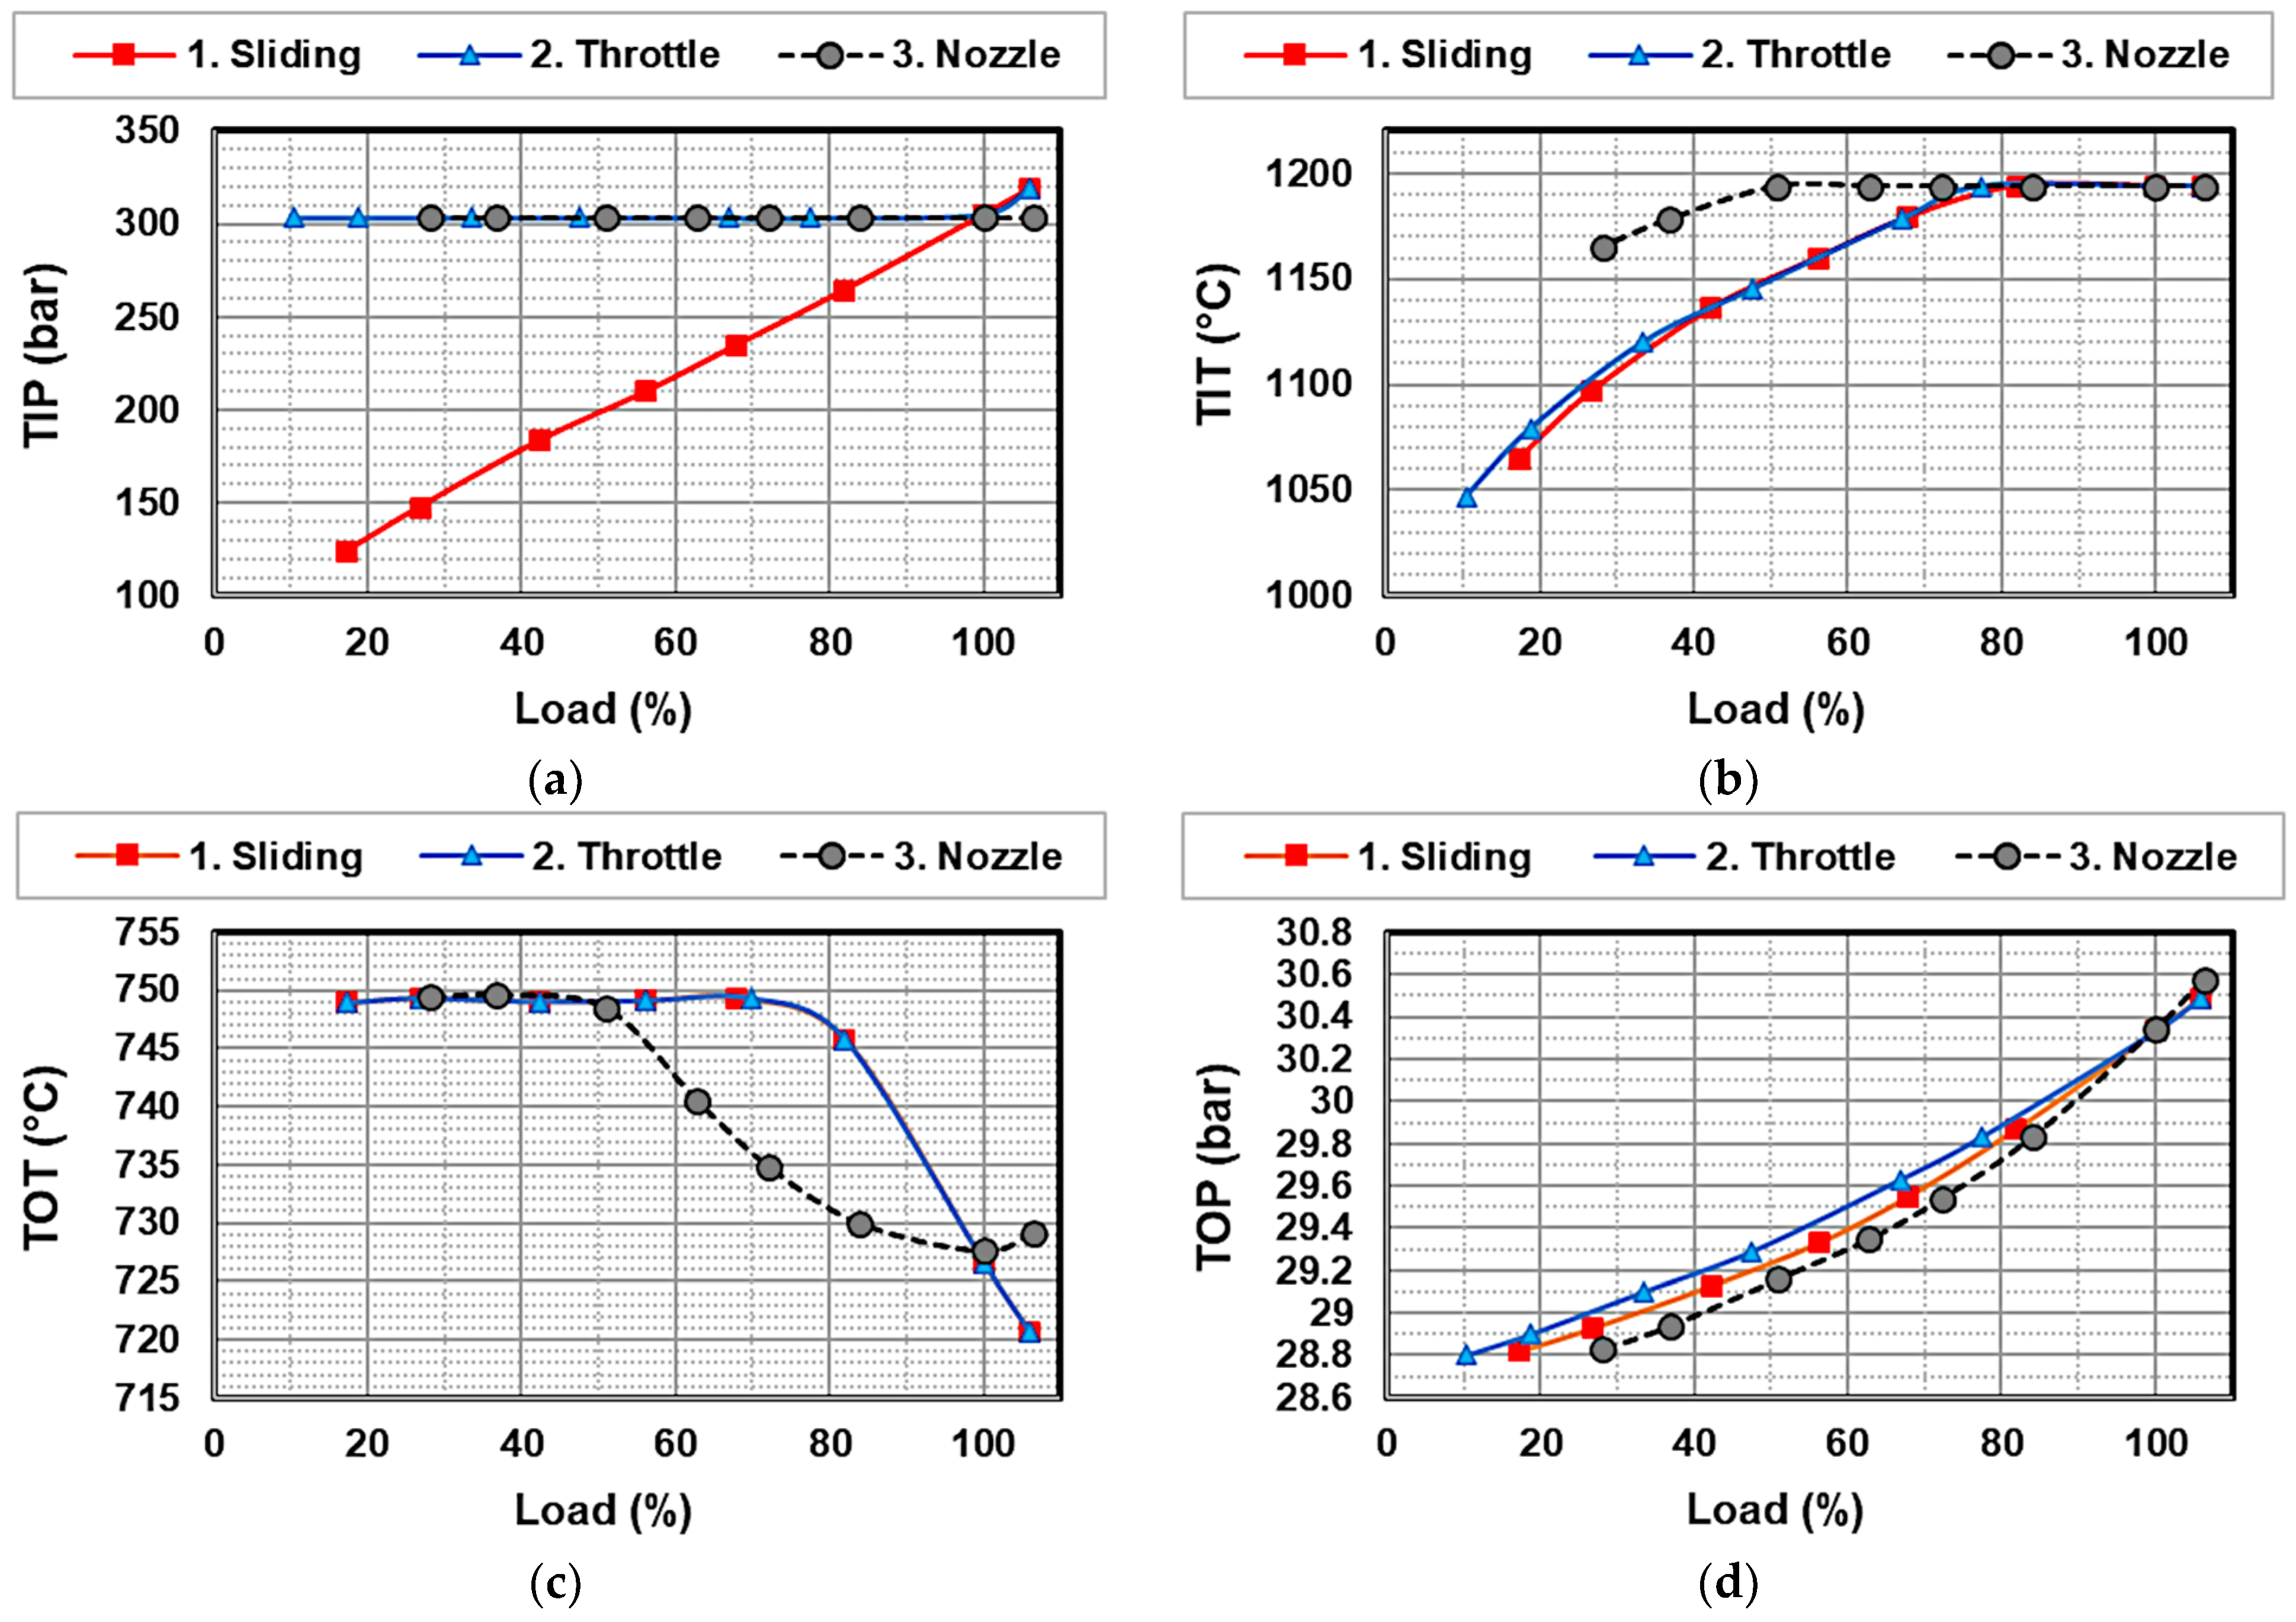
The effectiveness of turbine inlet control can be confirmed by examining TIP (Figure 4a). In the case of a full admission turbine operating in sliding pressure mode, TIP decreases linearly with load; in fact, the recirculating CO2 flow rate and thus turbine inlet flow diminish due to IGV progressive closure. On the other hand, throttle and nozzle options keep TIP constant with the aim of preserving ηth at the expense of expansion efficiency. However, they differ in the maximum TIP value. The throttling valve is wide open if the turbine inlet flow exceeds the design value, so the inlet pressure can rise beyond the nominal value in sliding mode. Nozzle control, on the contrary, can adapt the admission arc section in slightly overloaded conditions, so that the set point pressure is kept fixed. The only limit is the maximum physical nozzle area, beyond which the nozzles cannot be further opened. The overall cycle pressure ratio, computed by multiplying β values of compressors 15, 17, and 22 (see Figure 1), reflects TIP trends, given constant pmin. It is almost stable around 10 bar in the throttle and nozzle cases, whereas it drops to 4.5 at 20% load in the sliding case.
As illustrated in Figure 4b, TIT needs to be adjusted below the design level at loads < 70% when sliding and throttle controls are applied. This is due to the fact that TOT rises linearly, with a steep slope within 70% < load < 100%, reaching a limit of 750 °C at a load of 70% (Figure 4c). Conversely, nozzle control provides a more gradual increase in TOT so that the threshold value is reached at a lower load of 50%, below which TIT is inevitably decreased. In this condition, the penalty in TIT is considerably less; for instance, at 30% load, TIT is approximately 1170 °C instead of 1110 °C. Figure 4d completes the expansion characterization. As expected, the turbine outlet pressure (TOP) experiences a gradual reduction at part-load, regardless of the turbine control employed. However, it should be kept in mind that the rate of decrease is contingent upon the constraint of a fixed minimum outlet pressure. In fact, the reduction in TOP at a load as low as 20% is limited to 5% compared to the design point.
The turbine control also directly affects SCASU, as shown in Figure 5a. It is clear that “IGV+VC” solutions with admission control (i.e., throttle and nozzle) imply greater SCASU than with a sliding turbine. This is reasonable, as ASU must supply the combustion chamber with the required oxygen flow rate at a pressure level related to TIP (by neglecting combustor pressure drop). The correspondence between Figure 4a and Figure 5a is particularly evident in the sliding mode, with SCASU decreasing linearly with load, and hence with TIP. In this case, at 20% load, SCASU is only 1165 kJ/kgO2 vs. 1255 kJ/kgO2 with throttling. With regard to the supply of oxygen (see Figure 5b), there is a linear decline of mO2 at reduced load, irrespective of the strategy used. This is consistent with the falling demand for fuel.
The outcome regarding ηth is reported in Figure 6, divided by the nominal reference value. The combination of “IGV+VC” mode with nozzle control was found to be the most efficient solution, whereas the throttling option proved to be the worst because of the following: the lower the load, the larger the loss across the valve, which closes progressively. Sliding mode is somewhere in between throttle and nozzle, with a trend closer to the former solution. However, the benefit from partializing the turbine admission inlet arc becomes substantial, compared with sliding mode, at loads below 50%, in agreement with [17]. This can be explained by the fact that nozzle control can maintain a very high TIT at less than half loads (Figure 4b). At the best, ηth drops to 80% of ηth,d at 30% load. This represents the best compromise between fixed TIP, which has beneficial effects on overall cycle performance, and the consequent penalty in the “internal” turbine efficiency, as documented in the following Section 4.2.2.
When dealing with the minimum load, the ranking is turned upside down. In particular, nozzle control cannot reach loads below 30% due to geometric constraints dictated by physical nozzle area. On the other hand, the throttle solution excels at achieving very low loads, theoretically down to 10%, which can be valuable in case of extreme flexibility scenarios, but it has a significant decline in ηth/ηth,d to 40%. Sliding mode turned out as a balanced middle option, with a minimum load of about 20%, in which ηth/ηth,d equals approximately 60%.

4.2.2. Turbine Stage Characterization

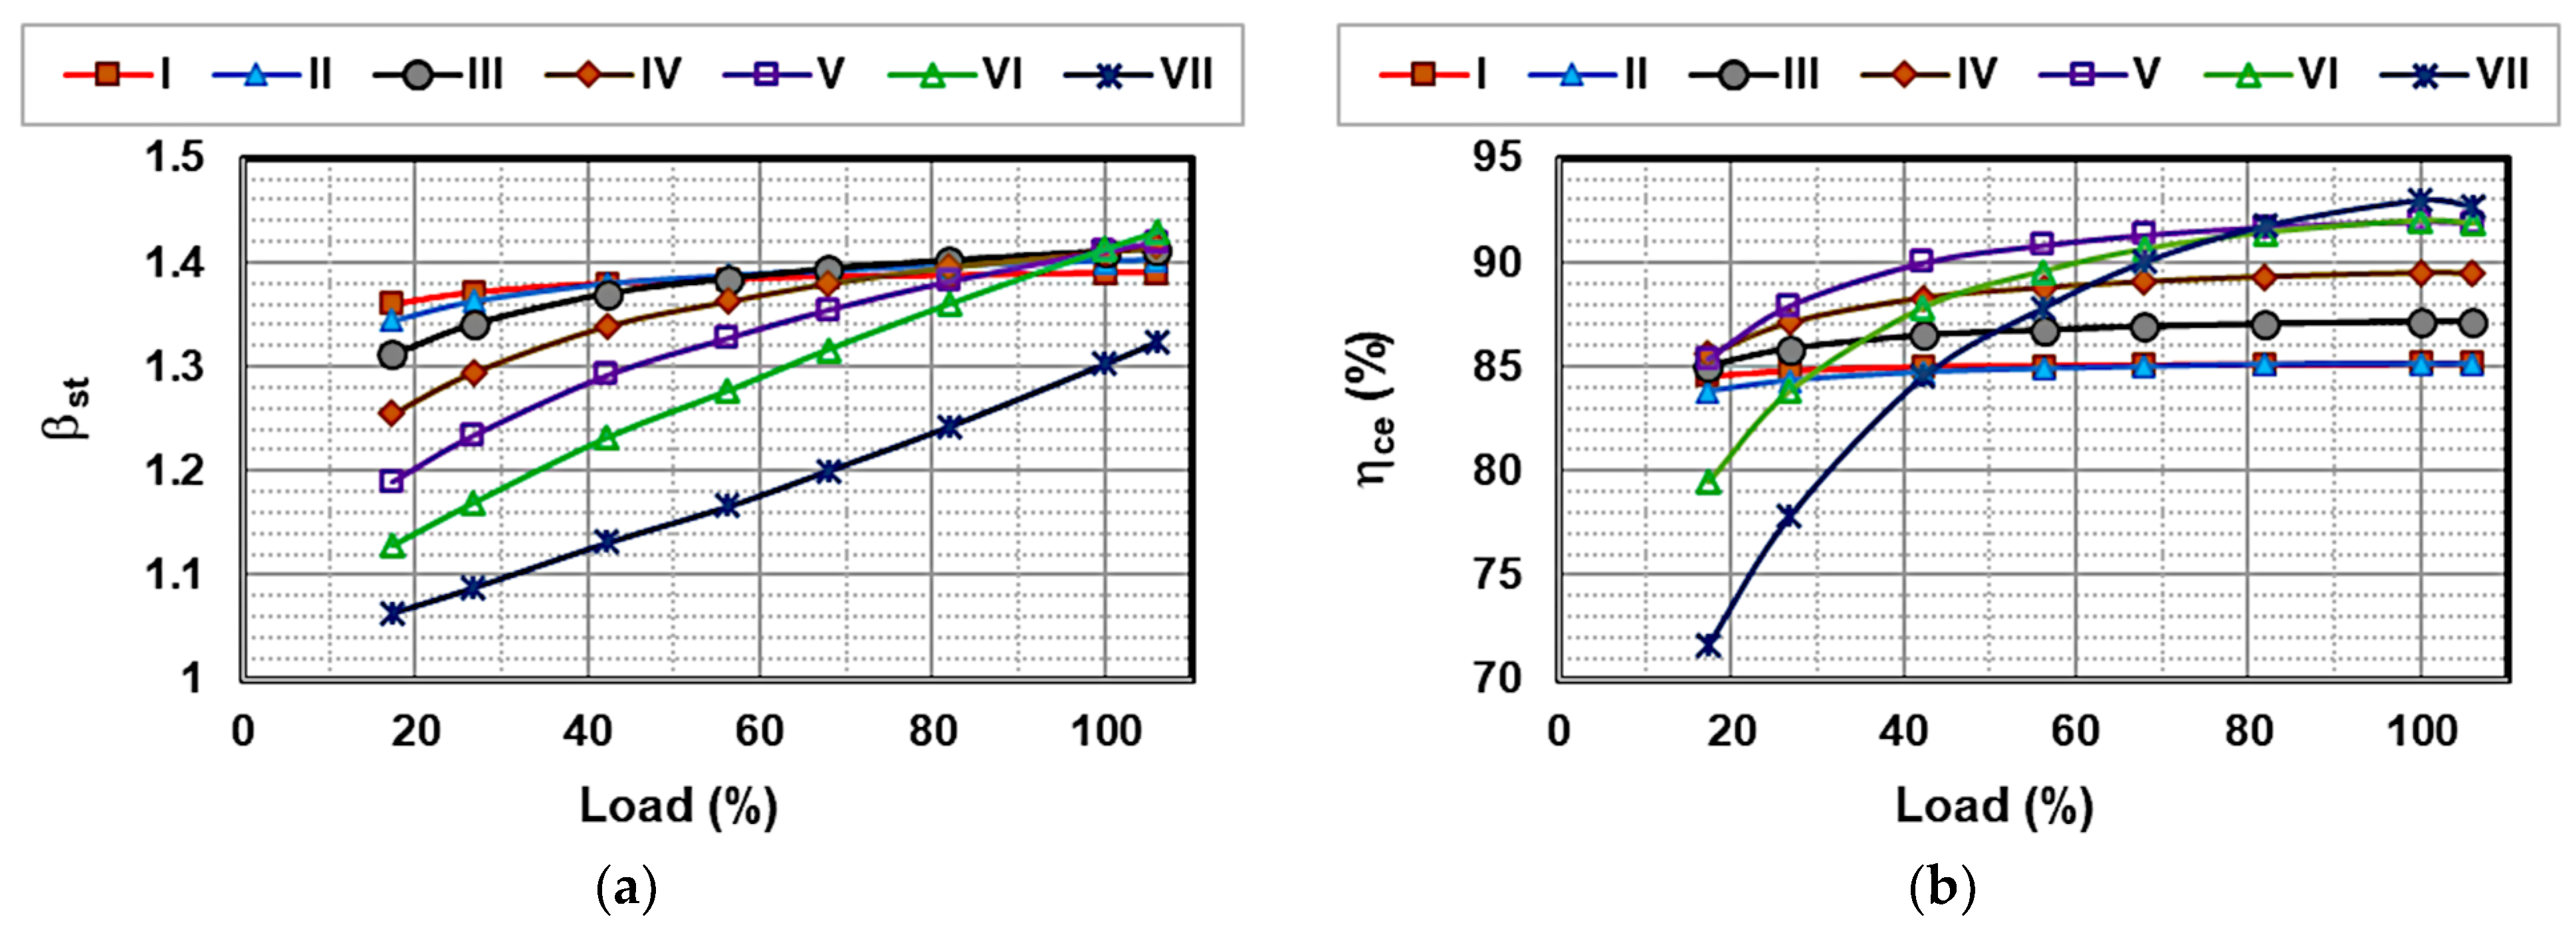
The assessment of the turbine off-design behavior focused on ηce and pressure ratio for each stage (βst), numbered from I to VII in descending order of inlet pressure, as the control mode varied.
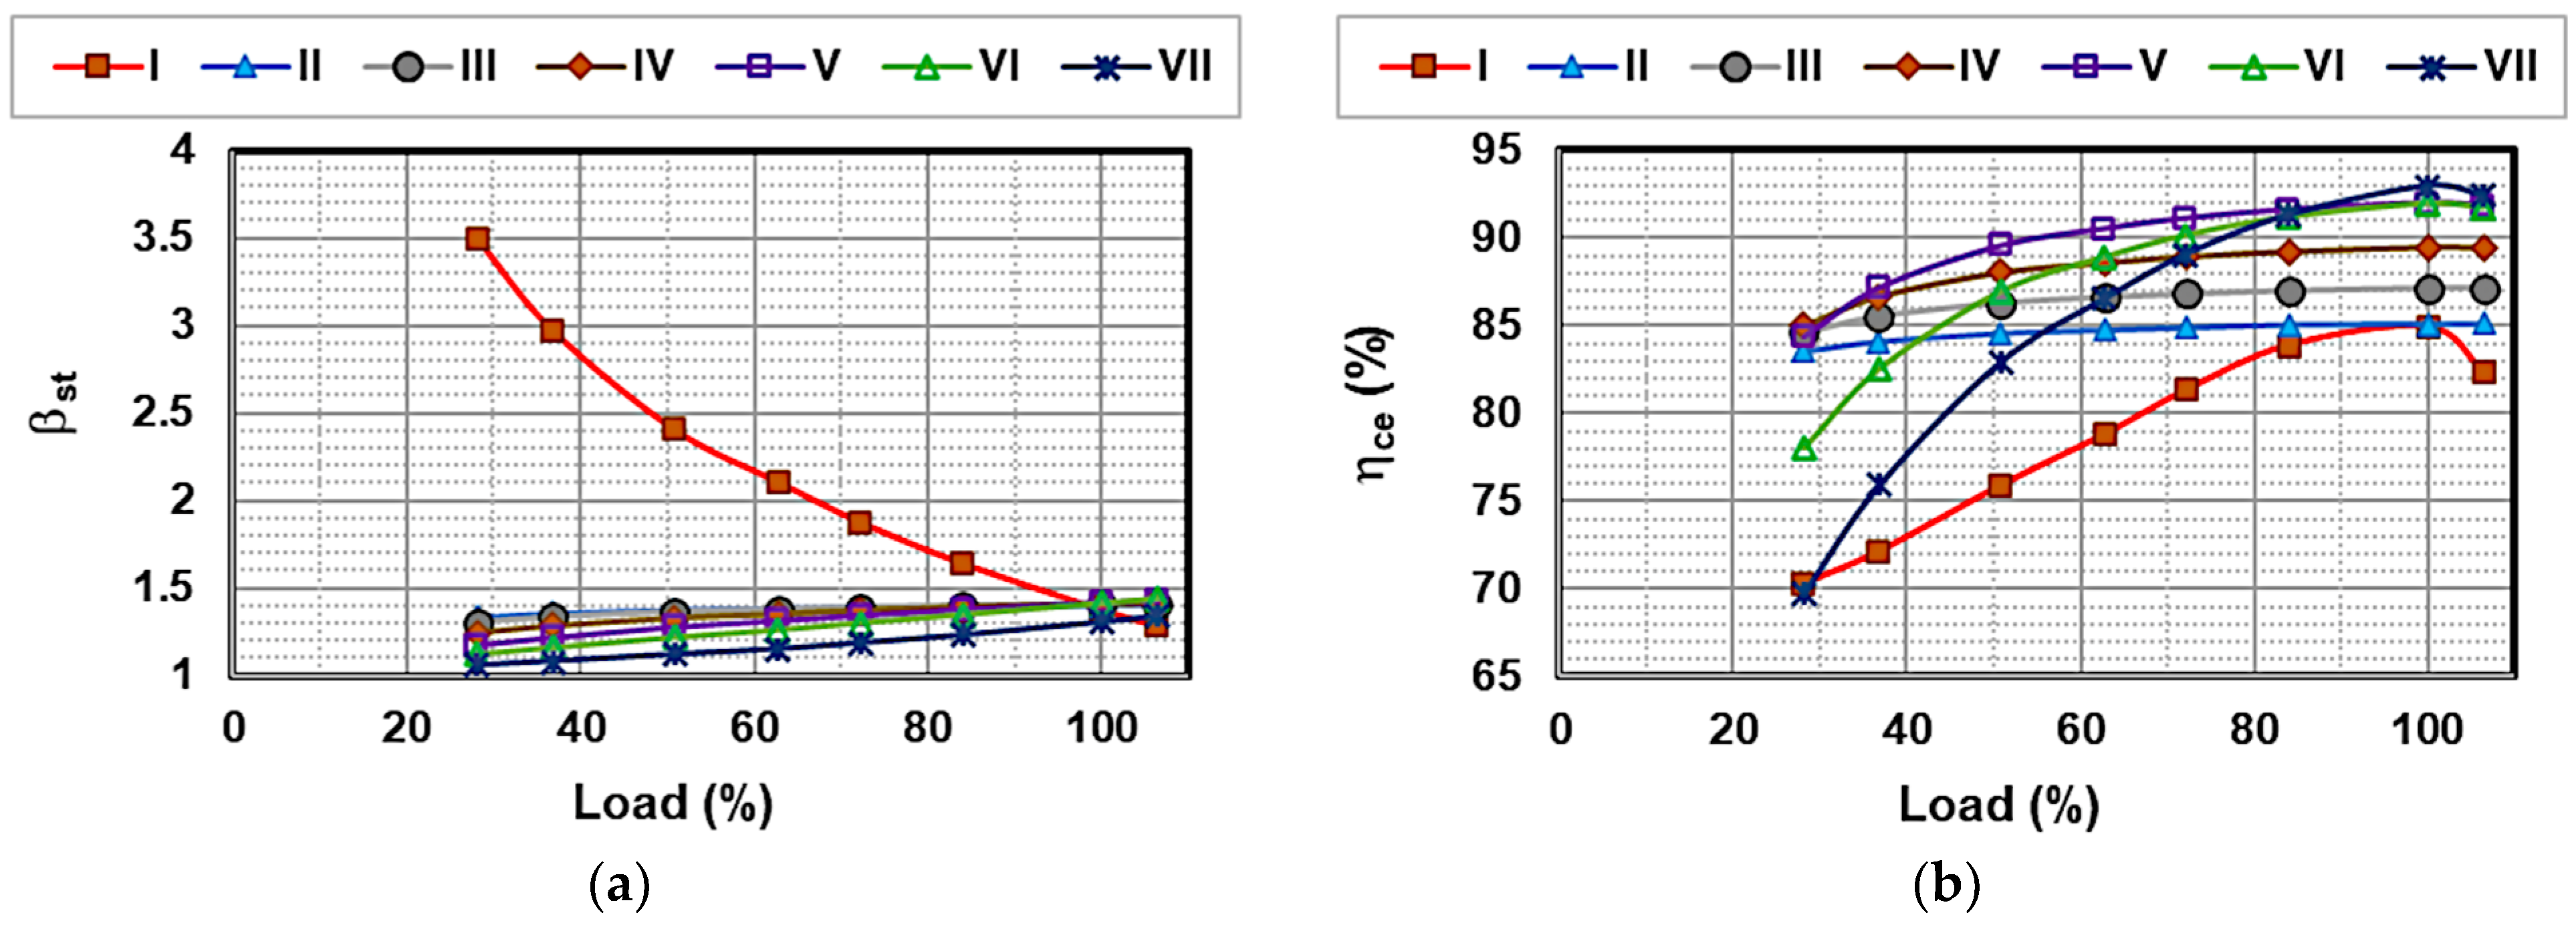
Starting from the sliding mode, Figure 7a shows that βst of high-pressure stages, from I to IV, is almost constant, or in other words, it decreases slightly when the load is reduced. On the contrary, the low-pressure stages, from V to VII, undergo a significant decrease in βst. Theoretically, βst for a sliding stage should not be affected by load variation since the outlet pressure goes hand in hand with the inlet pressure, thus avoiding changes in the velocity triangles and preserving total-to-total efficiency. This is what happens in stages I–IV, whose ηce remains essentially stable at the design value (Figure 7b).
On the other hand, low-pressure stages suffer a significant penalty in terms of ηce, particularly the last one (VII). At about 20% load, ηce,V, ηce,VI, and ηce,VII are equal to 86%, 81%, and 74%, respectively, compared to the nominal value of about 92%. This occurs because the TOP is fixed rather than being lowered at part-load. Therefore, βst of the last stages decreases at reduced load, with the last stage (VII) showing the lowest levels, resulting in the worst performance. As a rough estimate, a pmin of 8 bar would have allowed each stage to operate in “free” sliding mode, with an almost constant βst, hence, ηce. In fact, the crucial role played by pmin in pursuing a high part-load ηth was discussed in [17], where an optimal value of pmin was found at each load. The resulting downward trend of pmin with reduced load is a trade-off between the advantage of a higher ηce and the disadvantage of a greater amount of power required by CO2 compressors.
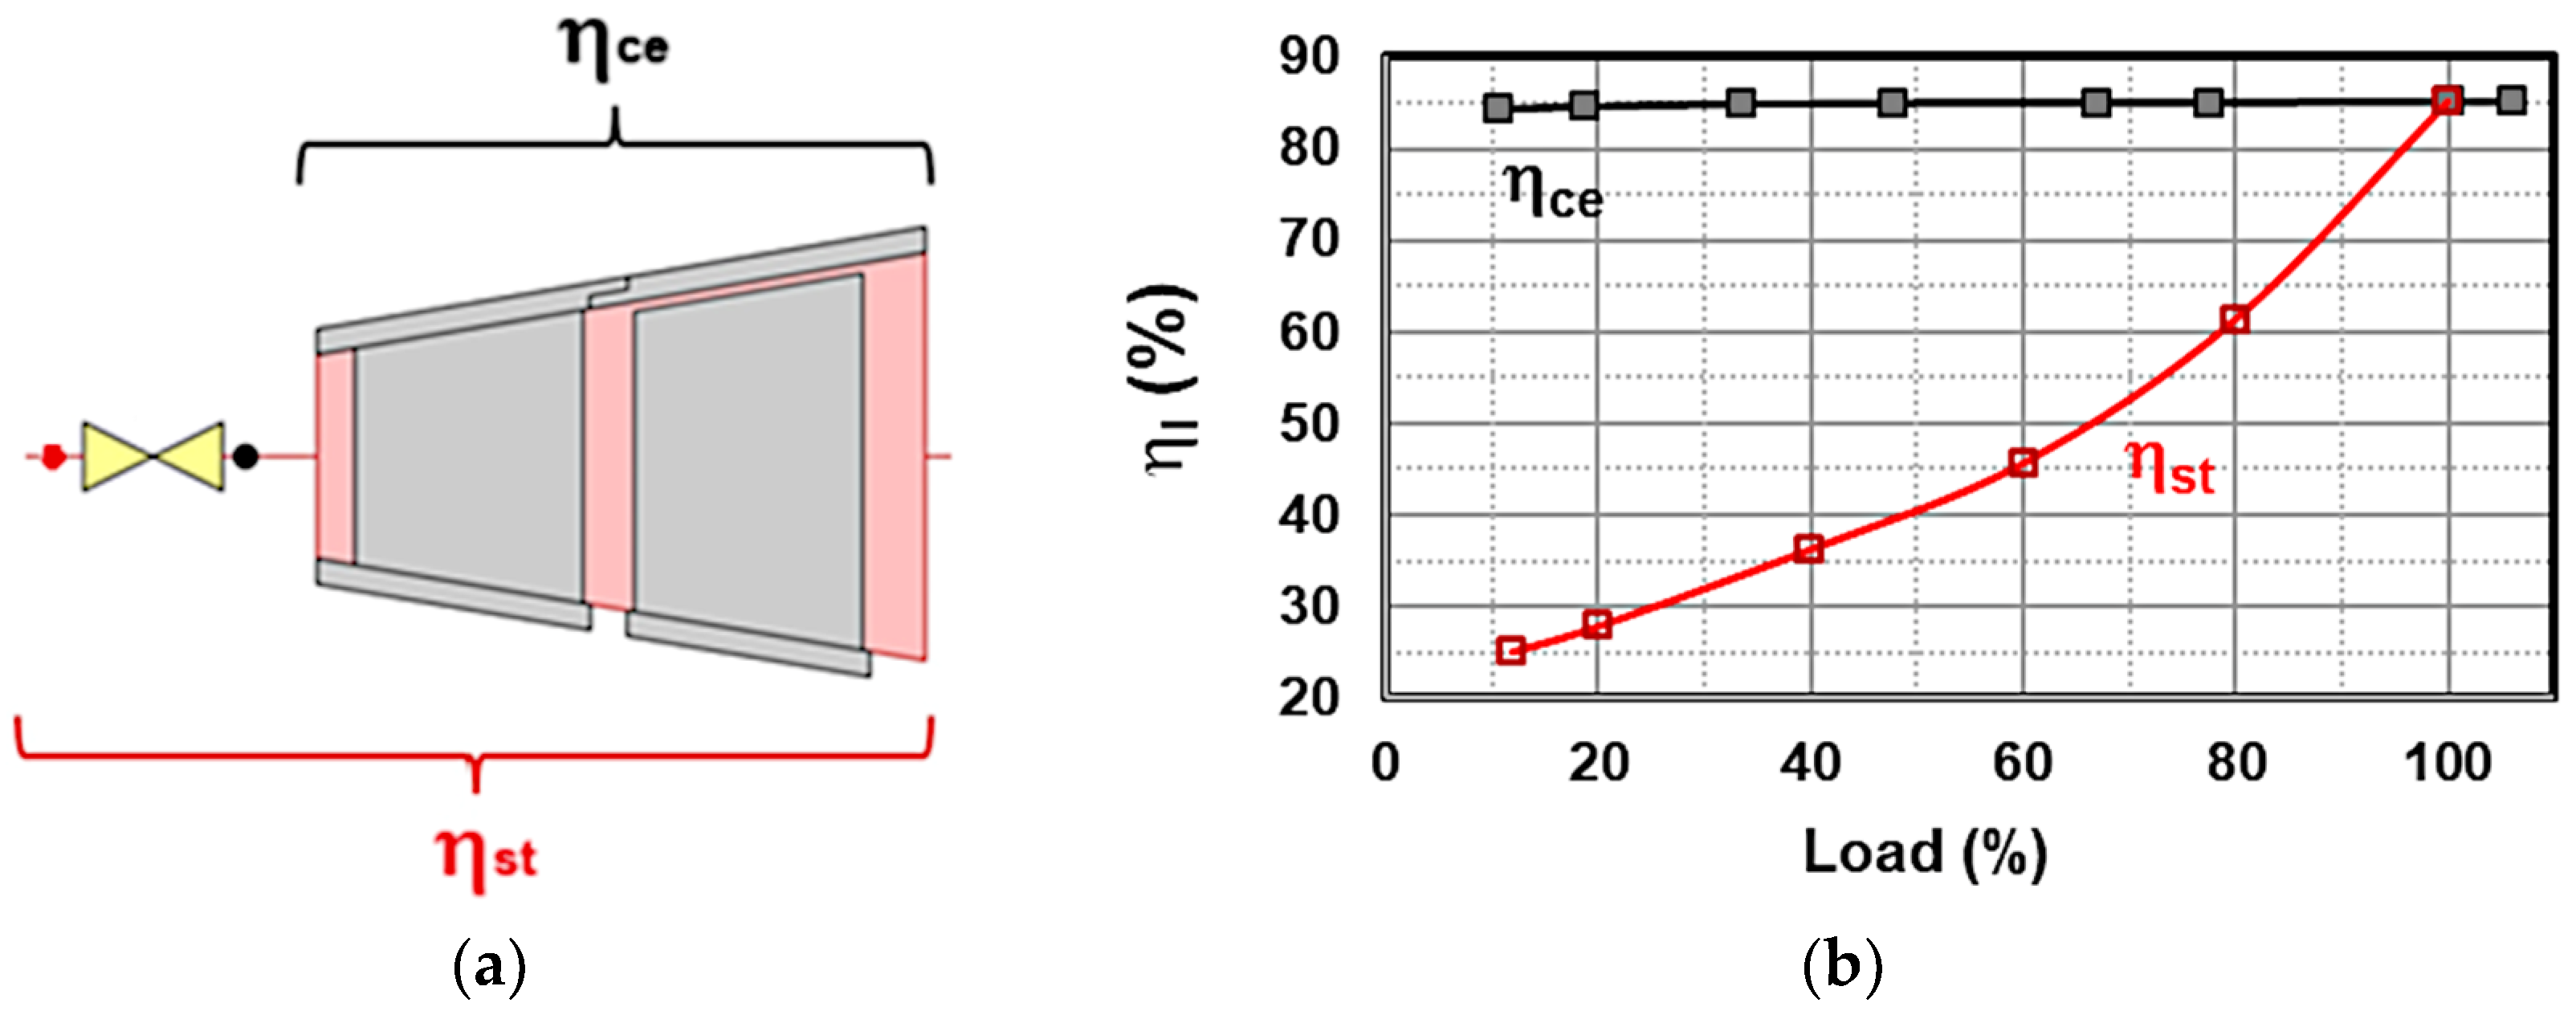
Moving on to the throttle mode, it is clear that the first stage, being directly involved in intake control, becomes increasingly overloaded as the load decreases, while the inlet valve closes progressively to ensure a constant TIP (Figure 8a). In fact, βst,I grows by more than 2.5 times compared to the design value, thus causing additional sources of loss, including those due to overexpansion. However, the corresponding profile of ηce,I, suggests that nominal performance at approximately 85% is guaranteed for the entire load range (Figure 8b). The reason is that ηce does not take into account the dissipative effect induced by iso-enthalpic throttling, as clarified in Figure 9a. Once this shortcoming is overcome, the overall stage performance (ηst) based on the inlet pressure upstream of the control valve reveals the expected derating. ηst,I is heavily penalized by partial load, dropping to about 30% at 20% load (Figure 9b). Furthermore, the gap between ηce,I and ηst,I reflects the difference between the pressure upstream of the valve, which is constant at the design value (see Figure 4a), and the pressure downstream of the valve, which drops progressively as the load decreases, thus implying an increase in entropy at constant enthalpy. On the other hand, the stages downstream of the first operate in sliding mode, so the considerations in the previous paragraph apply. In short, the negative impact that throttling mode has on the first stage of the turbine helps explain why ηth values are lower than those obtainable from sliding turbine control, especially at low loads (see Figure 6).
Finally, the nozzle strategy led to results similar to those of the throttle mode in terms of βst (Figure 10a). Once again, it is the first stage that pays the price of turbine control, being subject to rising βst, while all other stages have a constant or slightly decreasing βst when the load is reduced, as discussed above. The stage performance is correctly represented by ηce in this case, as demonstrated by the downward curve of ηce,I at part-load (Figure 10b). Although the pressures upstream and downstream of the control mechanism are identical, unlike in the throttle case, ηce,I still declines when the nozzles rotate from their optimal design condition. This is due to the fact that both the direction and velocity of the steam jet issuing from the nozzles deviate from the nominal condition. As a result, ηce,I drops from 85% to about 70% at 30% load, which is much better than the throttle solution (see ηst in Figure 9b), with consequent benefits on ηth. Profiles of ηce for the stages downstream of the first depend not only on the upstream constraint imposed by the nozzle control but also on the downstream constraint of constant TOP. Without the latter, stages II-VII would have a constant ηce, thus reiterating the importance of setting the appropriate conditions at the turbine outlet.

4.3. Influence of Ambient Temperature

A modification was implemented in the configuration of the power plant depicted in Figure 1 to assess the impact of Tamb on cycle performance. Specifically, the heat removal block (10) in the flue gas final treatment section was replaced by an air heat exchanger, as illustrated in Figure 11 for clarity. In fact, air-cooled systems are particularly well-suited for sCO2 cycles, as reported in [21]. The heat exchanger in Figure 11b was sized to guarantee an outlet gas temperature of 17 °C, which is in alignment with the design value of Tmin, under ISO conditions. Subsequently, establishing a connection between sink 12 and source 14 (in Figure 1), the inlet temperature of the first compressor stage is directly dependent on ambient conditions. For all other cooling needs, water was assumed to be available as a cold fluid, as previously suggested in [20]. It is important to remember that cooling water is essential for all inter-/aftercoolers in the multistage compression within the ASU (see Section 2.4 of [24] for more details) and for the intercooler and aftercooler within the compression train of the recirculated CO2 stream (components 16 and 20 in Figure 1, respectively). The initial temperature of the cooling water source was set at 15 °C, and it increased by 10 °C at the design condition, similar to [20].
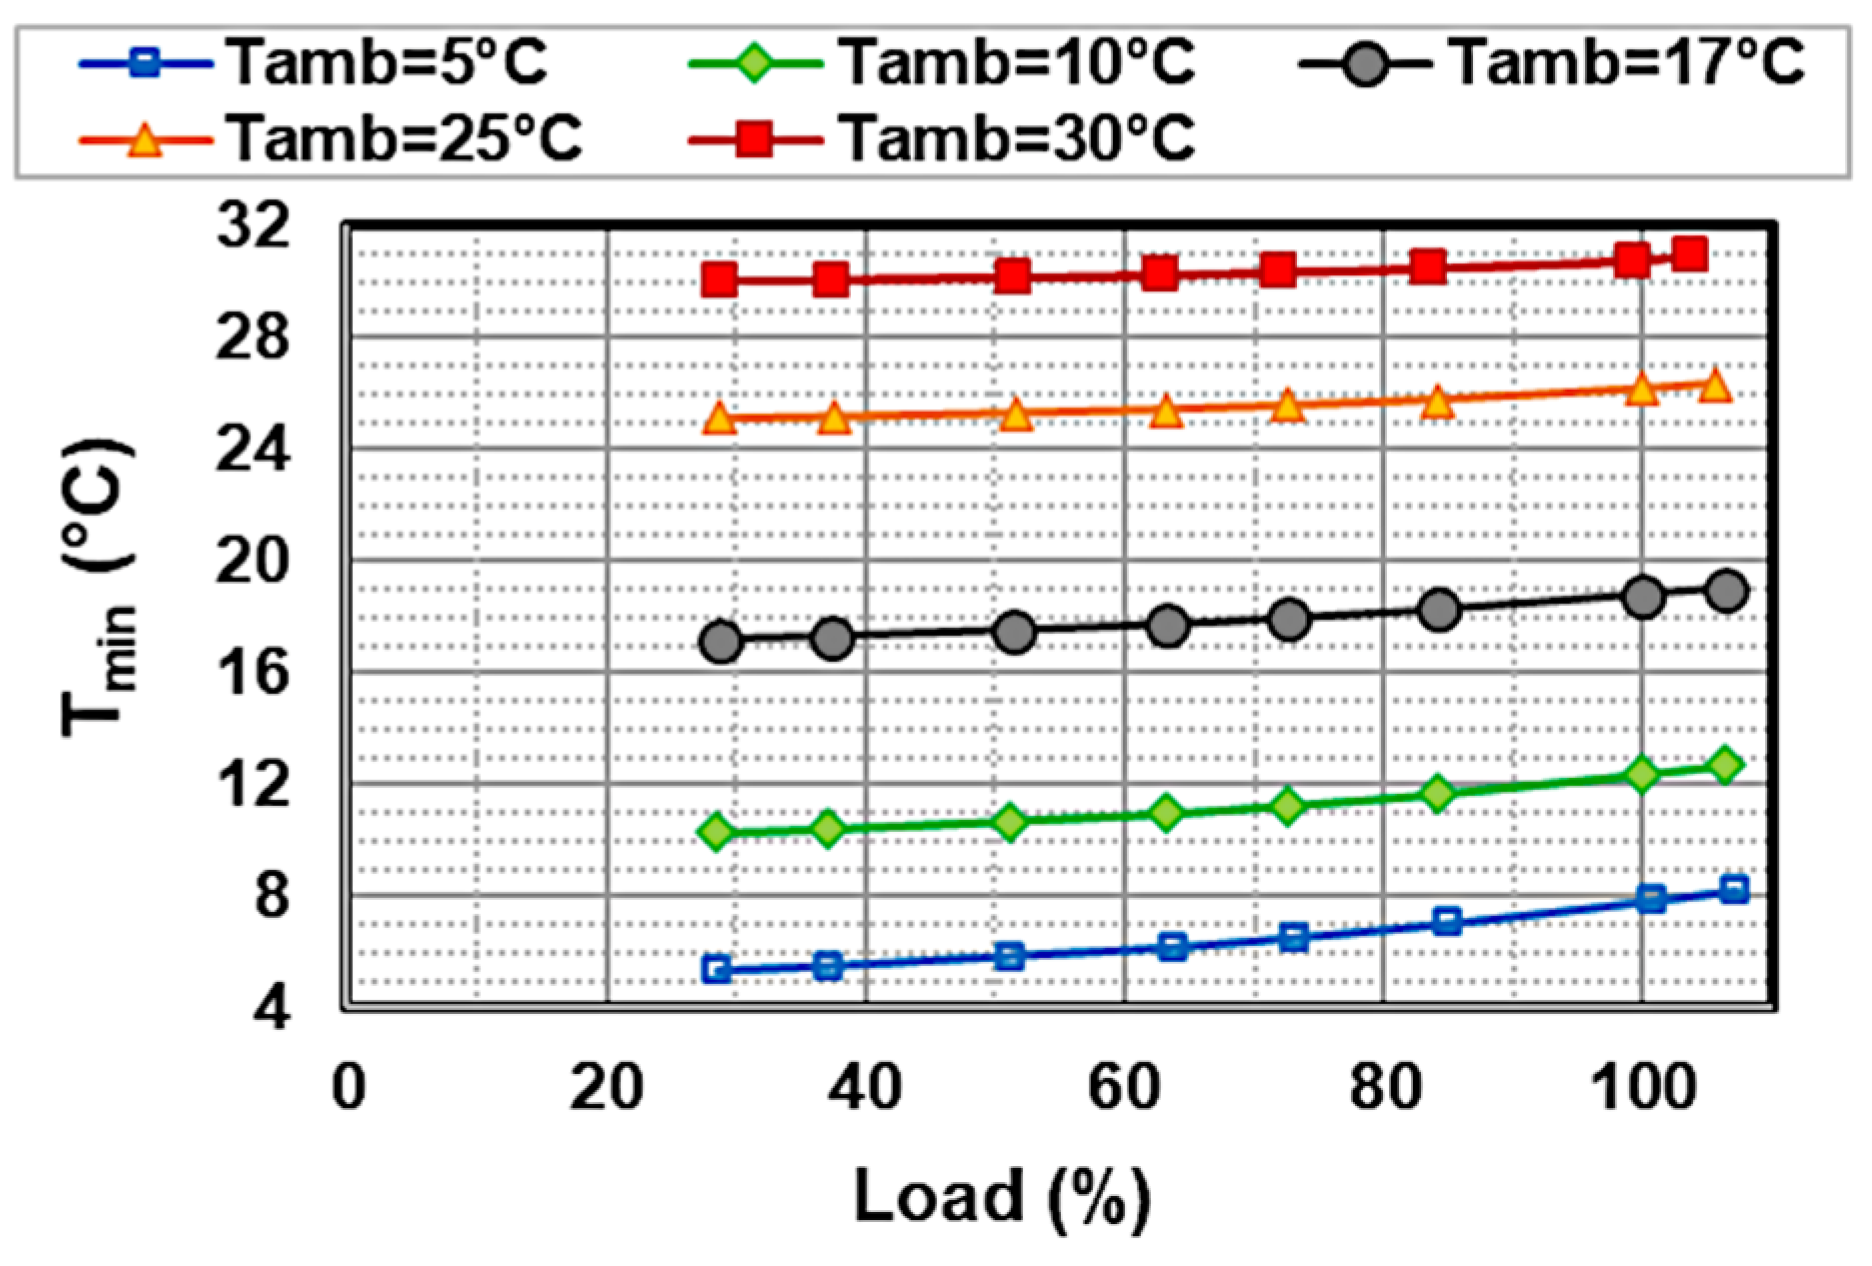
Off-design simulations at part-load were repeated for discrete values of Tamb in the range from 5 °C to 30 °C. The resulting values of Tmin can be inferred from Figure 12. It is obvious that they decrease as Tamb drops. Moreover, low loads contribute to slightly reduced Tmin for any Tamb, and this effect becomes more evident in cold weather. The nozzle mode, combined with “IGV+VC” control, was chosen because of its superior performance in terms of ηth, as documented in Section 4.2.1. The most affected components were found to be the ASU and compressors, with consequential implications on ηth.
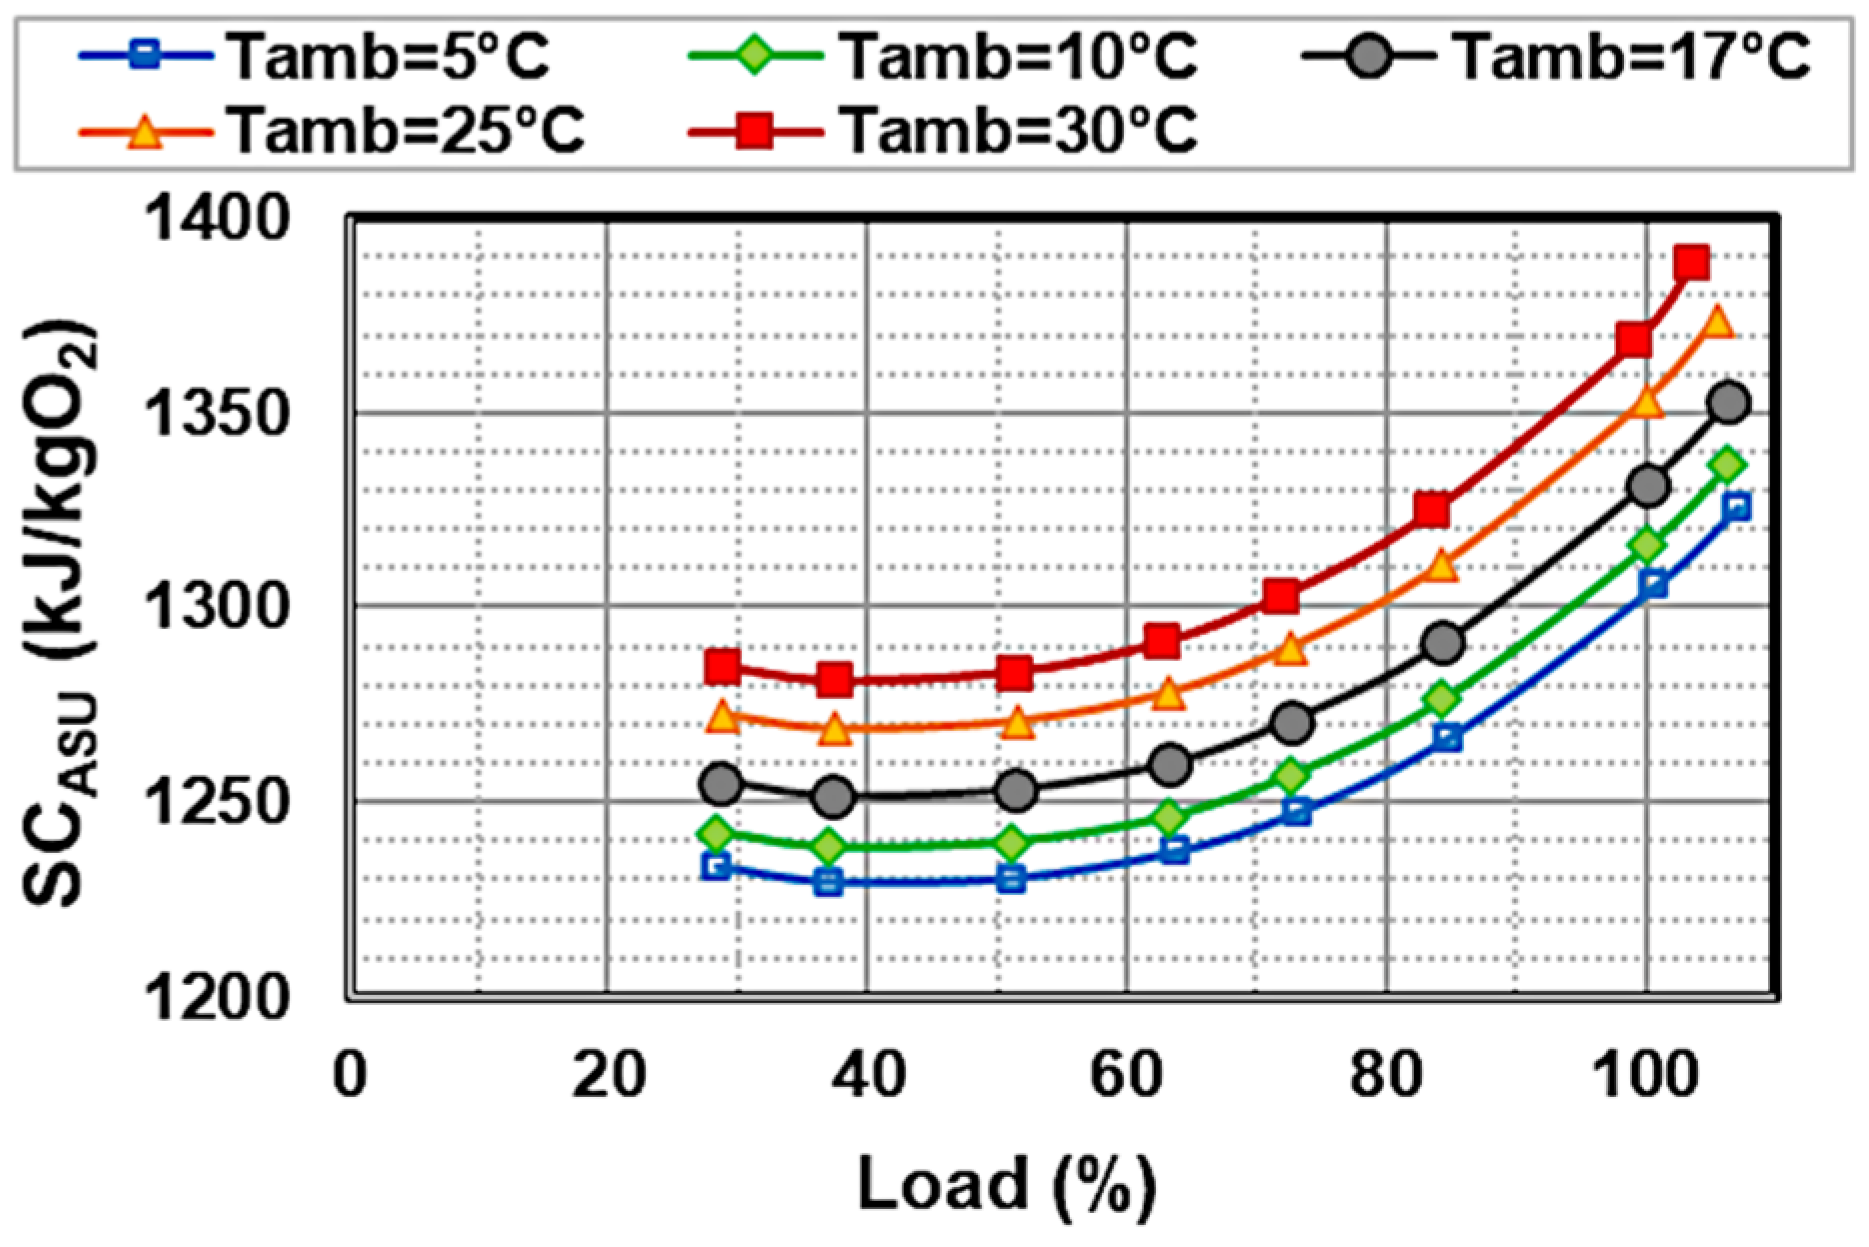
As regards the former, trends of SCASU in Figure 13 correspond to that in Figure 5a for nozzle control, here scaling with Tamb. The curves shift downward as Tamb decreases. Lowering Tamb to 5 °C translates into a reduction in SCASU of about 1.8% compared to ISO conditions, and this is valid for the entire load range. On the other hand, rising Tamb to 30 °C causes an increase in SCASU ranging from 2.3%, at the minimum load of 28%, to 2.7 at 100% load.
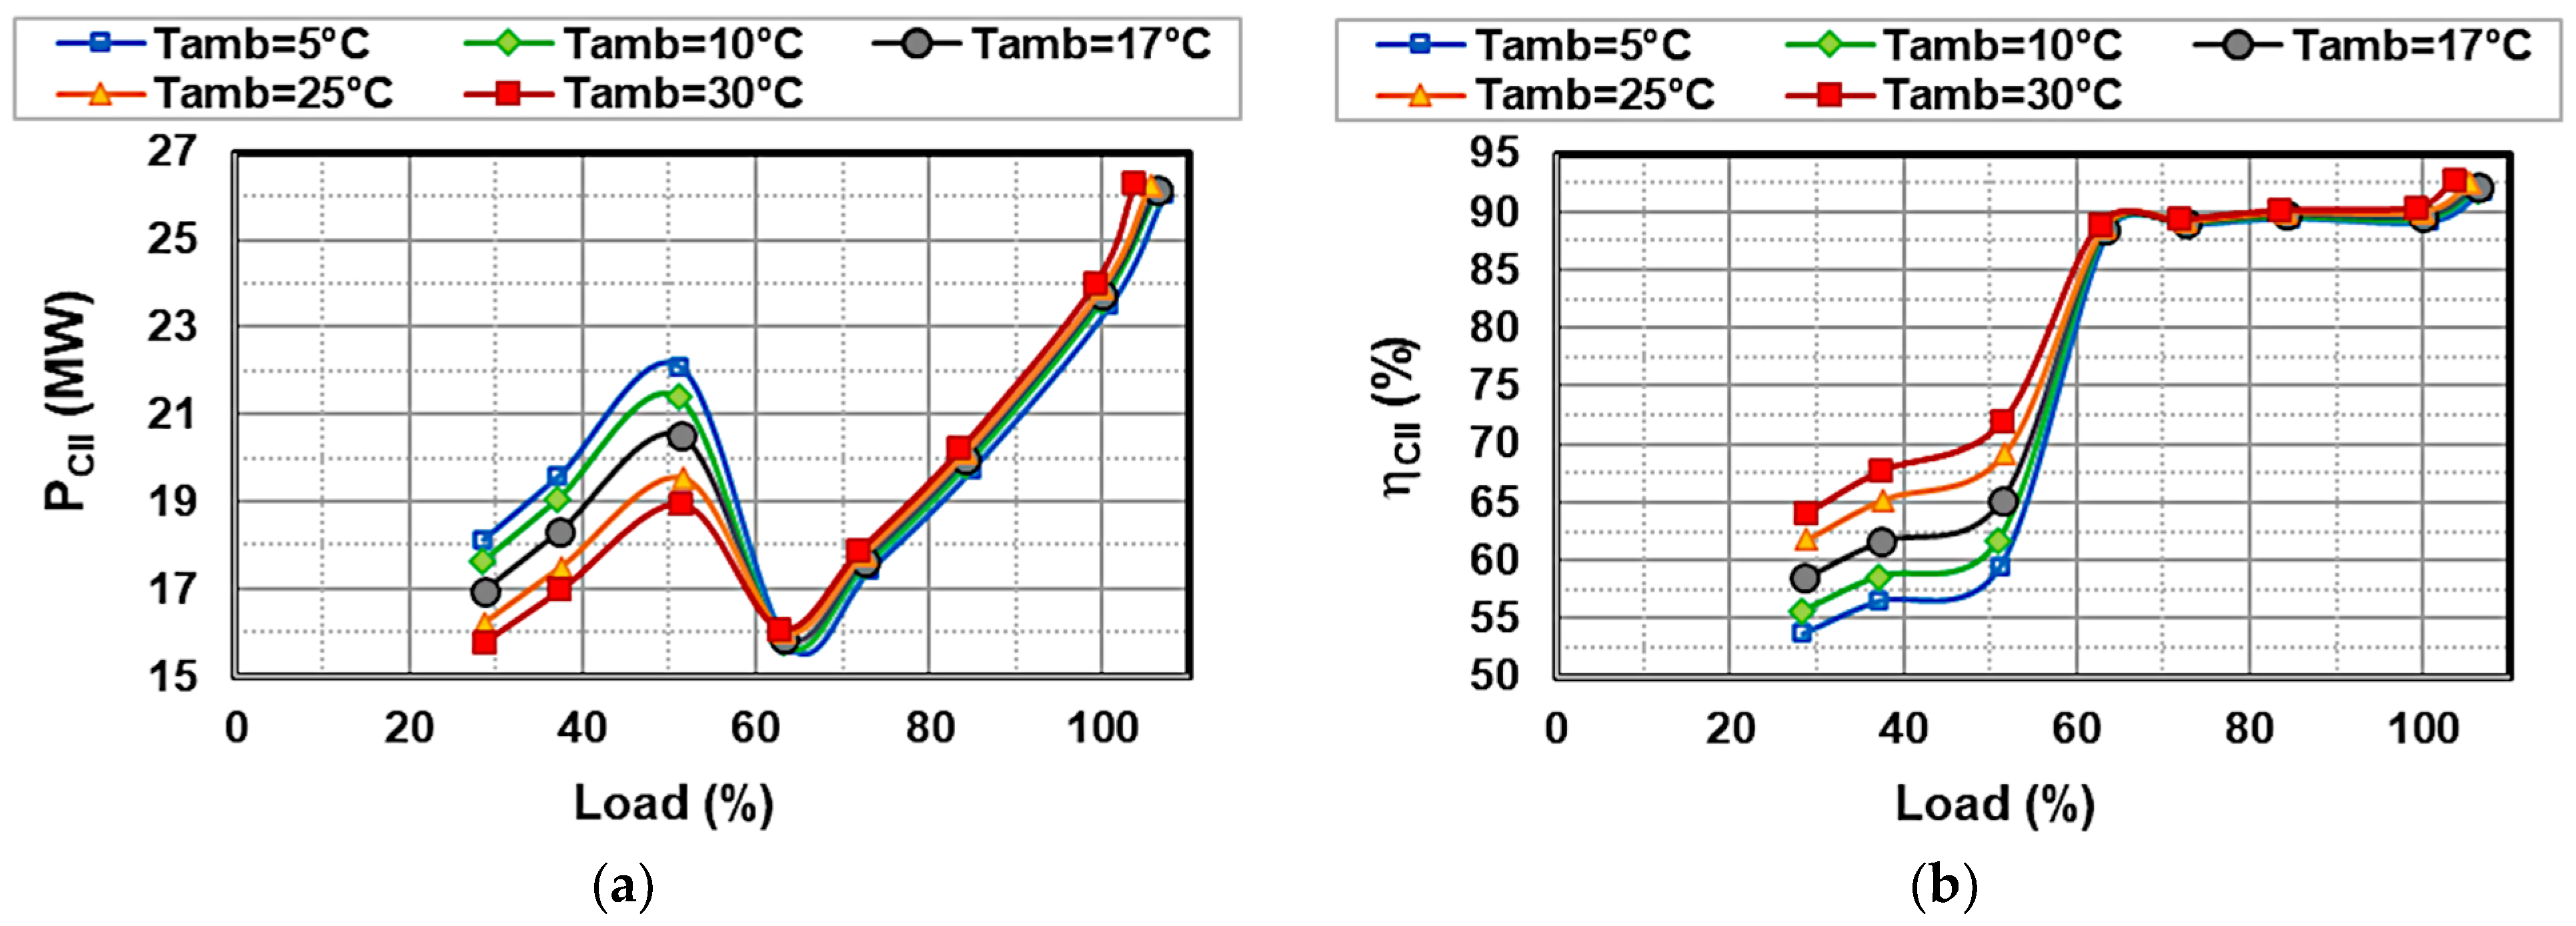
Regarding the latter, the first (I) compressor stage ((15) in Figure 1) behaves as expected, showing an increase in the power consumption (PC) in warmer climates for any load (Figure 14a). Furthermore, there is a positive linear relationship between PC and the load, with PC ranging from 10.5 MW, at the lowest load and Tamb, to 23.8 MW at the full load and highest Tamb. Figure 14b demonstrates that compression efficiency (ηC) is improved by cold weather. At each Tamb, the profile of ηC derives from the performance map (Figure 2), given the IGV position associated with the prescribed load. It can be inferred that loads below 70% are inevitably characterized by a decrease in ηC. The penalty reaches up to 3 pp compared to the maximum ηC value, while still benefiting from colder Tamb, i.e., inlet temperature.
Conversely, the second (II) compressor stage ((17) in Figure 1) has some counterintuitive features. As depicted in Figure 15a, the linear decrease in PC does not apply to loads below 60% because a hump appears at about half load. Moreover, in this load range, the role of Tamb is reversed, meaning that lower Tamb brings greater PC and also lower ηC (Figure 15b). At more than half loads, ηC varies from 64% to about 72% at Tamb = 30 °C, while lower values, from 54% to 59%, pertain to Tamb = 5 °C.
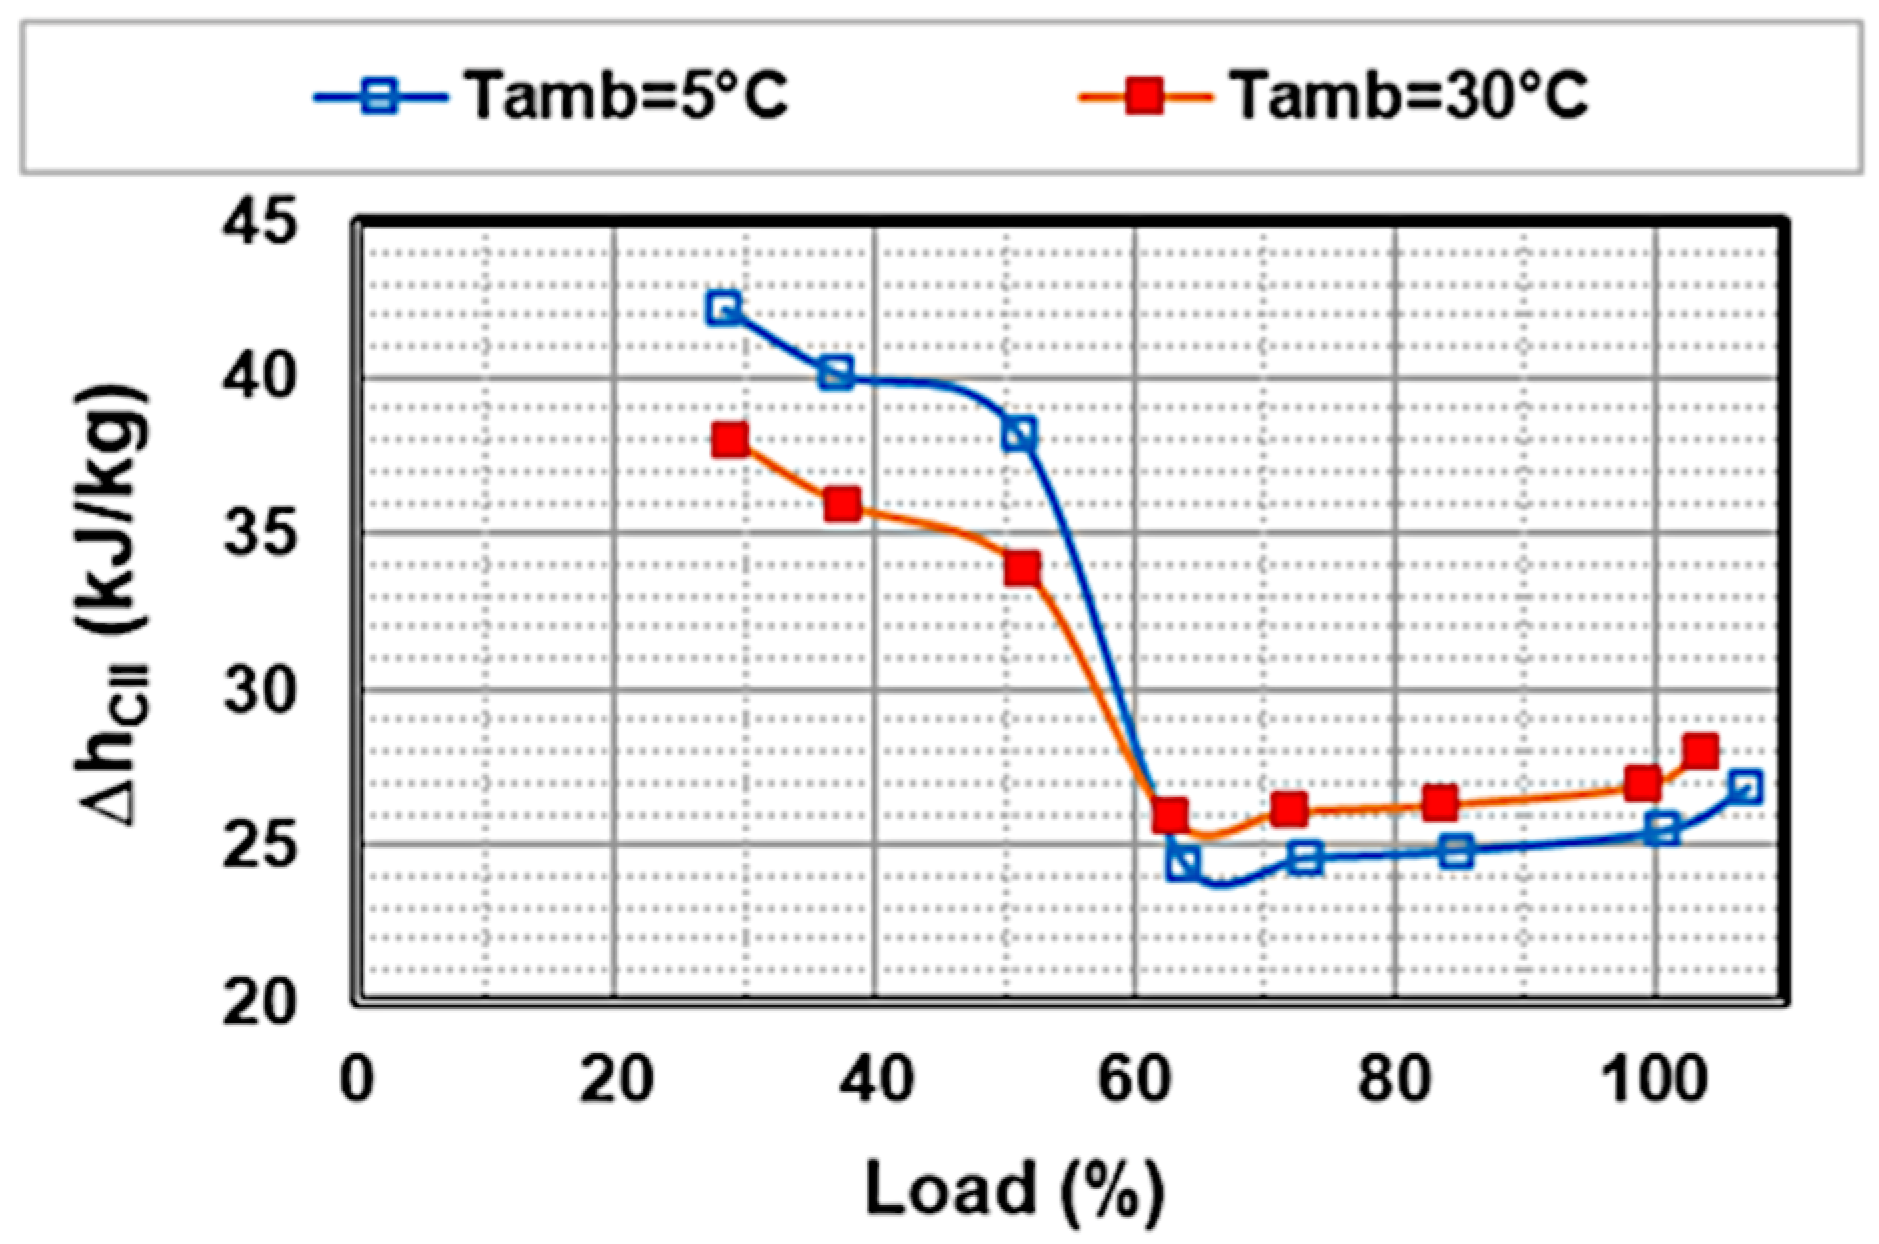
These seemingly strange results can be explained by the fluid properties. The enthalpy difference (Δh) between the compressor’s outlet and inlet increases when Tamb is reduced at loads below 60%, whereas the opposite occurs at higher loads (Figure 16). The inlet mass flow decreases as expected, from full to minimum load, regardless of Tamb. Moreover, at warmer conditions, the amount of flow to be compressed is lowered. Also, bear in mind that stage II operates under some fixed conditions, including an inlet temperature of 19.54 °C, ensured by the upstream intercooler, and an outlet pressure of 78 bar, set by CO2 export. In contrast, the inlet pressure, which depends on stage I, goes down as Tamb increases. Therefore, stage II compensates for this by increasing β as Tamb rises.
For completeness, the influence of Tamb on the dense phase pumps ((22) and (23) in Figure 1) was negligible. PC, ηC, and β are directly proportional to the load, regardless of Tamb.
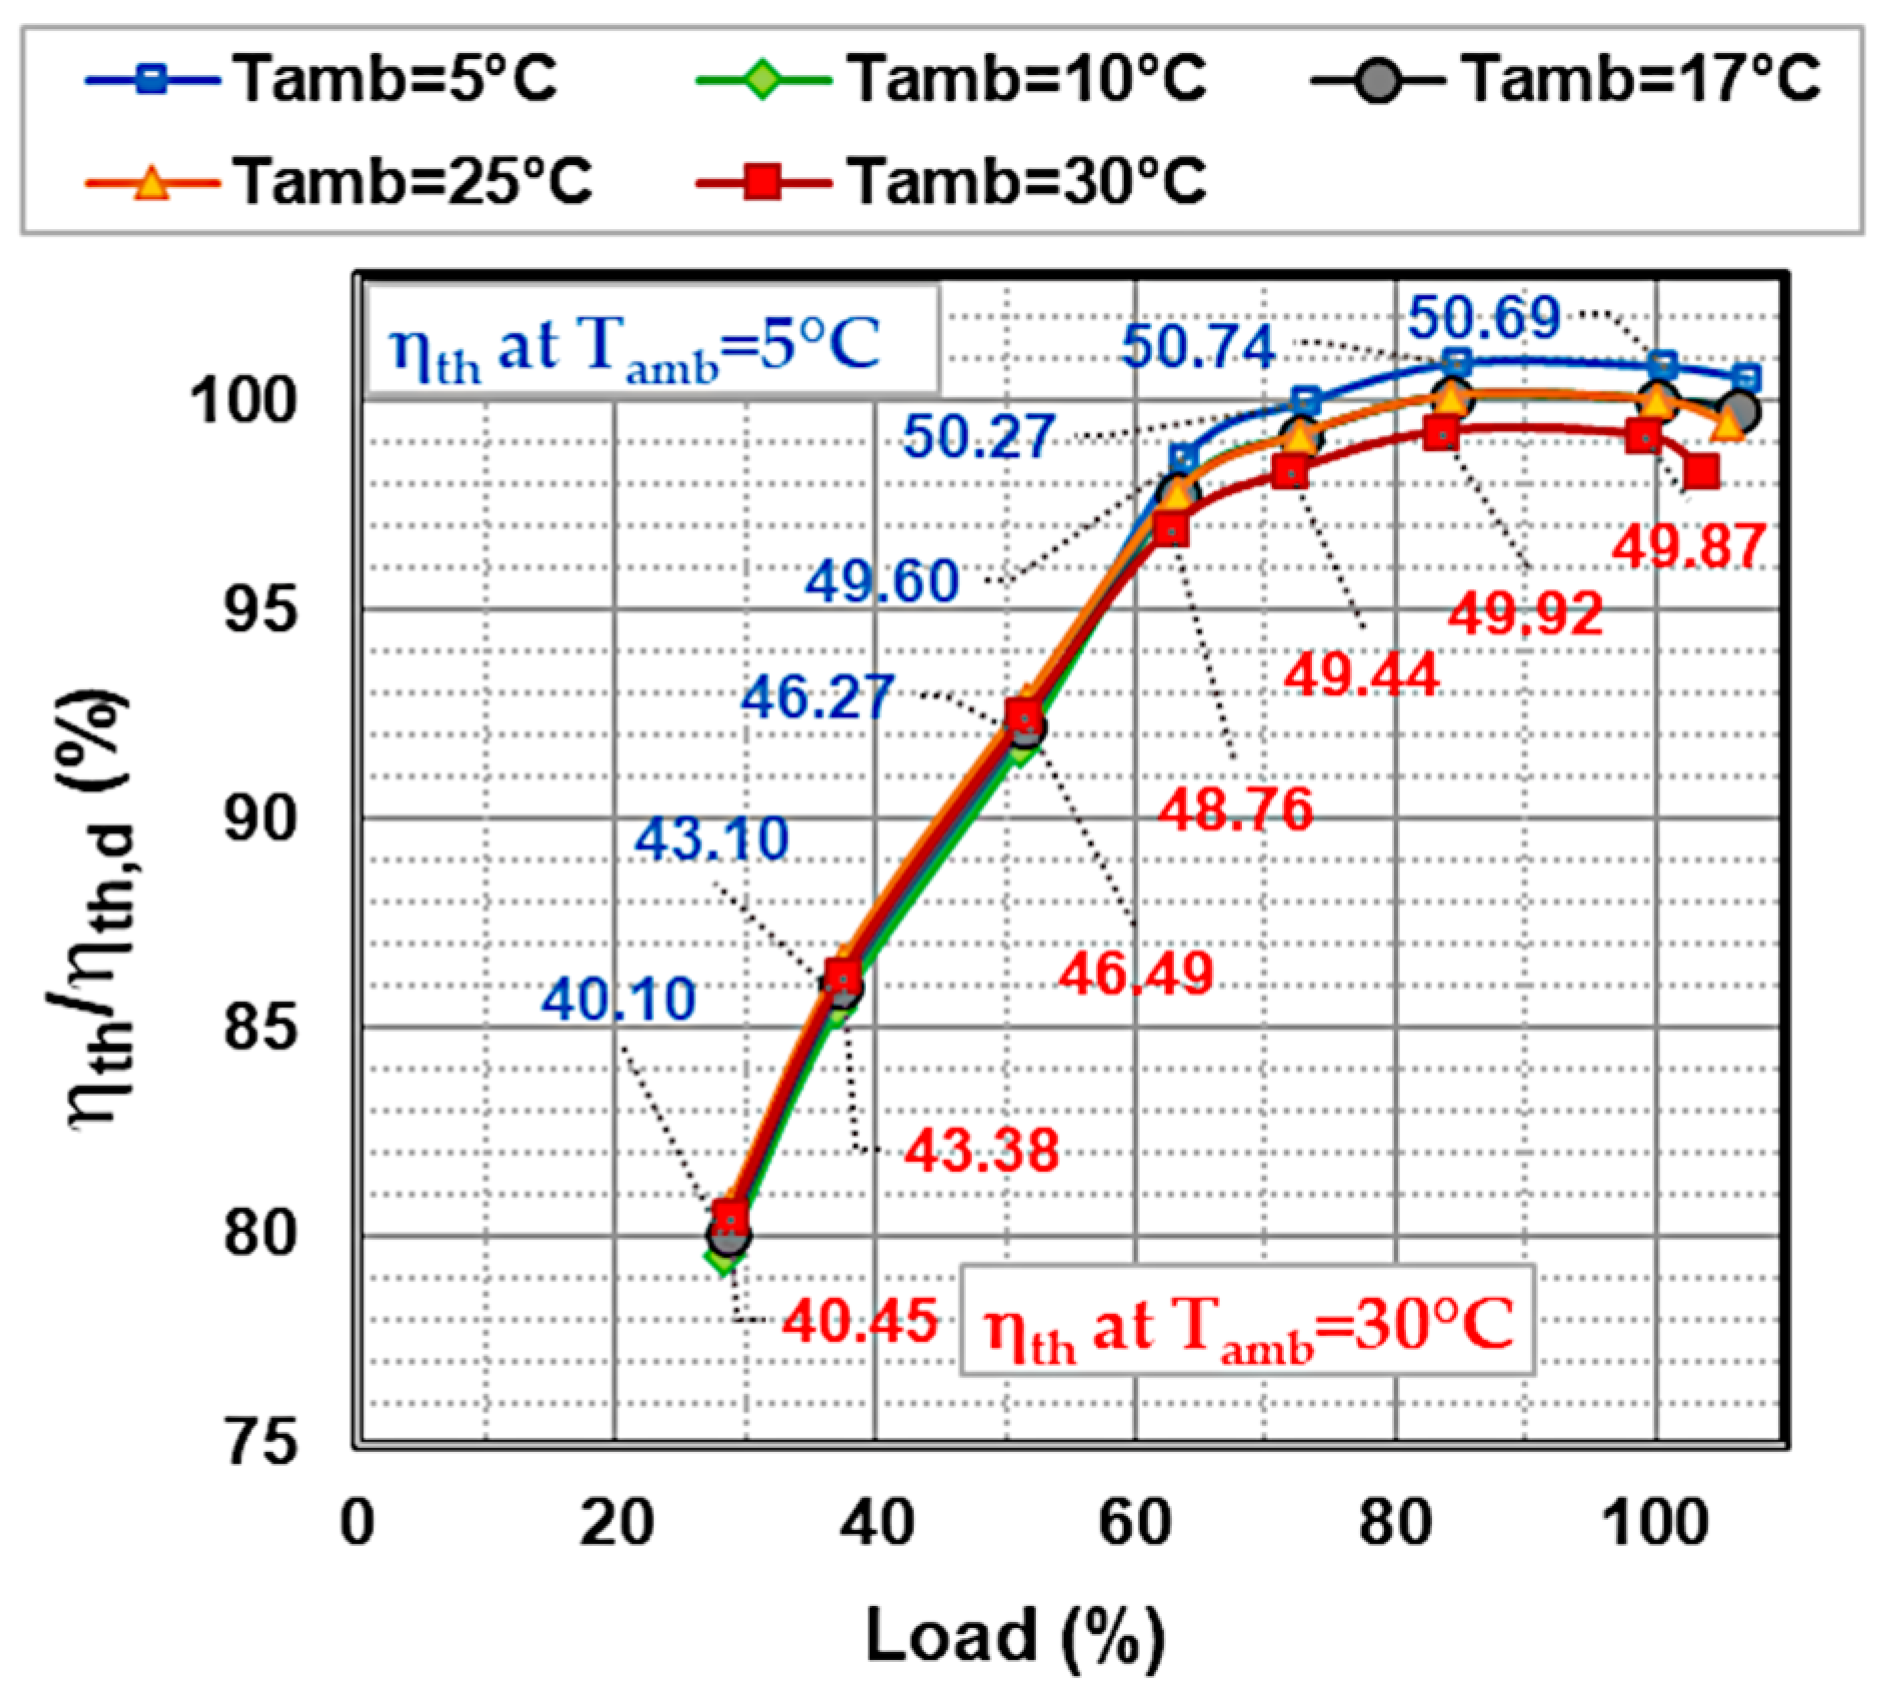
Figure 17 summarizes the overall impact of Tamb on cycle part-load operation. Changes in Tamb due to colder/warmer climatic conditions result in slightly higher/lower values of normalized ηth at relatively high loads, where all profiles reach a plateau. Compared to the intermediate case with Tamb = 17 °C, the gain/loss in ηth when reaching the left/right end of the Tamb range remains within 0.5 pp, as quantified by the labels in Figure 17, which show the absolute values of ηth (%) for the extreme Tamb of 5 °C and 30 °C.
At loads below 60%, the curves overlap into a single line, showing an approximately linear correlation between load and ηth. Under severe partial load conditions, the degradation of the efficiency of all turbomachinery, including compressors, pumps, and turbine stages, prevails over the benefit deriving from compressing a colder working fluid. Consequently, the drop in ηth to about 80% of the nominal value at 30% load covers the entire Tamb range.

5. Conclusions

Thermodynamic simulations were performed under steady-state conditions to evaluate the Allam cycle’s ability to adapt to variations in load (based on power) and ambient temperature, following a previous study on design operation. The ultimate goal is to estimate its efficiency relative to real-world electricity generation, which involves fluctuations in demand combined with variability in environmental conditions.
Firstly, advanced control modes were applied to both the compressors and the turbine in order to reduce the load at the nominal minimum cycle temperature (17 °C). The combination of “IGV+VC” mode with turbine nozzle control has been shown to provide the smallest penalty in terms of cycle performance, with ηth falling to 80% of the design value at 30% load.
Then, maintaining this part-load control strategy as a reference, the cycle layout was modified to take into account the effect of climate conditions on the minimum cycle temperature. The impact of warm ambient air on ηth was found to be almost negligible at very low loads, i.e., below 60%, whereas a reduction in ηth within 0.5 pp was calculated at loads above 60%. It is worth noting that these predictions did not include the energy consumption of fans in mechanical draft cooling towers, with the aim of providing a different perspective from that found in the literature.
On the one hand, the Allam cycle could be promoted among flexible, dispatchable, and carbon-free power generation technologies for the upcoming energy scenario. On the other hand, further knowledge is needed to adjust the turbine outlet pressure according to the cycle load, with the goal of further boosting ηth, especially at low loads. Future research will focus on finding the optimal conditions at the turbine outlet for a given condition at the inlet for each load level. From a broader perspective, maintaining relatively high efficiency in off-design conditions, and not only at the design point, is crucial for the future of this technology in terms of economic sustainability and market competitiveness compared to established combined cycles.

Author Contributions

Conceptualization, S.R.; methodology and software, F.D., L.C. and S.R.; validation and simulation, F.D. and L.C.; writing—original draft preparation, S.R.; writing—review and editing, S.R.; supervision, S.R. All authors have read and agreed to the published version of the manuscript.

Funding

This research received no external funding.

Data Availability Statement

The original contributions presented in this study are included in the article. Further inquiries can be directed to the corresponding author.

Conflicts of Interest

The authors declare no conflicts of interest.

Abbreviations

The following abbreviations are used in this manuscript:
ASUAir separation unit
CConstant
CFCorrected flow
CO2Carbon dioxide
CSCorrected speed
DGVDiffuser guide vane
fFunctional dependence
FFFlow function
hEnthalpy
IGVInlet guide vane
LHVLower heating value
mMass flow rate
MWMolecular weight
nRotational speed
NGNatural gas
O2Oxygen
PPower
pPressure
ppPercentage points
RGas constant
sSupercritical
SCSpecific consumption
TTemperature
TFXThermoflex prediction
TIPTurbine inlet pressure
TITTurbine inlet temperature
TOPTurbine outlet pressure
TOTTurbine outlet temperature
VCVariable control
βPressure ratio
ΔDifference
γRatio of specific heat
ηEfficiency
Subscripts
ambAmbient
CCompressor
ceCooled expansion
dDesign
inInlet
isIsentropic
minMinimum
odOff-design
outOutlet
refReference
stStage
thThermal
yPolytropic

Appendix A

Table A1. Design operating conditions related to stream numbers (see red and orange boxes) in Figure 1 [24].
Stream Numberp (Bar)T (°C)h (kJ/kg)m (kg/s)
1218.11099.41270.3873.6
2155.81009.11147.3909.4
3110.5935.51048.2930.8
478.34872.5965941.5
555.56818.3894.7941.5
639.4766.2828941.5
7303.21193.81402.7839.9
8309.220468.34881.7
9309.220468.34780.1
102817−104.2941.5
112817−38.1915
132817−38.16909
1449.4562.82−7.55909
1548.4819.54−70.72909
167857.13−50.37909
177857.13−50.3727.27
187857.13−50.37881.7
2076.4716−269.6690.7
2176.4716−269.6191.1
22309.297.1531.3447.88
23303.2722.2742.8780.1
27315.4116.9−83.47881.7
28321.738.54−239.2881.7
30321.738.54−239.2690.7
31702511.9349,976
32309.2141.811.9350,212
33309.220468.3418.55
3430.31727.5778.8941.5
35321.738.54−239.2191.1
36309.220468.3415.17
37309.220468.3417.86
3828.5640.54−74.98941.5
39309.220468.3417.97
4029.13118.970.83941.5
4129.71253214.4941.5
42309.220468.3411.17
43309.220468.3420.95
44309.220468.3410.2
45309.220468.345.976
46309.220468.344.776
48309.220468.3449.98
49309.220468.3451.7

References

  1. IEA. Global Energy Review 2025; International Energy Agency: Paris, France, 2025. [Google Scholar]
  2. EMBER. Global Electricity Review 2024; Ember: London, UK, 2024; Available online: https://ember-energy.org/app/uploads/2024/05/Report-Global-Electricity-Review-2024.pdf (accessed on 22 May 2025).
  3. Friedlingstein, P.; O’sullivan, M.; Jones, M.W.; Andrew, R.M.; Hauck, J.; Landschützer, P.; Le Quéré, C.; Li, H.; Luijkx, I.T.; Olsen, A.; et al. Global Carbon Budget 2024. Earth Syst. Sci. Data 2025, 17, 965–1039. [Google Scholar] [CrossRef]
  4. Allam, R.J.; Palmer, M.R.; Brown, G.W., Jr. System and Method for High Efficiency Power Generation Using a Carbon Dioxide Circulating Working Fluid. Assignee: 8 Rivers Capital LLC Palmer Labs LLC. U.S. Patent US8596075B2, 3 December 2013. [Google Scholar]
  5. Allam, R.J.; Fetvedt, J.E.; Forrest, B.A.; Freed, D.A. The oxy-fuel, supercritical CO2 Allam Cycle: New cycle developments to produce even lower-cost electricity from fossil fuels without atmospheric emissions. In Proceedings of the ASME Turbo Expo 2014: Turbomachinery Technical Conference and Exposition, Düsseldorf, Germany, 16–20 June 2014. [Google Scholar]
  6. Martin, S.; Forrest, B.; Rafati, N.; Lu, X.; Fetvedt, J.; McGroddy, M.; Brown, B.; Allam, R.; Beauchamp, D.; Freed, D. Progress update on the Allam cycle: Commercialization of Net Power and the Net Power demonstration facility. In Proceedings of the 14th International Conference on Greenhouse Gas Control Technologies, GHGT-14, Melbourne, Australia, 21–25 October 2018. [Google Scholar]
  7. Project Permian. Available online: https://netpower.com/projects/ (accessed on 22 May 2025).
  8. Reale, F. The Allam Cycle: A Review of Numerical Modeling Approaches. Energies 2023, 16, 7678. [Google Scholar] [CrossRef]
  9. Allam, R.J.; Palmer, M.R.; Brown, G.W., Jr.; Fetvedt, J.; Freed, D.; Nomoto, H.; Itohb, M.; Okitab, N.; Jones, C., Jr. High efficiency and low cost of electricity generation from fossil fuels while eliminating atmospheric emissions, including carbon dioxide. Energy Procedia 2013, 37, 1135–1149. [Google Scholar] [CrossRef]
  10. Kindra, V.; Rogalev, A.; Lisin, E.; Osipov, S.; Zlyvko, O. Techno-economic analysis of the oxy-fuel combustion power cycles with near-zero emissions. Energies 2021, 14, 5358. [Google Scholar] [CrossRef]
  11. Scaccabarozzi, R.; Gatti, M.; Martelli, E. Thermodynamic analysis and numerical optimization of the NET Power oxy-combustion cycle. Appl. Energy 2016, 178, 505–526. [Google Scholar] [CrossRef]
  12. Wimmer, K.; Sanz, W. Optimization and comparison of the two promising oxy-combustion cycles NET Power cycle and Graz Cycle. Int. J. Greenh. Gas Control 2020, 99, 103055. [Google Scholar] [CrossRef]
  13. Rogalev, A.; Grigoriev, E.; Kindra, V.; Rogalev, N. Thermodynamic optimization and equipment development for a high efficient fossil fuel power plant with zero emissions. J. Clean. Prod. 2019, 236, 117592. [Google Scholar] [CrossRef]
  14. Rodríguez Hervás, G.; Petrakopoulou, F. Exergoeconomic analysis of the Allam cycle. Energy Fuels 2019, 33, 7561–7568. [Google Scholar] [CrossRef]
  15. Martinelli, M.; Chiesa, P.; Martelli, E. Techno-economic assessment of the Allam cycle for different plant sizes, oxygen purities and heat integration with external sources. Fuel 2025, 381, 133383. [Google Scholar] [CrossRef]
  16. Scaccabarozzi, R.; Gatti, M.; Martelli, E. Thermodynamic optimization and part-load analysis of the NET power cycle. Energy Procedia 2017, 114, 551–560. [Google Scholar] [CrossRef]
  17. Zaryab, S.A.; Scaccabarozzi, R.; Martelli, E. Advanced part-load control strategies for the Allam cycle. Appl. Therm. Eng. 2020, 168, 114822. [Google Scholar] [CrossRef]
  18. Fernandes, D.; Wang, S.; Xu, Q.; Chen, D. Dynamic simulations of the Allam cycle power plant integrated with an air separation unit. Int. J. Chem. Eng. 2019, 2019, 6035856. [Google Scholar] [CrossRef]
  19. Xie, M.; Chen, X.; Chen, L.; Zhou, M.; Liu, Y.; Zeng, L.; Shi, H.; Zhang, F.; Xie, S.; Zhao, Y. Evaluating the feasibility of a novel Allam cycle for co-generating power and water in hot regions. Energy Convers. Manag. 2024, 309, 118447. [Google Scholar] [CrossRef]
  20. Mitchell, C.; Avagyan, V.; Chalmers, H.; Lucquiaud, M. An initial assessment of the value of Allam Cycle power plants with liquid oxygen storage in future GB electricity system. Int. J. Greenh. Gas Control 2019, 87, 1–18. [Google Scholar] [CrossRef]
  21. Xie, M.; Zhou, M.; Chen, L.; Zhang, F.; Xiao, N.; Chen, X.; Xie, S.; Shah, N.; Zhao, Y. Techno-economic assessment of the modified Allam cycle configurations with multi-stage pump/compressor for efficient operation in hot regions. Energy Convers. Manag. 2024, 306, 118291. [Google Scholar] [CrossRef]
  22. Crespi, F.; De Arriba, P.R.; Sánchez, D.; Ayub, A.; Di Marcoberardino, G.; Invernizzi, C.M.; Martínez, G.S.; Iora, P.; Di Bona, D.; Binotti, M.; et al. Thermal efficiency gains enabled by using CO2 mixtures in supercritical power cycles. Energy 2022, 238, 121899. [Google Scholar] [CrossRef]
  23. Fernandes, D.; Wang, S.; Xu, Q.; Buss, R.; Chen, D. Process and Carbon Footprint Analyses of the Allam Cycle Power Plant Integrated with an Air Separation Unit. Clean Technol. 2019, 1, 325–340. [Google Scholar] [CrossRef]
  24. Colleoni, L.; Sindoni, A.; Ravelli, S. Comprehensive thermodynamic evaluation of the natural gas-fired Allam cycle at full load. Energies 2023, 16, 2597. [Google Scholar] [CrossRef]
  25. Allison, T.C.; Moore, J.J.; Cich, S.; White, S.; Pryor, O. Oxy-Fuel Combustion and Advanced Power Generation Turbines. USEA Webinar 2022. Available online: https://usea.org/sites/default/files/event-/SwRI%20USEA%20Webinar%20-%20sCO2%20Oxy-Combustion.pdf (accessed on 10 March 2025).
  26. Allam, R.; Martin, S.; Forrest, B.; Fetvedt, J.; Lu, X.; Freed, D.; Brown, G.W.; Sasaki, T.; Itoh, M.; Manning, J. Demonstration of the Allam Cycle: An Update on the Development Status of a High Efficiency Supercritical Carbon Dioxide Power Process Employing Full Carbon Capture. Energy Procedia 2017, 114, 5948–5966. [Google Scholar] [CrossRef]
  27. Haseli, Y.; Sifat, N. Performance modeling of Allam cycle integrated with a cryogenic air separation process. Comput. Chem. Eng. 2021, 148, 107263. [Google Scholar] [CrossRef]
  28. Marshall, M.; Anguiano, M.; Bensmiller, J.; Replogle, C.; Kerr, T.; Klaerner, G.; Moore, J.J. Detailed design and cost estimation of a 300 MWE oxy-fuel sCO2 turbine. In Proceedings of the ASME Turbo Expo 2025: Turbomachinery Technical Conference and Exposition, Memphis, TN, USA, 16–20 June 2025. [Google Scholar]
  29. Atlas Copco Gas and Process. Driving Centrifugal Compressor Technology; Atlas Copco Gas and Process: Cologne, Germany, 2022. [Google Scholar]
  30. El-Masri, M.A. Design of Gas Turbine Combined Cycles and Cogeneration Systems; Thermoflow Inc.: Southborough, MA, USA, 2009; pp. 5.1–5.16. [Google Scholar]
  31. El-Masri, M.A. GASCAN—An Interactive Code for Thermal Analysis of Gas Turbine Systems. J. Eng. Gas Turbines Power 1988, 110, 201–209. [Google Scholar] [CrossRef]
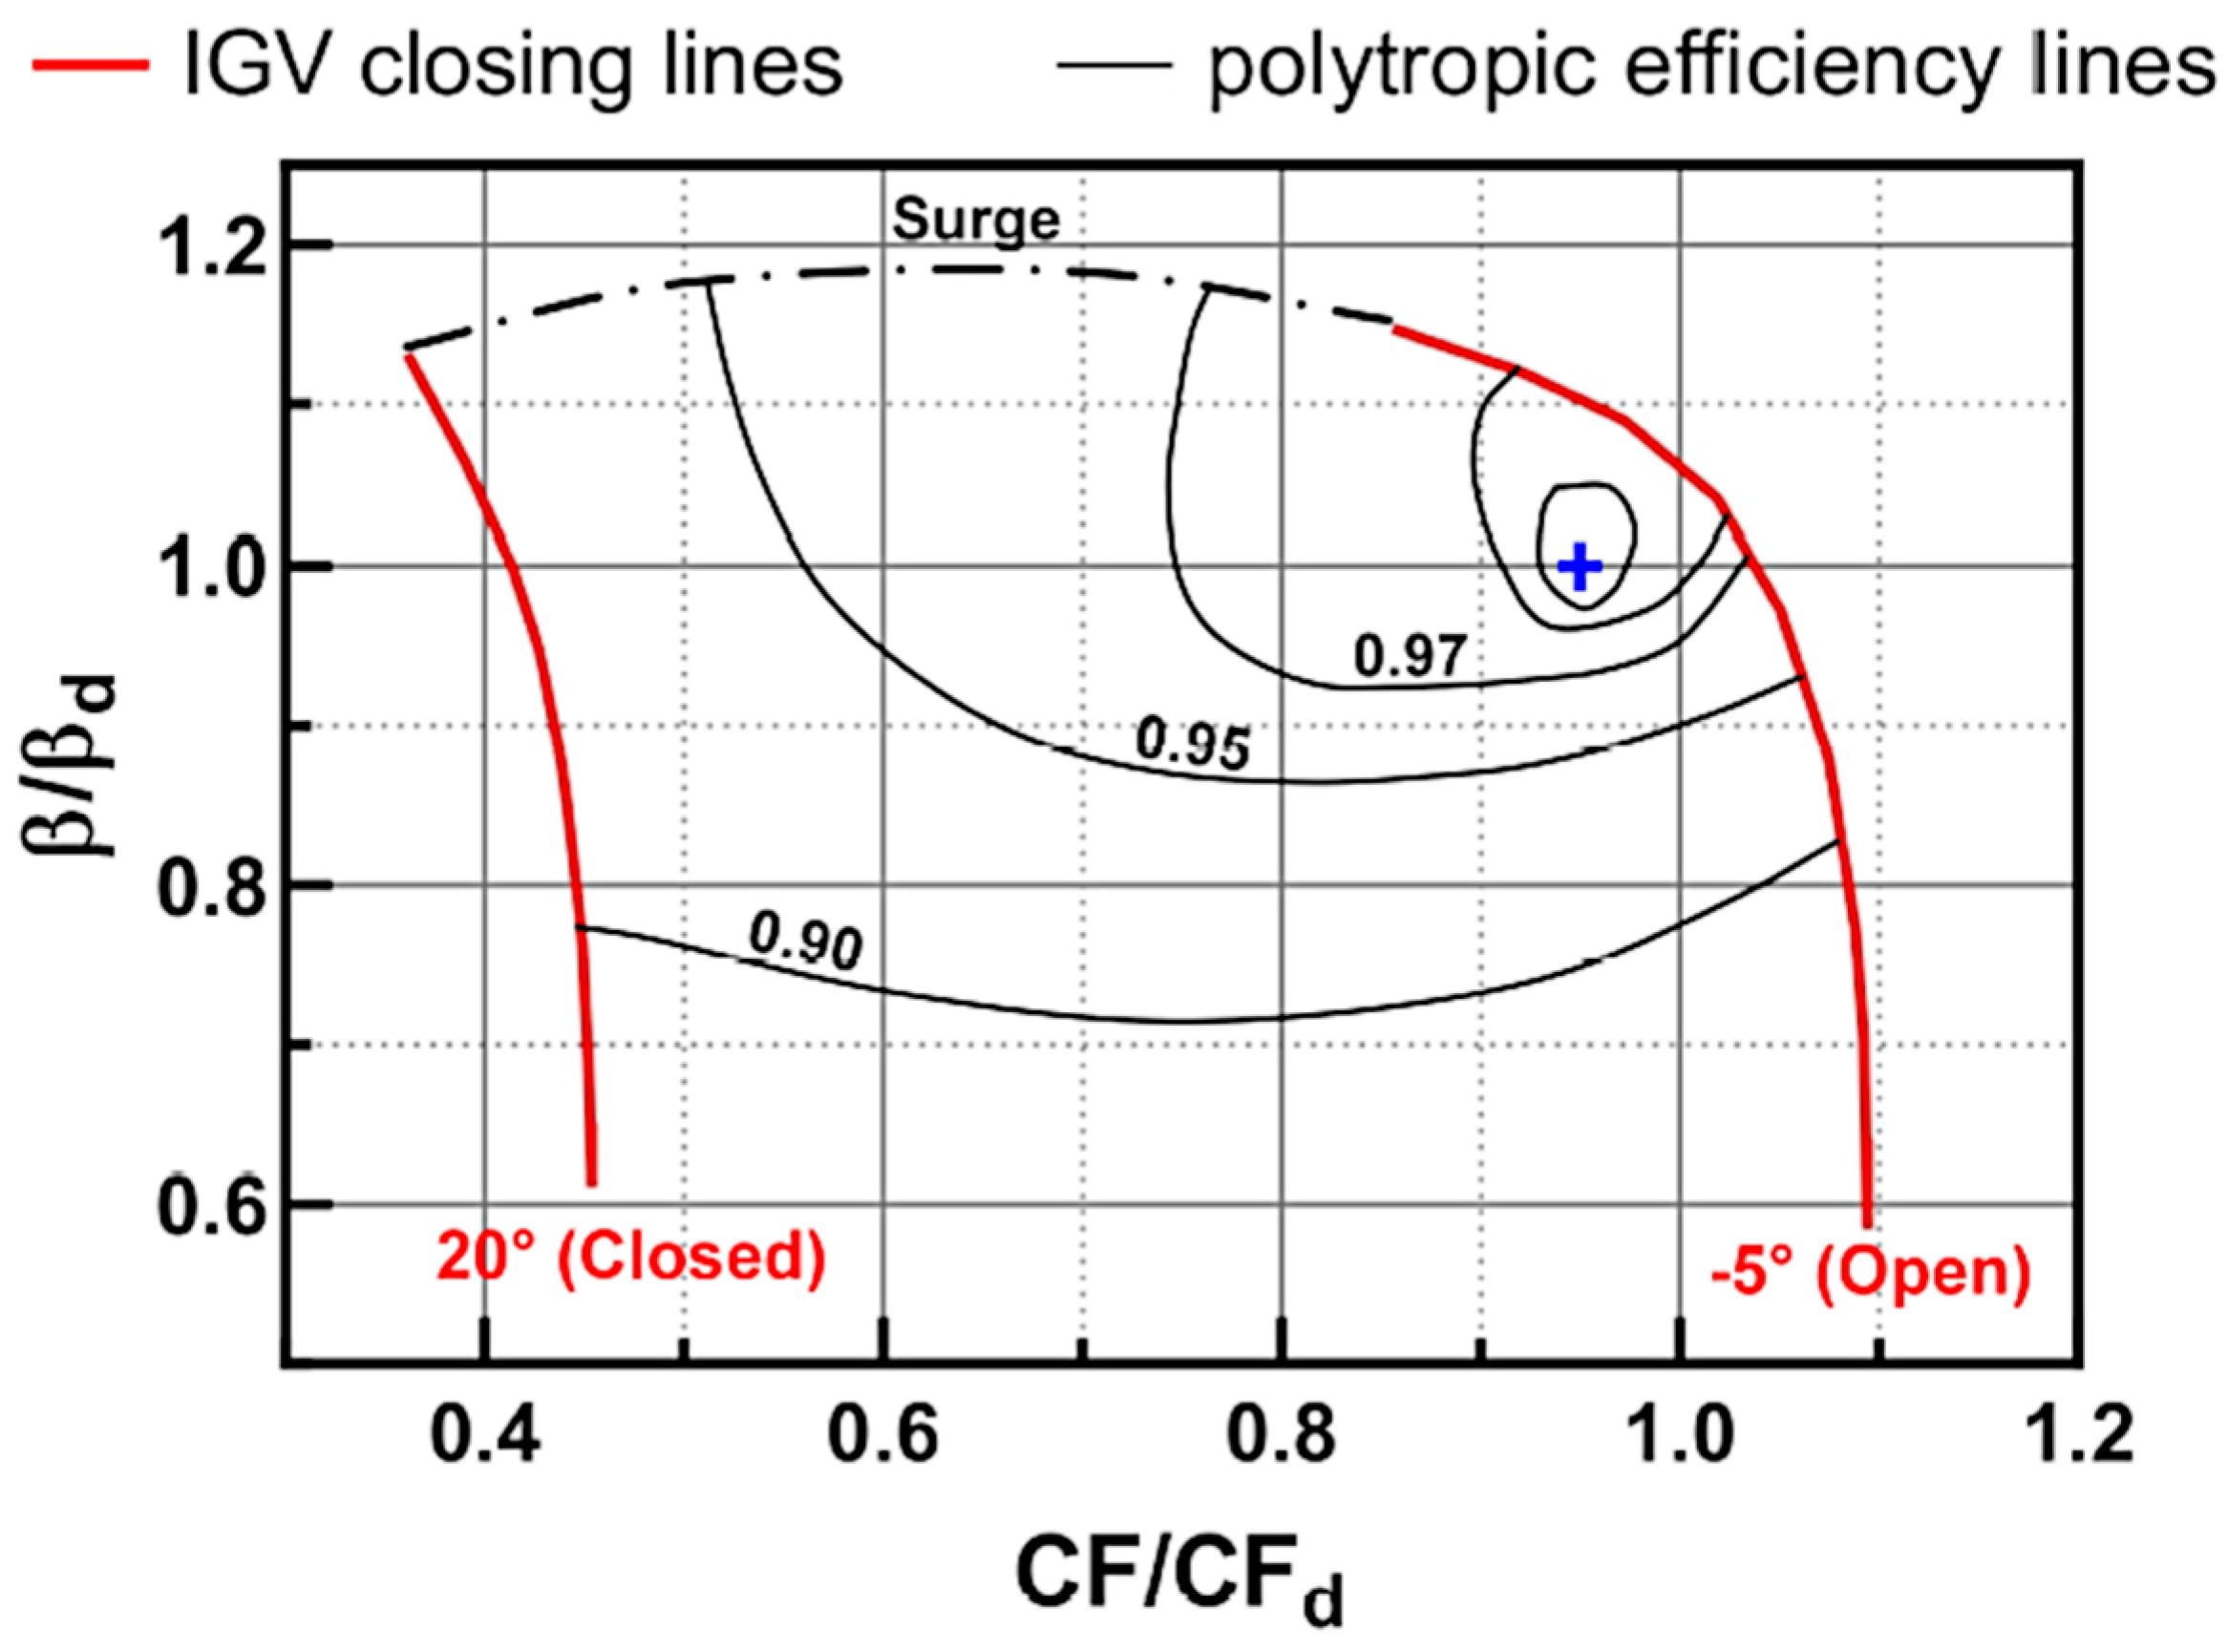
Figure 2. Centrifugal compressor performance map, with IGVs and DGVs; adapted from [29]. The blue cross indicates the design point.
Energies 18 04771 g002
Figure 3. Normalized Allam cycle performance as a function of load (fuel based): (a) turbine inlet pressure; (b) turbine inlet temperature; (c) thermal efficiency. Validation against Zaryab et al., advanced part-load control strategies for the Allam cycle [17].
Energies 18 04771 g003aEnergies 18 04771 g003b
Figure 4. Turbine inlet and outlet conditions as a function of load (power-based): (a) turbine inlet pressure; (b) turbine inlet temperature; (c) turbine outlet temperature; (d) turbine outlet pressure.
Energies 18 04771 g004
Figure 5. ASU characterization at reduced load (power-based): (a) specific consumption; (b) produced oxygen mass flow rate.
Energies 18 04771 g005
Figure 6. Normalized Allam cycle efficiency as a function of load (power-based).
Energies 18 04771 g006
Figure 7. Effects of sliding control on turbine stages as a function of load (power-based): (a) pressure ratio; (b) cooled expansion efficiency.
Energies 18 04771 g007
Figure 8. Effects of throttle control on turbine stages as a function of load (power-based): (a) pressure ratio; (b) cooled expansion efficiency.
Energies 18 04771 g008
Figure 9. Effects of throttle control on the first stage performance: (a) explanatory diagram for the definition of efficiency; (b) cooled expansion efficiency vs. stage expansion efficiency.
Energies 18 04771 g009
Figure 10. Effects of nozzle control on turbine stages as a function of load (power-based): (a) pressure ratio; (b) cooled expansion efficiency.
Energies 18 04771 g010
Figure 11. Gas final treatment at design point: (a) original version with heat removal icon (10); (b) new version with air heat exchanger (10). Source: Thermoflex® screenshot.
Energies 18 04771 g011
Figure 12. Minimum cycle temperature as a function of load (power-based) and ambient temperature.
Energies 18 04771 g012
Figure 13. ASU specific consumption as a function of load (power-based) and ambient temperature.
Energies 18 04771 g013
Figure 14. Performance of the first compression stage as a function of load (power-based) and ambient temperature: (a) power consumption; (b) compression efficiency.
Energies 18 04771 g014
Figure 15. Performance of the second compression stage as a function of load (power-based) and ambient temperature: (a) power consumption; (b) compression efficiency.
Energies 18 04771 g015
Figure 16. Enthalpy difference across the second compression stage as a function of load (power-based) and ambient temperature.
Energies 18 04771 g016
Figure 17. Normalized Allam cycle efficiency as a function of load (power-based) and ambient temperature (“IGV+VC” mode with nozzle control). Labels show absolute values of ηth (%) at Tamb of 5 °C and 30 °C.
Energies 18 04771 g017
Table 2. Main assumptions of the investigated part-load strategies.
LabelTurbine—1st StageCompressorConstraints
1. SlidingFull admission with sliding pressure controlIGV closureTOT ≤ 750 °C
Fixed pmin
2. ThrottleFull admission with a throttling valve
3. NozzlePartial admission with constant inlet pressure
Disclaimer/Publisher’s Note: The statements, opinions and data contained in all publications are solely those of the individual author(s) and contributor(s) and not of MDPI and/or the editor(s). MDPI and/or the editor(s) disclaim responsibility for any injury to people or property resulting from any ideas, methods, instructions or products referred to in the content.