Article

Study on the Gas–Liquid Two-Flow Characteristics Inside a Three-Stage Centrifugal Pump

Fluid Machinery Engineering Technology Research Center, Jiangsu University, Zhenjiang 212013, China
*
Author to whom correspondence should be addressed.
Energies 2025, 18(17), 4772; https://doi.org/10.3390/en18174772
Submission received: 21 June 2025 / Revised: 27 August 2025 / Accepted: 5 September 2025 / Published: 8 September 2025

Abstract

This paper takes a small three-stage centrifugal pump as the research object. Based on the RNG k-ε turbulence model and the TFM two-phase flow model, the numerical simulation of the internal gas–liquid two-phase flow was carried out, and the influence of the inlet gas content rate of the small multistage centrifugal pump on its internal flow was analyzed. The research results show that the head and efficiency of the multistage centrifugal pump will decrease with the increase in the inlet gas content rate. As the gas content increases from 0% to 5%, the head of the multistage centrifugal pump decreases by 3% and its efficiency drops by 5%. The trend of the continuous increase in the pressure on the blade surface does not change with the increase in the inlet gas content rate. The bubble area on the surface of the first-stage impeller blade increases with the increase in the gas content rate. When the inlet gas content rate condition reaches 5%, the bubbles cover the middle section of the blade suction surface. The flow vortex structure is mainly composed of blade separation vortices and mouth ring clearance leakage vortices. The vortices inside the impeller are concentrated in the blade outlet and rim area, while the vortices inside the guide vanes are located in the flow channel area of the anti-guide vanes. With the increase in the gas content rate, the amplitude of pressure pulsation in the flow channel inside the pump decreases.

1. Introduction

Multistage centrifugal pumps feature low flow rates, high heads, and compact structures. Compared with single-stage pumps connected in series, multistage pumps have higher efficiency. Meanwhile, to meet different pressure requirements, the number of stages of multistage centrifugal pumps can be flexibly adjusted. With these advantages, multistage centrifugal pumps are widely used in industrial fields, municipal buildings, agriculture, water conservancy, and other industries. In the field of sprinkler irrigation, multistage centrifugal pumps are suitable for high-head irrigation in mountainous and hilly areas. In the field of household water supply, multistage centrifugal pumps are mainly used to replace traditional single-stage pumps for pressurized water supply in high-rise buildings. In the field of landscaping, multistage centrifugal pumps are widely used in the water circulation of fountains and the micro-irrigation systems of greenhouses. During the actual operation of multistage centrifugal pumps, due to the special usage environment, there may be a situation where the inlet flow is mixed with gas. At this time, the multistage centrifugal pump is no longer transporting a single liquid, rather a mixed fluid containing both gas and liquid. When the inlet of a centrifugal pump contains air, vortices will occur inside the impeller and air bubbles will accumulate. When the air content at the inlet is too high, the gas inside the pump will block the flow channel, seriously affecting the performance of the centrifugal pump and causing significant energy loss within each component.
Heng [1] found that the high-efficiency operating range of centrifugal pumps decreases as the inlet gas volume fraction increases. He [2] discovered that when gas is present at the inlet of a centrifugal pump, it disrupts the stability of the internal flow field within the impeller and alters the liquid flow state. Song [3] monitored pressure fluctuations inside the pump during numerical simulations of centrifugal pumps and observed that gas at the inlet induces irregular pressure fluctuations in the impeller. He [4] further increased the inlet gas volume fraction in numerical simulations, and the results indicated that when the inlet gas volume fraction becomes excessively high, the centrifugal pump experiences surging, severely affecting its stable operation. S. Yang [5] conducted numerical simulations to investigate changes in the internal flow field of centrifugal pumps under different inlet gas volume fractions. The analysis revealed that once the inlet gas volume fraction exceeds a certain threshold, bubble clusters stably form on the backside of the blades. Yuan [6] analyzed vortex structures inside the impeller under gas-containing inlet conditions, demonstrating that when gas is present at the inlet, intense vortices develop within the impeller passages. Yuan [7] performed transient simulations of centrifugal pumps to study the formation process of vortices, and the unsteady numerical results showed that vortex formation is closely related to gas-phase accumulation. Si [8] found that as the gas content at the pump inlet increases, gas becomes more densely distributed within the impeller, leading to chaotic streamlines and an expanded diffusion region of velocity vortices. X. Wu [9] focused on the turbulent kinetic energy distribution in the internal flow field of centrifugal pump impellers under gas-containing inlet conditions, revealing a positive correlation between turbulent kinetic energy distribution and gas-phase distribution. Li [10] observed that when the inlet gas volume fraction reaches a certain value, phase separation occurs between liquid and gas in the impeller passages, destabilizing the liquid flow. Cui [11] gradually increased the inlet gas volume fraction and found that when it reaches 7%, flow interruption occurs during pump operation. Si [12] monitored pressure fluctuations at the pump outlet and, after data processing, concluded that as the inlet gas volume fraction increases, the blade-passing frequency becomes the dominant frequency of outlet pressure fluctuations, with increased amplitude and a higher proportion of low-amplitude frequencies within a single rotation cycle. Luo [13] investigated the impact of gas-containing inlet conditions on impeller forces, demonstrating that gas in the inlet causes uneven gas–liquid distribution in the impeller passages, leading to non-uniform pressure distribution and inconsistent force exertion on the impeller, adversely affecting pump stability. Guo [14] conducted a comprehensive review of the research on the two-phase flow of gas and liquid within centrifugal pumps, summarizing the types of two-phase flow in centrifugal pumps and the influencing factors, and elaborating on the research methods applicable to the two-phase flow in centrifugal pumps. Fu [15] employed numerical simulations to study the distribution of the gas phase within the impeller and volute flow passages, as well as the velocity streamlines of gas–liquid two-phase flow during centrifugal pump operation. Si [16] analyzed the internal flow characteristics of semi-open impeller centrifugal pumps under gas–liquid two-phase conditions. The study showed that different gas contents would result in different flow states within the semi-open impeller centrifugal pumps. The maximum working gas content was 4.6%, and the tip clearance would induce large-scale vortices. Tan [17] used the CFD-CA coupling method to reveal the mechanism of the gas–liquid two-phase flow noise in centrifugal pumps. The study found that the main sources of noise were the inhomogeneity of gas–liquid two-phase flow and the dynamic kinetic interference between the impeller and the tongue, and the high-pressure areas were concentrated in the spiral section of the volute and the outlet of the impeller. Verde [18] classified gas–liquid two-phase flow into bubble flow, coalesced bubble flow, gas pocket flow, and separated flow through visualization studies. Shao [19] conducted a comprehensive analysis of the flow characteristics of the gas–liquid two-phase flow in the suction chamber of a centrifugal pump by combining experimental and numerical simulation methods. The study confirmed the existence of nine flow patterns and also discovered that there were enhanced points for bubbles in the pulsating flow and weakened points in the stable flow. Zhang [20] conducted a study on the gas–liquid two-phase flow characteristics of centrifugal pumps using the method of dimensionless transformation. The research results showed that the aggregation of the gas phase would increase the blockage rate of the flow channel and reduce the energy transfer efficiency. Caridad [21] investigated the relationship between the head of a gas–liquid two-phase centrifugal pump, the relative outflow angle, and bubble diameter. Their results indicated that the pump head decreased with increasing bubble diameter but increased with a larger relative liquid outflow angle at the outlet. Pineda [22] employed commercial CFD software STAR-CCM+ v8.06 to study the flow field characteristics of gas–liquid two-phase centrifugal pumps, achieving favorable numerical predictions. Wang [23] focused on the jet centrifugal pump as the research object and revealed the characteristics of the gas–liquid two-phase flow of the jet pump. The study found that when the gas content was less than 5%, the performance of the jet centrifugal pump was stable. As the gas content increased, the gas phase and liquid phase velocities inside the pump would separate. Zhang [24] utilized the CFD-PBM model to elucidate the key mechanisms of the gas–liquid two-phase flow in centrifugal pumps. The study revealed that when the initial coalescence rate of bubbles exceeded the fragmentation rate, the bubbles would reach a dynamic equilibrium, and the bubble diameter would increase along the flow channel. Wang [25] utilized the Euler–Euler heterogeneous flow model to reveal the gas–liquid mixed transportation characteristics of segmented impeller centrifugal pumps. The study found that in the pure water condition, optimizing the position of the short blades can eliminate the flow bulge phenomenon. In the gas–liquid condition, when the short blades are close to the suction inlet of the long blades, the bubble breakage rate increases and the flow field stability is enhanced.
In conclusion, the presence of air at the inlet of a centrifugal pump can affect its performance, causing air bubbles and vortices inside the pump. In severe cases, it can exacerbate the vibration and noise of the centrifugal pump. However, most of these studies have focused on single-stage centrifugal pumps, while there are relatively few research results on multistage centrifugal pumps, especially small multistage centrifugal pumps. The flow channels of multistage centrifugal pumps are more complex than those of single-stage centrifugal pumps, and the inter-stage interaction forces are stronger. The gas phase may accumulate gradually at each stage. The research on medium- and large-sized multistage centrifugal pumps mainly focuses on high gas content or gas–oil two-phase flow studies. However, small-sized multistage centrifugal pumps used in agricultural irrigation have more compact structures due to size requirements, with narrower flow channels. This restricts the movement of gas bubbles and easily causes local air clusters to become blocked. The flow channel blockage effect is significant. Compared with medium- and large-sized multistage centrifugal pumps, their external characteristics are more susceptible to the influence of the inlet gas content, and the internal pressure fluctuations are more intense. In this paper, a small three-stage centrifugal pump is taken as the research object. The gas–liquid two-phase flow simulation is carried out by changing the gas content rate at the inlet, providing a theoretical basis for further studying the gas–liquid two-phase flow characteristics of small multistage centrifugal pumps.

2. Computational Model and Mesh Generation

2.1. Computational Model

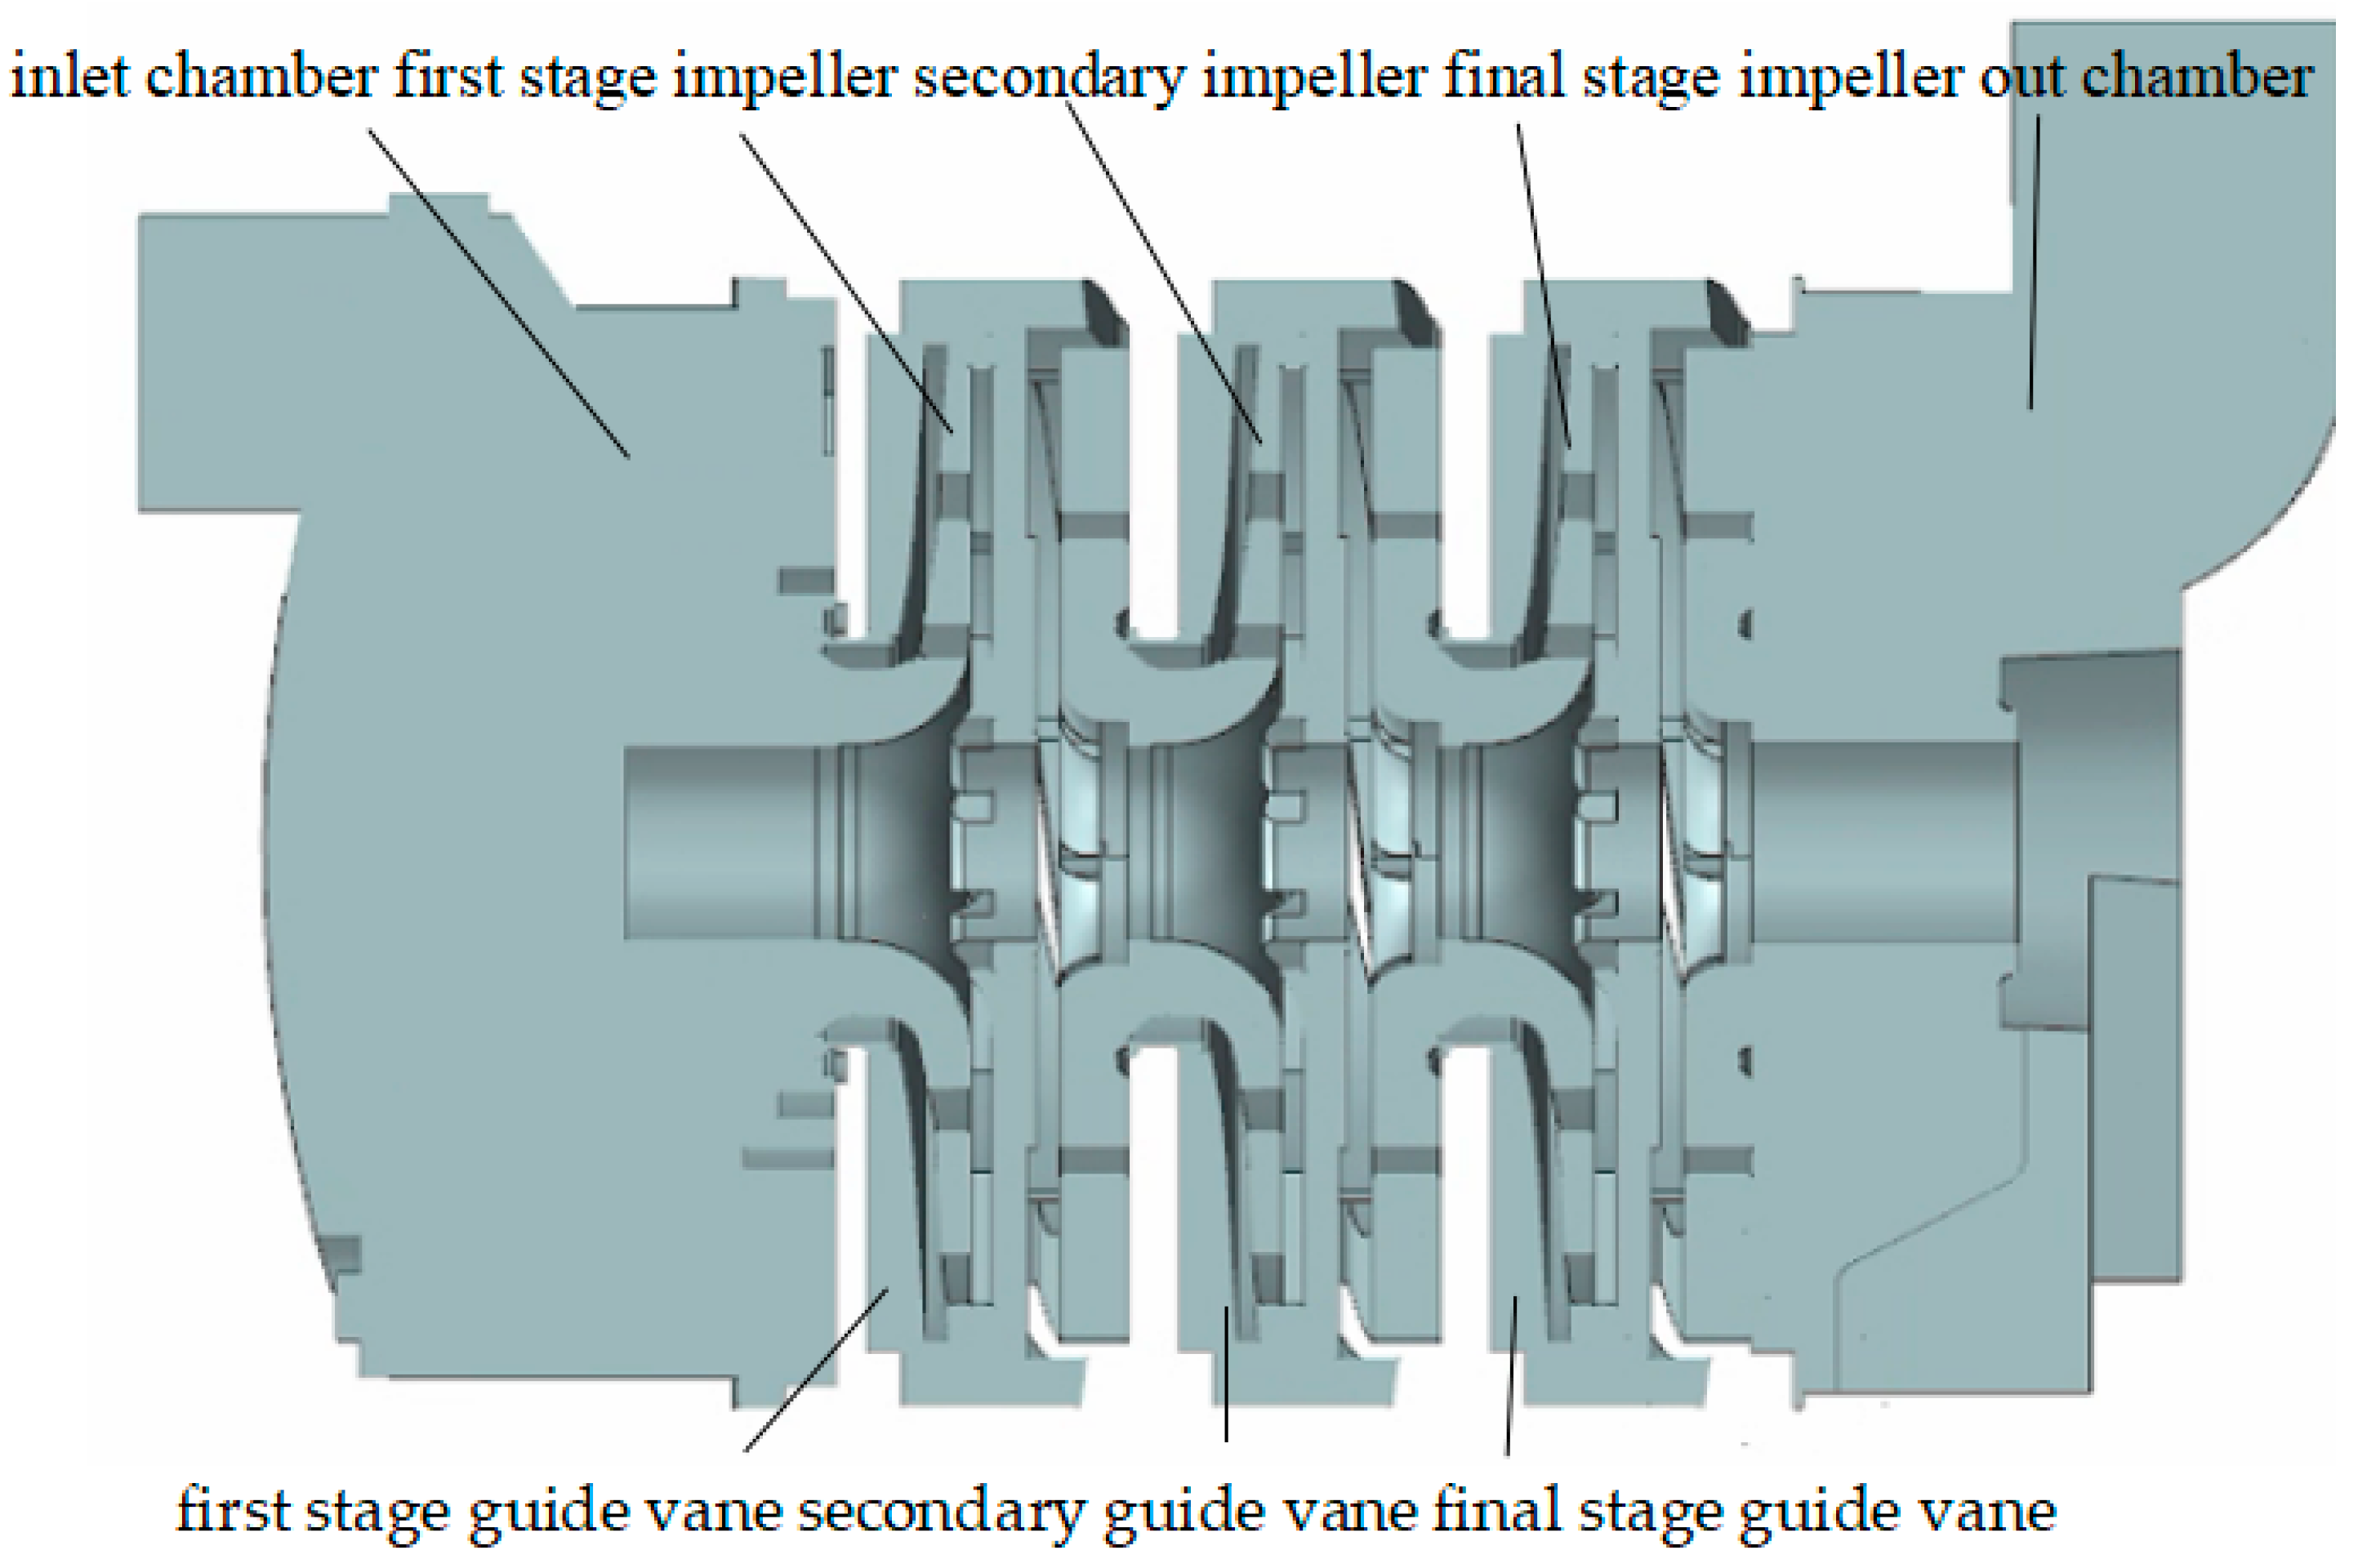
A small three-stage centrifugal pump was selected as the research object. Its design parameters are as follows: Q = 2 m3/h, H = 34 m, n = 2800 r/min, specific speed 39.8, and design rated efficiency 33.2%. The main components of this pump include the suction chamber, the first-stage impeller, the first-stage guide vanes, the secondary impeller, the secondary guide vanes, the last-stage impeller, the last-stage guide vanes, and the outlet chamber, etc. The main structure is shown in Figure 1.
The liquid enters from the left side of the pump. First, it passes through the first-stage impeller for an initial pressure increase, and then flows towards the first-stage guide vanes. Subsequently, the liquid enters the secondary impeller for the second pressurization, then flows to the secondary guide vanes, and finally enters the final impeller for the final pressurization. The final-stage guide vanes slow down the liquid and further increase its pressure energy. Eventually, the liquid flows out from the outlet flange of the pump. The inlet diameter of the three-stage centrifugal pump is 30 mm, the outlet diameter is 30 mm, the inlet diameter of the impeller is 34 mm, the outlet diameter is 98 mm, and the number of blades is 7. The outlet width of the impeller is 2 mm, the guide vanes are flow channel guide vanes, the base circle diameter of the guide vanes is 110.5 mm, the outlet diameter is 24 mm, the number of guide vanes’ blades is 6, and the outlet width of the guide vanes is 6 mm. The detailed parameters of the three-stage centrifugal pump can be found in Table 1.

2.2. Turbulence Model, Mesh Generation, and External Characteristics Validation

The RNG k-ε model, as an improved version of the model, primarily utilizes renormalization group (RNG) theory to optimize the shortcomings of the k-ε model in predicting turbulent rotational structures. It can more accurately depict the generation and evolution processes of turbulent rotational structures and vortices while employing fewer parameters to explain the characteristics of turbulent dynamics. Additionally, the RNG model exhibits higher predictive accuracy in near-wall regions, enabling more precise reflection of wall effects. The governing equations are as follows:
t ( ρ k ) + x i ρ μ i k = x j α k μ e f   f k x j + G k + G b ρ ε Y M + S k
t ( ρ ε ) + x i ρ ω u i = x j μ + μ t σ t ε x j + C 1 ε ε k G k + G 3 ε G b C * 2 ε ρ ε 2 k + S ε
where G b is the turbulent kinetic energy production term caused by buoyancy; G k is the turbulent kinetic energy production term caused by mean velocity gradient; Y M represents the influence of compressible turbulent fluctuation expansion on the total dissipation rate; μ t is the turbulent viscosity; α k and α ε are the reciprocals of the effective turbulent Prandtl numbers for turbulent kinetic energy k and dissipation rate ε , respectively; Constant terms:
C 1 ε = 1.42 ,   C * 2 ε = C 2 ε + C μ η 3 1 η η 0 1 + β η 3 ,   η = k ε 2 S i j S i j ¯ ,
C 2 ε = 1.68 ,   β = 0.012 ,   μ t = C μ ρ k 2 ε ,   C μ = 0.0845 .
Zhang [26] compared the simulation effects of the standard k-ε, RNG k-ε, and k-ω SST models in multistage pumps and found that the RNG k-ε turbulence model yielded higher accuracy in the simulation results of multistage pumps. Fan [27] conducted numerical simulations on multistage pumps, comparing the entropy production prediction effects of the k-ε, RNG k-ε, k-ω SST, and RSM models, and discovered that the RNG k-ε turbulence model performed well in predicting entropy production. Other domestic and foreign scholars have also widely adopted this two-phase flow model in their research on two-phase flows [28,29,30,31,32]. In this paper, the RNG k-ε turbulence model was also adopted during the numerical simulation of a three-stage centrifugal pump.
Based on the two-dimensional structure diagram and model parameters, the overall structure of the three-stage centrifugal pump was modeled in three dimensions using UG, covering key parts such as the suction chamber, impeller, guide vanes, and discharge chamber. Figure 2 shows the three-dimensional water domain model of the three-stage centrifugal pump. As shown in Figure 2, the positions of each key flow component of the three-stage centrifugal pump, as well as the connections and clearances between the components, can be clearly observed. The fluid domains of the inlet and outlet sections are more gradual compared with those within the impeller and guide vanes. The pressure, velocity, etc., of the fluid inside the three-stage centrifugal pump will undergo significant changes along with the flow in the impeller and guide vanes. Therefore, this paper focuses on the changes in the two-phase flow characteristics within the impeller and guide vanes.
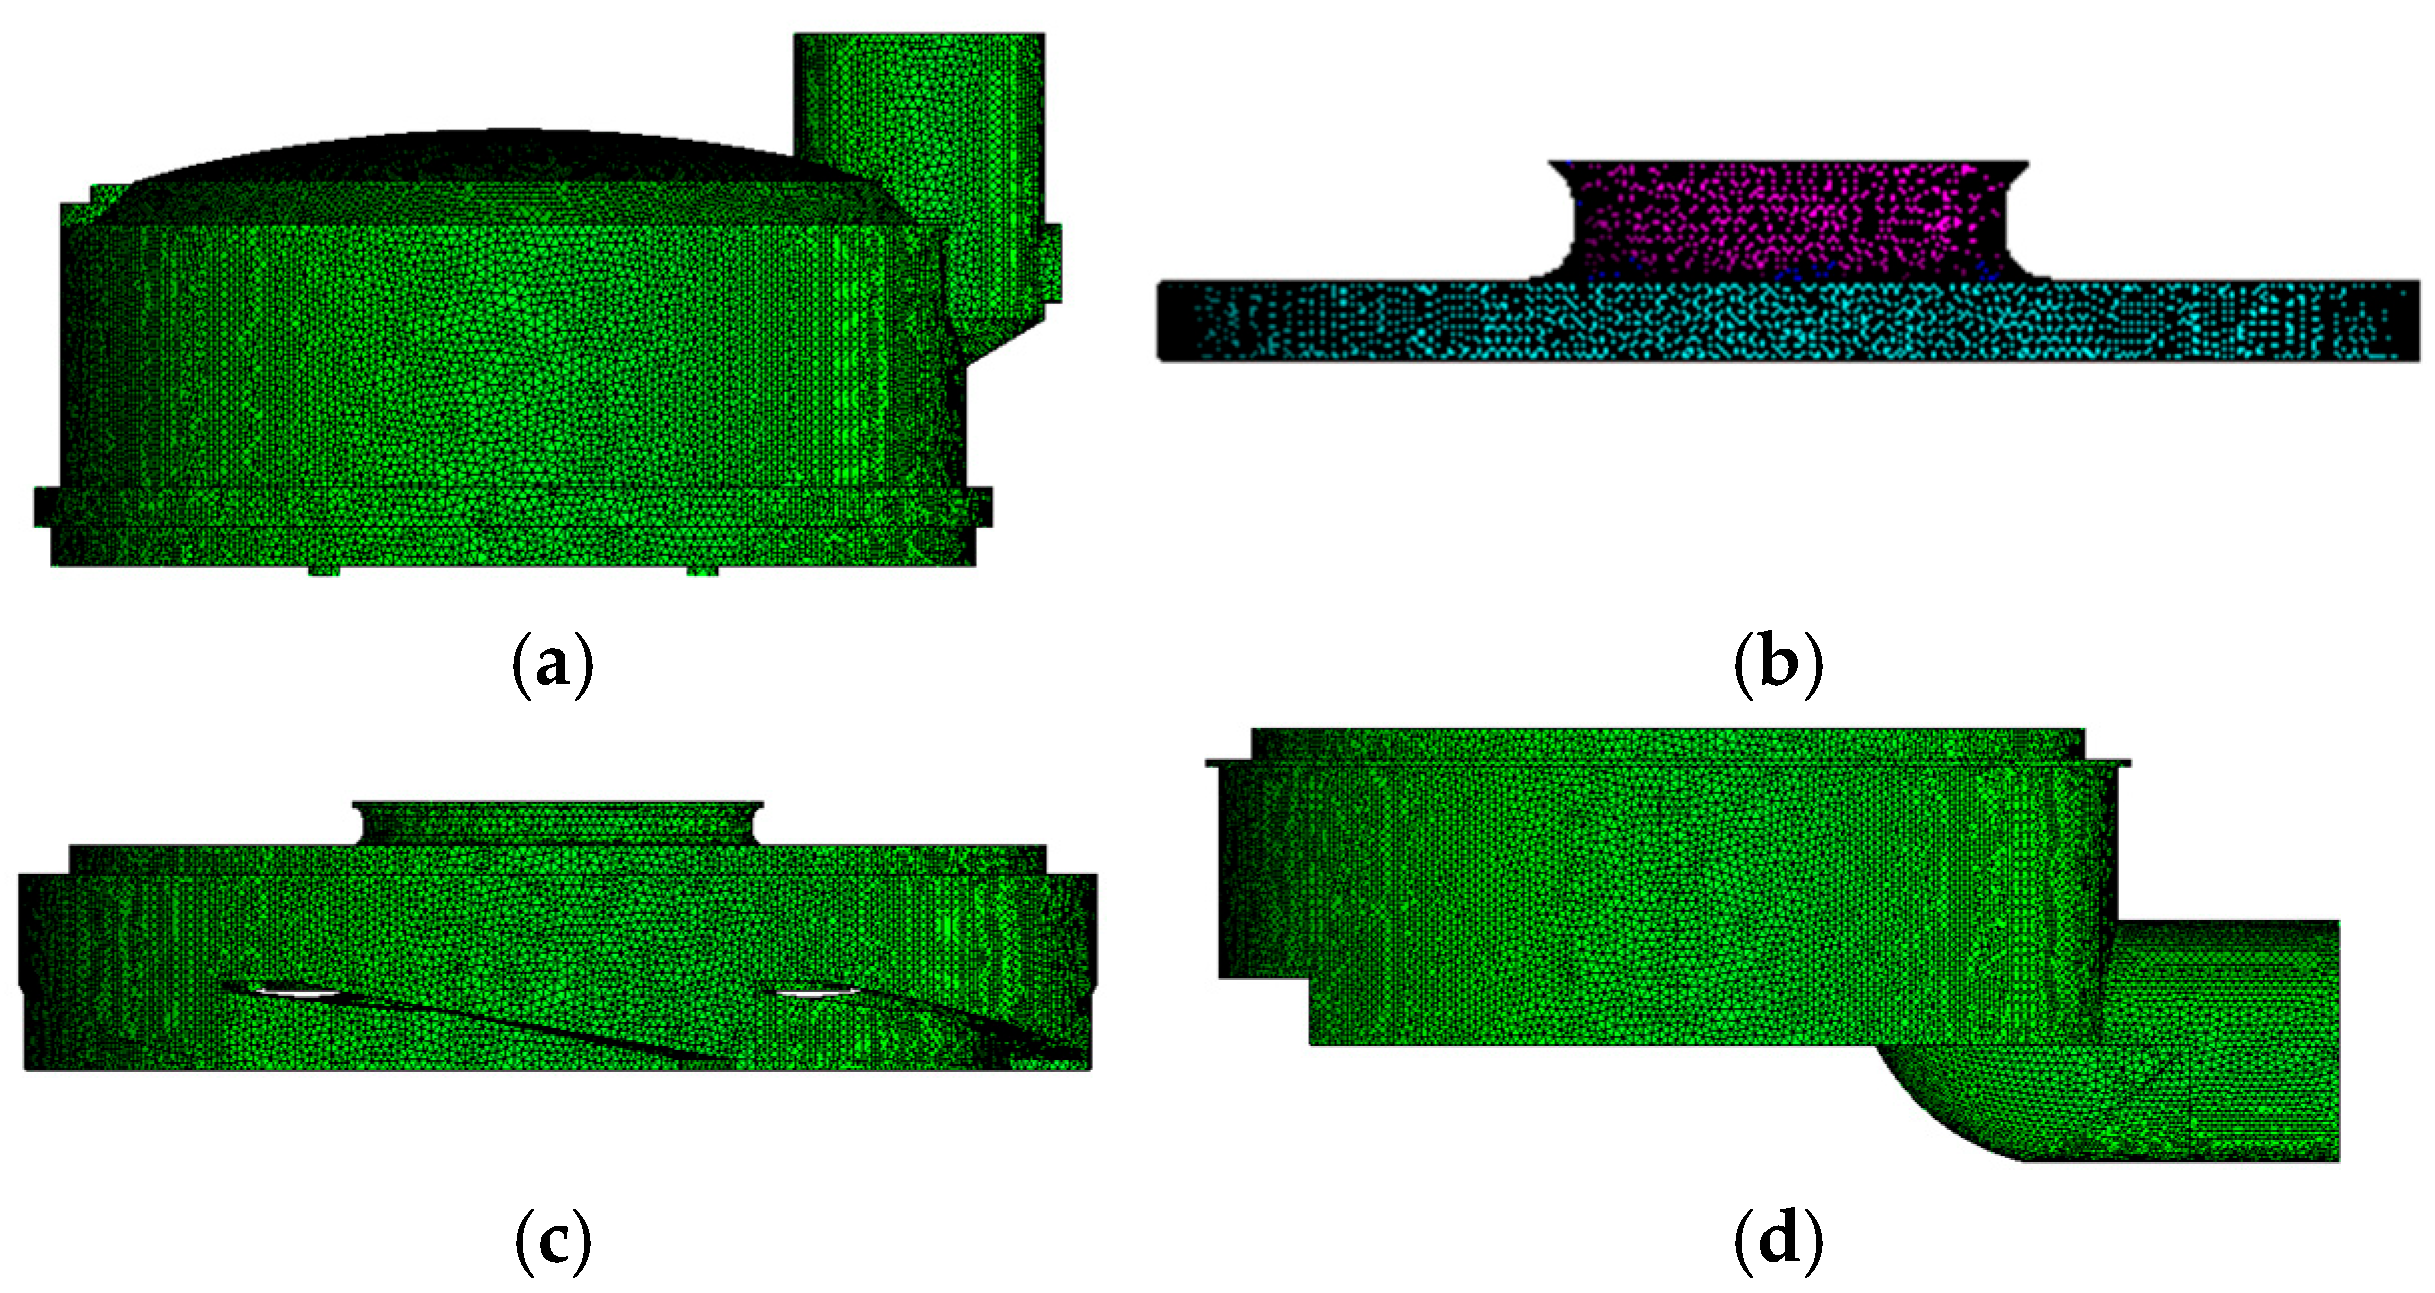
ANSYS Mesh software (19.2) was utilized to generate hybrid tetrahedral and hexahedral meshes for different flow components of the computational domain. Figure 3 illustrates the mesh generation for the three-stage centrifugal pump. Figure 3a shows the generated inlet section mesh, Figure 3b shows the generated impeller mesh, Figure 3c shows the generated guide vane mesh, and Figure 3d shows the generated outlet section mesh. During numerical simulations, the accuracy of computational results was significantly influenced by mesh density. The inlet section, the impeller, and the outlet section adopt hexahedral structure grids, while the guide vanes use unstructured grids. To ensure result reliability, head and efficiency were selected as key indicators for evaluating grid independence, and grid independence verification was performed.
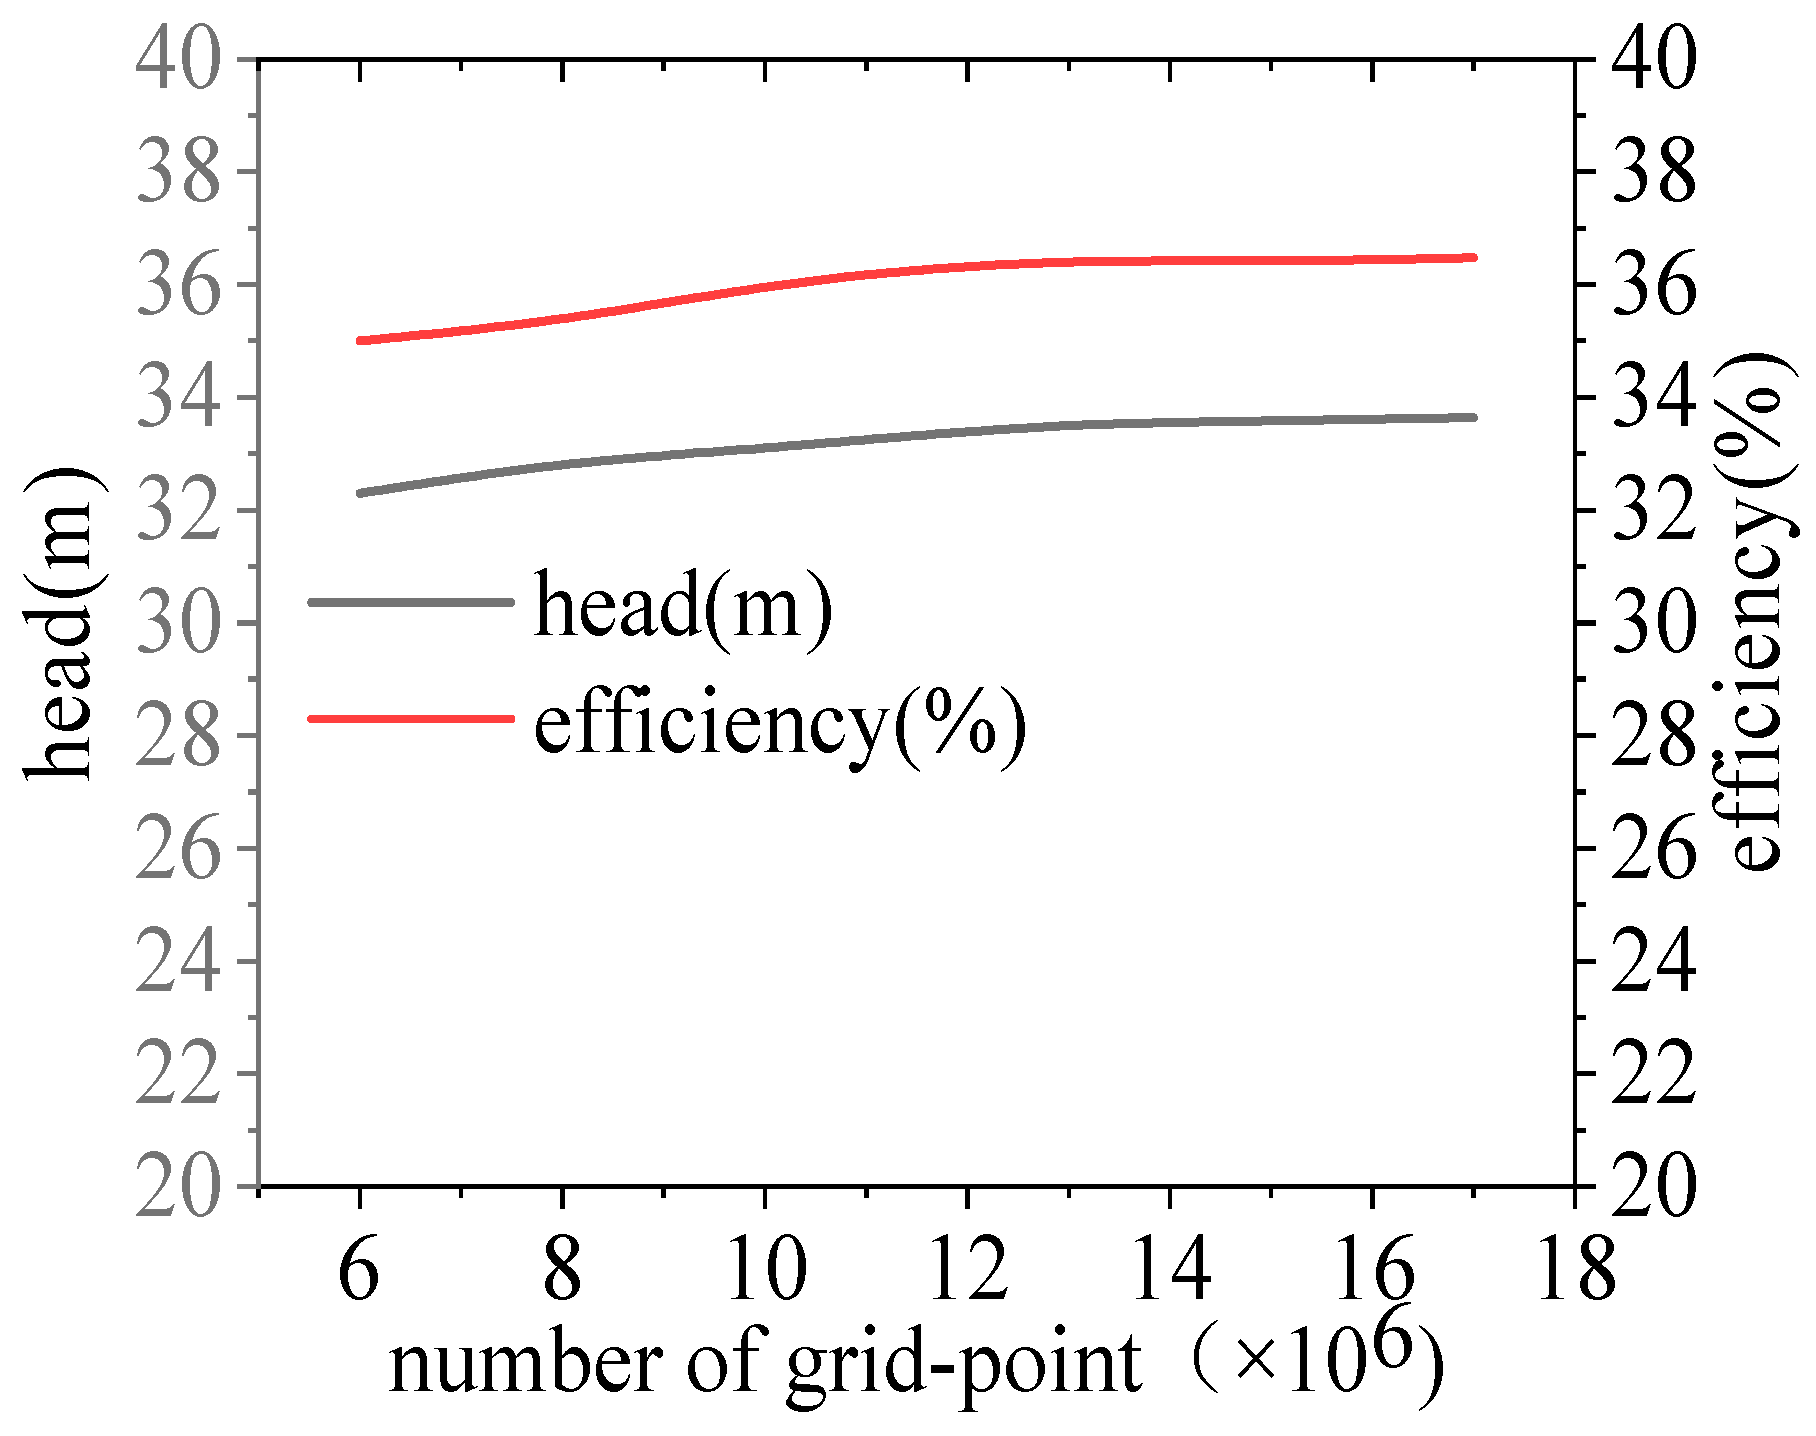
Figure 4 presents the simulated pump head and efficiency under design flow conditions with varying mesh counts. The simulation results demonstrated that, with 6 million grid elements, both the head and efficiency of the centrifugal pump remain at relatively low levels. As the mesh count gradually increases, the head and efficiency of the three-stage centrifugal pump increase. When the number of grids reaches 12, the rate of increase in head and efficiency slows down. When the number of grids exceeds 13, the changes in the head and efficiency of the centrifugal pump become less obvious. At this point, the performance of the centrifugal pump is less affected by the number of grids. This indicates that finer mesh partitioning contributes to enhanced simulation accuracy to some extent, thereby enabling more precise prediction of centrifugal pump performance. However, considering computational resource limitations and processing time constraints, a final mesh count of 13 million is adopted. This configuration comprises 3.335 million elements for the suction chamber, 422,000 for the impeller, 1.869 million for the guide vanes, and 2.693 million for the discharge chamber. The average y + values on the impeller blade surfaces and guide vane surfaces are 42.42 and 32.48, respectively, meeting the requirements for RNG k-ε turbulence model simulations.
To verify the accuracy of the numerical calculation results for this small three-stage centrifugal pump, an experimental study on its external characteristics was conducted. The pump performance test bench, as shown in Figure 5, primarily consists of a three-stage centrifugal pump, inlet and outlet pipelines, pressure sensors, flow meters, and flow regulators, with the outlet pipeline diameter being 25 mm. A three-phase motor was employed as the driving device, and the flow rate was adjusted via valves on the pipeline. The outlet pressure of the centrifugal pump was monitored using a WT2000 pressure sensor with a measurement range of 0–0.6 MPa and a comprehensive accuracy of ±0.5%. The flow rate was monitored by an LWGY-25A0A3T (Shanghai Automation Instrument Group Co., Ltd., located in Shanghai, China) turbine flow meter with a testing accuracy of ±0.5%. A TPA-3A hydraulic machinery comprehensive tester from Jiangsu University was used as the data acquisition system.
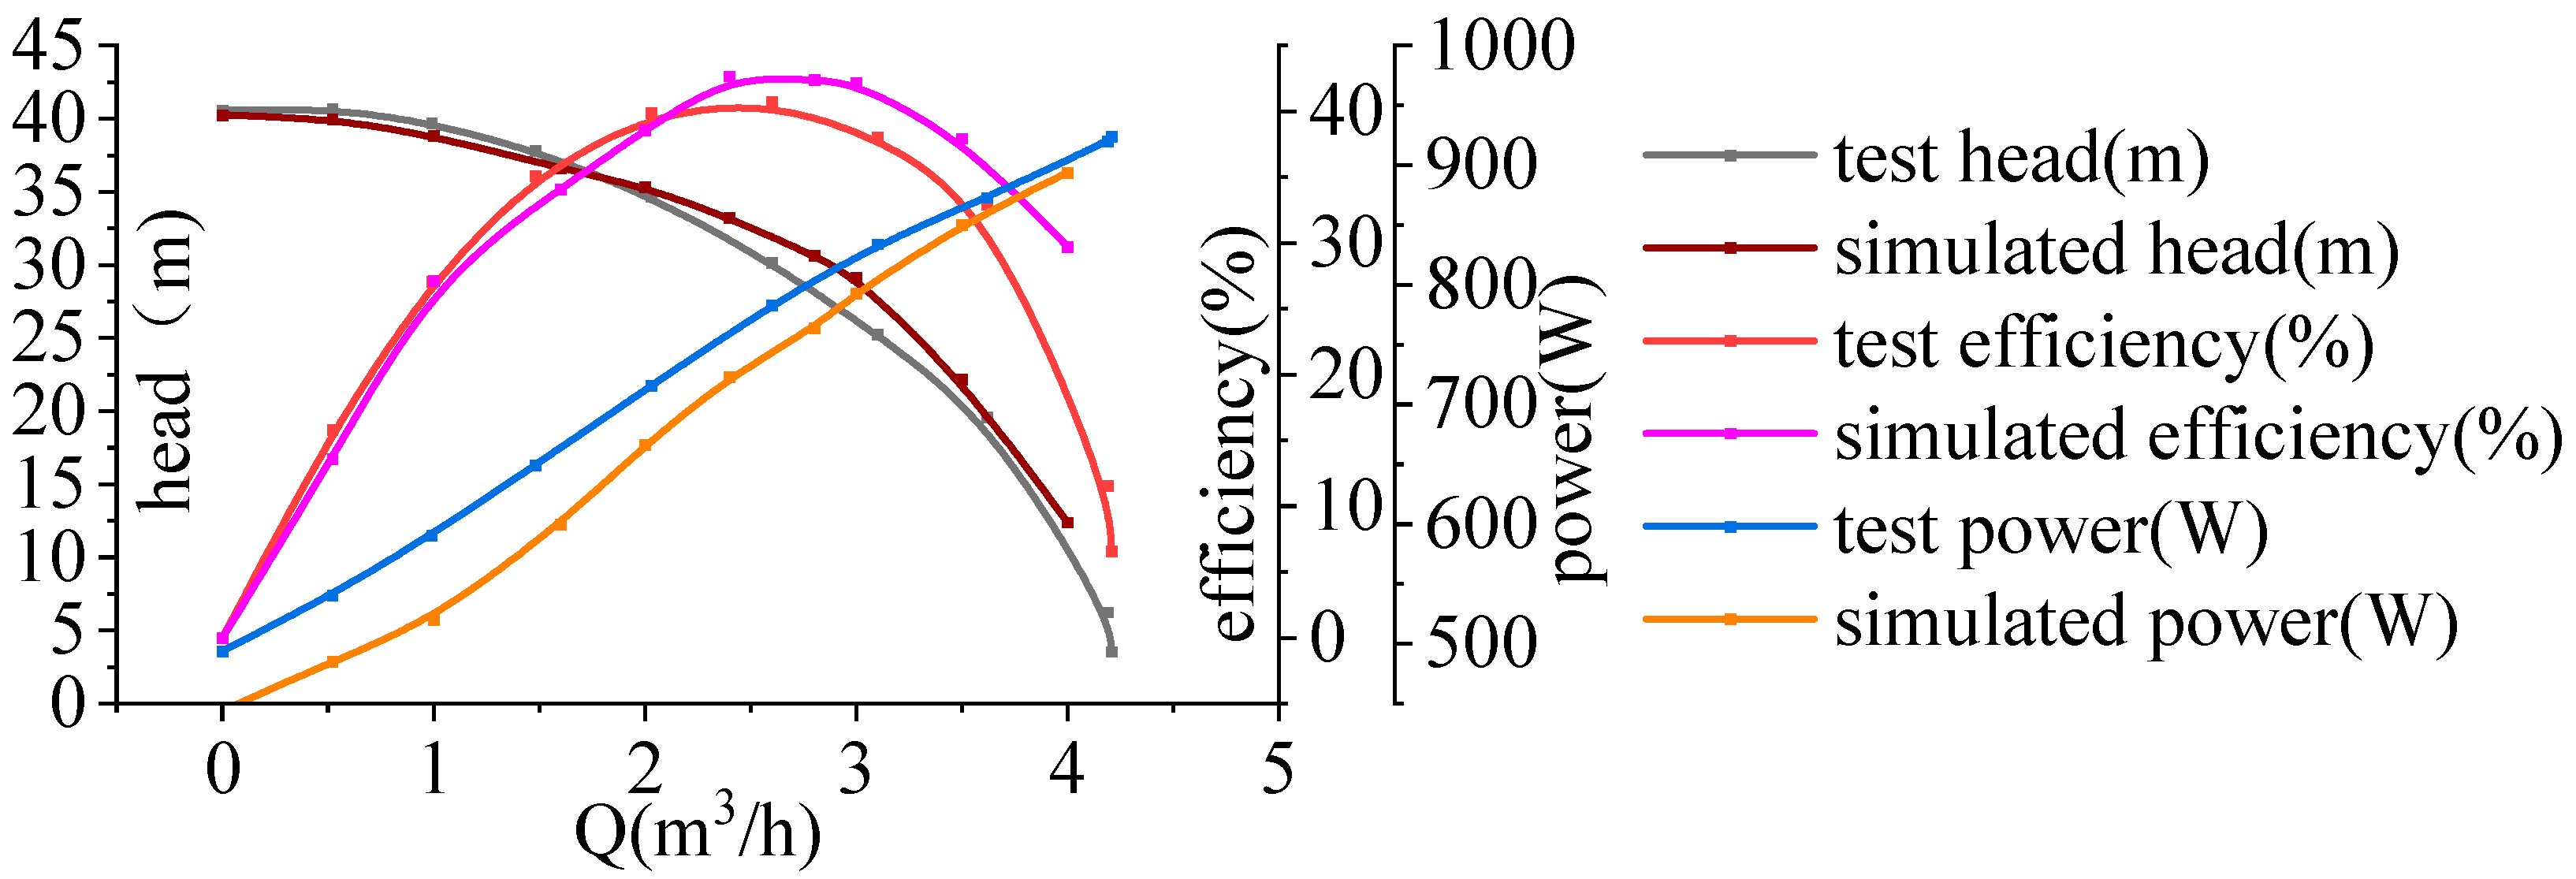
Figure 6 shows the comparison between test results and simulated external characteristic results. It can be observed from the figure that the trends of numerical simulation and test results with flow rate variation are consistent. The head decreases with increasing flow rate, while the efficiency first increases and then decreases, reaching its peak at Q = 2.4 m3/h. The input power increases with flow rate growth. At the rated flow point Q = 2 m3/h, the tested head is 34.7 m, while the simulated head is 35.3 m. The tested efficiency is 39%, and the simulated efficiency is 38.58%. The error between test and simulation results is within 3%, indicating that the numerical simulation method adopted in this paper is of good accuracy.

2.3. Multiphase Flow Model and Boundary Conditions

The TFM model (Euler–Euler two-fluid heterogeneous model) is a relatively complex multiphase flow model applied in research areas such as aerodynamics and gas–liquid two-phase flow. By solving a set of coupled equations, it can simulate the motion and changes of two fluids under interaction conditions. In gas–liquid two-phase flow simulations, it assumes that gas and liquid are two independent fluids, each treated as a continuous medium with their own mass, momentum, and energy conservation equations. The interaction between gas and liquid is reflected through Newton’s third law.
The continuity equation and momentum equation are as follows:
t α k ρ k + α k ρ k w k = 0
t α k ρ k w k + α k ρ k w k w k = α k P k + α k μ k w k + w k T + M k + α k ρ k f k
where k represents any phase of the fluid; μ k is the dynamic viscosity, Pa·s; P k is the pressure, Pa; ρ k is the density, kg/m3; α k is the volume fraction; f k is the mass force related to impeller rotation, N; M k is the interphase force acting on phase k, N; w k is the relative velocity between phases, m/s.
The fluid medium was a mixture of air and pure water at 25 °C, with the inlet boundary condition set as a relative total pressure inlet and the initial gas volume fraction specified. The outlet boundary condition was configured as a mass flow outlet based on the design flow parameters, where the mass flow represents the combined total of water and air bubbles. The liquid phase employed the RNG k-ε turbulence model, while the gas phase adopted the zero-equation theoretical model. Both gas and liquid phases were assumed to be incompressible media, with bubbles being uniformly spherical and their deformation and phase change neglected. For unsteady calculations, the interface “Frozen Rotor” changed to “Transient Rotor Stator.” To obtain more stable and accurate data, the total simulation time was set to 0.10715 s, with a time step of 0.0001786 s. Data from the final cycle were selected for analysis.
Euler–Euler dual-fluid heterogeneous model setup: The gas phase adopted the dispersed fluid, with the average particle diameter uniformly set to 0.2 mm.
The definition of inlet gas void fraction:
IGVF = Q g Q g + Q l
where Qg represents the gas volumetric flow rate, and Ql represents the liquid volumetric flow rate. The gas volume fraction was set to 0%, 1%, 2%, 3%, and 5%, where IGVF (inlet gas volume fraction) denoted the composition of the initial gas–liquid two-phase working medium at the inlet.

3. Calculation Result Analysis

3.1. Characteristic Curve Analysis

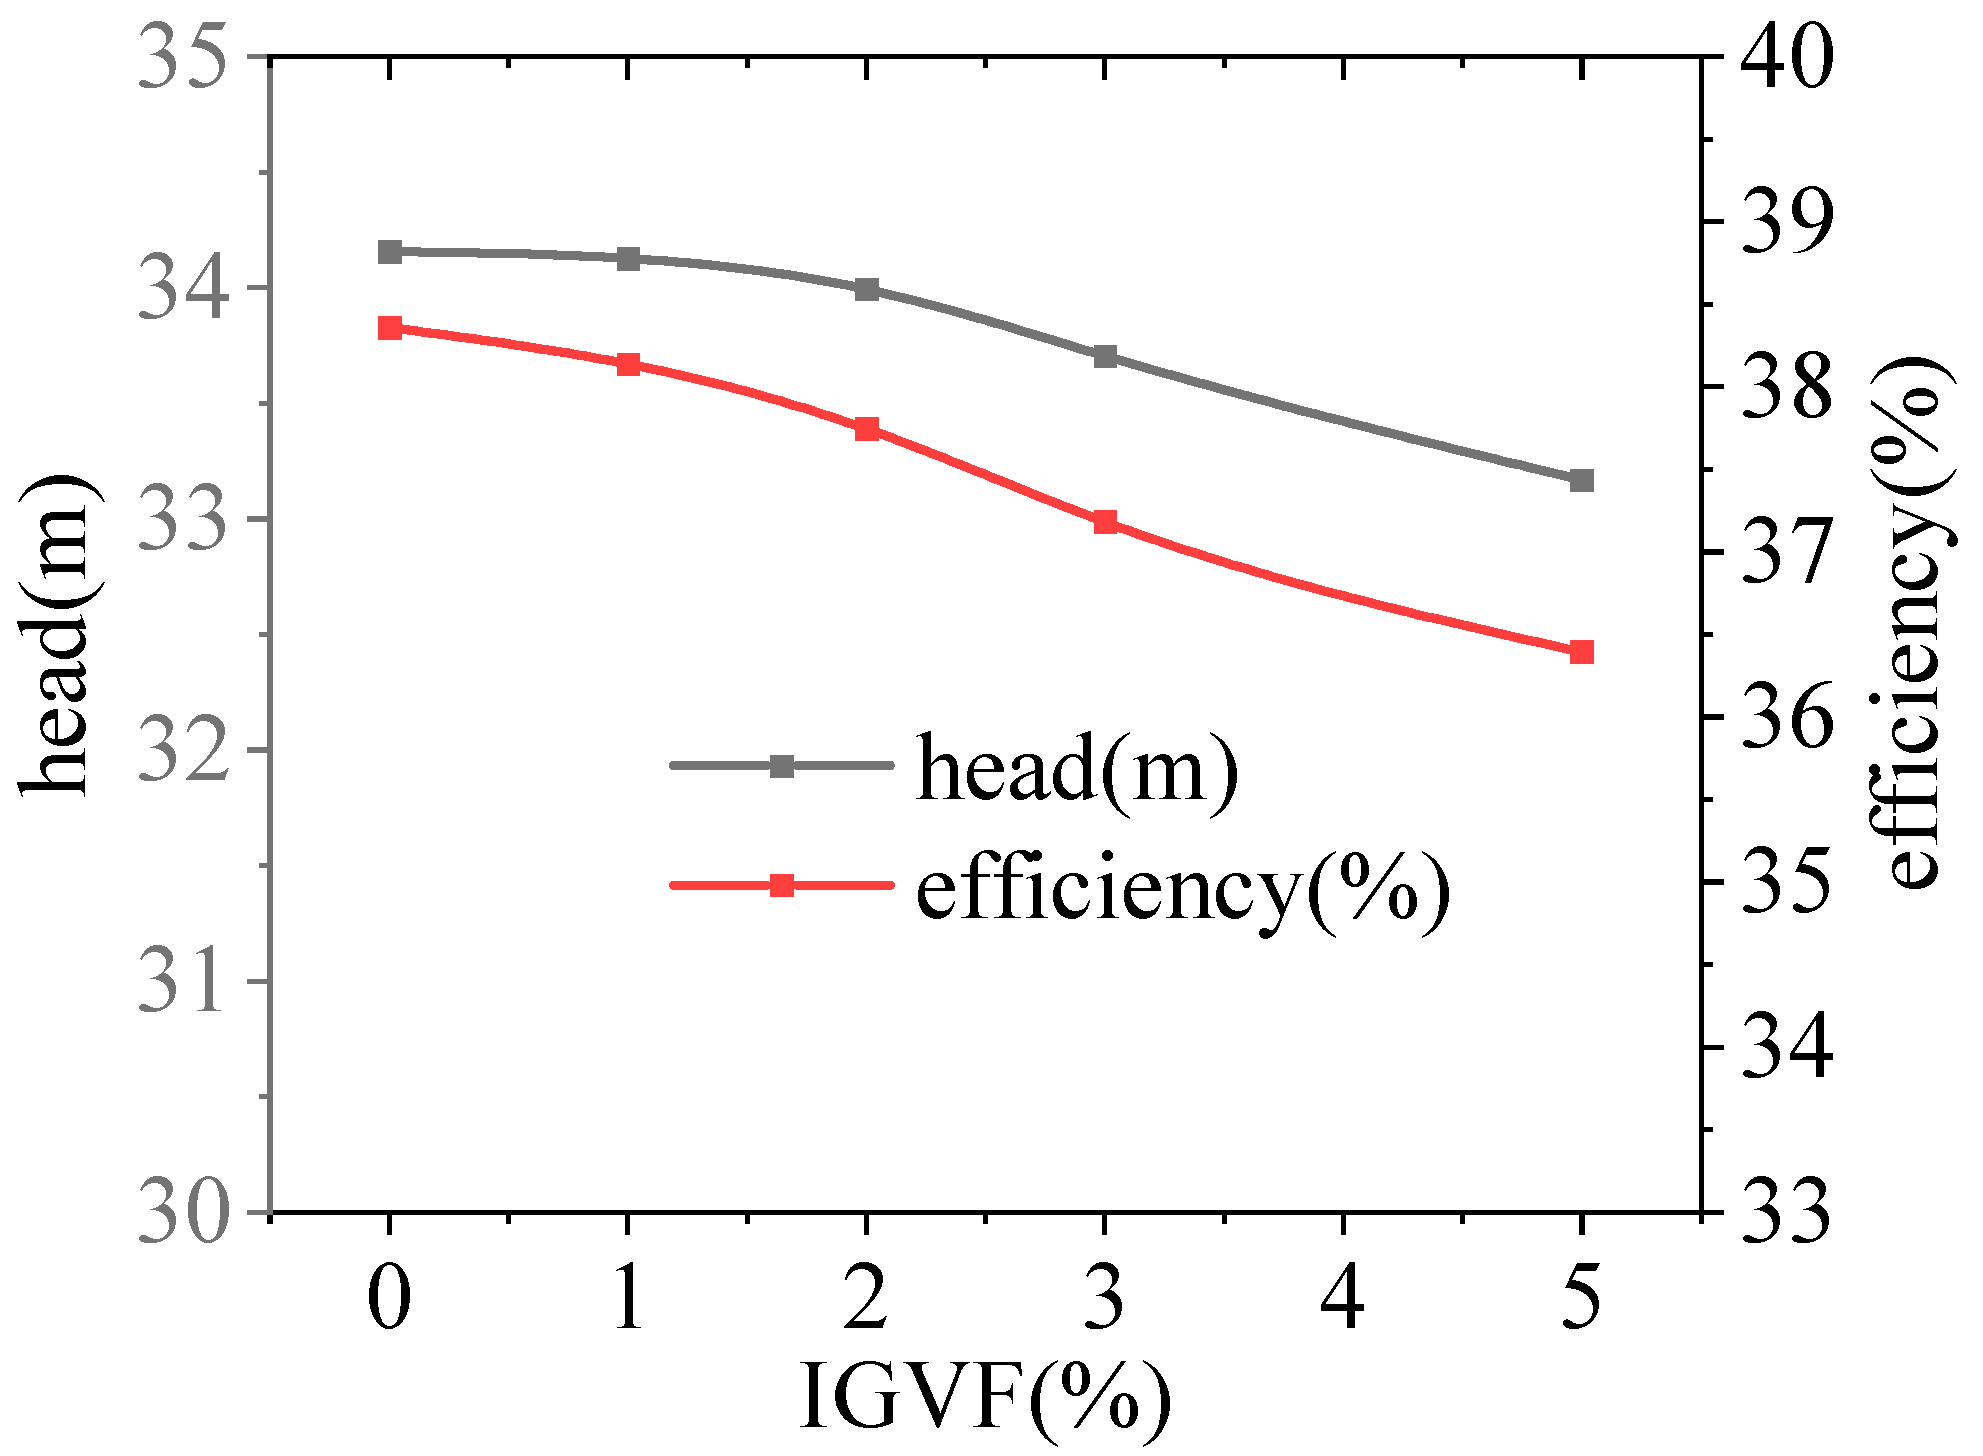
Figure 7 shows the head and efficiency obtained from the numerical simulation of a three-stage centrifugal pump under different gas volume fraction conditions. As can be seen from the figure, both the head and efficiency of the three-stage centrifugal pump decrease with the increase in inlet gas volume fraction, with the head showing a more significant decline compared with efficiency as the gas volume fraction rises. When IGVF = 0%, the head is 34.157 m and the efficiency is 38.359%. When IGVF = 1%, the head drops to 34.126 m, which is a 0.09% reduction compared with when IGVF = 0%, and the efficiency decreases to 38.137%, which is a 0.58% reduction compared with when IGVF = 0%. When IGVF = 2%, the head drops to 33.994 m, which is a 0.39% reduction compared with when IGVF = 1% and the efficiency decreases to 37.746%, which is a 1.04% reduction compared with when IGVF = 1%. When IGVF = 3%, the head drops to 33.705 m, which is a 0.86% reduction compared with when IGVF = 2% and the efficiency decreases to 37.182%, which is a 1.52% reduction compared with when IGVF = 2%. When IGVF = 5%, the head drops to 33.168 m, which is a 1.62% reduction compared with when IGVF = 3% and the efficiency decreases to 36.395%, which is a 2.16% reduction compared with when IGVF = 3%. As can be seen from the figure, as the gas content in the imported medium increases, the effects on the head and efficiency of the three-stage centrifugal pump become increasingly severe, and the decrease in efficiency is greater than that in head.

3.2. Impeller Blade Pressure Analysis

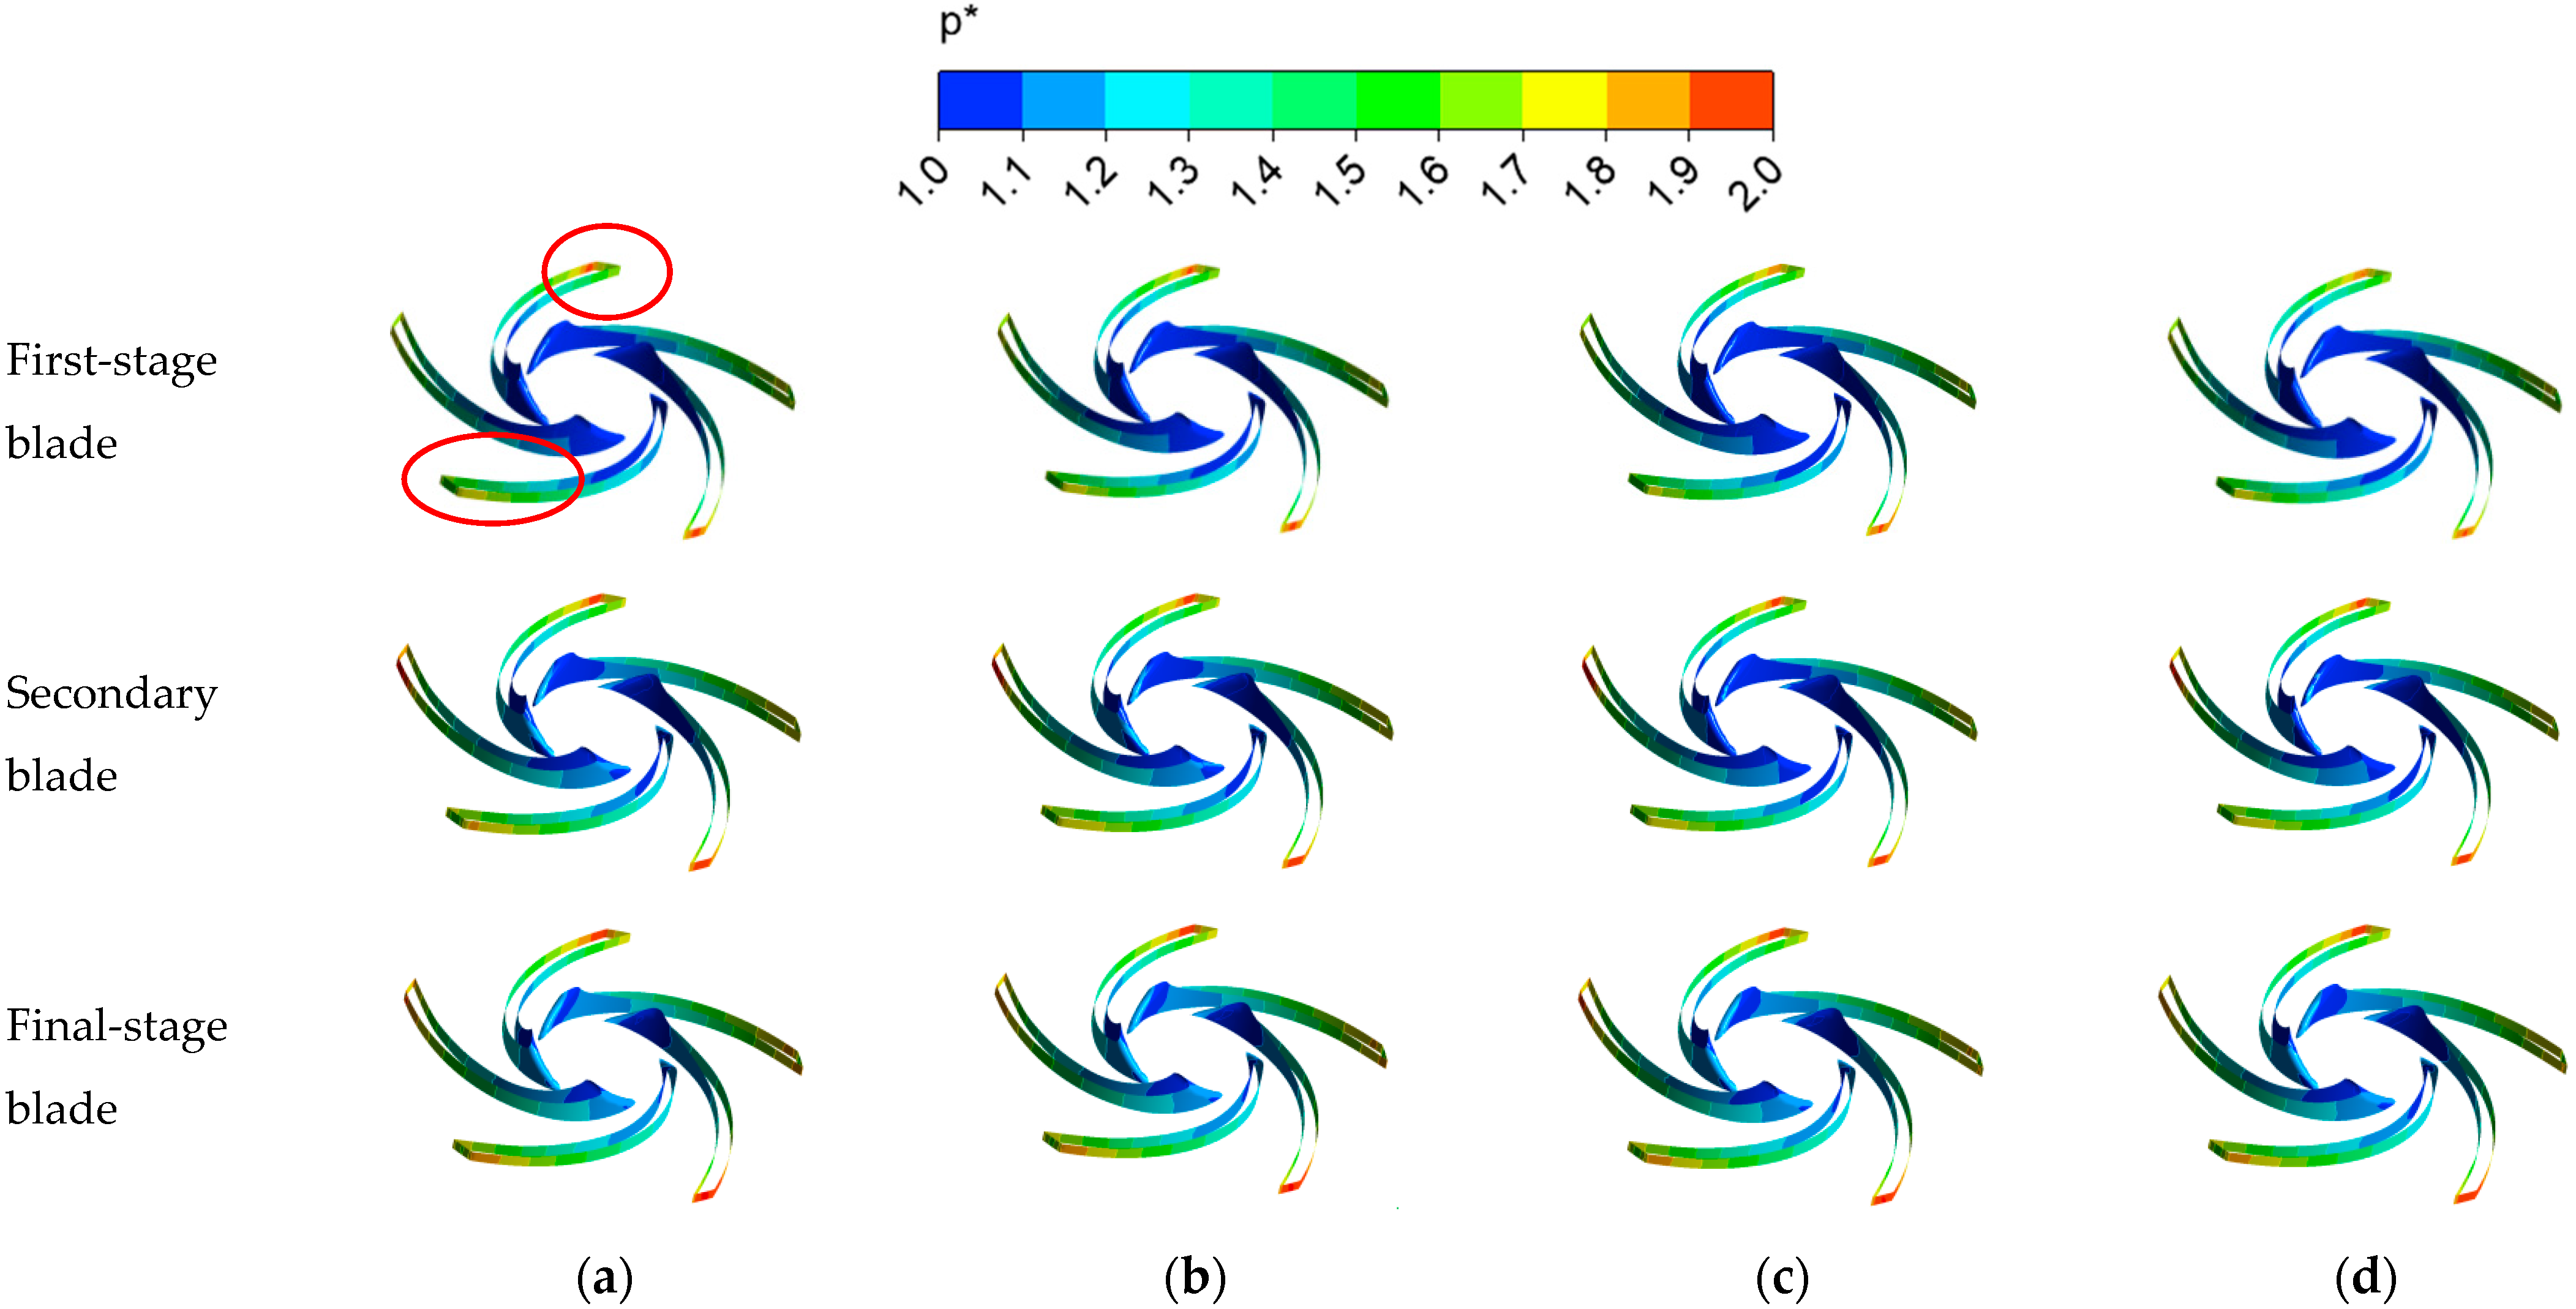
Figure 8 illustrates the pressure distribution on the impeller blades under different gas-containing conditions. Given that the impeller is the key pressurizing component of the pump, the research focus is placed on the variation of pressure distribution within the impeller flow channel. This aims to elucidate the effect of gas–liquid two-phase flow on the pressurization performance of the impeller. A dimensionless parameter p* is adopted to eliminate the influence of fluid density variations on the pressure distribution in the flow channels of the multistage centrifugal pump impeller.
p * = p / ( 0.5 ρ u 2 2 )
u 2 = π n D 2 / 60
where n represents the rotational speed, r/min; D2 represents the impeller outlet diameter, m; p is the flow field pressure, Pa; ρ represents the gas–liquid two-phase flow density, kg/m3; u2 is the impeller outlet circumferential velocity, m/s.
Comparing the pressure distribution on the impeller blades under the same gas volume fraction condition, the pressure increases with the number of impeller stages. The pressure on a single-stage impeller blade rises from the impeller inlet to the outlet, with the suction side pressure significantly higher than the pressure side. The high-pressure zone on the pressure side is located at the junction between the impeller outlet and the guide vane. When comparing the pressure distribution on the same-stage impeller blades under different gas volume fraction conditions, it is observed that the pressure distribution pattern remains consistent across varying gas fractions. The pressure gradually increases from the impeller hub to the shroud, with the suction side pressure consistently higher than the pressure side. As the gas volume fraction increases, the area of the high-pressure zone at the junction between the impeller outlet and the guide vane gradually decreases. The area of the low-pressure zone at the inlet of the impeller increases, and the pressure difference between the pressure surface and the suction surface of the blades also increases. In the first-stage impeller, the aggregation of air masses will cause a local low-pressure zone, and the pressure distribution will exhibit intense fluctuations. Therefore, for a three-stage centrifugal pump, changes in the inlet gas volume fraction affect the pressure distribution on the impeller blades. As the inlet gas volume fraction increases, the pressure distribution trend remains relatively consistent, but the area of the high-pressure zone on the impeller blades decreases. The reduction in the high-pressure zone area at the impeller/guide vane junction is only marginal.

3.3. Gas Content Distribution on Blade Surface

Figure 9 shows the gas volume fraction distribution on the impeller blades under different gas volume fraction conditions. As the inlet gas volume fraction increases from 1% to 5%, the suction side of the impeller blades accumulates gas phase, with bubbles forming band-like distributions in localized areas. The gas phase is primarily concentrated near the leading edge of the impeller, and the gas-containing region expands toward the mid-section of the impeller as the gas volume fraction increases. Observing the suction side of the impeller, when IGVF = 1%, cavities are distributed at the inlet and mid-section of the suction side, with a cavity volume fraction of 0.4–0.5. A region with a volume fraction of 1 appears at the impeller inlet. When IGVF = 2%, the region with a volume fraction of 1 at the blade leading edge significantly expands and shifts toward the mid-section of the blade, while the gas volume fraction in the mid-section increases to 0.6–0.8. When IGVF = 3%, a region with a cavity volume fraction of 1 emerges in the mid-section of the impeller suction side, and the area occupied by cavities further increases. When IGVF = 5%, bubbles fully cover the mid-section of the blade suction side. Therefore, as the gas content in the import increases, gas will form localized accumulation areas in the impeller flow channel, and it will preferentially accumulate at the junction of the blade suction surface and the upper cover plate. When the gas content exceeds 5%, the accumulation area will spread towards the impeller outlet, resulting in a significant increase in the risk of flow channel blockage.

3.4. Vortex Structure Distribution Inside the Impeller

3.4.1. First-Stage Impeller Vortex Structure Distribution

To analyze the impact of inlet gas volume fraction on the vortex structure within a three-stage centrifugal pump, the Q-criterion is employed to identify vortices under different gas volume fraction conditions. To more clearly observe changes in the vortex area within the pump, a quantitative analysis of the vortex areas in the impeller and guide vanes is conducted.
Figure 10 presents the vortex structure identification results for the first-stage impeller of the three-stage centrifugal pump. By examining the vortex distribution in different directions of the impeller, it can be observed that trailing-edge vortices appear at the outlet of the first-stage impeller. The pressure at the impeller outlet increases along the flow direction, leading to boundary layer separation. The separation zone forms a shear layer that rolls up to generate vortex cores, which explains the formation of wake vortices at the impeller outlet. Comparing the suction side and pressure side of the impeller, the vortex intensity on the pressure side is significantly higher than that on the suction side. The pressure on the impeller’s pressure side is lower than that on the suction side, creating a low-pressure zone. This low pressure draws fluid from the hub toward the shroud, inducing transverse flow and forming secondary flow within the impeller passage. The superposition of this secondary flow and the main flow results in spiral-shaped vortex cores, leading to the formation of passage vortices in the middle of the impeller channel. The pressure side of the impeller is more prone to generating vortex cores compared with the suction side. By comparing the vortex structure diagrams of the first-stage impeller under different inlet gas volume fractions, it can be observed that as the inlet gas volume fraction increases, the number of micro-vortices at the impeller outlet slightly increases. When 0.2 mm bubbles enter the first-stage impeller and flow with the fluid, periodic vortex rings are shed at the impeller outlet due to viscous effects. Additionally, the pressure difference between the suction side and pressure side of the impeller drives the fluid to rotate around the bubbles, forming small vortex structures. Within the impeller passage, as the inlet gas volume fraction increases, the separation vortices on the suction side are suppressed, and the separation zone slightly expands but does not form large-scale vortex cores.

3.4.2. Secondary Impeller Vortex Structure Distribution

Figure 11 shows the vortex structure distribution in various directions of the secondary impeller. At the impeller outlet, the gas phase gradually forms gas clusters, while the wake vortices at the impeller rim merge to form large-scale vortex cores. The passage vortices within the flow channels of the secondary impeller are enhanced compared with those in the first stage impeller. This is because the inlet of the secondary impeller is connected to the outlet of the first stage guide vane, where non-uniform flow exacerbates secondary flow in the secondary impeller channels, making the helical passage vortices more pronounced. A distinct vortex appears near the rear shroud of the secondary impeller inlet, which is absent in the first stage impeller. The interaction between the fluid flow at the rear shroud of the secondary impeller inlet and the outflow from the first stage guide vane generates a secondary pulsating vortex. Comparing the vortex structures in the secondary impeller under different gas volume fraction conditions, as the inlet gas volume fraction increases, bubbles gradually accumulate at the impeller rim. When the inlet gas volume fraction reaches 5%, the bubbles coalesce to form large gas slugs. These aggregated gas clusters cause partial blockage at the impeller outlet, resulting in gas cluster blockage vortices.

3.4.3. Final-Stage Impeller Vortex Structure Distribution

Figure 12 shows the vortex structure distribution in the last-stage impeller of a three-stage centrifugal pump. At the outlet of the last-stage impeller, significant gas-phase convergence is observed. A gas-blocking vortex occupying up to 30% of the flow channel width appears at the trailing edge of the impeller water outlet. Compared with the gas-phase area at the outlet of the secondary impeller, the gas-phase area at the outlet of the last-stage impeller is larger. The trailing-edge vortices at the outlet of the last-stage impeller no longer exhibit the port-like features seen in the trailing-edge vortices at the inlet of the secondary impeller. Instead, they exist intermittently over a longer diameter. When comparing the vortex structures in the last-stage impeller under different inlet gas volume fractions, it is found that at an inlet gas volume fraction of 5%, the gas phase in the last-stage impeller has already aggregated into large gas clusters, accompanied by newly formed vortex cores resulting from bubble breakup. The channel vortices within the flow passage are severely affected by non-uniform incoming flow, leading to prominent vortex structures.
To compare the vortex intensity of impellers at different stages under varying inlet gas volume fraction conditions, the vorticity of each stage impeller is integrated over the area. Figure 13 shows the trend of the area-integrated vorticity results for each stage impeller. As the gas content of the imports increases, the vortex intensities of the first-stage impeller are 13.57 m2/s, 14.9 m2/s, 15.09 m2/s, 15.72 m2/s, and 16.31 m2/s, those of the second-stage impeller are 13.89 m2/s, 15.72 m2/s, 15.83 m2/s, 16.28 m2/s, and 16.72 m2/s, and those of the final-stage impeller are 14.00 m2/s, 15.82 m2/s, 16.16 m2/s, 16.61 m2/s, and 16.82.m2/s. The vortex strength within the impellers exhibits a certain increase with the progression of stages, with the vortex strength of the secondary- and final-stage impellers being greater than that of the first-stage impeller. This is attributed to the more stable incoming flow at the inlet of the first-stage impeller compared with that of the penultimate-stage impeller. Additionally, as the stage number increases, the surface pressure of the impeller significantly rises, leading to a more pronounced pressure difference between the suction side and pressure side of the impeller, making the flow passage more prone to passage vortices. With the increase in inlet gas volume fraction, the vorticity intensity of the impeller also increases, reaching its maximum at IGVF = 5%. The aggregation of bubbles promotes vortex generation within the pump. Moreover, compared with the increase in inlet gas volume fraction, the transition from IGVF = 0 to IGVF = 1% has a more significant impact on the vortices within the impeller.

3.5. Guide Vane Vortex Structure Distribution

3.5.1. First-Stage Guide Vane Vortex Structure Distribution

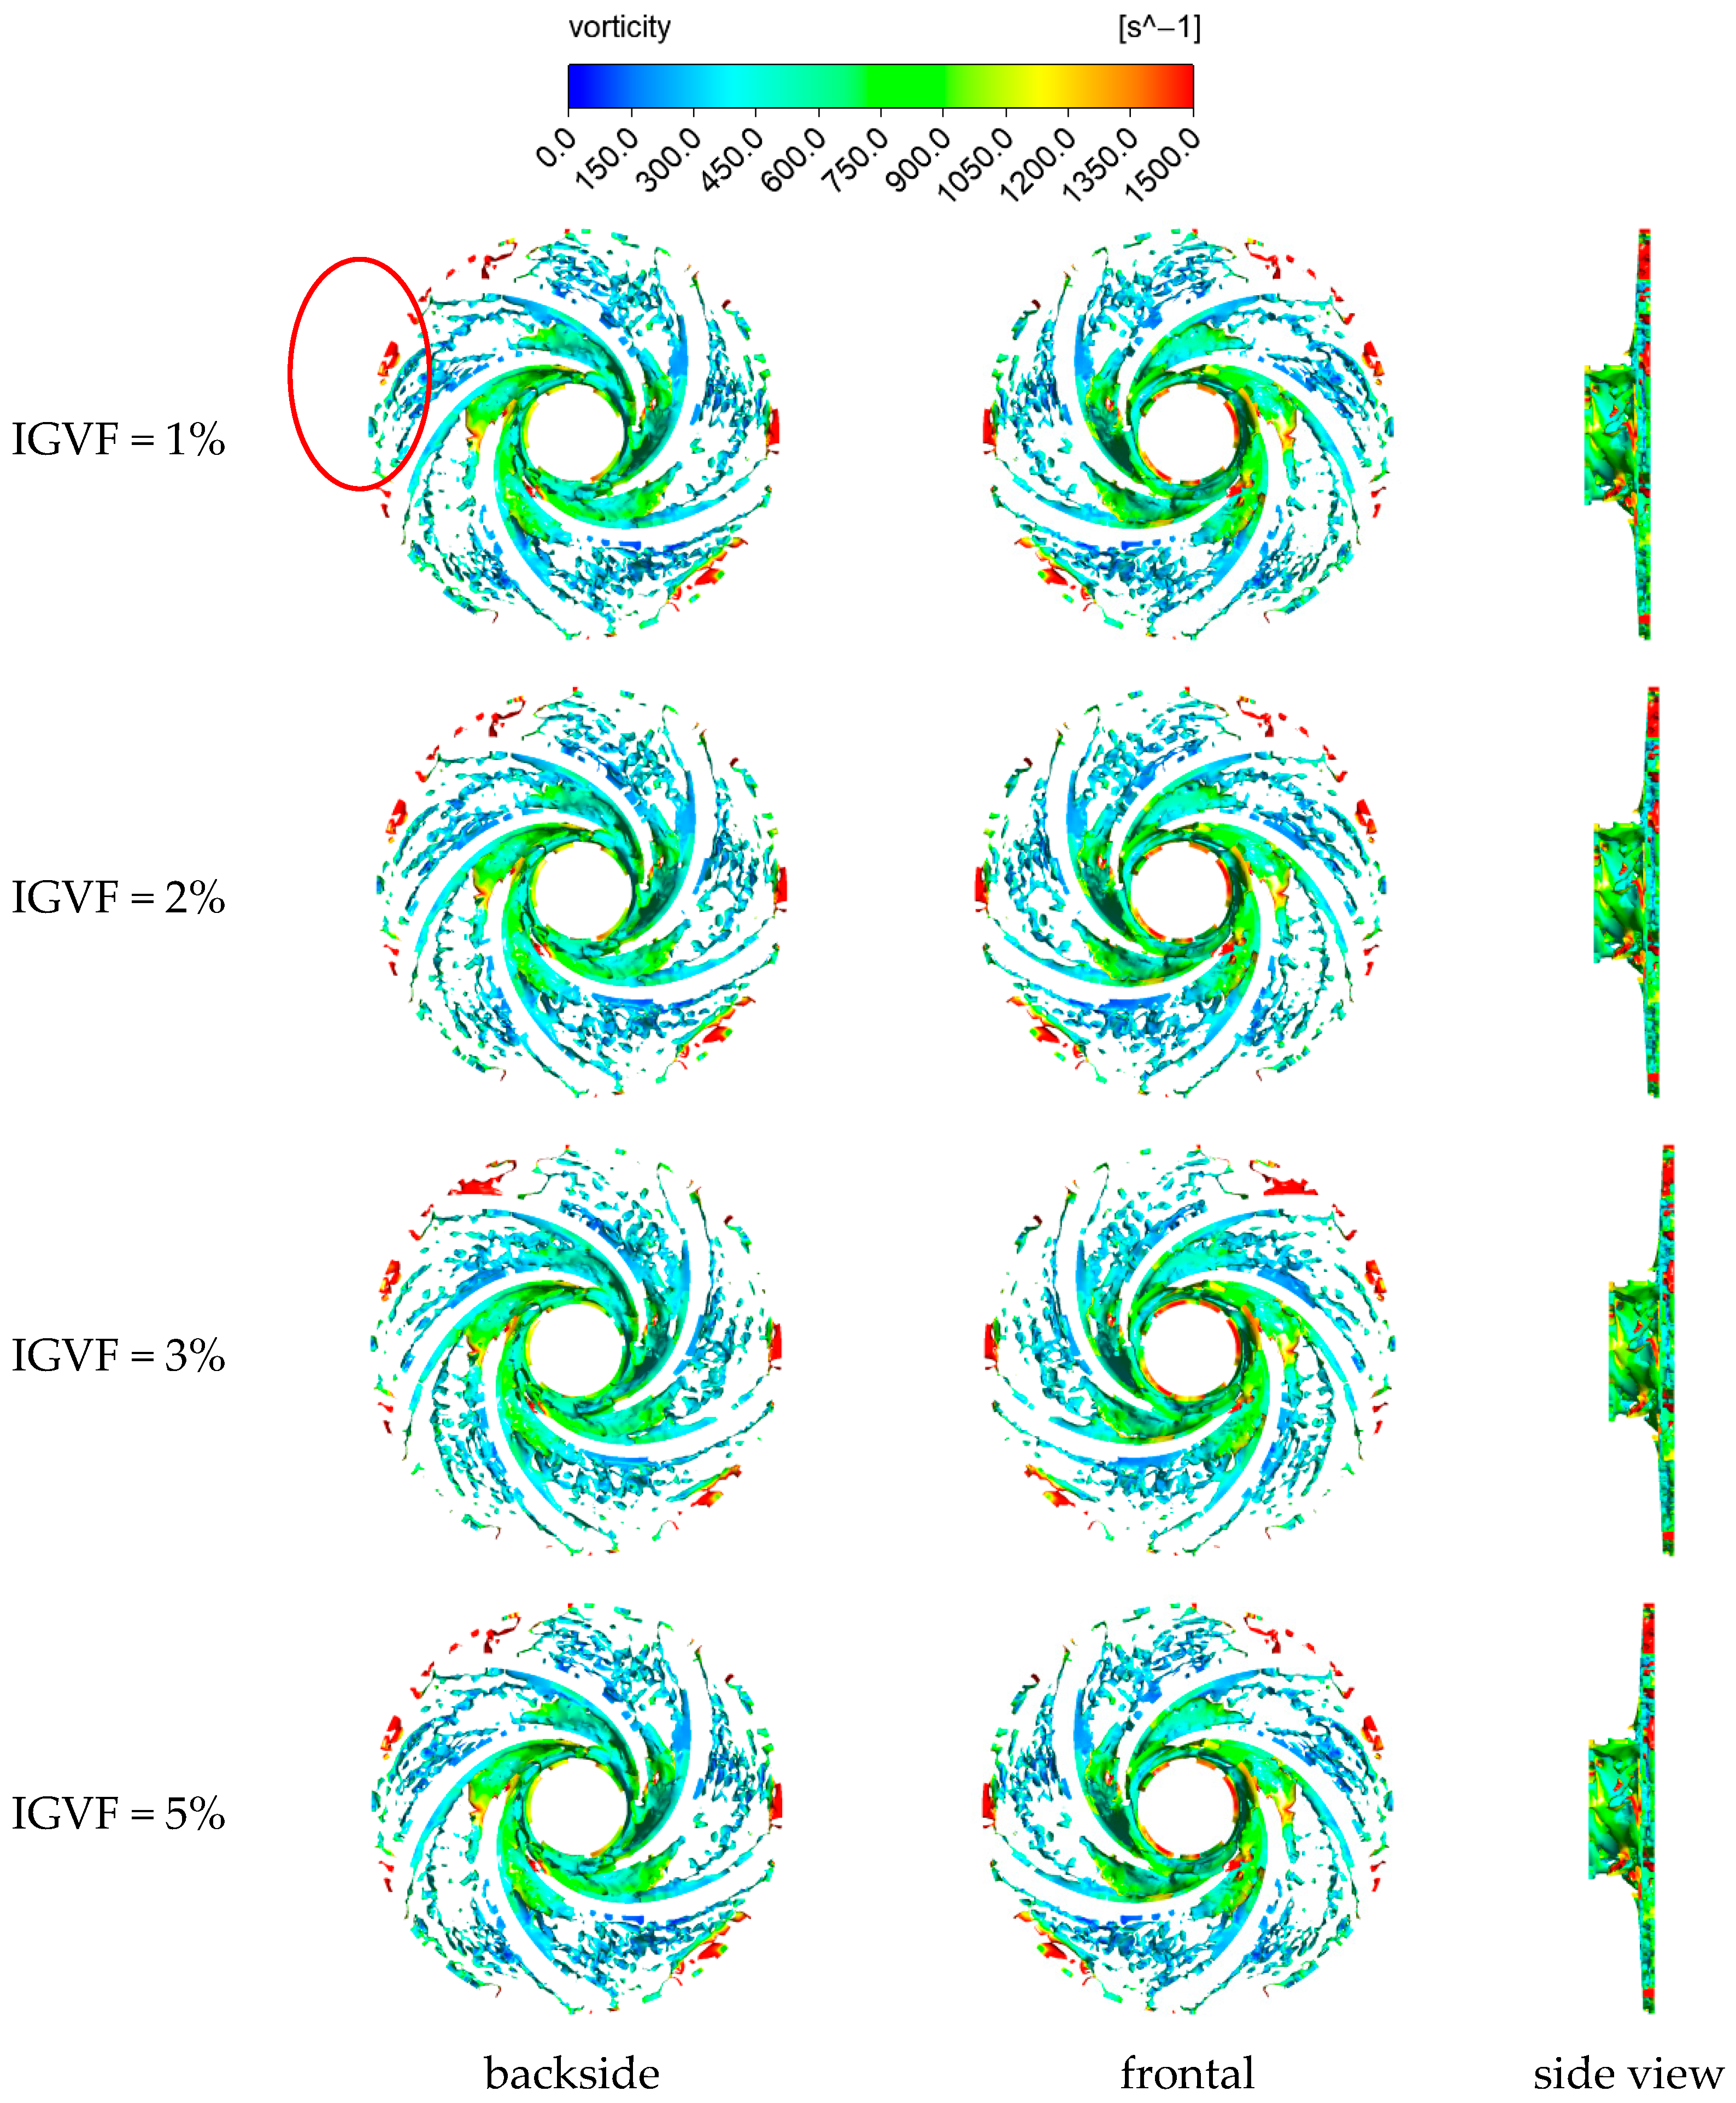
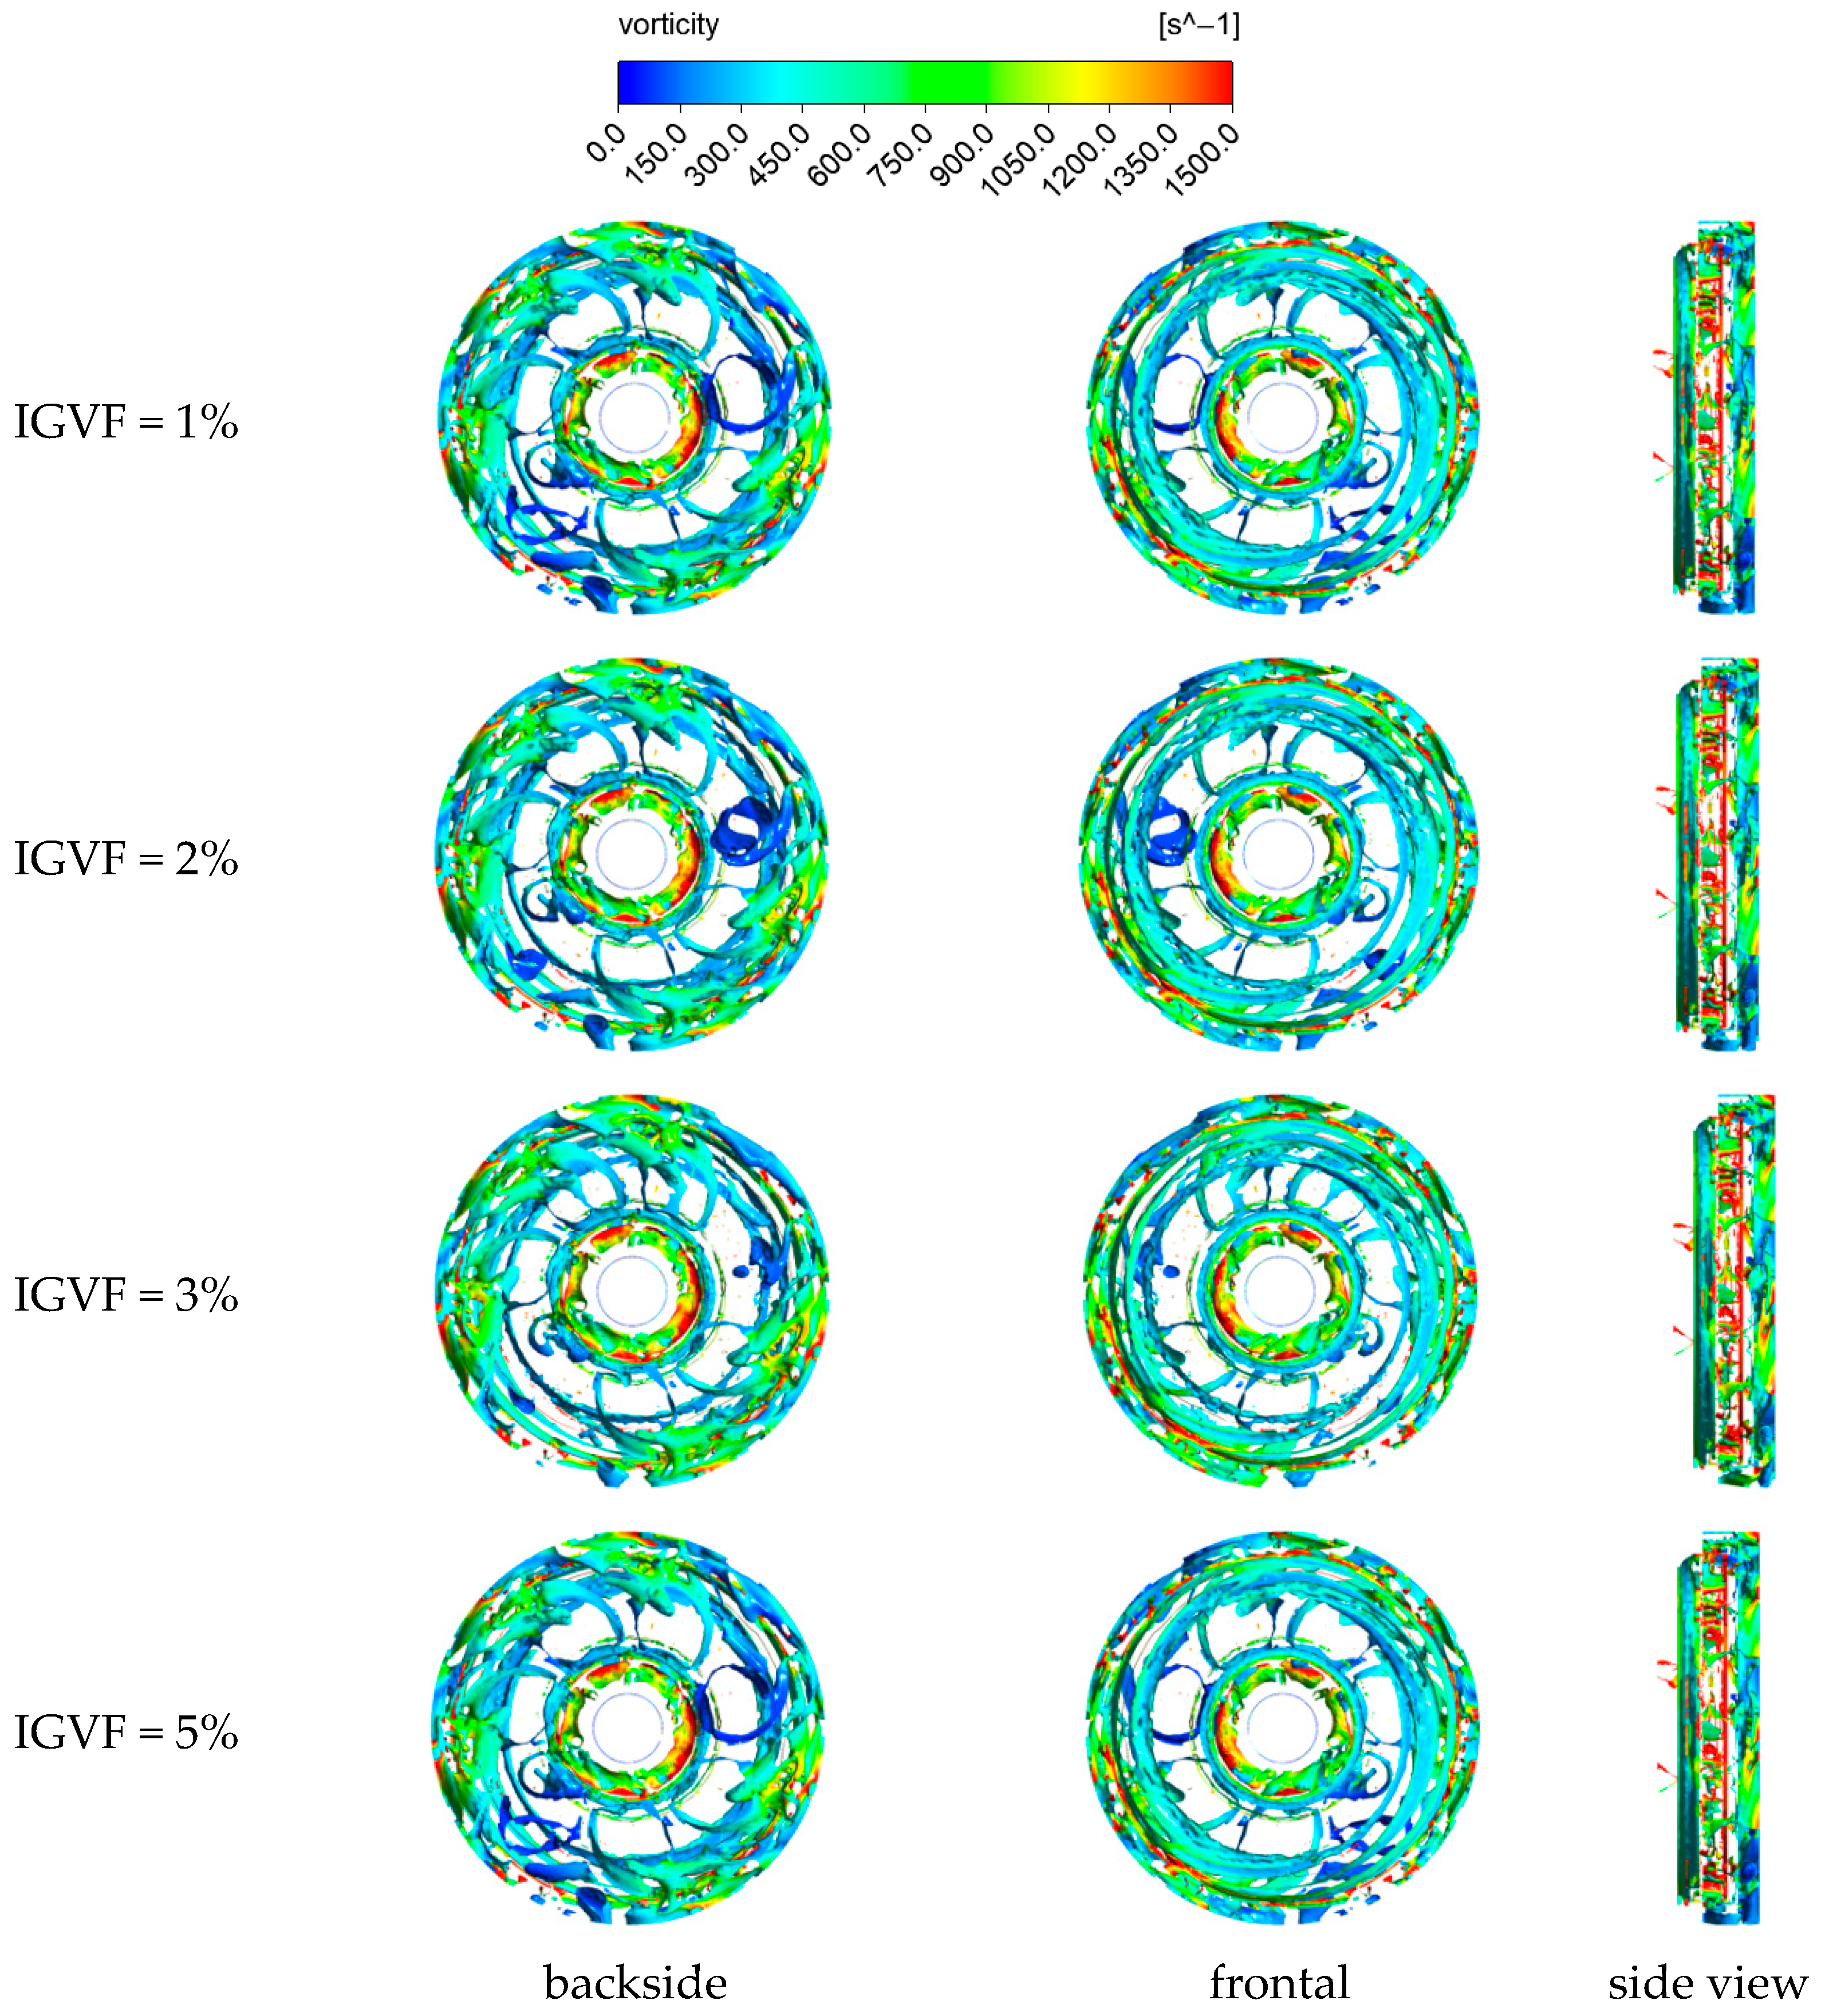
Figure 14 shows the distribution of vortex structures in the flow field within the first-stage guide vanes. From the figure, it can be observed that the vortices in the first-stage guide vanes primarily exist in four locations. First, at the inlet of the guide vanes, part of the fluid flows from the high-pressure region of the guide vanes into the suction chamber through the seal ring clearance. The fluid flow within this clearance exhibits certain leakage, resulting in leakage vortices at this location. Second, at the junction between the first-stage impeller and the first-stage guide vanes, distinct vortices are present. These vortices are the impeller’s tip leakage vortices, which disperse at the inlet of the guide vane flow passage. Third, vortices are generated by the rotating flow outside the front shroud of the impeller. Finally, at the outlet of the guide vanes, where the first-stage guide vanes connect with the second-stage impeller, the flow becomes highly turbulent under the interaction between dynamic and static components, leading to the formation of large-scale gas clusters. As the inlet gas volume fraction increases, the scale of vortices within the guide vanes expands, with bubbles gradually aggregating and tending to form gas clusters. The aggregated bubbles significantly influence the flow passages within the guide vanes, causing the vortex-occupied regions to progressively enlarge.

3.5.2. Secondary Guide Vane Vortex Structure Distribution

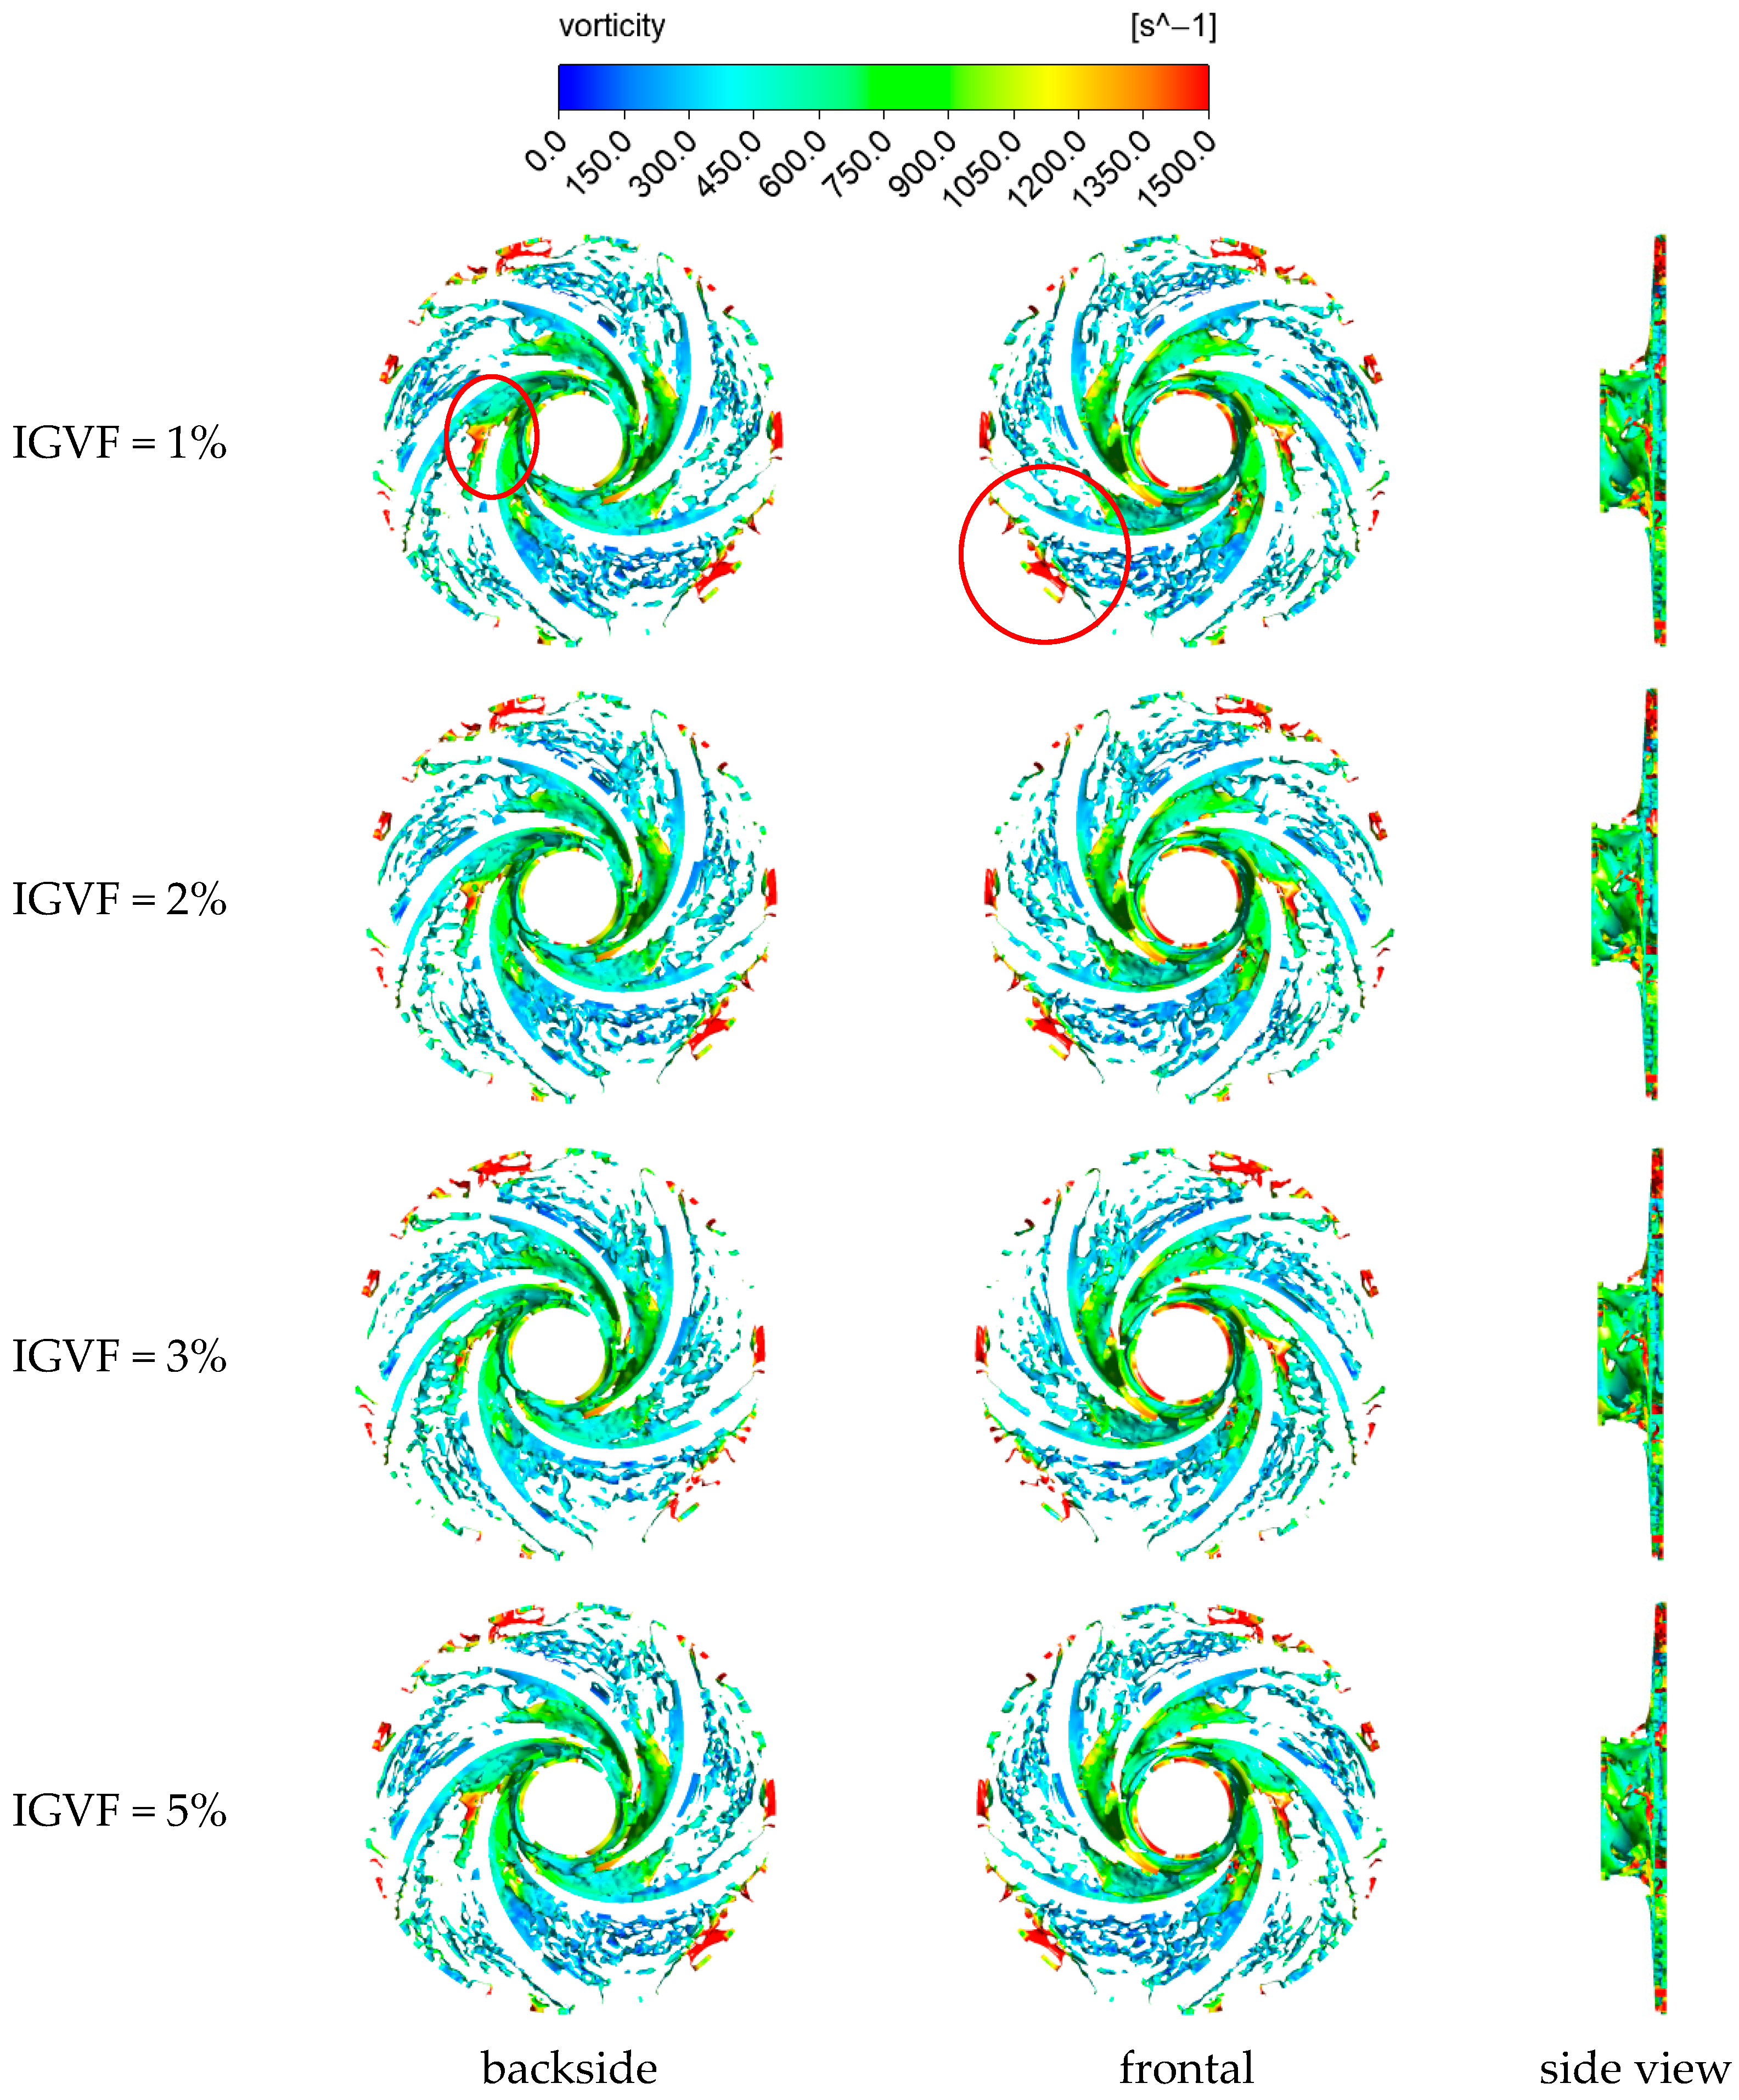
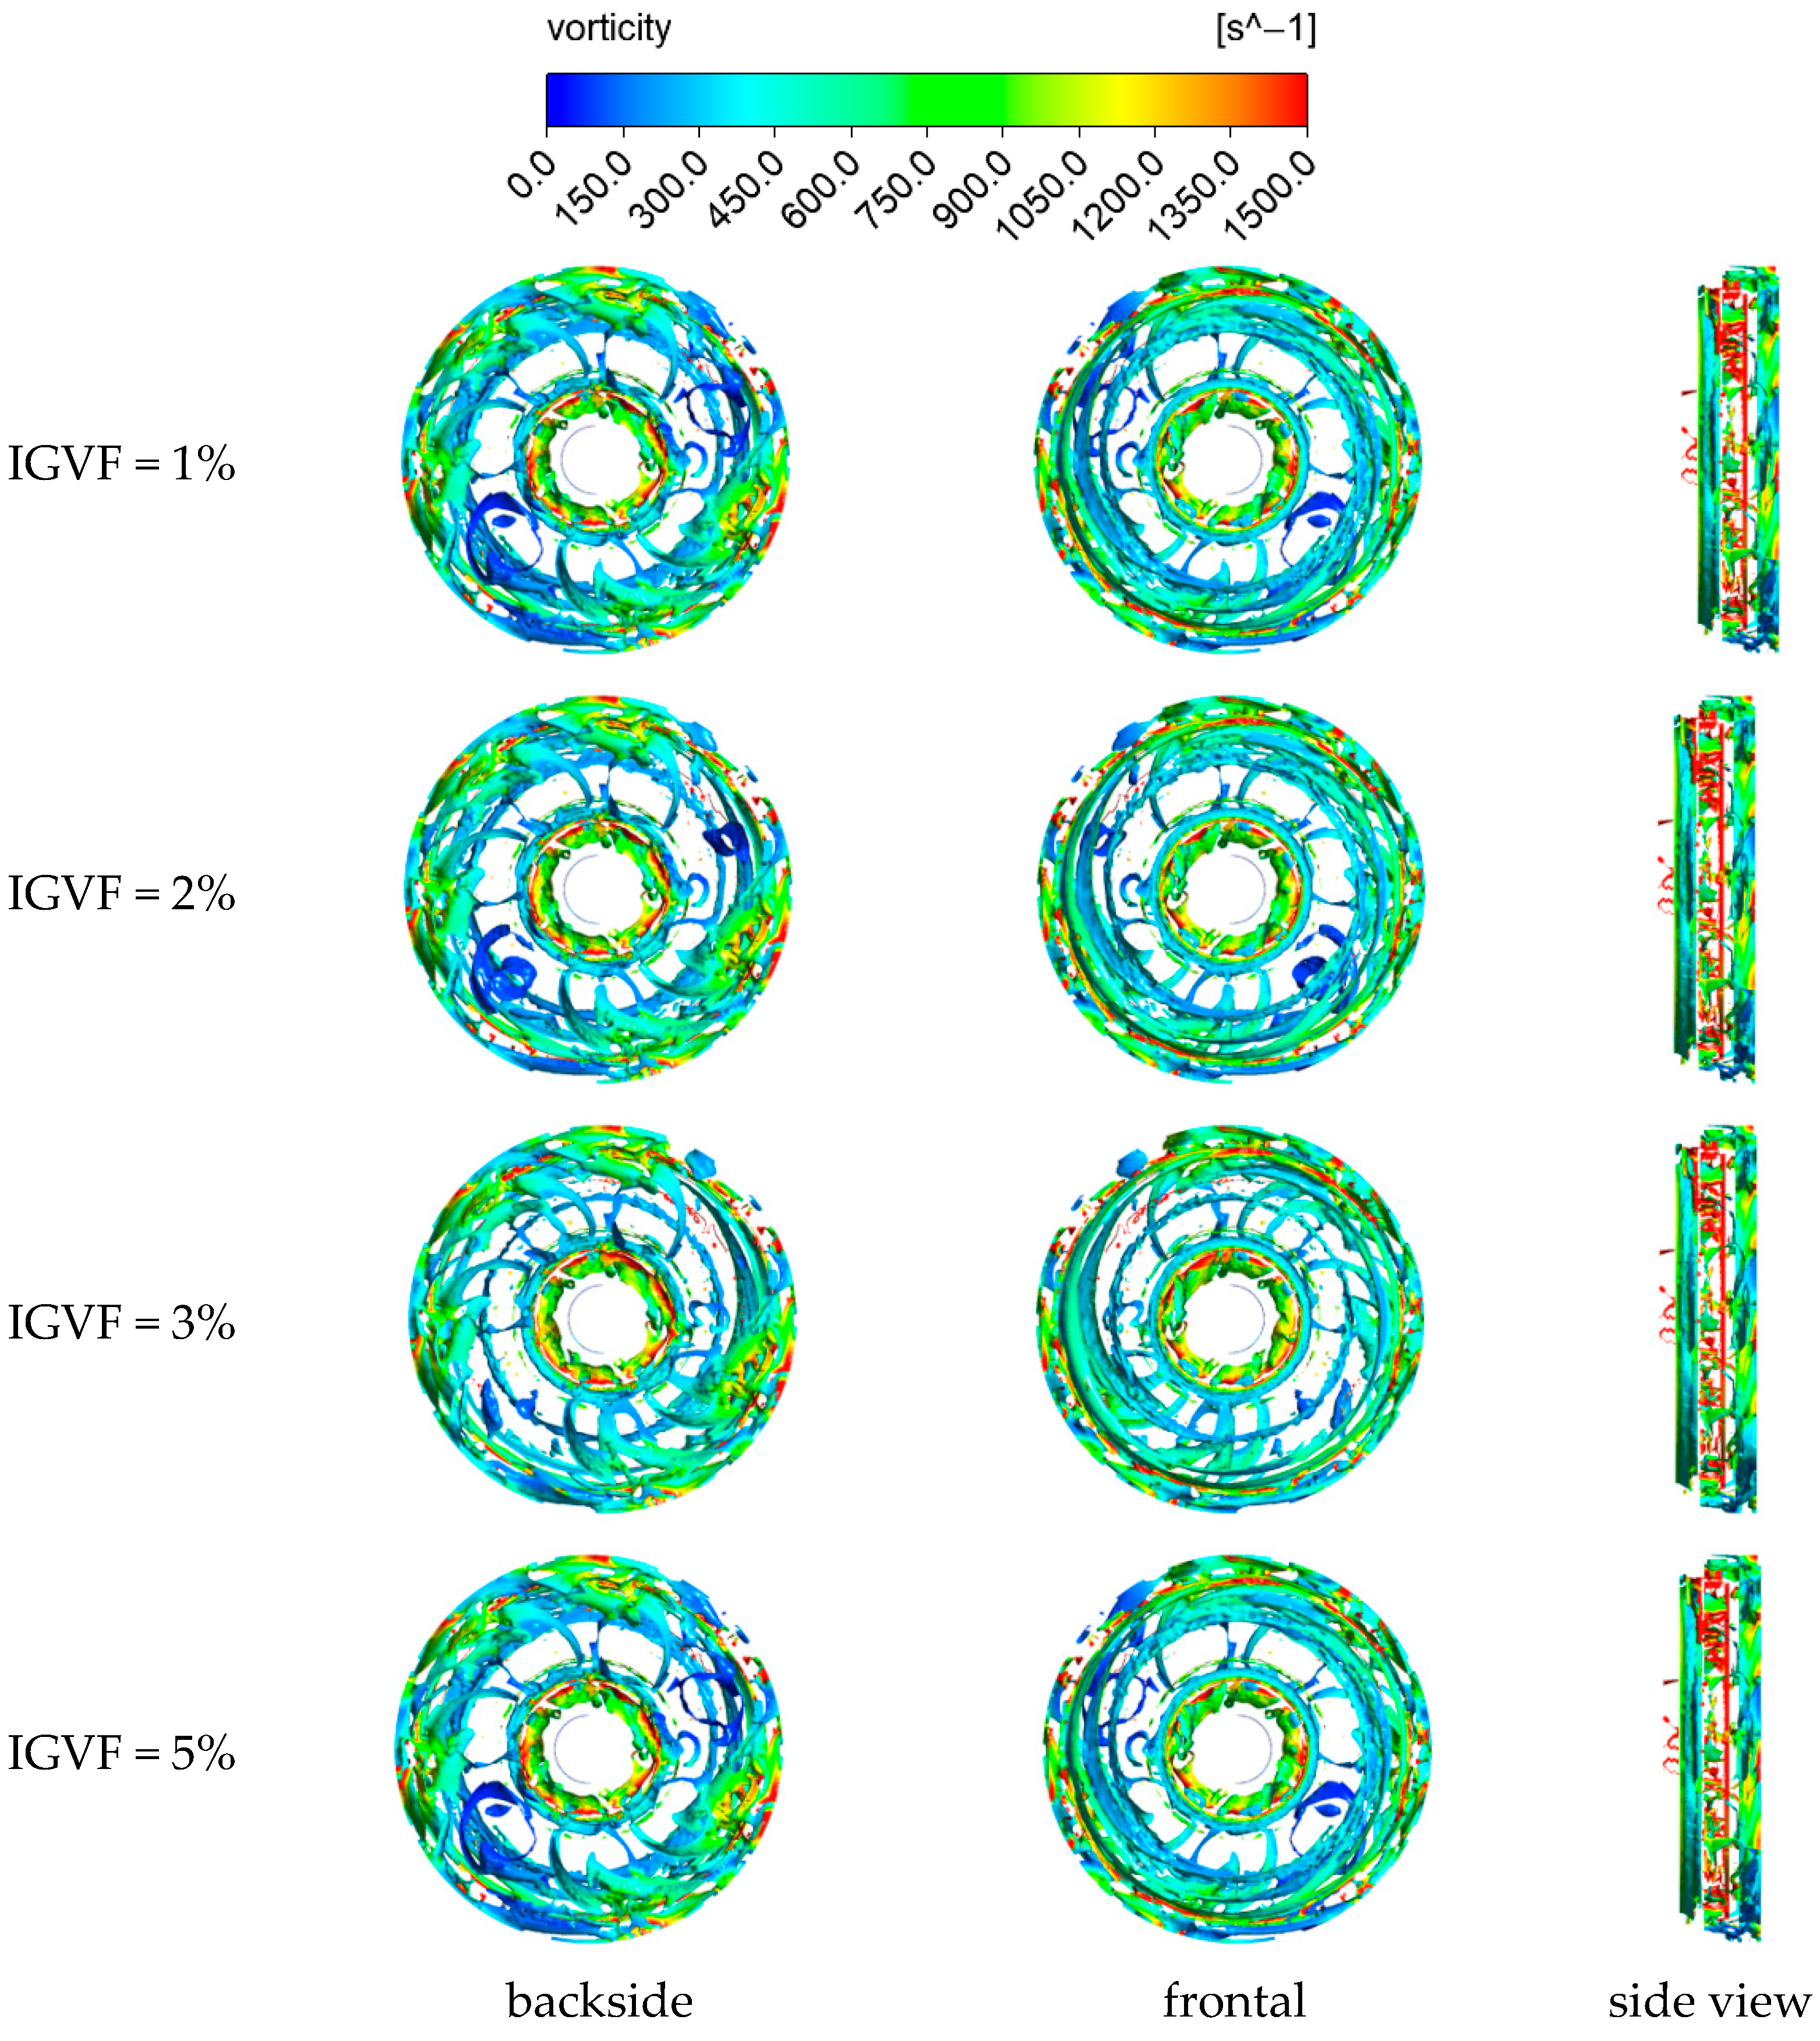
Figure 15 shows the vortex structure distribution inside the secondary guide vanes. The vortex distribution in the secondary guide vanes aligns with that in the first-stage guide vanes, but, compared with the first stage guide vanes, the vortex scale at the same position in the secondary guide vanes has expanded. The leakage vortex at the top of the secondary guide vanes shows a significant increase in volume compared with the first stage guide vanes. At the inlet of the secondary guide vane passage, the gas phase occupies a portion of the flow path, reducing the effective flow area and consequently decreasing the fluid flow velocity. Within the counter guide vane passage, certain recirculation zones and secondary flows exist, leading to energy losses in the guide vanes. As the inlet gas volume fraction increases, the vortices become more localized and enlarged, further occupying the flow path area at the guide vane inlet, with the gas phase exhibiting a tendency to gradually block the flow passage.

3.5.3. Final-Stage Guide Vane Vortex Structure Distribution

Figure 16 shows the distribution of vortex structures in the flow within the last-stage guide vane. It can be observed that the leakage vortex at the top of the last-stage guide vane exhibits a significantly larger scale compared with that at the top of the secondary guide vane. The flow passage at the inlet of the guide vane channel is blocked by the gas phase, with gas-blocking vortices distributed segmentally at the entrance of the guide vane channel. At the outlet of the guide vane, the vortex scale is reduced compared with that at the outlet of the secondary guide vane. The flow at the outlet of the last-stage guide vane is more stable than that at the outlet of the secondary guide vane, with no rotor–stator interference observed, resulting in smoother flow. As the inlet gas volume fraction increases, the vortex scales at different locations expand. By examining the changes in vortex structures across various stages of guide vanes, it can be concluded that an increase in the inlet gas volume fraction leads to larger vortex sizes within the guide vanes, affecting the fluid flow conditions and causing certain energy losses.
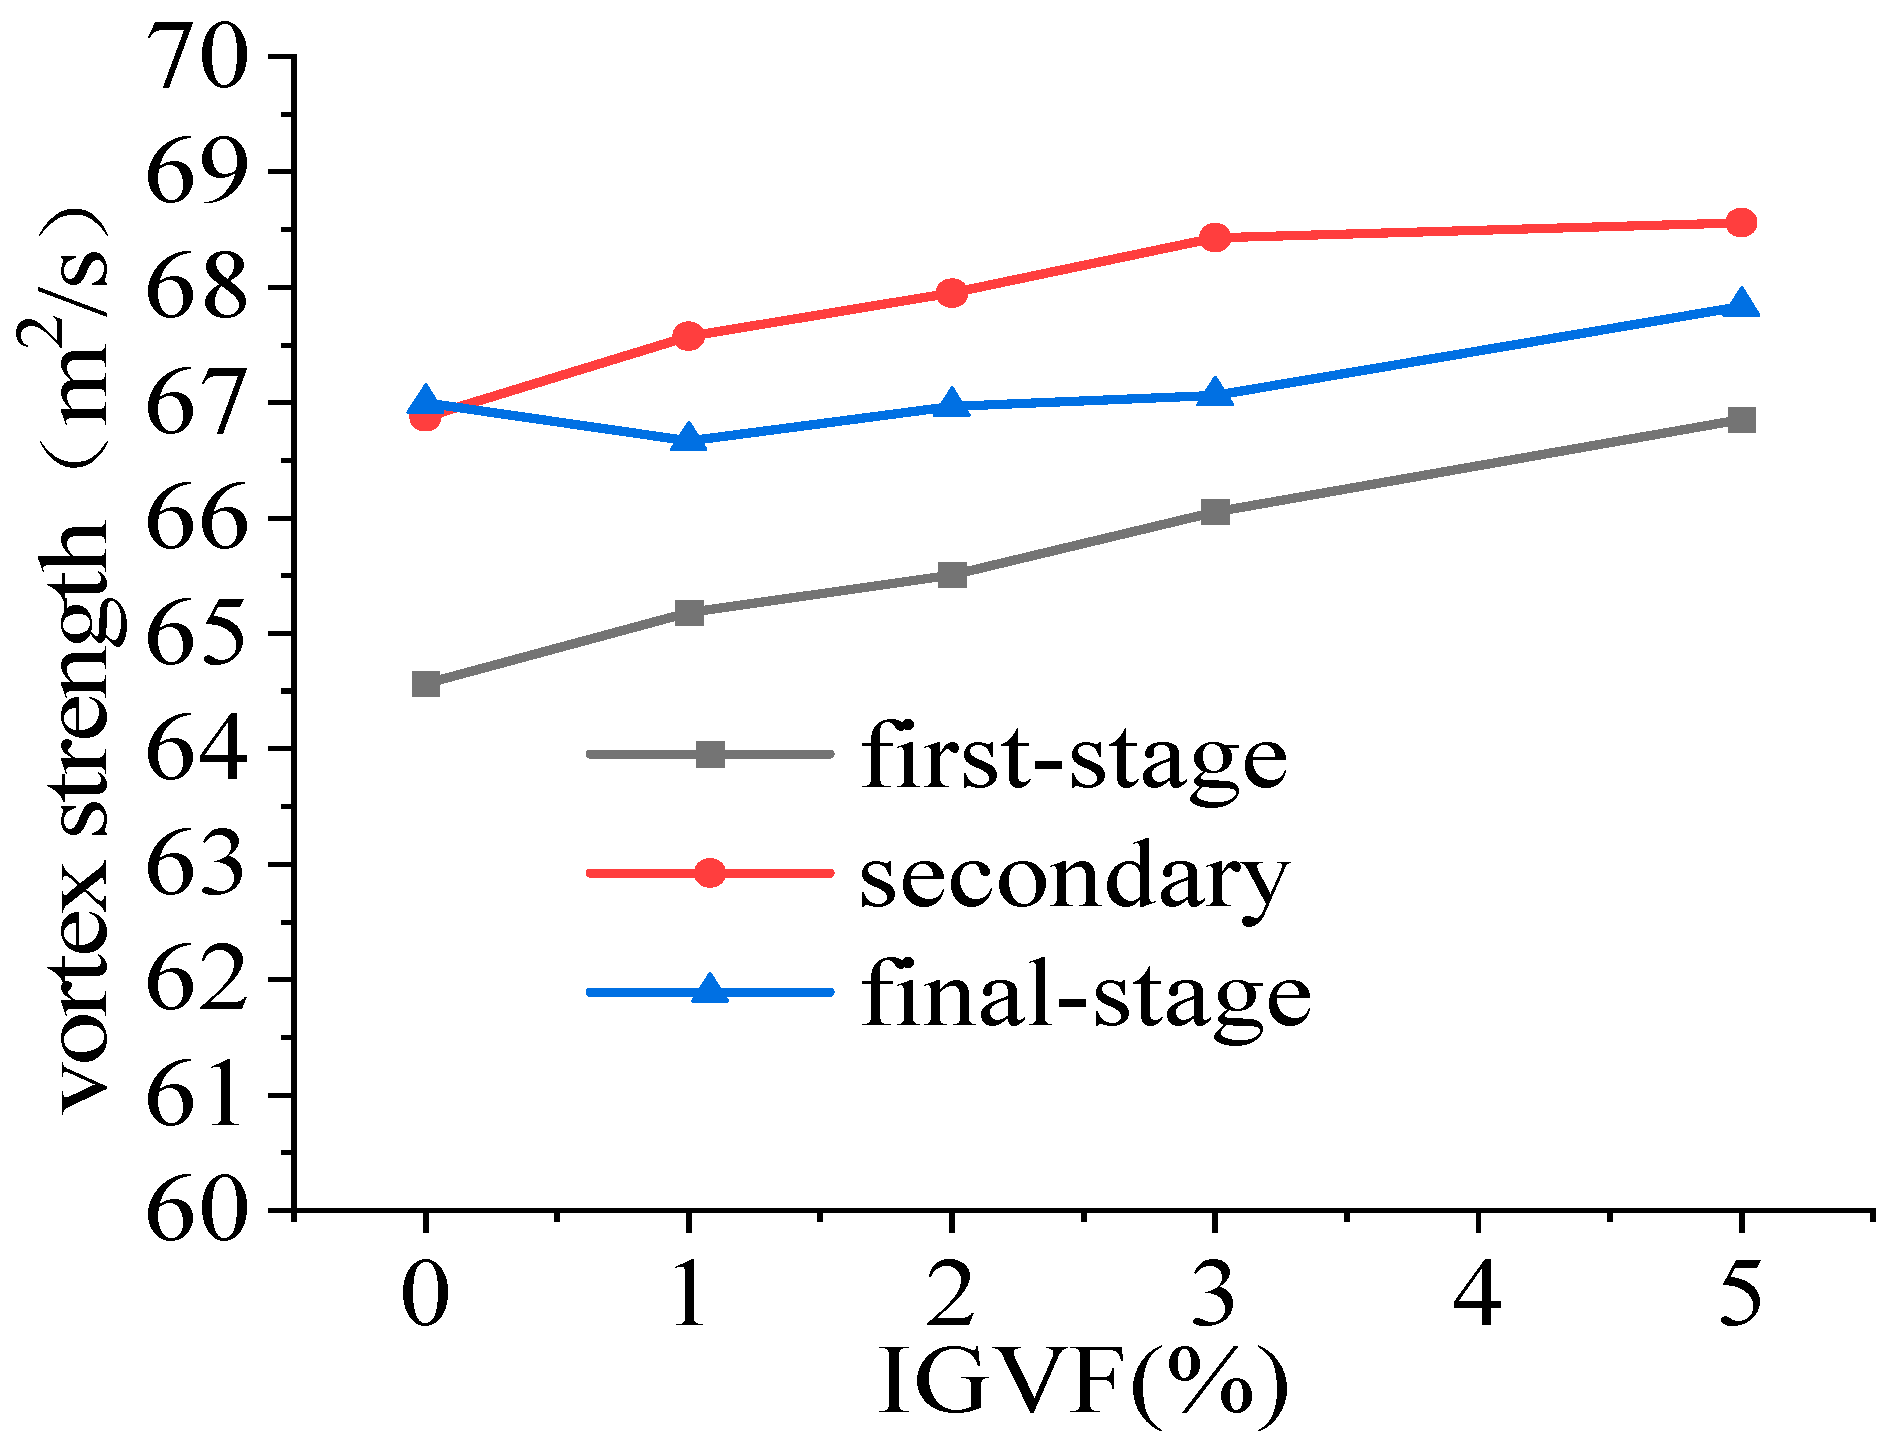
Figure 17 shows the variation of vortex strength in the guide vanes at each stage of the three-stage centrifugal pump. As the gas content of the imports increases, the vortex strengths of the first-stage guide vane are 64.56 m2/s, 65.18 m2/s, 65.51 m2/s, 66.05 m2/s, and 66.86 m2/s, those of the second-stage guide vane are 66.88 m2/s, 67.58 m2/s, 67.95 m2/s, 68.43 m2/s, and 8.56 m2/s, and those of the final-stage guide vane are 67.00 m2/s, 66.67 m2/s, 66.97 m2/s, 67.06 m2/s, and 67.84 m2/s. It can be observed from the figure that under constant gas volume fraction conditions, the secondary guide vane exhibits the highest vortex strength among the three stages, while the first stage guide vane shows the lowest. Vortices within the guide vanes primarily exist at the interface between the guide vanes and the impeller. The pressure inside the guide vanes of the three-stage centrifugal pump increases with the stage number. Comparing the first stage and secondary guide vanes, the vortex strength is greater in the secondary guide vanes due to the influence of the guide vane inlet. The outlet of the final-stage guide vane connects to the discharge section and is not affected by rotor–stator interaction, resulting in a reduction of vortex strength compared with the secondary guide vanes. However, due to the pressure effect inside the guide vanes, the vortex strength remains higher than that in the first stage guide vanes. As the inlet gas volume fraction increases, the vortex strength in the guide vanes at all stages also increases, with a gradual and moderate growth trend. Compared with the vortex strength inside the impeller, the vortex strength of the fluid in each stage of the guide vanes is much greater than that inside the corresponding impeller. This indicates that the degree of vortex change when the fluid flows inside the guide vanes is more intense compared with that inside the impeller. There are more vortices and energy losses inside the guide vanes.

3.6. Pressure Pulsation Analysis

3.6.1. Monitoring Point Setup

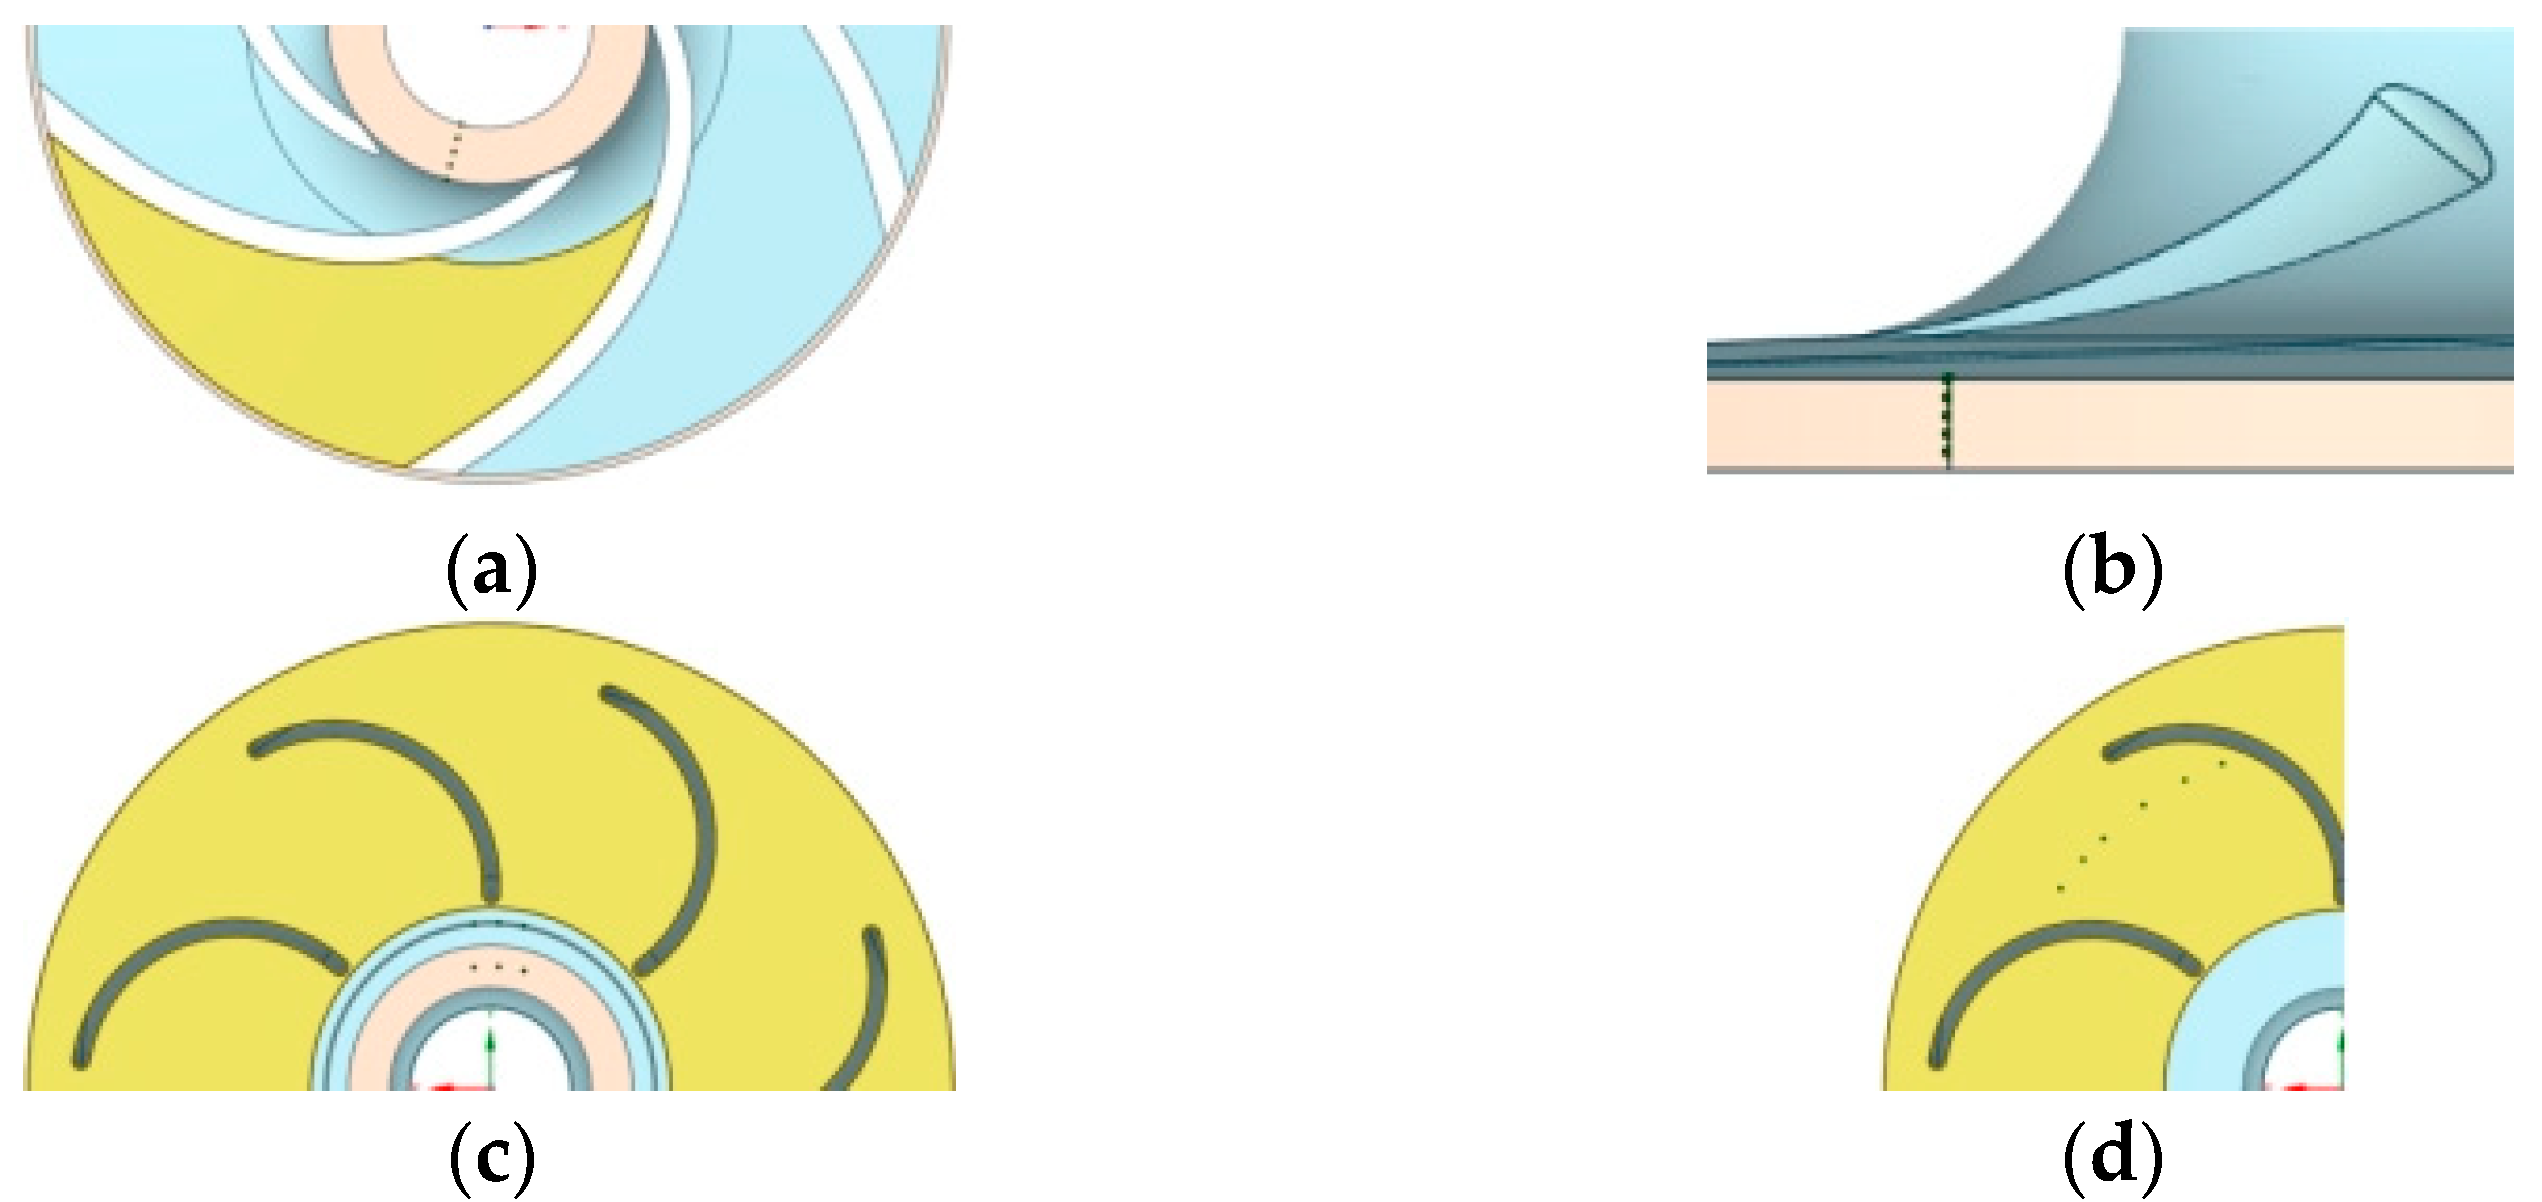
Figure 18 shows the pressure fluctuation monitoring point locations at the impeller inlet, impeller outlet, and guide vane outlet. The first-stage impeller is equipped with nine monitoring points, labeled A1 to A5 at radial positions r = 22 mm, 26 mm, 30 mm, 32 mm, and 34 mm at the impeller inlet. At the impeller outlet, the first-stage guide vane has six monitoring points, with C1 to C3 at r = 19.6 mm and C4 to C6 at r = 15 mm. The secondary-stage impeller and the last-stage impeller inlets and outlets are similarly arranged with monitoring points, as shown in Figure 18a,b. The secondary-stage guide vane outlet has monitoring points arranged similarly to Figure 18c, while the last-stage guide vane outlet positions C1 to C6 at r = 42 mm.

3.6.2. Time-Domain Characteristics Analysis of Pressure Pulsation

When exploring the internal fluid pressure fluctuation characteristics of different flow-through components, the concept of the pressure fluctuation coefficient Cp is introduced. It aims to reflect the fluctuation range between the instantaneous pressure and the average pressure. The pressure fluctuation coefficient Cp is defined as follows:
C p = p p ¯ 0.5 ρ u 2
u = n π D 2 60
where p represents the instantaneous fluid pressure value at a certain monitoring point, Pa; p ¯ represents the average fluid pressure at a certain monitoring point within the monitoring period, Pa; ρ represents the density of the fluid medium in the fluid computing domain, kg/m3; u is the circumferential velocity of the fluid at the impeller outlet, m/s; n is the rotational speed of the multistage centrifugal pump, r/min; D 2 is the outer diameter of the impeller, mm.
The frequency domain signal is obtained by performing Fourier transform on the time-domain pulsation, with frequency and the corresponding pulsation amplitude as the horizontal and vertical coordinates to establish the corresponding coordinate system. The commonly used reference frequencies mainly include the shaft frequency f0 and the impeller blade frequency fY. The defining equations are as follows:
f 0 = n 60
f Y = f 0 × Z 1
where f0 is the axial frequency, Hz; fY represents the blade frequency of the impeller, in Hz; Z1 represents the number of impeller blades.
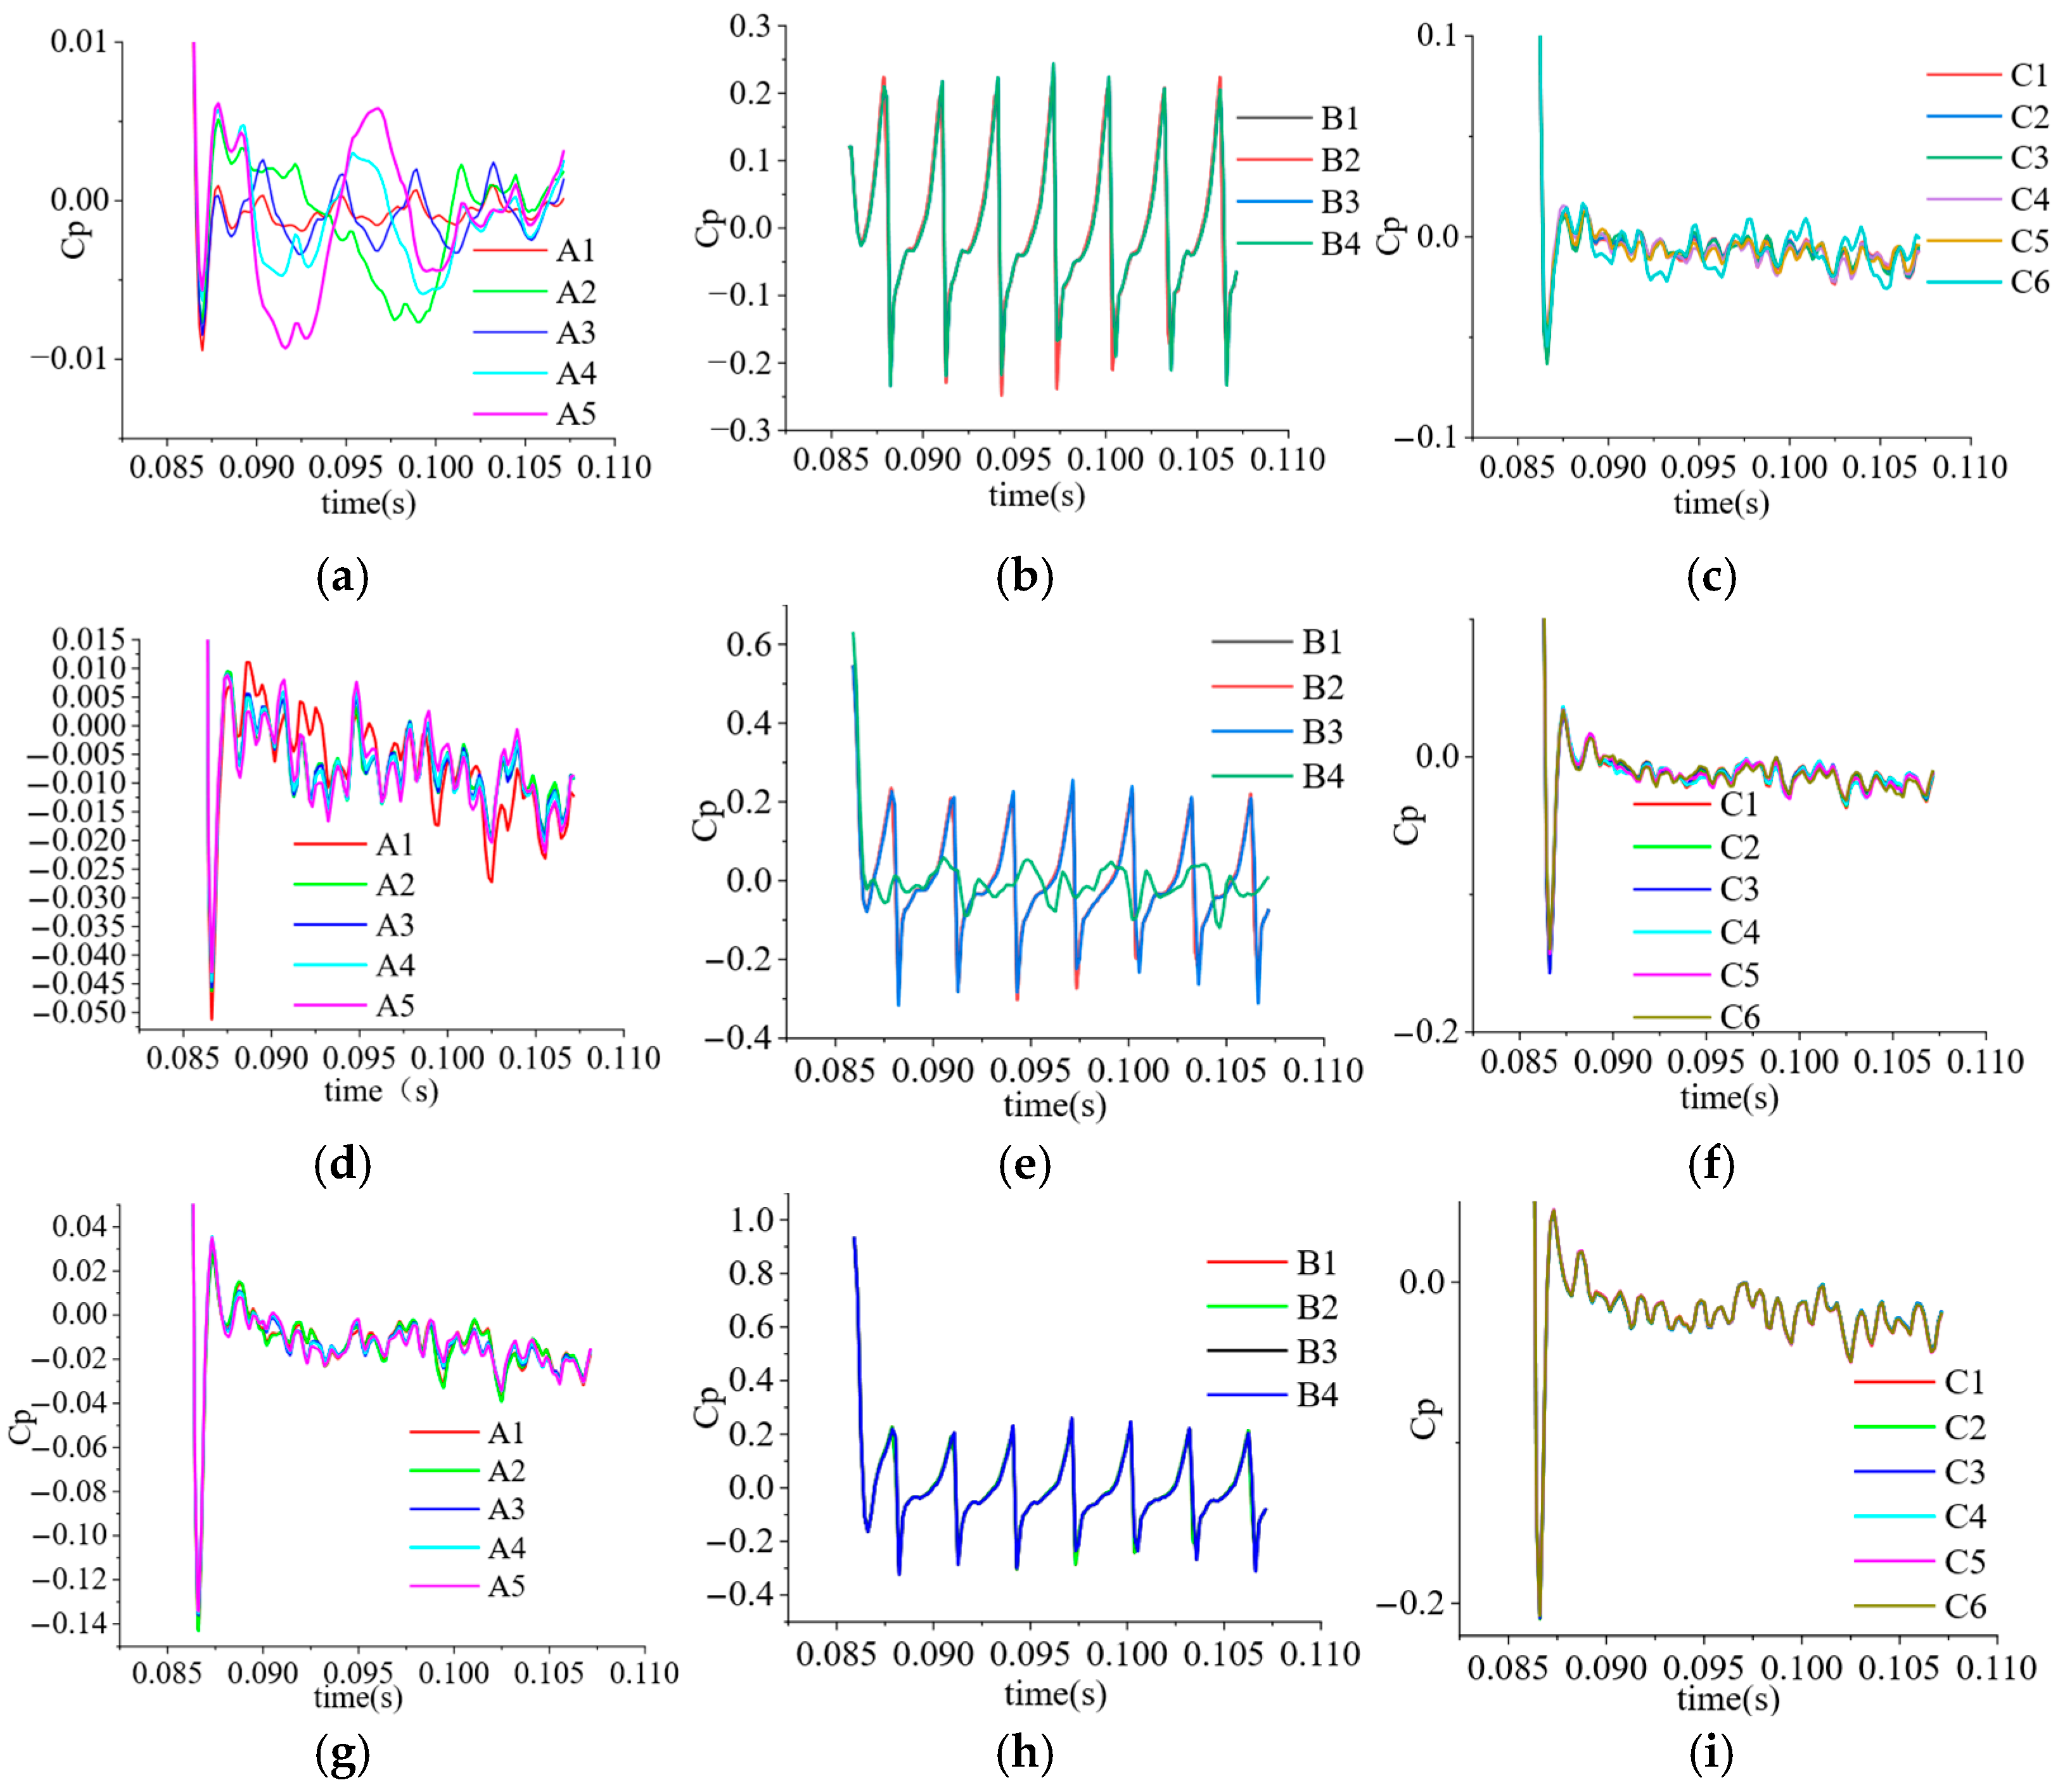
Figure 19 shows the time-domain distribution of pressure pulsation in the pump flow channel during one rotation cycle when the inlet gas volume fraction of the three-stage centrifugal pump is 1%. In the first-stage flow channel, the pressure pulsation in the impeller inlet region exhibits five peaks and troughs. The amplitude of pressure pulsation at points A1 to A4 at the impeller inlet displays a stepwise distribution. Point A5 is located at the impeller inlet and the front shroud, where the regularity of pressure pulsation variation is not significant. Additionally, the pressure pulsation at A5 reaches an extreme value, indicating turbulent fluid flow at this point. The significant variation in pressure pulsation amplitude at A5 is attributed to the accumulation of bubbles in this region. As shown in Figure 19b, the pressure pulsation at the impeller outlet exhibits clear periodicity. During one rotation cycle, the pressure pulsation in the impeller outlet region changes cyclically, with seven peaks and troughs, matching the number of guide vane blades. The pressure pulsation amplitudes at points B1 and B2 vary consistently, as do those at points B3 and B4. Comparing the pressure pulsation amplitudes at B2 and B3, the amplitude at B3 is greater than that at B2, indicating more intense pressure fluctuations near the upper shroud of the impeller outlet. This is caused by the tip clearance at the upper part of the impeller outlet. At the guide vane outlet, due to incomplete rectification of the fluid exiting the impeller, significant residual circulation remains, leading to bubble clustering and chaotic pressure pulsation. As shown in Figure 19c, among the six points at the guide vane outlet, point C6 exhibits the largest pressure pulsation amplitude, indicating the most severe time-varying bubble coalescence at this location. In the secondary flow channel, the pressure pulsation at the secondary impeller inlet shows more pronounced amplitude fluctuations compared with the first stage impeller inlet. A large trough appears at the beginning of the rotation cycle, indicating intense pressure fluctuations at the secondary impeller inlet during pump startup. These fluctuations persist and influence the pressure variations in the latter part of the cycle. This phenomenon occurs because the secondary impeller inlet experiences more significant dynamic–static interference effects than the first stage impeller inlet, resulting in narrower leakage and severe bubble accumulation accompanied by partial collapse. At the impeller outlet, the pressure pulsation at point B4 differs from that at point B3, with four peaks observed at B4 and an abnormally high pressure during the rotation cycle. This is caused by vortex formation due to bubble generation at the impeller outlet during pump startup. At the guide vane outlet, the bubble scale expands further, leading to more chaotic pressure pulsation. In the final-stage flow channel, the pressure pulsation at the impeller inlet exhibits a larger-amplitude trough during startup, indicating increasingly intense pressure variations at the impeller inlets of each stage as the multistage centrifugal pump starts up. The increase in impeller stages affects the pressure variation trend at the impeller inlet. The pressure pulsation trend at the final-stage impeller outlet aligns with that at the first stage impeller outlet, and the pressure pulsation trends at all points of the final-stage guide vane outlet are consistent. This demonstrates that on the surface of the single return guide vane channel in the final stage, the pressure pulsation is uniform at points along the same diameter. At 0.086621 s, the pressure amplitude reaches a lower trough.
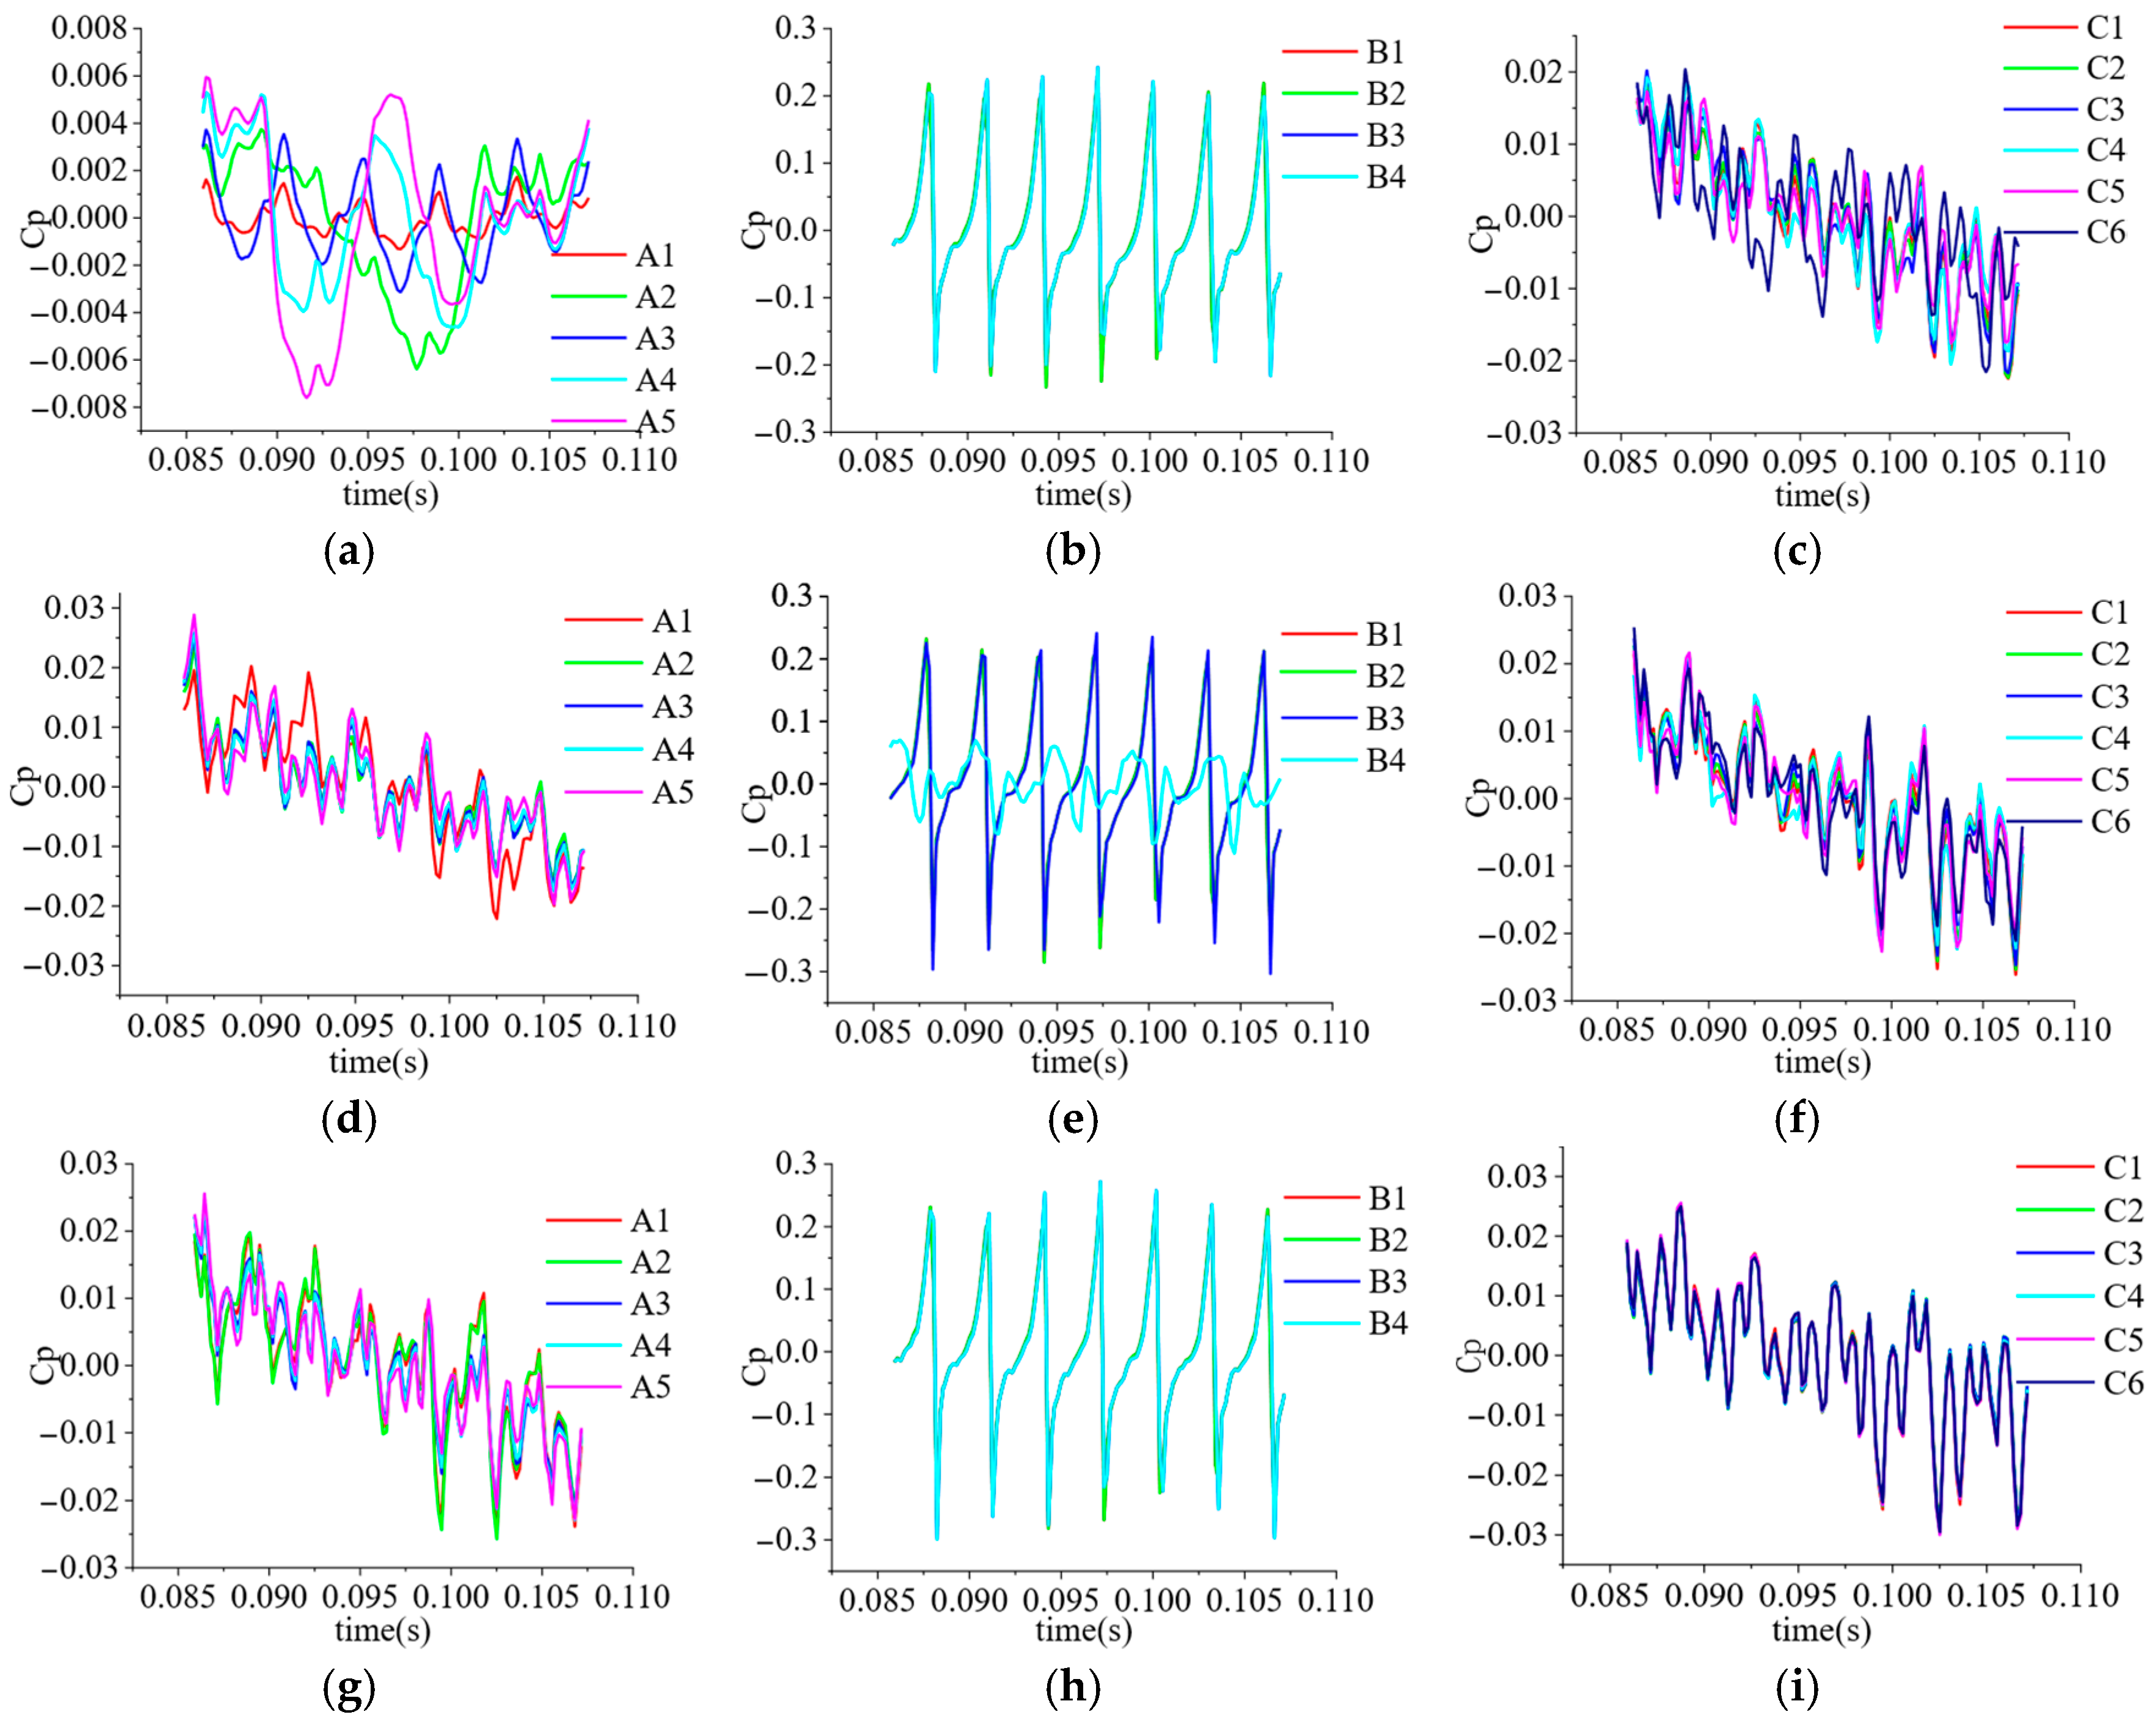
Figure 20 shows the time-domain distribution of pressure pulsation in the pump flow channel during one rotation cycle when the inlet gas volume fraction is 2% for the three-stage centrifugal pump. Compared with Figure 19, the peaks and troughs at the beginning of the rotation cycle at each position disappear. The pressure pulsation at the impeller inlet shows no obvious variation pattern, and its amplitude decreases significantly. The pressure pulsation at the impeller outlet exhibits periodic changes with reduced amplitude. The pressure pulsation at the diffuser outlet tends to shift toward negative amplitudes. As the number of stages increases, the number of pressure pulsation peaks at the diffuser outlet gradually decreases, indicating that under the same inlet gas volume fraction, the flow at the diffuser outlet becomes increasingly stable with the increase in the number of stages.
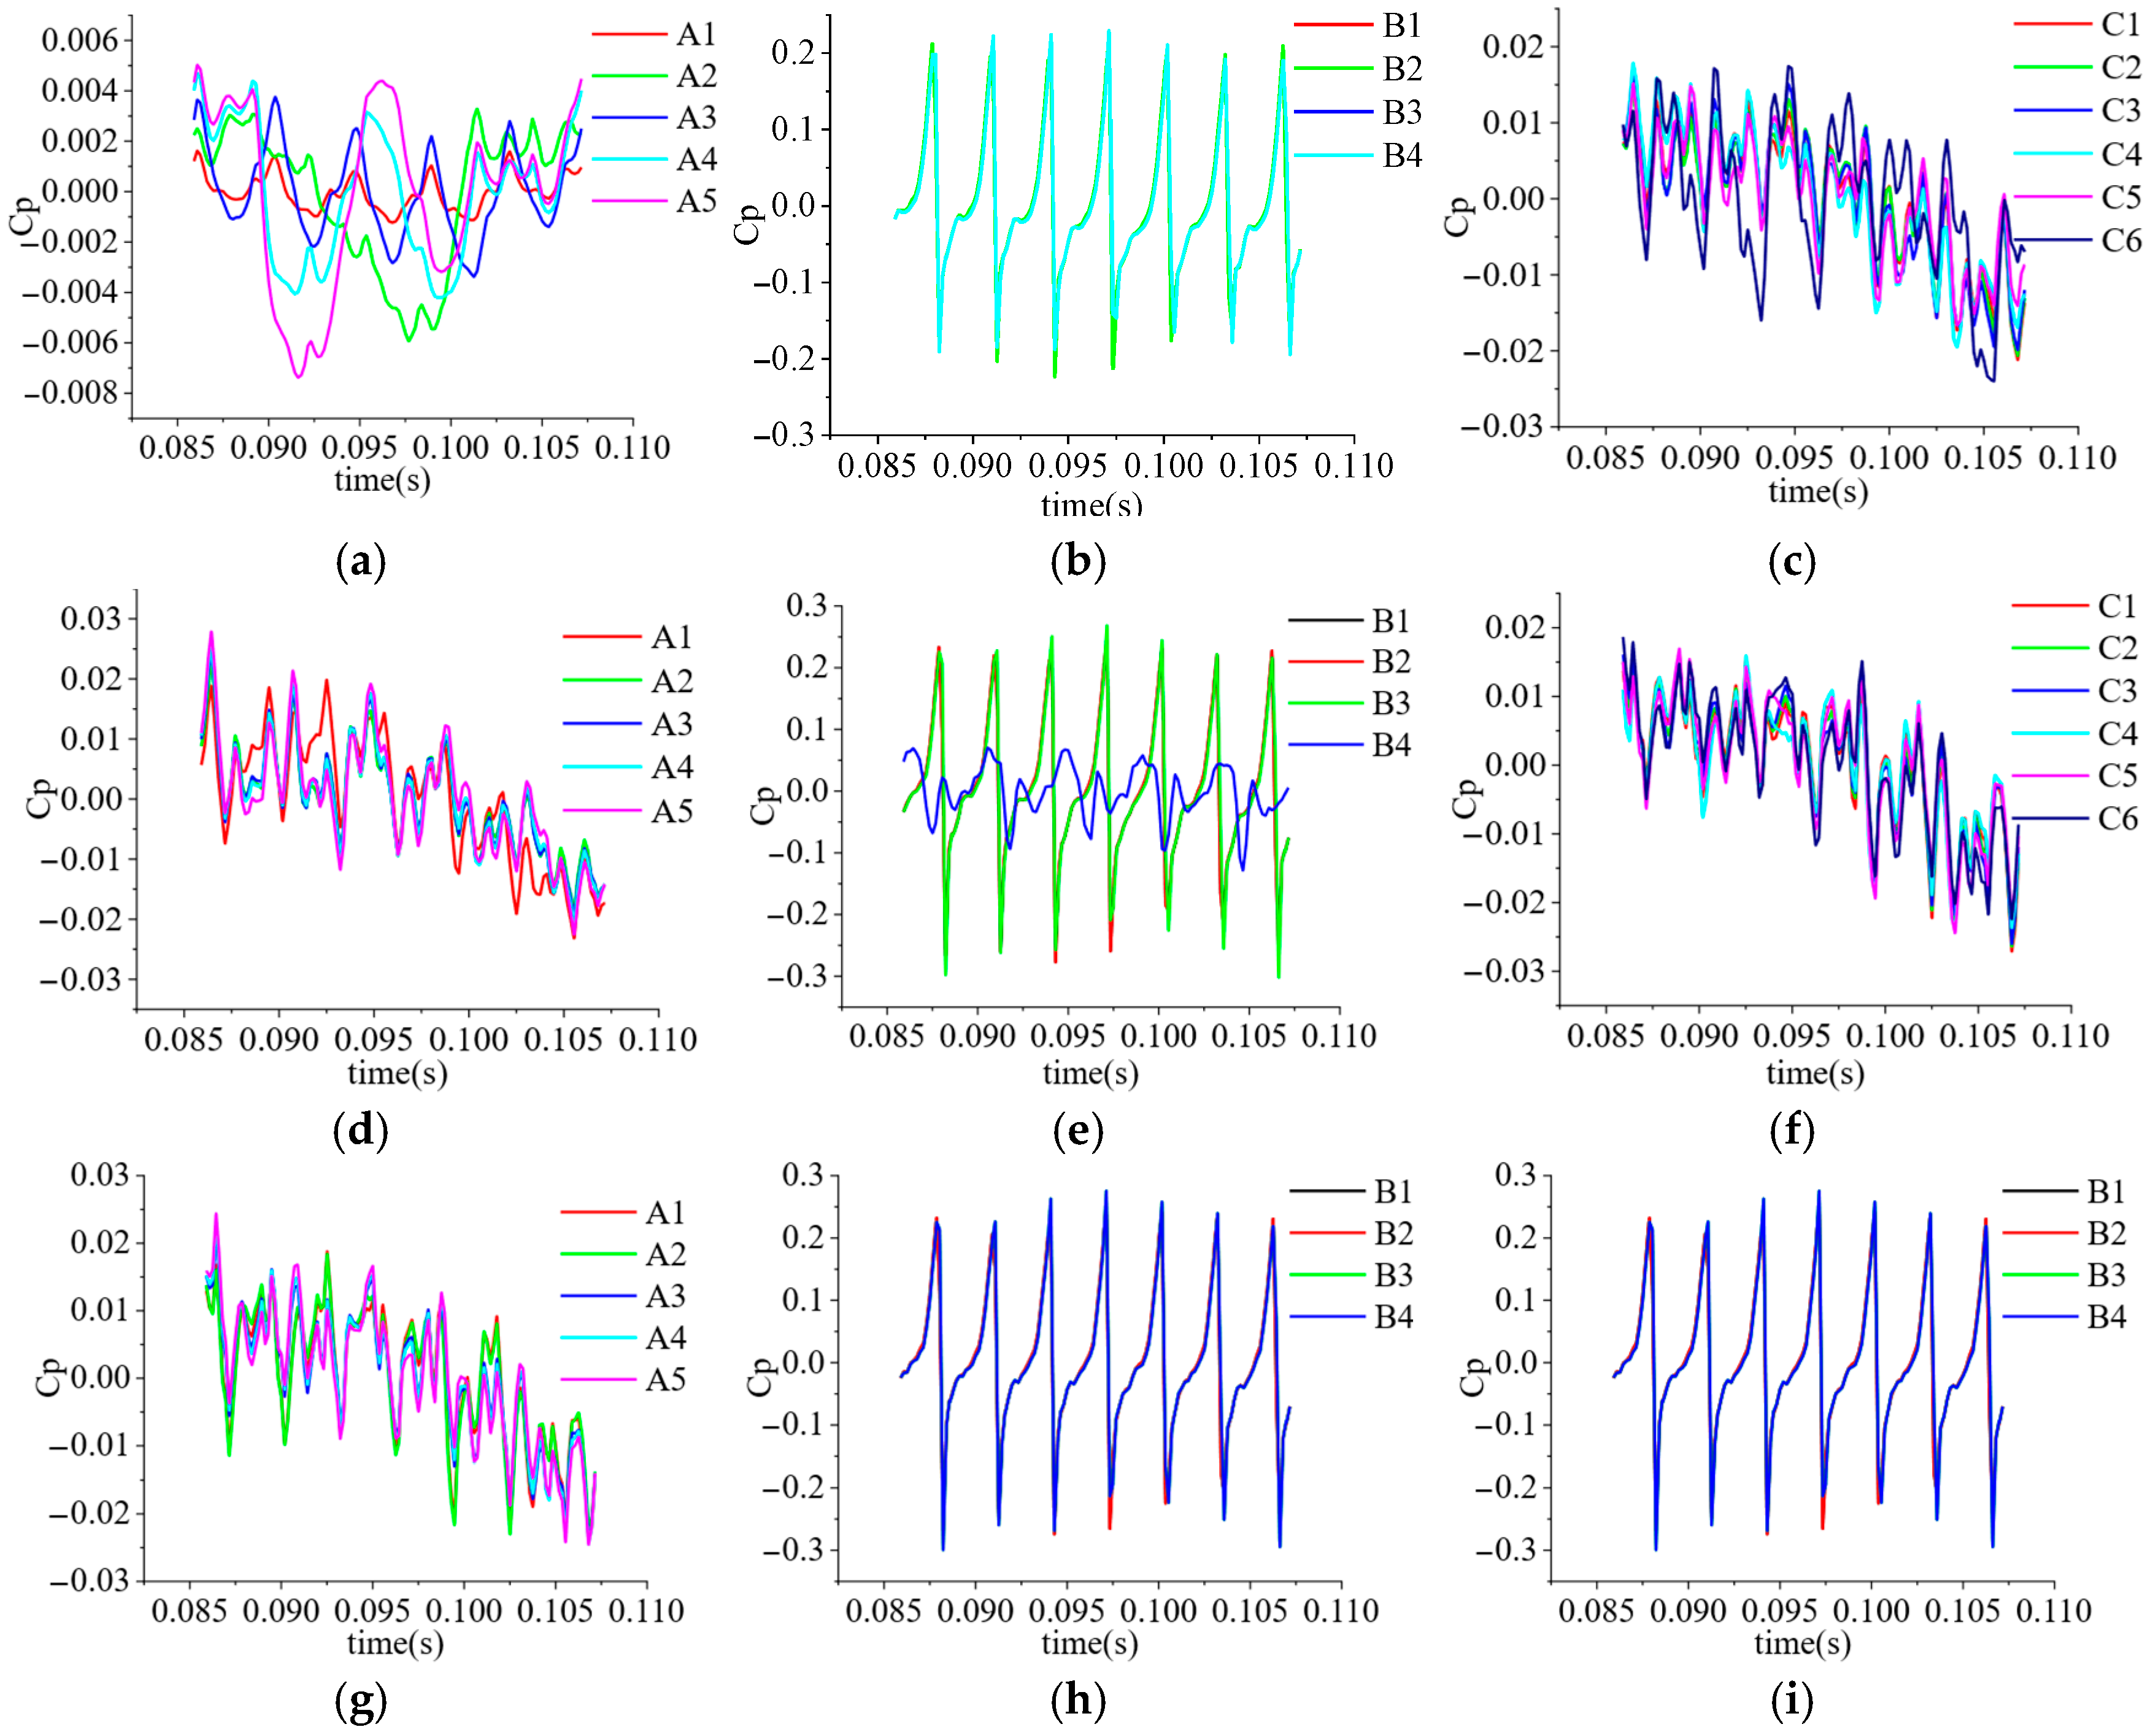
Figure 21 shows the time-domain distribution of pressure pulsation in the pump flow channel during one rotation cycle when the inlet gas volume fraction of the three-stage centrifugal pump is 3%. The amplitude of pressure pulsation inside the pump further decreases, with the pressure pulsation at point A3 exhibiting periodic variations. The pressure pulsations at points A2, A3, and A4 near the secondary impeller inlet gradually coincide. The pressure pulsation pattern in the impeller outlet region shows little change, while the pressure pulsation at point C6 in the guide vane outlet region displays six peaks and troughs. The pressure pulsations at points C1, C2, C3, and C4 gradually synchronize.
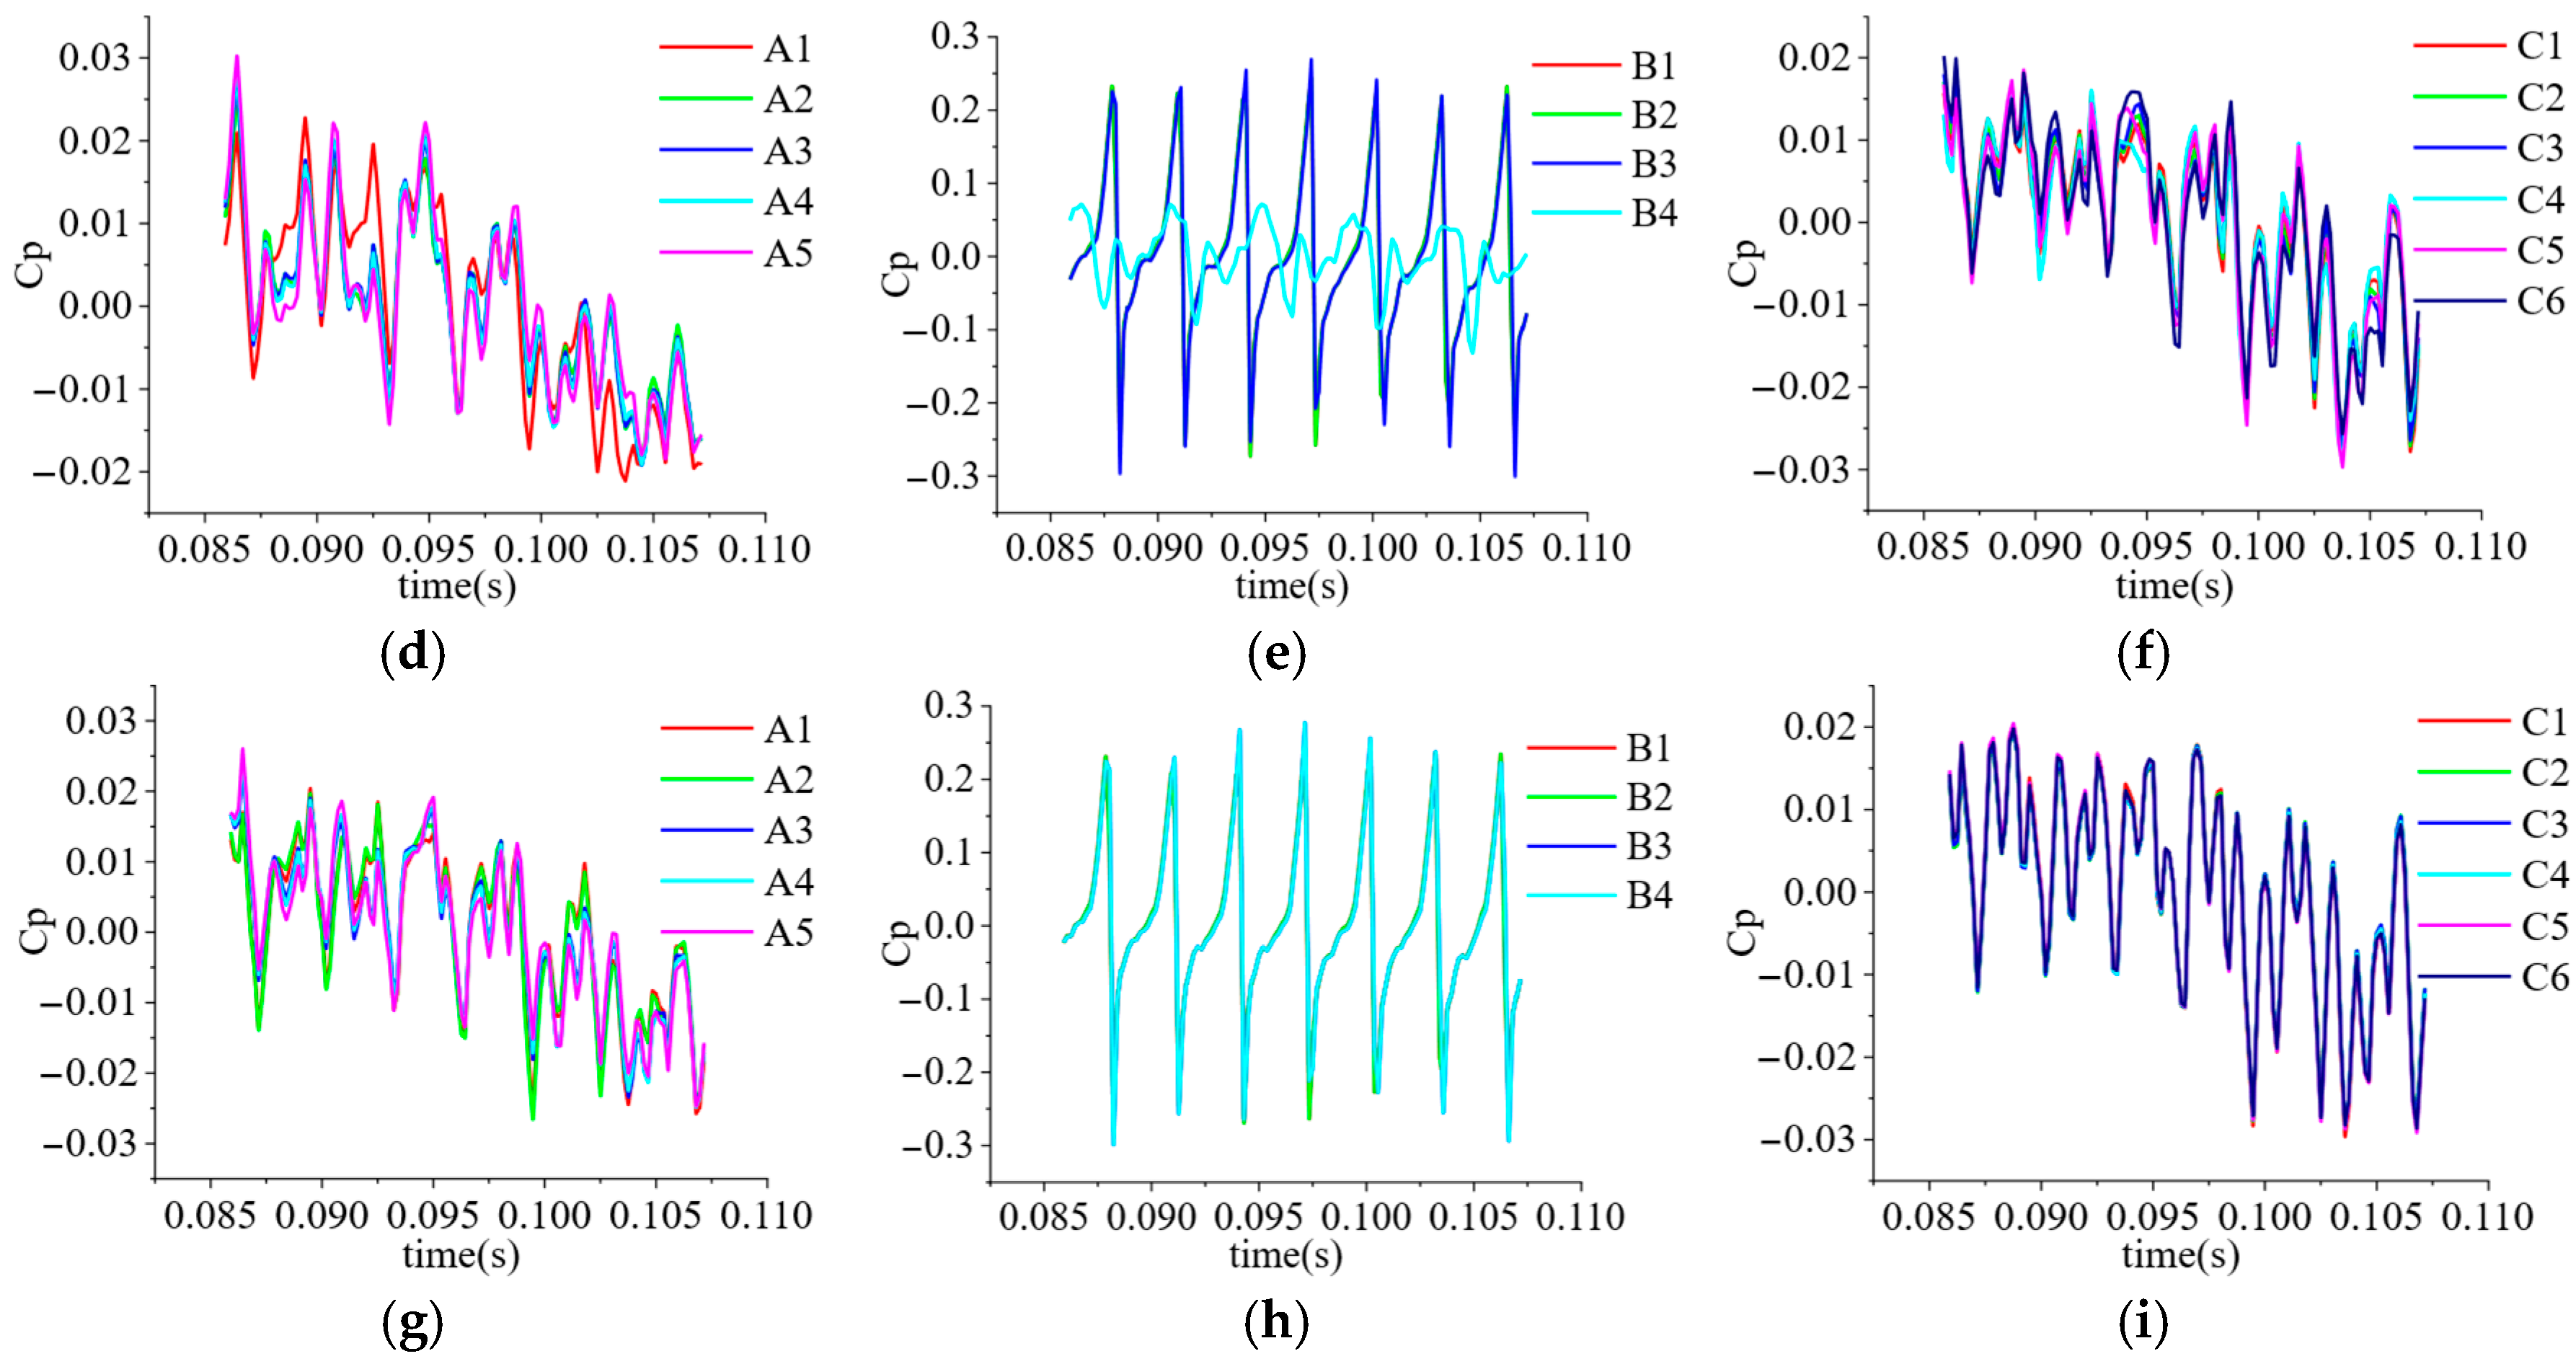
Figure 22 shows the time-domain distribution of pressure pulsation in the pump flow channel during one rotation cycle when the inlet gas volume fraction at the inlet of the three-stage centrifugal pump is 5%. Under high gas volume fraction conditions, further increases in the inlet gas volume fraction have minimal impact on pressure pulsation variations at the impeller inlet. The pressure pulsation at the impeller inlet gradually converges as the number of stages increases, while the pressure pulsation at the impeller outlet maintains stable periodic fluctuations. The peaks and troughs of pressure pulsation at the monitoring point of the guide vane outlet decrease, and the pressure pulsation at each monitoring point gradually becomes more regular

3.6.3. Frequency Domain Characteristics Analysis of Pressure Pulsation

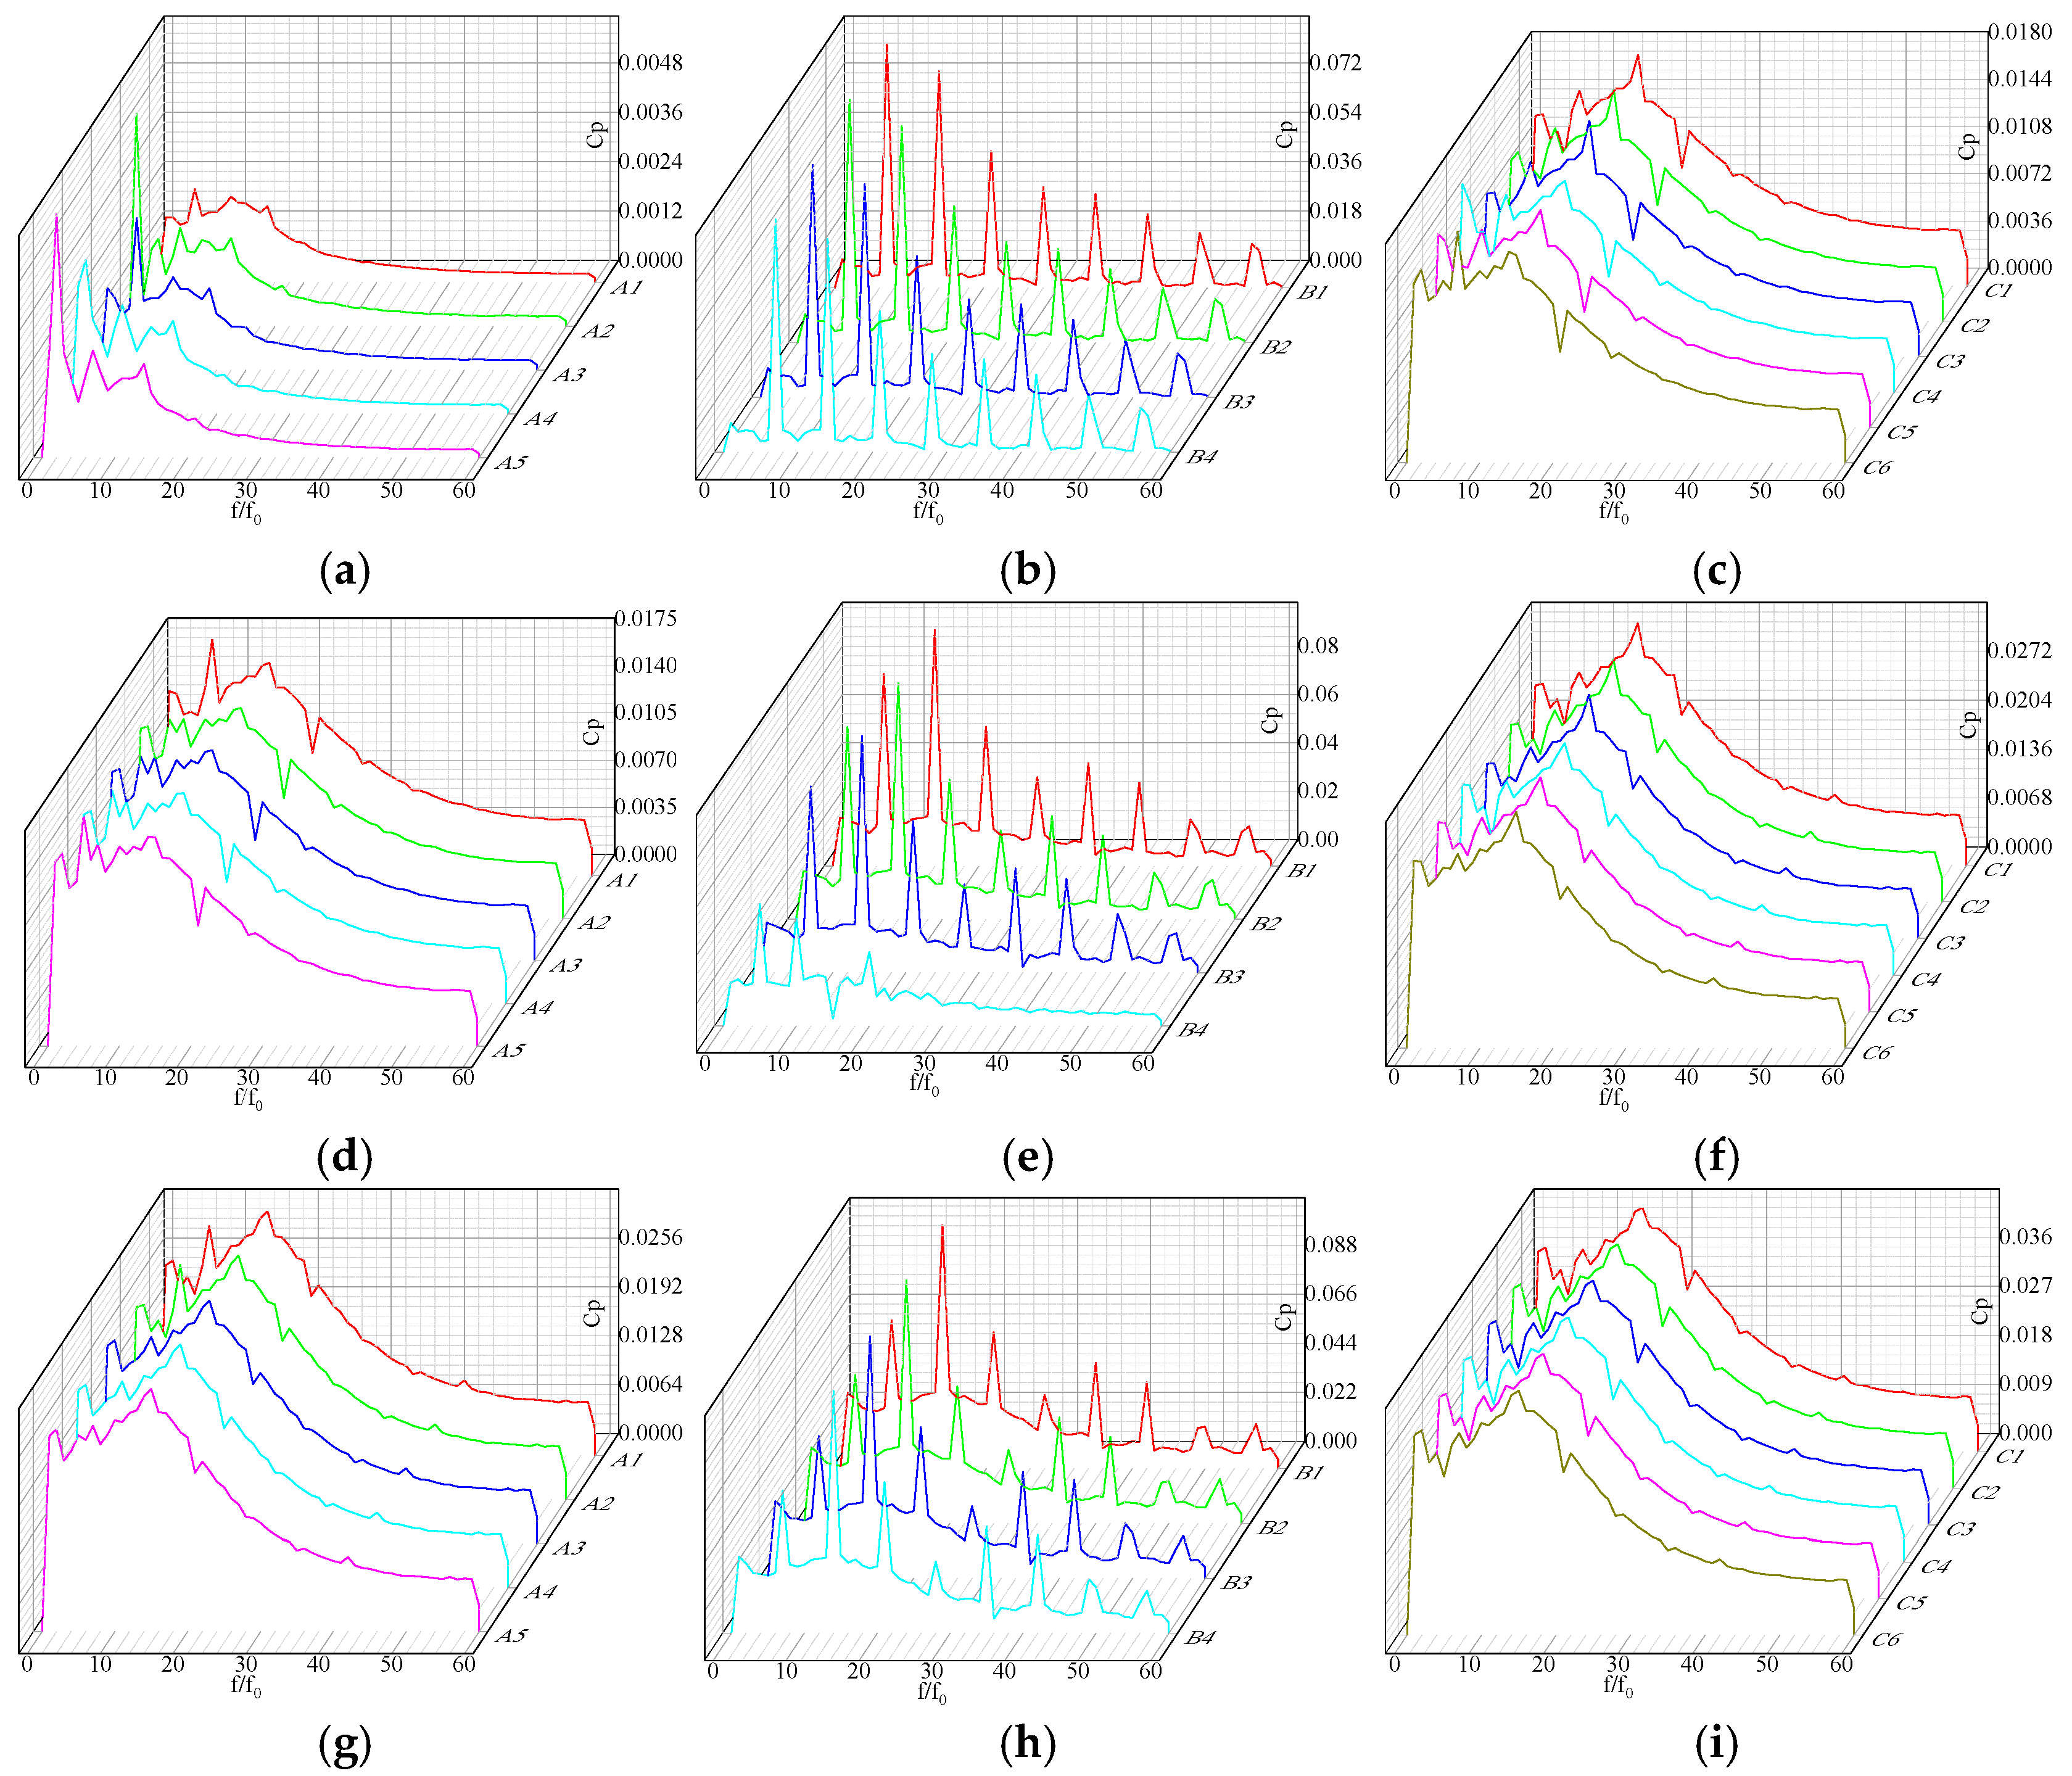
Figure 23 shows the frequency domain distribution of pressure pulsation in the three-stage centrifugal pump at IGVF = 1%. Overall, the large amplitude pressure pulsations in the pump flow channels are concentrated in the low-frequency signal region, with amplitudes decreasing as frequency increases. The frequency domain fluctuations of pressure pulsation at the inlet of the first-stage impeller are relatively regular. The dominant frequencies at points A1 and A3 are 5f0, which corresponds to the blade passing frequency, while the dominant frequency at point A2 is f0, and at points A4 and A5 it is 2f0. At the inlet of the secondary impeller, the dominant frequency at A1 is 7f0, at A2 and A3 it is 15f0, and at A4 and A5 it matches the blade passing frequency. At the inlet of the final-stage impeller, all points exhibit a dominant frequency of 15f0, with amplitude variation patterns consistent with those observed at the secondary impeller inlet. The amplitude at the dominant frequency of the impeller inlet decreases as the stage number increases. The outlet region of the first-stage impeller shows relatively small overall amplitudes, with dominant frequencies mainly concentrated at 7f0, after which the amplitudes gradually decrease with increasing frequency. At the outlet of the secondary impeller, the dominant frequencies at points B1, B2, and B3 are 14f0, while at point B4 it matches the blade passing frequency. At the outlet of the final-stage impeller, all points exhibit a dominant frequency of 14f0, with amplitudes initially increasing and then decreasing as frequency rises. The frequency domain fluctuations at the guide vane outlet are relatively regular, with consistent amplitude variation patterns across all stages. High-amplitude regions are concentrated at 15f0, except for point C6 at the outlet of the first-stage guide vane, where the dominant frequency is 7f0.
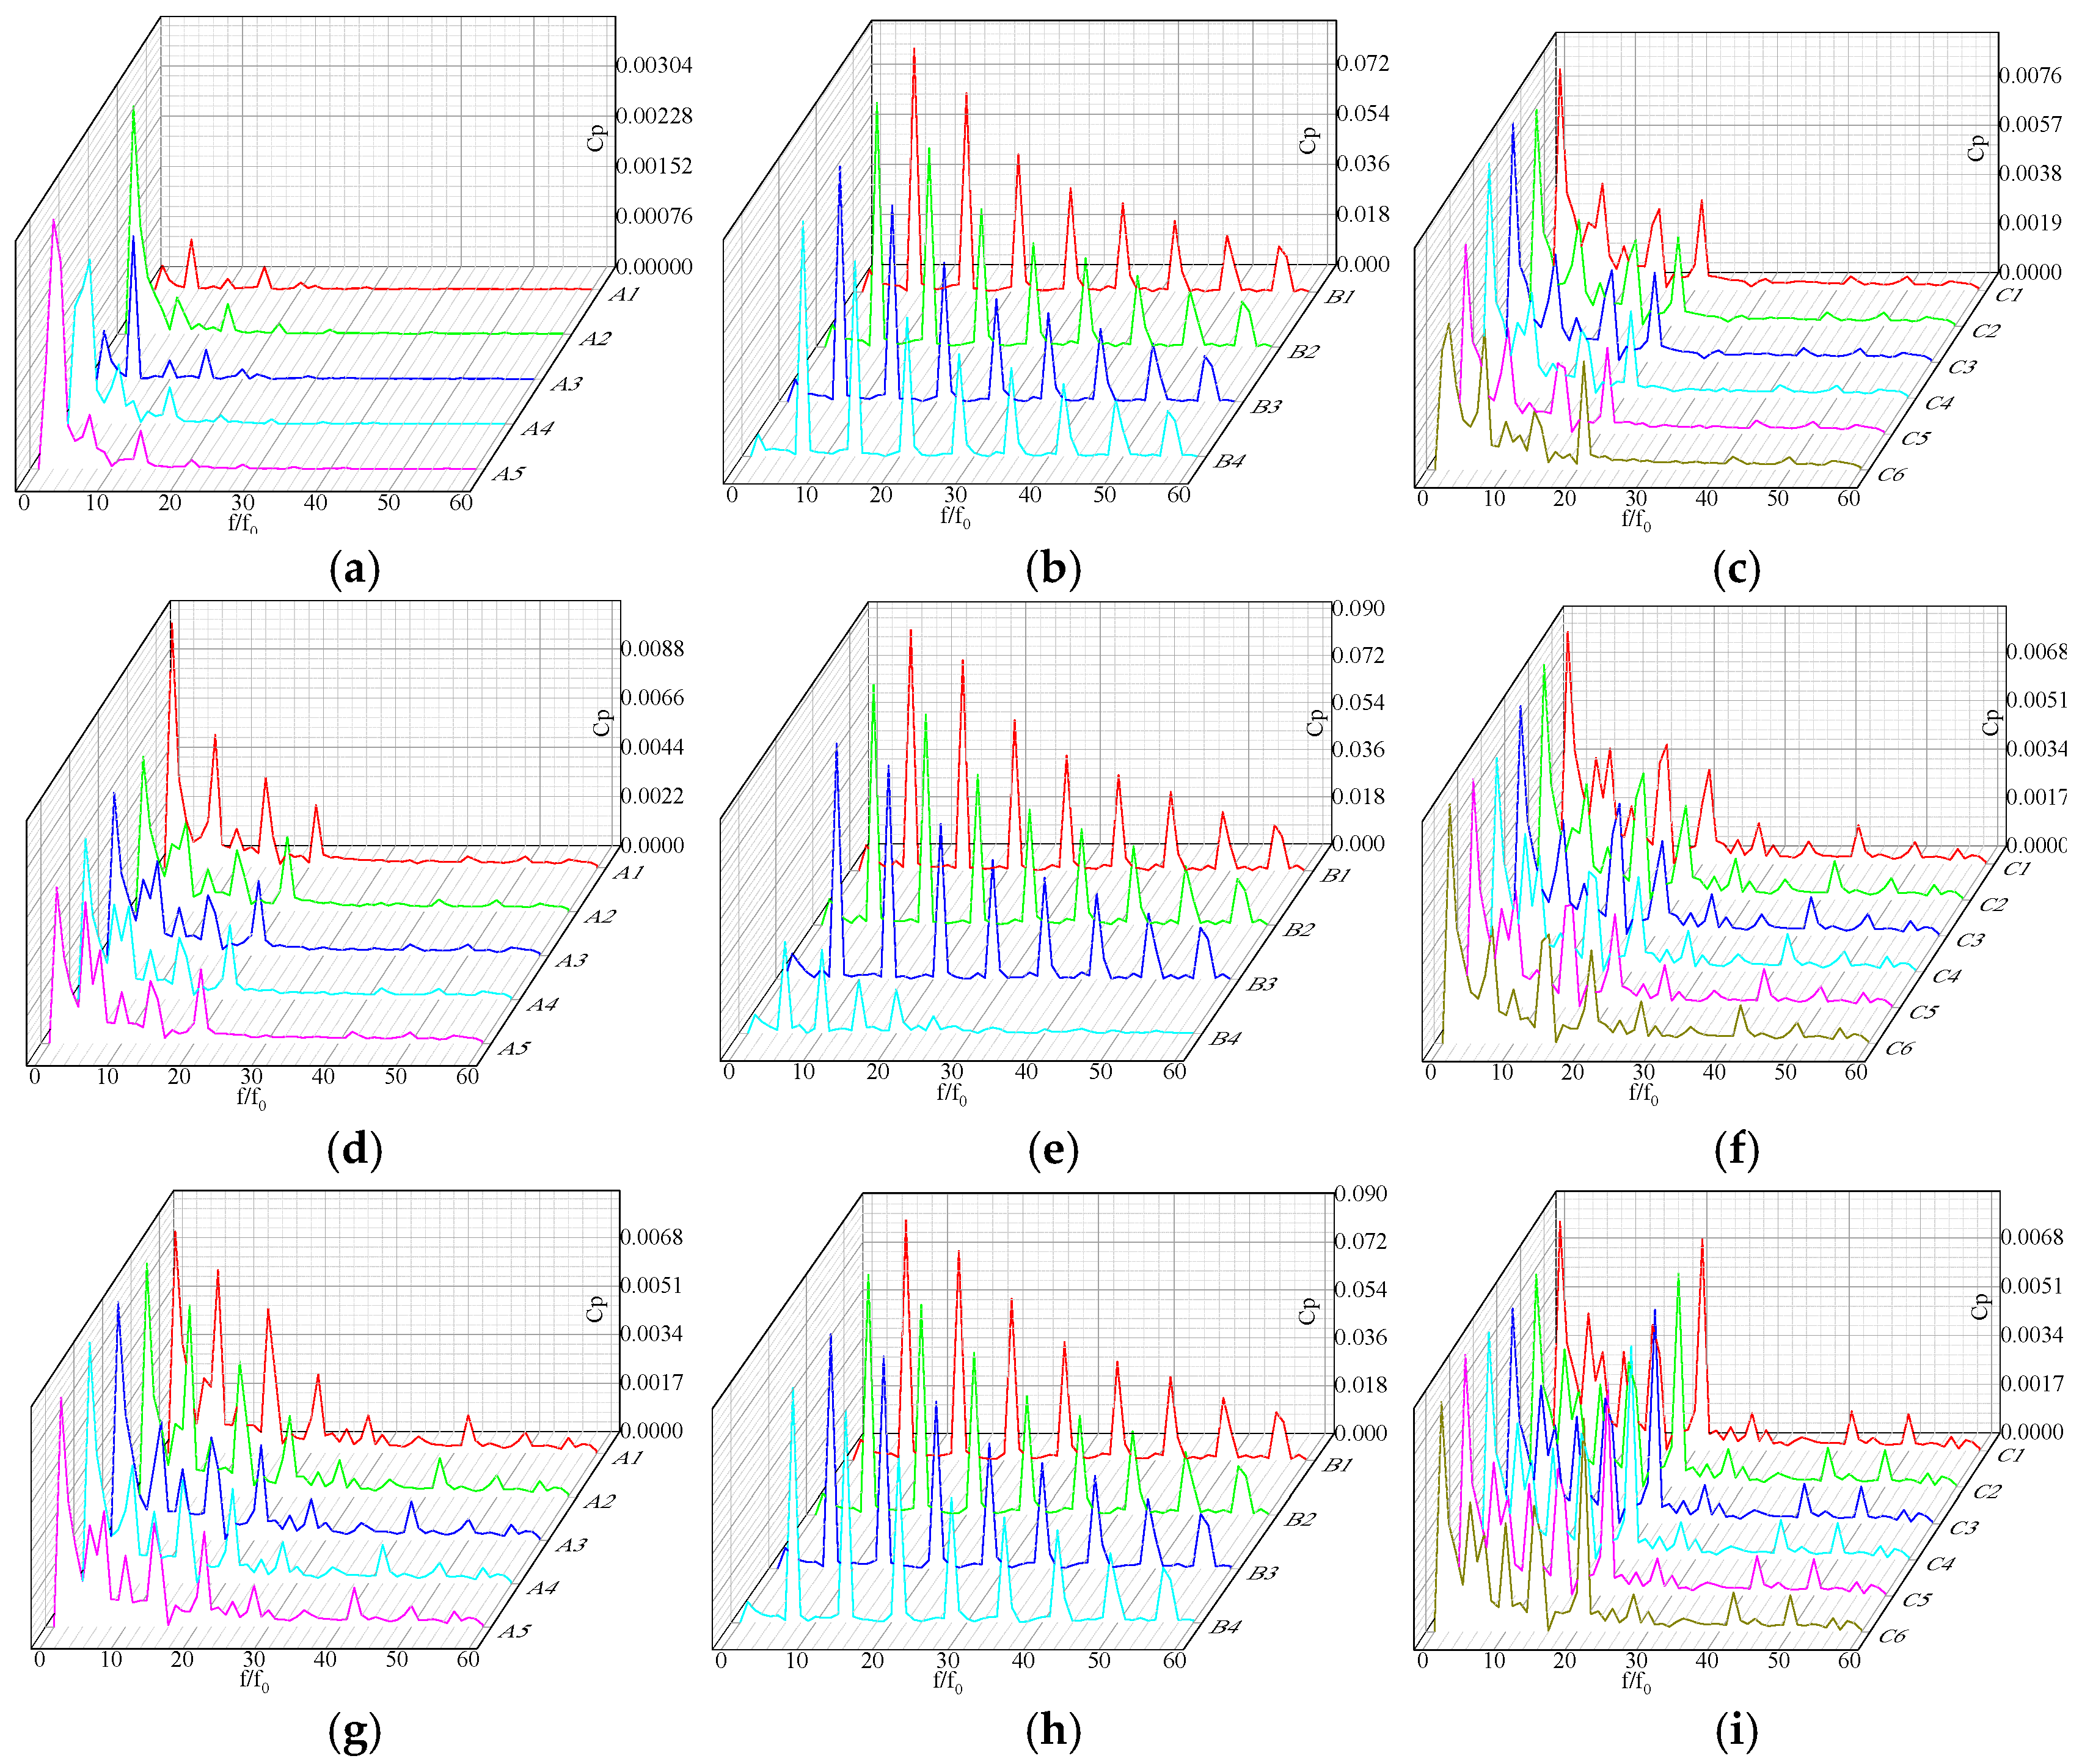
Figure 24 illustrates the frequency domain distribution of pressure pulsations inside the three-stage centrifugal pump under the condition of IGVF = 2%. The figure reveals that the dominant frequency of pressure pulsations at positions A1 and A3 of the first-stage impeller inlet corresponds to the impeller’s rotational frequency, i.e., the blade passing frequency. In contrast, the dominant frequency at position A2 aligns with the pump shaft’s rotational frequency, known as the shaft frequency. For positions A4 and A5, their dominant pressure pulsation frequencies correspond to 3 times and 2 times the blade passing frequency, denoted as 3f0 and 2f0, respectively. At the inlets of the second-stage and third-stage impellers, the dominant frequency of pressure pulsations similarly manifests as the shaft frequency, while the secondary dominant frequency appears at 7 times the blade passing frequency. Notably, the distribution patterns of pressure pulsations on the pressure surfaces at various inlet points exhibit consistency. When IGVF = 2%, the frequency domain distribution of pressure pulsations at the impeller outlets follows the same pattern as observed under IGVF = 1%, with the dominant frequency across all impeller stages being 7f0. However, in the first-stage impeller, the amplitudes of various frequencies are relatively lower. At point B4 of the second-stage impeller, the amplitude of pressure pulsations in the frequency domain transitions from a trough to a peak at 15f0. The third-stage impeller shares the same pressure pulsation frequency domain characteristics as the first-stage impeller, with 7f0 as the dominant frequency. At the guide vane outlets, the dominant frequency of pressure pulsations is the shaft frequency. The secondary dominant frequency at the outlets of the first-stage and second-stage guide vanes is 7f0, while for the third-stage guide vane, it is 21f0. As the number of guide vane stages increases, pressure pulsations exhibit more peaks with increasing frequency, indicating that the complexity of pressure pulsations escalates with the progression of guide vane stages.
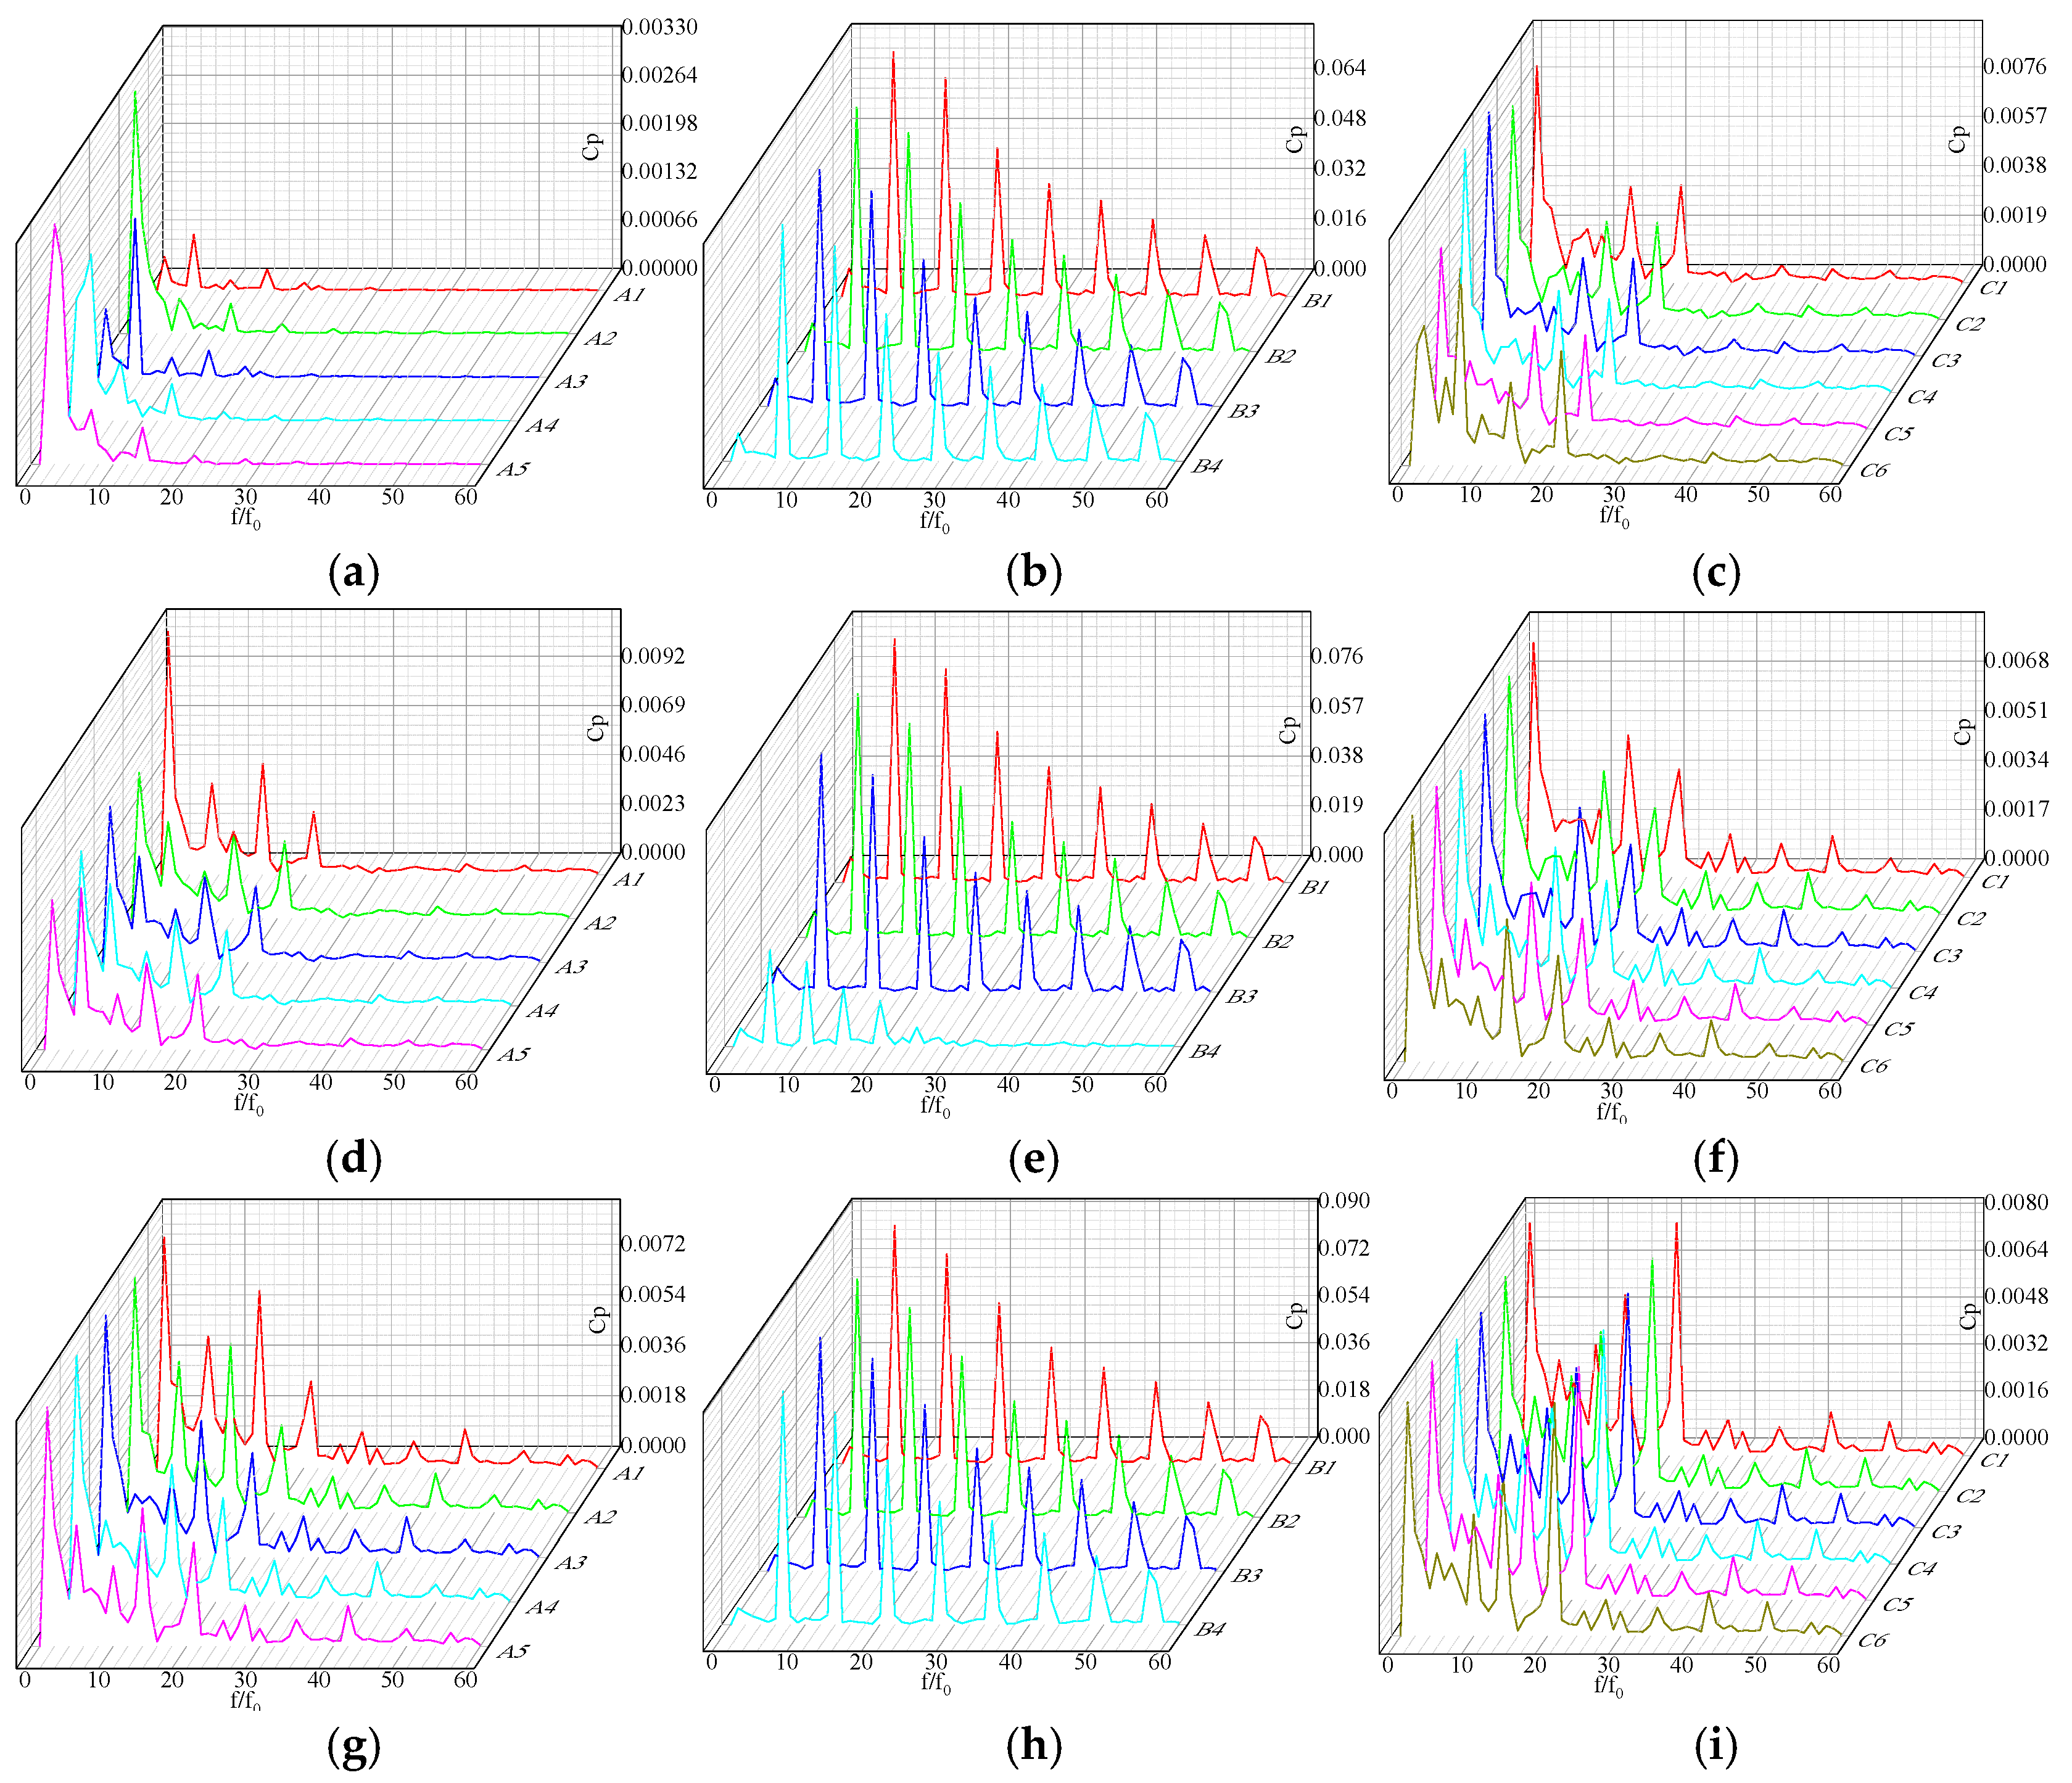
Figure 25 shows the frequency domain distribution of the internal pressure pulsation of the three-stage centrifugal pump under the condition of IGVF = 3%. It can be observed from the figure that the main frequency of each monitoring point at the inlet of the first-stage impeller remains consistent with that when IGVF = 2%. For the secondary impellers A1, A2, A3, and A4, their main frequencies are all 46.67 Hz, while the main frequency of A5 is the same as the blade frequency. This phenomenon might be caused by the increase in gas content. With the increase in the gas content rate, the leakage vortex scale at the front cover plate position of the inlet of the secondary impeller expands to some extent, and the bubbles begin to converge to a certain degree, which in turn causes the deviation of the main frequency. At the inlet of the final-stage impeller, the main frequency is shown as the axial frequency, while the secondary main frequency is different from the situation when IGVF = 2%, and the secondary main frequency is 14f0. This change might be due to the increase in the gas content at the inlet, which leads to an increase in the gas flow at the impeller inlet, resulting in an increase in the gas phase components in the flow passage and thus making the flow state unstable. As for the impeller outlet, the main frequency of pressure pulsation at each point is 7f0, and the secondary main frequency is 14f0. At the outlet of the first-stage guide vanes, the main frequency at point C6 is 7f0, while the main frequencies at other points are axial frequencies. For all the measurement points of the secondary guide vanes, the main frequency of their pressure pulsation is the axial frequency. However, at points C1 and C2 of the final-stage guide vanes, the main frequency becomes 21f0. The reason for this change might be that the bubble volume at the outlet of the guide vanes is too large, which has a blocking effect on the fluid in the flow channel, while the main frequency at other points remains the axial frequency.
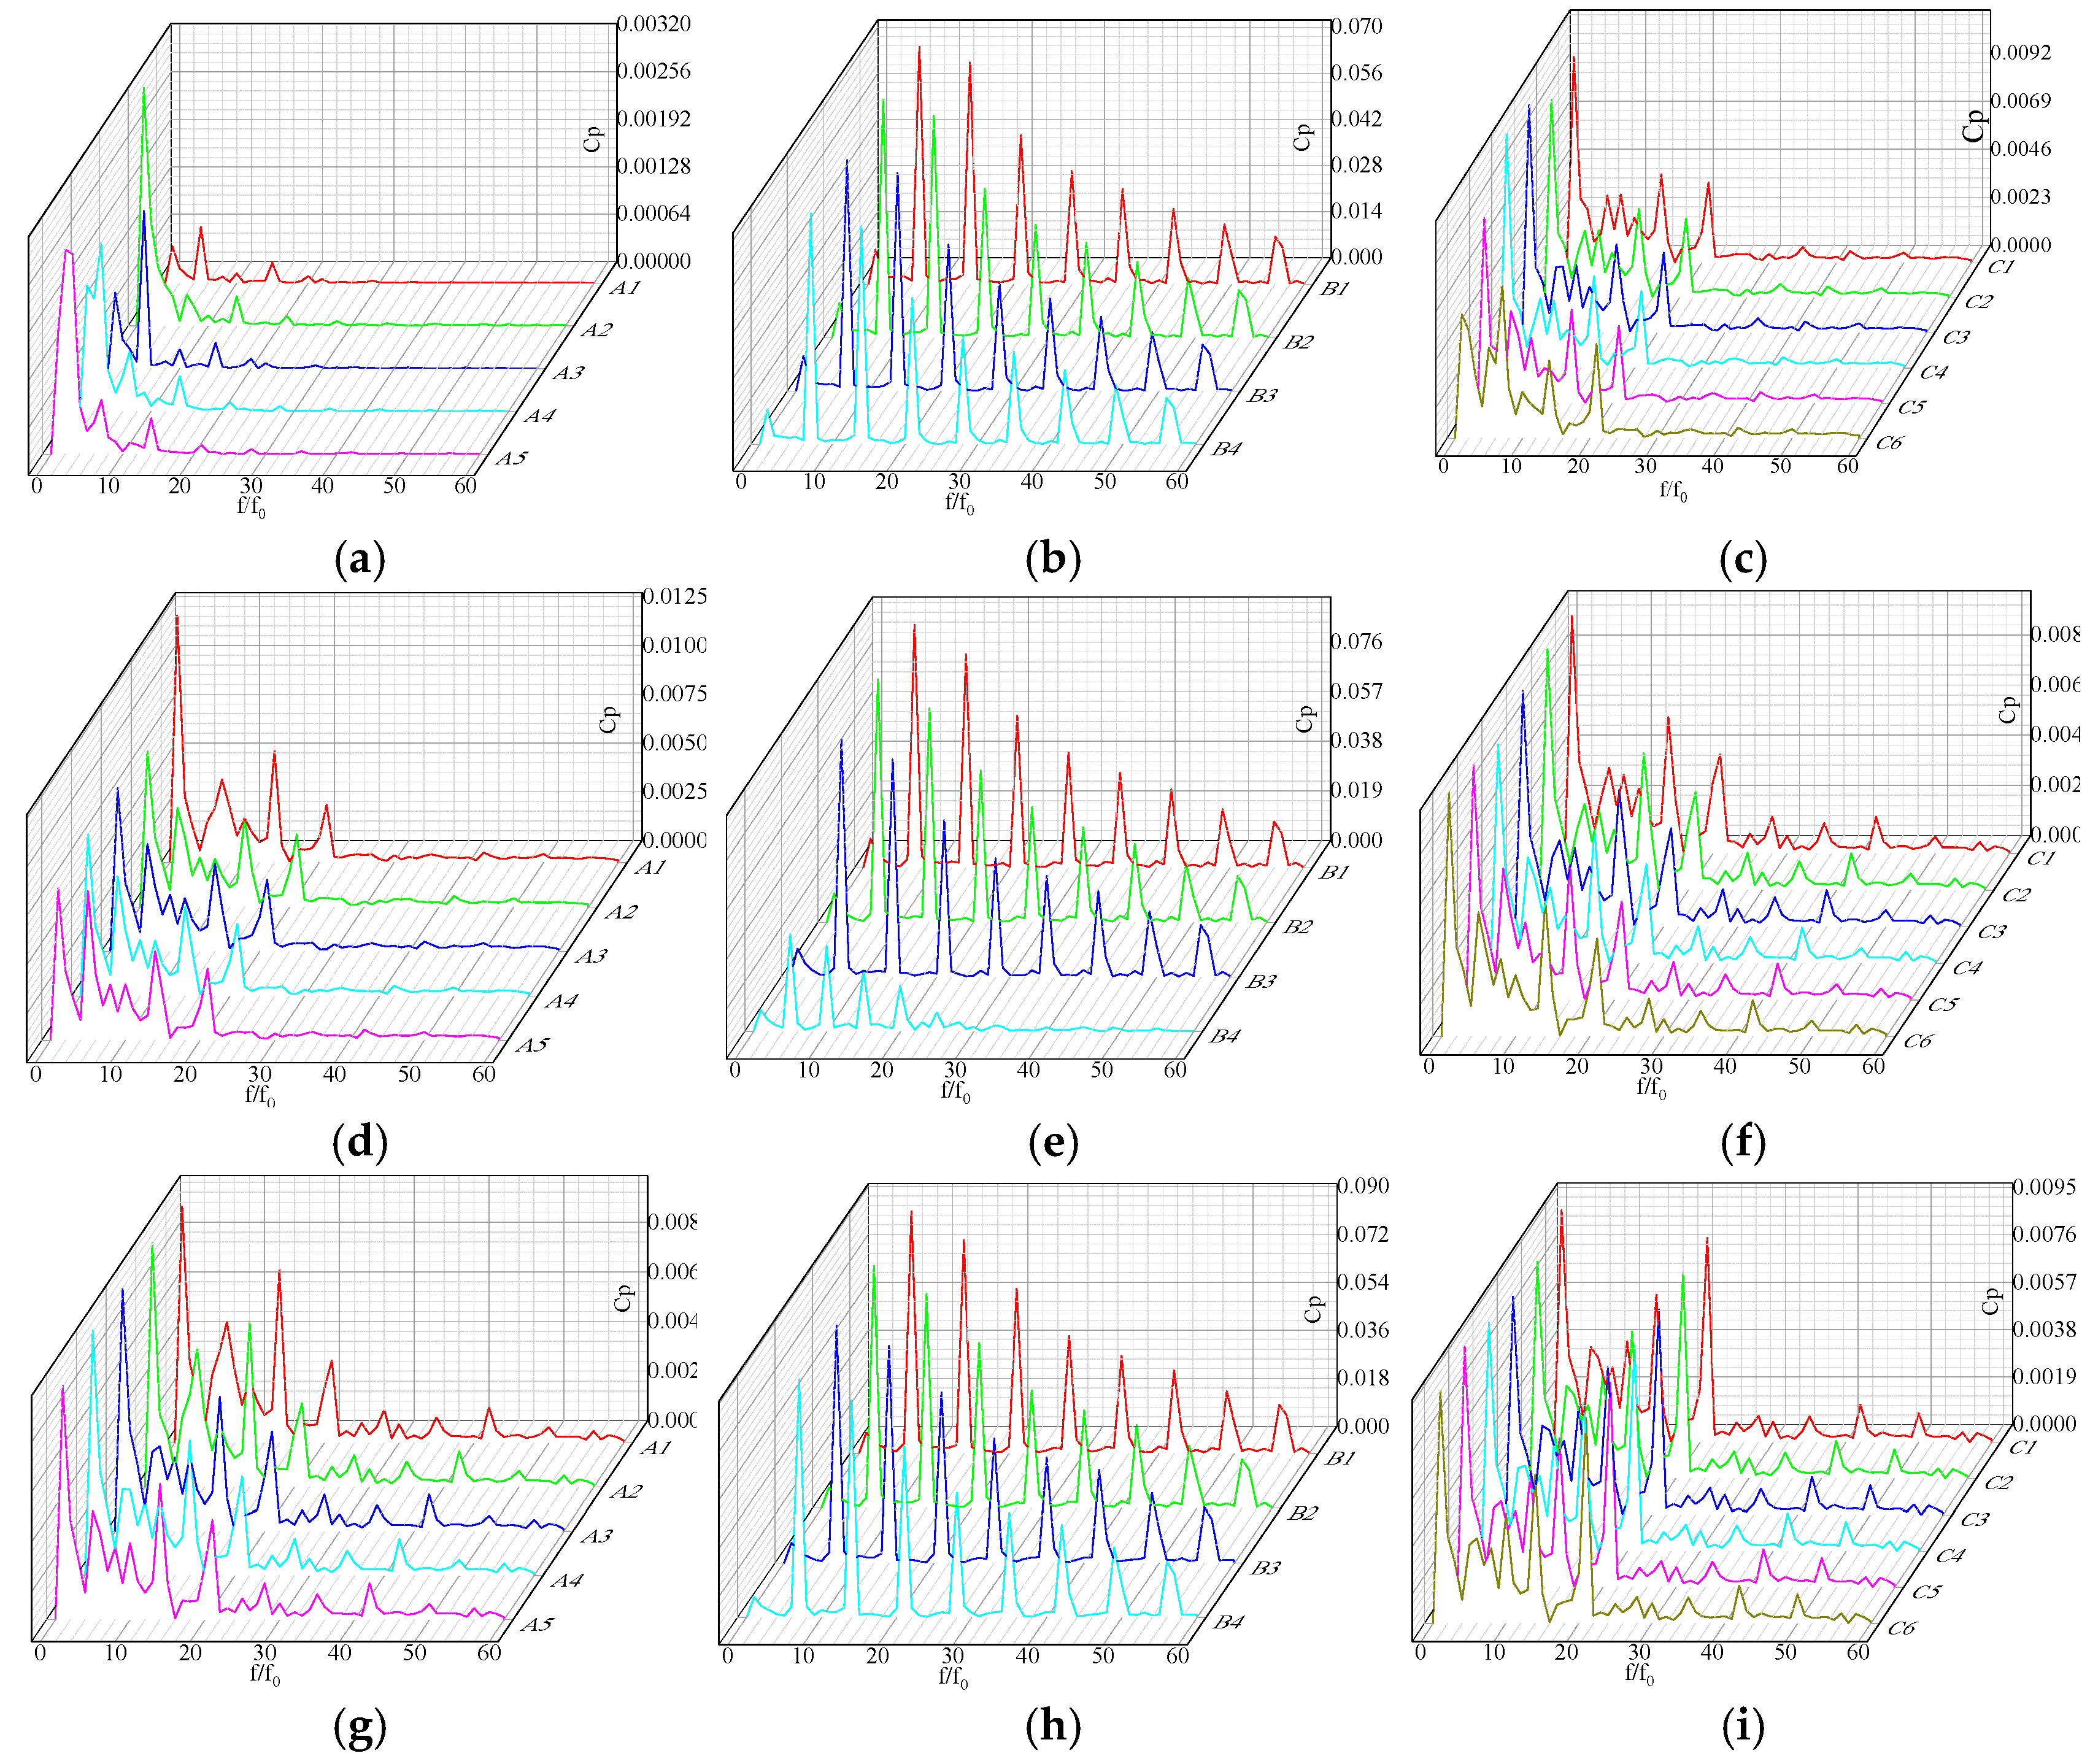
Figure 26 shows the frequency domain distribution of pressure pulsation inside the three-stage centrifugal pump when IGVF = 5%. The frequency domain distribution law of pressure pulsation at the inlet of the first-stage impeller is consistent with that when IGVF = 3%. The main frequencies at the intakes of the secondary impeller and the last-stage impeller are axial frequencies. The second wave peak at point A1 of the secondary impeller is between 4f0 and 9f0. The second peak of the secondary impeller A1 with IGVF = 3% is between 6f0 and 9f0, and the amplitude is significantly reduced. This might be due to the fact that the flow velocity at the inlet hub of the secondary impeller is affected by the bubbles. Meanwhile, under the effect of dynamic and static interference, the flow velocity of the fluid has decreased, and the period of work completed by the impeller on the fluid has become longer. The main frequency at each point at the inlet of the final-stage impeller is 46.67 Hz, and the secondary main frequency is 14f0. However, the secondary main frequency varies at each point. The secondary main frequency of A1 and A2 is 21f0, while that of A3, A4, and A5 is 7f0. The main frequency at each point at the outlet of the first-stage impeller is 7f0. At the outlets of the secondary impeller and the last-stage impeller, the main frequency at point B1, B2, and B3 is 7f0, and at point B4, it is 5f0. This indicates that at point B4 of the outlet of the secondary impeller and the last-stage impeller, the acceleration effect of the impeller on the fluid at this location is less affected by the guide vane blades. The main frequency at each point at the outlet of the guide vanes is f0, the secondary main frequency of the first-stage guide vanes and the secondary guide vanes is 14f0, and the secondary main frequency of the last-stage guide vanes is 21f0. The possible reason for this is that the increase in gas content leads to the enhanced compressibility of the fluid at the outlet of the guide vanes, the intensification of flow instability, and the change in the frequency of vortex shedding.

4. Conclusions

(1) Under gas-containing conditions, bubbles with a diameter of 0.2 mm entering the three-stage centrifugal pump have a limited impact on the pressure distribution of the entire pump. As the gas content increases, the bubbles are uniformly dispersed in the pump and flow with the fluid, resulting in relatively low energy loss. However, the area of the high-pressure zone on the impeller surface gradually decreases with the increase in the inlet gas content rate, indicating that the impeller’s ability to complete work on the fluid weakens. The entry of the gas phase into the impeller flow channel will cause energy loss. An increase in gas content will lead to a continuous decline in pump performance, disorder of liquid flow lines, and intensification of backflow phenomena, especially in the running surface and back edge area of the impeller. After the impeller completes work, the bubbles break violently. Small bubbles gather at the edge of the impeller. The rectification effect of the guide vanes further intensifies the bubble breaking and adheres to the surface of the guide vanes, resulting in a decrease in the pump efficiency. Bubbles interfere with fluid flow and increase turbulence, weakening the conveying capacity of the pump.
(2) When the gas content increases, bubbles first converge on the suction surface of the impeller, and then gradually appear on the pressure surface. As the number of stages increases, the bubbles gather and expand in scale. When the gas content reaches 5%, bubbles may block the flow channel, slow down the flow velocity, and form flow channel vortices. The degree of flow disorder in the impeller flow channel intensifies, and the impeller outlet area is most significantly affected. Through the analysis of the Q criterion, the vortex structure of the impeller and the guide vanes is mainly composed of blade separation vortices and clearance leakage vortices. The vortices inside the impeller are concentrated in the blade outlet and rim area, while the guide vane vortices are located in the anti-guide vane flow channel area. The increase in gas content rate expands the vortex area and complicates the structure inside the pump. The accumulation of the gas phase is prone to cause back flow and unstable flow, further deteriorating the local flow conditions.
(3) The pressure pulsation in the impeller inlet area is irregular, and the dynamic and static interference is severe, accompanied by leakage. During startup, there may be huge pressure difference fluctuations. The pressure pulsation at the impeller outlet changes periodically, and the period is consistent with the number of guide vanes, while the regularity of the pressure pulsation at the guide vanes outlet is poor. However, with the increase in the gas content rate, the difference between the peak and trough of the wave within the cycle increases significantly. The increase in the gas content rate at the inlet of the three-stage pump reduces the amplitude of pressure pulsation in the flow channel.

Author Contributions

Conceptualization, W.C.; methodology, W.C. and X.Z.; software, X.Z.; formal analysis, X.Z.; writing—original draft preparation, X.Z.; writing—review and editing, W.C. and X.Z.; supervision, W.C.; investigation (performing the experiments), W.C. and X.Z. All authors have read and agreed to the published version of the manuscript.

Funding

This research received no external funding.

Institutional Review Board Statement

Not applicable.

Informed Consent Statement

Not applicable.

Data Availability Statement

The original contributions presented in this study are included in the article. Further inquiries can be directed to the corresponding author.

Acknowledgments

This work is supported by Jiangsu Provincial Key Research and Development Program Modern Agriculture Project (Grant No. BE2020330).

Conflicts of Interest

The authors declare no conflicts of interest.

References

  1. Heng, Y.; Chen, Z.; Jiang, Q.; Bois, G.; Zhang, W.; He, K. Performance and internal flow pattern analyses of a specific centrifugal disc pump under air-water two-phase flow conditions. Energy 2024, 309, 132981. [Google Scholar] [CrossRef]
  2. He, A.; Shao, C. Study on the induced noise of gas-liquid two- phase flow in a centrifugal pump. Appl. Acoust. 2021, 176, 107892. [Google Scholar] [CrossRef]
  3. Song, X.; Luo, Y.; Wang, Z. Numerical prediction of the influence of free surface vortex air-entrainment on pump unit performance. Ocean Eng. 2022, 256, 111503. [Google Scholar] [CrossRef]
  4. He, D.; Zhao, L.; Chang, Z.; Zhang, Z.; Guo, P.; Bai, B. On the performance of a centrifugal pump under bubble inflow: Effect of gas-liquid distribution in the impeller. J. Pet. Sci. Eng. 2021, 203, 108587. [Google Scholar] [CrossRef]
  5. Yan, S.; Luo, X.; Feng, J.; Zhu, G.; Zhang, L.; Chen, S. Numerical simulation of a gas-liquid centrifugal pump under different inlet gas volume fraction conditions. Int. J. Fluid Mach. Syst. 2019, 12, 56–63. [Google Scholar] [CrossRef]
  6. Yuan, S.; He, W.; Si, Q.; Yuan, J.; Zhang, H.; Cui, Q. Numerical Simulation of Internal Flow in Gas-Liquid Two-Phase Flow Centrifugal Pumps Based on MUSIG Model. J. Drain. Irrig. Mach. Eng. 2021, 39, 325–327. [Google Scholar] [CrossRef]
  7. Yuan, J.; Zhang, K.; Si, Q.; Zhou, B.; Tang, Y.; Jin, Z. Numerical study on Gas-liquid Two-phase Flow in Centrifugal Pumps Based on heterogeneous Flow Model. Trans. Chin. Soc. Agric. Mach. 2017, 48, 89–95. [Google Scholar] [CrossRef]
  8. Si, Q.; Bois, G.; Liao, M.; Zhang, H.; Cui, Q.; Yuan, S. A comparative study on centrifugal pump designs and two-phase flow characteristic under inlet gas entrainment conditions. Energies 2019, 13, 65. [Google Scholar] [CrossRef]
  9. Wu, X.; Yang, Y.; Shi, W.; Wu, S.; Jin, Y. Numerical simulation study on flow characteristics of multistage centrifugal pumps under different inlet gas void fractions. Sustainability 2023, 15, 15485. [Google Scholar] [CrossRef]
  10. Li, C.; Luo, X.; Feng, J.; Sun, S.; Zhu, G.; Xue, Y. Research on the Influence of Inlet Gas Content Rate on the Performance of Deep-sea Multiphase Mixed Transport Pumps. Res. Prog. Hydrodyn. 2020, 35, 248–257. [Google Scholar]
  11. Cui, Q.; Si, Q.; Bois, G.; Yuan, S.; Yuan, J. Investigation on gas-liquid two-phase flow centrifugal pump performances for different rotational speeds. IOP Conf. Ser. 2019, 240, 16–32. [Google Scholar] [CrossRef]
  12. Si, Q.; He, W.; Bois, G.; Cui, Q.; Yuan, S.; Zhang, K. Experimental and numerical studies on flow characteristics of centrifugal pump under air- water inflow. Int. J. Fluid Mach. Syst. 2019, 12, 31–38. [Google Scholar] [CrossRef]
  13. Luo, X.; Yan, S.; Feng, J.; Zhu, G.; Sun, S.; Chen, S. Analysis of Force Characteristics of Gas-Liquid Two-Phase Centrifugal Pump. Trans. Chin. Soc. Agric. Eng. 2019, 35, 66–80. [Google Scholar]
  14. Guo, Q.; Fei, Z.; Huang, X. Review on Two-Phase Flow in Centrifugal Pumps. J. Drain. Irrig. Mach. Eng. 2025, 43, 238–246. [Google Scholar]
  15. Fu, Q.; Yuan, S.; Zhu, R.; Chen, J.; Wang, X. Hydraulic characteristics of transient transition process of gas-liquid mixed flow in a centrifugal pump. J. Harbin Eng. Univ. 2012, 33, 1428–1434. [Google Scholar]
  16. Si, Q.; Guo, Y.; Tian, D.; Ma, W.; Zhang, H.; Yuan, S. Analysis of Internal Flow Characteristics of Semi-open Impeller Centrifugal Pumps under Gas-Liquid Two-Phase Conditions. Trans. Chin. Soc. Agric. Eng. 2021, 37, 30–37. [Google Scholar]
  17. Tan, M.; Fan, X.; Liu, H.; Wu, X. Research on the Noise Characteristics of Gas-Liquid Two-Phase Flow in Centrifugal Pumps. J. Huazhong Univ. Sci. Technol. 2025, 53, 129–135. [Google Scholar] [CrossRef]
  18. Verde, W.M.; Biazussi, J.L.; Sassim, N.A.; Bannwart, A.C. Experimental study of gas-liquid two-phase flow patterns within centrifugal pumps impellers. Exp. Therm. Fluid Sci. 2017, 85, 37–51. [Google Scholar] [CrossRef]
  19. Shao, C.; Zhong, G.; Zhou, J. Study on gas–liquid two-phase flow in the suction chamber of a centrifugal pump and its dimensionless characteristics. Nucl. Eng. Des. 2021, 380, 111298. [Google Scholar] [CrossRef]
  20. Zhang, H.; Yuan, S.; Deng, F.; Liao, M.; Chen, M.; Si, Q. Characteristics of Internal Gas-Liquid Two-Phase Flow in Centrifugal Pumps Based on Dimensional Normalization. J. Drain. Irrig. Mach. Eng. 2021, 39, 451–456+463. [Google Scholar]
  21. Caridad, J.; Asuaje, M.; Kenyery, F.; Tremante, A.; Aguillón, O. Characterization of a centrifugal pump impeller under two-phase flow conditions. J. Pet. Sci. Eng. 2008, 63, 18–22. [Google Scholar] [CrossRef]
  22. Pineda, H.; Biazussi, J.; López, F.; Oliveira, B.; Carvalho, R.D.; Bannwart, A.C.; Ratkovich, N. Phase distribution analysis in an electrical submersible pump (ESP) inlet handling water–air two-phase flow using computational fluid dynamics (CFD). J. Pet. Sci. Eng. 2016, 139, 49–61. [Google Scholar] [CrossRef]
  23. Wang, W.; Li, T. Numerical Analysis of Gas-Liquid Two-Phase Flow in Jet-Type Centrifugal Pumps. Fluid Mach. 2020, 48, 53–57. [Google Scholar]
  24. Zhang, F.; Zhu, L.; Chen, K.; Yan, W.; Appiah, D.; Hu, B. Numerical simulation of gas–liquid two-phase flow characteristics of centrifugal pump based on the CFD–PBM. Mathematics 2020, 8, 769. [Google Scholar] [CrossRef]
  25. Wang, B.; Zhang, H.; Deng, F.; Wang, C.; Si, Q. Effect of short blade circumferential position arrangement on gas-liquid two-phase flow performance of centrifugal pump. Processes 2020, 8, 1317. [Google Scholar] [CrossRef]
  26. Wang, L.; Liu, H.; Wang, K.; Zhou, L.; Jiang, X.; Li, Y. Numerical simulation of the sound field of a five-stage centrifugal pump with different turbulence models. Water 2019, 11, 1777. [Google Scholar] [CrossRef]
  27. Fan, B.; Liang, Z.; Fan, R.; Chen, S. Numerical study on entropy generation of the multi-stage centrifugal pump. Entropy 2022, 24, 923. [Google Scholar] [CrossRef]
  28. Li, W.; Pan, Y.; Li, H.; Qi, H.; Wu, P.; Lu, D. Research progress on solid-liquid two-phase flow characteristics and erosion of centrifugal pump. J. Drain. Irrig. Mach. Eng. 2023, 41, 109–117. [Google Scholar] [CrossRef]
  29. Cao, W.; Zhang, Y.; Mao, J.; Cheng, Y.; Zhang, L. Solid-liquid two-phase flow and wear characteristics of high-speed multi-stage deep well pumps. J. Drain. Irrig. Mach. Eng. 2023, 41, 433–439. [Google Scholar]
  30. Zhang, Z.; Li, Y.; Chen, D. Influence of two-fluid turbulence models on the calculation of solid-liquid two-phase flow field. J. Drain. Irrig. Mach. Eng. 2023, 41, 376–383. [Google Scholar]
  31. Kong, D.; Pan, Z.; Yang, B. Characteristics of gas-liquid two-phase flow in self-priming pump. J. Drain. Irrig. Mach. Eng. 2022, 40, 15–21. [Google Scholar] [CrossRef]
  32. Liu, H.; Du, X.; Wu, X.; Tan, M. Numerical simulation on gas-phase characteristics of gas-liquid two-phase flow in pump. J. Drain. Irrig. Mach. Eng. 2022, 40, 238–243. [Google Scholar] [CrossRef]
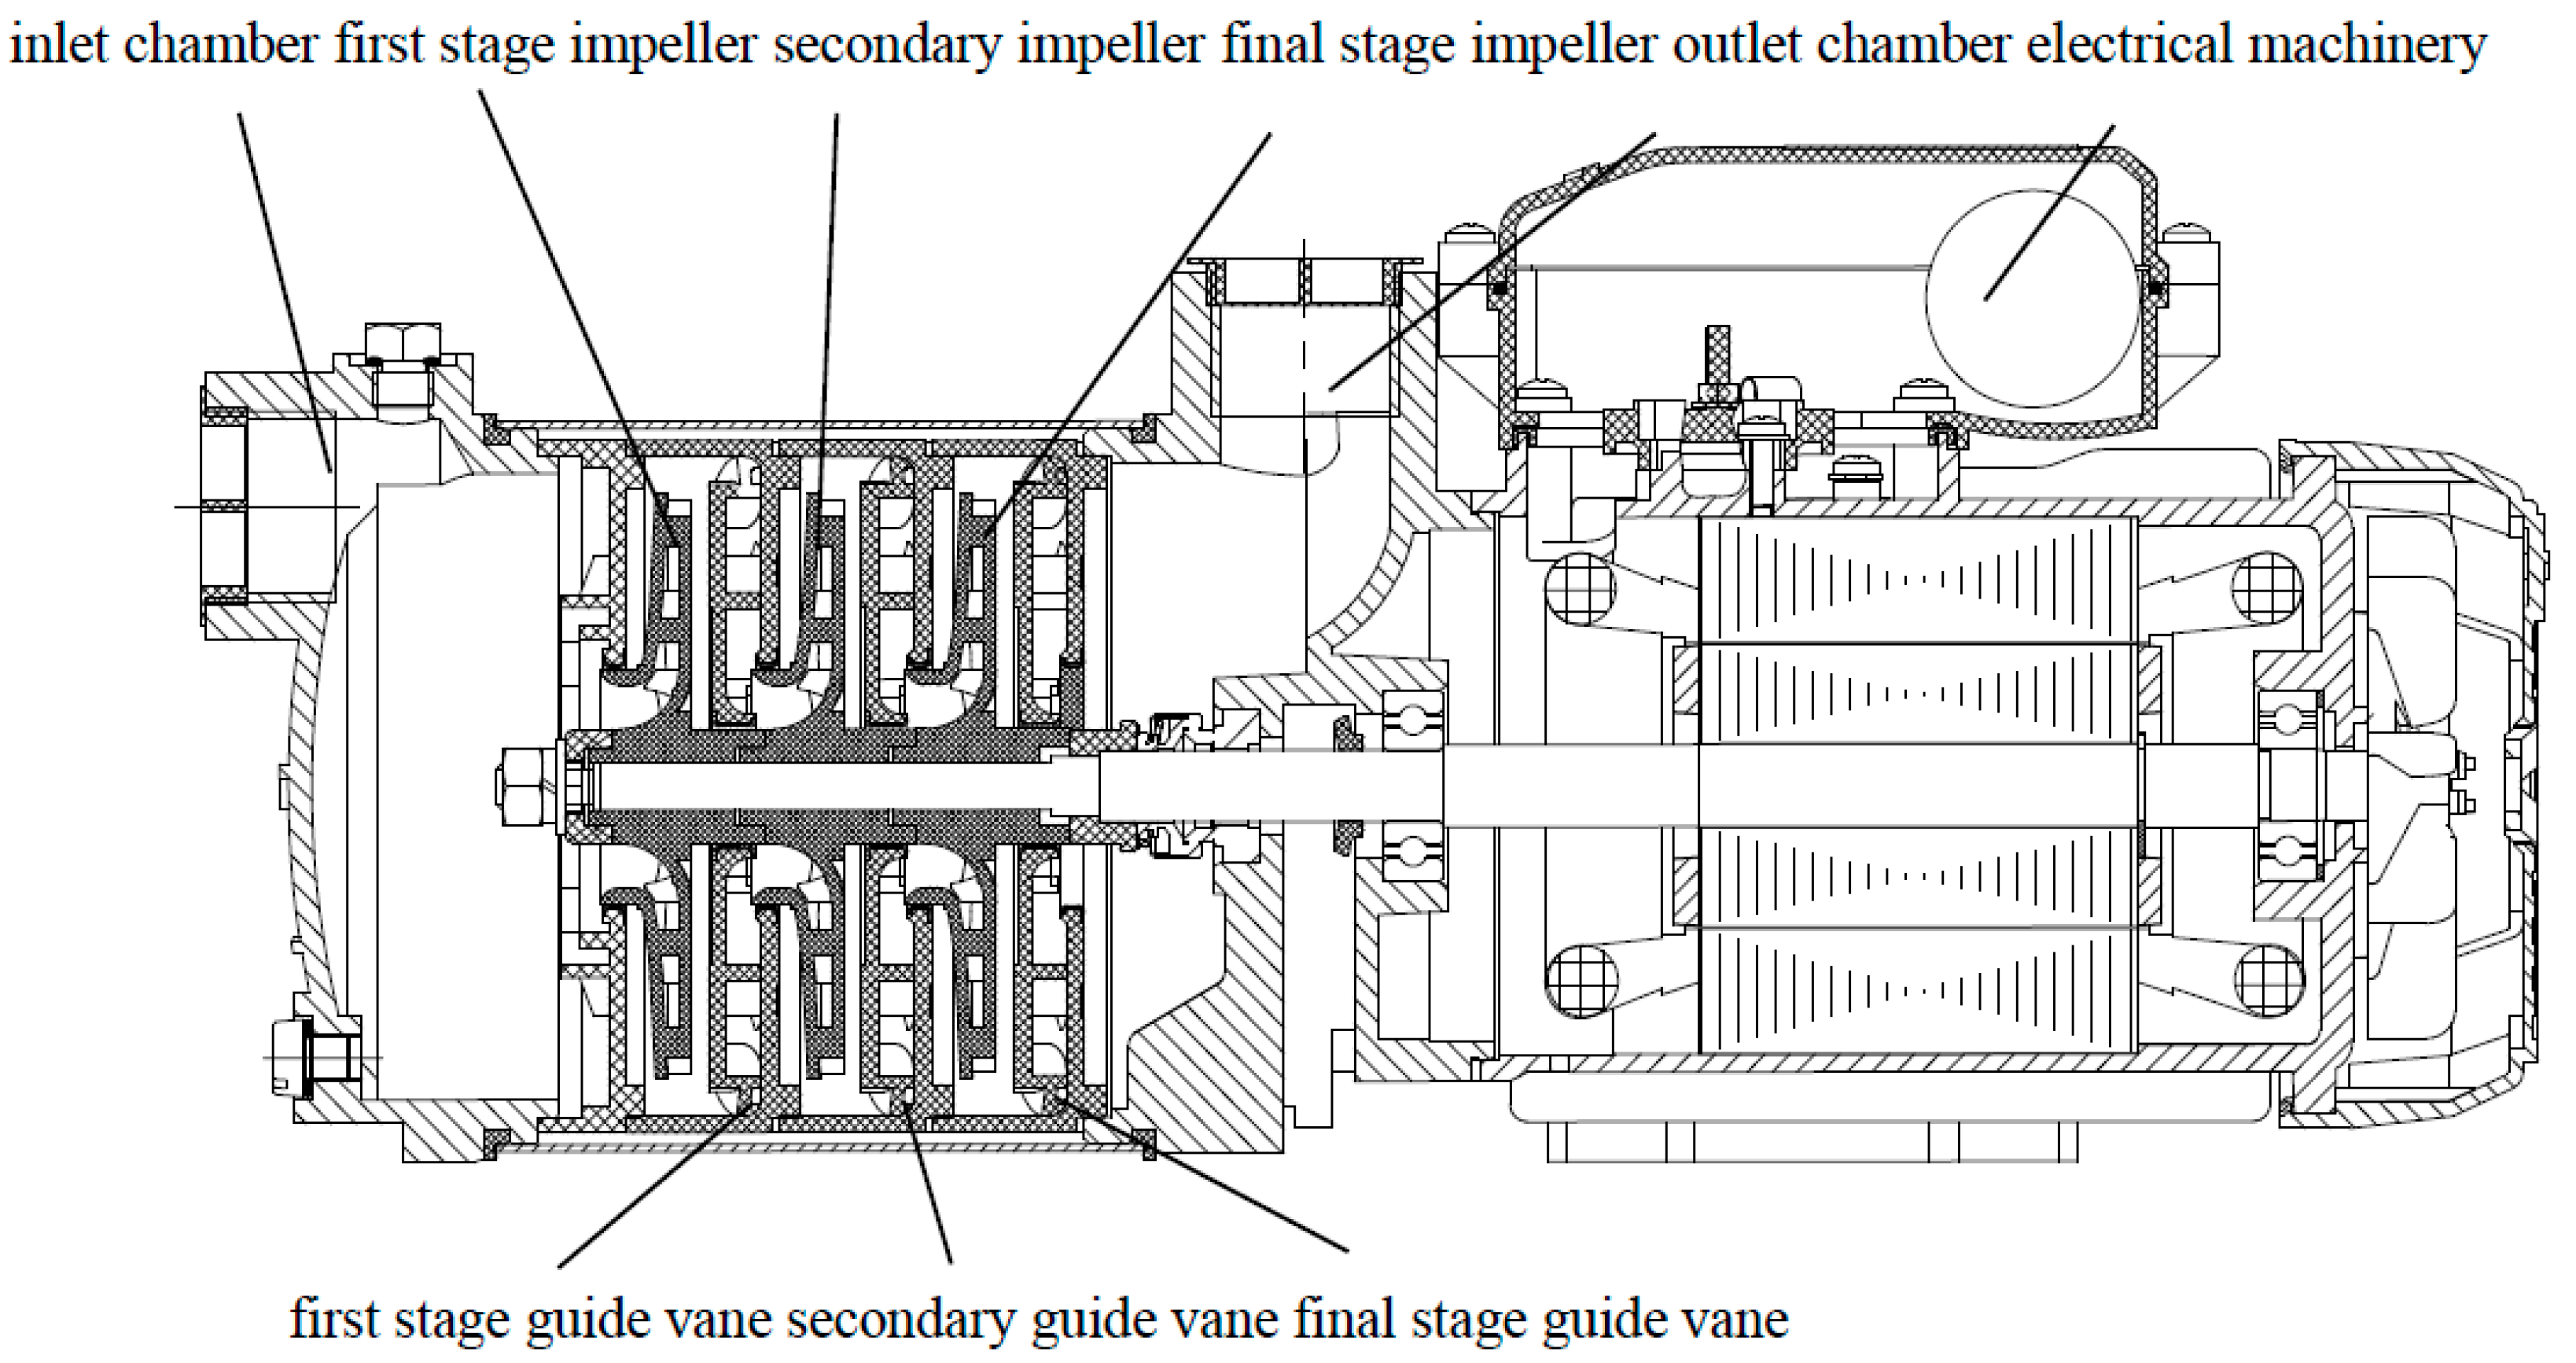
Figure 1. Structure of the pump.
Energies 18 04772 g001
Figure 2. The three-dimensional water domain model of the three-stage centrifugal pump.
Energies 18 04772 g002
Figure 3. Grid division of key components. (a) Inlet chamber. (b) Impeller. (c) Guide vane. (d) Outlet chamber.
Energies 18 04772 g003
Figure 4. Grid independence verification.
Energies 18 04772 g004
Figure 5. Schematic diagram of the test bench.
Energies 18 04772 g005
Figure 6. Comparison of external characteristics of test and simulation results.
Energies 18 04772 g006
Figure 7. The external characteristics change with the variation of the gas content rate.
Energies 18 04772 g007
Figure 8. Blade pressure distribution. (a) IGVF = 1%. (b) IGVF = 2%. (c) IGVF = 3%. (d) IGVF = 5%.
Energies 18 04772 g008
Figure 9. Distribution of air content in blade.
Energies 18 04772 g009
Figure 10. Distribution of the vortex structure of the first-stage impeller.
Energies 18 04772 g010
Figure 11. Distribution of the secondary impeller vortex structure.
Energies 18 04772 g011
Figure 12. The vortex structure distribution of the final-stage impeller.
Energies 18 04772 g012
Figure 13. The variation of vortex strength of the impeller.
Energies 18 04772 g013
Figure 14. The structural distribution of the first-stage guide vane vortices.
Energies 18 04772 g014
Figure 15. Distribution of the secondary guide vane vortex structure.
Energies 18 04772 g015
Figure 16. The structural distribution of the last-stage guide vane vortices.
Energies 18 04772 g016
Figure 17. The variation of the vortex strength of the guide vanes.
Energies 18 04772 g017
Figure 18. Distribution of monitoring points. (a) Impeller inlet monitoring points. (b) Impeller outlet monitoring points. (c) First-stage and secondary guide vane outlet monitoring points. (d) Final-stage guide vane outlet monitoring points.
Energies 18 04772 g018
Figure 19. Time-domain distribution of pressure pulsation with IGVF = 1%. (a) First-stage impeller inlet. (b) First-stage impeller outlet. (c) First-stage guide vane outlet. (d) Secondary impeller inlet. (e) Secondary impeller outlet. (f) Secondary guide vane outlet. (g) Final-stage impeller inlet. (h) Final-stage impeller outlet. (i) Final-stage guide vane outlet.
Energies 18 04772 g019
Figure 20. Time-domain distribution of pressure pulsation with IGVF = 2%. (a) First-stage impeller inlet. (b) First-stage impeller outlet. (c) First-stage guide vane outlet. (d) Secondary impeller inlet. (e) Secondary impeller outlet. (f) Secondary guide vane outlet. (g) Final-stage impeller inlet. (h) Final-stage impeller outlet. (i) Final-stage guide vane outlet.
Energies 18 04772 g020
Figure 21. Time-domain distribution of pressure pulsation with IGVF = 3%. (a) First-stage impeller inlet. (b) First-stage impeller outlet. (c) First-stage guide vane outlet. (d) Secondary impeller inlet. (e) Secondary impeller outlet. (f) Secondary guide vane outlet. (g) Final-stage impeller inlet. (h) Final-stage impeller outlet. (i) Final-stage guide vane outlet.
Energies 18 04772 g021
Figure 22. Time-domain distribution of pressure pulsation with IGVF = 5%. (a) First-stage impeller inlet. (b) First-stage impeller outlet. (c) First-stage guide vane outlet. (d) Secondary impeller inlet. (e) Secondary impeller outlet. (f) Secondary guide vane outlet. (g) Final-stage impeller inlet. (h) Final-stage impeller outlet. (i) Final-stage guide vane outlet.
Energies 18 04772 g022aEnergies 18 04772 g022b
Figure 23. Frequency domain distribution of pressure pulsation with IGVF = 1%. (a) First-stage impeller inlet. (b) First-stage impeller outlet. (c) First-stage guide vane outlet. (d) Secondary impeller inlet. (e) Secondary impeller outlet. (f) Secondary guide vane outlet. (g) Final-stage impeller inlet. (h) Final-stage impeller outlet. (i) Final-stage guide vane outlet.
Energies 18 04772 g023
Figure 24. Frequency domain distribution of pressure pulsation with IGVF = 2%. (a) First-stage impeller inlet. (b) First-stage impeller outlet. (c) First-stage guide vane outlet. (d) Secondary impeller inlet. (e) Secondary impeller outlet. (f) Secondary guide vane outlet. (g) Final-stage impeller inlet. (h) Final-stage impeller outlet. (i) Final-stage guide vane outlet.
Energies 18 04772 g024
Figure 25. Frequency domain distribution of pressure pulsation with IGVF = 3%. (a) First-stage impeller inlet. (b) First-stage impeller outlet. (c) First-stage guide vane outlet. (d) Secondary impeller inlet. (e) Secondary impeller outlet. (f) Secondary guide vane outlet. (g) Final-stage impeller inlet. (h) Final-stage impeller outlet. (i) Final-stage guide vane outlet.
Energies 18 04772 g025
Figure 26. Frequency domain distribution of pressure pulsation with IGVF = 5%. (a) First-stage impeller inlet. (b) First-stage impeller outlet. (c) First-stage guide vane outlet. (d) Secondary impeller inlet. (e) Secondary impeller outlet. (f) Secondary guide vane outlet. (g) Final-stage impeller inlet. (h) Final-stage impeller outlet. (i) Final-stage guide vane outlet.
Energies 18 04772 g026
Table 1. Dimensions of components of multistage centrifugal pump.
ParameterSize
inlet diameter of pump30 mm
outlet diameter of pump30 mm
inlet diameter of the impeller34 mm
outlet diameter of the impeller98 mm
the number of blades7
the outlet width of the impeller2 mm
the base circle diameter of the guide vanes110.5 mm
the outlet diameter of the guide vanes24 mm
the number of the guide vanes’ blades6
the outlet width of the guide vanes6 mm
Disclaimer/Publisher’s Note: The statements, opinions and data contained in all publications are solely those of the individual author(s) and contributor(s) and not of MDPI and/or the editor(s). MDPI and/or the editor(s) disclaim responsibility for any injury to people or property resulting from any ideas, methods, instructions or products referred to in the content.