Article

Numerical Investigation of Hydrogen Production via Methane Steam Reforming in Tubular Packed Bed Reactors Integrated with Annular Metal Foam Gas Channels

School of Nuclear Science and Energy Engineering, Shandong University, Jinan 250061, China
*
Author to whom correspondence should be addressed.
Energies 2025, 18(17), 4758; https://doi.org/10.3390/en18174758 (registering DOI)
Submission received: 15 July 2025 / Revised: 29 August 2025 / Accepted: 3 September 2025 / Published: 7 September 2025
(This article belongs to the Special Issue Computational Fluid Dynamics (CFD) Study for Heat Transfer)

Abstract

Methane steam reforming is the most widely adopted hydrogen production technology. To address the challenges associated with the large radial thermal resistance and low mass transfer rates inherent in the tubular packed bed reactors during the MSR process, this study proposes a structural design optimization that integrates annular metal foam gas channels along the inner wall of the reforming tubes. Utilizing multi-physics simulation methods and taking the conventional tubular reactor as a baseline, a comparative analysis was performed on physical parameters that characterize flow behavior, heat transfer, and reaction in the reforming process. The integration of the annular channels induces a radially non-uniform distribution of flow resistance in the tubes. Since the metal foam exhibits lower resistance, the fluid preferentially flows through the annular channels, leading to a diversion effect that enhances both convective heat transfer and mass transfer. The diversion effect redirects the central flow toward the near-wall region, where the higher reactant concentration promotes the reaction. Additionally, the higher thermal conductivity of the metal foam strengthens radial heat transfer, further accelerating the reaction. The effects of operating parameters on performance were also investigated. While a higher inlet velocity tends to hinder the reaction, in tubes integrated with annular channels, it enhances the diversion effect and convective heat transfer. This offsets the adverse impact, maintaining high methane conversion with lower pressure drop and thermal resistance than the conventional tubular reactor does.

1. Introduction

The excessive consumption of fossil fuels has led to a series of environmental issues, including the greenhouse effect, smog, and acid rain [1]. Consequently, pursuing sustainable and clean energy has become a critical challenge for modern society. Hydrogen energy, characterized by its wide availability, high energy density, and zero carbon emissions, presents significant advantages. It has been widely applied in petroleum refining, aerospace, and transportation sectors [2,3]. At present, hydrogen production methods can be broadly classified into three categories: hydrogen from fossil fuels, hydrogen from industrial by-products, and hydrogen from water electrolysis. Among these, methane steam reforming has become the most widely adopted approach due to its technological maturity and high energy conversion efficiency [4]. Compared to dry reforming and autothermal reforming of methane, MSR exhibits greater advantages in terms of energy efficiency [5]. According to statistics, MSR accounted for approximately 60% of global hydrogen production in 2021 and is projected to maintain its dominance over the next two decades.
Researchers have continuously explored multiple avenues for process improvement to enhance the hydrogen production efficiency of methane steam reforming in practical applications. At present, most studies focus on optimizing and controlling operating parameters [6,7]. Although such efforts have yielded some positive results, their impact remains limited, offering only moderate improvements in overall process performance. Building on this foundation, increasing attention has been directed toward the introduction of novel materials to further advance the reforming process. Strategies in this area include the development of advanced catalyst architectures [8,9], the use of high-performance catalyst supports [10], and the structural redesign of the reactor itself [11]. For example, Wu et al. [11] found that utilizing a gradually expanding tube structure effectively reduced the average reactor temperature and pressure drop while enhancing the outlet mass flow rate. Huang et al. [12] reported that increasing the reactor tube diameter improves methane conversion and hydrogen yield, but it also intensifies the non-uniformity of the temperature field. In addition, internal fin structures, known for their excellent heat transfer properties, have been widely employed in industrial equipment such as radiators, burners, and heat exchangers to enhance thermal performance [13,14,15,16]. Jurtz et al. [17] investigated flow and heat transfer in tubular packed beds and demonstrated that internal helical fins could increase the overall heat transfer coefficient by 25%.
As methane steam reforming is a highly endothermic reaction, heat transfer plays a crucial role throughout the entire reforming process. Previous studies have shown that the process demands a substantial heat supply, particularly in the inlet region where low temperatures typically prevail, thereby limiting both the reaction rate and the overall reaction order. Yuan [18] and Pashchenko [19] identified temperature delay in the inlet region as a major factor constraining reactor performance. As a result, enhancing the heat transfer capacity within tubular packed bed reactors has been recognized as a promising approach to improve reforming efficiency. Palma et al. [20] introduced a structured catalyst to enhance axial and radial temperature distributions. Suzuki et al. [21] proposed that a non-uniform catalyst distribution inside the reformer could minimize temperature gradients throughout the reactor. Building upon this idea, Mozdzierz et al. [22] divided the reformer into multiple zones with varying catalyst densities. In recent years, metal foam has been widely studied and applied across various industrial systems, demonstrating significant potential in enhancing heat transfer [23,24,25,26]. Zaioet and Ferri et al. [27,28] filled Rh/Al2O3 egg-shell catalysts into copper foam metals to enhance the performance of the catalysts in the methane steam reforming process. The study found that this method can achieve a relatively low radial temperature gradient while obtaining a high methane conversion. Settar et al. [29] introduced non-catalytic zones between catalyst sections and inserted metal foam into these zones. They found that inserting foam copper into a methane steam reformer enhanced flow mixing, thereby significantly improving reactor efficiency. Subsequently, Settar et al. [30] demonstrated that embedding metal foam into a wall-coated MSR reactor increased CH4 conversion. Pajak et al. [31] implemented axially spaced steel foam segments in the reactor and found that this configuration mitigated the sharp temperature drop at the reactor inlet, significantly improving temperature uniformity. In a follow-up study, Pajak et al. [32] employed radially spaced steel foam within the reactor and reached similar conclusions.
In numerical simulations, the equivalent medium method has been widely employed for modeling multiphase reaction processes due to its advantages of reduced computational time and high prediction accuracy. This method treats complex reaction zones as porous media and couples them with chemical kinetics, enabling effective simulation of flow, heat transfer, and mass transport behaviors in methane steam reforming for hydrogen production within a computational fluid dynamics framework. Experimental validation by Mokheimer et al. [33] demonstrated that this method can accurately predict CH4 conversion under various operating conditions. Lao et al. [34] compared simulation results obtained using the equivalent medium method with industrial experimental data and found excellent agreement in outlet species distribution. Sheu et al. [35] used this method to simulate adsorption-enhanced MSR in reactors, further validating its applicability. Amini et al. [36] applied the method to model an industrial-scale side-fired steam reformer and achieved satisfactory simulation performance. In summary, the effective medium method enables accurate simulation and species distribution prediction with relatively low computational cost. Therefore, this study also adopts the equivalent medium method to perform numerical simulations of the hydrogen production process using methane steam reforming.
As highlighted in the preceding literature review, incorporating metal foam structures into packed-tube reactors has proven effective in enhancing flow and heat transfer characteristics during methane steam reforming, thereby improving the overall reaction efficiency. Therefore, this study innovatively proposes a strategy of installing metal foam inserts in the reforming tube, aiming to improve the radial heat transfer and alleviate the radial mass transfer limitations in the MSR process. In this study, copper foam is selected as the filler material for the non-catalytic zones of the reforming tube. Copper foam, a widely used engineering material, offers significantly lower cost compared to nickel-based catalysts and exhibits excellent thermal conductivity, making it highly effective for enhancing heat transfer. Based on this selection, the work conducts a multi-physics coupled numerical study on methane steam reforming in reforming tubes integrated with annular metal foam structures. A comparative analysis with conventional packed bed reactors is performed to systematically investigate the underlying mechanisms through which this structural optimization enhances reactor performance. Furthermore, the effects of various operating parameters on flow, heat transfer, and reaction performance under the proposed structure are analyzed, aiming to further study the influence of various operating parameters on the degree of performance optimization of the innovative structure.

2. Numerical Method

2.1. Physical Model

In Figure 1a, RT-1 represents a conventional straight cylindrical methane steam reforming reactor, in which the tube is filled exclusively with spherical nickel-based catalyst particles. To enhance the performance of the conventional tubular reactor, this study proposes a structural optimization strategy involving the integration of annular metal foam gas channels within the reforming tube. This structural optimization strategy involves setting up parallel gas channels in some sections of the reforming tube, which is different from the series arrangement of packed bed and metal foam as well as the design of filling catalyst particles in the gaps of the metal foam. The resulting reactor designs are illustrated in Figure 1a as RT-2 and RT-3. Specifically, RT-2 incorporates a continuously arranged coaxial annular metal foam, whereas RT-3 employs a discretely arranged coaxial annular metal foam. Among the reforming tubes of these three structures, the conventional tubular reactor RT-1 is the basis for comparison in this study. Given the two-dimensional axial symmetry of all reforming tubes shown in Figure 1a, the physical models are simplified to the axisymmetric form depicted in Figure 1b. The corresponding geometric parameters for each reactor configuration are listed in Table 1. As shown in Table 1, the annular metal foam gas channels in RT-2 and RT-3 have the same radial thickness and the same total axial length. Based on the parallel design strategy, the ratio of the radial thickness of the annular metal foam to the diameter of the reforming tube is relatively small, while the ratio of its axial length to the length of the reforming tube is relatively large.
The Ni/MgAl2O4 catalyst particles loaded into all reforming tubes have an average diameter of 2.5 mm, forming packed catalyst beds with a uniform porosity of 0.45. Owing to their intrinsic porosity, the catalyst particles are assigned an effective thermal conductivity of 1.0 W/(m·K) [37,38]. The annular metal foams in RT-2 and RT-3 are made of copper foam with 20 PPI [39], a porosity of 0.90, and an effective thermal conductivity of 30 W/(m·K) [32]. Given the negligible thermal resistance of the reforming tube wall, the inner and outer wall temperatures are assumed to be equal. Therefore, the tube wall is omitted in the physical model.

2.2. Governing Equations

In this study, a two-dimensional axisymmetric steady-state numerical simulation of methane steam reforming for hydrogen production within the reforming tube is conducted using the equivalent medium method. The two-dimensional axisymmetric simplification and the equivalent medium method have been proven to possess certain rationality and accuracy in simulating the MSR process inside the reforming tube [33]. The simulation is based on the following assumptions: (1) The gas mixture is treated as an incompressible ideal gas. Within the range of inlet velocities from 0.2 m/s to 1.0 m/s, the flow regime is laminar. (2) The gas mixture consists of only five components: methane, hydrogen, carbon dioxide, carbon monoxide, and water vapor. (3) Both the catalyst bed and the annular metal foam regions are modeled as isotropic and homogeneous porous media. Based on the laminar flow assumption of the gas mixture and the relatively high effective thermal conductivity of the metal foam, the gas and solid phases are assumed to be in local thermal equilibrium. (4) Chemical reactions are restricted to gas-phase catalytic reactions and are assumed to occur only within the catalyst bed region.
Reaction Kinetic Equations:
The intrinsic kinetic model proposed by Xu and Froment [40] is adopted in this study. This model simplifies the complex methane steam reforming system into a parallel reaction network comprising three key reactions: methane steam reforming (MSR), reverse methanation (RM), and the water–gas shift (WGS) [41]. The corresponding reaction equations are as follows:
CH 4 + H 2 O CO + 3 H 2 , Δ h MSR 298 K = 206 . 1 kJ / mol
CH 4 + 2 H 2 O CO 2 + 4 H 2 , Δ h RM 298 K = 164 . 9 kJ / mol
CO + H 2 O CO 2 + H 2 , Δ h WGS 298 K = - 41 . 15 kJ / mol
In the kinetic model, the reaction rates are formulated as functions of temperature and the partial pressures of the gaseous components. Each rate expression incorporates adsorption terms to account for the adsorption–desorption behavior of the species on the catalyst surface. The rate expressions for the individual reactions are given below:
r MSR = k MSR p H 2 2.5 p CH 4 p H 2 O p CO p H 2 3 / K MSR / D E N 2
r RM = k RM p H 2 3.5 p CH 4 p H 2 O 2 p CO 2 p H 2 4 / K RM / D E N 2
r WGS = k WGS p H 2 p CO p H 2 O p CO 2 p H 2 / K WGS / D E N 2
D E N = 1 + K CO p CO + K H 2 p H 2 + K CH 4 p CH 4 + K H 2 O p H 2 O / p H 2
where ri denotes the reaction rate of reaction i, and ki and Ki represent the rate constant and equilibrium constant, respectively, for reaction i (i = MSR, RM, WGS). In the adsorption terms, Ki and pi denote the adsorption constant and partial pressure of gas component i, respectively (i = CH4, H2, CO2, CO, H2O).
The reaction rate constants follow Arrhenius form, as expressed in Equation (8). The adsorption equilibrium constants for the gas species are described using the Van’t Hoff equation, as shown in Equation (9). Parameters used in these equations are listed in Table 2.
k i = A k i e E i / R T
K i = A K i e Δ H i / R T
The reaction equilibrium constants also follow the Van’t Hoff relation [42] and are expressed as follows:
K MSR = p H 2 3 p CO / p CH 4 p H 2 O = e 26830 / T + 30.114
K WGS = p CO 2 p H 2 / p CO p H 2 O = e 4400 / T 4.036
K RM = K MSR × K WGS
The continuity equation is expressed as follows:
ρ f u f = 0
where ρf and u f represent the density and velocity of the gas mixture, respectively. The gas mixture density ρf is calculated using the ideal gas law.
The momentum conservation equation is expressed as follows:
ρ f u f u f = p + μ f u f + u f T 2 3 μ f u f I + F
where p denotes the static pressure of the gas mixture, μf represents the dynamic viscosity, I is the identity tensor, and F is the momentum source term (drag force). The dynamic viscosity μf of the gas mixture is calculated using Wilke’s method [43]. The viscosities of individual gas components are expressed as temperature dependent functions [44]. The drag source term F is computed differently in the catalyst bed and metal foam regions. In the axial direction of the reforming tube, the drag in the catalyst bed region is calculated using the R-S correlation, as given in Equation (15) [45]. For the metal foam region, the drag term is evaluated using the DEF correlation, as shown in Equation (16) [39]:
F cat , x = μ f α u f , x + 1 2 C 2 ρ f u f , x 2
F foam , x = μ f K u f , x + f ρ f K u f , x 2
where uf,x denotes the axial velocity of the gas mixture. In addition, α and C2 represent the permeability and inertial resistance coefficient of the catalyst bed, respectively, both of which are functions of the tube diameter dt, catalyst particle diameter dp and catalyst bed porosity εcat. K and f denote the permeability and form drag coefficient of the metal foam, respectively.
The energy equation is expressed as follows:
ρ f c p , f u f T f = k eff T f i = 1 N h i J i + S h
where cp,f is the specific heat capacity of the gas mixture, which is calculated using the mass fraction weighted mixing rule. The specific heats of individual gas components are temperature-dependent functions [46]. Tf denotes the temperature of the gas mixture. keff represents the effective thermal conductivity of the porous medium, which is obtained using a volume averaging approach between the gas and solid phases [47]. The thermal conductivity of the gas mixture, kf, is calculated using the Wassiljewa equation [48], with the thermal conductivities of individual gases also modeled as temperature dependent [44]. hi denotes the sensible enthalpy of species i. J i represents the mass diffusion flux of species i. Sh is the energy source term due to chemical reactions, which is calculated as follows:
S h = i = 1 3 η i r i Δ h i
where ηi denotes the effectiveness factor for reaction i, which accounts for the reduction in reaction rate due to internal and external diffusion limitations within the catalyst. Baek et al. [37] reported that in small-scale reforming hydrogen reactors, the effectiveness factor is typically less than 0.1. In the study by Ngo et al. [46], ηi was modeled as a function of the reactor’s effective residence time. Similarly, the average value of ηi is also less than 0.1. In the numerical simulation work by Lao et al. [34], ηi was set as a constant value of 0.1, and their research results indicated that the numerical simulation results showed good consistency with the experiment when ηi was taken as a constant value. Based on these considerations, the effectiveness factors in this study are also set as constant values less than 0.1: ηMSR = ηRM = 0.04 and ηWGS = 0.06.
The species transport equation is expressed as follows:
ρ f u f Y i = J i + r m , i
J i = ρ f D i , m Y i
D i , m = ε s j = 1 , j i N x j D ij + x i 1 Y i j = 1 , j i N Y i D ij 1
where Yi denotes the mass fraction of species i, and rm,i represents the rate of change in mass concentration of species i due to chemical reactions. The mass diffusion flux is calculated using Equation (20), where Di,m is the effective mass diffusivity of species i. xi is the mole fraction of species i, and Dij denotes the binary mass diffusion coefficient between species i and j, calculated using the Chapman–Enskog equation [49].

2.3. Boundary Conditions

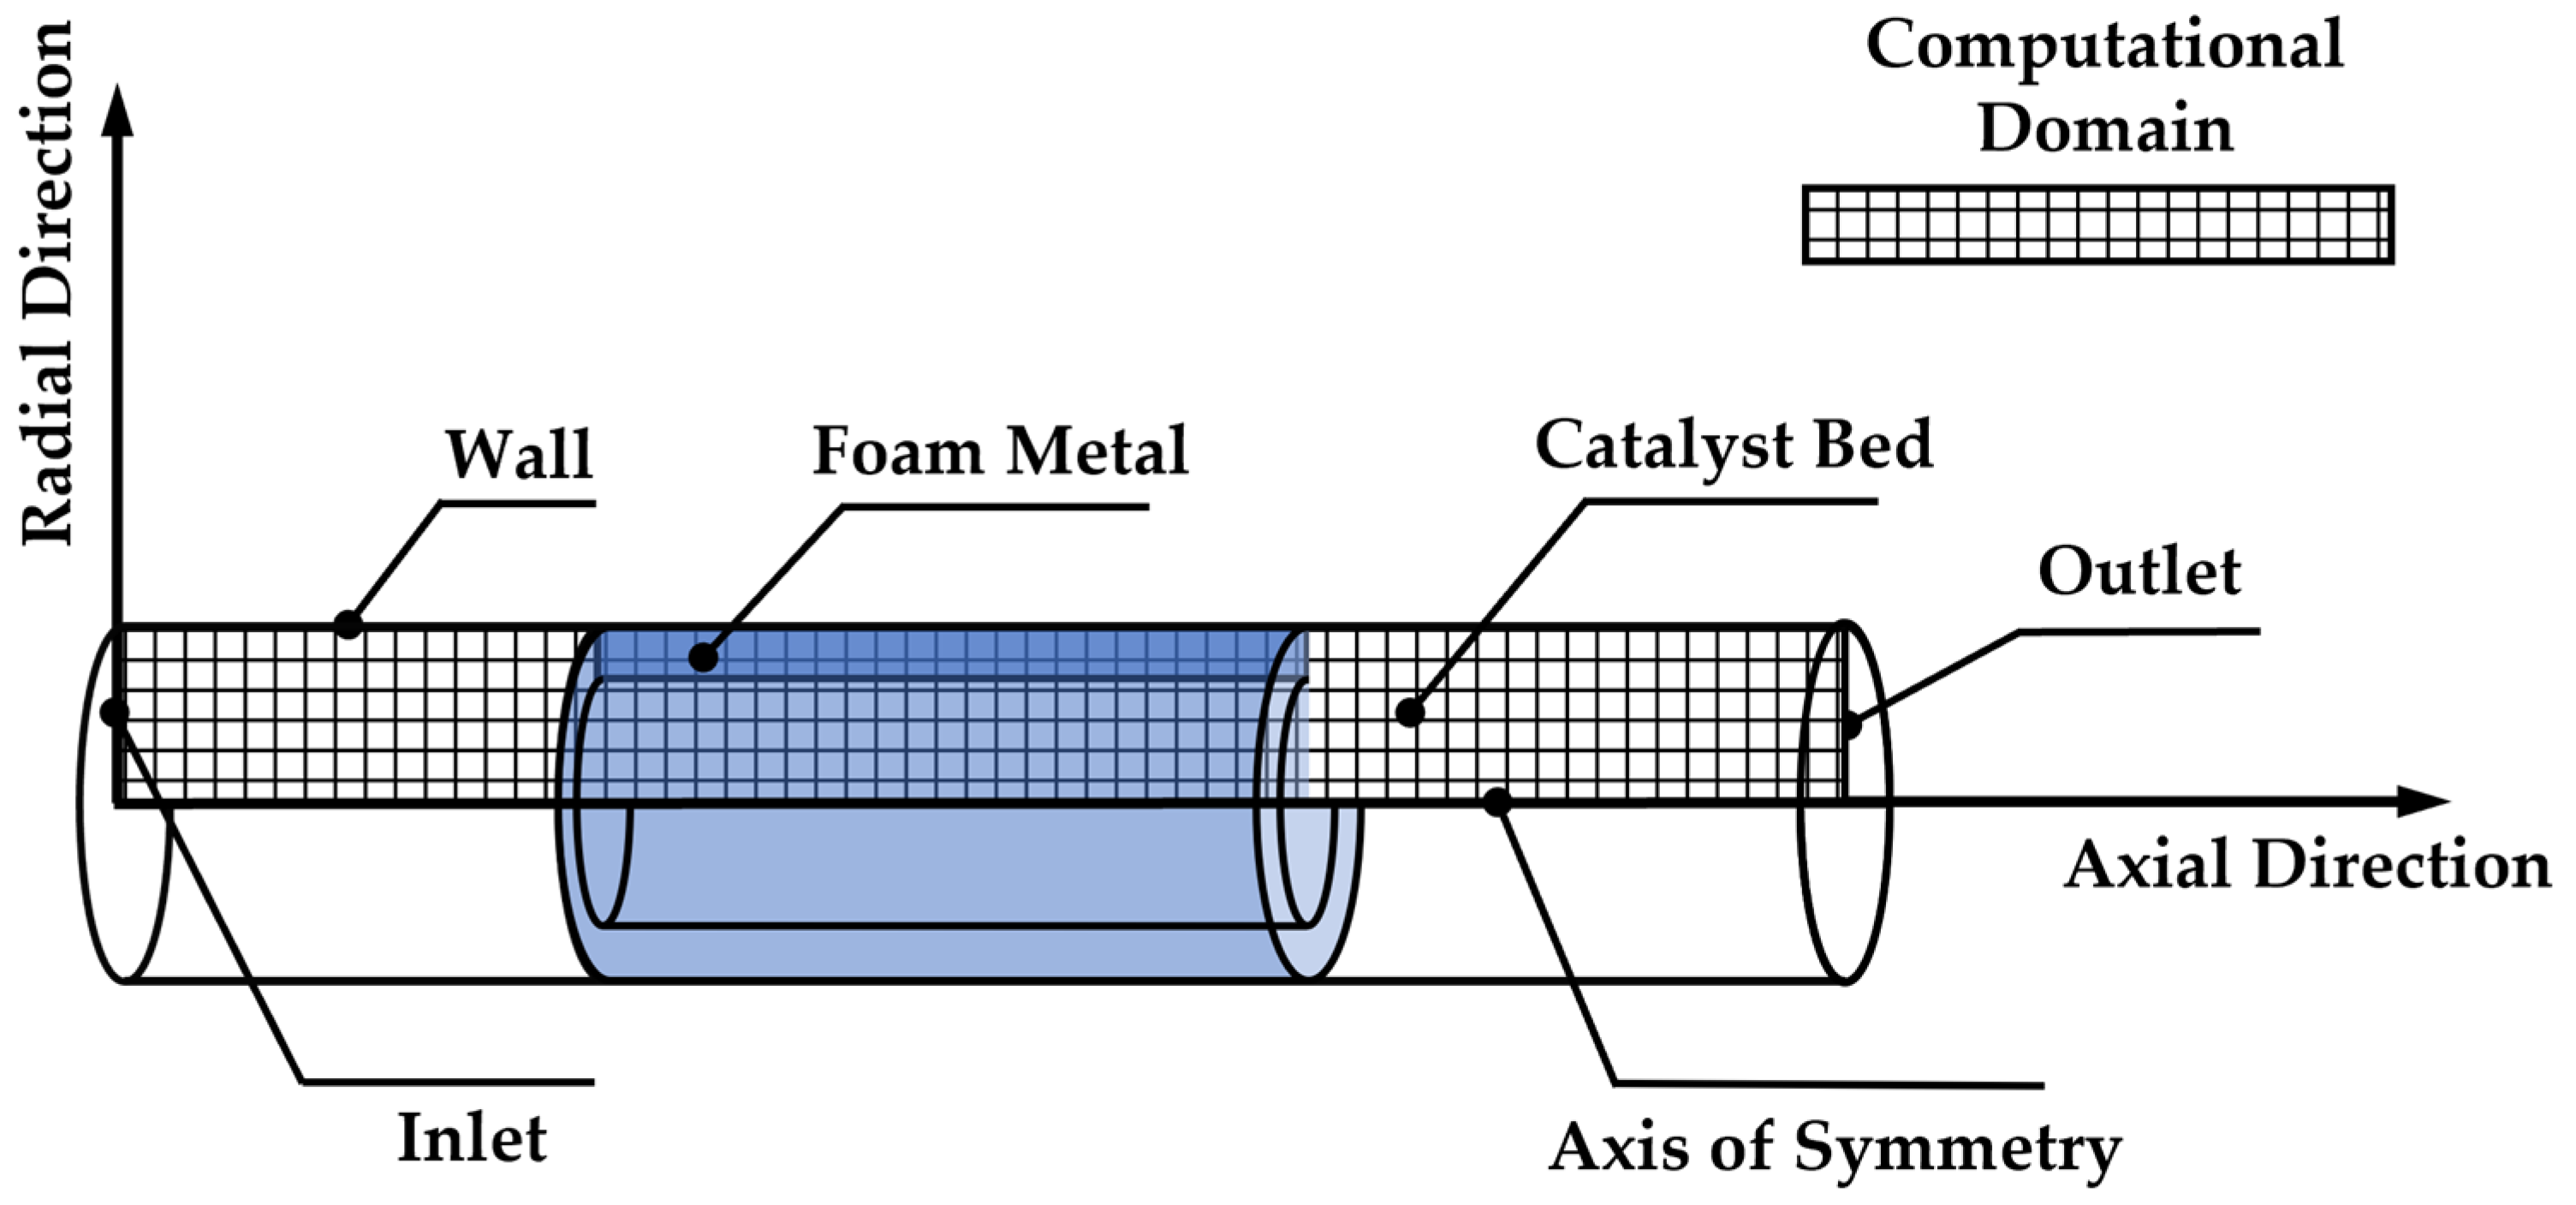
Figure 2 shows the schematic diagram of the computational domain for RT-2. The central axis of the tube serves as the axis of symmetry and is treated as a symmetry boundary condition. A velocity inlet boundary condition is applied at the tube entrance. The inlet velocity and temperature of the gas mixture are denoted as uinlet and Tinlet, respectively. The steam-to-carbon ratio (S/C) refers to the molar ratio of water vapor to methane. A pressure outlet boundary condition with zero gauge pressure is applied at the tube exit. Different reaction pressures pt are implemented by varying the operating pressure in the simulation. The tube wall is modeled using a constant wall temperature boundary condition, where the wall temperature Twall represents the reaction temperature. The influence of operating parameters on reforming performance is discussed in Section 3. The specific boundary conditions for each case are summarized in Table 3 and Table 4.
The governing equations for the hydrogen production process with methane steam reforming are solved using the finite volume method implemented in the commercial software Ansys Fluent 2024R1. A pressure-based solver is employed, with pressure–velocity coupling handled using the SIMPLE algorithm. The spatial discretization schemes for the momentum, energy, and species transport equations are set to second-order upwind. The solution is considered converged when the residuals of the continuity and momentum equations fall below 10−5, and those of the energy and species transport equations fall below 10−7. The reaction kinetics are implemented with a user-defined function using the DEFINE_VR_RATE. Thermophysical properties of the gases are defined using the built-in Expression functionality of the software.

2.4. Mesh and Model Validation

In this subsection, the methane steam reforming experiments conducted by Xu et al. are used as a reference for validating the numerical method. Both mesh independence and model accuracy are evaluated.
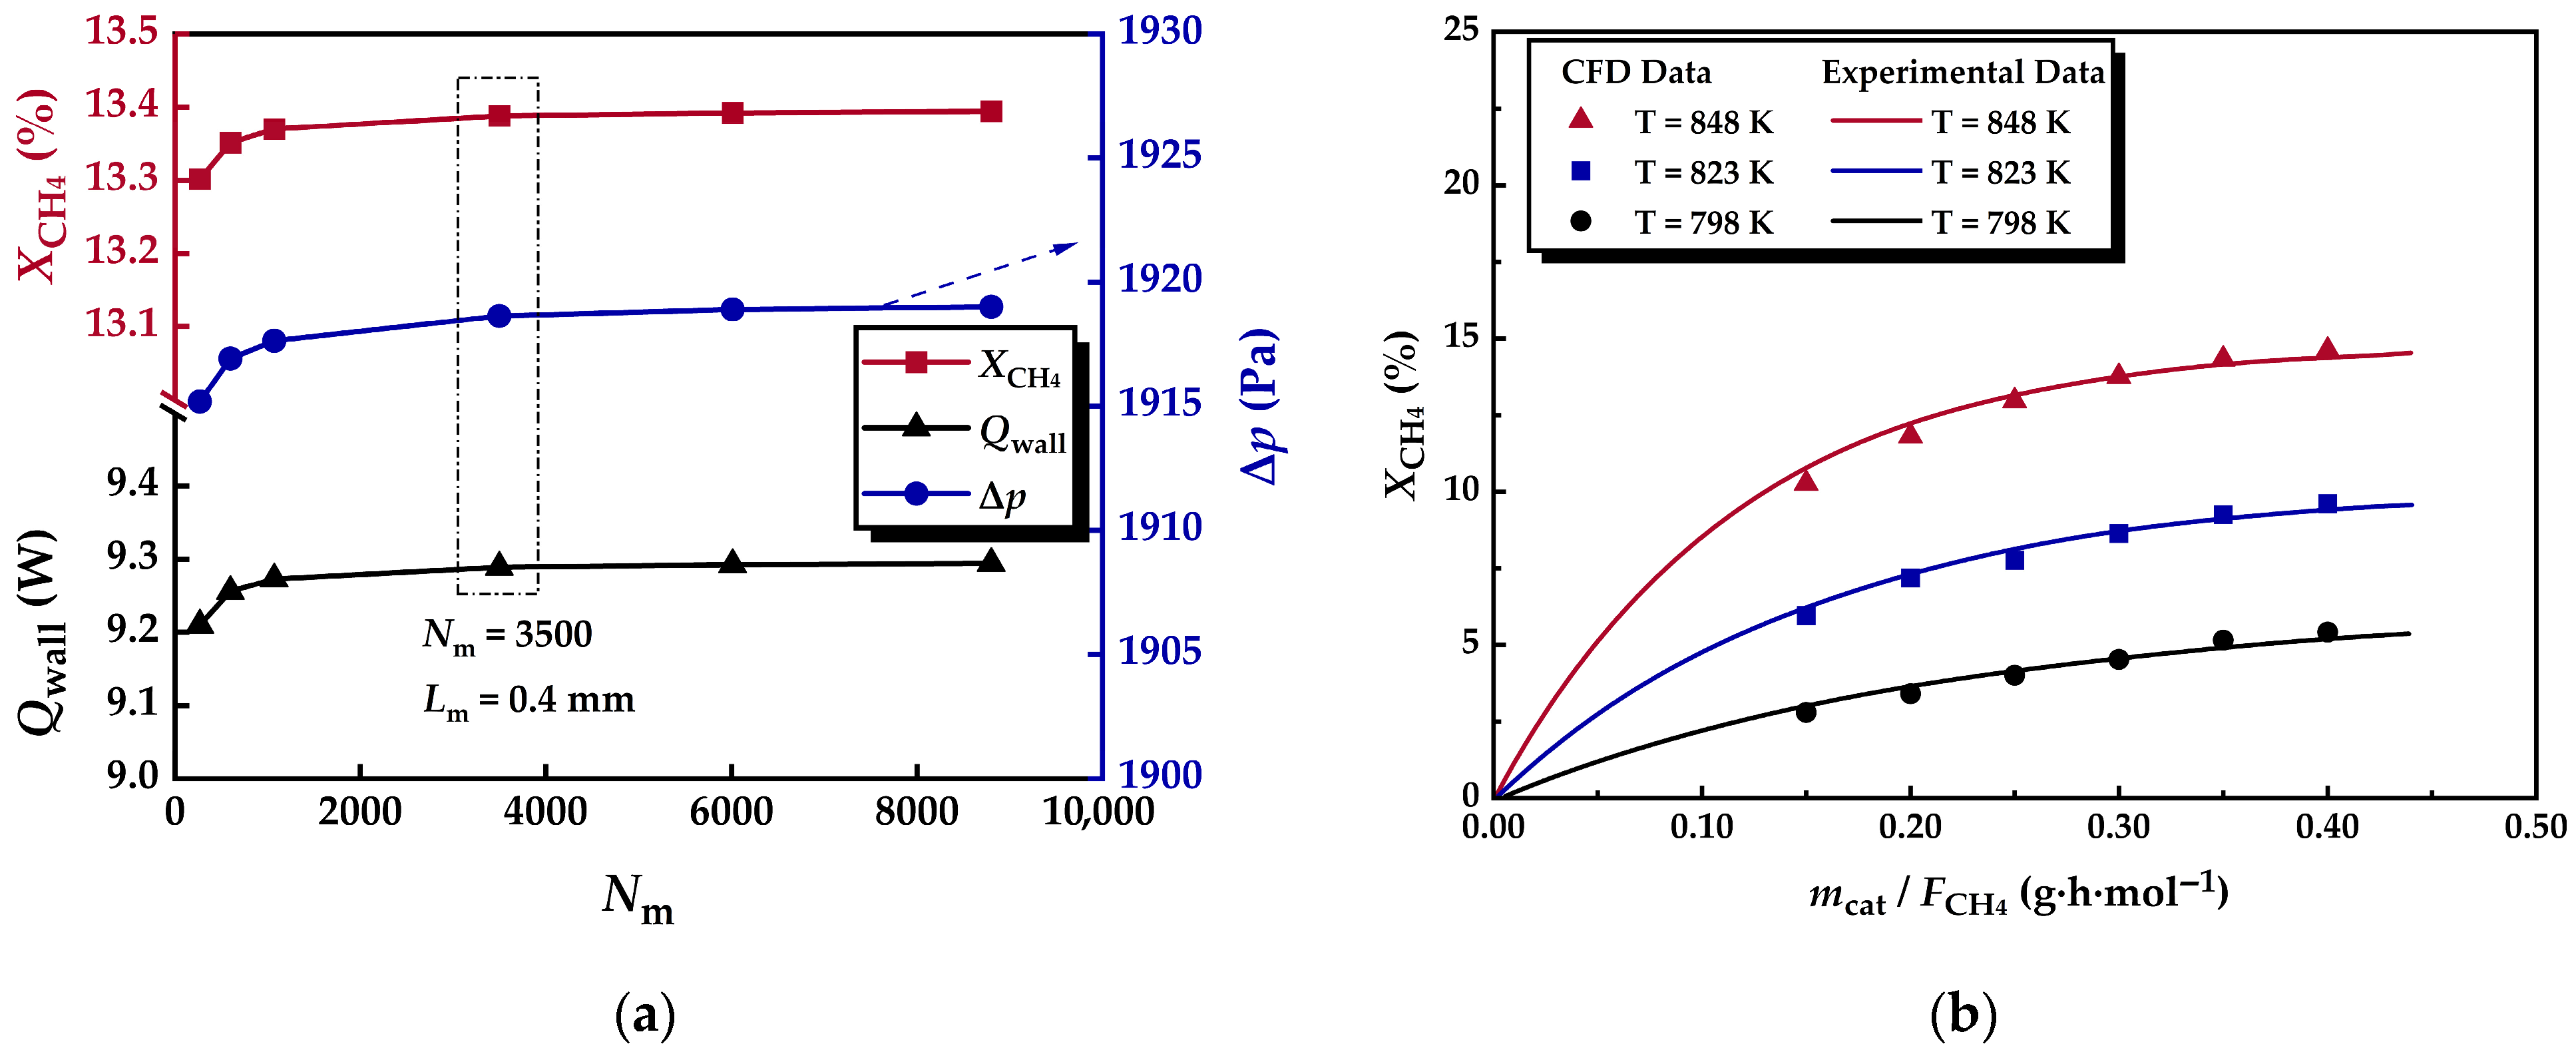
To eliminate discretization errors in the simulation results, a two-dimensional axisymmetric physical model identical in dimensions to the experimental reforming tube was constructed using ICEM software. A structured mesh was generated for the computational domain. The mesh resolution was controlled by adjusting the mesh size Lm, which correspondingly changed the total number of mesh cells Nm. When Lm was set to 1.5, 1.0, 0.75, 0.4, 0.3, and 0.25 mm, the corresponding values of Nm were 286, 600, 1072, 3500, 6012, and 8800, respectively. Figure 3a presents the numerical results obtained under different mesh sizes Lm, including methane conversion XCH4, wall heat flux Qwall, and pressure drop Δp along the reforming tube. The methane conversion XCH4 is calculated using a carbon balance method, as defined in Equation (22). As shown in the Figure 3a, when Nm > 3500, the simulation results of all parameters become insensitive to further mesh refinement. Furthermore, when Nm increases from 3500 to 8800, the changes in the simulation results of all parameters do not exceed 0.1%. Therefore, a mesh size of 0.4 mm was selected for the axisymmetric model in this study.
In this subsection, numerical simulations of methane steam reforming for hydrogen production inside the reforming tube were conducted under multiple operating conditions identical to those used in the experiments. Figure 3b compares the simulated methane conversion with experimental data. At reaction temperatures of 848 K, 823 K, and 798 K, the maximum percentage absolute errors between simulation and experiment are 4.71%, 4.48%, and 7.09%, respectively. Additionally, the simulation results show that methane conversion increases with rising reaction temperature and decreasing methane inlet flow rate, consistent with the trends observed in the experimental data. The above comparison results indicate that in the numerical model developed in this study, the equivalent medium method and the reaction kinetic equation have high accuracy and reliability.
X CH 4 = x CO , outlet + x CO 2 , outlet x CO , outlet + x CO 2 , outlet + x CH 4 , outlet × 100 %

3. Results and Discussion

Using the conventional packed bed tubular reactor as a baseline, this section presents a systematic analysis of the simulation results from three perspectives: flow characteristics, heat transfer characteristics, and reaction characteristics. The objective is to investigate the underlying mechanisms by which the incorporation of annular metal foam gas channels affects the multi-physical fields within the reforming tube and to reveal how these structural modifications contribute to performance enhancement.

3.1. Flow Characteristics

3.1.1. Velocity Distribution

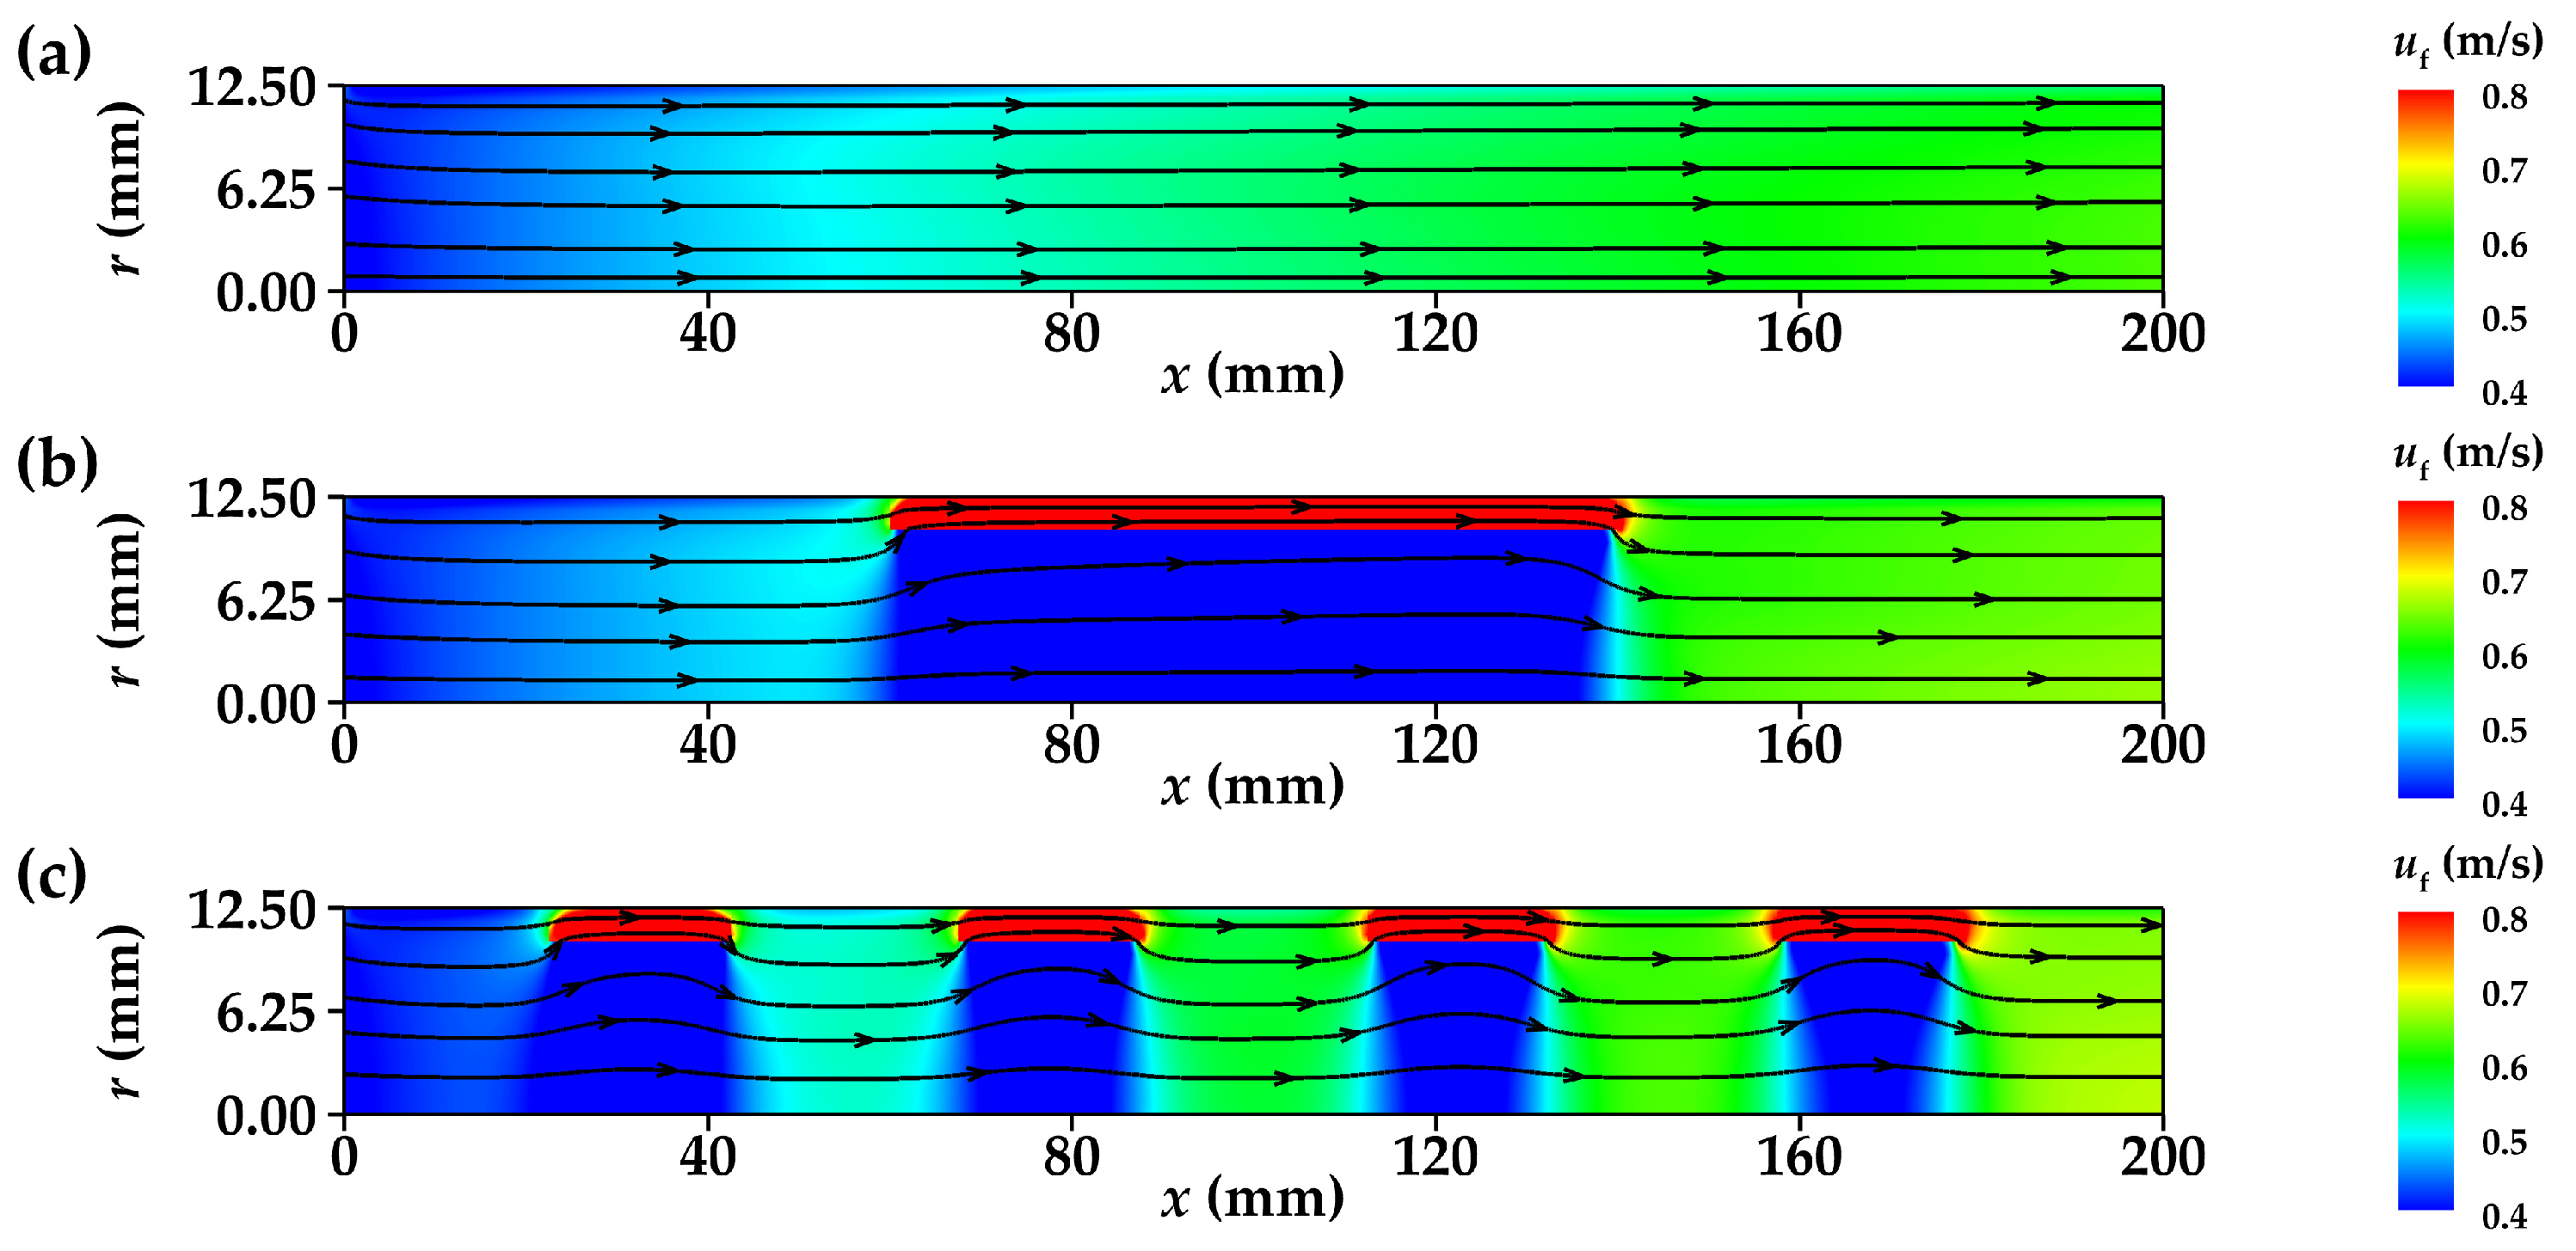
Figure 4 presents the velocity contours of the gas mixture within the different reforming tubes. Compared to RT-1, the inclusion of annular metal foam gas channels significantly alters the internal flow field. Specifically, the flow velocity within the foam pores is noticeably higher in the metal foam segments than in the adjacent catalyst bed pores. For instance, at the axial position x = 100 mm in RT-2, the average gas velocity within the metal foam region is 1.307 m/s, while that in the catalyst bed region is only 0.295 m/s. This flow redistribution is attributed to the non-uniform radial distribution of flow resistance within the cross-section of the metal foam-containing segment. The gas mixture preferentially flows through the lower-resistance foam pores. Secondly, streamlines reveal pronounced radial flow in RT-2 and RT-3, which is conducive to enhancing convective heat and mass transfer processes.
A consistent domain segmentation approach is applied to all configurations to quantitatively compare the velocity distribution of the gas mixture in different reforming tubes. Taking RT-1 as an example, the domain segmentation method is illustrated in Figure 5. Along the axial direction, 81 equally spaced cross-sectional planes are defined. At each section, the mass-weighted average velocity of the gas mixture is calculated and used to represent the average velocity at the corresponding axial position.
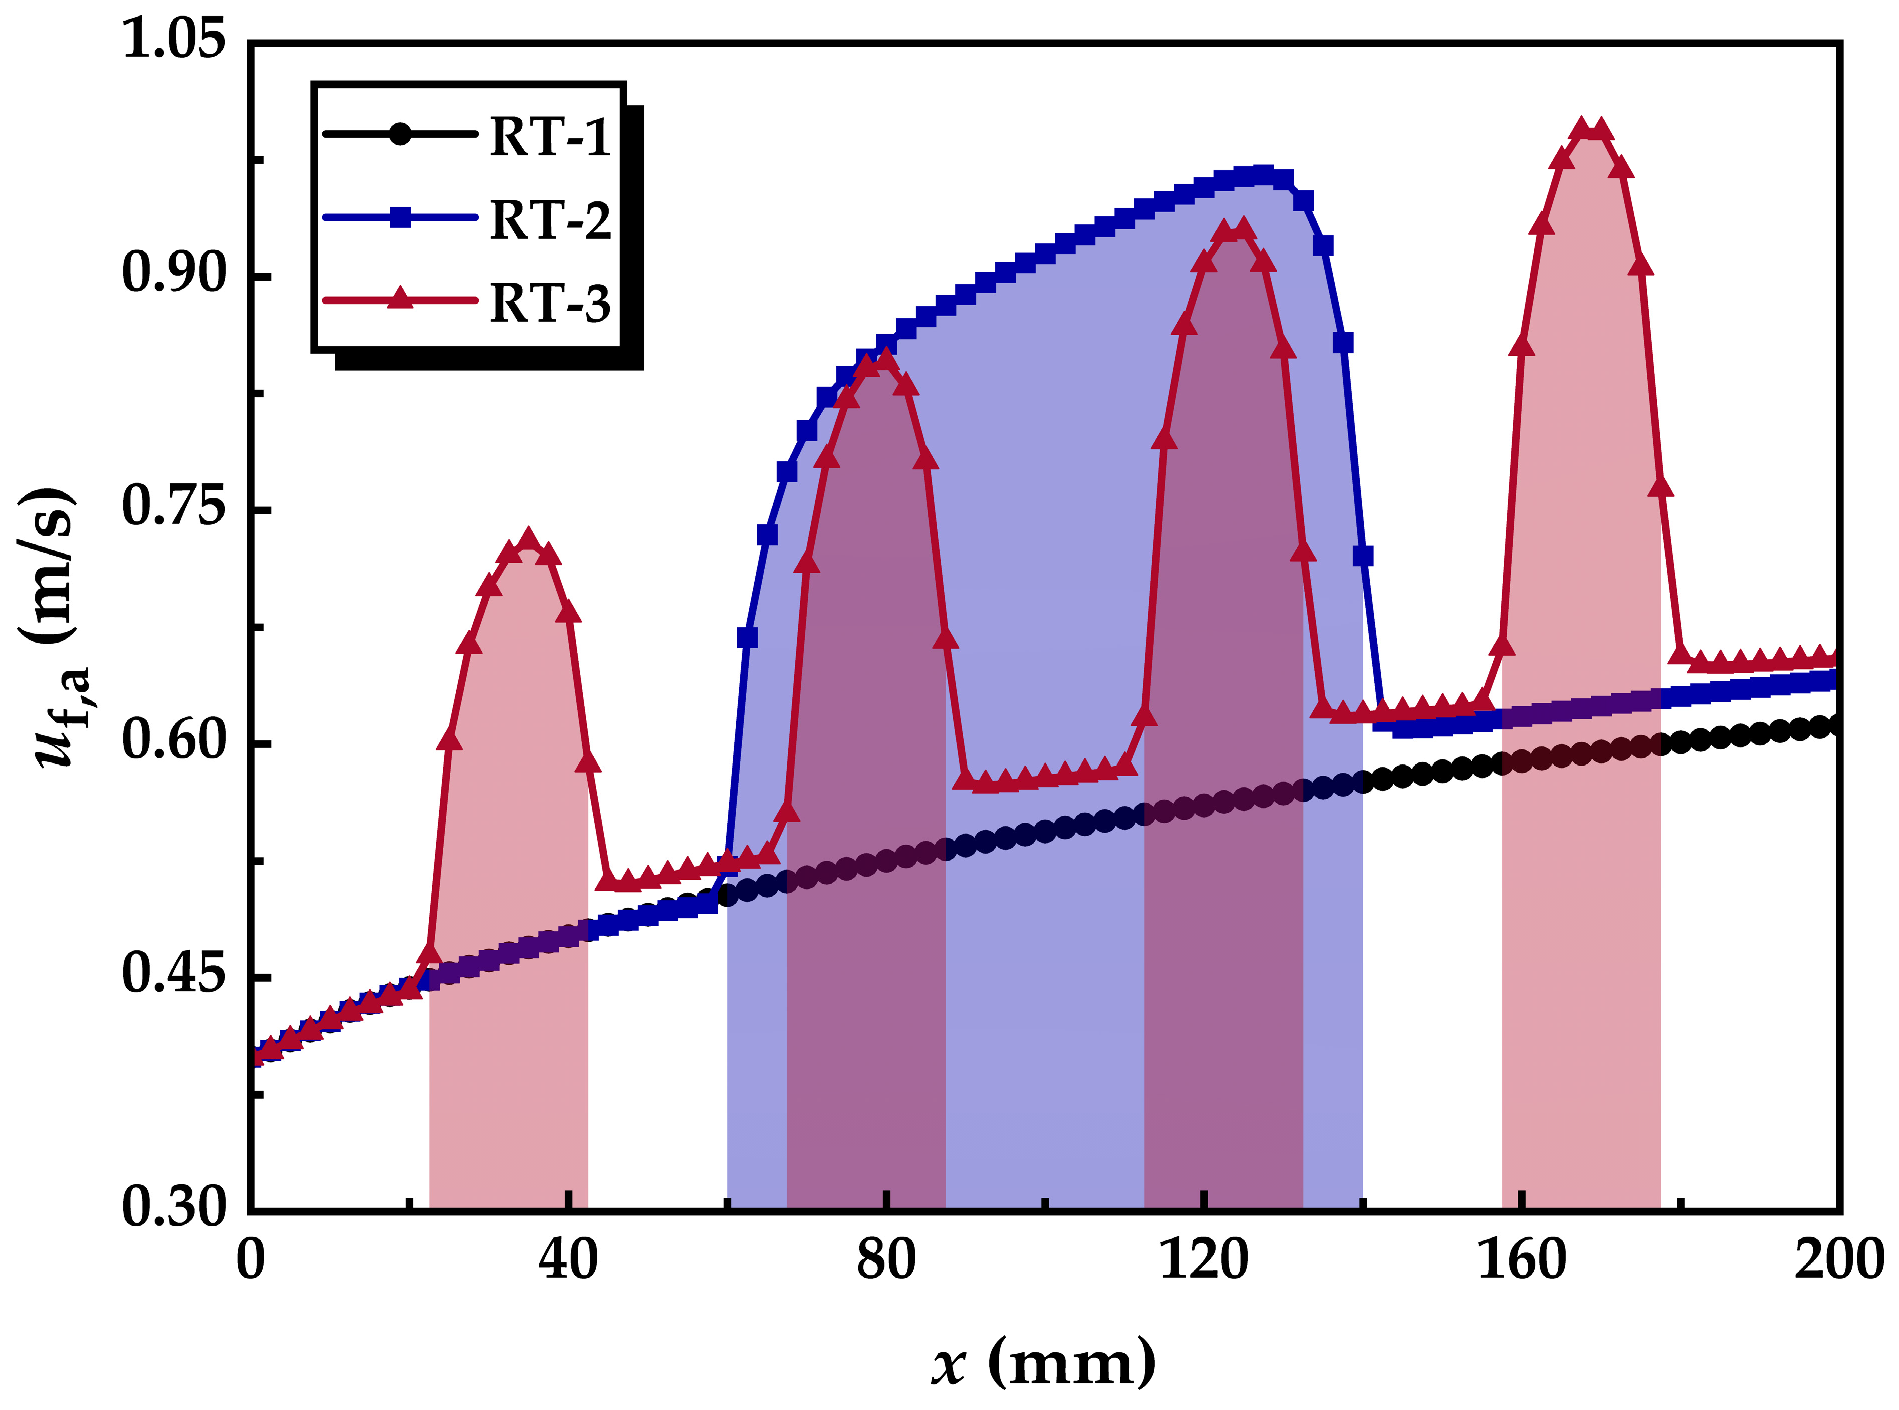
Figure 6 illustrates the axial distribution of the average velocity of the gas mixture for reforming tubes with different internal structures. As shown in the figure, the average gas velocity in RT-1 increases along the flow direction. Two contributing factors can explain this phenomenon. First, the average gas temperature rises progressively due to the temperature gradient between the tube wall and the gas. Second, as the reforming reaction proceeds, the proportion of low-density hydrogen in the gas mixture increases. Together, these effects cause a reduction in the average density of the gas mixture, and according to the continuity equation, this leads to a corresponding increase in flow velocity. Moreover, due to the superior heat transfer and reaction characteristics of RT-2 and RT-3, the average outlet velocities in these configurations are also higher than that of RT-1.
Taking RT-2 as an example, Figure 6 shows that the average velocity of the gas mixture increases sharply over a short distance as it enters the metal foam segment. This phenomenon is attributed to the flow diversion effect. The relatively low flow resistance in the annular metal foam gas channel promotes radial dispersion of the gas mixture, significantly increasing the mass flow proportion through this region. As a result, most of the gas mixture accelerates within the foam pores, leading to a rapid rise in average velocity. In the central region of the metal foam segment, the average velocity continues to increase, with a growth rate significantly higher than that in RT-1. This can be explained by two factors. First, as shown in Figure 10, the gas temperature within the annular channel rises rapidly, causing a sharp decrease in density and rapid volumetric expansion. Second, as shown in Figure 13, the primary net reaction rate increases significantly in the catalyst bed at higher radial positions within the foam segment of RT-2, and the resulting hydrogen production further drives the gas flow acceleration within the channel.

3.1.2. Flow Disturbance Distribution

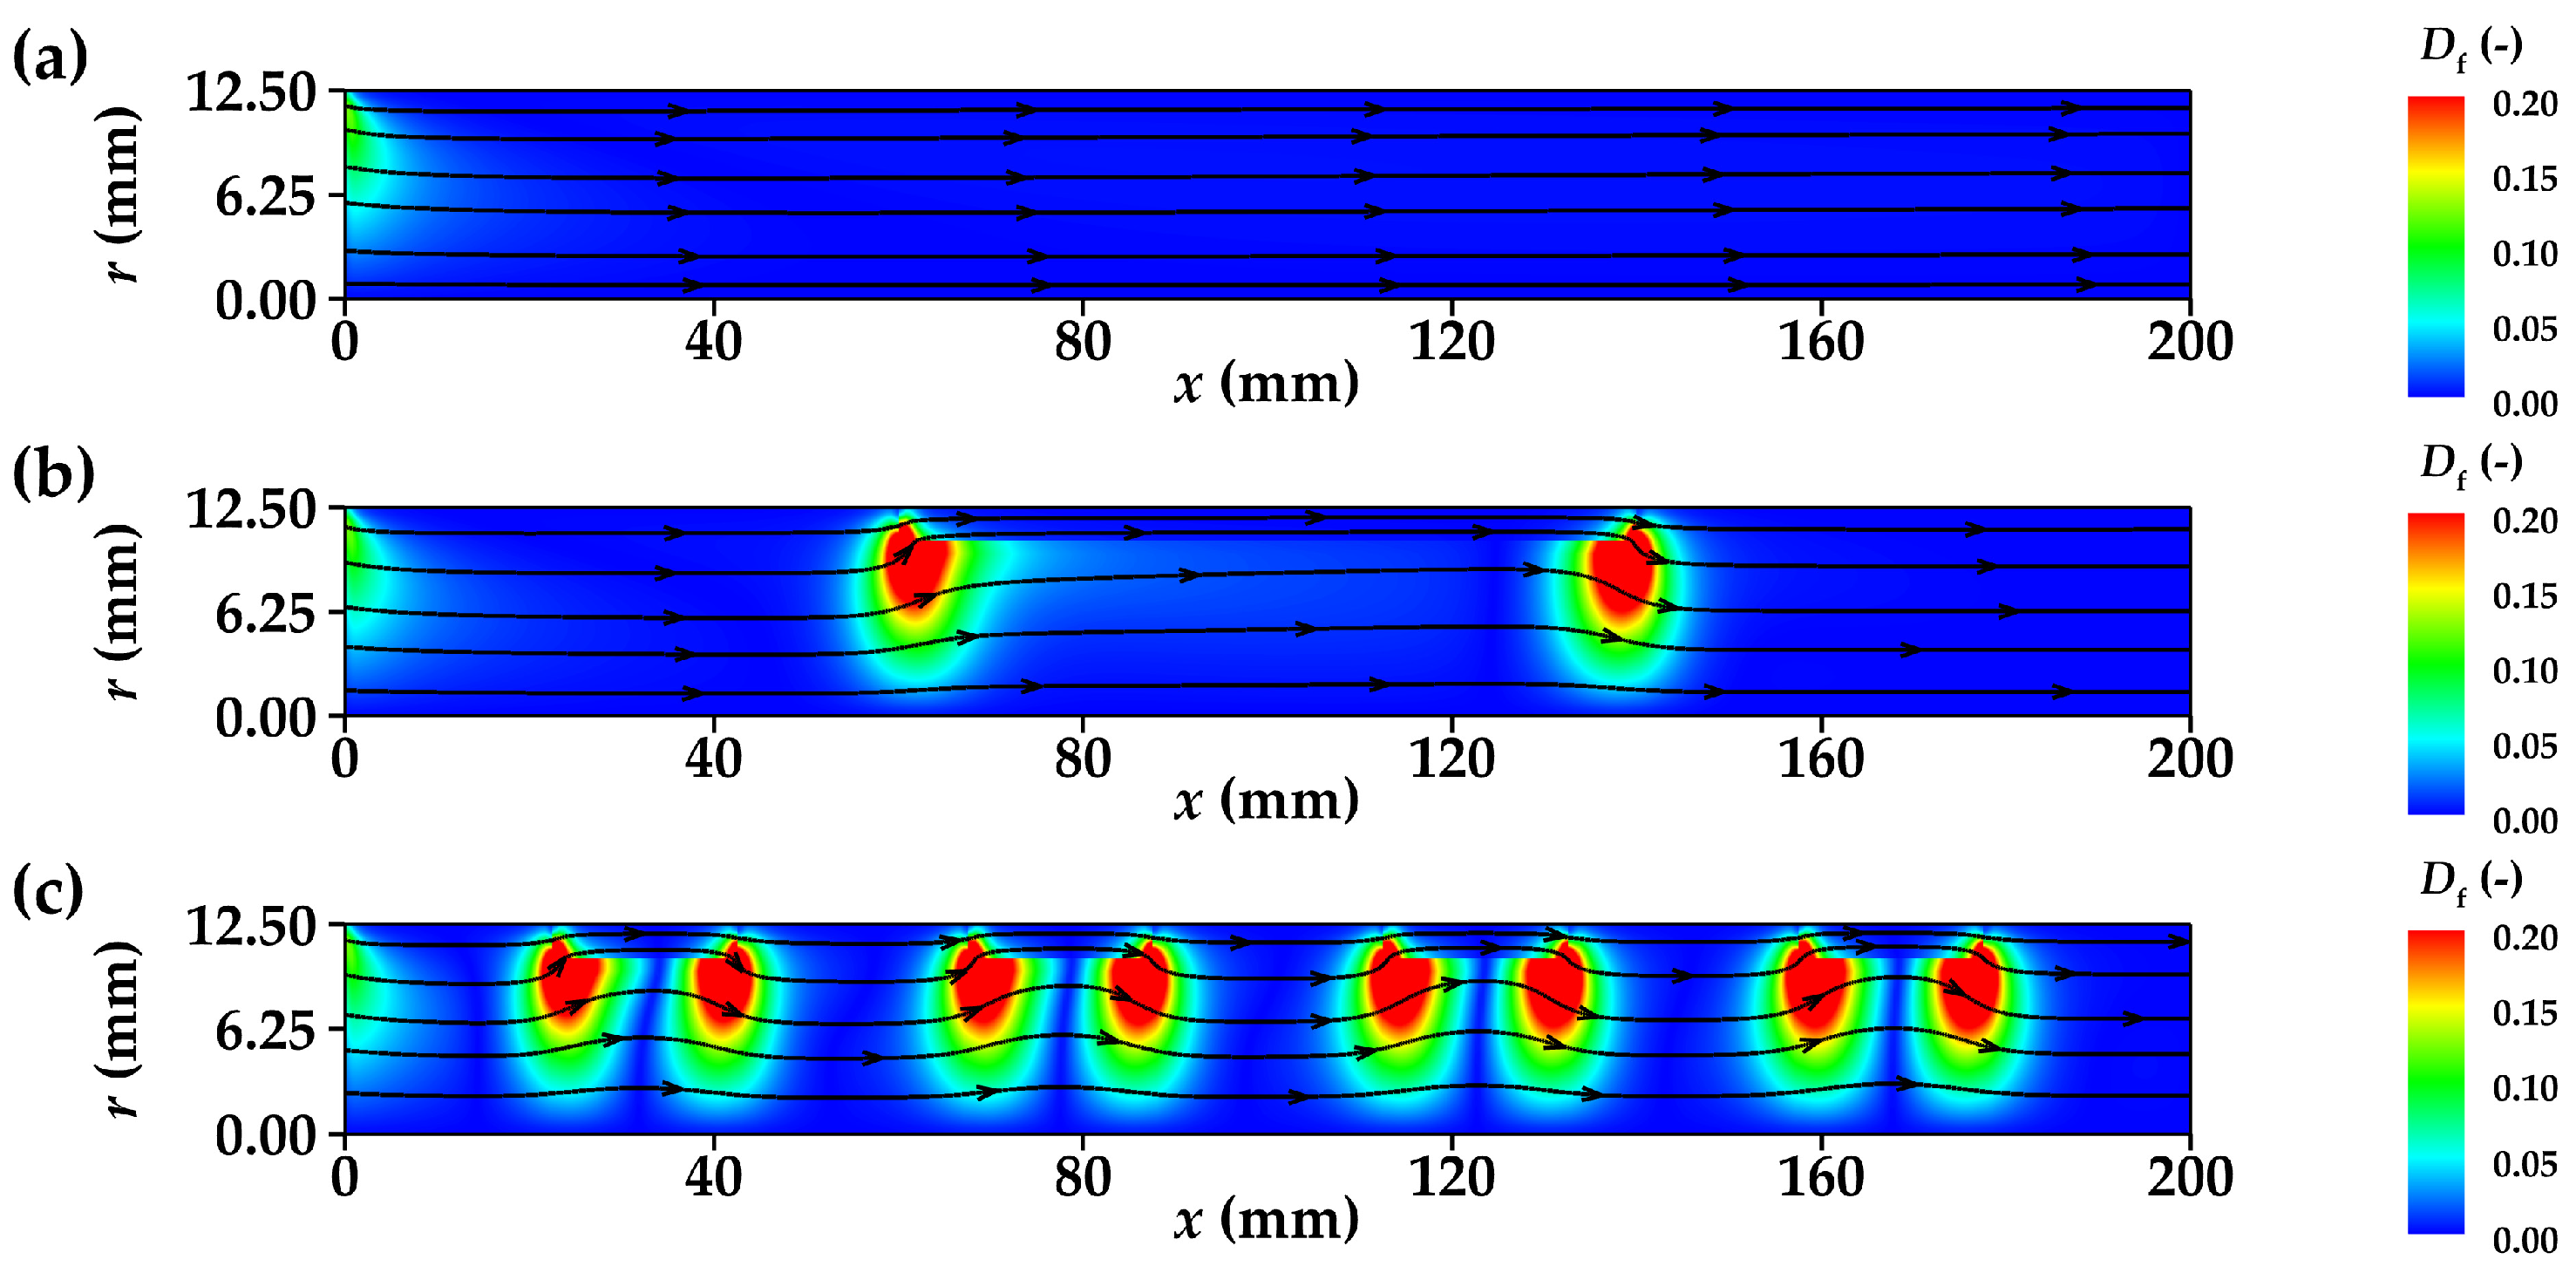
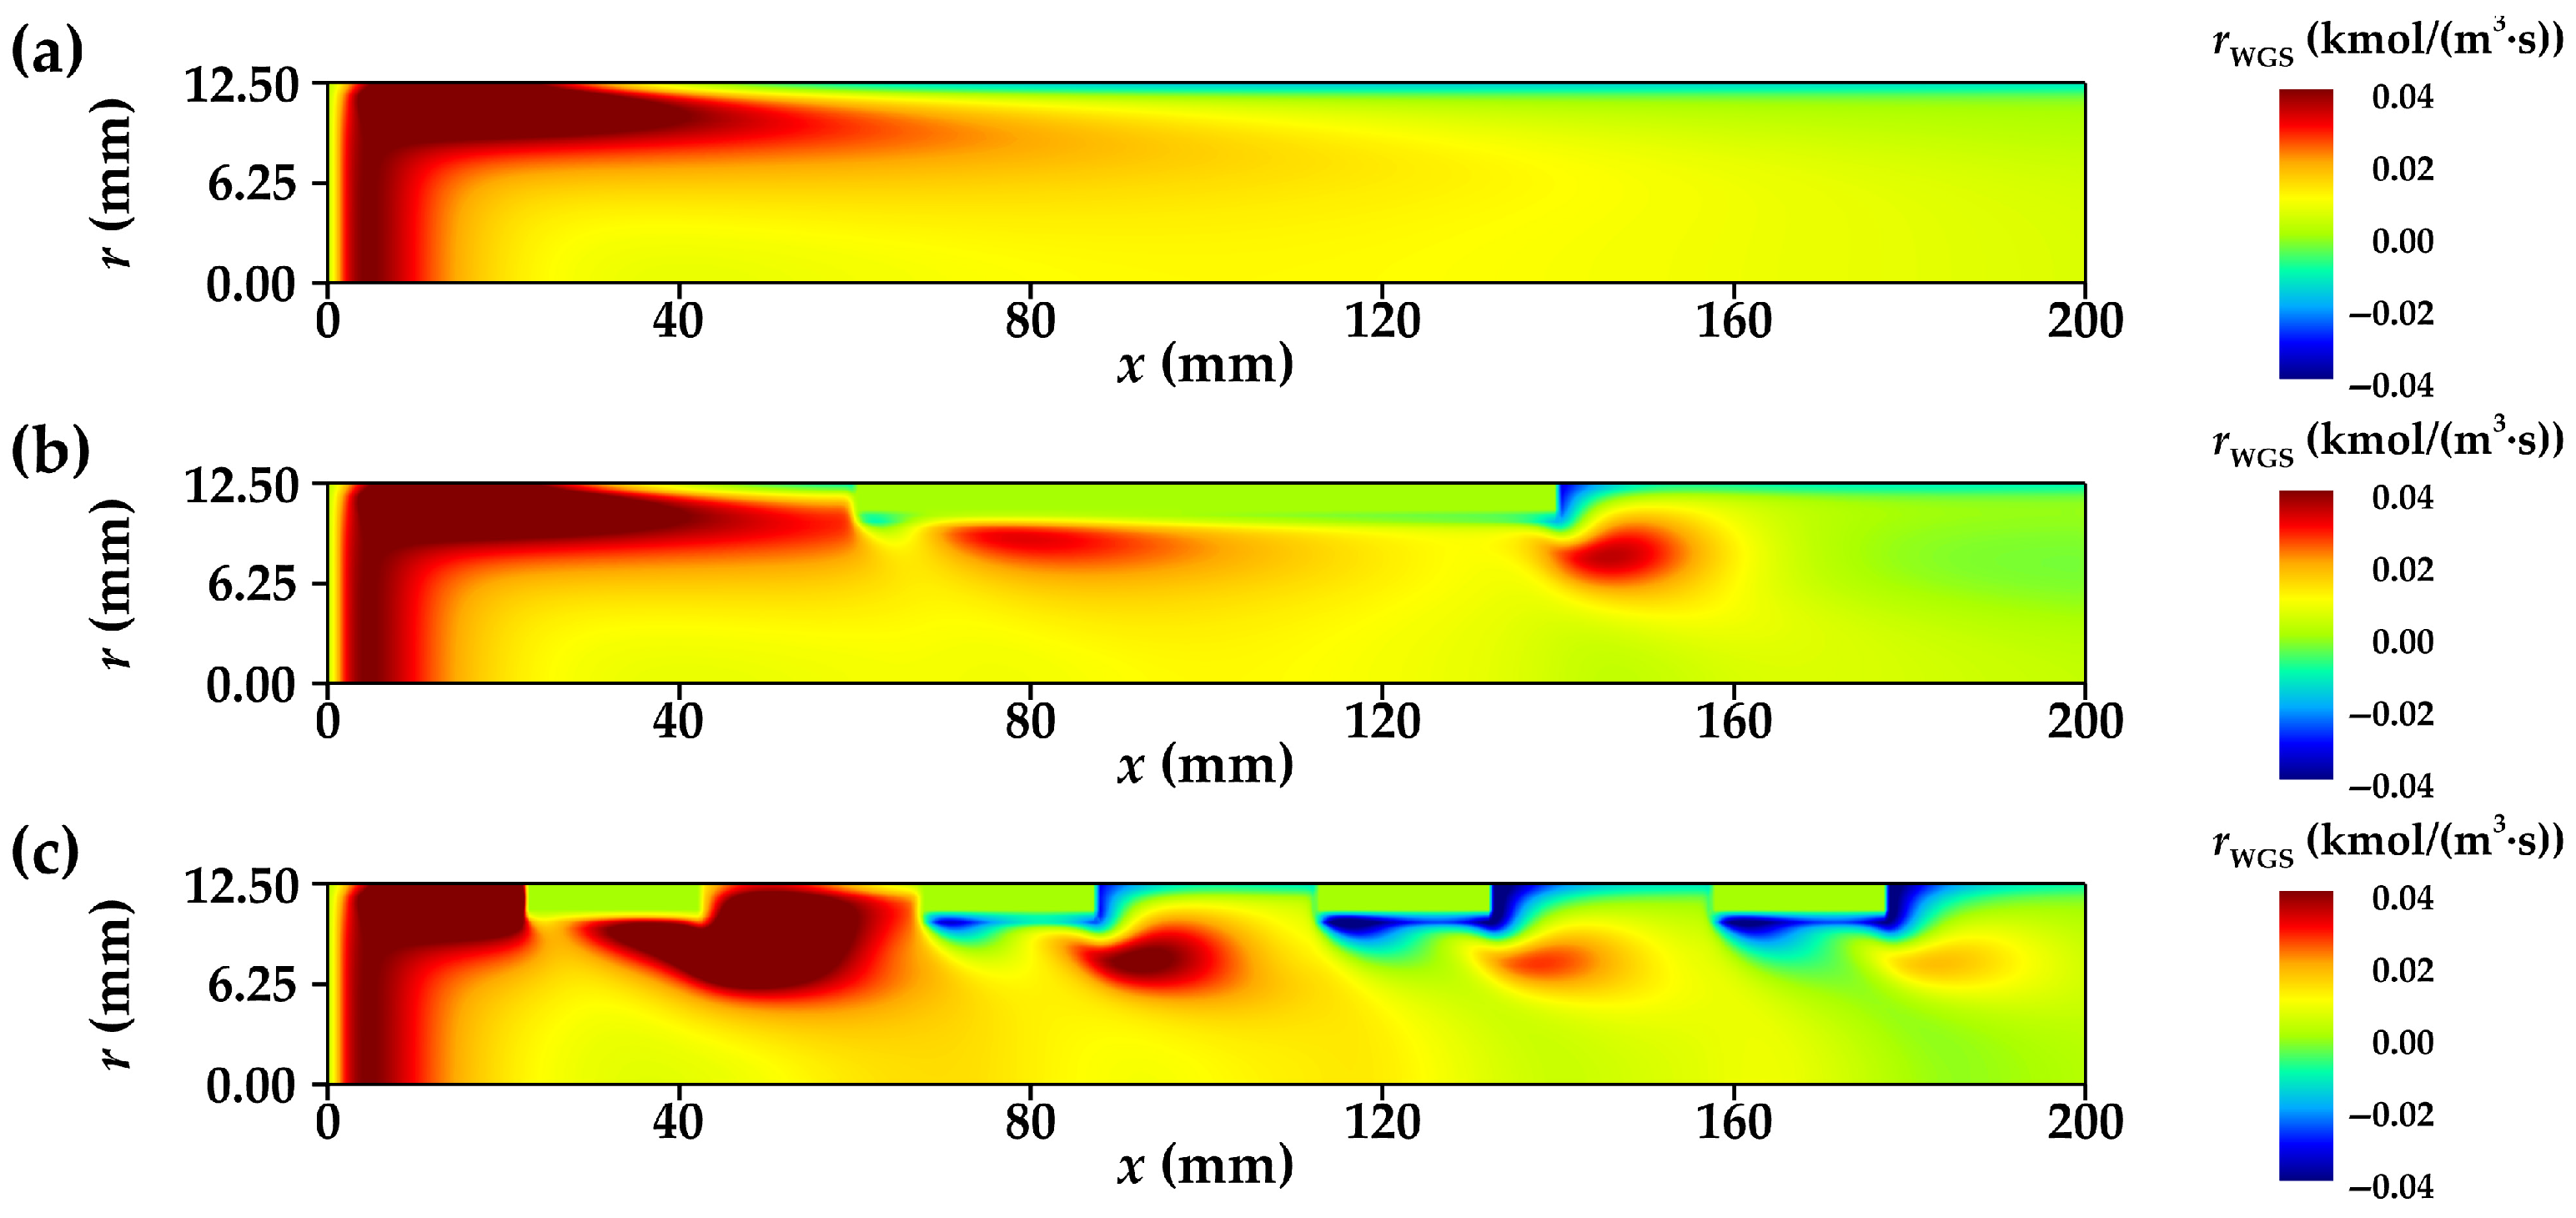
In this study, a dimensionless parameter Df (defined in Equation (23)) is introduced to quantitatively evaluate the flow disturbance intensity of the gas mixture within the different reforming tubes. Figure 7 presents the flow disturbance intensity contours for the gas mixture in reforming tubes with various internal structures. It is observed that relatively weak flow disturbances occur in the inlet sections of all reforming tubes. As shown in Figure 10, a significant radial temperature gradient exists near the wall region of the inlet section, leading to pronounced thermal expansion and the generation of radial velocity components directed toward the tube center. Additionally, Figure 13 indicates that the net reaction rate of the primary reforming reaction is relatively high near the inlet wall, and the volumetric expansion associated with the reaction further intensifies fluid expansion. The combined effects of thermal expansion and reactive volumetric growth give rise to observable flow disturbances in the inlet region.
D f = u f , r / u f , x 2 + u f , r 2
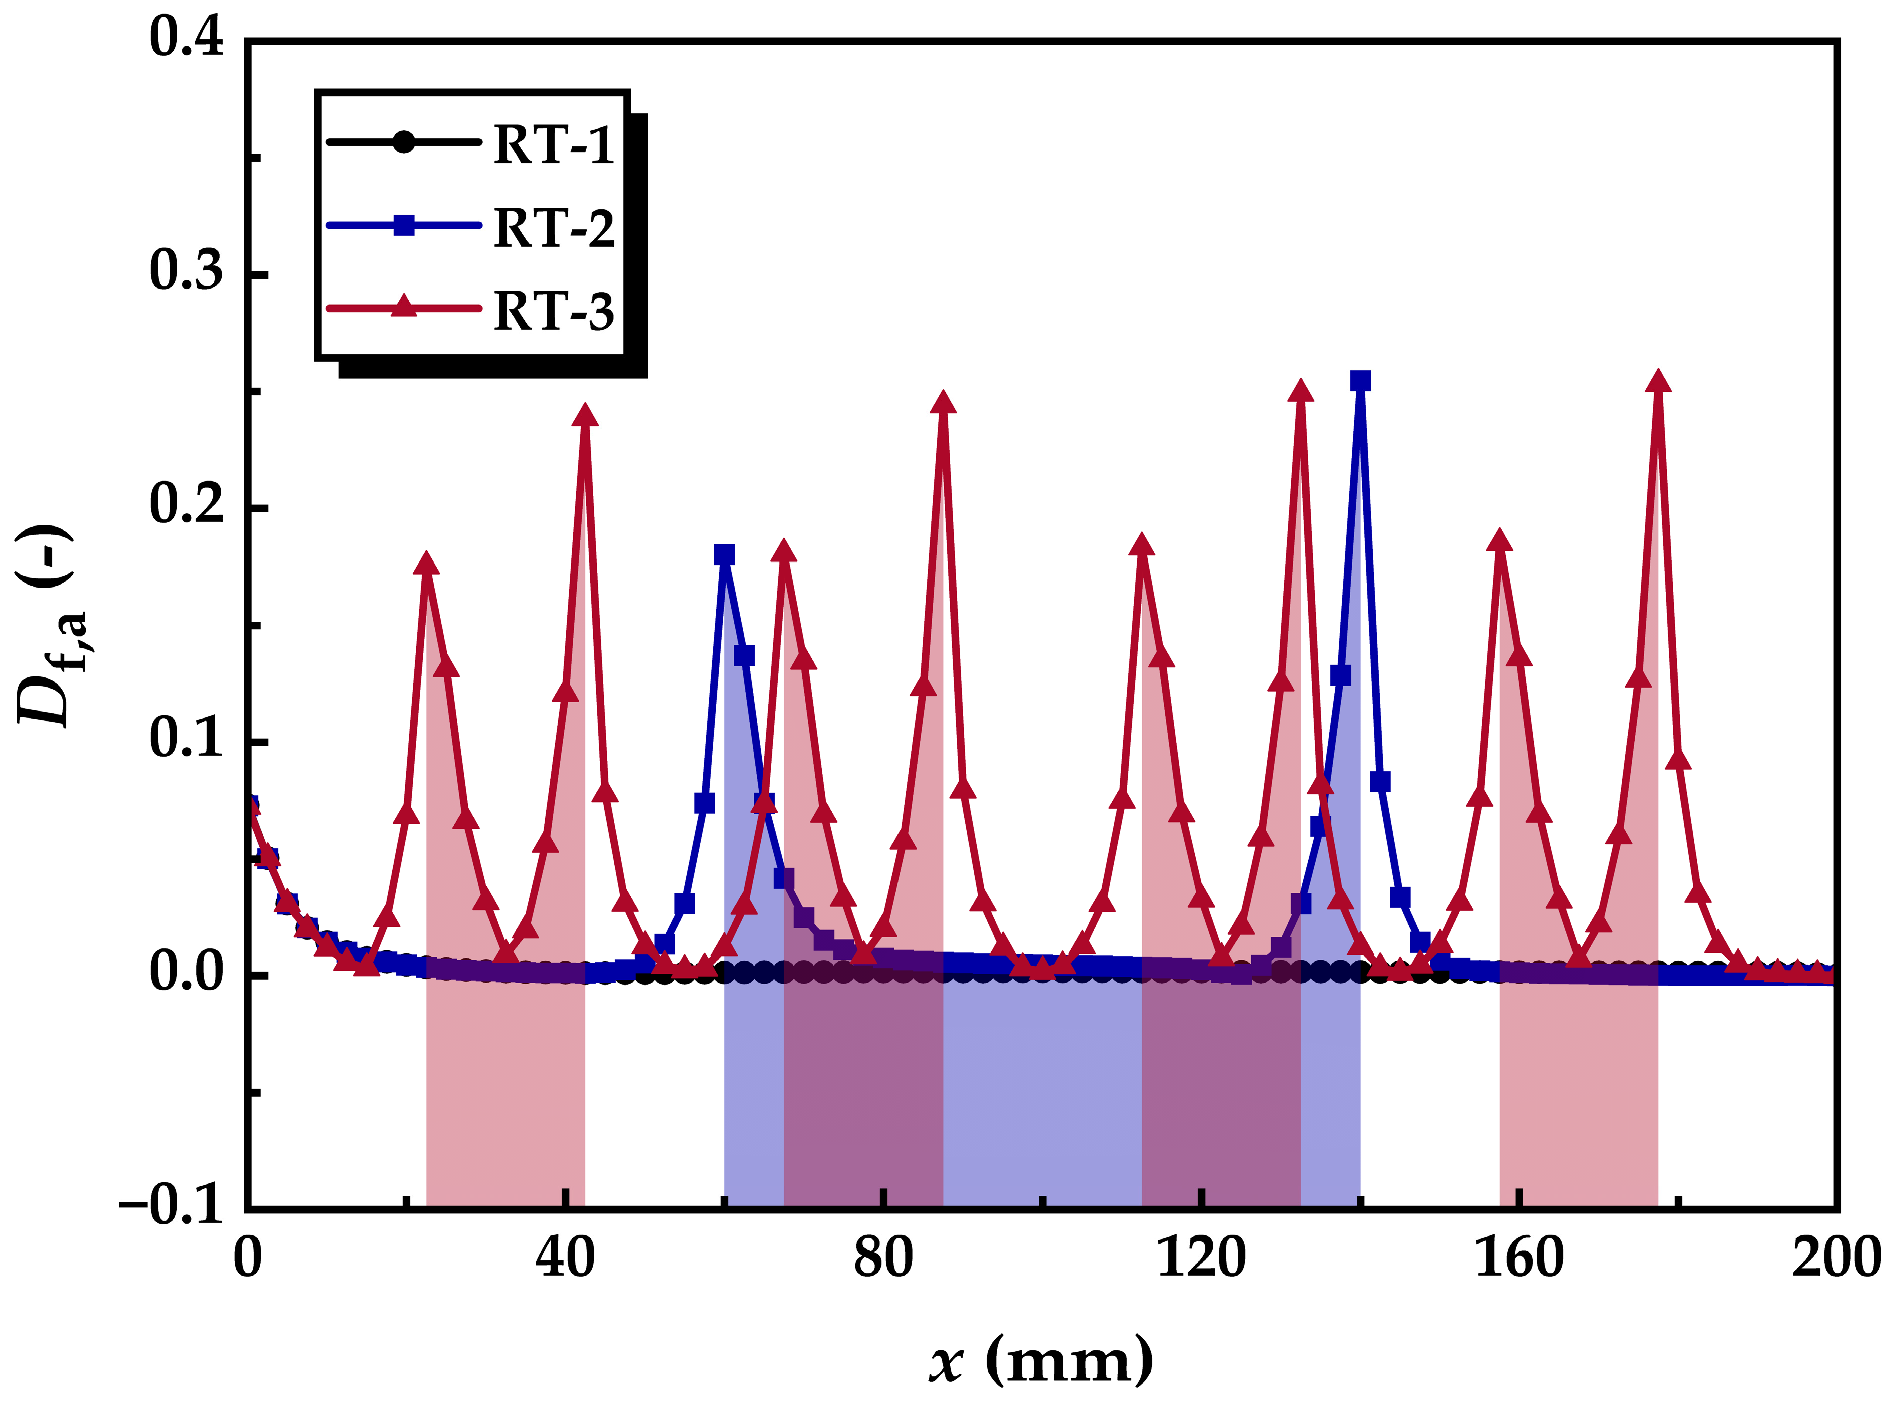
Figure 7b,c show intense flow disturbances near the annular metal foam gas channels. These disturbances are primarily caused by the flow redistribution induced by the presence of the foam structure. The disturbance intensity in this region is significantly higher than that in the inlet section and extends across a wide radial range within the reforming tube. Furthermore, the axial distribution of average disturbance intensity shown in Figure 8 confirms that the disturbances caused by flow diversion are several times greater than those arising from thermal and reactive expansion. These flow disturbances also extend over a considerably larger axial range.

3.1.3. Pressure Drop

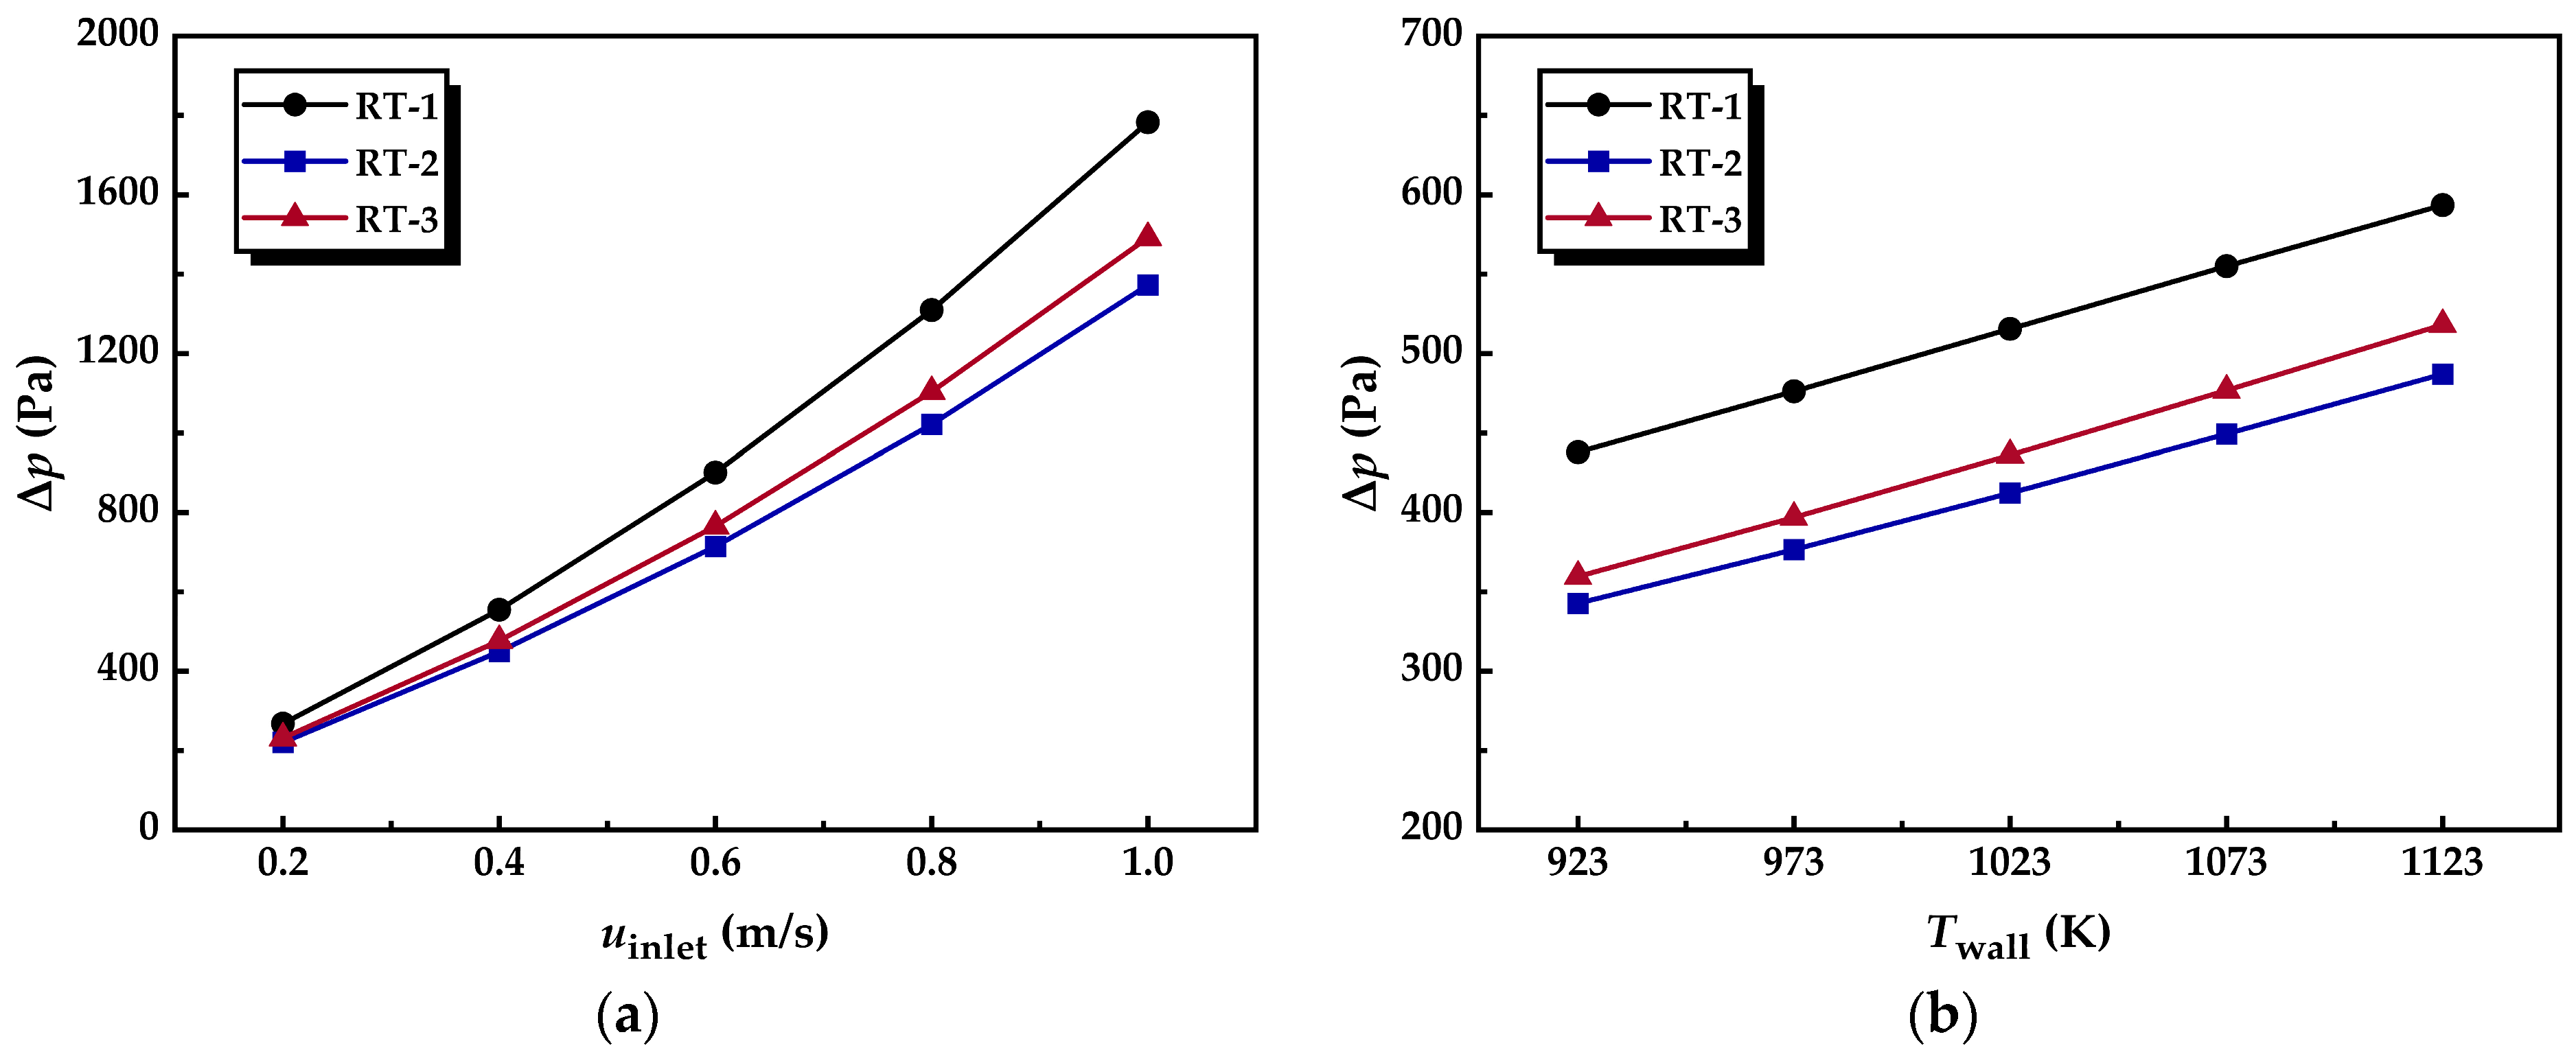
The pressure drop of the gas mixture flowing through the reforming tube is a key flow performance metric in the methane steam reforming process. Its magnitude directly influences the economic efficiency of hydrogen production. Figure 9a compares the pressure drop behavior of reforming tubes with different internal structures as a function of inlet feed gas velocity. The figure shows that the pressure drop increases with rising inlet velocity for all reforming configurations. This is due to the presence of catalyst particles and metal foam skeletons, where the flow resistance within their porous structures increases proportionally with velocity. As a result, the pressure drop rises as the inlet velocity increases. The annular metal foam gas channels in RT-2 and RT-3 exhibit high porosity and low flow resistance, resulting in consistently lower pressure drops than RT-1 at all inlet velocities. Moreover, the more frequent flow disturbances in RT-3 lead to greater local resistance losses, making its pressure drop slightly higher than that of RT-2.
Notably, as the inlet gas velocity increases, the slopes of the RT-2 and RT-3 curves in Figure 9a are significantly lower than that of RT-1. This indicates that incorporating annular metal foam structures increasingly reduces pressure drop at higher flow rates. As previously discussed, increasing in inlet velocity amplifies the radial non-uniformity of flow resistance within the foam segment, thereby intensifying the flow redistribution effect. For example, in RT-2 at the axial location of x = 100 mm, the mass flow fraction passing through the annular metal foam channel accounts for 61.8%, 62.2%, and 64.4% of the total flow when the inlet velocity is 0.2 m/s, 0.6 m/s, and 1.0 m/s, respectively. These results demonstrate that higher inlet velocities enhance the flow diversion effect, directing a greater proportion of the gas mixture into the metal foam pores. This mechanism underpins the increasingly pronounced pressure drop reduction observed in RT-2 and RT-3 at elevated inlet velocities.
Figure 9b illustrates the variation in pressure drop with increasing wall temperature for all reforming tube configurations. It is evident that the pressure drop increases as the wall temperature rises. This phenomenon is attributed to the intensified heat transfer between the tube wall and the gas mixture at elevated wall temperatures, which accelerates the temperature rise of the fluid. The resulting increase in fluid temperature influences flow resistance through two main mechanisms. First, higher fluid temperatures increase the molecular viscosity of the gas mixture, thereby enhancing viscous drag. Second, the elevated temperature promotes greater hydrogen production via the reforming reaction in the inlet region, which raises the flow velocity at the front of the tube, further increasing resistance in the porous media. Under the combined influence of these two effects, the pressure drop in all reforming tubes increases with wall temperature.
The enhanced viscosity and increased hydrogen generation suppress radial flow from lower to higher radial positions, weakening the flow diversion effect as wall temperature increases. Numerical simulations show that at the axial location x = 100 mm in RT-2, the proportion of gas flowing through the annular metal foam channel decreases from 64.4% at 923 K to 62.3% at 1023 K and 60.3% at 1123 K. As the flow diversion effect weakens, less gas enters the annular foam channel, reducing the pressure drop advantage for RT-2 and RT-3 at elevated wall temperatures. For instance, in RT-2, the pressure drop is 21.7%, 20.1%, and 17.9% lower than that of RT-1 at wall temperatures of 923 K, 1023 K, and 1123 K, respectively.

3.2. Heat Transfer Characteristics

3.2.1. Temperature Distribution

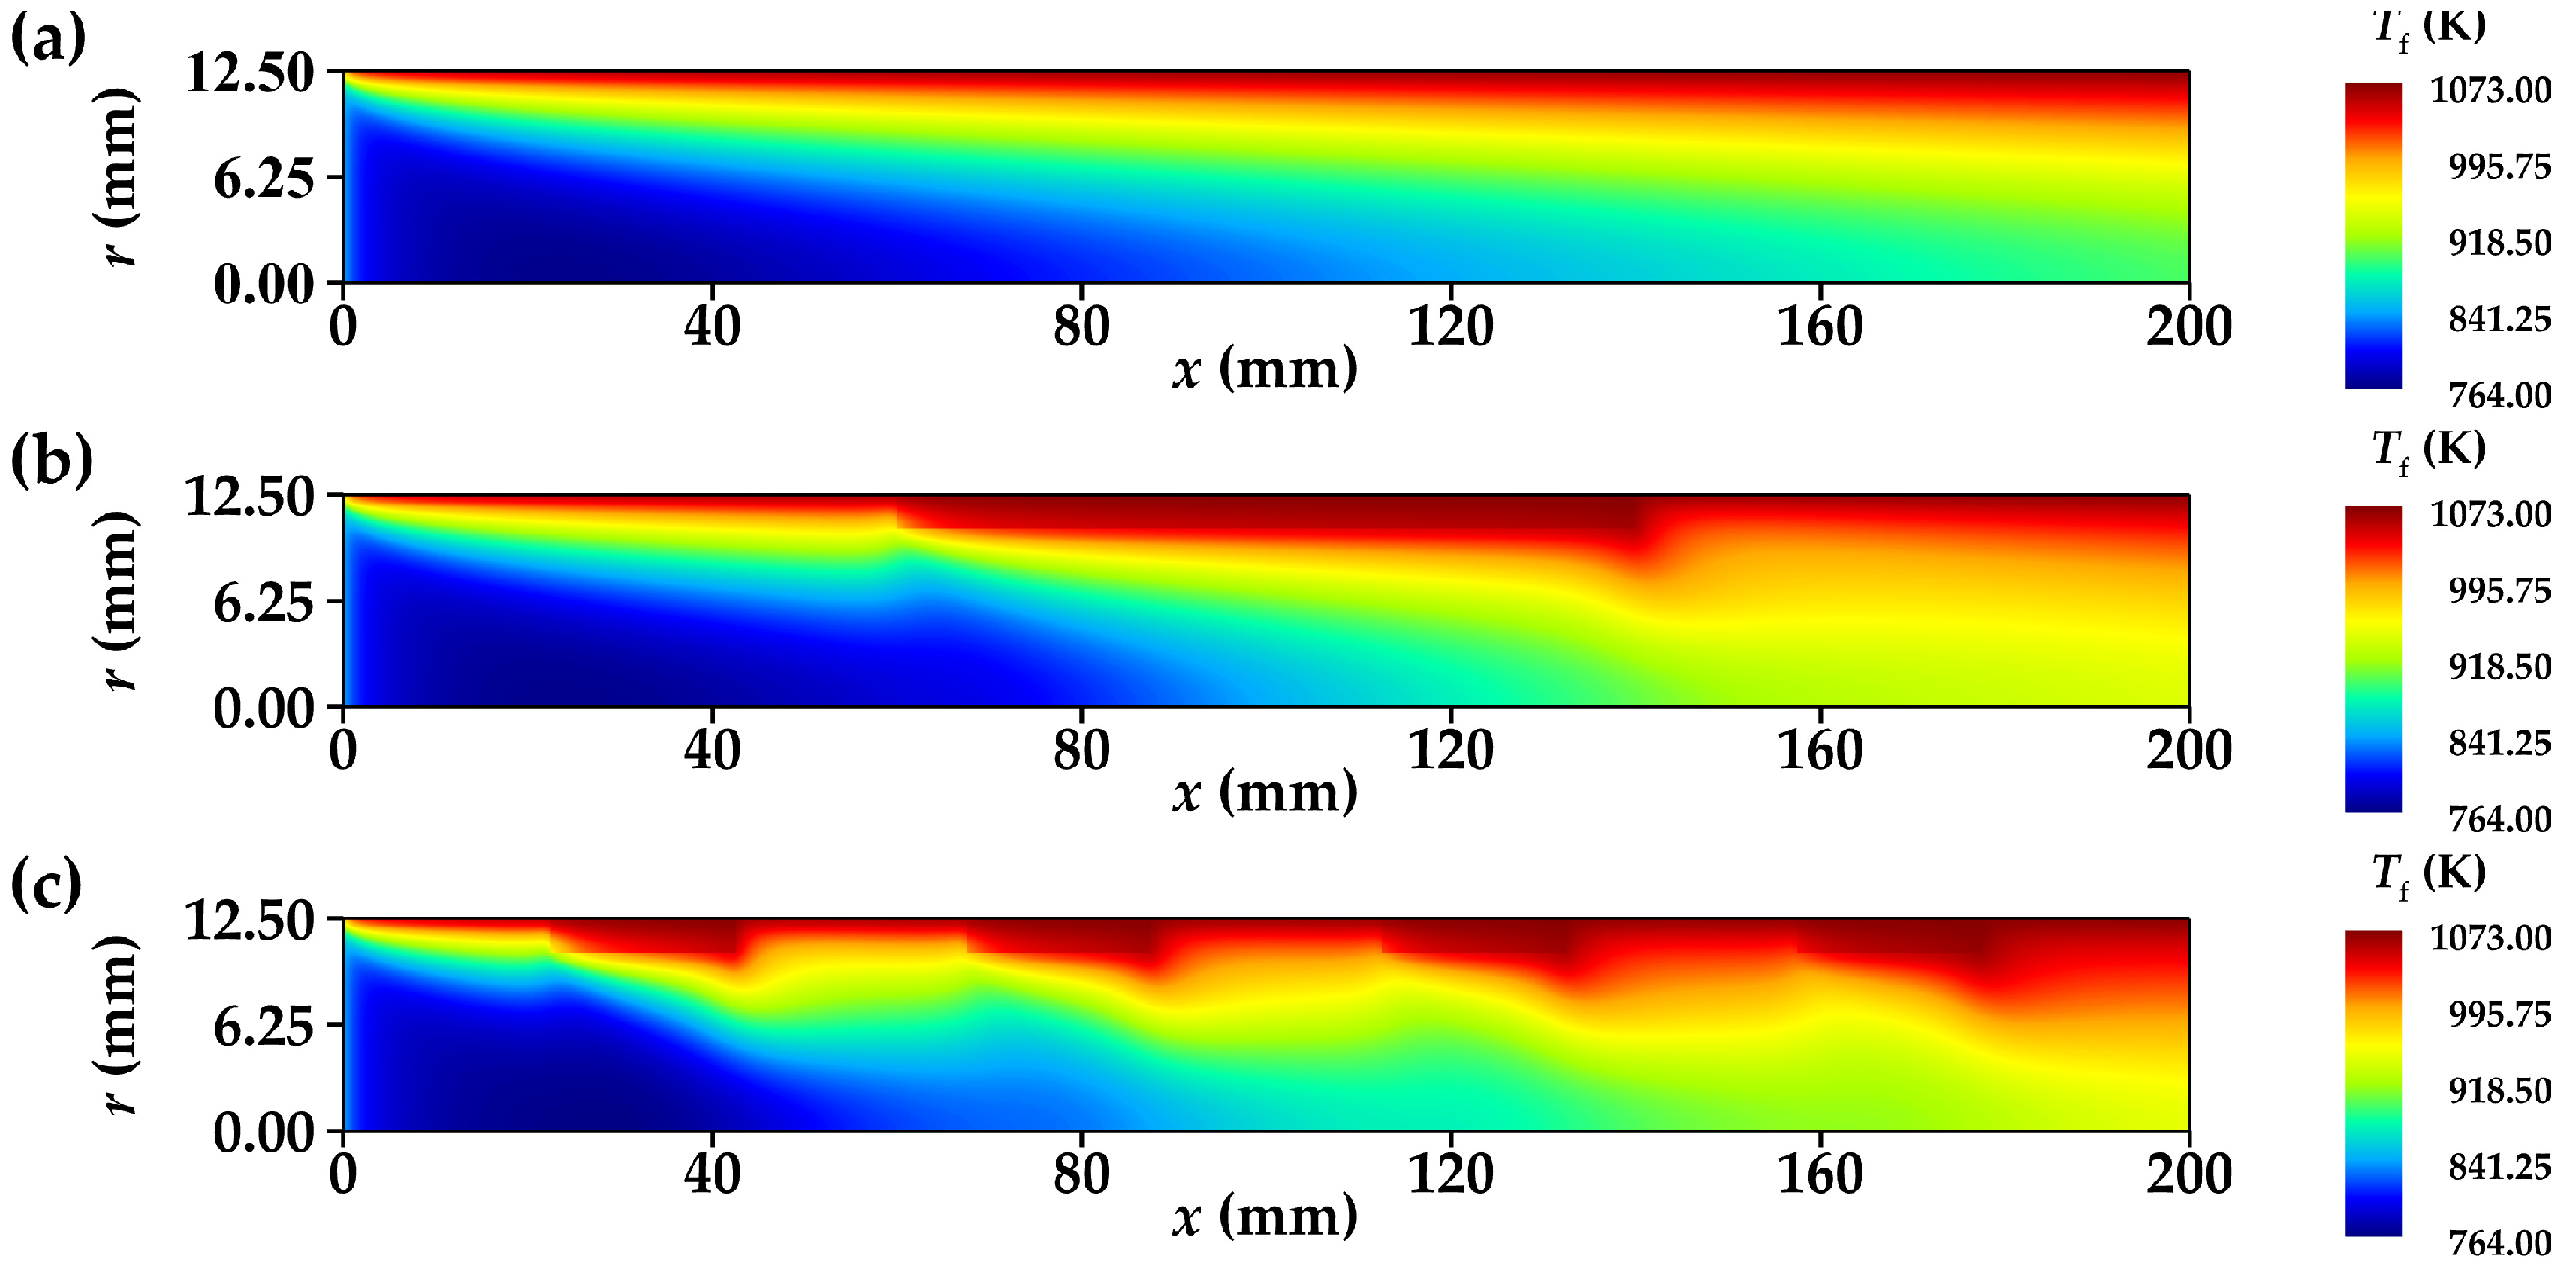
Figure 10 presents the temperature contours of the gas mixture inside each reforming tube. The figure shows that in the inlet section of each reformer tube, the gas temperature drops sharply at lower radial positions, forming a cold spot. According to Figure 13, the net reaction rate of the endothermic reactions in the inlet section is relatively high, indicating that a substantial amount of heat is required to sustain these reactions. Due to the presence of the catalyst bed, heat transfer in the inlet section primarily relies on thermal conduction. Compared to regions near the tube wall, the lower radial zones face higher radial thermal resistance, resulting in insufficient heat supply from the external tube wall to meet the endothermic demand. Under these conditions, the gas mixture at low radial positions must consume its internal energy to sustain the reaction, leading to a rapid drop in temperature. Similarly, in Figure 10b,c, the upward shift of the cold spots toward higher radial positions within the metal foam section and at the outlet of the annular foam gas channel is also caused by the mismatch between the endothermic reaction and radial heat transfer.
After the reforming tube is equipped with an annular metal foam gas channel, the improvement in heat transfer performance is mainly reflected in the following three aspects.
First, the flow diversion effect increases the flow rate within the annular metal foam gas channel. Since the macroscopic thermal conductivity of the metal foam is higher than that of the catalyst bed, more of the gas mixture is sufficiently heated inside the annular channel. This is reflected in Figure 10b,c by significantly higher fluid temperatures in the metal foam region, and in Figure 11a by the noticeably higher average fluid temperature along the axial section corresponding to the metal foam segment compared to RT-1.
Second, within the metal foam segments of RT-2 and RT-3, the fluid temperature in the high-radial catalyst bed adjacent to the annular channel is significantly higher than that in the same position of RT-1. This indicates that the annular metal foam gas channel effectively reduces radial thermal resistance in this tube part.
Third, at the outlet of the annular metal foam gas channel, a sudden increase in flow resistance causes the fluid in the channel to flow radially toward the central axis of the tube. This portion of the fluid has been thoroughly heated, thereby enhancing convective heat transfer in the reformer section downstream of the metal foam segment. This is evidenced in Figure 10b,c by the expansion of the high-temperature region following the outlet of the annular gas channel.

3.2.2. Distribution of Heat Flux Density
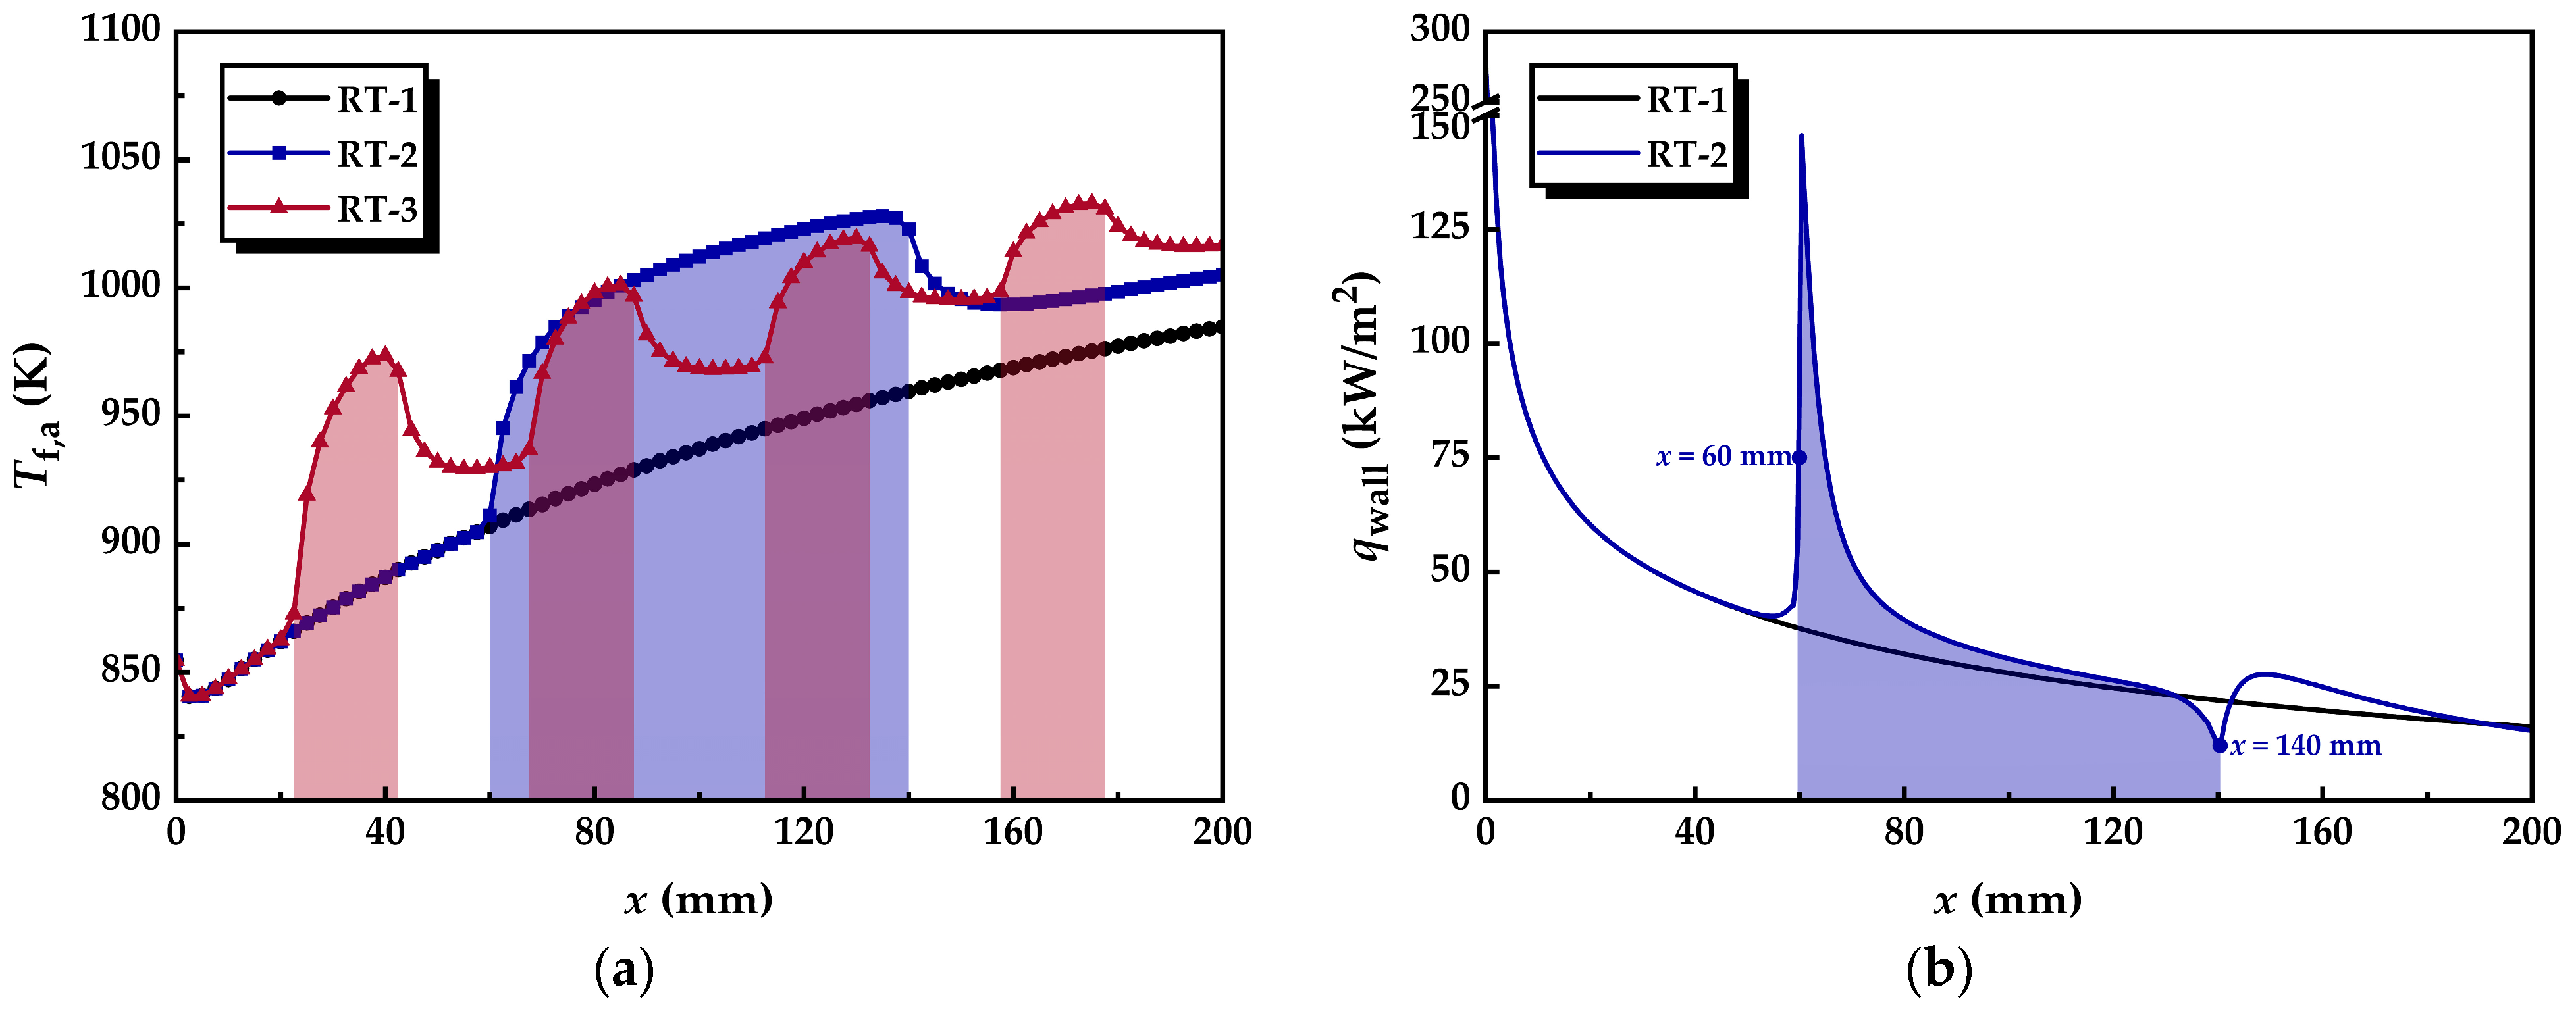
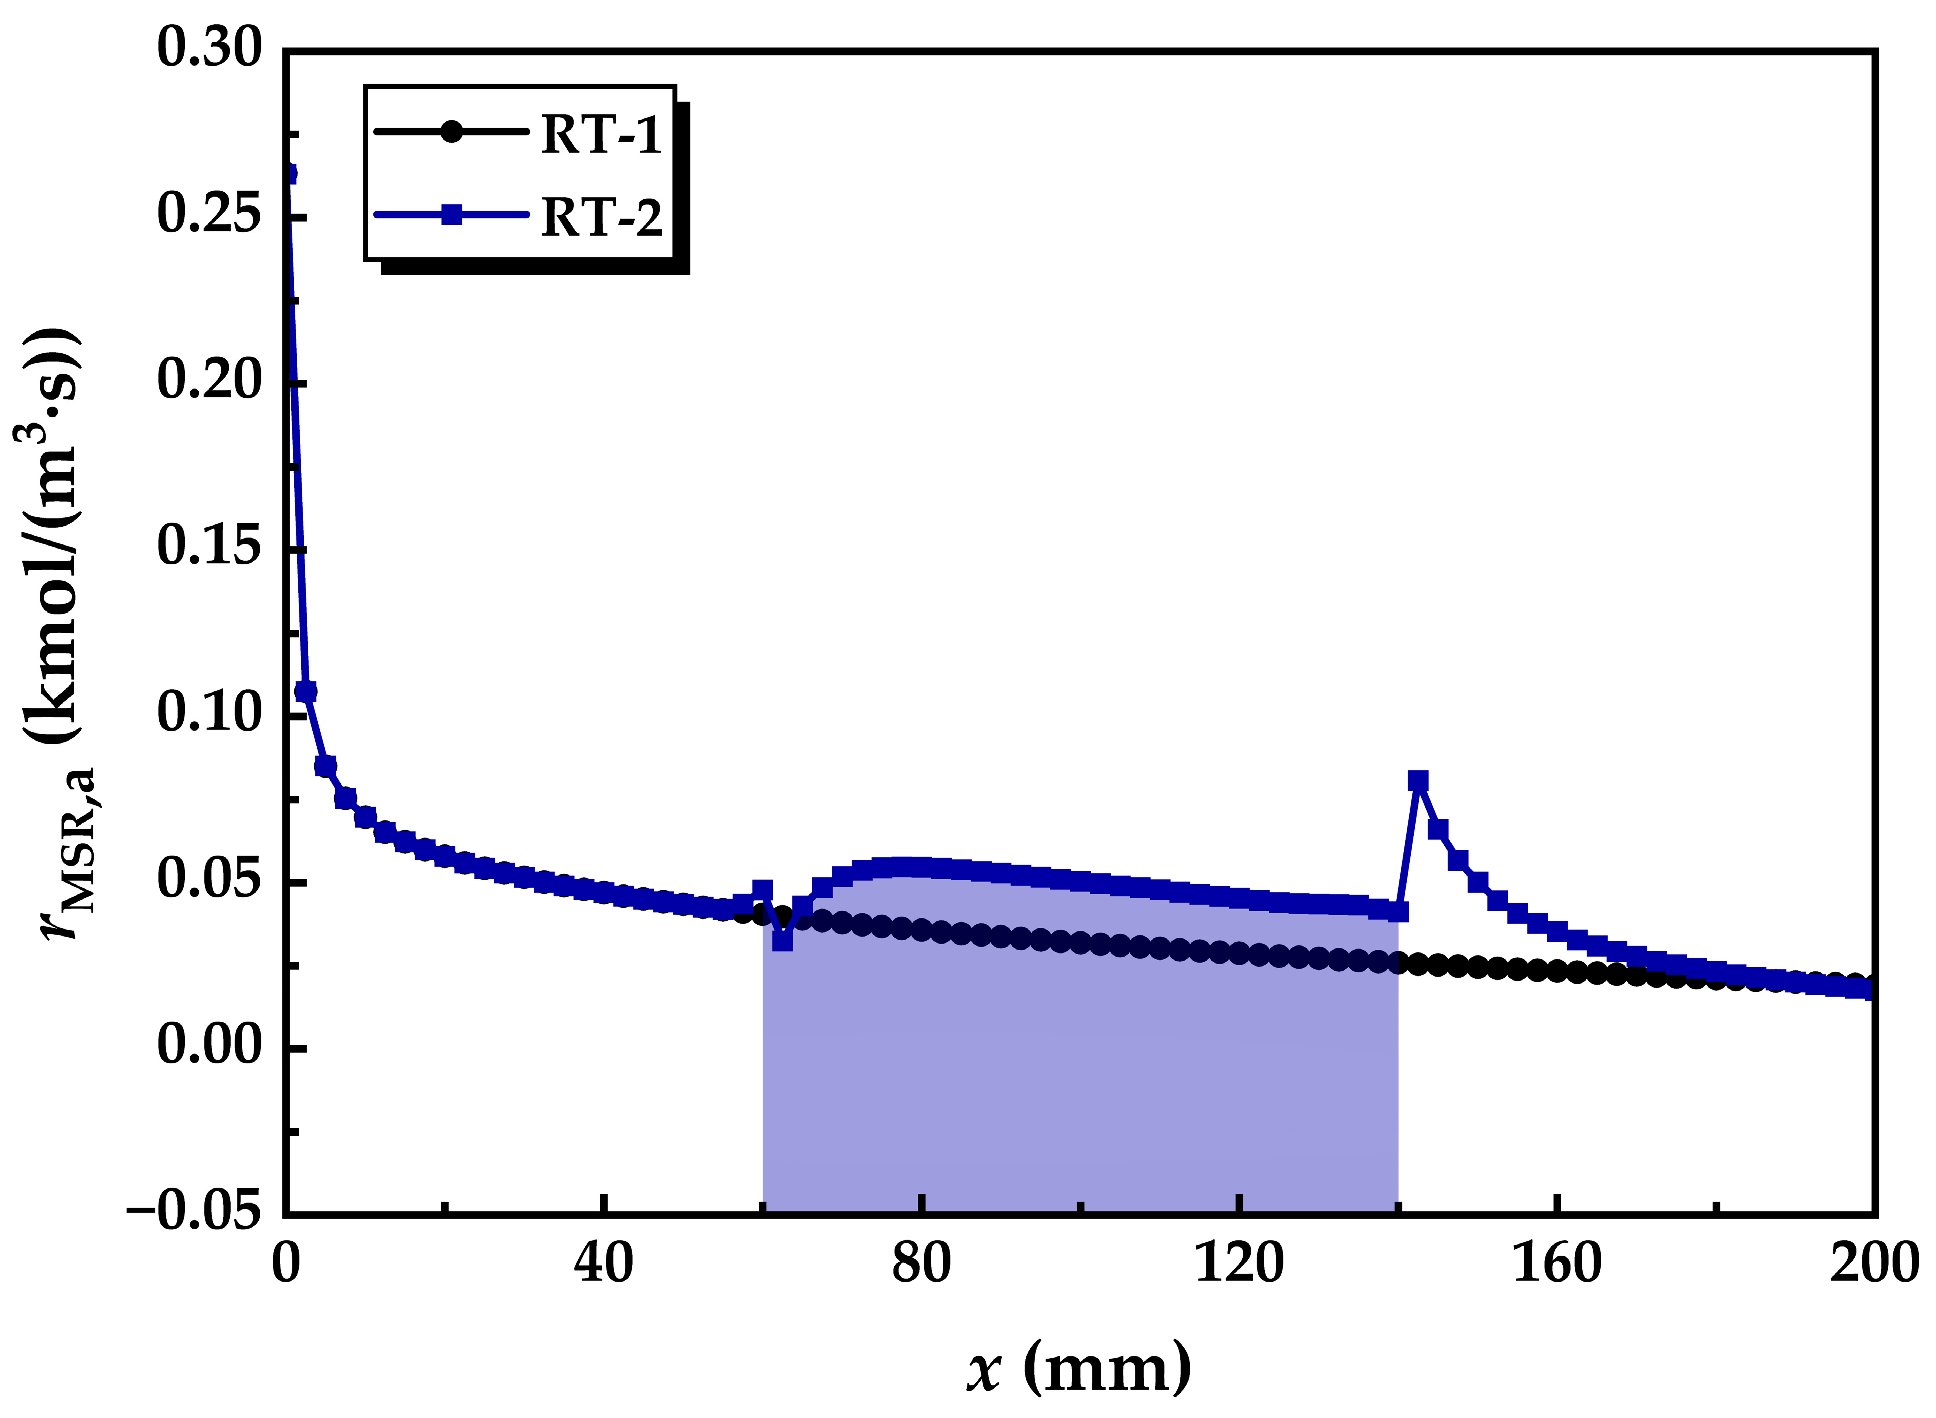
Figure 11b compares the distribution curves of wall heat flux in reforming tubes RT-1 and RT-2. In RT-1, the wall heat flux drops sharply at the inlet section and then decreases gradually along the flow direction. This distribution pattern is consistent with the average net reaction rate of the MSR in RT-1, as shown in Figure 14. This indicates that the high wall heat flux at the inlet section of the reforming tube is due to the substantial heat demand of the endothermic reactions, while the sharp decline in heat flux results from the rapid decrease in the average net reaction rate of the MSR.
As shown in the curve of RT-2 in Figure 11b, there is a noticeable increase in wall heat flux just before the fluid enters the metal foam section. This occurs because during the flow redistribution process, fluid from the lower radial region shifts toward the higher radial region, resulting in a local temperature drop and an increase in methane concentration at the upper radial zone. Consequently, the temperature gradient driving heat transfer increases, accelerating the reforming reaction and significantly increasing wall heat flux.
Figure 11. Axial distribution curves of average temperature and heat flux density: (a) average temperature of the gas mixture; (b) heat flux density on the reforming tube wall.
Energies 18 04758 g011
Once the fluid enters the metal foam section, a large portion of the gas mixture is effectively heated within the porous structure, rapidly increasing the wall heat flux. Simultaneously, the intensified endothermic reaction in the upper radial region of the catalyst bed within the metal foam section further contributes to the rise in wall heat flux. However, as the gas mixture within the annular metal foam channel rapidly heats up and the rate of the endothermic reaction subsequently decreases, the wall heat flux gradually declines.
Just before the fluid exits the metal foam section, the wall heat flux in RT-2 is lower than that in RT-1. This is mainly due to two factors. First, the gas flow rate in the catalyst bed of this axial region is lower in RT-2, resulting in reduced heat demand from endothermic reactions. Second, the gas within the annular metal foam channel has a higher temperature, weakening its heat exchange with the tube wall. Once the gas exits the metal foam section, the significantly improved reaction performance leads to a renewed increase in heat demand, which in turn causes the wall heat flux to rise rapidly.

3.2.3. Thermal Resistance

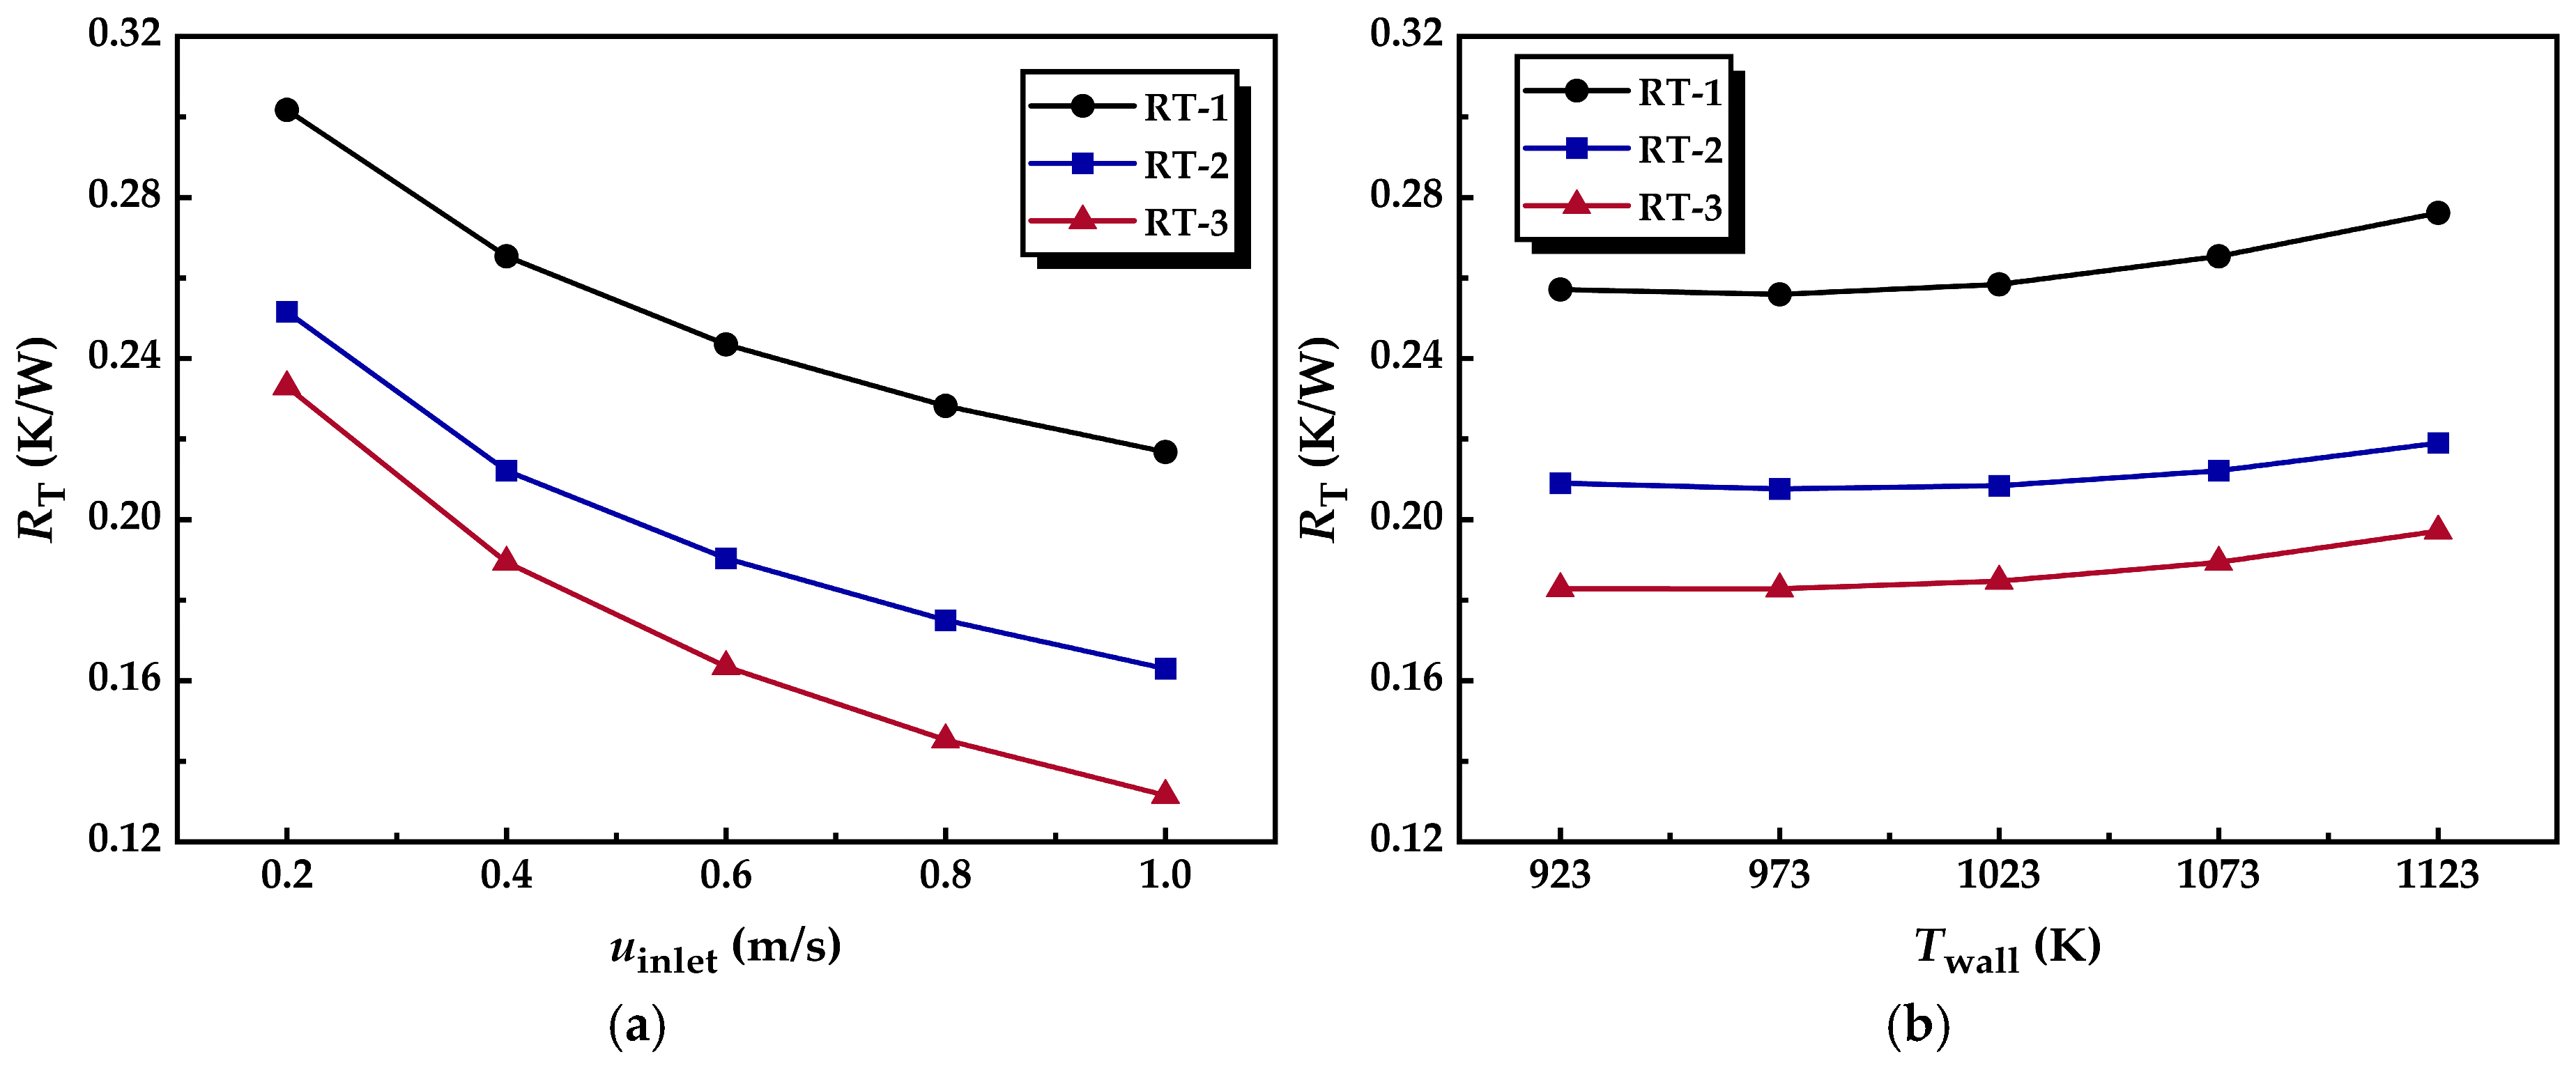
Figure 12a illustrates the variation of thermal resistance in each reforming tube concerning inlet gas velocity. The resistance is calculated using Equation (24), where Tf,a represents the volume-weighted average of the temperature of the gas mixture in the reforming tube. The results indicate that thermal resistance decreases with increasing inlet velocity for all reforming tubes, which is attributed to enhanced convective heat transfer as the gas flow rate increases. Compared with RT-1, RT-2 and RT-3 exhibit lower thermal resistance due to the flow diversion effect. In these configurations, the induced radial flow enhances convective heat transfer to a far greater extent. Furthermore, the higher frequency of flow disturbances in RT-3 leads to more efficient convective heat transfer than RT-2, resulting in even lower thermal resistance. When the inlet velocities are 0.2 m/s, 0.6 m/s, and 1.0 m/s, the thermal resistance of RT-3 is reduced by 22.8%, 32.8%, and 39.3% respectively, relative to RT-1. These results demonstrate that as the inlet velocity increases, the improvement in heat transfer performance becomes more pronounced in reforming tubes equipped with annular metal foam gas channels. The underlying reason lies in the intensified flow diversion effect at higher inlet velocities, which substantially enhances convective heat transfer.
R T = T wall T f , a / Q wall
Figure 12b shows the variation of thermal resistance in each reforming tube as the reaction temperature increases. It can be observed that the thermal resistance of all reforming tubes increases slightly with rising reaction temperature. On one hand, temperature changes affect the physical properties of the gas mixture, indirectly influencing the overall thermal resistance. On the other hand, higher reaction temperatures accelerate the reforming reaction rate, thereby altering the gas mixture’s composition, contributing to changes in its average thermal resistance. Compared to RT-1, RT-2 and RT-3 exhibit lower thermal resistance due to enhanced convective heat transfer caused by the fluid redistribution effect, and the high thermal conductivity of the annular metal foam, which reduces the radial conductive resistance in the metal foam section. Furthermore, RT-3 exhibits the lowest overall thermal resistance, as the convective effects in this configuration are more pronounced.

3.3. Reaction Characteristics

3.3.1. Distribution of Net Reaction Rate

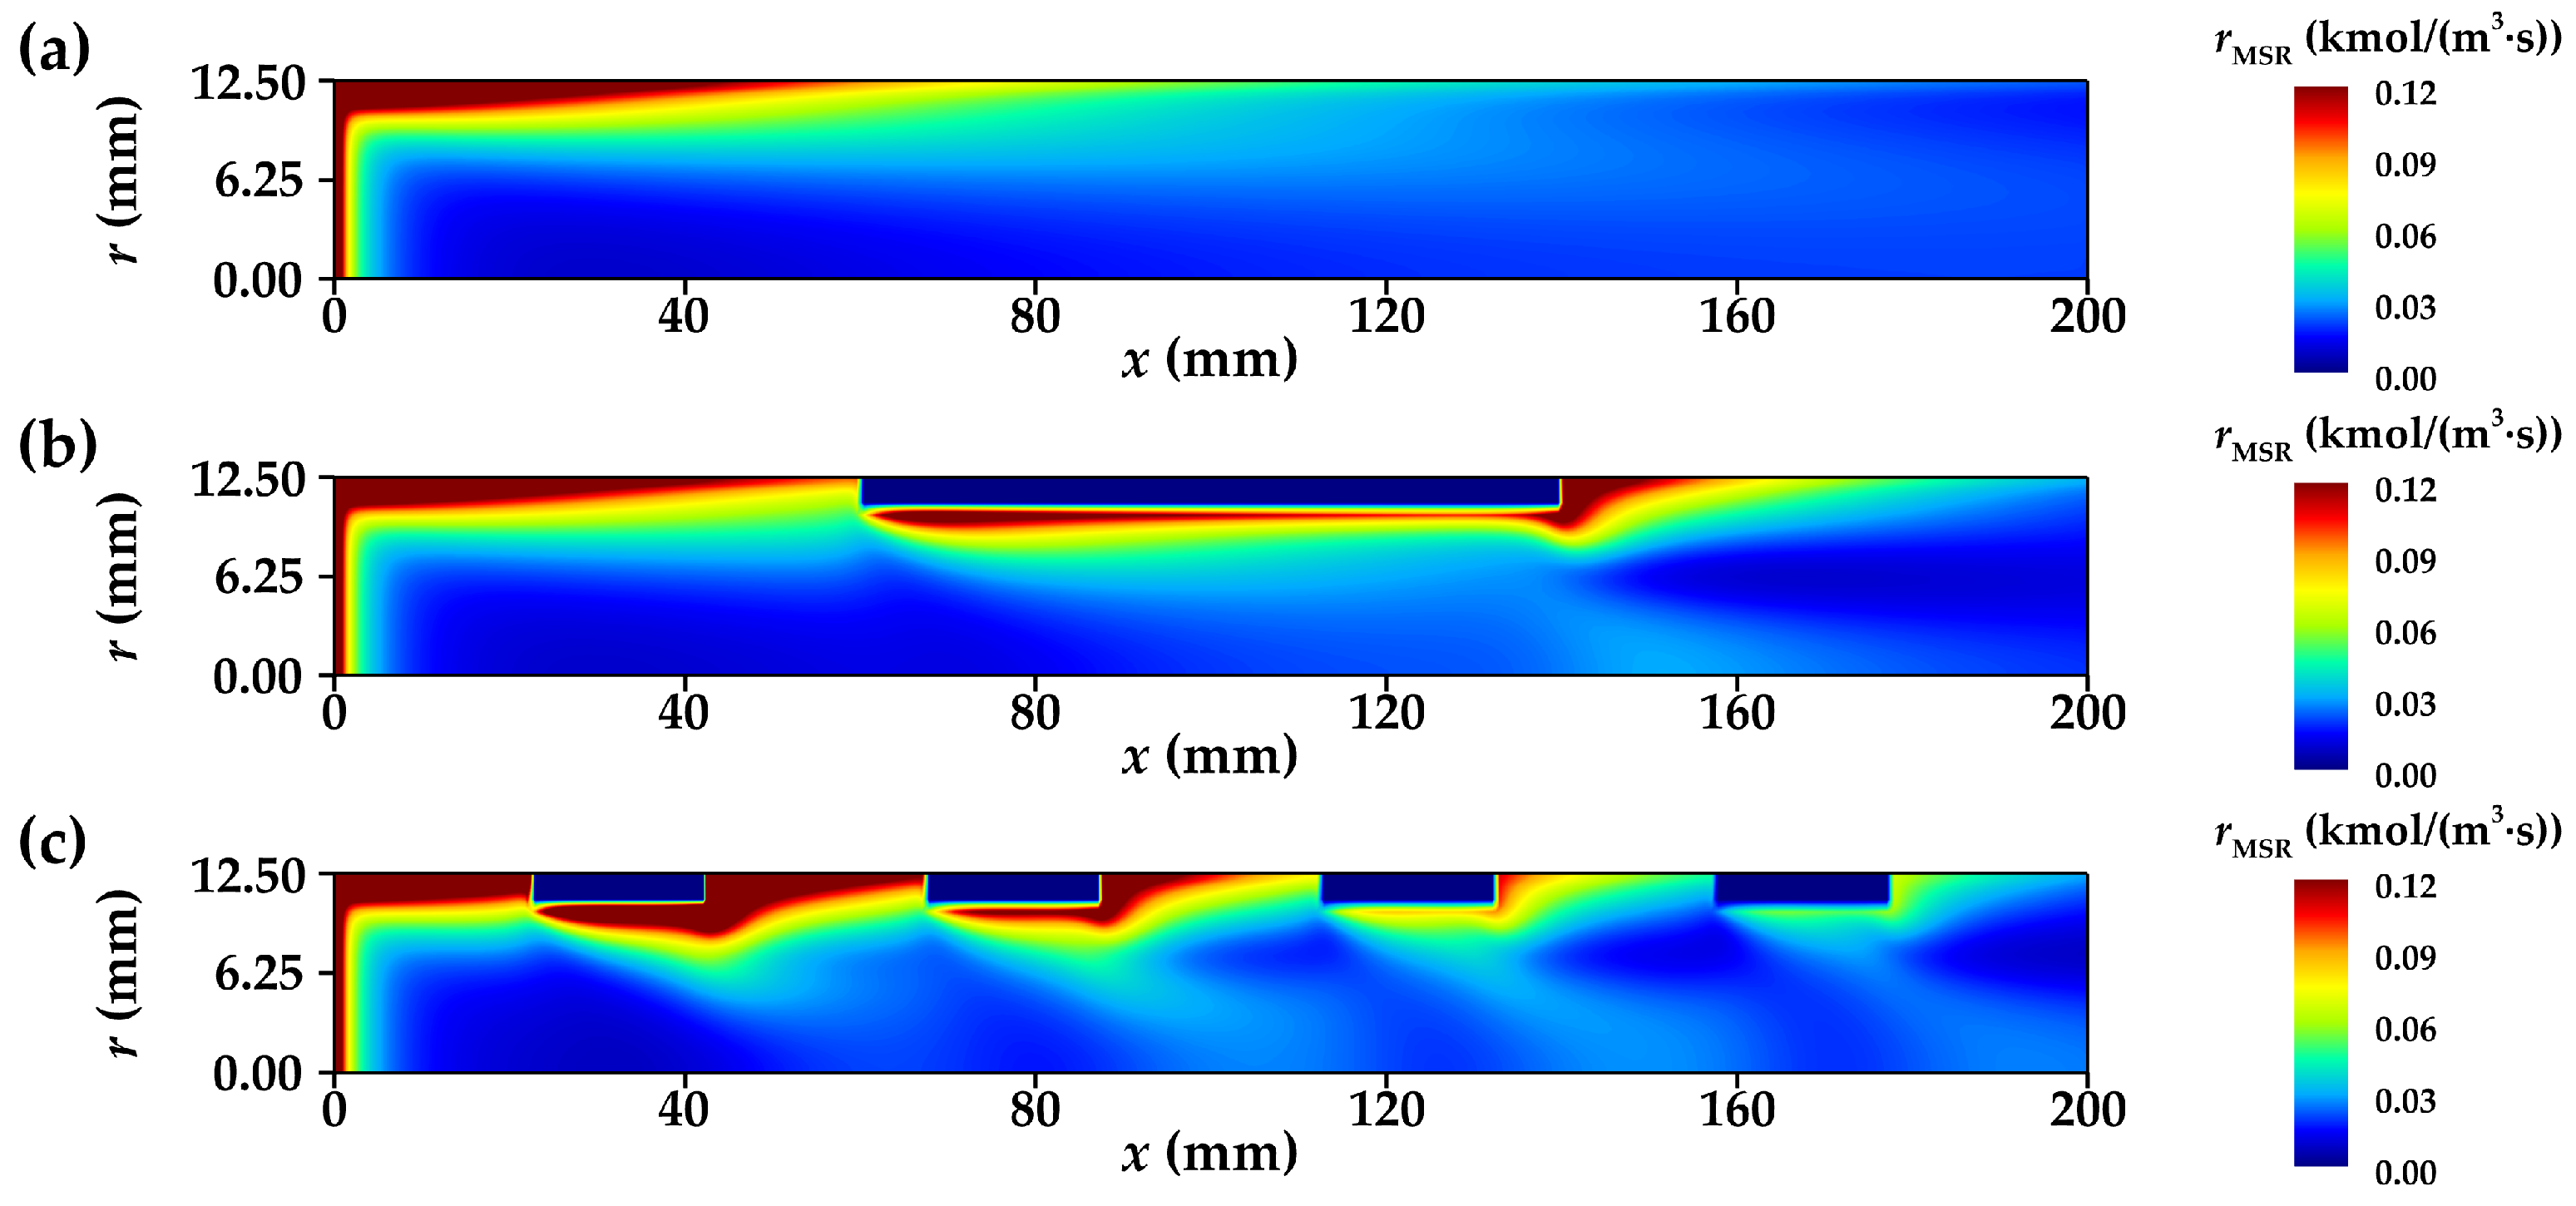
Figure 13 presents the net reaction rate contours of the MSR reaction in each reforming tube. Firstly, the MSR net reaction rate distribution in RT-1 is analyzed. At the inlet section of the reforming tube, uniform mixing, high reactant concentrations, and elevated temperature result in high MSR net reaction rates across all radial positions. As the endothermic reaction continues, cold spots form in the low-radial region, limiting the reaction due to lower temperatures and causing the MSR net rate to decline sharply. In contrast, the shorter heat transfer distance in the high-radial region allows for sufficient external heat supply, maintaining a higher MSR net reaction rate. However, due to limited radial mass transfer, the methane consumed in the high-radial region cannot be replenished promptly, leading to a gradual decline in the MSR rate because of methane depletion.
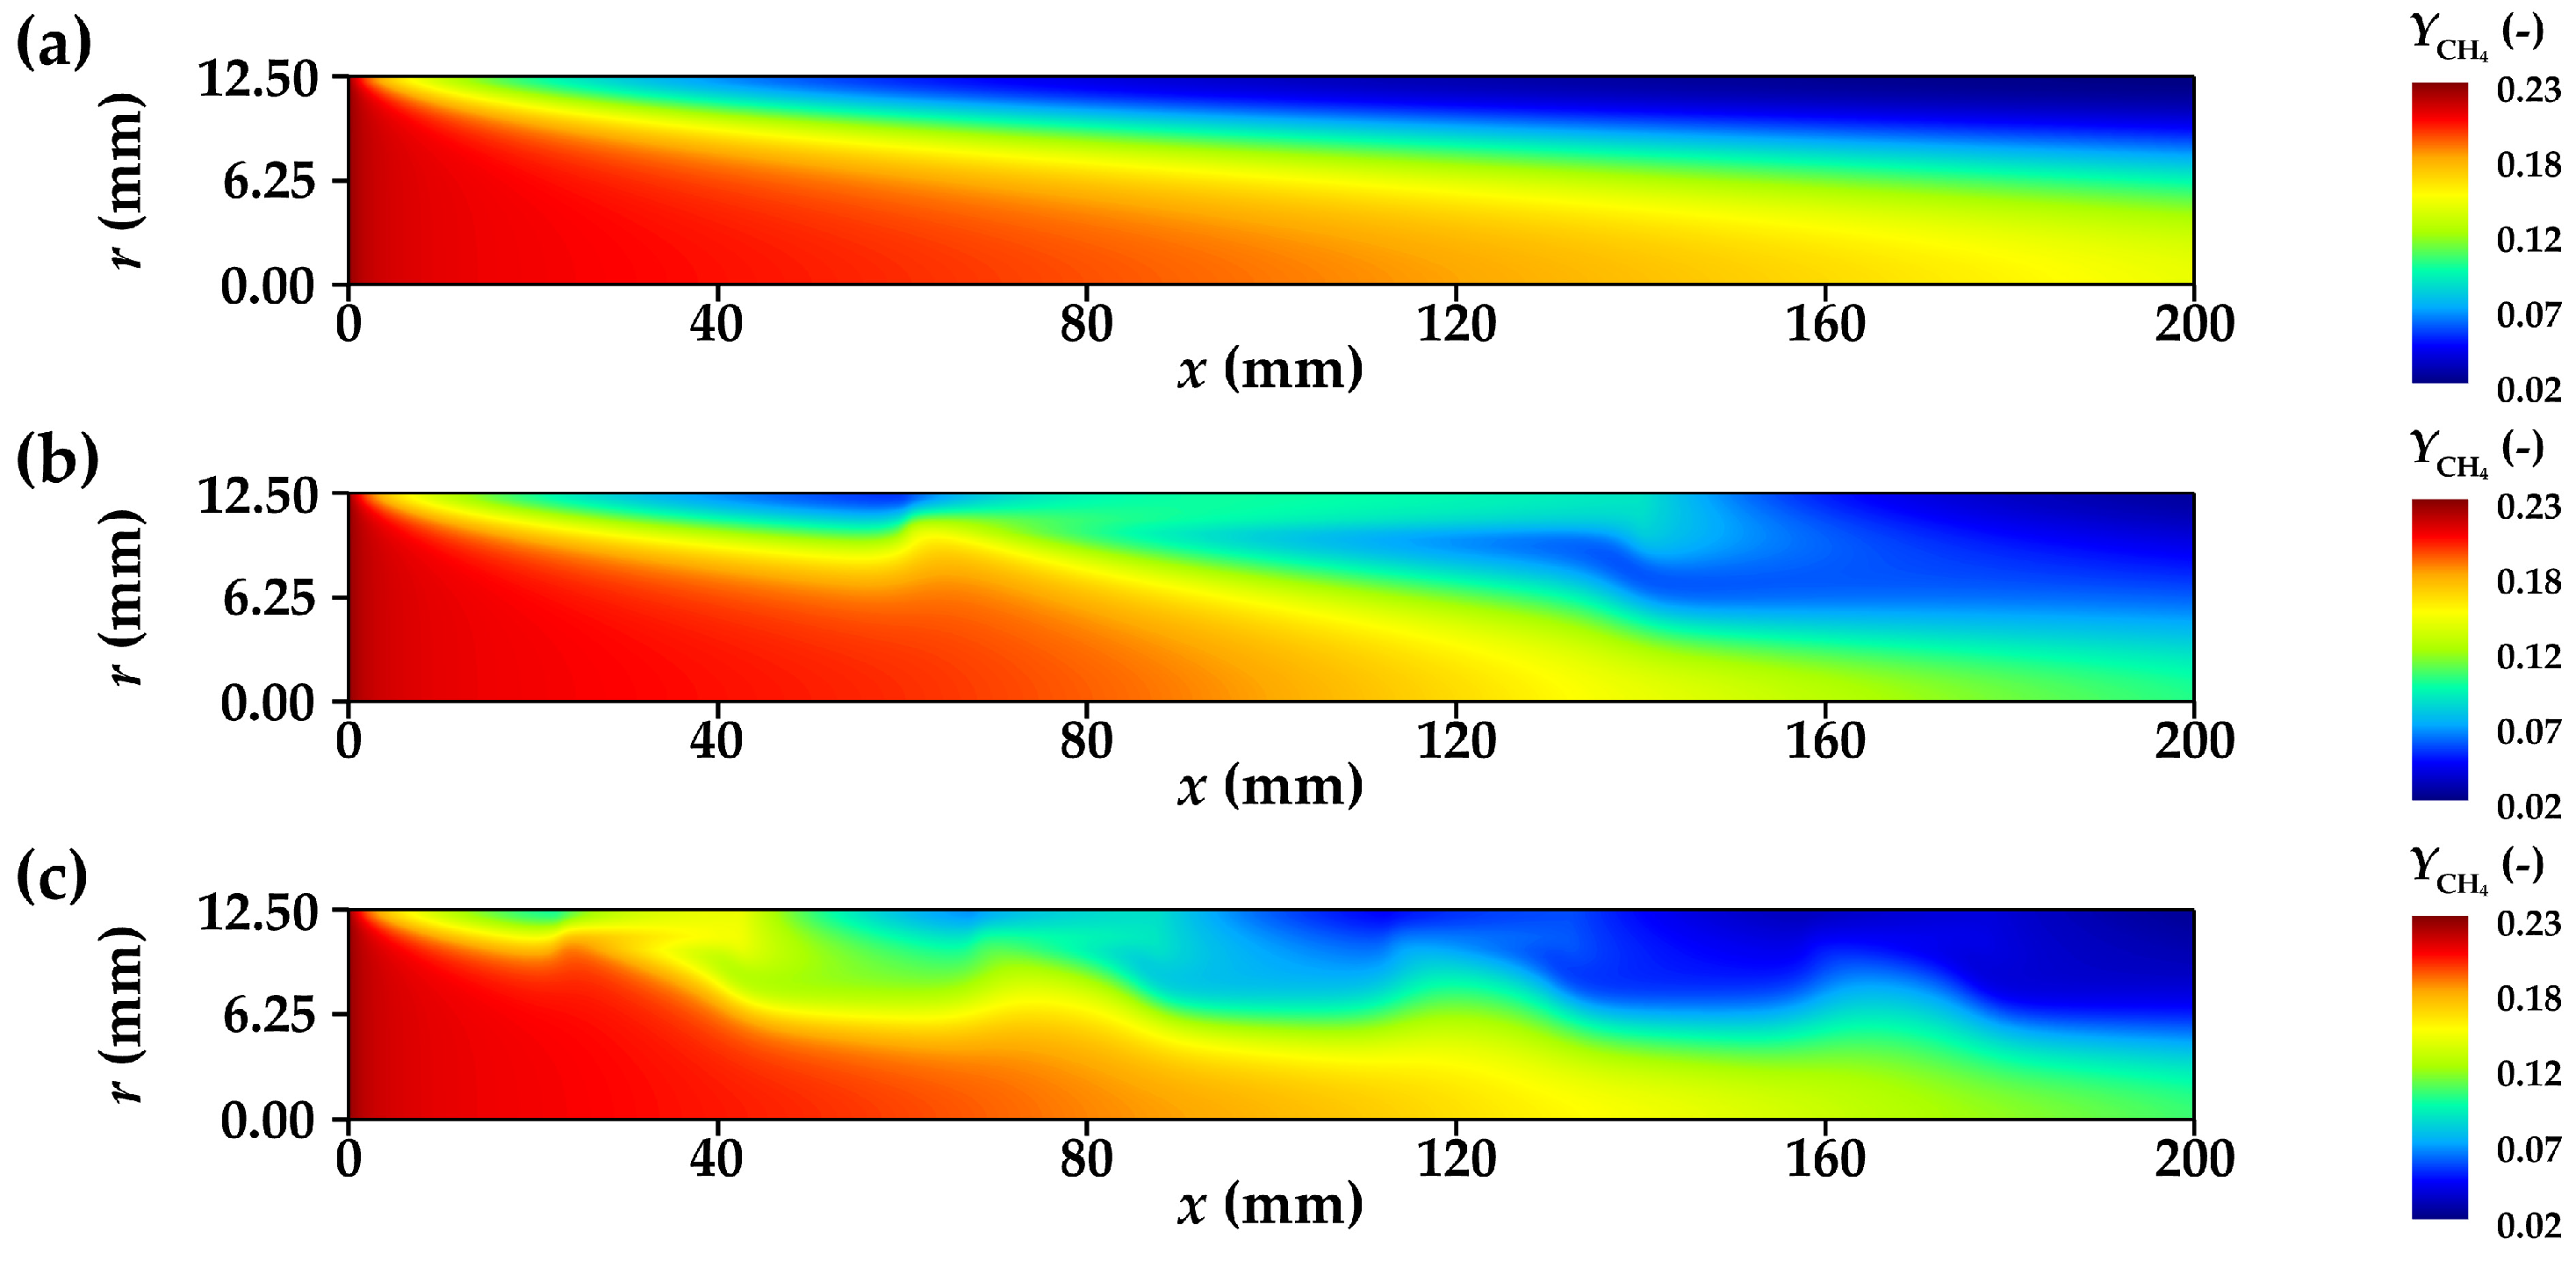
From the subfigures in Figure 13, it is evident that the introduction of annular metal foam gas channels significantly enhances the main reaction at two distinct locations within the reforming tubes. First, at the outlet of the annular metal foam gas channel, the net reaction rate of MSR increases markedly. Second, the net MSR rate is also significantly enhanced in the upper radial region of the catalyst bed within the metal foam segment. According to Figure 10, the reaction temperatures at these two locations in RT-2 and RT-3 are higher than in RT-1, providing more favorable thermodynamic conditions for the endothermic MSR reaction. Furthermore, Figure 17 shows that the methane concentrations at these positions are also higher in RT-2 and RT-3 compared to RT-1, and the elevated reactant levels further promote the progression of the MSR reaction.
Taking RT-2 as an example, Figure 14 compares the axial distribution of the average net MSR rate between the two reforming tube structures. It can be observed that the increase in net MSR rate at the outlet of the annular metal foam gas channel is significantly greater than that within the catalyst bed segment of the metal foam region. This can be attributed to two main factors. First, the varying intensity of the flow redistribution effect results in a higher flow rate at the metal foam outlet, increasing the amount of reactants participating in the reforming reaction. Second, the fluid is more thoroughly heated within the pores of the metal foam, leading to a higher reaction temperature. The combined effect of these two factors results in a greater enhancement in net MSR rate at the outlet of the annular metal foam gas channel compared to that within the catalyst bed segment. In addition, an increase in net MSR rate is also observed just before the inlet of the annular metal foam gas channel, compared to RT-1. This is mainly due to the flow redistribution effect, which raises the reaction temperature and methane flow at higher radial positions in this region.
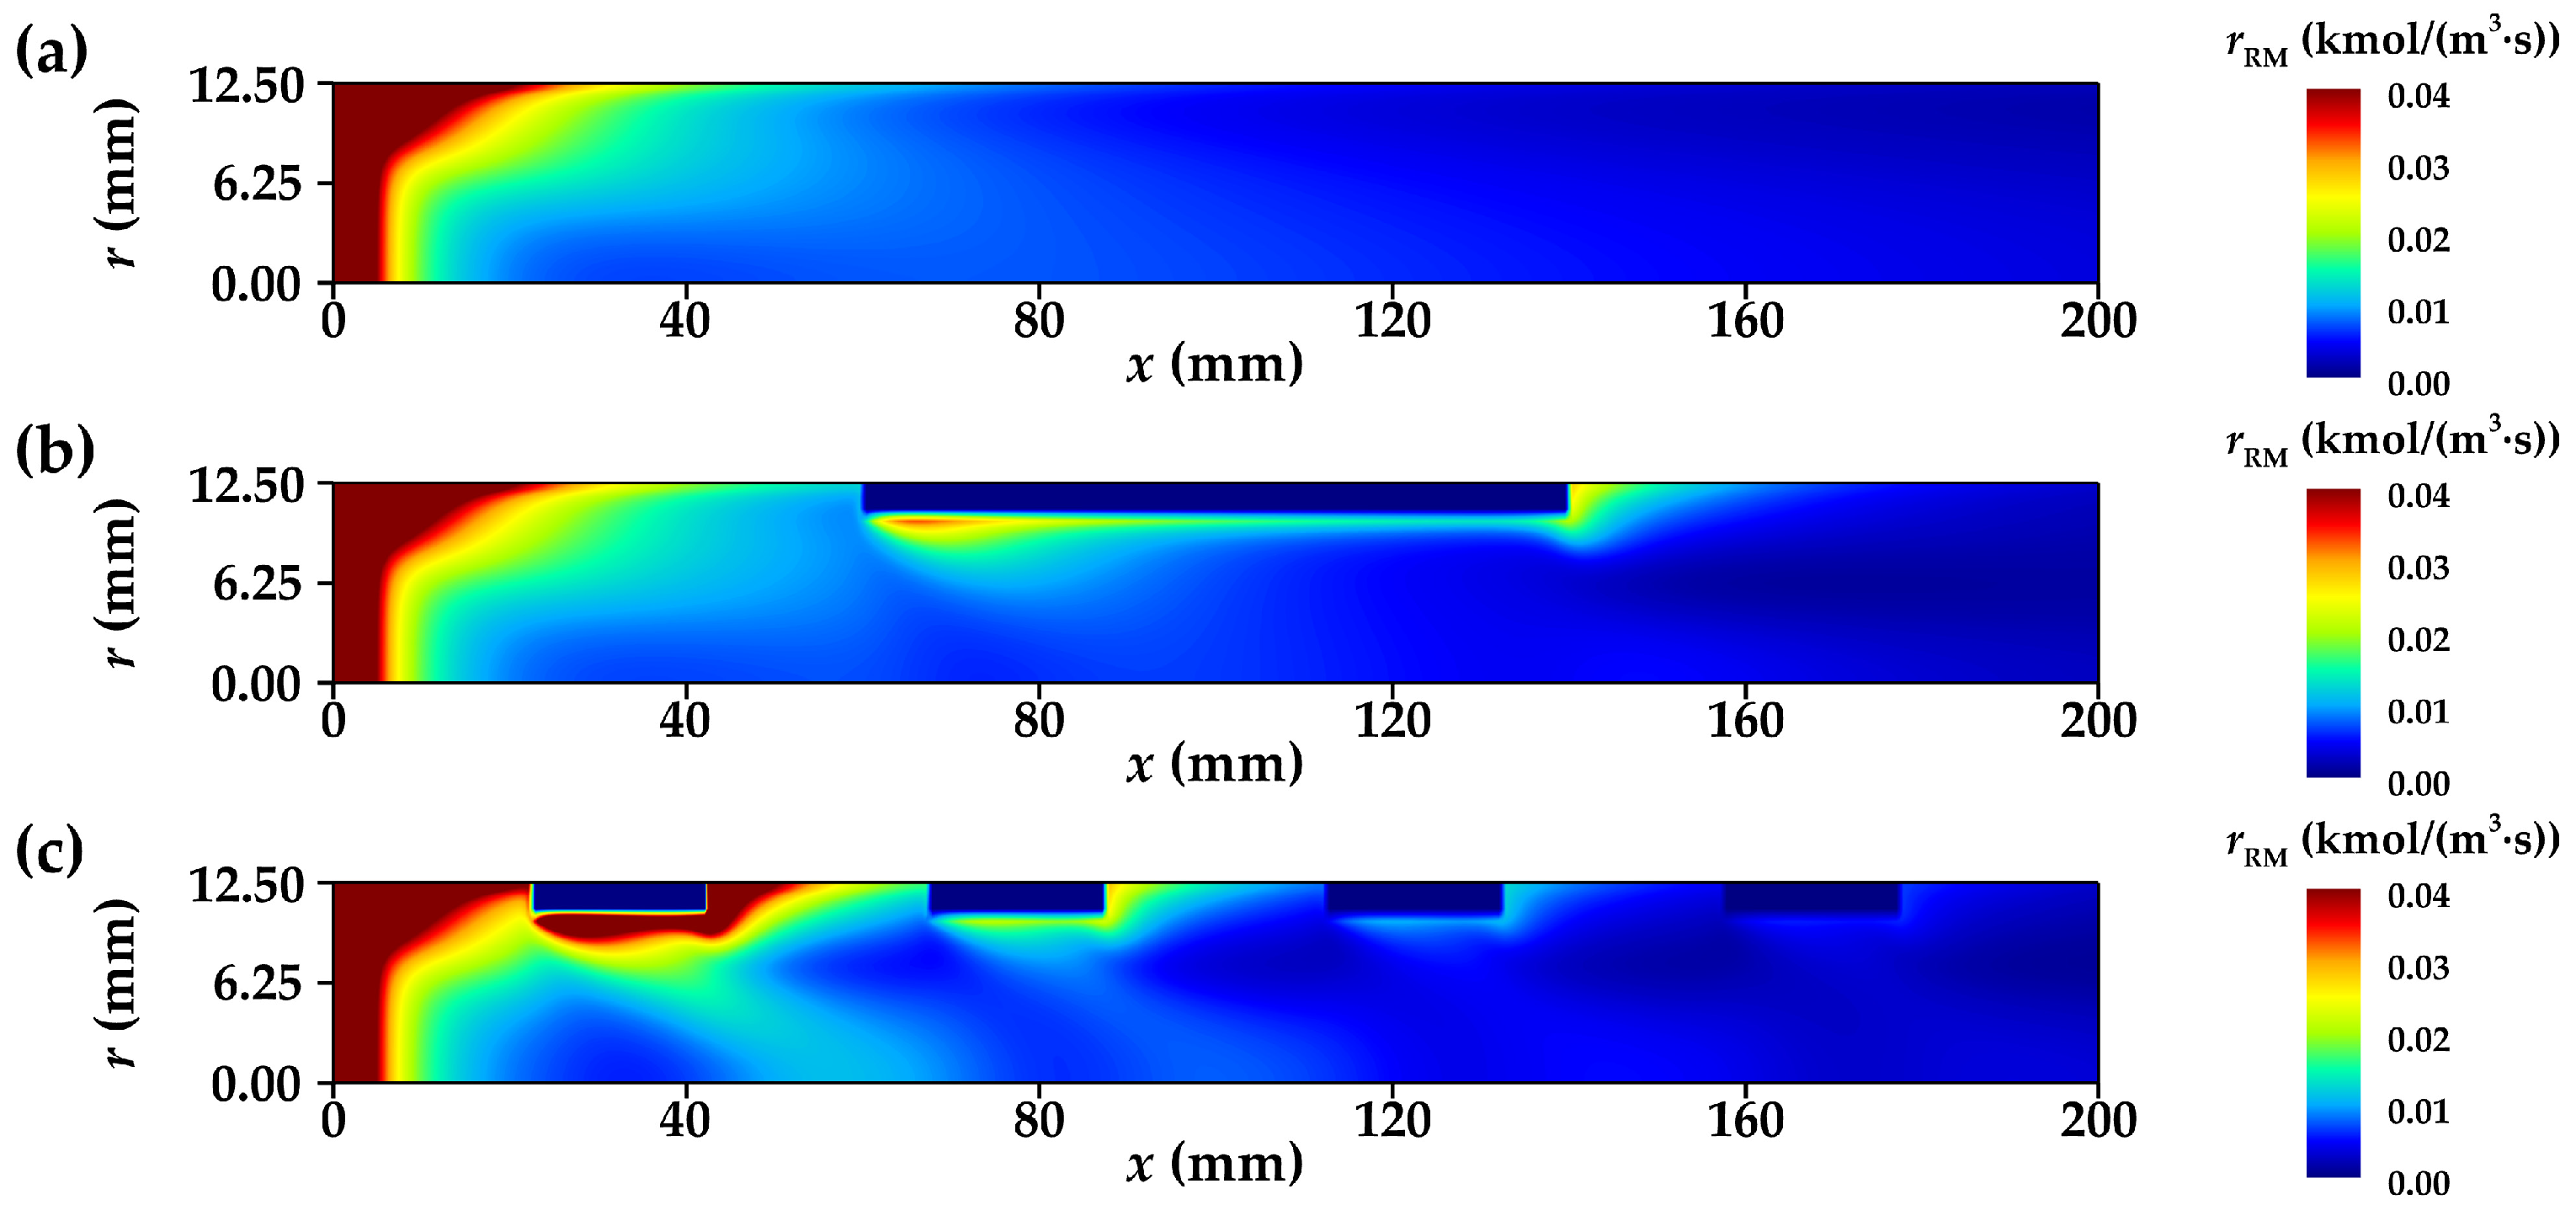
Figure 15 shows the net reaction rate distribution of the RM reaction in each reforming tube. Due to the similar reaction characteristics of RM and MSR, the net reaction rate distributions of the two reactions exhibit generally consistent patterns. However, because the activation energy of RM is higher than that of MSR, MSR is more likely to occur in the parallel reaction system. In addition, the hydrogen generated by the MSR reaction inhibits the RM reaction, resulting in a significantly smaller high-rate region for the RM reaction in Figure 15 compared to that of MSR.
As shown in Figure 16, the net reaction rate distribution of the WGS reaction, which is a side reaction in the methane steam reforming system, shows a significant dependence on the net reaction rate of the MSR reaction. Taking the inlet section of the reforming tube as an example, since the inlet feed gas contains no CO, the net reaction rate of the WGS reaction is initially zero. As the MSR reaction proceeds and produces large amounts of CO, the net reaction rate of the WGS reaction increases rapidly. At lower radial positions, the rapid decline in the MSR net reaction rate results in an insufficient CO supply for the WGS reaction, causing its net reaction rate to drop sharply. At higher radial positions, the MSR reaction continues at a relatively high rate, providing a steady CO supply to sustain the WGS reaction rate. Based on this analysis, the influence of the annular metal foam gas channel on the distribution of the WGS net reaction rate is primarily achieved by indirectly affecting the MSR reaction. It is worth noting that the elevated fluid temperature near the tube wall suppresses the WGS reaction due to its exothermic nature. As seen in Figure 16c, in regions with high fluid temperature and high MSR net reaction rate, the WGS reaction exhibits a negative net rate due to excessive temperature and product concentration.

3.3.2. Concentration Distribution of Component Gases

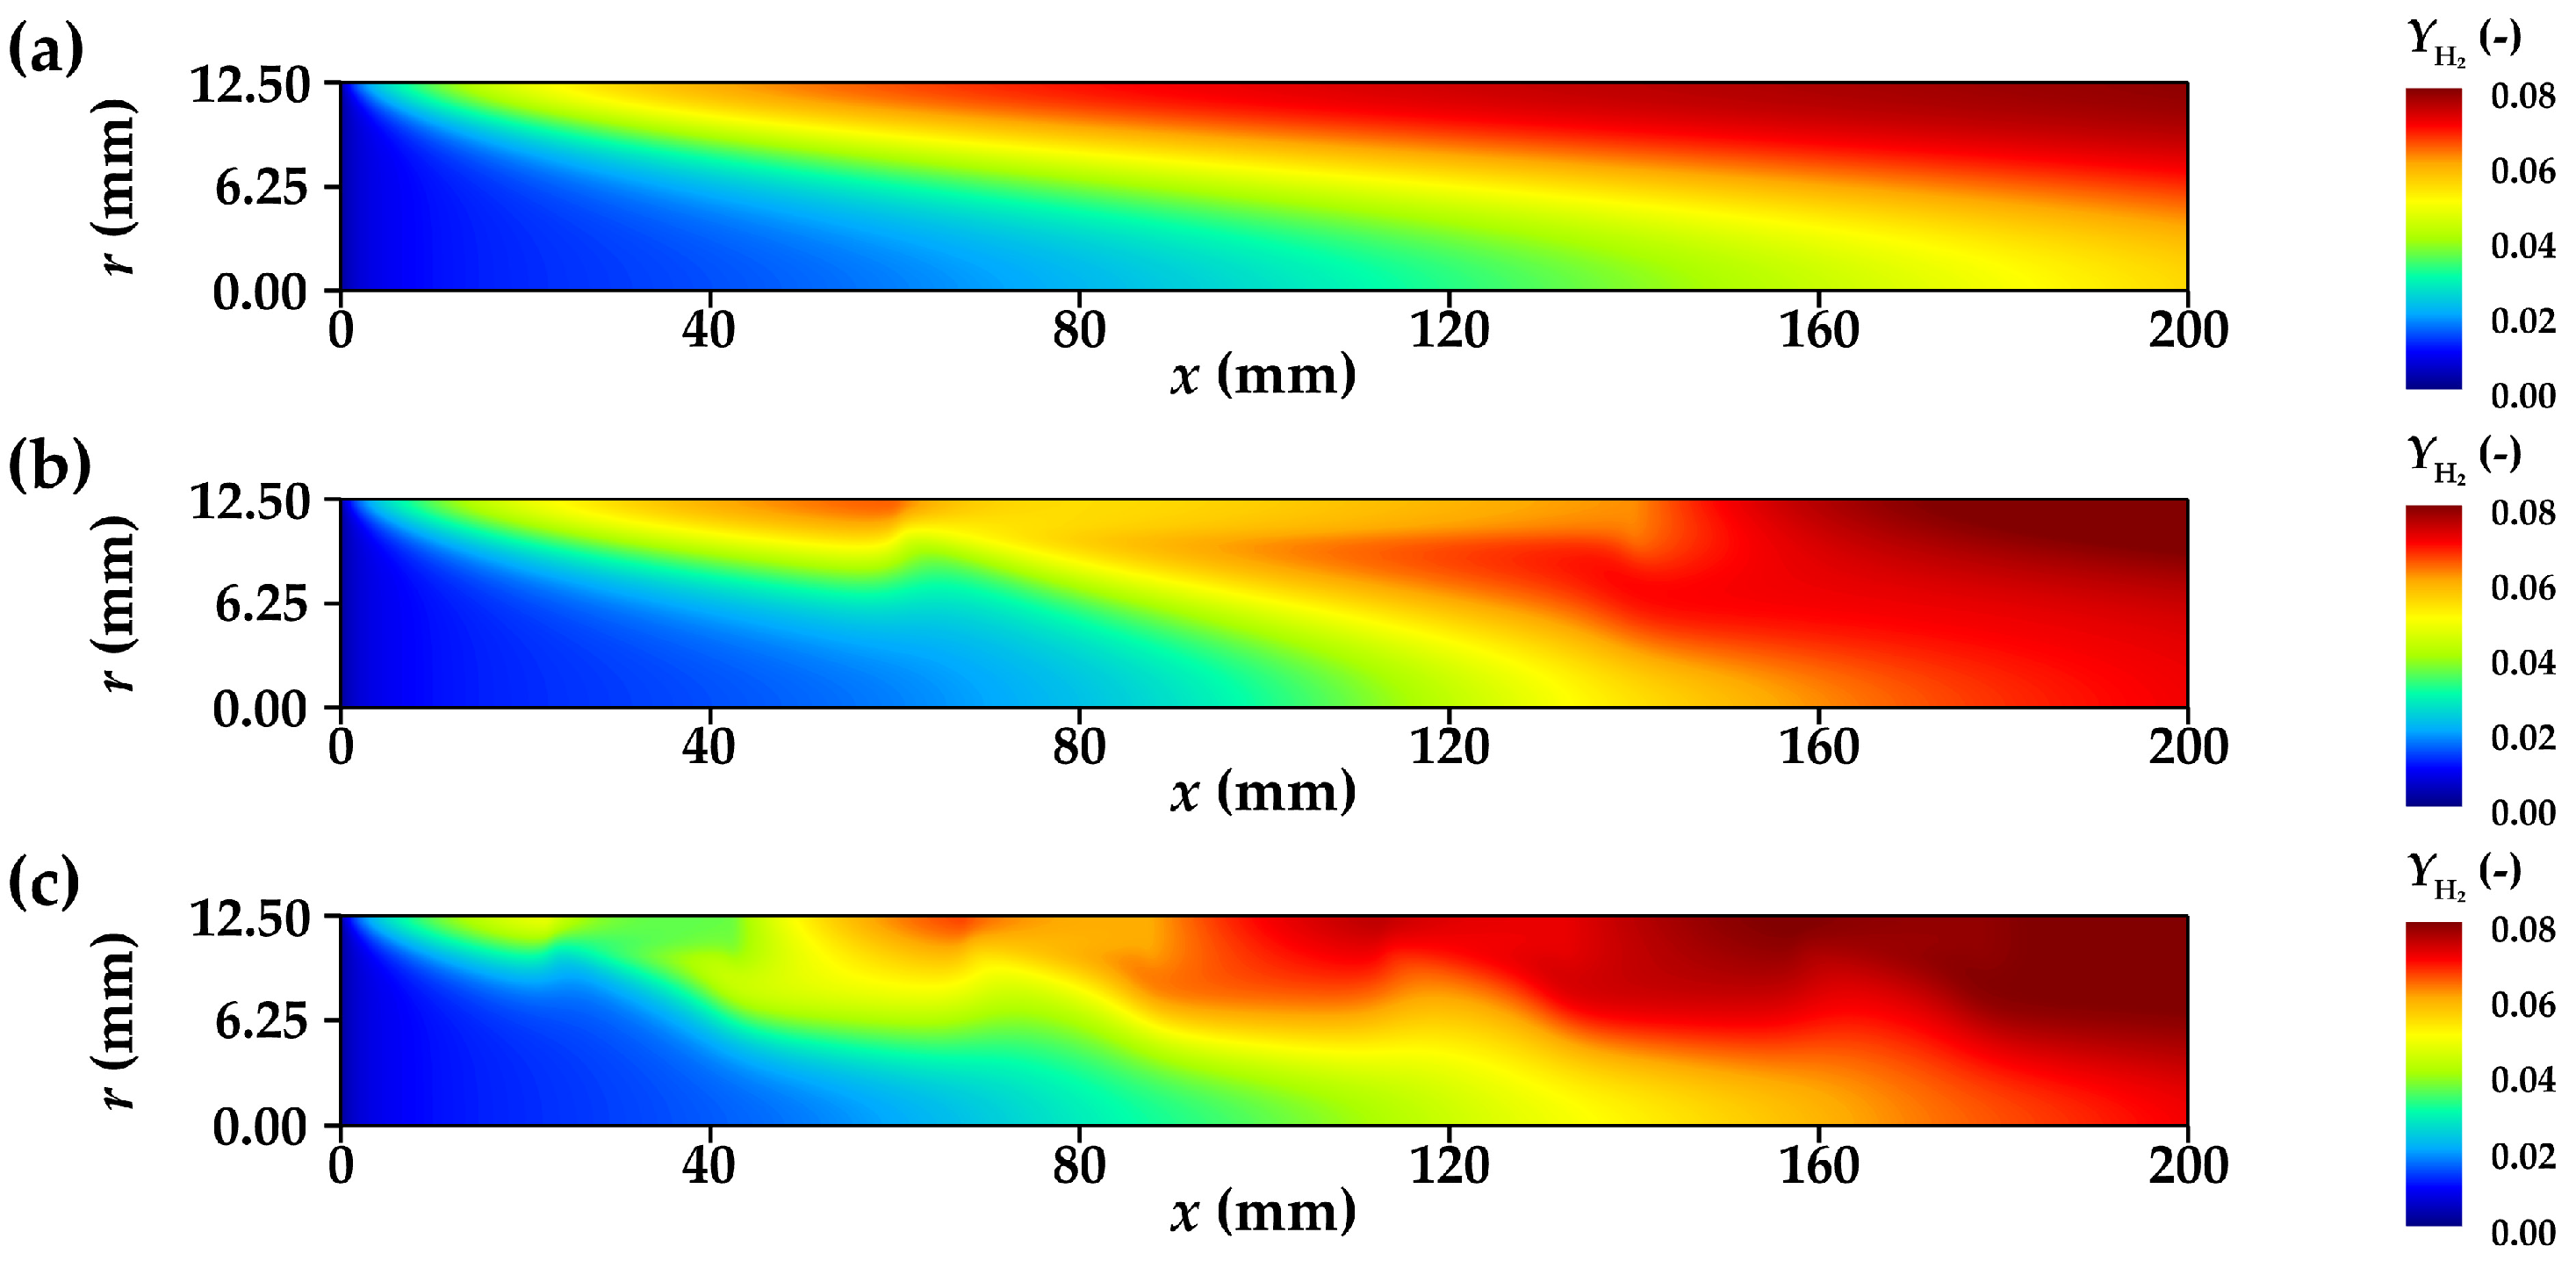
Figure 17 and Figure 18 respectively illustrate the mass fraction contours of the primary reactant (methane) and the primary product (hydrogen) in the different reforming tubes. Compared with RT-1, both RT-2 and RT-3 clearly show that the methane concentration in the upper radial regions increases significantly due to the fluid diversion effect. Furthermore, in regions where the MSR net reaction rate is high, a rapid methane consumption and a swift formation of hydrogen can be observed. Notably, near the outlet of the annular metal foam gas channels, the fluid exhibits radial flow toward the tube center, which increases the hydrogen concentration at lower radial positions. This suppresses the MSR reaction, resulting in a low-rate MSR zone observable in the corresponding region of Figure 13. Nevertheless, the inclusion of the annular metal foam gas channel still leads to an enhancement in reaction performance. Nevertheless, the arrangement of the annular metal foam gas channel still makes the YCH4 at the outlet of the reforming tube lower than that of RT-1, and the YH2 is significantly higher.

3.3.3. Methane Conversion

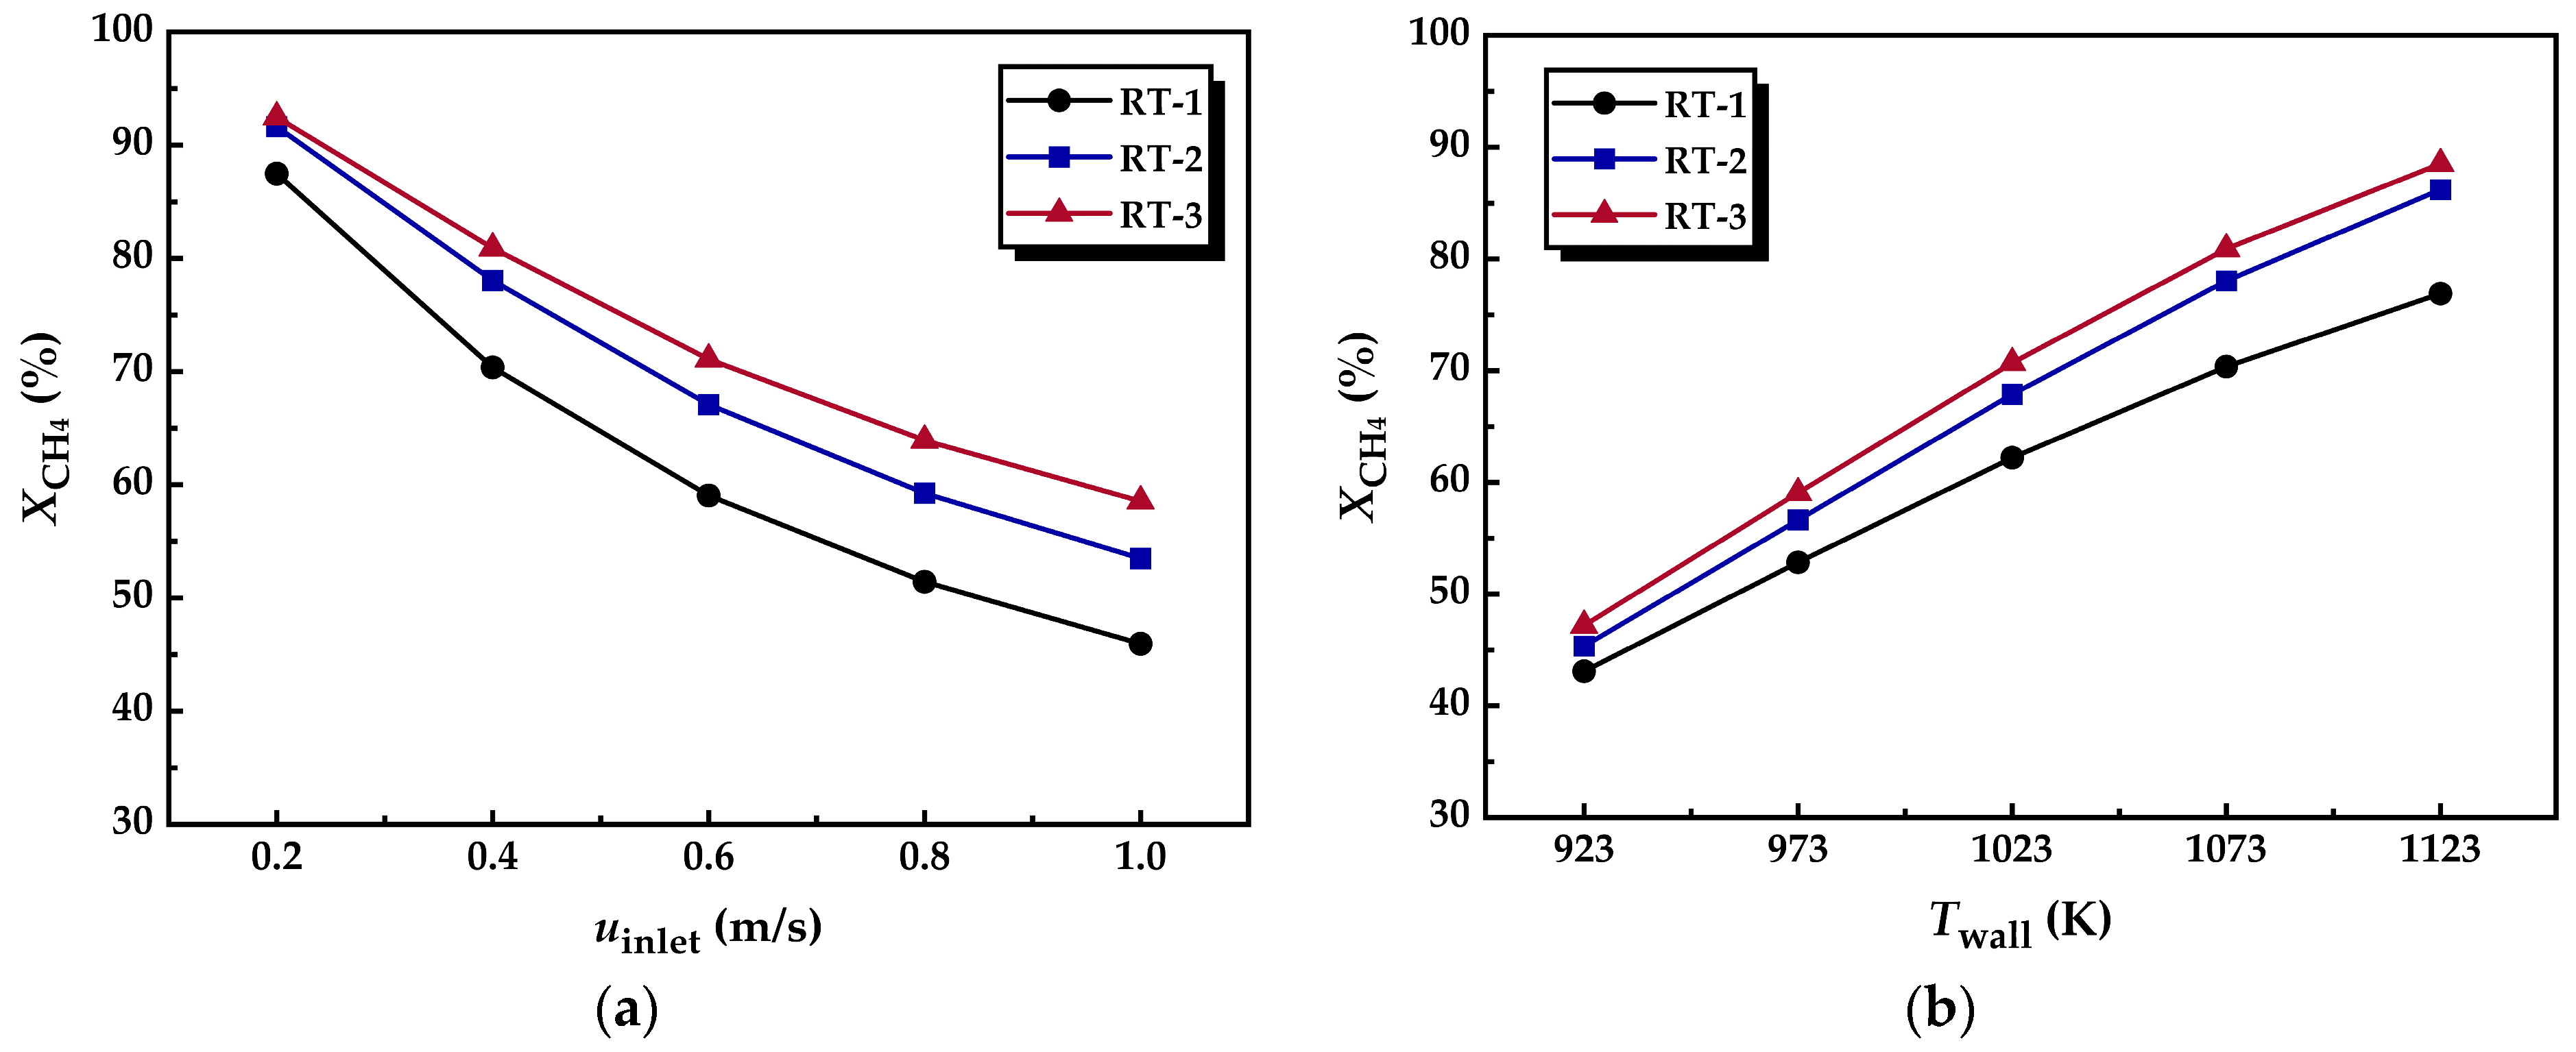
Figure 19a presents the influence of feed gas inlet velocity on methane conversion. It can be observed that as the inlet velocity increases, the methane conversion decreases in reforming tubes. This occurs because the increased flow rate of the gas mixture reduces the residence time in the reformer, causing part of the methane to exit the reactor before fully reacting, thus decreasing the methane conversion. Compared with RT-1, both RT-2 and RT-3 exhibit enhanced methane conversion capabilities due to the intensified convective heat and mass transfer driven by the fluid redistribution effect. Taking RT-3 as an example, when the inlet velocities are 0.2 m/s, 0.6 m/s, and 1.0 m/s, its methane conversion exceeds RT-1 by 5.72%, 20.39%, and 27.43%, respectively. This is mainly because as the inlet velocity increases, the intensity of the redistribution effect in RT-3 becomes more pronounced, resulting in greater enhancements in convective heat and mass transfer.
Moreover, when the inlet velocity increases from 0.2 m/s to 1.0 m/s, the methane conversion in RT-1 decreases by 47.5%, while in RT-3 it only drops by 36.7%. This result indicates that under unfavorable reaction conditions, incorporating annular metal foam gas channels can effectively mitigate the negative effects caused by deteriorated reaction conditions.
Figure 19b shows the effect of reformer wall temperature on methane conversion. It can be observed that the methane conversion in all reformers increases with rising reaction temperature, as MSR is a strongly endothermic reaction and higher temperatures promote the equilibrium shift toward the forward direction when the reaction temperature increases from 923 K to 1123 K, the methane conversion in RT-2 rises by 90.1%, in RT-3 by 87.6%, and in RT-1 by only 78.5%. This result indicates that under favorable reaction conditions, the reformers equipped with annular metal foam gas channels can further amplify the positive impact of temperature on reaction performance due to their superior flow and heat transfer characteristics.
The data of various performance parameters in Figure 9, Figure 12 and Figure 19 are listed in detail in Table 5 and Table 6:

4. Conclusions

This study proposes a structural optimization scheme by introducing annular metal foam gas channels along the inner wall of the reforming tube to enhance the performance of the methane steam reforming process for hydrogen production. Numerical simulation methods were employed to model and analyze the multi-physical fields of various parameters during the reaction process, aiming to identify the factors influencing reforming performance and to reveal the mechanism by which the proposed optimization enhances system efficiency. The main conclusions are as follows:
  • The incorporation of annular metal foam gas channels leads to a non-uniform radial distribution of flow resistance within the foam segment, resulting in a flow-splitting effect of the gas mixture. The radial flow induced by the splitting enhances convective heat and mass transfer processes. Additionally, the increased flow proportion through the annular metal foam channels reduces the pressure drop across the reforming tube. In addition, increasing the inlet velocity or decreasing the wall temperature is more beneficial to optimizing the pressure drop of the innovative structure reforming tube.
  • Incorporating annular metal foam gas channels reduces the radial thermal conduction resistance within the foam segment. The increased flow proportion through the channel allows the gas mixture to absorb heat more effectively. Moreover, the radial flow resulting from the flow-splitting process enhances convective heat transfer, significantly reducing the overall thermal resistance of the reformer tube.
  • The radial flow of fluid and the reduction in thermal resistance within the reforming tube significantly enhance the main reaction rate at multiple locations. Compared to conventional reformers, those equipped with annular metal foam gas channels exhibit higher methane conversion efficiency. Under unfavorable reaction conditions, the annular channel configuration effectively mitigates the negative impacts caused by process deterioration; under favorable conditions, it further amplifies the positive effects on reaction performance. In summary, increasing the inlet velocity or decreasing the wall temperature is conducive to improving the optimization degree of the reaction performance of the innovative structure reforming tube.

Author Contributions

Conceptualization, Y.H.; Methodology, Y.H. and Z.W.; Software, Z.W.; Validation, Z.W.; Formal analysis, Y.H.; Investigation, Z.Z.; Data curation, Z.Z.; Writing—original draft, Y.H.; Writing—review & editing, G.Z.; Visualization, Y.H.; Supervision, G.Z.; Project administration, G.Z.; Funding acquisition, G.Z. All authors have read and agreed to the published version of the manuscript.

Funding

This research was supported by National Natural Science Foundation of China (Grant No. 52176080) and Natural Science Foundation of Shandong Province, China (Grant No. ZR2022ME003).

Data Availability Statement

The data presented in this study are available on request from the corresponding author.

Conflicts of Interest

The authors declare no conflicts of interest.

Nomenclature

Symbols
uvelocity (m/s)
Ttemperature (K)
Ymass fraction
Δppressure drop (Pa)
Qheat flux (W)
XCH4methane conversion (%)
Dfflow disturbance intensity
RTthermal resistance (K/W)
cpspecific heat capacity (J/(kg·K))
Dmeffective mass diffusivity (m2/s)
L0length of the reforming tube (m)
R0radius of the reforming tube (m)
Greek
εporosity
ηeffectiveness factor
ρdensity (kg/m3)
λthermal conductivity (W/(m·K))
μdynamic viscosity (kg/(m·s))
Subscripts
fgas mixture
ssolid phase
i (i = MSR, RM, WGS)chemical reaction
i (i = CH4, H2, CO2, CO, H2O)component gas
xaxial direction
rradial direction
catcatalyst
foammetal foam
wallreforming tube wall
inletreforming tube inlet
outletreforming tube outlet
aaverage

References

  1. Endo, N.; Goshome, K.; Tetsuhiko, M.; Segawa, Y.; Shimoda, E.; Nozu, T. Thermal Management and Power Saving Operations for Improved Energy Efficiency within a Renewable Hydrogen Energy System Utilizing Metal Hydride Hydrogen Storage. Int. J. Hydrogen Energy 2021, 46, 262–271. [Google Scholar] [CrossRef]
  2. Parthasarathy, P.; Narayanan, K.S. Hydrogen Production from Steam Gasification of Biomass: Influence of Process Parameters on Hydrogen Yield—A Review. Renew. Energy 2014, 66, 570–579. [Google Scholar] [CrossRef]
  3. Acar, C.; Dincer, I. Review and Evaluation of Hydrogen Production Options for Better Environment. J. Clean. Prod. 2019, 218, 835–849. [Google Scholar] [CrossRef]
  4. Pizoń, Z.; Kimijima, S.; Brus, G. Enhancing a Deep Learning Model for the Steam Reforming Process Using Data Augmentation Techniques. Energies 2024, 17, 2413. [Google Scholar] [CrossRef]
  5. Carapellucci, R.; Giordano, L. Steam, Dry and Autothermal Methane Reforming for Hydrogen Production: A Thermodynamic Equilibrium Analysis. J. Power Sources 2020, 469, 228391. [Google Scholar] [CrossRef]
  6. Hou, K.; Hughes, R. The Kinetics of Methane Steam Reforming over a Ni/α-Al2O Catalyst. Chem. Eng. J. 2001, 82, 311–328. [Google Scholar] [CrossRef]
  7. Hoang, D.L.; Chan, S.H.; Ding, O.L. Kinetic and Modelling Study of Methane Steam Reforming over Sulfide Nickel Catalyst on a Gamma Alumina Support. Chem. Eng. J. 2005, 112, 1–11. [Google Scholar] [CrossRef]
  8. Hiramitsu, Y.; Demura, M.; Xu, Y.; Yoshida, M.; Hirano, T. Catalytic Properties of Pure Ni Honeycomb Catalysts for Methane Steam Reforming. Appl. Catal. Gen. 2015, 507, 162–168. [Google Scholar] [CrossRef]
  9. Tsuda, Y.; Hirano, T.; Echigo, M. Effect of Metal Addition to Ni/CeO2 Catalyst on the Steam Reforming Reaction of Methane. Int. J. Hydrogen Energy 2024, 49, 937–948. [Google Scholar] [CrossRef]
  10. You, X.; Wang, X.; Ma, Y.; Liu, J.; Liu, W.; Xu, X.; Peng, H.; Li, C.; Zhou, W.; Yuan, P.; et al. Ni-Co/Al2O3 Bimetallic Catalysts for CH4 Steam Reforming: Elucidating the Role of Co for Improving Coke Resistance. ChemCatChem 2014, 6, 3377–3386. [Google Scholar] [CrossRef]
  11. Wu, Z.; Guo, Z.; Yang, J.; Wang, Q. Numerical Investigation of Hydrogen Production via Methane Steam Reforming in a Novel Packed Bed Reactor Integrated with Diverging Tube. Energy Convers. Manag. 2023, 289, 117185. [Google Scholar] [CrossRef]
  12. Huang, W.-J.; Yu, C.-T.; Sheu, W.-J.; Chen, Y.-C. The Effect of Non-Uniform Temperature on the Sorption-Enhanced Steam Methane Reforming in a Tubular Fixed-Bed Reactor. Int. J. Hydrogen Energy 2021, 46, 16522–16533. [Google Scholar] [CrossRef]
  13. Patel, A.; Singh, V.K. Numerical Investigation of a Novel Phase Change Material Based Heat Sink with Double Sided Spiral Fins. Int. Commun. Heat. Mass. Transf. 2022, 138, 106342. [Google Scholar] [CrossRef]
  14. He, Z.; Yan, Y.; Zhao, T.; Zhang, Z.; Mikulčić, H. Parametric Study of Inserting Internal Spiral Fins on the Micro Combustor Performance for Thermophotovoltaic Systems. Renew. Sustain. Energy Rev. 2022, 165, 112595. [Google Scholar] [CrossRef]
  15. Kiatpachai, P.; Keawkamrop, T.; Asirvatham, L.G.; Mesgarpour, M.; Dalkılıç, A.S.; Ahn, H.S.; Mahian, O.; Wongwises, S. An Experimental Study of the Air-Side Performance of a Novel Louver Spiral Fin-and-Tube Heat Exchanger. Alex. Eng. J. 2022, 61, 9811–9818. [Google Scholar] [CrossRef]
  16. Duan, J.; Peng, Z. Numerical Investigation of Nano-Enhanced Phase Change Material Melting in the 3D Annular Tube with Spiral Fins. Renew. Energy 2022, 193, 251–263. [Google Scholar] [CrossRef]
  17. Jurtz, N.; Flaischlen, S.; Scherf, S.C.; Kraume, M.; Wehinger, G.D. Enhancing the Thermal Performance of Slender Packed Beds through Internal Heat Fins. Processes 2020, 8, 1528. [Google Scholar] [CrossRef]
  18. Yuan, Q.; Gu, R.; Ding, J.; Lu, J. Heat Transfer and Energy Storage Performance of Steam Methane Reforming in a Tubular Reactor. Appl. Therm. Eng. 2017, 125, 633–643. [Google Scholar] [CrossRef]
  19. Pashchenko, D.; Mustafin, R.; Mustafina, A. Steam Methane Reforming in a Microchannel Reformer: Experiment, CFD-Modelling and Numerical Study. Energy 2021, 237, 121624. [Google Scholar] [CrossRef]
  20. Palma, V.; Ricca, A.; Martino, M.; Meloni, E. Innovative Structured Catalytic Systems for Methane Steam Reforming Intensification. Chem. Eng. Process. Process Intensif. 2017, 120, 207–215. [Google Scholar] [CrossRef]
  21. Suzuki, K.; Iwai, H.; Nishino, T. Electrochemical and Thermofluid Modeling of a Tubular Solid Oxide Fuel Cell with Accompanying Indirect Internal Fuel Reforming; WIT Press: Billerica, MA, USA, 2005. [Google Scholar]
  22. Mozdzierz, M.; Brus, G.; Sciazko, A.; Komatsu, Y.; Kimijima, S.; Szmyd, J.S. Towards a Thermal Optimization of a Methane/Steam Reforming Reactor. Flow. Turbul. Combust. 2016, 97, 171–189. [Google Scholar] [CrossRef]
  23. Chen, C.; Diao, Y.; Zhao, Y.; Zhu, T.; Wang, Z.; Han, Y.; Liu, Y. Performance Prediction of a Fin-Metal Foam-Cold Thermal Energy Storage Device: Solidification. Int. J. Heat. Mass. Transf. 2023, 202, 123672. [Google Scholar] [CrossRef]
  24. Stark, J.R.; Sevart, C.D.; Bergman, T.L. Experimentally Validated Analytical Expressions for the Thermal Resistance of a Novel Composite Fin-Foam Annular Array. Appl. Therm. Eng. 2018, 131, 260–269. [Google Scholar] [CrossRef]
  25. Samudre, P.; Kailas, S.V. Thermal Performance Enhancement in Open-Pore Metal Foam and Foam-Fin Heat Sinks for Electronics Cooling. Appl. Therm. Eng. 2022, 205, 117885. [Google Scholar] [CrossRef]
  26. Yang, X.; Wei, P.; Liu, G.; Bai, Q.; He, Y.-L. Performance Evaluation on the Gradient Design of Pore Parameters for Metal Foam and Pin Fin-Metal Foam Hybrid Structure. Appl. Therm. Eng. 2020, 175, 115416. [Google Scholar] [CrossRef]
  27. Zaio, F.; Ambrosetti, M.; Beretta, A.; Groppi, G.; Tronconi, E. Intensification of Methane Steam Reforming by Cu-Foams Packed with Rh-Al2O3 Catalyst: A Pilot-Scale Assessment. Chem. Eng. Res. Des. 2025, 215, 98–107. [Google Scholar] [CrossRef]
  28. Ferri, G.; Ambrosetti, M.; Beretta, A.; Groppi, G.; Tronconi, E. Experimental Investigation and 2D Mathematical Modelling of Copper Foams Packed with Rh-Al2O3 Catalysts for the Intensification of Methane Steam Reforming. Catal. Today 2024, 426, 114386. [Google Scholar] [CrossRef]
  29. Settar, A.; Nebbali, R.; Madani, B.; Abboudi, S. Numerical Investigation on the Wall-Coated Steam Methane Reformer Improvement: Effects of Catalyst Layer Patterns and Metal Foam Insertion. Int. J. Hydrogen Energy 2015, 40, 8966–8979. [Google Scholar] [CrossRef]
  30. Settar, A.; Abboudi, S.; Lebaal, N. Effect of Inert Metal Foam Matrices on Hydrogen Production Intensification of Methane Steam Reforming Process in Wall-Coated Reformer. Int. J. Hydrogen Energy 2018, 43, 12386–12397. [Google Scholar] [CrossRef]
  31. Pajak, M.; Mozdzierz, M.; Chalusiak, M.; Kimijima, S.; Szmyd, J.S.; Brus, G. A Numerical Analysis of Heat and Mass Transfer Processes in a Macro-Patterned Methane/Steam Reforming Reactor. Int. J. Hydrogen Energy 2018, 43, 20474–20487. [Google Scholar] [CrossRef]
  32. Pajak, M.; Brus, G.; Kimijima, S.; Szmyd, J.S. Coaxial Multi-Criteria Optimization of a Methane Steam Reforming Reactor for Effective Hydrogen Production and Thermal Management. Energy AI 2023, 13, 100264. [Google Scholar] [CrossRef]
  33. Mokheimer, E.M.A.; Ibrar Hussain, M.; Ahmed, S.; Habib, M.A.; Al-Qutub, A.A. On the Modeling of Steam Methane Reforming. J. Energy Resour. Technol. 2015, 137, 012001. [Google Scholar] [CrossRef]
  34. Lao, L.; Aguirre, A.; Tran, A.; Wu, Z.; Durand, H.; Christofides, P.D. CFD Modeling and Control of a Steam Methane Reforming Reactor. Chem. Eng. Sci. 2016, 148, 78–92. [Google Scholar] [CrossRef]
  35. Sheu, W.-J.; Chu, C.-S.; Chen, Y.-C. The Operation Types and Operation Window for High-Purity Hydrogen Production for the Sorption Enhanced Steam Methane Reforming in a Fixed-Bed Reactor. Int. J. Hydrogen Energy 2022, 47, 37192–37203. [Google Scholar] [CrossRef]
  36. Amini, A.; Sedaghat, M.H.; Jamshidi, S.; Shariati, A.; Rahimpour, M.R. A Comprehensive CFD Simulation of an Industrial-Scale Side-Fired Steam Methane Reformer to Enhance Hydrogen Production. Chem. Eng. Process. Process Intensif. 2023, 184, 109269. [Google Scholar] [CrossRef]
  37. Baek, S.M.; Kang, J.H.; Lee, K.-J.; Nam, J.H. A Numerical Study of the Effectiveness Factors of Nickel Catalyst Pellets Used in Steam Methane Reforming for Residential Fuel Cell Applications. Int. J. Hydrogen Energy 2014, 39, 9180–9192. [Google Scholar] [CrossRef]
  38. Dixon, A.G. Local Transport and Reaction Rates in a Fixed Bed Reactor Tube: Endothermic Steam Methane Reforming. Chem. Eng. Sci. 2017, 168, 156–177. [Google Scholar] [CrossRef]
  39. Mancin, S.; Zilio, C.; Diani, A.; Rossetto, L. Experimental Air Heat Transfer and Pressure Drop through Copper Foams. Exp. Therm. Fluid. Sci. 2012, 36, 224–232. [Google Scholar] [CrossRef]
  40. Xu, J.; Froment, G.F. Methane Steam Reforming, Methanation and Water-gas Shift: I. Intrinsic Kinetics. AIChE J. 1989, 35, 88–96. [Google Scholar] [CrossRef]
  41. Zanfir, M.; Gavriilidis, A. Catalytic Combustion Assisted Methane Steam Reforming in a Catalytic Plate Reactor. Chem. Eng. Sci. 2003, 58, 3947–3960. [Google Scholar] [CrossRef]
  42. Dehkordi, A.M.; Memari, M. Compartment Model for Steam Reforming of Methane in a Membrane-Assisted Bubbling Fluidized-Bed Reactor. Int. J. Hydrogen Energy 2009, 34, 1275–1291. [Google Scholar] [CrossRef]
  43. Poling, B.E.; Prausnitz, J.M.; O’connell, J.P. The Properties of Gases and Liquids; Mcgraw-Hill: New York, NY, USA, 2001. [Google Scholar]
  44. Perry, R.H.; Green, D.W. Perry’s Chemical Engineers’ Handbook, 8th ed.; McGraw-Hill: New York, NY, USA, 2008. [Google Scholar]
  45. Eisfeld, B.; Schnitzlein, K. The Influence of Confining Walls on the Pressure Drop in Packed Beds. Chem. Eng. Sci. 2001, 56, 4321–4329. [Google Scholar] [CrossRef]
  46. Ngo, S.I.; Lim, Y.-I.; Kim, W.; Seo, D.J.; Yoon, W.L. Computational Fluid Dynamics and Experimental Validation of a Compact Steam Methane Reformer for Hydrogen Production from Natural Gas. Appl. Energy 2019, 236, 340–353. [Google Scholar] [CrossRef]
  47. Ni, M. 2D Heat and Mass Transfer Modeling of Methane Steam Reforming for Hydrogen Production in a Compact Reformer. Energy Convers. Manag. 2013, 65, 155–163. [Google Scholar] [CrossRef]
  48. Wang, H.; Duan, X.; Liu, X.; Ye, G.; Gu, X.; Zhu, K.; Zhou, X.; Yuan, W. Influence of Tubular Reactor Structure and Operating Conditions on Dry Reforming of Methane. Chem. Eng. Res. Des. 2018, 139, 39–51. [Google Scholar] [CrossRef]
  49. Ni, M. 2D Thermal Modeling of a Solid Oxide Electrolyzer Cell (SOEC) for Syngas Production by H2O/CO2 Co-Electrolysis. Int. J. Hydrogen Energy 2012, 37, 6389–6399. [Google Scholar] [CrossRef]
Figure 1. Schematic diagrams of reforming tubes with different structures: (a) Three-dimensional schematic diagram; (b) Two-dimensional axisymmetric schematic diagram.
Energies 18 04758 g001
Figure 2. Schematic diagrams of calculational domain of RT-2.
Energies 18 04758 g002
Figure 3. Validation of numerical method: (a) mesh independence; (b) model accuracy.
Energies 18 04758 g003
Figure 4. Velocity contours of the gas mixture in reforming tubes with different structures: (a) RT-1; (b) RT-2; (c) RT-3.
Energies 18 04758 g004
Figure 5. Schematic diagram of computational domain partitioning.
Energies 18 04758 g005
Figure 6. Axial distribution curves of the average velocity of the gas mixture.
Energies 18 04758 g006
Figure 7. Flow disturbance contours of the gas mixture in reforming tubes with different structures: (a) RT-1; (b) RT-2; (c) RT-3.
Energies 18 04758 g007
Figure 8. Axial distribution curves of the average flow disturbance intensity of the gas mixture.
Energies 18 04758 g008
Figure 9. Effect of operating parameters on pressure drop of reforming tubes: (a) inlet velocity of feed gas (Twall = 1073 K); (b) wall temperature of reforming tubes (uinlet = 0.4 m/s).
Energies 18 04758 g009
Figure 10. Temperature contours of the gas mixture in reforming tubes with different structures: (a) RT-1; (b) RT-2; (c) RT-3.
Energies 18 04758 g010
Figure 12. Effect of operating parameters on heat transfer resistance: (a) inlet velocity of feed gas (Twall = 1073 K); (b) wall temperature of reforming tubes (uinlet = 0.4 m/s).
Energies 18 04758 g012
Figure 13. Contours of the net reaction rate of MSR: (a) RT-1; (b) RT-2; (c) RT-3.
Energies 18 04758 g013
Figure 14. Axial distribution curves of the net reaction rate of MSR.
Energies 18 04758 g014
Figure 15. Contours of the net reaction rate of RM: (a) RT-1; (b) RT-2; (c) RT-3.
Energies 18 04758 g015
Figure 16. Contours of the net reaction rate of WGS: (a) RT-1; (b) RT-2; (c) RT-3.
Energies 18 04758 g016
Figure 17. Contours of the mass fraction of methane: (a) RT-1; (b) RT-2; (c) RT-3.
Energies 18 04758 g017
Figure 18. Contours of the mass fraction of hydrogen: (a) RT-1; (b) RT-2; (c) RT-3.
Energies 18 04758 g018
Figure 19. Effect of operating parameters on methane conversion: (a) inlet velocity of feed gas (Twall = 1073 K); (b) wall temperature of reforming tubes (uinlet = 0.4 m/s).
Energies 18 04758 g019
Table 1. Structural parameters of reforming tubes with different structures.
ParametersValuesParametersValues
L0/(mm)200LC/(mm)80
R0/(mm)12.5LD/(mm)20
L1(mm)60LG/(mm)25
L2/(mm)22.5HM/(mm)2
Table 2. Parameters of the reaction kinetic equations.
ParametersValuesParametersValues
A(kMSR)/(kmol·bar0.5/(kgcat·h))4.225 × 1015A(KCH4)/bar−16.65 × 10−4
A(kRM)/(kmol·bar0.5/(kgcat·h))1.020 × 1015A(KH2)/bar−16.12 × 10−9
A(kWGS)/(kmol/(kgcat·h·bar))1.955 × 106A(KCO)/bar−18.23 × 10−5
EMSR/(J/kmol)2.401 × 108A(KH2O)/[-]1.77 × 105
ERM/(J/kmol)2.439 × 108ΔHCH4/(J/kmol)−3.828 × 108
EWGS/(J/kmol)6.713 × 107ΔHH2/(J/kmol)−8.290 × 108
ΔHCO/(J/kmol)−7.065 × 108
ΔHH2O/(J/kmol)8.868 × 108
Table 3. Boundary conditions of the reforming tubes with different uinlet.
uinletTinletTwallPtS/C
0.2, 0.4, 0.6, 0.8, 1.0 m/s873 K1073 K5 bar3.0
Table 4. Boundary conditions of the reforming tubes with different Twall.
uinletTinletTwallPtS/C
0.4 m/s873 K923, 973, 1023, 1073, 1123 K5 bar3.0
Table 5. Summary table of performance parameters with different uinlet.
uinlet (m/s)Twall (K)Δp (Pa)
of RT-1
Δp
of RT-2
Δp
of RT-3
RT (K/W)
of RT-1
RT
of RT-2
RT
of RT-3
XCH4 (%)
of RT-1
XCH4
of RT-2
XCH4
of RT-3
0.21073267.73220.59231.410.301710.251590.23387.47191.6492.473
0.4554.94449.31476.80.265370.212140.1893970.36178.04980.896
0.6900.58714.5765.710.243480.190420.163559.04467.07971.084
0.81309.51021.91103.70.228250.175070.1453451.41759.24563.918
1.01783.213731491.90.216780.162950.1315545.94853.48158.552
Table 6. Summary table of performance parameters with different Twall.
Twall (K)uinlet (m/s)Δp (Pa)
of RT-1
Δp
of RT-2
Δp
of RT-3
RT (K/W)
of RT-1
RT
of RT-2
RT
of RT-3
XCH4 (%)
of RT-1
XCH4
of RT-2
XCH4
of RT-3
9230.4437.92342.69359.620.257120.209050.1828543.08745.33547.187
973476.19376.55396.850.255940.207640.1828152.84256.63159.059
1023515.55412.28436.120.258420.208430.1847362.20667.87270.702
1073554.94449.31476.80.265370.212140.1893970.36178.04980.896
1123593.57487.05518.190.276160.219010.1971676.90286.20488.531
Disclaimer/Publisher’s Note: The statements, opinions and data contained in all publications are solely those of the individual author(s) and contributor(s) and not of MDPI and/or the editor(s). MDPI and/or the editor(s) disclaim responsibility for any injury to people or property resulting from any ideas, methods, instructions or products referred to in the content.