Abstract
Reducing energy consumption in belt conveyor systems is critical to improving the overall energy efficiency of lignite mining operations. This study presents a theoretical and empirical analysis of energy use in overburden and coal conveyors, with a focus on balancing the relationship between belt speed and load. Building on the theory of conveyor motion resistance, the energy consumption index (WskZE)—previously introduced by the authors—is revisited as a function of two key variables: belt speed (v) and real-time material flow rate (Qr). Empirical validation was conducted using operational data from variable-speed conveyors in the Konin lignite mine and compared to similar-length conveyors in the Bełchatów mine. Energy consumption measurements allowed for the analysis of energy consumption for two different scenarios: (i) in the Bełchatów mine the belt speed was constant and the excavator capacity was variable and (ii) in the Konin mine the excavator capacity was kept constant and the conveyor belt speed was varied. The results confirm that WskZE is linearly dependent on belt speed and inversely proportional to throughput, as predicted by theoretical models. However, findings also show that lowering belt speed—while effective in reducing energy use—results in a higher proportion of power being consumed to move the belt and heavy idlers, especially when these components are sized for peak loads. This study suggests a revised conveyor design philosophy (a new paradigm) that emphasizes maximizing the mass ratio of transported material to moving components. Additionally, it recommends integrating real-time monitoring of energy performance indicators into mine control systems to enable energy-aware operational decisions.
1. Introduction
This study addresses the analysis of electric energy consumption by coal conveyors in a brown coal mine. Unlike previous studies that utilized empirical data from the mine [1,2,3], this paper presents theoretical considerations regarding reducing energy consumption of conveyors. Prior analyses of data from the Bełchatów mine were conducted without reference to the theory of conveyor motion resistance, resulting in empirically selected functions that were not theoretically motivated. This paper transitions from examining factors influencing energy consumption and classical relationships for determining total conveyor motion resistance to exploring power demand and the unit energy consumption index (WskZE), as defined in earlier works [1,2,3,4,5,6].
The derived dependencies were verified using empirical data published in other studies, focusing on one of the conveyors from the coal conveyors line in the Drzewce lignite pit in the Konin lignite mine. This line allows for belt speed adjustments, providing a unique opportunity to analyze the impact of speed changes on energy demand fluctuations. The research results have been documented in numerous works by various authors from Poland [7,8,9,10] and abroad [11]. The subject is current, also in terms of theoretical calculation of savings [12,13,14], speed regulation possibilities [13,15] and application of regulation in an industrial environment [14,15,16].
Polish studies [9,10,13] describe the energy consumption of the DW5 conveyor, which is similar in length (940 m) to the previously analyzed A and B conveyors in the Bełchatów mine [1,2,3]. Unlike the Bełchatów mine, in the Konin mine excavator’s efficiency remained constant during the test period, while the belt speed and, consequently, the degree of conveyor belt trough filling were adjusted and therefore it was possible to calculate WskZE as function of Q and v.
This paper theoretically and empirically determines the ratio of the power demand of the conveyor in idle motion (without mined material) to the power required to operate the conveyor under load. This analysis reveals the extent of energy waste associated with transporting an empty belt. This quotient is compared to the ratio of the mass of the transported mined material to the mass of the hauler in tire transport.
Such a comparison highlights the significance of the ratio of the mass of the mined material to the mass of the belt and idlers per running meter of the conveyor route in determining the energy efficiency of the conveyor [13,16]. Reducing the speed while maintaining efficiency is beneficial for existing lines, but for new conveyors, it is essential to reconsider the principles of belt conveyor and belt selection. The need for conveyors to handle maximum (peak) momentary efficiency, which occurs infrequently [17,18,19,20], results in long-term energy costs for transporting a wide and heavy belt, even when operating at an average efficiency of 30–40% of the theoretical efficiency [21].
Revisiting this design paradigm and managing peak performance through surge tanks behind the excavator could ensure that an even stream of mined material, adjusted to the optimally selected efficiency percentile, is fed to the receiving conveyors [18,19,20]. Additionally, better utilization of machine working time, given the low degree of calendar time utilization, could allow for longer exploitation of mined material at lower efficiency, thereby better fulfilling nominal capacity [21,22].
Efforts should also focus on reducing the weight of the belt and idlers [23,24], which depends on the width and strength of the belt. As excavator efficiency decreases, the weight of the moving parts will also change. This weight can be reduced by altering materials and construction methods.
2. Theoretical Model of Energy Consumption—Factors Affecting Energy Needs
During stable operation, the driving force of the driving drum equals the total motion resistance that must be overcome [7,25]. According to the DIN 22101 [26] standard, the total resistance to the movement of the conveyor (FC) can be divided into four main components: the main resistance (FG), the concentrated resistance (FS), the lifting resistance (FH), and the additional resistance (FD) (Equation (1)):
The total motion resistance can be calculated using Equation (2):
where mi, mb, and ml represent the mass of the idlers (i), belt (b), and load (l) per meter of the route length (in kg/m). The individual elements of this formula can be presented as the sum of the components for homogeneous sections of the conveyor route characterized by the same parameters (e.g., the angle of route inclination δ). For simplicity, it is assumed that the conveyor is homogeneous in this respect. The goal is not to calculate the exact resistance to motion, which should be carried out using specialized software considering all necessary details [27], but to illustrate the factors influencing the general proportions of the impact of various factors on the total resistance of the conveyor.
The mass ml of the mined material weighing down 1 m of the conveyor belt length (ml—mass of unit load) can be calculated from the conveyor capacity Qr and the belt speed v using Equation (3):
where the conveyor capacity Qr is given in Mg/h and the belt speed v in m/s.
The weight of the belt per meter of conveyor length is calculated using Equation (4):
For the analyzed conveyors with a belt width of B = 1.6 m, 1 m2 of belt weighs mbu = 45.88 kg/m2, (mbu—mass of 1 m2 of belt), and 1 running meter (mb) weighs mb = 73.4 kg (1.6 × 45.88), giving a total belt weight of 146.8 kg (2mb).
The mass mi of rotating parts of idlers per meter of conveyor length is calculated using Equation (5):
where

Figure 1.
Geometry of the conveyor support set in the upper and bottom strands (after [7]).
The route of the analyzed conveyors consists of repeatable elements, as shown in the drawing (Figure 2).

Figure 2.
Diagram of the route section of the analyzed conveyors (data from the mine) (after [7]).
For one 6-meter-long set of support, there are five upper sets with a total weight of 609.5 kg (each set contains three idlers, and their total weight is 121.9 kg), and one set of lower idlers with a weight of 69.8 kg. In total, the rotating parts weigh 679.3 kg, and one running meter of conveyor weighs approximately 113.2 kg.
At full load of the conveyor (its operation with a theoretical capacity of Qtheor = 6400 Mg/h), there is only 339.27 kg of excavated material (according to Formula (3)) per meter of belt. When working with a load of 30–40%, the amount of excavated material varies within the range of 101.78 kg to 135.71 kg. The influence of the weight of the belt and idlers has a significant impact on the total resistance, as their weight per meter of belt (260 kg) is twice that of the excavated material 0.39 (=102.78/260) and 0.52 (=135.71/260). This worsens the proportions for full load 1.3 (=339.27/260), for which the belt weight accounts for 43.27% of the total load (=146.8/339.27) and the idlers weight for 33.37% (=113.2/339.27). In total, the idlers and belt weight is then 76.64% of the full load, which provides a similar ratio of transported excavated material to moving mass of 1.3 (=339.27/260) as in the most efficient trucks and dumpers, e.g., Belaz-75710 1.25 (=450/360) [28]; Caterpillar 797F 1.28 (=400/312) [29]; Liebherr T 284 1.54 (=363/236) [30].
Unfortunately, when the load on the conveyor falls below the nominal load, this ratio is much worse. In the analyzed case of a 30% nominal load, this ratio is approximately 0.39, which roughly corresponds to the proportions of dumpers on the route in both directions, with and without excavated material during the return, e.g., 0.4 for Belaz-75710 (produced by the Belarusian Automobile Plant BiełAZ, Žodzina, Belarus). We use energy twice to transport the machine, and only transport excavated material in one direction with a weight corresponding to the weight of the dumper. In conical pits, trucks are able to recuperate energy during downhill movement; however, ascending requires substantially greater energy input. On a flat surface, a truck must operate in two cycles—one with load and one without. By contrast, a belt conveyor simultaneously operates the loaded upper strand and the empty return strand, with the resistance to motion accounting for both movements concurrently.
Unfortunately, when the conveyor operates below its nominal load, the efficiency ratio deteriorates significantly. In the analyzed case, at only 30% of nominal capacity, the ratio is approximately 0.39. This value is comparable to the energy efficiency of large dump trucks, such as the BelAZ-75710, where the loaded and unloaded return trips result in a similar ratio of around 0.4. In practice, energy is expended twice to move the vehicle itself, while the transported material corresponds in weight to only one trip of the truck. In conical pits, part of the potential energy can be recuperated during downhill travel, but substantially more energy is required when climbing uphill. On flat haul roads, the truck must always make a round trip—once loaded and once empty—effectively doubling the energy consumption for the same quantity of material. In contrast, a belt conveyor moves the loaded upper strand and the empty return strand simultaneously, with resistance to motion accounting for both directions at once.
The energy demand required to transport the mined material by conveyor should be estimated based on knowledge of the friction coefficient (FC). The necessary power (PC) needed to drive the conveyor, which must be transmitted by the drive system, is calculated using Equation (6) [7]:
where η is the efficiency of the conveyor drive.
3. The Energy Consumption Index WskZE
Knowing the power demand, we can determine the unit energy consumption index for transporting 1 Mg over a distance of 1 km (WskZE). If we assume that the conveyor operates with the efficiency Qr (Mg/h) for the time T (given in hours), then it transports the mass TQr of the mined material (in Mg), and the energy consumption index WskZE can be calculated from Equations (7) and (8). Similar findings were observed in a recent papers based on four years of operational data from a Polish lignite mine, where a 35% increase in average load reduced the unit energy consumption index (WskZE) by 26% [1,2,3].
After inserting FC (Equation (2)) into Equation (8), we get Equations (9)–(11):
By dividing the numerator and denominator of Equation (10) by ml, we obtain.
We can already see that the energy consumption index WskZE depends on the ratio of the unit masses of moving parts and the mass of the mined material on the belt (mi/ml and mb/ml), as well as the resistance coefficients (C and f), and the efficiency η. It also has a component that depends on the ratio of the lifting height of the mined material H and the conveyor length L. However, it does not depend directly on the length of the conveyor, as the energy consumed is calculated per kilometer of route and per metric ton of mined material.
The mass of mined material per meter of belt (ml) depends on the conveyor capacity Qr and the belt speed v (according to Equation (3)). Therefore, it is worthwhile to transform Equation (11) further:
Model Simplification for Flat Conveyors
For horizontal conveyors, when H = 0 and cosδ = 1, WskZE (Equations (12) and (13)) becomes a function of two variables: belt speed v and actual conveyor capacity Qr, and takes the form (Equation (14)):
When Qr is reduced for a sufficiently long time (smaller than Qtheor) and constant for a reasonably long time (e.g., due to the operation of excavators in more difficult conditions), then because the energy consumption index WskZE depends linearly on the speed, it is reasonable to reduce the belt speed to the minimum value ensuring full loading of the conveyor belt. At this reduced speed (when Qr is much smaller than Qtheor), we significantly reduce energy consumption.
4. Empirical Verification Using Konin Mine Data
The linear relationship between energy consumption and belt speed is consistent with the results of industrial research. The paper [13] presents the results of research on belt conveyor drive systems, which were conducted on a 940-meter-long DW5 horizontal conveyor operating in the Drzewce opencast mine in the Konin mine in Poland (Figure 3). The study included measurements of changes in the power consumed by the drives depending on the belt speed and the load of mined material.
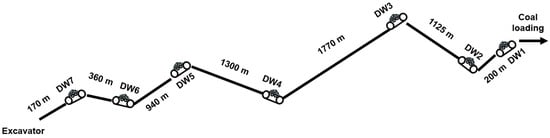
Figure 3.
Diagram of the route section of the analyzed conveyors (data from the mine) (after [13,31]).
In the work [21], the conveyor motion resistance coefficient is differentiated based on various parameters of the belt, conveyor, material, and even temperature. These factors can affect the quotient of power demand in motion, both with and without load, whether fully or partially. This requires separate studies. The considerations presented are estimates based on data read from the graph.
In the case of horizontal conveyors [7], which are primarily used in the belt line of the Drzewce opencast mine, the energy consumption of belt conveyors was measured as a function of changes in the belt speed at a constant load (the excavator operated with a constant efficiency Qr = 833 Mg/h). Energy consumption is practically proportional to the belt speed (Figure 4).
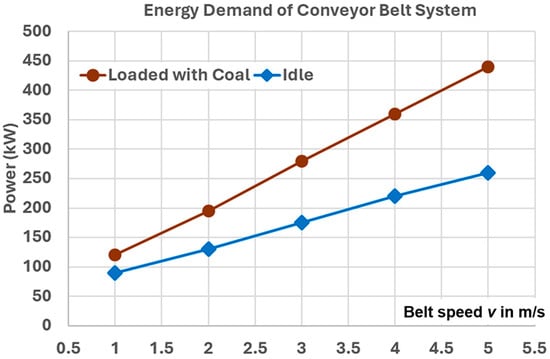
Figure 4.
Dependence of power consumption of the drive systems of an empty and loaded flat belt conveyor on the belt speed (based on [13]).
5. Analysis of Belt Resistance and Power Ratios
The power demand (PC, in kW) can be determined from Equation (6) by inserting FC (Equation (2)):
The required power for no-load motion (Pidle) can be determined by assuming ml = 0, and for a horizontal conveyor cosδ = 1:
For a horizontal conveyor, when H = 0 and cosδ = 1, we have Equation (18):
As a result of the adopted assumptions, the ratio of power required to operate the conveyor without and with the mined material for a flat conveyor corresponds to the ratio of the mass of the moving parts of the idlers and the belt to the total mass with the mined material (Equation (19)):
The higher the ratio of the mass of the mined material to the mass of the moving parts, the smaller the share of power required to operate the empty conveyor will be of the active power required to operate the loaded conveyor. For a constant capacity Qr = 833 Mg/h and speeds v = 1, 2, 3, 4, and 5 m/s, this ratio changes from approximately 50.51% to 67.12%, 75.38%, and 80.33%. This does not correspond to the measurement results (Figure 4): 73.75%, 65.24%, 63.59%, 61.02%, and 58.95%, which may indicate that the amount of mined material (ml) affects the change of the resistance to motion coefficient (f), which assumes different values for idle run and work under load. It probably also changes depending on the degree of belt filling, and perhaps in another way with the belt speed. With the change in belt load, its contact zone and pressure change, and this is also influenced by the level of its initial tension, which is not taken into account here. It is therefore clear that continuing research is worthwhile, and knowledge of how the demand for power for conveyors changes at different speeds and filling levels is highly valuable.
Introduction of Variable Coefficient of Resistance f(v)
Let us assume that the coefficient of resistance to motion depends on the belt speed. Then, the power ratio will take the following form (Equation (20)):
Statistical methods were used to select functions so that the product of Cf for idle and loaded operation would provide a good fit for the power demand equations. It was assumed that the conveyor has a length of L = 940 m, the mass of the moving parts is 260 kg, and the capacity of 1 m of the belt is 232.80 kg. Then, Cf as a function of speed will take the following form (Equations (21) and (22)):
Cfidle(v) = 0.0169222 + 0.0188338/v
Cf(v) = 0.0303286 − 0.00485153/v
These equations are not optimized for achieving the highest R2 index, but rather simple models that ensure their product with linear equations yields a linear result for idle operation and an almost linear result for load operation. They can be determined using the assumed values. The power requirements Pidle(v) and PC(v) at different speeds v, taking into account the variation in drag coefficient Cf(v) (Equations (21) and (22)), are given by Equations (23a), (23b), (24a) and (24b):
Pidle(v) = Cfidle(v) × 2523.752v
Pidle (v) = 47.53184 + 42.70744v
PC(v) = Cf(v) (2523.752v + 2246.03)
PC(v) = 55.8749 + 76.54185v − 10.897/v
For the functions thus determined, the quotient of the demand for power of the conveyor without and with load now corresponds to the proportions determined from the graph (Figure 4) and does not deviate from them by more than +/−2%. For the subsequent speeds of 1, 2, 3, 4, 5, and 6 m/s, the power ratio is 74.26%, 65.33%, 62.32%, 60.77%, and 59.82%, respectively. This means that even at 6 m/s, nearly 60% of the energy is used to overcome the resistance to the movement of the empty belt (ratio 1.5:1). At 1 m/s, the ratio of energy used to transport the belt to the energy used to transport the excavated material is 4:1 (Figure 5).
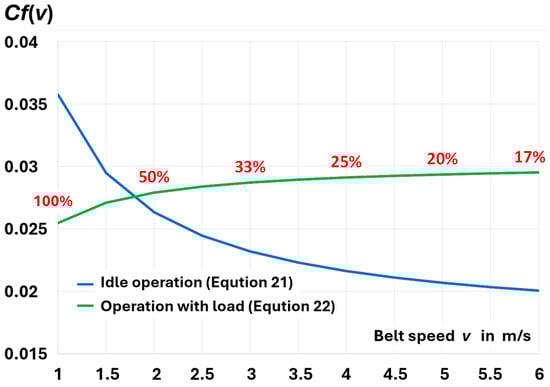
Figure 5.
Changes in the product Cf(v) as a function of belt speed v (in m/s) and belt filling degree (in %, assumed to be 100% for the speed of 1 m/s) at a constant capacity Qr = 833 Mg/h [based on [1]).
In the calculations, it was assumed that for the measurements described in [7], the speeds were selected so that the capacity Qr = 833 Mg/h filled the belt trough by about 100% at v = 1 m/s. With this assumption, at a speed of 5.24 m/s, the minimum nominal capacity of the line Qtheor should be approximately 4400 Mg/h, and at 6 m/s, about 5000 Mg/h. Of course, it could be higher, and then the mass of 233.80 kg/m would correspond to a lower value of the filling degree. This is not crucial for the nature and direction of changes.
For the data presented in the graph (Figure 4), it is possible to calculate and plot changes in WskZE as a function of the belt load (its degree of filling, Figure 6). The energy consumption rate decreases with the increase in belt load (the degree of utilization of the theoretical capacity).
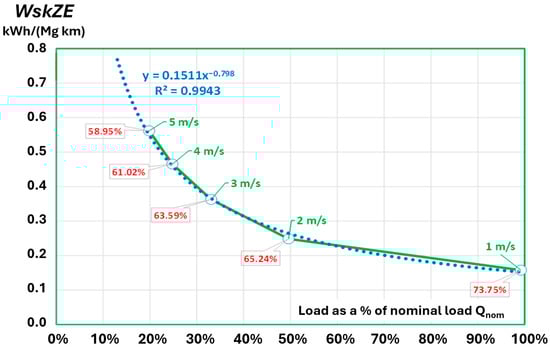
Figure 6.
Changes in the unit energy consumption index WskZE for the DW5 conveyor and the data from (Figure 4). For the measurement points, the belt speed and the conveyor’s power demand during no-load operation were given as a percentage of the demand with load (based on [1]).
After calculating WskZE based on the measurements (according to Equation (7)), the parameters in the linear equation of Formula (14) can be selected. This will allow for estimating some unknown parameters (Equation (25), Figure 7):
WskZE(v) = 0.18589 × (0.551314v + 1/3.6) = 0.102484v + 0.051636
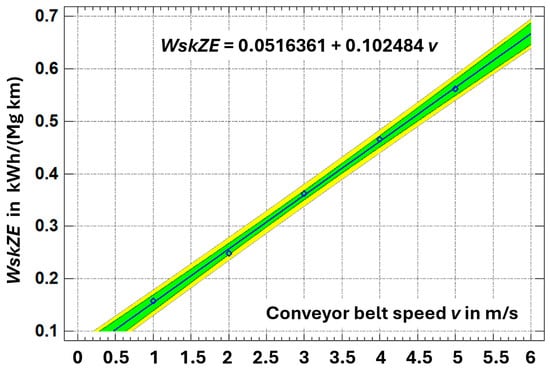
Figure 7.
WskZE as a function of belt speed for constant excavator performance for the DW5 conveyor (based on [1]); 95% confidence limit (green area) and 95% prediction limits (yellow area).
Given Cfg/η = 0.18589 and (mi + 2mb)/Qr = 0.551314.
This allows for us to estimate the weight of the belt and rollers at approximately 459.24 kg/m, which appears to be an excessively high value in light of the value determined for the conveyors from the Bełchatów mine (260 kg/m).
After applying the estimates from Bełchatów, the equation is slightly modified, and the estimation error increases slightly, but the equation parameters are closer to the actual data (Equations (26a) and (26b)):
WskZE = 0.299555 × (260 × v/833 + 1/3.6)
WskZE = 0.093498559v + 0.083209722
Given Cfg/η = 0.299555, the change in capacity and speed must meet the condition of the maximum amount of excavated material that can be transported on the belt. It was assumed that this quantity is 233.25 kg/m (=4400/(3.6 × 5.24)). In the graph (Figure 8), this is illustrated by removing data for about half of the graph below the diagonal (833 Mg/h, 6 m/s). If, due to transfers, only the maximum amount of excavated material remains on the belt, then WskZE will no longer depend on Qr and v, because the belt cannot accept more loaded material. From Equation (11), it follows that this indicator depends on the amount of loaded material ml (for a given route structure, which determines the values of mi and mb). Qr and v are used only to determine this amount, provided that it does not exceed the maximum value resulting from the capacity of the belt.
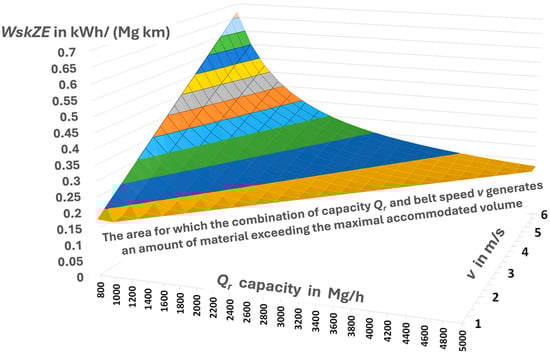
Figure 8.
WskZE(v,Q) for speed changes in the range of 1–6 m/s and capacity of 800–5000 Mg/h. WskZE = 0.299555 (260v/Qr + 1/3.61) (based on [1]).
6. Calculation of WskZE for Konin Mine and Comparison with Bełchatów Mine
Similar results were presented in two works [9,31]. They also concern horizontal belt conveyors from the Drzewce opencast mine, where the energy consumption of belt conveyors was measured as a function of belt speed changes at a constant load on a coal line with adjustable conveyor speed. These papers also confirmed that energy consumption is proportional to belt speed (Figure 9). Unfortunately, the graphs presented in two publications [9,31] appear ambiguous in terms of the description of the x-axis, making it difficult to conclude, so the figures (Figure 9) are only estimations. Both articles present similar proportions of energy consumed in idle run to energy used to transport coal with constant efficiency.
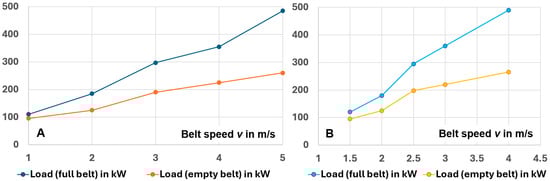
Figure 9.
Power consumption curve of the drive systems of the empty and loaded conveyor belt depending on the belt speed based on data from (A) [31] and (B) [9].
Despite the ambiguity of the x-axis description, these data can be used in rough WskZE calculations (according to Equation (7)). It was assumed that the data originated from a variable-speed line in the Drzewce opencast mine, which operated at a capacity of 833 Mg/h, and most likely from the same DW5 flat conveyor, as mentioned in other studies [13].
For the general case, it can be seen that the power PC depends linearly on L, which is why the conversion of the specific energy consumption per 1 km of route in the formula for WskZE (according to Equation (14)) removes this influence. Notably, to calculate the consumption for the entire route, WskZE should be multiplied by the route length L given in kilometers.
The slope of the straight line for determining the demand for conveyor power PC (Equations (15)–(18)) is 0.94Cfg(mi + 2mb)/(1000η). Clearly, the greater the mass of the idlers and belt per meter of the conveyor, the faster the power required to overcome the resistance to movement increases. The increase in the conveyor’s capacity moves the entire line vertically, increasing the required power when Q increases or decreasing it when Q decreases. Notably, certain combinations of Q and v are not feasible to implement, as each speed has a limiting efficiency resulting from the belt’s capacity. Therefore, it is not possible to reduce demand by reducing speed and increasing efficiency. Savings can be achieved by reducing the speed when the efficiency drops for some reason. Real data from measurements in the mine confirm this.
In the work [9] for the 5.716 km long chain of coal conveyors in the Drzewce opencast mine of KWB Konin, the specific energy consumption index was determined. WskZE was 0.26141 kWh/(Mgkm). In one month, 187,196 kWh of electric energy was used to transport 125,280 tons of coal over a distance of 5.716 km (Table 1).

Table 1.
Specific energy consumption index WskZE in the Drzewce opencast mine [9].
In a previous article [9], WskZE was determined for a larger number of overburden and coal lines in the KWB “Konin”. The DW5 conveyor from the Drzewce open pit resembles conveyors A and B analyzed in the works [2,3]. It is 940 m long, i.e., almost 1 km as conveyor A and B. Its distinguishing feature is the possibility of speed regulation, which resulted in a reduction in WskZE from the average level in other open pits of approximately 0.4997 kWh/(Mgkm) (0.442 kWh/(Mgkm) in the Lubstów branch, 0.594 kWh/(Mgkm) in the Jóźwin branch, and 0.463 kWh/(Mgkm) in the Kazimierz branch) to the level of 0.261 kWh/(tkm). This is a reduction of approximately 50%. It is important that the low level of the WskZE indicator in the KWB “Bełchatów” was achieved without speed regulation, and the benefits of using energy-saving belts will be shown in the next paper. The average value of this indicator was 0.2886 kWh/(tkm) (conveyor A) and 0.3036 kWh/(tkm) (conveyor B) [1,2,3]. It is evident that there is still potential for further energy savings, making it worthwhile to continue researching various possibilities for reducing this indicator.
Similar results were presented in [31]. The Konin lignite mine operates conveyors with a total length of 50 km. The length of belt conveyors with adjustable belt speed in the coal line constitutes 12% of the total length of the conveyors in operation. Between May 2006 and March 2007, 3328.781 MWh of energy were used, and 2,323,101 Mg of coal was transported over a distance of 5867 km. The energy consumption index was 0.244 kWh/(Mgkm). The analyzed line operated at a speed of 3 m/s for 8 months and at 2.5 m/s for 3 months. The achieved index was therefore slightly lower than that presented in Table 1. Energy consumption is therefore over 50% lower than in the Kazimierz open-pit mine (0.434 kWh/tkm) and the Jóźwin open-pit mine (0.622 kWh/tkm). As a result, energy consumption was reduced by 4.2% throughout the plant.
In the Konin coal mine, approximately 70% of the electricity is consumed by the drive systems [13]. The overburden conveyors consume 51%, and the coal conveyors consume 6%, as coal is transported to the power plant by train. Overburden excavators consume 9%, coal excavators 1%, and stackers 8%. In total, this accounts for 78% of the mine’s total energy consumption, and the mine consumes approximately 350 GWh per year [10] (Figure 10).
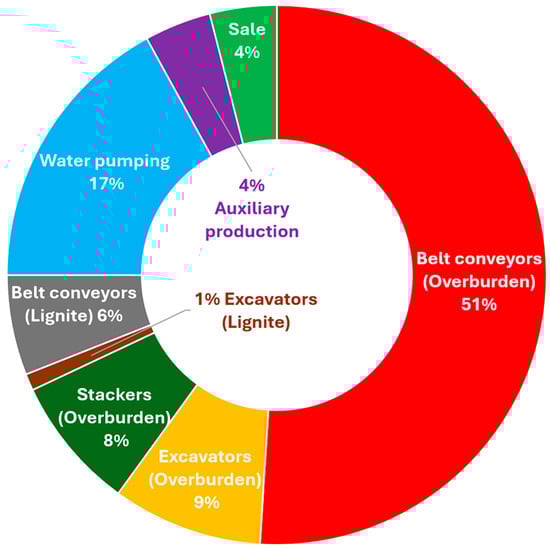
Figure 10.
Energy consumption of the Konin coal mine, divided into individual technical processes [9].
According to the authors of [13], the optimal consumption of electric energy occurs when the conveyor operates with a nominal load. Since the load of the conveyor belt depends on the type of material transported by the belt (coal, overburden) and on the excavator’s capacity, which is variable, the conclusion is that the belt speed should be adjusted to the current load [13]. Due to the diversified geological structure of coal seams, it is not possible to ensure a constant efficiency of the coal excavator, which would simultaneously provide the nominal load of the belt conveyor at a constant nominal speed of 5.24 m/s. In such applications, to ensure the nominal filling of the belt, it is necessary to adjust the conveyor belt speed to match the excavator’s instantaneous efficiency [20,32].
The scale of savings achieved (4.2% on a mine scale) thanks to modifications of 12% of transport routes seems significant. However, the problem lies in forecasting efficiency in advance, which would enable matching the speed to the expected efficiency during the entire conveyor’s loading period.
7. Discussion of Results
This article presents results of tests carried out in the Konin lignite mine, previously reported in [9,10,13,31]. Konin is the second Polish mine—after Bełchatów [1,2,3]—to pursue reductions in conveyor energy use. In Konin, approximately 70% of the site’s ~350 GWh annual electricity consumption is attributable to conveyor drives. Conveyor lines equipped with variable-speed capability matched to the excavator’s actual throughput accounted for 12% of the transport system. Modifications implemented during the tests yielded annual savings of about 4.2% of the mine’s total electricity consumption. Extending these measures to the entire system is estimated to offer a further ~30% reduction, i.e., up to ~35% in total. Prior analyses of fixed-speed conveyors under variable loading [3] showed that proper load management can reduce the energy consumption index, WskZE, by up to ~30% within realistic operating variability (between the maximum and minimum recorded monthly average loads, which were far below full capacity).
In parallel, the planned phase-out of lignite mining under EU climate policy has shortened the investment horizon for such operations, weakening incentives for further modernization. The Konin mine has essentially concluded operations, and KWB Bełchatów is reducing output, with operation planned until 2036.
To facilitate wider uptake of the test findings, we propose a modification of the well-known simplified method recommended by DIN 22101 and CEMA for estimating conveyor motion resistances. Specifically, the required power at idle (Equation (15)) and under load (Equation (17)) is expressed as an explicit function of belt speed v, conveyor length L, and the excavator’s actual throughput Qr. In the same framework, the specific energy consumption index WskZE (Equation (14)) is reformulated per 1 km of conveyor route, thereby eliminating L from the expression.
This formulation enables the resistance coefficient Cf in Equation (2) to be identified from measurements not as a fixed, selected constant, but as a function of belt speed, Cf(v) (Figure 5), both for idle operation (Equation (21)) and for loaded operation (Equation (23)).
The proposed approach supports more effective balancing of the actual load and belt speed and simplifies estimation of the achievable energy-saving potential in conveyor systems. Because it relies on the simplified method, it is accessible to practitioners without the need for specialist laboratory and field campaigns. By contrast, the unit resistance method is more complex and typically requires dedicated expertise to determine the necessary parameters.
With this method, changes in WskZE can be quantified for different belt speeds and plotted as a function of the belt loading degree (Figure 6). As expected, WskZE decreases as belt loading (i.e., utilization of theoretical capacity) increases.
Presenting the results as a bivariate surface WskZE(v, Qr) makes it straightforward to locate the minima, which lie along the diagonal (Figure 8). Such (v, Qr) combinations ensure maximum filling of the belt trough. For a given capacity Qr, exceeding a threshold belt speed v reduces the degree of filling and increases WskZE. Conversely, for a fixed v, there exists a maximum Qr that fully utilizes the belt; operating below this limiting capacity decreases filling and again increases WskZE.
8. Dynamic Belt Speed Control and Buffering Under Variable BWE Output—Directions for Further Research
When a conveyor operates well below its nominal load, its energy-efficiency ratio deteriorates. In the case analyzed, at 30% of nominal capacity the ratio is ≈0.39, comparable to large dump trucks (e.g., BelAZ-75710), where the loaded trip and empty return yield ≈ 0.4. Trucks must always complete a round trip—once loaded and once empty—so energy is expended twice to move the vehicle, whereas the conveyed material corresponds to a single direction. In conical pits, limited potential energy can be recuperated on descent but significantly more energy is required uphill. In contrast, a belt conveyor moves the loaded upper and empty return strands simultaneously, and resistance to motion accounts for both directions at once.
Energy use is highly sensitive to belt speed v and variability of excavator output Qr. Lowering v reduces the specific energy index WskZE but increases travel time (for a 2 km conveyor: 6.36 min at 5.24 m/s; 13.33 min at 2.5 m/s; >33 min at 1 m/s). Net savings therefore require sufficient stability of Qr over the longer transport horizon; otherwise, a rising Qr with insufficient speed ramp-up risks spillage and offsets benefits. Speed adjustments should be synchronized with realistic excavator schedules and known disturbances (e.g., buried drainage pipes [32] or hard-to-excavate layers [17]). Although [9] proposed adapting belt speed to real-time excavator performance, industrial deployment has not been reported. Short, frequent performance drops to near zero during the bucket wheel cycle [19] make it uneconomic to chase every fluctuation; the process is non-stationary with intermittent cycles [19,20], only locally approximable as stationary over short windows [20,33], and further complicated by geology and operational anomalies.
A practical remedy is a buffer hopper placed behind the excavator to absorb rare peaks, enabling a steadier inflow without oversizing belts or tracking every transient. Instead of designing for rare maxima, buffering smooths the flow to a chosen percentile (e.g., 90th) of Qr [20,21,22]; excess material is stored and released when output drops. Hopper volume should be co-optimized with belt width and speed. DEM can support design by capturing material mechanics under varying moisture and weather [33,34,35]. Without buffering, belts must be selected for extremes, driving wider/heavier belts with disproportionate energy use and wear—especially in the central zone (Figure 11; after [1]).
Figure 11.
Cumulative distribution of cord damage in the ST belt core based on DiagBelt magnetic diagnostics (totals and changes since last scanning in yellow); photos of the belt and conveyor (after [1]).
Measurements also confirm that the gravity-related resistance Cfg is speed-dependent: on the DW5 conveyor (Konin), the idle-to-loaded power ratio varies markedly with v; Cfg should therefore be modeled as Cfg(v), not a constant. This has direct implications for control, as speed selection policies should reflect Cfg(v).
Oversizing for rare peaks is inefficient: the moving mass term (mi + 2mb) in Formula (15) penalizes everyday operation. Consistent with [18,21,22], extreme utilization is rare and wide belts are frequently under-filled, especially when the belt runs at full speed while the excavator slows, accelerating wear and wasting energy.
AI-assisted control. Recent studies show that automatic speed control can cut energy use without reacting to every short-lived fluctuation. Vision-based coal flow estimation with deep learning enables closed-loop speed control that suppresses no-load running and reduces spillage risk [36]. In distributed direct-drive systems, intelligent multi-motor coordination (e.g., adaptive/fuzzy with RBF-NN estimators) improves load sharing and lowers losses [37]. Robust, load-aware speed control under fluctuating throughputs has also been proposed using advanced optimization/robust control formulations [38]. In practice, these methods are most effective in a hierarchical architecture:
- (i)
- A slow supervisory layer (minutes) sets target v from predicted Qr, buffer level, and Cfg(v);
- (ii)
- A fast actuator layer (seconds) enforces constraints (spillage, filling, torque) with hysteresis/dead-band to avoid non-economic reactions. The AI controller smooths actions, while buffers smooth the flow.
Modern mines collect extensive telemetry on energy, mass flow, and operating time [1,2,3], yet utilization remains limited. Advanced statistics and Industry 4.0 toolchains should convert raw telemetry into actionable policies. Peak-Over-Threshold analysis [19] combined with DEM [33,34,35] helps size buffers and forecast peaks; digital twin models can then test policies prior to deployment. Finally, feed/discharge storage tanks may offer reliability at lower CAPEX/OPEX than duplicating conveyor lines. Studies of belt core wear [33] show that under stable flow, service life is governed more by cover abrasion than core degradation, consistent with length-based longevity forecasts [21]. These findings reinforce optimized layouts and speed control [39,40,41], energy-saving belts [42], improved loading [43], energy efficiency classification frameworks [6,8,44,45], and benchmarking against truck haulage for energy/emissions [46].
9. Conclusions
Two-variable efficiency surface, expressed as WskZE(v, Qr), provides a robust framework for conveyor optimization. Both theory and field data from Konin show that the most favorable operating points correspond to conditions of high belt filling (diagonal ridge in the (v, Qr) plane).
Lowering belt speed can reduce energy consumption, but only when the material flow remains sufficiently stable. Attempts to follow short-term fluctuations are uneconomic, reflecting the intermittent nature of excavator output.
Buffer hoppers designed with DEM simulations offer a more effective solution than oversizing conveyors. By smoothing material flow to a defined percentile, they reduce both energy use and mechanical wear.
Measurements indicate Cfg varies with v. Models and control policies should therefore adopt Cfg(v) in calculations, ensuring more accurate representation of real operating conditions.
Oversizing belt width for rare peaks increases mass (mi + 2mb) and decreases typical efficiency. Effective design requires linking belt width selection with speed scheduling to maintain consistently high filling.
AI-assisted hierarchical control, combining different methods of flow estimation (including vision-based) with intelligent motor coordination, enables energy savings without the need to react to every transient change in flow.
Telemetry already collected in mines should be fully exploited with advanced statistical methods and Industry 4.0 tools. This allows for calibration of resistance models, forecasting of material flow, and calculation of optimal speed set-points.
In practice under stable flow, belt life is dominated by cover abrasion rather than core degradation. Improvements in layouts, loading, belt design, and speed control all contribute to lower life-cycle energy use and costs compared with truck haulage.
Future work should validate Cfg(v) across temperatures, materials, and idler/belt variants; try to pilot AI-assisted hierarchical speed control with practical dead-bands; integrate buffer–conveyor co-design using DEM and POT; standardize reporting of WskZE to enable cross-mine benchmarking and control of current operation.
Author Contributions
Conceptualization, L.J. and M.B.; methodology, L.J.; software, L.J.; validation, L.J. and M.B.; formal analysis, L.J.; investigation, M.B.; resources, L.J. and M.B.; data curation, L.J. and M.B.; writing—original draft preparation, L.J.; writing—review and editing, M.B.; visualization, L.J.; supervision, L.J.; project administration, M.B.; funding acquisition, M.B. and L.J. All authors have read and agreed to the published version of the manuscript.
Funding
This research received no external funding.
Data Availability Statement
The data presented in this study is available on request from the corresponding author.
Conflicts of Interest
The authors declare no conflicts of interest.
References
- Bajda, M.; Jurdziak, L. Comparison of electric energy consumption by belt conveyors in a brown coal mine. Part 4. Theoretical considerations and verification for data from Konin. Górnictwo Odkryw. 2019, 60, 4–16. (In Polish) [Google Scholar]
- Bajda, M.; Jurdziak, L. Electric Energy Needs of Belt Conveyors in One of the Polish Lignite Mines—Method of Analysis. Civ. Environ. Eng. Rep. 2025, 35, 170–184. [Google Scholar] [CrossRef]
- Bajda, M.; Jurdziak, L.; Konieczka, Z. Impact of Monthly Load Variability on the Energy Consumption of Twin Belt Conveyors in a Lignite Mine. Energies 2025, 18, 2003. [Google Scholar] [CrossRef]
- Kawalec, W.; Suchorab, N.; Konieczna-Fuławka, M.; Król, R. Specific Energy Consumption of a Belt Conveyor System in a Continuous Surface Mine. Energies 2020, 13, 5214. [Google Scholar] [CrossRef]
- Suchorab, N. Specific energy consumption—The comparison of belt conveyors. Min. Sci. 2019, 26, 263–274. [Google Scholar] [CrossRef]
- Suchorab-Matuszewska, N. Data-Driven Research on Belt Conveyors Energy Efficiency Classification. Arch. Min. Sci. 2024, 69, 375–389. [Google Scholar] [CrossRef]
- Kulinowski, P. Selection of Drive Power and Conveyor Belt Strength in Steady-State Operating Conditions. Belt Conveyor–Calculations. Available online: http://www.kmg.agh.edu.pl/Dydaktyka/Przedmioty/Transport_przenosnikowy/Materialy/PT_algorytm.pdf (accessed on 20 June 2025). (In Polish).
- Woźniak, D.; Hardygóra, M. Aspects of selecting appropriate conveyor belt strength. Energies 2021, 14, 6018. [Google Scholar] [CrossRef]
- Szymański, J. Coal conveyors with adjustable belt speed. Technical and economic aspects. Górnictwo Geoinżynieria 2009, 33, 427–438. (In Polish) [Google Scholar]
- Szymański, J. Logistic and economic issues of transporting brown coal in mines using conveyors with adjustable belt speed. Logistyka 2009, 4, 44–48. (In Polish) [Google Scholar]
- Jena, M.C.; Mishra, S.K.; Moharana, H.S. Experimental investigation on maximizing conveying efficiency of belt conveyors used in series application and estimation of power consumption through statistical analysis. Environ. Prog. Sustain. Energy 2023, 42, e14031. [Google Scholar] [CrossRef]
- Ji, J.; Miao, C.; Li, X.; Liu, Y. Speed regulation strategy and algorithm for the variable-belt-speed energy-saving control of a belt conveyor based on the material flow rate. PLoS ONE 2021, 16, e0247279. [Google Scholar] [CrossRef]
- Matras, E.; Reizer, R.; Umiński, W. Optimization of belt conveyor operation. Probl. Eksploat. 2007, 1, 57–65. (In Polish) [Google Scholar]
- Wen, L.; Liang, B.; Zhang, L.; Hao, B.; Yang, Z. Research on coal volume detection and energy-saving optimization intelligent control method of belt conveyor based on laser and binocular visual fusion. IEEE Access 2023, 12, 75238–75248. [Google Scholar] [CrossRef]
- Zhou, Q.; Gong, H.; Su, W.; Yan, Q.; Shi, K.; Du, G. Active speed control of belt conveyor with variable speed interval based on fuzzy algorithm. J. Electr. Eng. Technol. 2024, 19, 1499–1513. [Google Scholar] [CrossRef]
- Gładysiewicz, L.; Kawalec, W.; Król, R. Selection of carry idlers spacing of belt conveyor taking into account random stream of transported bulk material. Eksploat. Niezawodn.–Maint. Reliab. 2016, 18, 32–37. [Google Scholar]
- Galetakis, M.; Michalakopoulos, T.; Bajcar, A.; Roumpos, C.; Lazăr, M.; Svoboda, P. Project Bewexmin: Bucket Wheel Excavators Operating under Difficult Mining Conditions Including Unmineable Inclusions and Geological Structures with Excessive Mining Resistance. In Proceedings of the 13th ISCSM, Belgrade, Serbia, 11–14 September 2016. [Google Scholar]
- Jurdziak, L. Methodology of BWE efficiency analysis for power reduction of conveyor drives. In Proceedings of the 8th International Symposium Continuous Surface Mining, ISCSM 2006, Aachen, Germany, 24–27 September 2006; pp. 125–131. [Google Scholar]
- Jurdziak, L. Application of extreme value theory for joint dimensioning of BWEs and long distance belt conveyors in lignite mine. In Proceedings of the International Conference on Bulk Europe 2008, Prague, Czech Republic, 11–12 September 2008. [Google Scholar]
- Jurdziak, L. Analysis of Moving Averages of BWEs Actual Capacity. Advances in Intelligent Systems and Computing. In Proceedings of the Intelligent Systems in Production Engineering and Maintenance, ISPEM 2019, Paris, France, 26 February 2019; Volume 835. [Google Scholar] [CrossRef]
- Kolovos, C. Efficiency of a bucket wheel excavator lignite mining system. Int. J. Surf. Min. Reclam. Environ. 2004, 18, 21–29. [Google Scholar] [CrossRef]
- Kasztelewicz, Z. Analysis of the operating parameters of domestic brown coal mines. Górnictwo Odkryw. 2004, 46, 21–32. (In Polish) [Google Scholar]
- Kulinowski, P.; Kasza, P.; Zarzycki, J. Influence of design parameters of idler bearing units on the energy consumption of a belt conveyor. Sustainability 2021, 13, 437. [Google Scholar] [CrossRef]
- Kulinowski, P.; Kasza, P.; Zarzycki, J. Methods of Testing of Roller Rotational Resistance in Aspect of Energy Consumption of a Belt Conveyor. Energies 2022, 16, 26. [Google Scholar] [CrossRef]
- Gładysiewicz, L. Belt Conveyors—Theory and Calculations; Wrocław University Science and Technology Press: Wrocław, Poland, 2003. (In Polish) [Google Scholar]
- DIN 22101:2011-12; Continuous Conveyors—Belt Conveyors for Loose Bulk Materials—Basis for Calculation and Dimensioning. ISO: Geneva, Switzerland, 2011.
- Kawalec, W.; Kulinowski, P. Conveyor belt calculations. Transp. Przemysłowy 2007, 1, 6–11. (In Polish) [Google Scholar]
- Available online: https://en.wikipedia.org/wiki/BelAZ_75710 (accessed on 20 June 2025).
- Available online: https://en.wikipedia.org/wiki/Caterpillar_797 (accessed on 20 June 2025).
- Available online: https://en.wikipedia.org/wiki/Liebherr_T_282_series (accessed on 20 June 2025).
- Kasztelewicz, Z.; Szymański, J. Energy saving control method of electrical drives in conveyor belts with regulated speed in surface brown coal mine. Arch. Min. Sci. 2008, 53, 319–329. [Google Scholar]
- Nowak-Szpak, A.; Strempski, A.; Bajcar, A. The results of studies on mining process in example of excavator SchRs 4000.37.5. Górnictwo Odkryw. 2012, 53, 85–91. (In Polish) [Google Scholar]
- Doroszuk, B.; Król, R. Analysis of conveyor belt wear caused by material acceleration in transfer station. Min. Sci. 2019, 26, 189–201. [Google Scholar]
- Walker, P.; Doroszuk, B.; Król, R. Analysis of ore flow through longitudinal belt conveyor transfer point. Eskploatacja Niezawodn.–Maint. Reliab. 2020, 22, 536–543. [Google Scholar] [CrossRef]
- Walker, P.; Kawalec, W.; Król, R. Application of the discrete element method (DEM) for simulation of the ore flow inside the shaft ore bunker in the underground copper ore mine. In Intelligent Systems in Production Engineering and Maintenance; Springer International Publishing: Cham, Switzerland, 2019; pp. 633–644. [Google Scholar]
- Xu, Z.; Sun, Z.; Li, J. Research on Coal Flow Visual Detection and the Energy-Saving Control Method Based on Deep Learning. Sustainability 2024, 16, 5783. [Google Scholar] [CrossRef]
- Zhou, Q.; Shi, K.; Xu, K.; Du, G.; Gao, K. Optimized Multi-Motor Power Control Strategy for Distributed Permanent Magnet Direct Drive Belt Conveyors. Appl. Sci. 2024, 14, 8343. [Google Scholar] [CrossRef]
- Yuan, Y.; Qu, W.; Zhou, L.; Zhang, A.; Bai, Y.; Wang, M. Energy-Saving Speed Control of Mining Belt Conveyor Based on Second-Order Linear Self-Immunity. AIP Adv. 2025, 15, 075317. [Google Scholar] [CrossRef]
- Gladysiewicz, L.; Kawalec, W. Optimised selection of a belt conveyor loaded by a BWE. In Proceedings of the 8th International Symposium of Continuous Surface Mining ISCSM, Achen, Germany, 24–27 September 2006; pp. 353–357. [Google Scholar]
- He, D.; Liu, X.; Zhong, B. Sustainable belt conveyor operation by active speed control. Measurement 2020, 154, 107458. [Google Scholar] [CrossRef]
- Vasić, M.; Miloradović, N.; Blagojević, M. Speed control of high power multiple drive belt conveyors. IMK-14–Res. Dev. Heavy Mach. 2021, 27, 9–15. [Google Scholar] [CrossRef]
- Bajda, M.; Jurdziak, L.; Pactwa, K.; Woźniak, J. Energy-Saving of Conveyor Belts in the Strategy and Reporting of Corporate Social Responsibility Initiatives of Producers. In Global Congress on Manufacturing and Management; Springer International Publishing: Cham, Switzerland, 2021; pp. 402–414. [Google Scholar]
- Bahadirov, G.A.; Gulmatov, A.B.; Umarov, B.T.; Mirzayev, O.T. Eco-efficient conveyer belt loading methods. A classification approach for minimizing energy consumption. E3S Web Conf. 2025, 614, 01004. [Google Scholar] [CrossRef]
- Kawalec, W.; Woźniak, D. Energy efficiency of the bottom cover of a conveyor belt–the first step to the new classification of belts. Min. Sci. 2014, 21, 47–60. [Google Scholar]
- Konieczna-Fuławka, M. Energy-Saving Solutions Applied in Belt Conveyors: A Literature Review. Energies 2025, 18, 3019. [Google Scholar] [CrossRef]
- Liu, F.; Cai, Q.; Chen, S.; Zhou, W. A comparison of the energy consumption and carbon emissions for different modes of transportation in open-cut coal mines. Int. J. Min. Sci. Technol. 2015, 25, 261–266. [Google Scholar] [CrossRef]
Disclaimer/Publisher’s Note: The statements, opinions and data contained in all publications are solely those of the individual author(s) and contributor(s) and not of MDPI and/or the editor(s). MDPI and/or the editor(s) disclaim responsibility for any injury to people or property resulting from any ideas, methods, instructions or products referred to in the content. |
© 2025 by the authors. Licensee MDPI, Basel, Switzerland. This article is an open access article distributed under the terms and conditions of the Creative Commons Attribution (CC BY) license (https://creativecommons.org/licenses/by/4.0/).