1. Introduction
Batteries are the most commonly used devices for storing electrical energy [
1,
2,
3]. They have been used in technology for over 150 years [
4,
5], and their design is constantly being improved. The literature contains a wealth of information on the materials from which batteries are made, and there is a constant development and investigations of new materials that allow for the accumulation of larger amounts of electric charge and a higher number of permissible charge and discharge cycles while maintaining the same or lower battery mass [
1,
4,
6,
7,
8]. They are used in mobile devices [
9,
10], electric vehicles [
11,
12], and energy storage systems dedicated to renewable energy sources [
13,
14,
15,
16]. An equally important application of batteries is unmanned vehicles operating in various environments and over a wide range of ambient temperatures [
17].
Each battery stores an electric charge and contains two electrodes and an electrolyte. Depending on the materials used in their construction, batteries exhibit different values of parameters such as nominal voltage, energy efficiency, and permissible number of charge–discharge cycles [
1,
4,
5].
From the perspective of possible battery applications, parameters such as battery capacity C, nominal voltage V
nom, maximum permissible discharge current I
outmax, maximum permissible charging current I
inmax, and self-discharge rate are important [
1,
4]. Each of the above parameters depends on the battery design, and some of them also on its geometric dimensions. For each power supply system containing batteries, a different type and size of battery is best suited to its typical operating conditions [
13].
When analyzing the operation of an electronic system containing batteries, one can distinguish alternating charge and discharge cycles. As the battery’s state of charge changes, the voltage at its terminals changes. Too high a voltage can damage the battery due to overcharging, while too low a voltage can cause the powered device to stop operating [
18,
19]. When analyzing the operation of a battery-powered system, the battery’s state of charge must be taken into account. Therefore, computer analyses of electronic or power systems should consider the properties of the batteries used.
To accomplish this task, battery models appropriate for the simulation software are necessary. SPICE has been used for many years in the analysis of electronic and power electronics systems [
20,
21]. Unfortunately, the built-in electronic component models in this software do not include a battery model. The simplest way to model this element is to use an ideal voltage source [
6]. However, such a model does not allow for the consideration of changes in the battery’s state of charge, but only allows for preliminary verification of the correct operation of bidirectional DC–DC converters [
21,
22]. In [
14,
23], a battery model was used in which the battery’s ability to store energy was described using a capacitor. However, such a model does not take into account the limitations of the battery voltage range or the charging and discharging current limits.
In [
9], a battery model dedicated to SPICE was proposed, but its correctness was verified only for very low-capacity batteries used in low-current devices. In [
14], the voltage limitation on a charged battery was considered using a stabilization diode, but the properties of this model were verified only for DC analysis.
The literature provides information on modeling selected parameters of lithium-ion (Li-Ion) batteries [
24,
25,
26,
27,
28,
29], lithium–iron–phosphate (LiFePO
4) batteries [
30], and sodium-ion (Na-Ion) batteries [
31]. As noted in [
27,
30], one of the most important parameters of energy storage devices is the state of charge (SoC), and it is important that this parameter can be determined using computer models of batteries. In the process of performing analytical models of batteries, artificial intelligence algorithms and prediction algorithms are also used to estimate the values of SoC and state of health (SoH) parameters [
28].
When analyzing electrical energy storage systems, it is important to take into account electrical, electrochemical, and thermal phenomena [
26,
30,
32]. Typically, the input data for the prepared models are experimental studies of single prismatic cells [
25,
26]. In [
33], catalog data of the modeled battery cells were used as input data for estimating the parameters of the developed models and their validation.
The paper [
25] describes a 3D electrochemical–thermal coupled model of lithium–iron–phosphate batteries. The accuracy of this model is verified experimentally for one device only. The form of the described model is complicated and therefore the computations are time consuming.
In the paper [
24], thermo-electrochemical simulations of Li-Ion batteries using the finite element method (FEM) and circuit simulations are described. In the cited paper, a network form of the considered batteries model is proposed. This model makes it possible to compute the waveforms of the voltage on the batteries, SoC, and the average and maximum values of temperature. Disadvantages of the considered model are the use of a block calculating the value of SoC by integrating the waveform of the current and a lack of experimental verification of this model.
The model of batteries proposed in the paper [
26] belongs to the group of compact models. It was formulated by approximation of the characteristic of Li-Ion batteries given by the manufacturer. Additionally, some computation results illustrate processes of charging and discharging during the operation of these batteries in electrical vehicles.
The paper [
27] proposes very simple model of a battery. It has a form of a network containing a voltage source, a resistor, and two two-port RC networks connected in series. This model was used for SoC estimation of Li-Ion batteries. There is a similar form for the model presented in the paper [
31]. Additionally, it contains a thermal model in the form of a Cauer network. In turn, the paper [
30] uses the network form of batteries containing a voltage source, three resistors, and one capacitor. The passive components represent the shunt resistance, the series resistance, and the RC network—dynamic properties of the considered Li-Ion batteries.
A review of Li-Ion batteries model is presented in the paper [
29]. The network representation of the considered model is similar to in the paper [
31]. Additionally, the cited paper considers the problem of effective prediction of battery state of health (SoH).
As can be seen from the presented literature review, many papers describe models of batteries produced using one selected technology only. There is a lack of a universal model which can be used in computations of characteristics of different kinds of batteries.
The aim of this article is to formulate and experimentally verify the correctness of a battery model. This model has a universal structure for batteries manufactured using different technologies. The proposed model has a form of a subcircuit for the SPICE software (PSpice A/D ver. 17.4-2019) and takes into account phenomena such as limited battery capacity, limited range of permissible battery voltage changes, limited maximum charge and discharge currents, a self-discharge effect, and the influence of temperature on battery characteristics. The correctness of the formulated model was experimentally verified for batteries of various designs and nominal capacities, operating under various power and load conditions.
In
Section 2, the form of the elaborated model is proposed.
Section 3 describes the tested batteries.
Section 4 presents the results of calculations and measurements illustrating the correctness of the formulated model and its universality.
2. Model Form
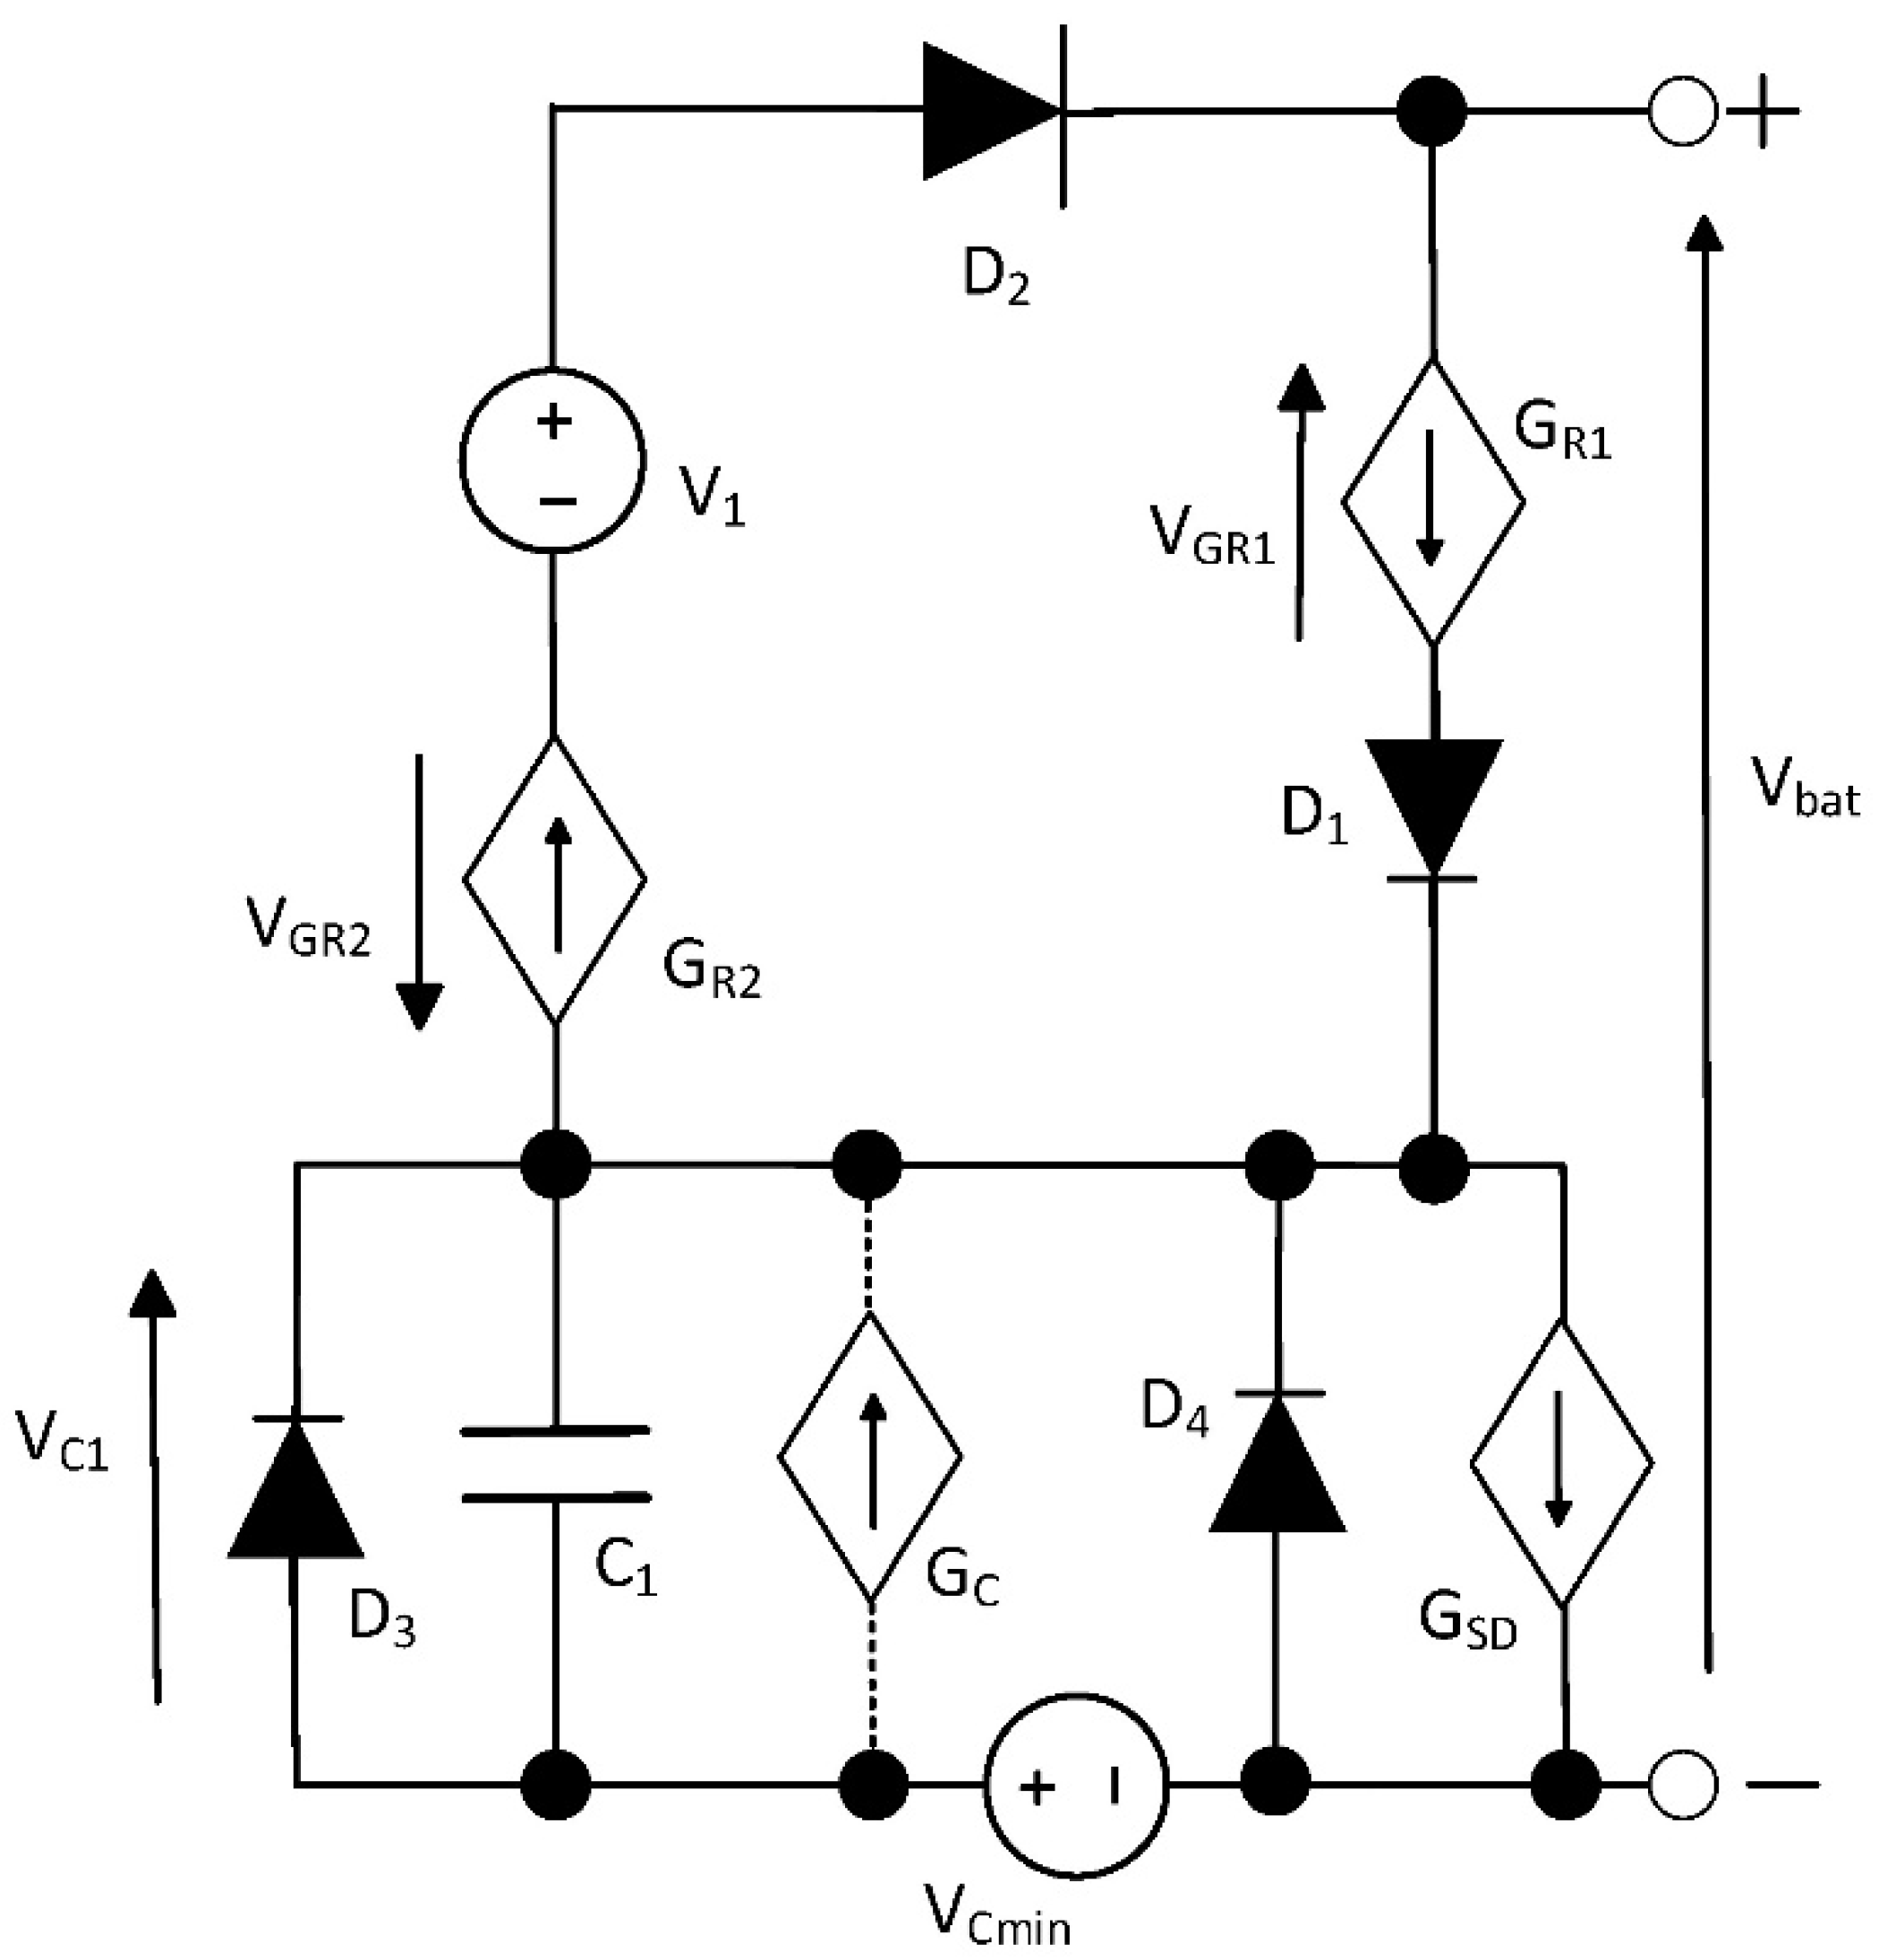
The elaborated model of a battery is dedicated to SPICE software. The network representation of this model is shown in
Figure 1.
In the developed model, the energy storage element is capacitor C1. Its electrical capacitance corresponds to the quotient of the charge stored in the battery (battery capacity) and the difference between the voltage across a fully charged and fully discharged battery. Typically, battery properties can be described using the linear capacitance C1. However, for some battery designs, it is necessary to consider the non-linear relationship between capacitance and voltage. In such a case, a controlled current source GC is used, describing the relationship between capacitive current and voltage VC1. This source is used only in selected types of batteries and therefore its connections are marked with a dashed line. Voltage source VCmin corresponds to the minimum voltage across a discharged battery. Diode D3 limits the maximum voltage across capacitor C1, corresponding to a fully charged battery, while diode D4 limits the maximum voltage across a charged battery. These diodes perform the voltage limitation task by operating within the breakdown range. The maximum value of this voltage is determined by setting the BV parameter for the diodes under consideration. The controlled current source GSD models the self-discharge current. It takes into account the influence of temperature on this current.
Diode D1 and controlled current source GR1 model the battery’s series resistance during charging. Diode D2 and controlled current source GR2, in turn, describe the battery’s series resistance during discharging. Diodes D1 and D2 are described using the SPICE model for these components. To achieve a low forward voltage for these diodes, an unphysical low emission coefficient of N = 0.1 was assumed for these diodes.
The network form of the proposed model shown in
Figure 1 is universal. This means that it can be used for different kinds of batteries. Of course, the values of the model parameters can be different for different types of batteries. The values of the developed model parameters, such as capacitance C
1, voltage V
cmin, and breakdown voltages of diodes D
3 and D
4, were determined based on data provided by the manufacturer. The description of the controlled current sources G
C, G
SD, G
R1, and G
R2 for each of the modeled batteries is described differently. Additionally, the sodium-ion batteries need the use the non-linear capacitor in the model to properly describe their characteristics. The fact that four of the model’s components can be described by equations of different forms is related to the different properties of the modeled battery components. A detailed description of these sources for selected battery types is provided in
Section 4.
In the mentioned descriptions of the controlled current sources, splines are used. All these formulas are continuous functions, but their derivatives can be non-continuous functions. Despite this, during the performed computations, we did not observe any convergence problems.
3. Investigated Batteries
Currently, batteries making using various electrode materials and electrolytes are available on the market [
1,
8,
34]. From this wide range, five types of batteries were selected for the tests. They are used in automotive applications and bidirectional electrical energy conversion systems.
Table 1 presents the operating parameters of selected batteries manufactured using different technologies, which were subjected to testing. In the following part of the article, they are designated as ACU1 (VRLA Leed Acid HPB200-12 [
35]), ACU2 (AGM Deep Cycle OT200-12LW [
36]), ACU3 (LiFePO
4 JB-LFP12-200CC [
37]), ACU4 (LiPo SLPBB042126 [
38]), and ACU5 (Na-Ion GWN12100 [
39,
40]).
Manufacturers of ACU1 and ACU2 batteries do not specify the maximum number of permissible operating cycles, while ACU4, made using lithium–polymer (Li-Po) technology, has the lowest number of such cycles at just over 100. The rated capacity of the batteries under consideration ranges from 6.55 to 200 Ah. The ACU4 battery has the lowest rated voltage of only 3.7 V. The ACU5 battery has the widest operating voltage range, covering values from 6 to 16 V, indicating the possibility of using the deep discharge process. The ACU5 battery has the widest temperature range. During the discharge process, this range covers temperatures from −30 to 70 °C. The internal resistance of the cells under consideration ranges from 1.5 mΩ (ACU4) to 50 mΩ (ACU3). This value depends on the battery’s state of charge.
The ACU1 and ACU2 batteries are manufactured using AGM (Absorbent Glass Mat) technology. These are maintenance-free, lead-acid VRLA (Valve-Regulated Lead Acid) batteries with self-regulating, single-sided safety valves and internal gas recombination. The electrolyte in these batteries is contained in a glass mat separator. This technology allows the batteries to be installed in areas with natural gravity ventilation and minimizes the frequency of maintenance. The Deep Cycle technology used in the ACU1 battery allows for operation in deep discharge conditions and is frequently used in home electricity storage systems [
4,
23].
Lithium–iron–phosphate (ACU3) LiFePO
4 batteries are typically constructed from prismatic cells connected in series. Individual prismatic cells contain an anode, typically made of graphite, a cathode made of LiFePO
4, and an electrolyte, which is a substance that allows the free flow of ions. LiFePO
4 batteries are also equipped with a BMS (Battery Management System), which monitors the voltage level of individual prismatic cells during the charging and discharging process. Modern LiFePO
4 battery solutions also incorporate a BLE (Bluetooth Low-Energy) communication system with a mobile device to control the SoC (state of charge) level [
4,
6].
Lithium-ion (LiPo) batteries (ACU4) consist of an anode, a cathode, an electrolyte, and a separator, all enclosed in a flexible housing. Instead of the liquid electrolyte used in standard lithium-ion batteries, LiPo batteries use a solid or gel electrolyte. The anode is typically made of lithium–cobalt oxide or lithium–iron phosphate, while the cathode is made of graphite or silicon-based materials. The separator is typically a porous membrane that separates the anode and cathode but allows lithium ions to pass through, preventing short circuits [
4,
6].
The latest solution is sodium-ion batteries (Na-Ion) designed for automotive applications. These batteries are an alternative technology to lithium-ion batteries, but in sodium-ion batteries, the charge carrier is sodium ions, not lithium. The cathode is typically made of sodium-based materials, such as oxides, phosphates, or layered compounds, while the anode is made of hard carbon, which can be produced from biomass, among other sources. Sodium is more abundant in the environment and cheaper than lithium, which can reduce the production costs of batteries made with this technology [
4,
6].
ACU1, ACU2, ACU3, and ACU5 batteries are used, among other things, to store electricity produced by renewable energy sources [
41]. ACU1 and ACU2 batteries are also used in automotive START/STOP systems, where they can be loaded with high discharge currents, up to 600 A (ACU1). ACU4 (LiPo) batteries are used to power drones due to their low weight, which in the case of the battery selected for testing was only 126 g. ACU3 and ACU5 batteries are also available in prismatic cell versions, used to power electric vehicles and for home energy storage.
4. Results of Investigations
To verify the correctness of the proposed model, calculations and measurements of the characteristics of the selected batteries were performed. In all figures presented in this section, the points represent measurement results provided by the manufacturers of the tested batteries, while the lines represent the results of calculations performed using the model described in
Section 2.
The following subsections present the results of calculations and measurements performed for various battery designs. Information on the efficiency of individual controlled sources used in the model shown in
Figure 1 is also provided.
Section 4.1 presents the results obtained for an HPB200_12_AGM_VRLA lead-acid AGM battery (ACU1).
Section 4.2 contains the results obtained for a Deep Cycle AGM battery (ACU2).
Section 4.3 presents the test results for a LiFePO
4 battery (ACU3).
Section 4.4 presents the test results for a LiPo battery (ACU4), and
Section 4.5 for a Na-Ion battery (ACU5).
All calculated characteristics were determined using transient analysis in SPICE. During the computations of charging characteristics, the tested batteries were powered from a voltage source generating a step-shaped voltage corresponding to the voltage of the fully charged tested battery. A controlled current source was connected in series with the voltage source to simulate the operation of the current-limiting system. During discharge, the tested batteries were loaded with a current source generating a step-shaped current corresponding to the discharge current. This current value is given in the individual graphs relative to the battery capacity C. For example, for a battery with a nominal capacity of 100 Ah, the discharge current described as 1 C is equal to 100 A, and that described as 0.2 C is equal to 20 A. During the determination of self-discharge characteristics, the battery was loaded with a 100 kΩ resistor.
4.1. Lead-Acid Battery ACU1
In the ACU1 battery model, a linear model of the capacitor C
1 was used, i.e., the controlled current source G
C was omitted. The dependence of the capacitance C
1 on the temperature T is described by the following formula
where C
0 is the capacitance of capacitor C
1 at the reference temperature T
0, and a
C1 and a
C2 are the model parameters.
The G
SD current source modeling the self-discharge current is described by the relationship of the form
where I
SD0 is the self-discharge current at the reference temperature T
0, and a
SD0, a
SD1, and a
SD2 are the model parameters.
The internal resistance of the battery during discharge is modeled by a controlled current source G
R1 described by the formula
where V
GR1 is the voltage on the G
R1 source, I
GR1 is the current of this source, and R
1, R
2, and α
R1 are the model parameters.
In turn, the internal resistance of the battery during charging is modeled by a controlled current source G
R2 described by the formula
where V
GR2 is the voltage on the G
R2 source, V
C1 is the voltage on the C
1 capacitor, and R
3, R
4, and a
R3 are the model parameters.
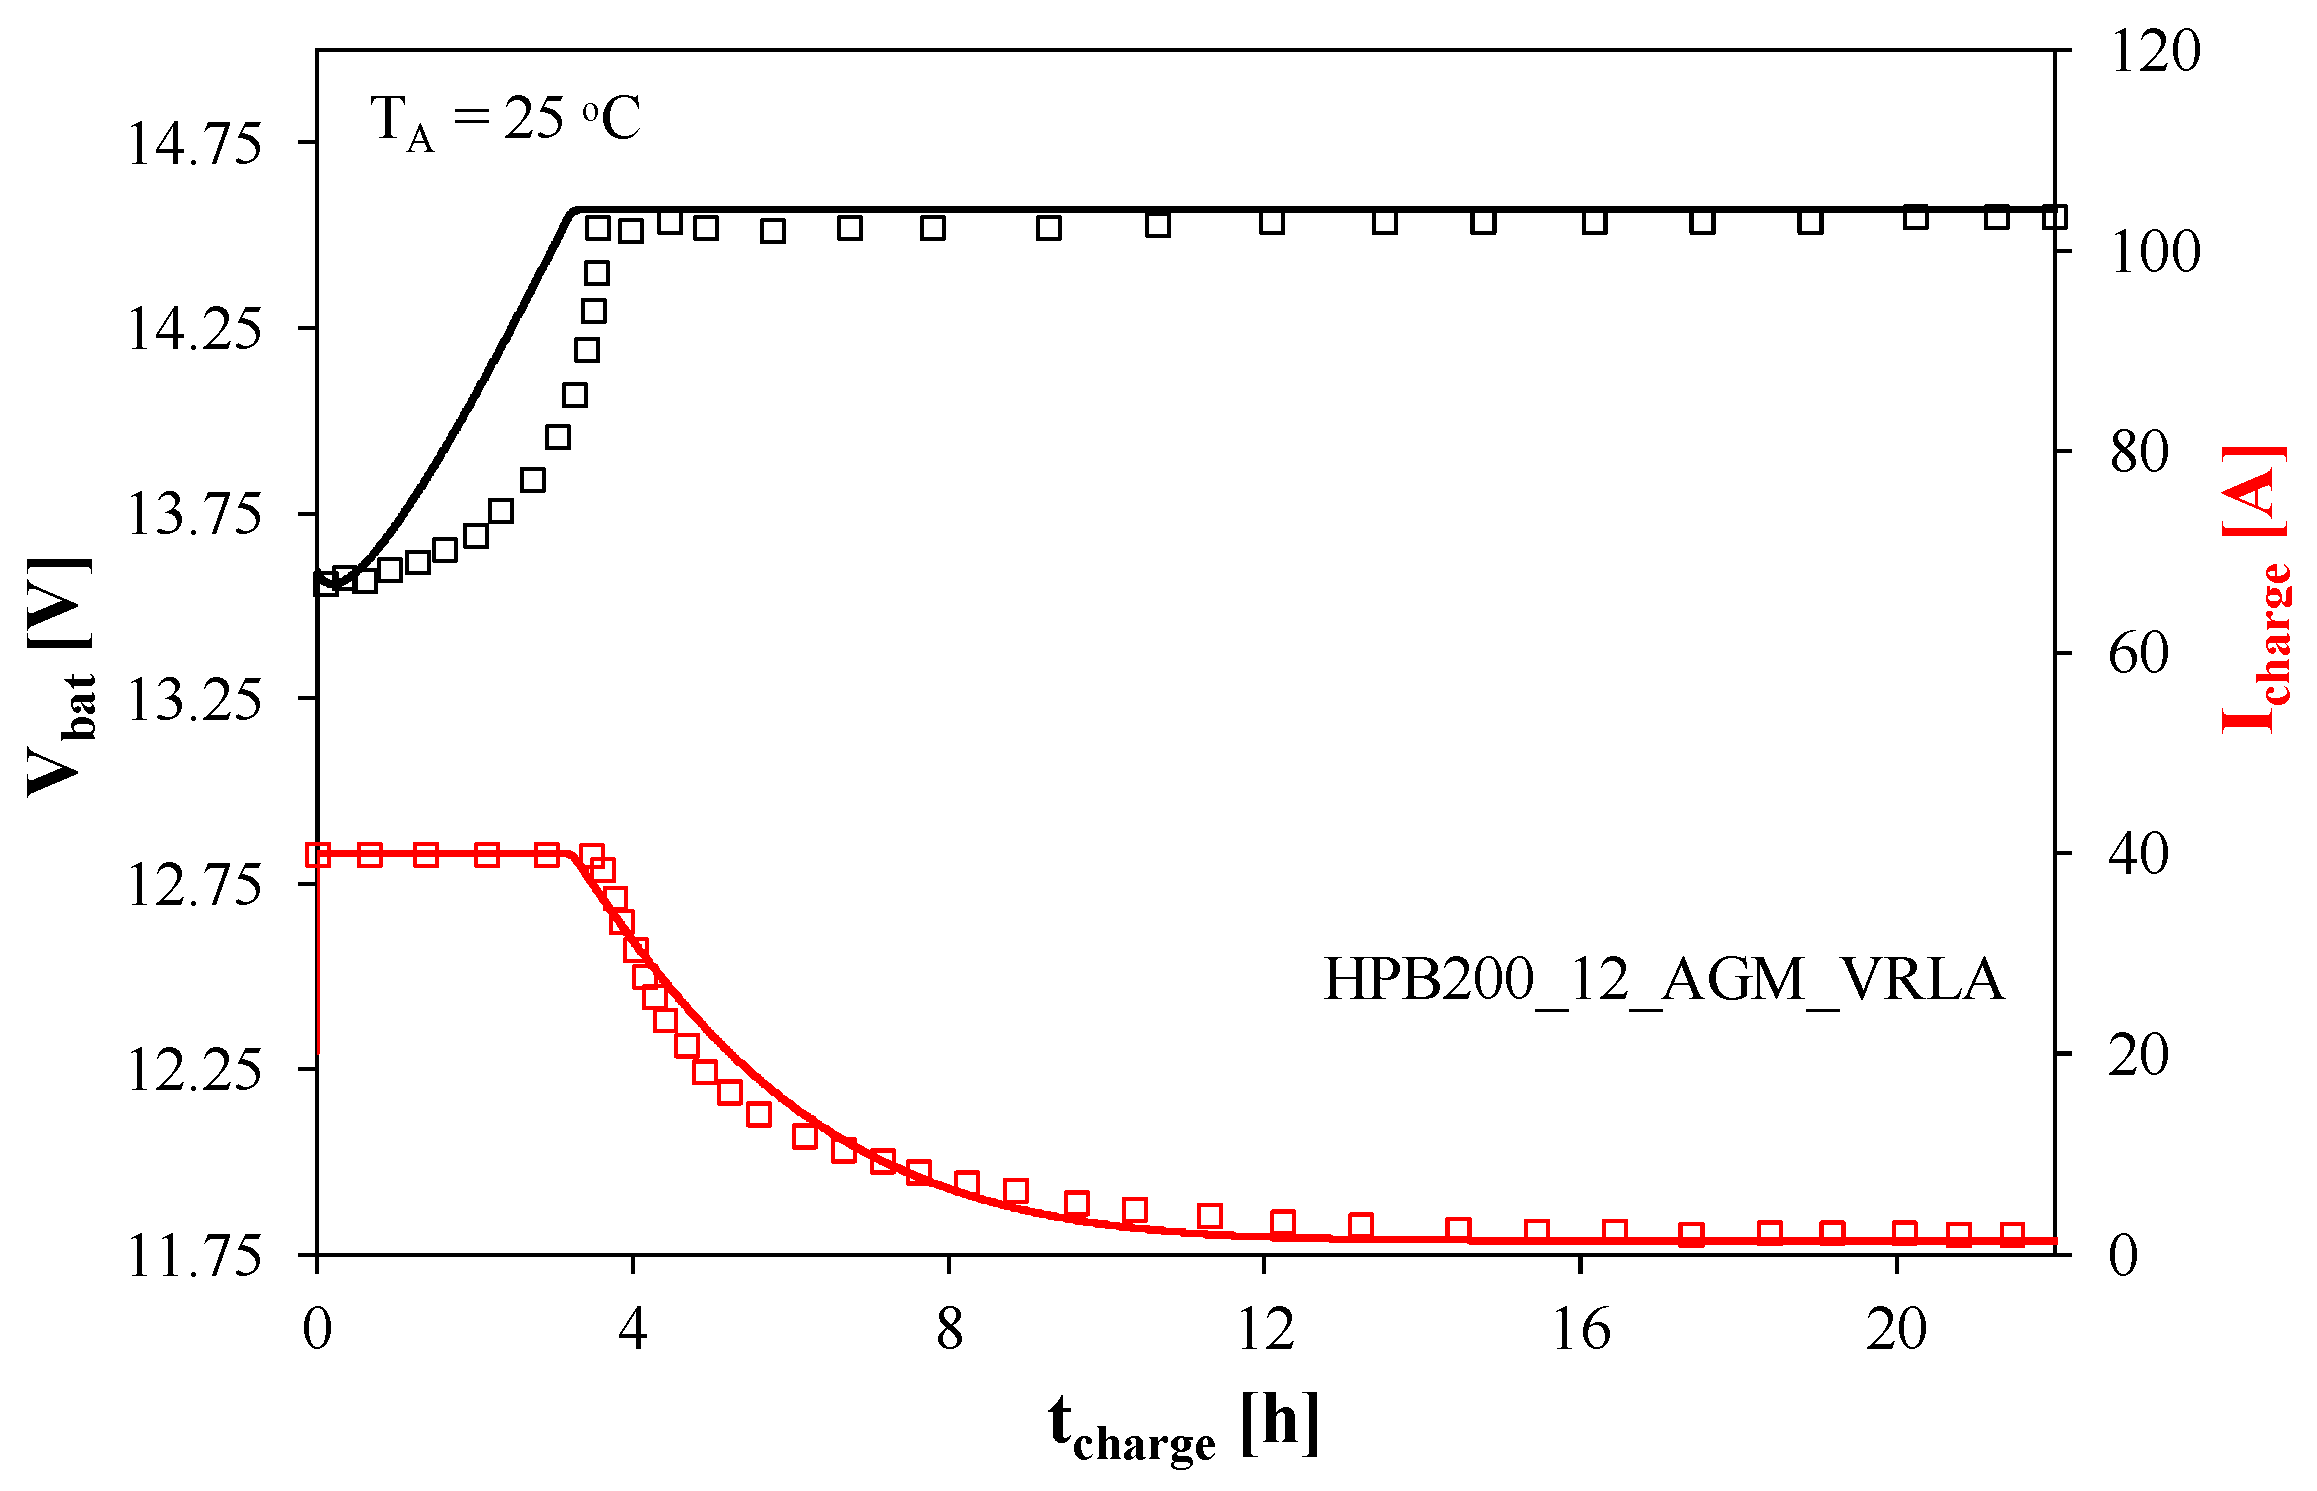
The results of modeling and measurement of the characteristics of a lead-acid AGM battery type HPB200_12_AGM_VRLA are presented in
Figure 2,
Figure 3,
Figure 4,
Figure 5 and
Figure 6.
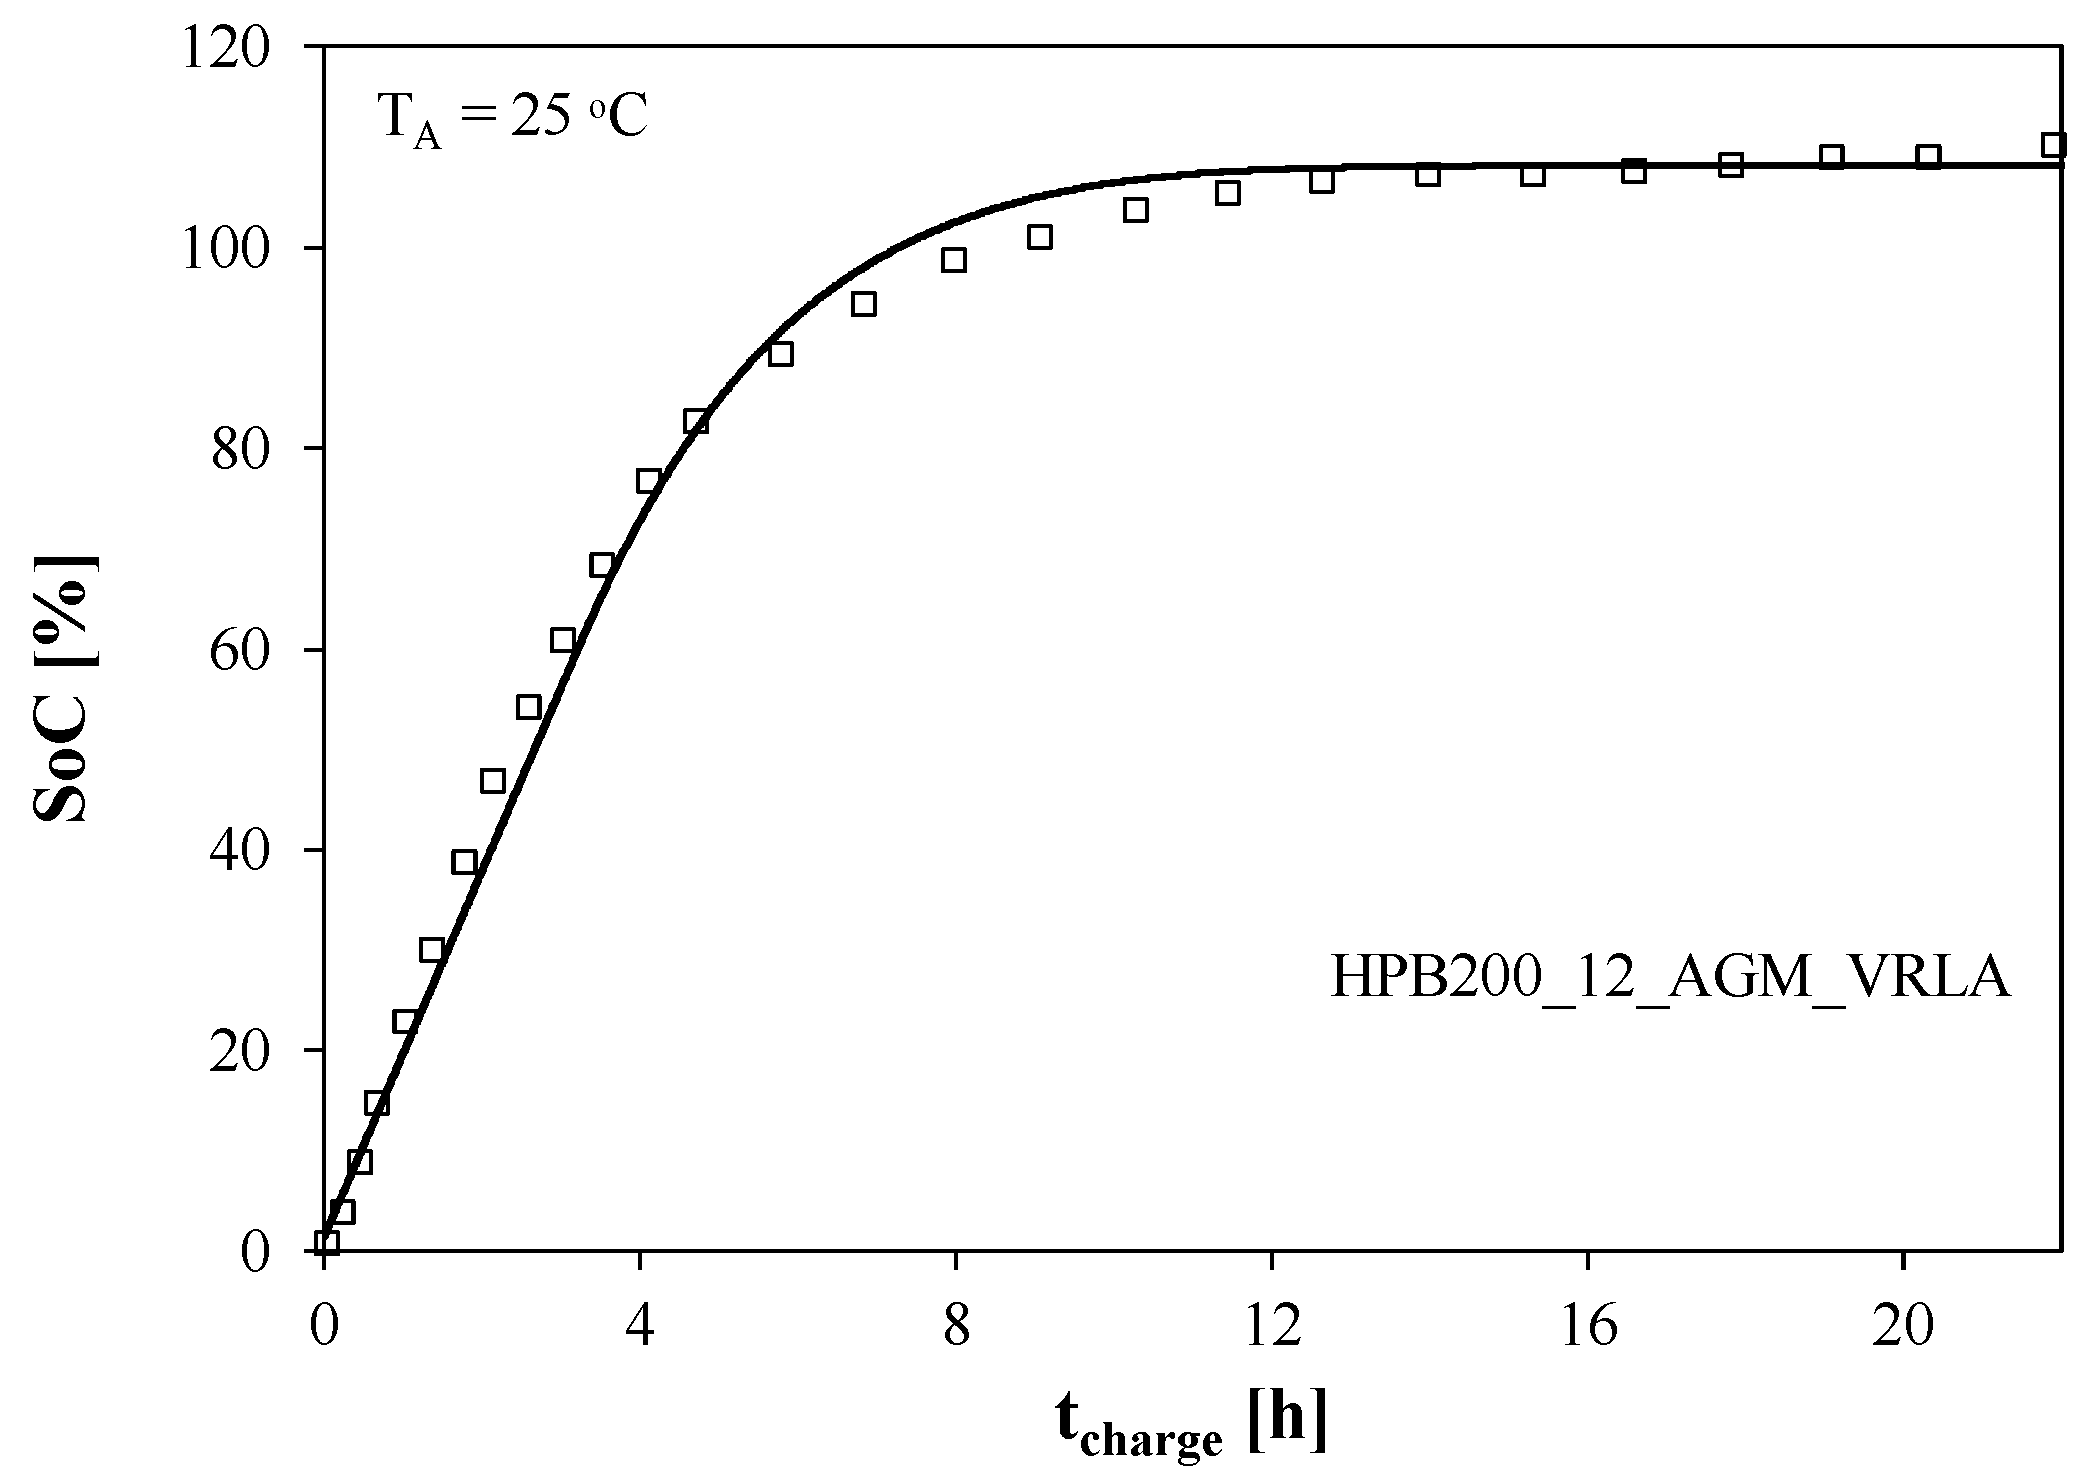
Figure 2 and
Figure 3 present the battery charging characteristics.
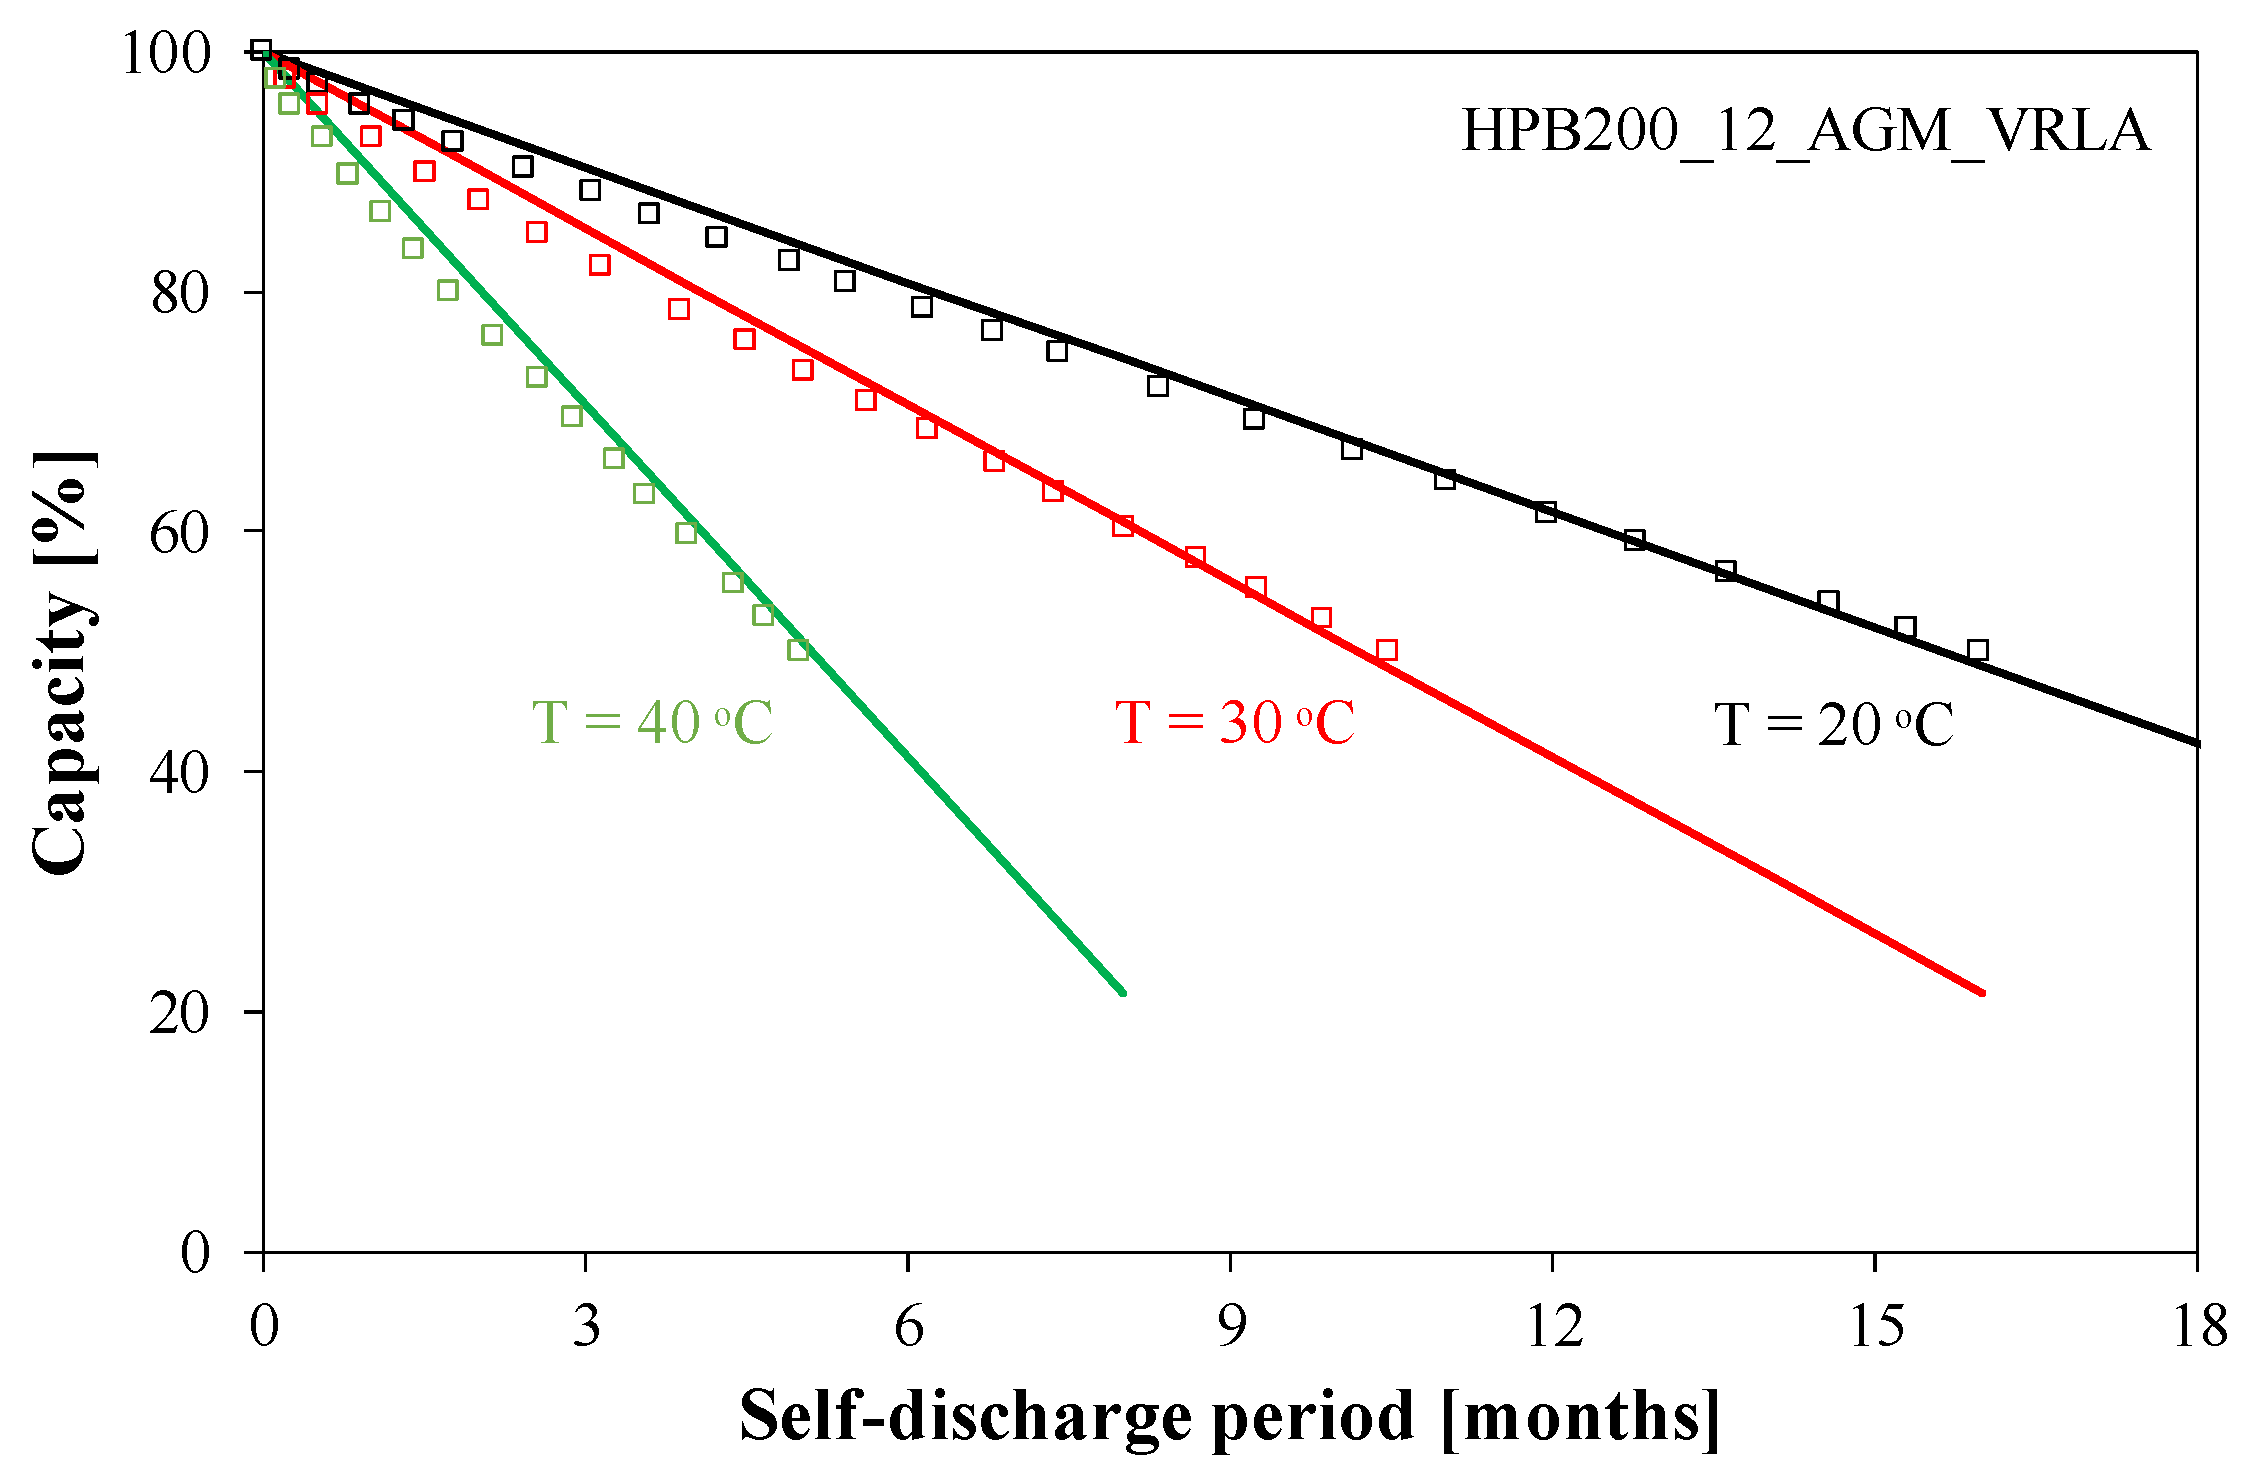
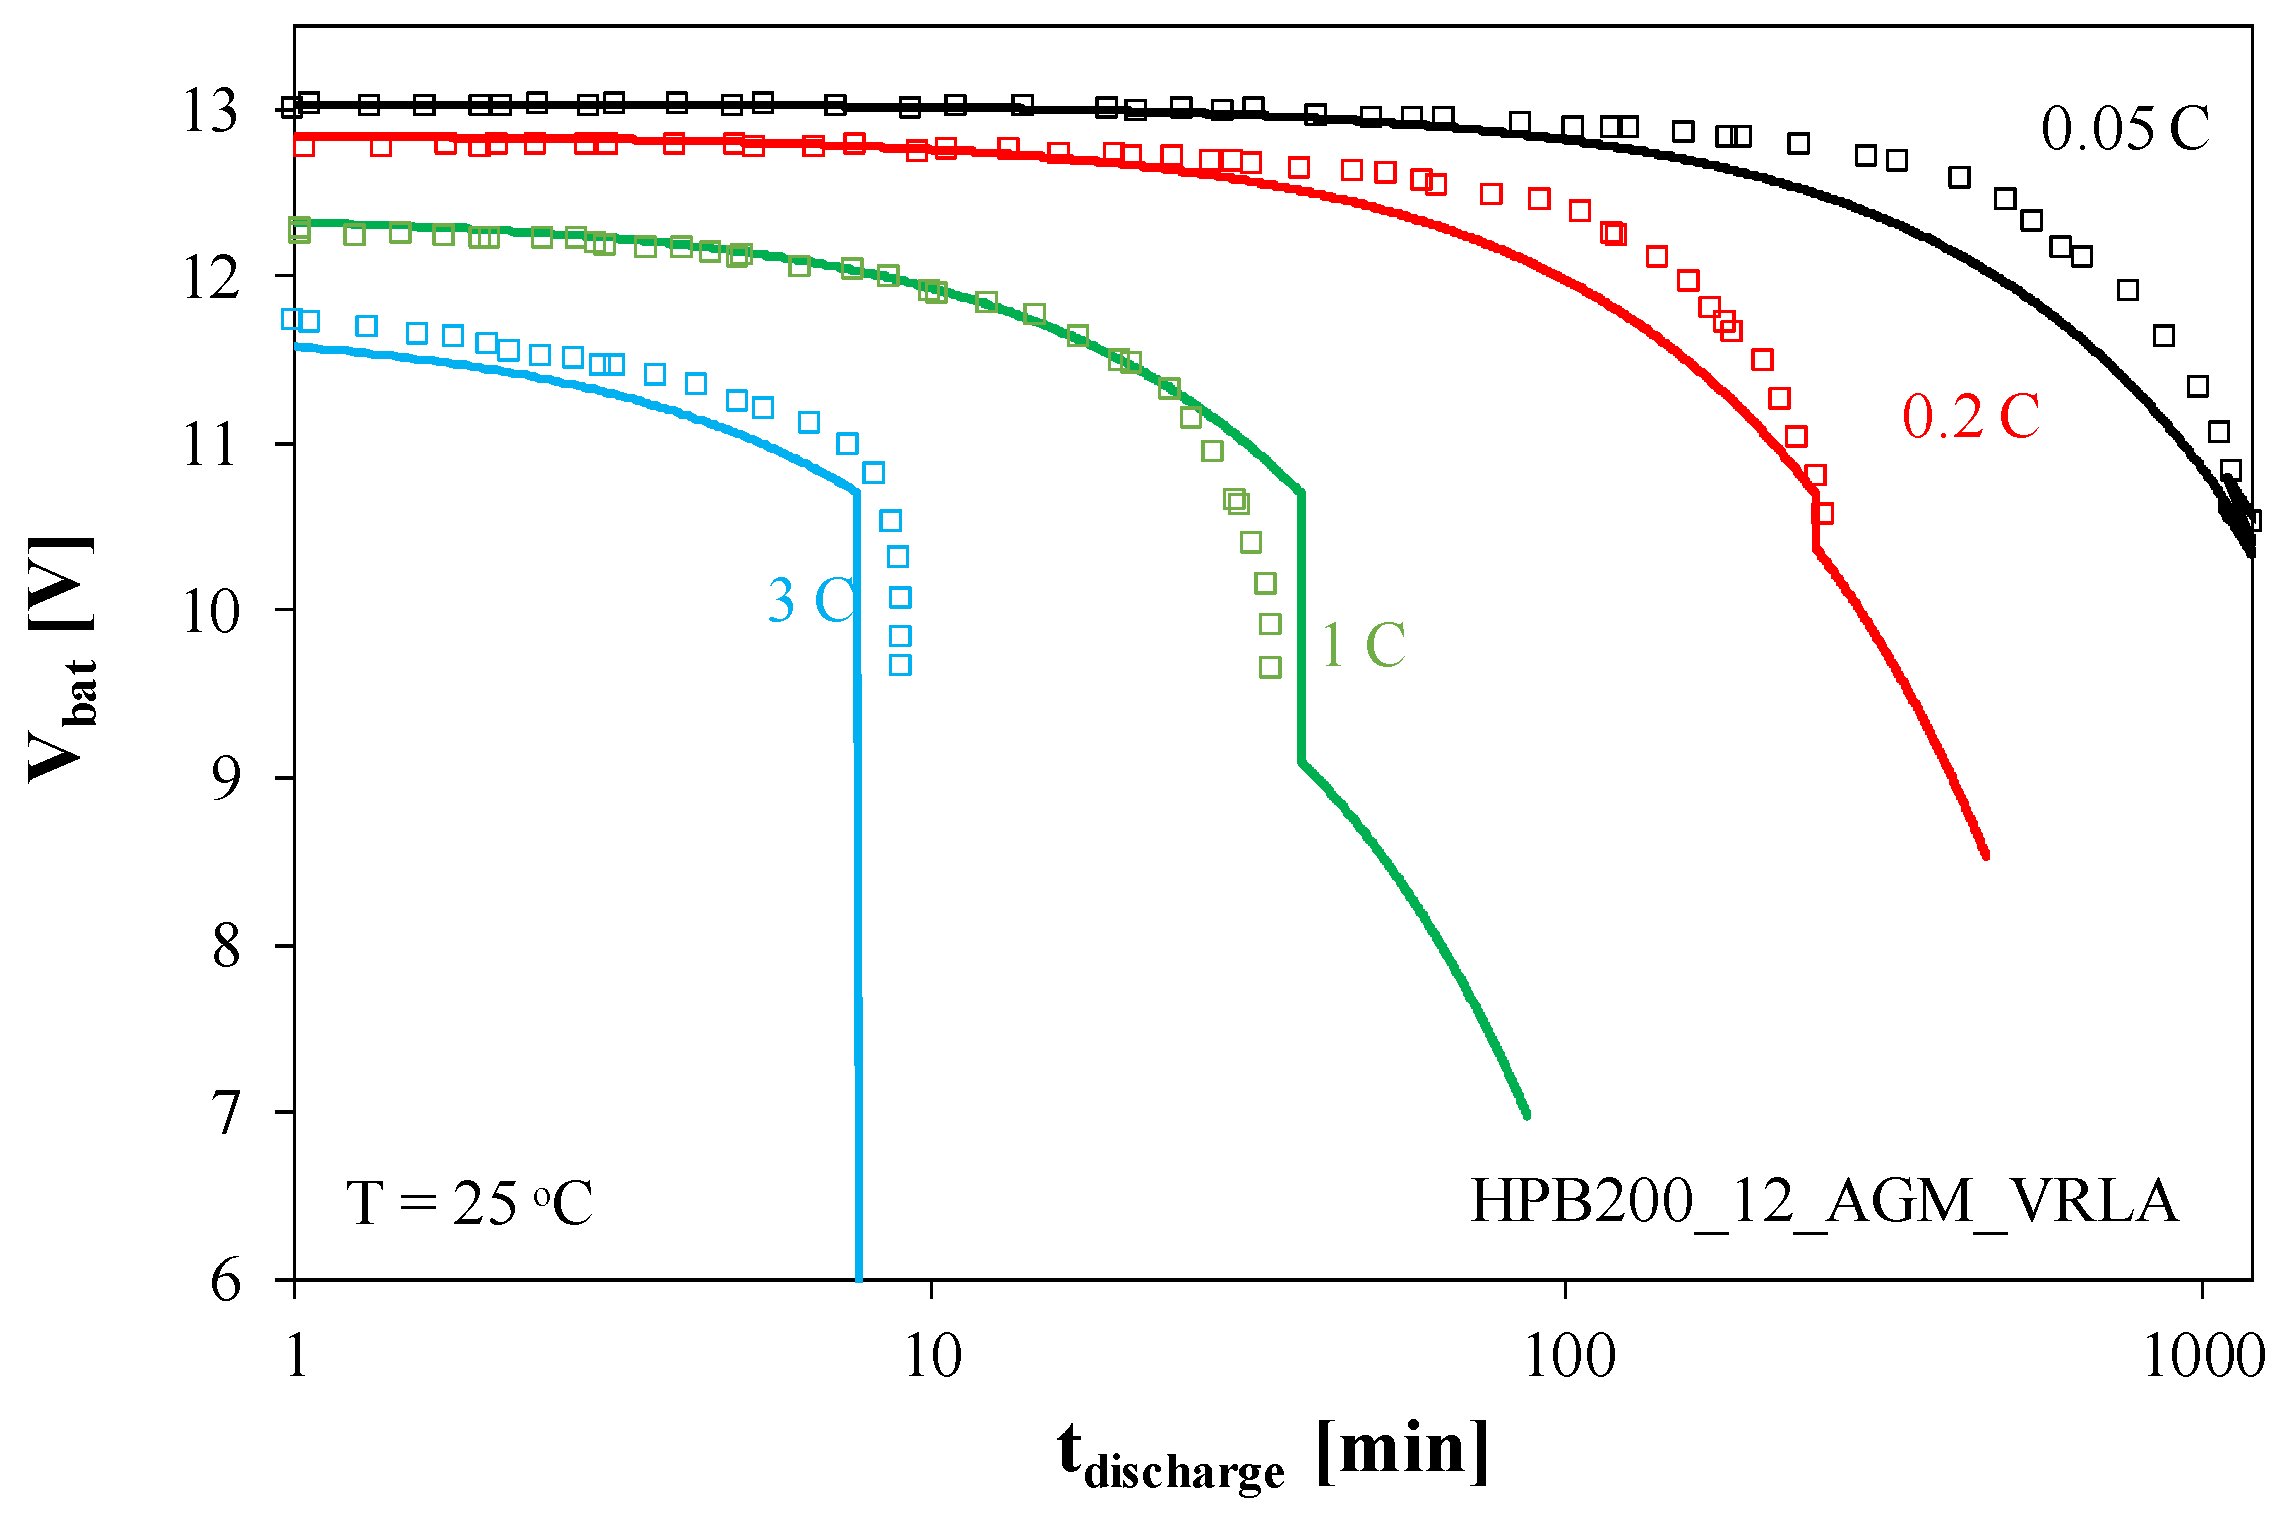
Figure 4 illustrates the self-discharge process. The battery discharge characteristics at selected current values are shown in
Figure 5, and
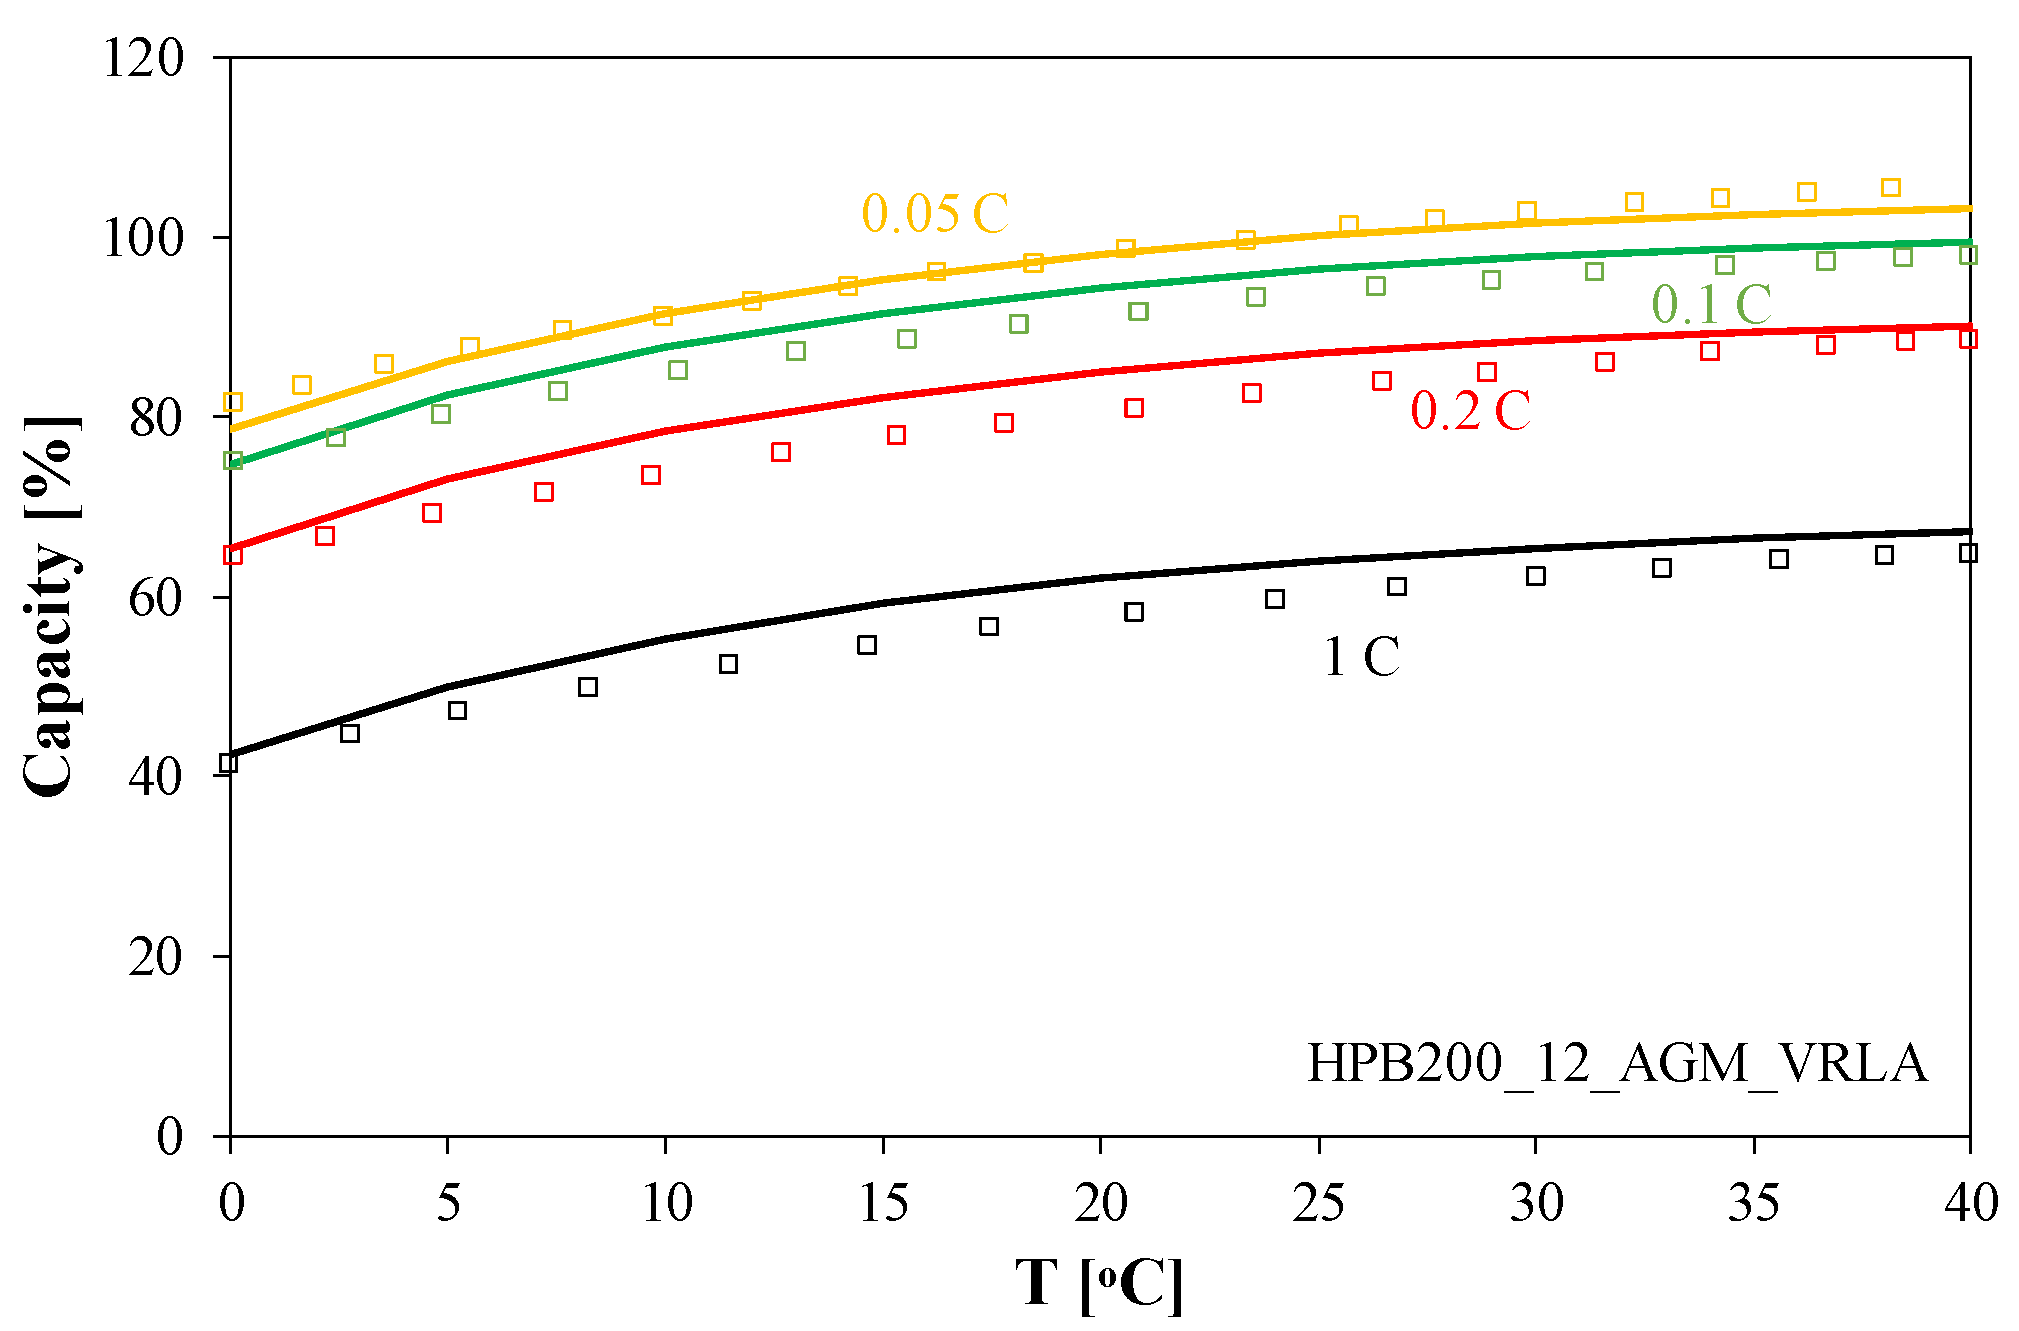
Figure 6 illustrates the dependence of the battery capacity on temperature.
When determining the characteristics presented in
Figure 2, the tested battery was powered from a voltage source with an output voltage of 14.57 V, internal resistance varying in the range from 25 to 0.1 mΩ, and current limit of 40 A. As can be seen, in the initial charging phase lasting about 4 h, the charging current is constant and amounts to 40 A, and the voltage increases from 13.6 V to 14.55 V. Then, the voltage stabilizes and the current decreases exponentially, reaching 2 A after about 12 h.
The change in the battery state of charge (SoC) during the charging process is illustrated in
Figure 3. The SoC value was determined as the quotient of the V
C1 voltage on the capacitor C
1 by the value of this voltage when the battery is fully charged.
It is easy to see that the battery charge increases exponentially and reaches its nominal value after 8 h. Further charging causes the battery’s nominal capacity to be exceeded by several percent.
The self-discharge process is observed in an unloaded battery and is a long-term process, and its rate depends on the temperature T. As can be seen in
Figure 4, at room temperature, it takes as long as 16 months to lose half of the charge stored in the battery. An increase in temperature accelerates this process, and at 40 °C, it takes only 4 months to lose half of the charge. It is worth noting that self-discharge is a linear function of time.
During computations of the considered characteristics, the file containing their results can have a very big size. Therefore, it is worth limiting the list of variables collected in this file or use the comment “print” instead of the comment “probe” and a high value of the parameter print step.
Under typical operating conditions, a constant current is drawn from the battery. This causes the battery to discharge. The voltage waveforms of the ACU1 battery during constant current discharge are shown in
Figure 5.
As shown in
Figure 5, the voltage at the battery terminals decreases as the battery discharges. Discharge time decreases with increasing discharge current. At a current of 0.05 C, the battery voltage reaches 11 V after 1000 min (approximately 16 h), while at a current of 3 C, this time is less than 10 min. It is worth noting that at high discharge currents, the voltage at the charged battery is lower than its nominal value already within the first minute of the discharge process. This is the result of a voltage drop across the battery’s internal resistance.
Battery capacity changes with temperature and discharge current. This relationship is shown in
Figure 6. In the simulations, the capacity value was determined as the product of the electrical capacitance of capacitor C
1 and the battery voltage observed 1 min after the start of the discharge process with a current of a fixed value normalized to the rated value of the battery capacity.
As can be seen, battery capacity increases with temperature. In the temperature range of 0 to 40 °C, capacity increases by 20%. It is also worth noting that increasing discharge current causes a decrease in capacity. Increasing current from 0.05 C to 1 C results in a reduction in battery capacity by as much as half. This decrease is the result of energy losses on the battery’s internal resistance.
As can be seen in
Figure 2,
Figure 3,
Figure 4,
Figure 5 and
Figure 6, the model proposed in this article accurately reflects the characteristics of the tested battery. Deviations between the calculated and measured values do not exceed a few percent.
4.2. Lead-Acid Battery ACU2
In the ACU2 battery model, the controlled current source G
C is omitted. The dependence of the capacitance C
1 on the temperature T is described by Formula (1). The current source G
SD modeling the self-discharge current is described by the relationship of the form
where a
SD0, a
SD1, a
SD2, a
SD3, and a
SD4 are the model parameters.
The internal resistance of the battery during discharge is modeled by a controlled current source G
R1 with the efficiency described by Formula (3), while the resistance of the resistor R
2 is described by a spline function of the form
where R
5, I
0, and a
R3 are the model parameters.
In turn, the internal resistance of the battery during charging is modeled by a controlled current source G
R2 described by the formula
where the resistance R
6 is described by the formula of the form
where R
7, R
8, R
9, R
10, R
11, R
12, R
13, V
1, V
2, V
3, V
4, V
5, a
R6, a
R7, and a
R8 are the model parameters.
The results of modeling and measurement of the ACU2 battery characteristics are shown in
Figure 7,
Figure 8 and
Figure 9.
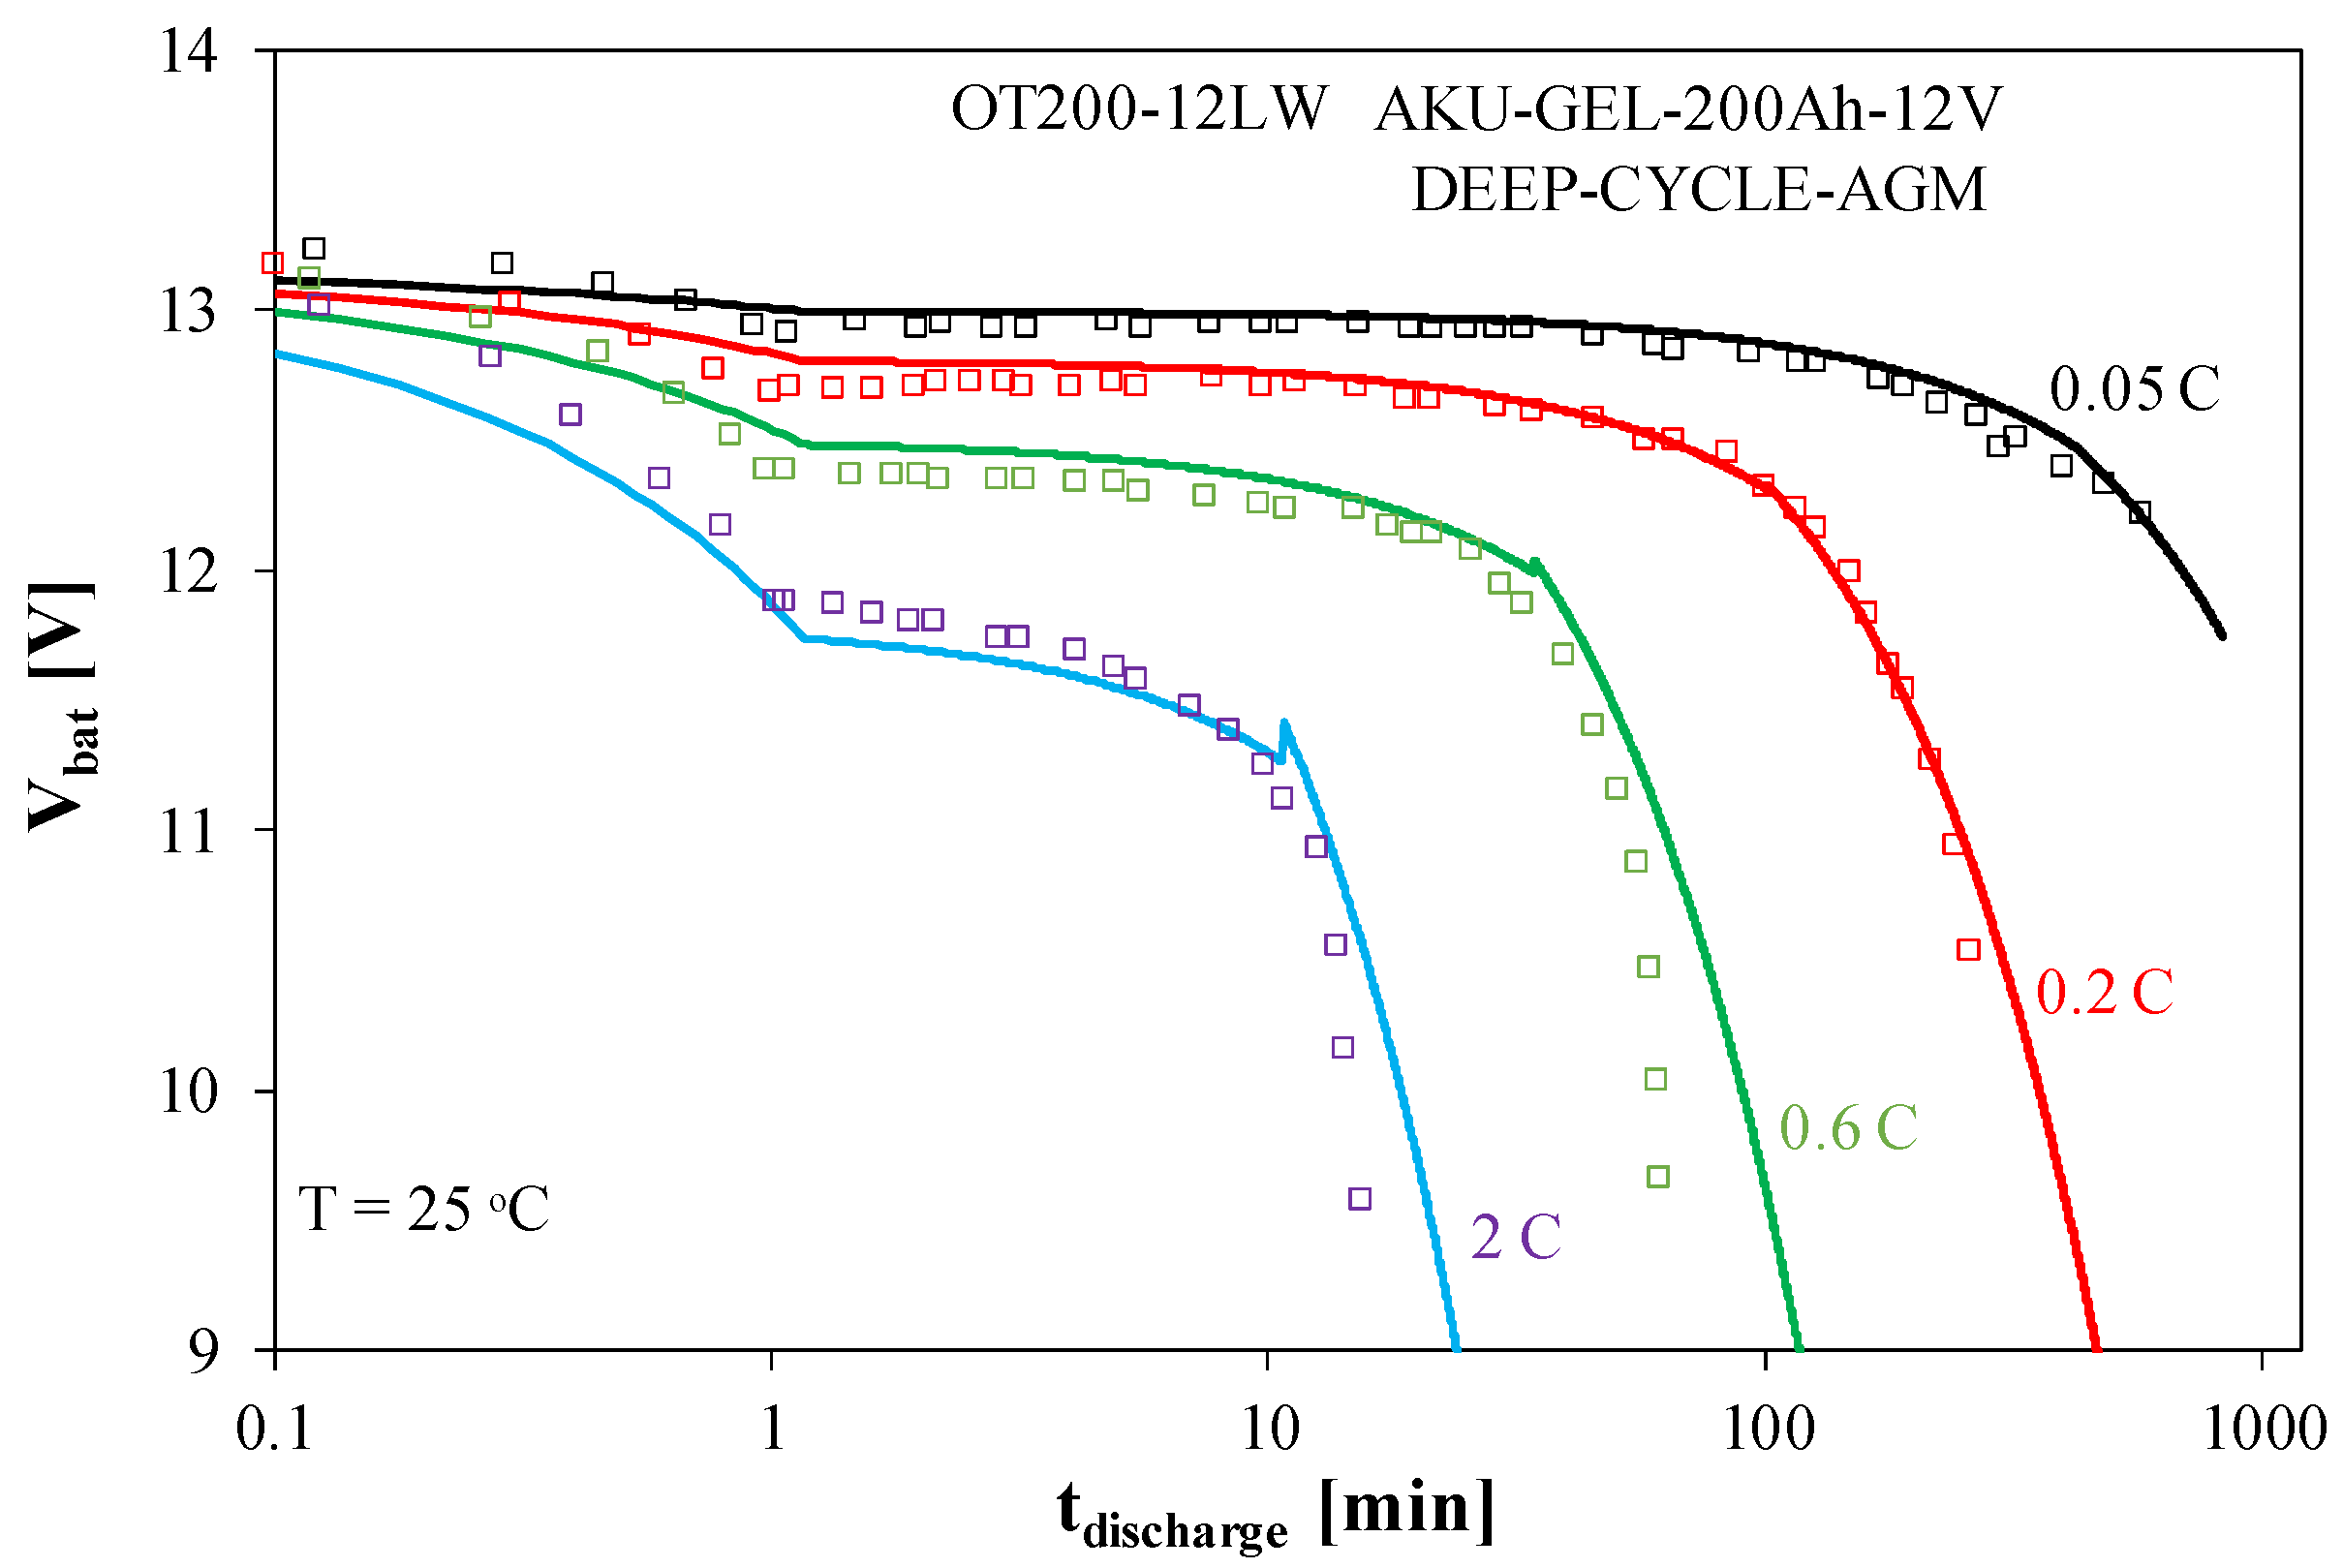
Figure 7 presents the battery discharge characteristics.
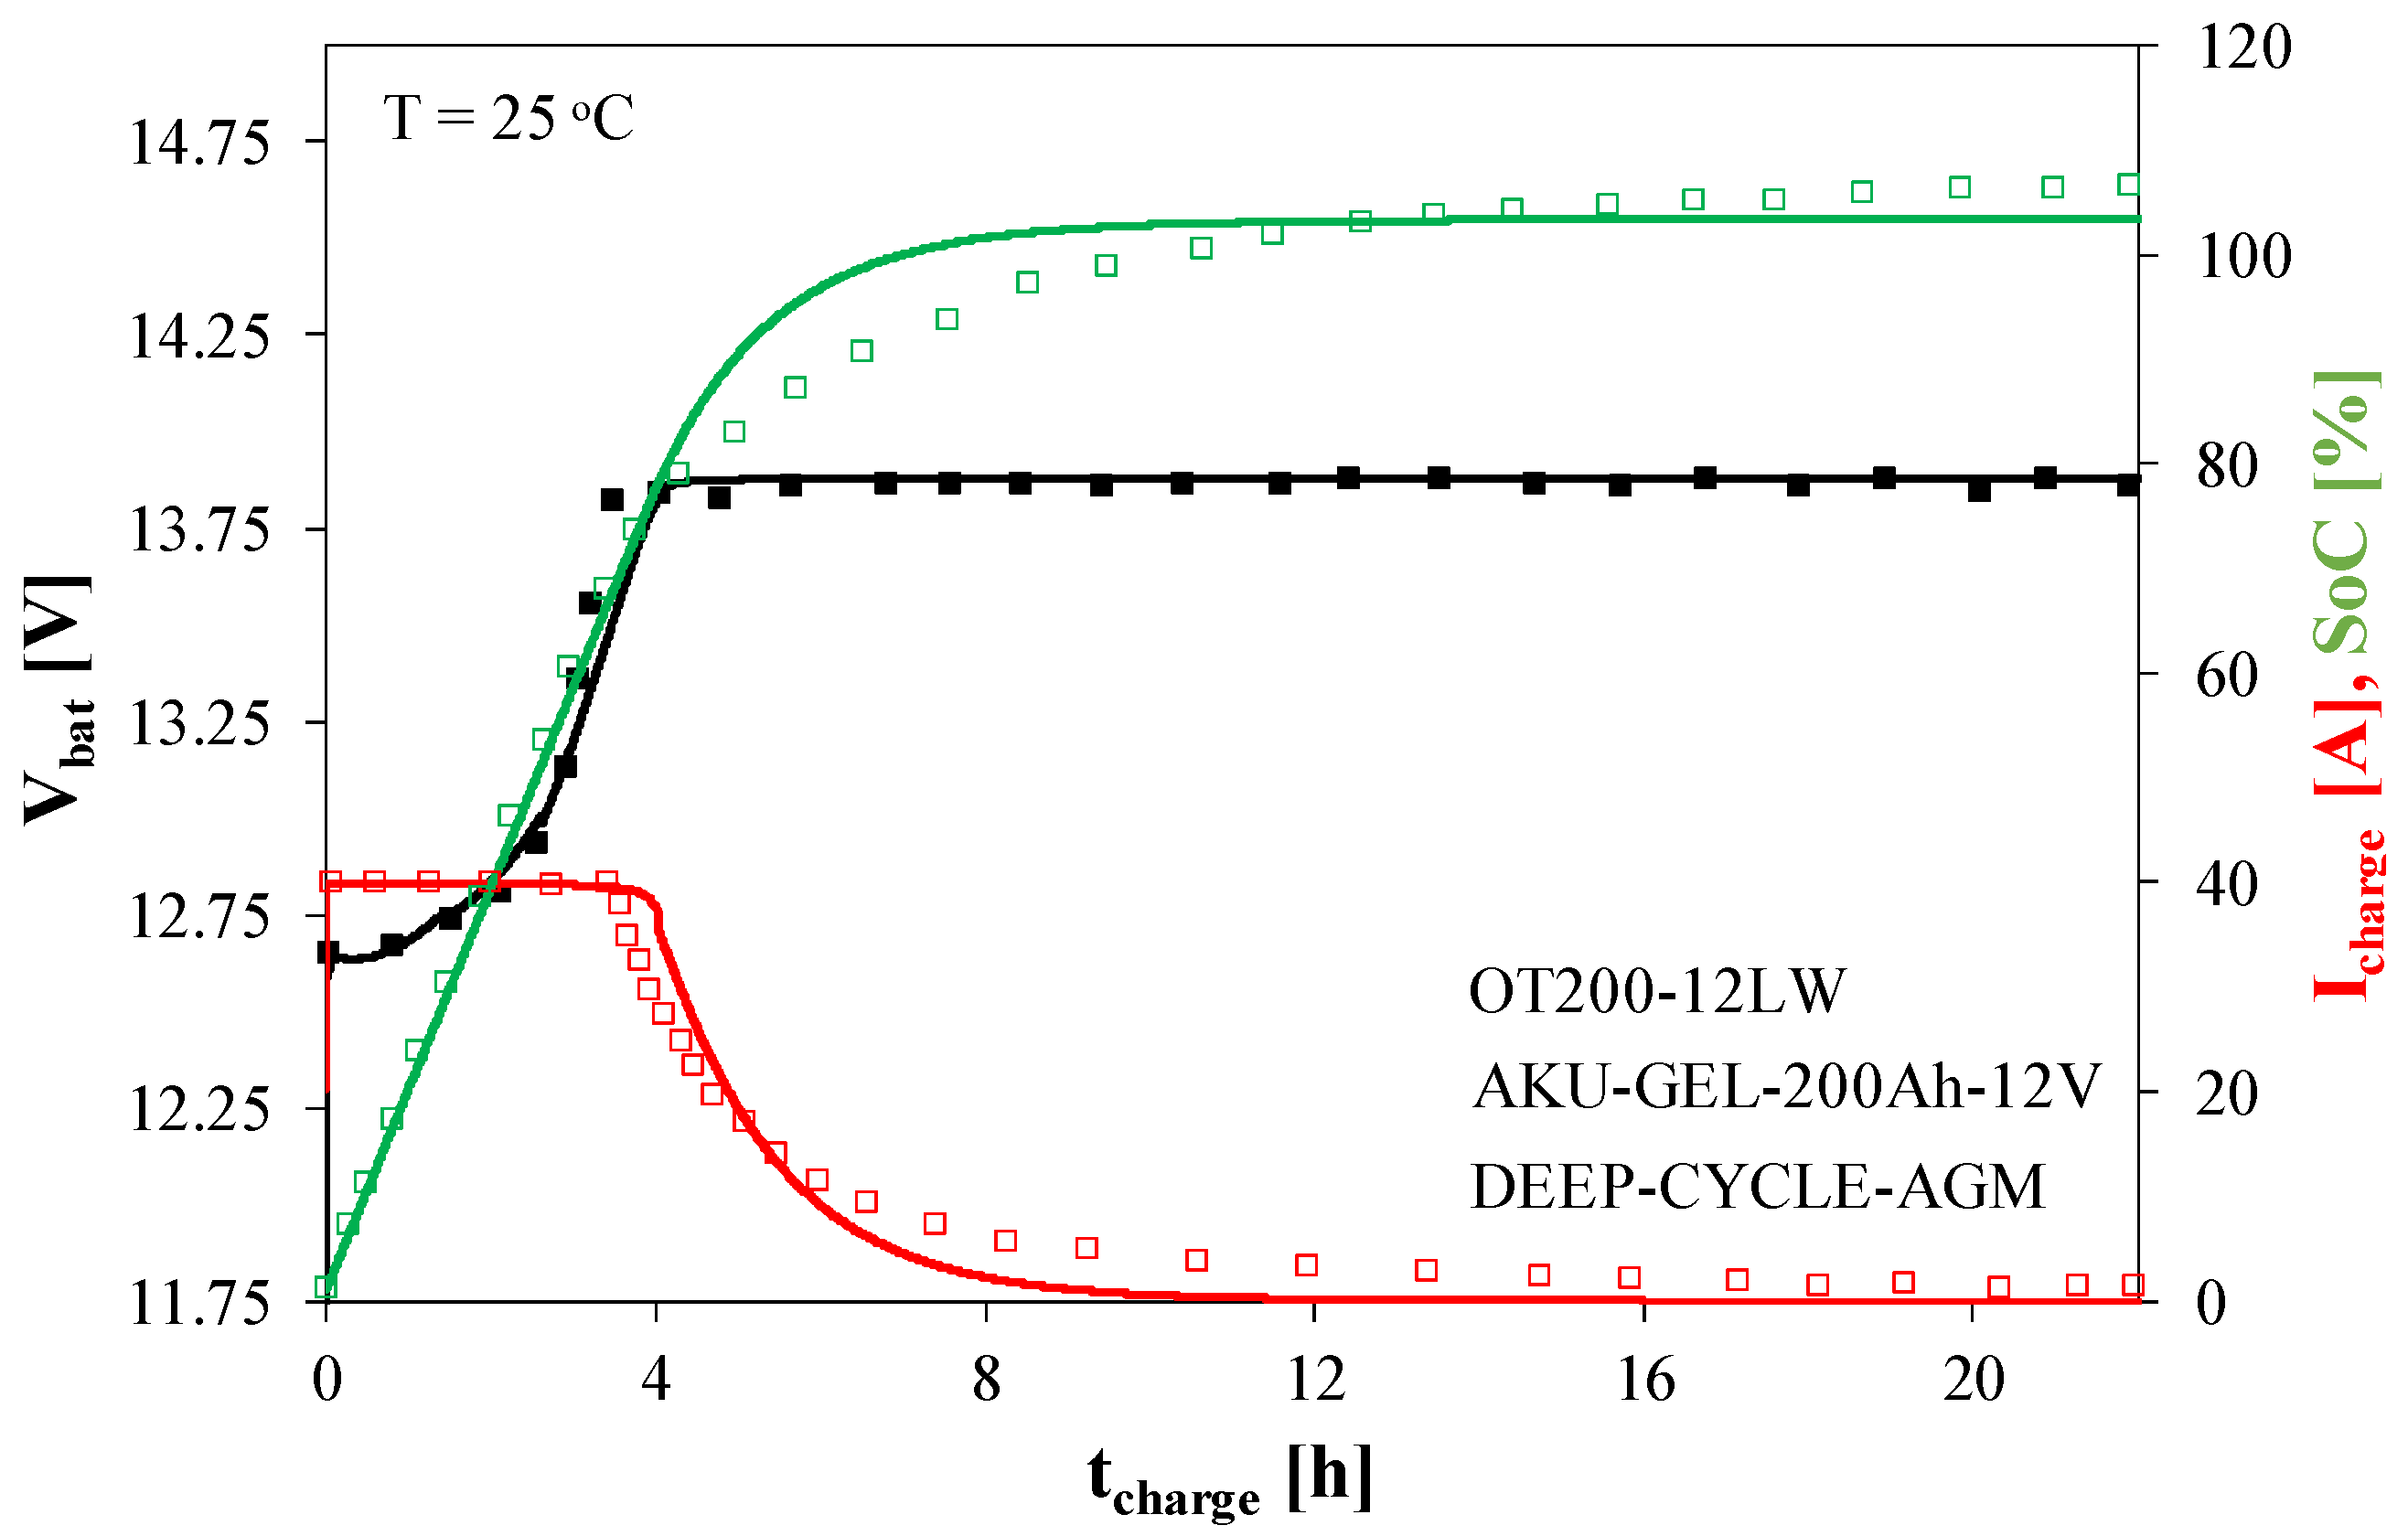
Figure 8 illustrates the self-discharge process. The battery charging characteristics are shown in
Figure 9.
As can be seen in
Figure 7, the duration of the full battery discharge process significantly decreases with increasing discharge current. It is also clear that just 1 min after the start of discharge, there is a significant decrease in the battery voltage at high discharge current values. When this current is 2 C, the battery voltage is 10% lower than for a current of 0.05 C. At the lowest discharge current considered (0.05 C), the battery voltage remains almost constant for over 100 min, and at the highest current value, the steady-state value is maintained for only 1 min.
Figure 8 illustrates the decrease in battery capacity caused by self-discharge at fixed temperature values.
It is easy to observe that battery capacity decreases linearly with time, and the slope of this relationship increases significantly with increasing temperature. A 20% loss of capacity occurs after 20 months at 0 °C. However, at 40 °C, the same capacity loss occurs after only 2 months. This relationship indicates that the most favorable operating conditions for the considered battery occur at 0 °C.
The process of charging the ACU2 battery from a voltage source is shown in
Figure 9.
In the initial phase of the charging process, a fixed current is supplied to the battery. It causes an increase in the charge stored in the battery and the voltage at its terminals. After approximately 4 h, the Vbat voltage reaches its nominal value, and the current decreases exponentially. After 12 h, the battery is fully charged, and the SoC reaches 100%. In the final phase of charging, practically no changes in the Vbat voltage are observed.
4.3. Lithium–Iron–Phosphate Battery ACU3
In the ACU3 battery model, the controlled current source GC is omitted. The dependence of the capacitance C1 on the temperature T is described by Formula (1), and the source current GSD by Formula (2).
The internal resistance of the ACU3 battery during discharge is modeled by a controlled current source G
R1 with the efficiency described by Formula (3), while the resistance of the resistor R
2 is described by a spline function of the form
where V
6, R
14, and R
15 are the model parameters.
In turn, the internal resistance of the battery during charging is described by Formula (7), and the resistance R
6 is given by the formula of the form
where R
16, R
17, R
18, R
19, R
20, R
21, R
22, V
7, V
8, V
9, V
10, a
R11, a
R12, and a
R13 are the model parameters.
The results of modeling and measurement of the ACU3 battery characteristics are presented in
Figure 10 and
Figure 11.
Figure 10 presents the battery discharge characteristics, and
Figure 11 its charging characteristics.
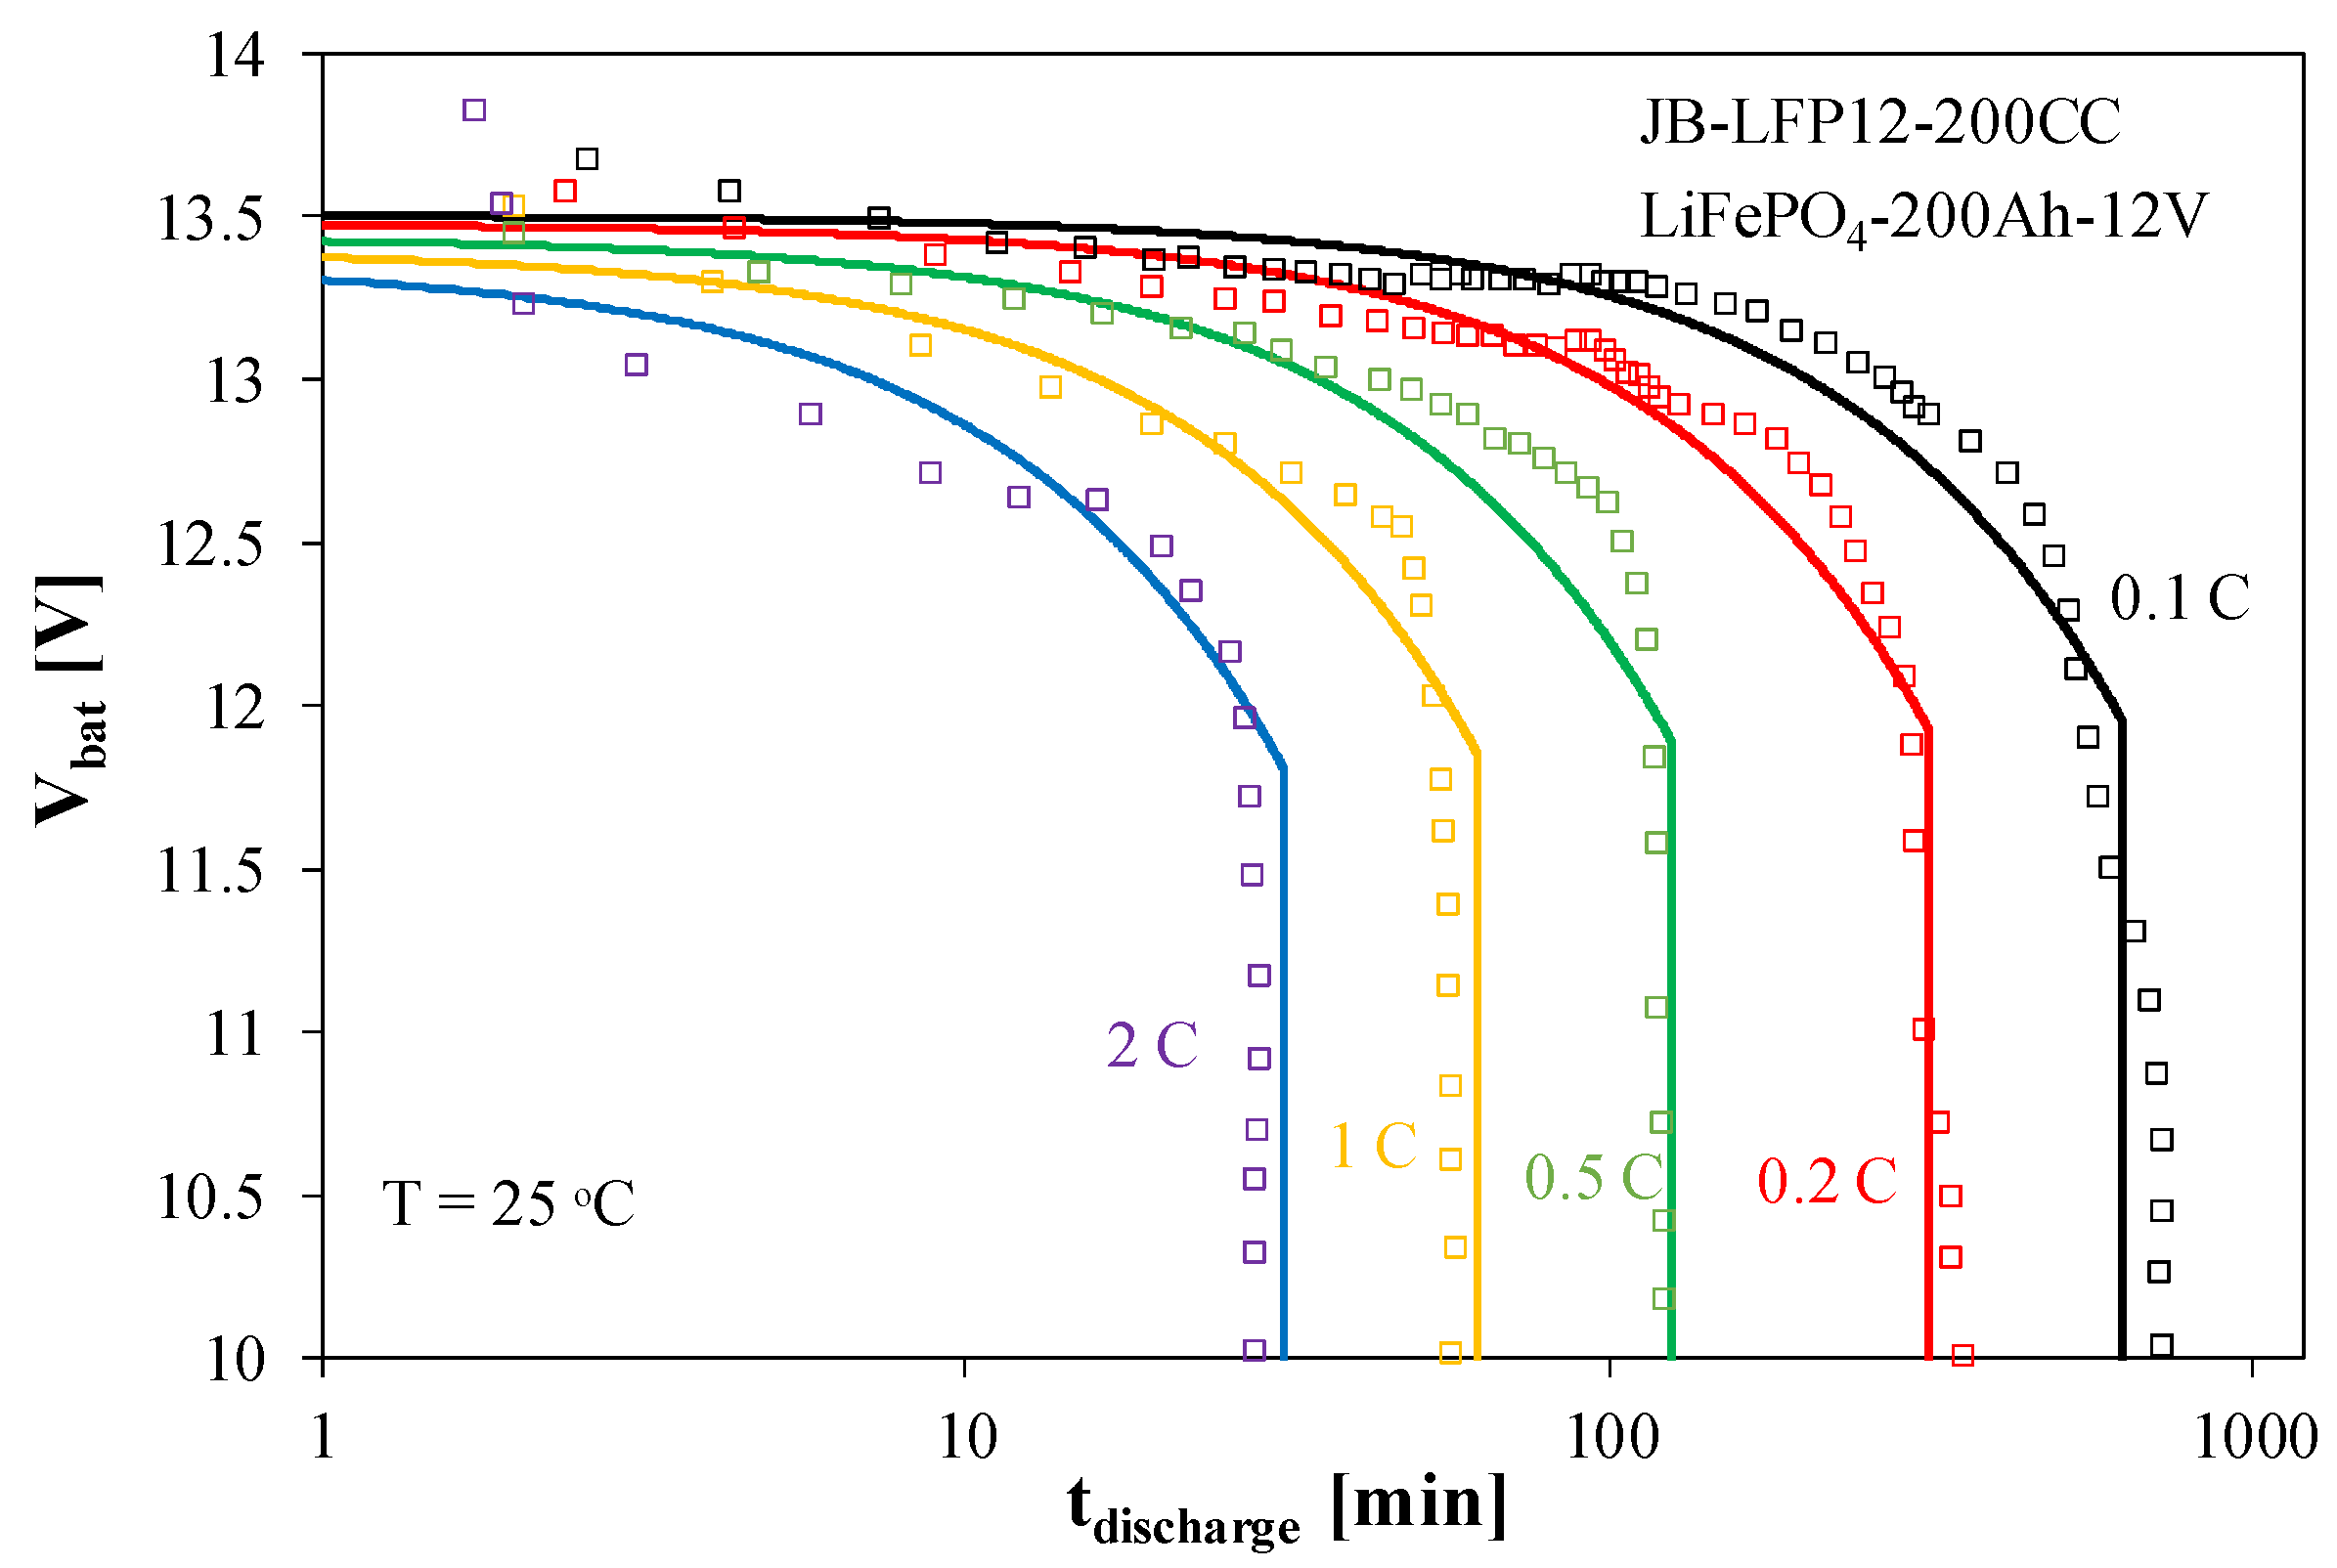
Figure 10 shows that when discharging the ACU3 battery at a current of 0.1 C, the battery voltage remains virtually constant for about 200 min, while at a current of 0.5 C, this is only for 20 min. After discharging the battery to a voltage of about 11.5 V, further discharge occurs rapidly (vertical line on the graph).
In the charging process of the considered battery, a few phases can be seen in the V
bat(SoC) waveform presented in
Figure 11. Charging is conducted with a constant current. In the initial charging phase, the V
bat voltage practically jumps from 10 to 12.5 V with a change in the SoC value of only 3%. Then, the V
bat voltage increases to 13.5 V with a further 20% increase in the SoC. A further increase in the V
bat voltage occurs with the increase in the SoC. After the V
bat voltage reaches 14.5 V, the charging current abruptly decreases, and the V
bat voltage stabilizes.
4.4. Lithium-Polymer Battery ACU4
In the ACU4 battery model, the dependence of the capacitor C
1 capacitance on the voltage is taken into account using a controlled current source G
C. Its efficiency is equal to the product of the current flowing through capacitor C
1 and the quotient of the capacitance C
X by the capacitance equal to 1 F. In the case under consideration, capacitor C
1 has a capacitance of 1 F. The dependence of the capacitance C
X on the voltage V
C1 is described by the formula of the form
where V
11, V
12, C
01, d
1, d
2, d
3, d
4, d
5, d
6, and d
7 are model parameters. The values of these parameters depend on temperature.
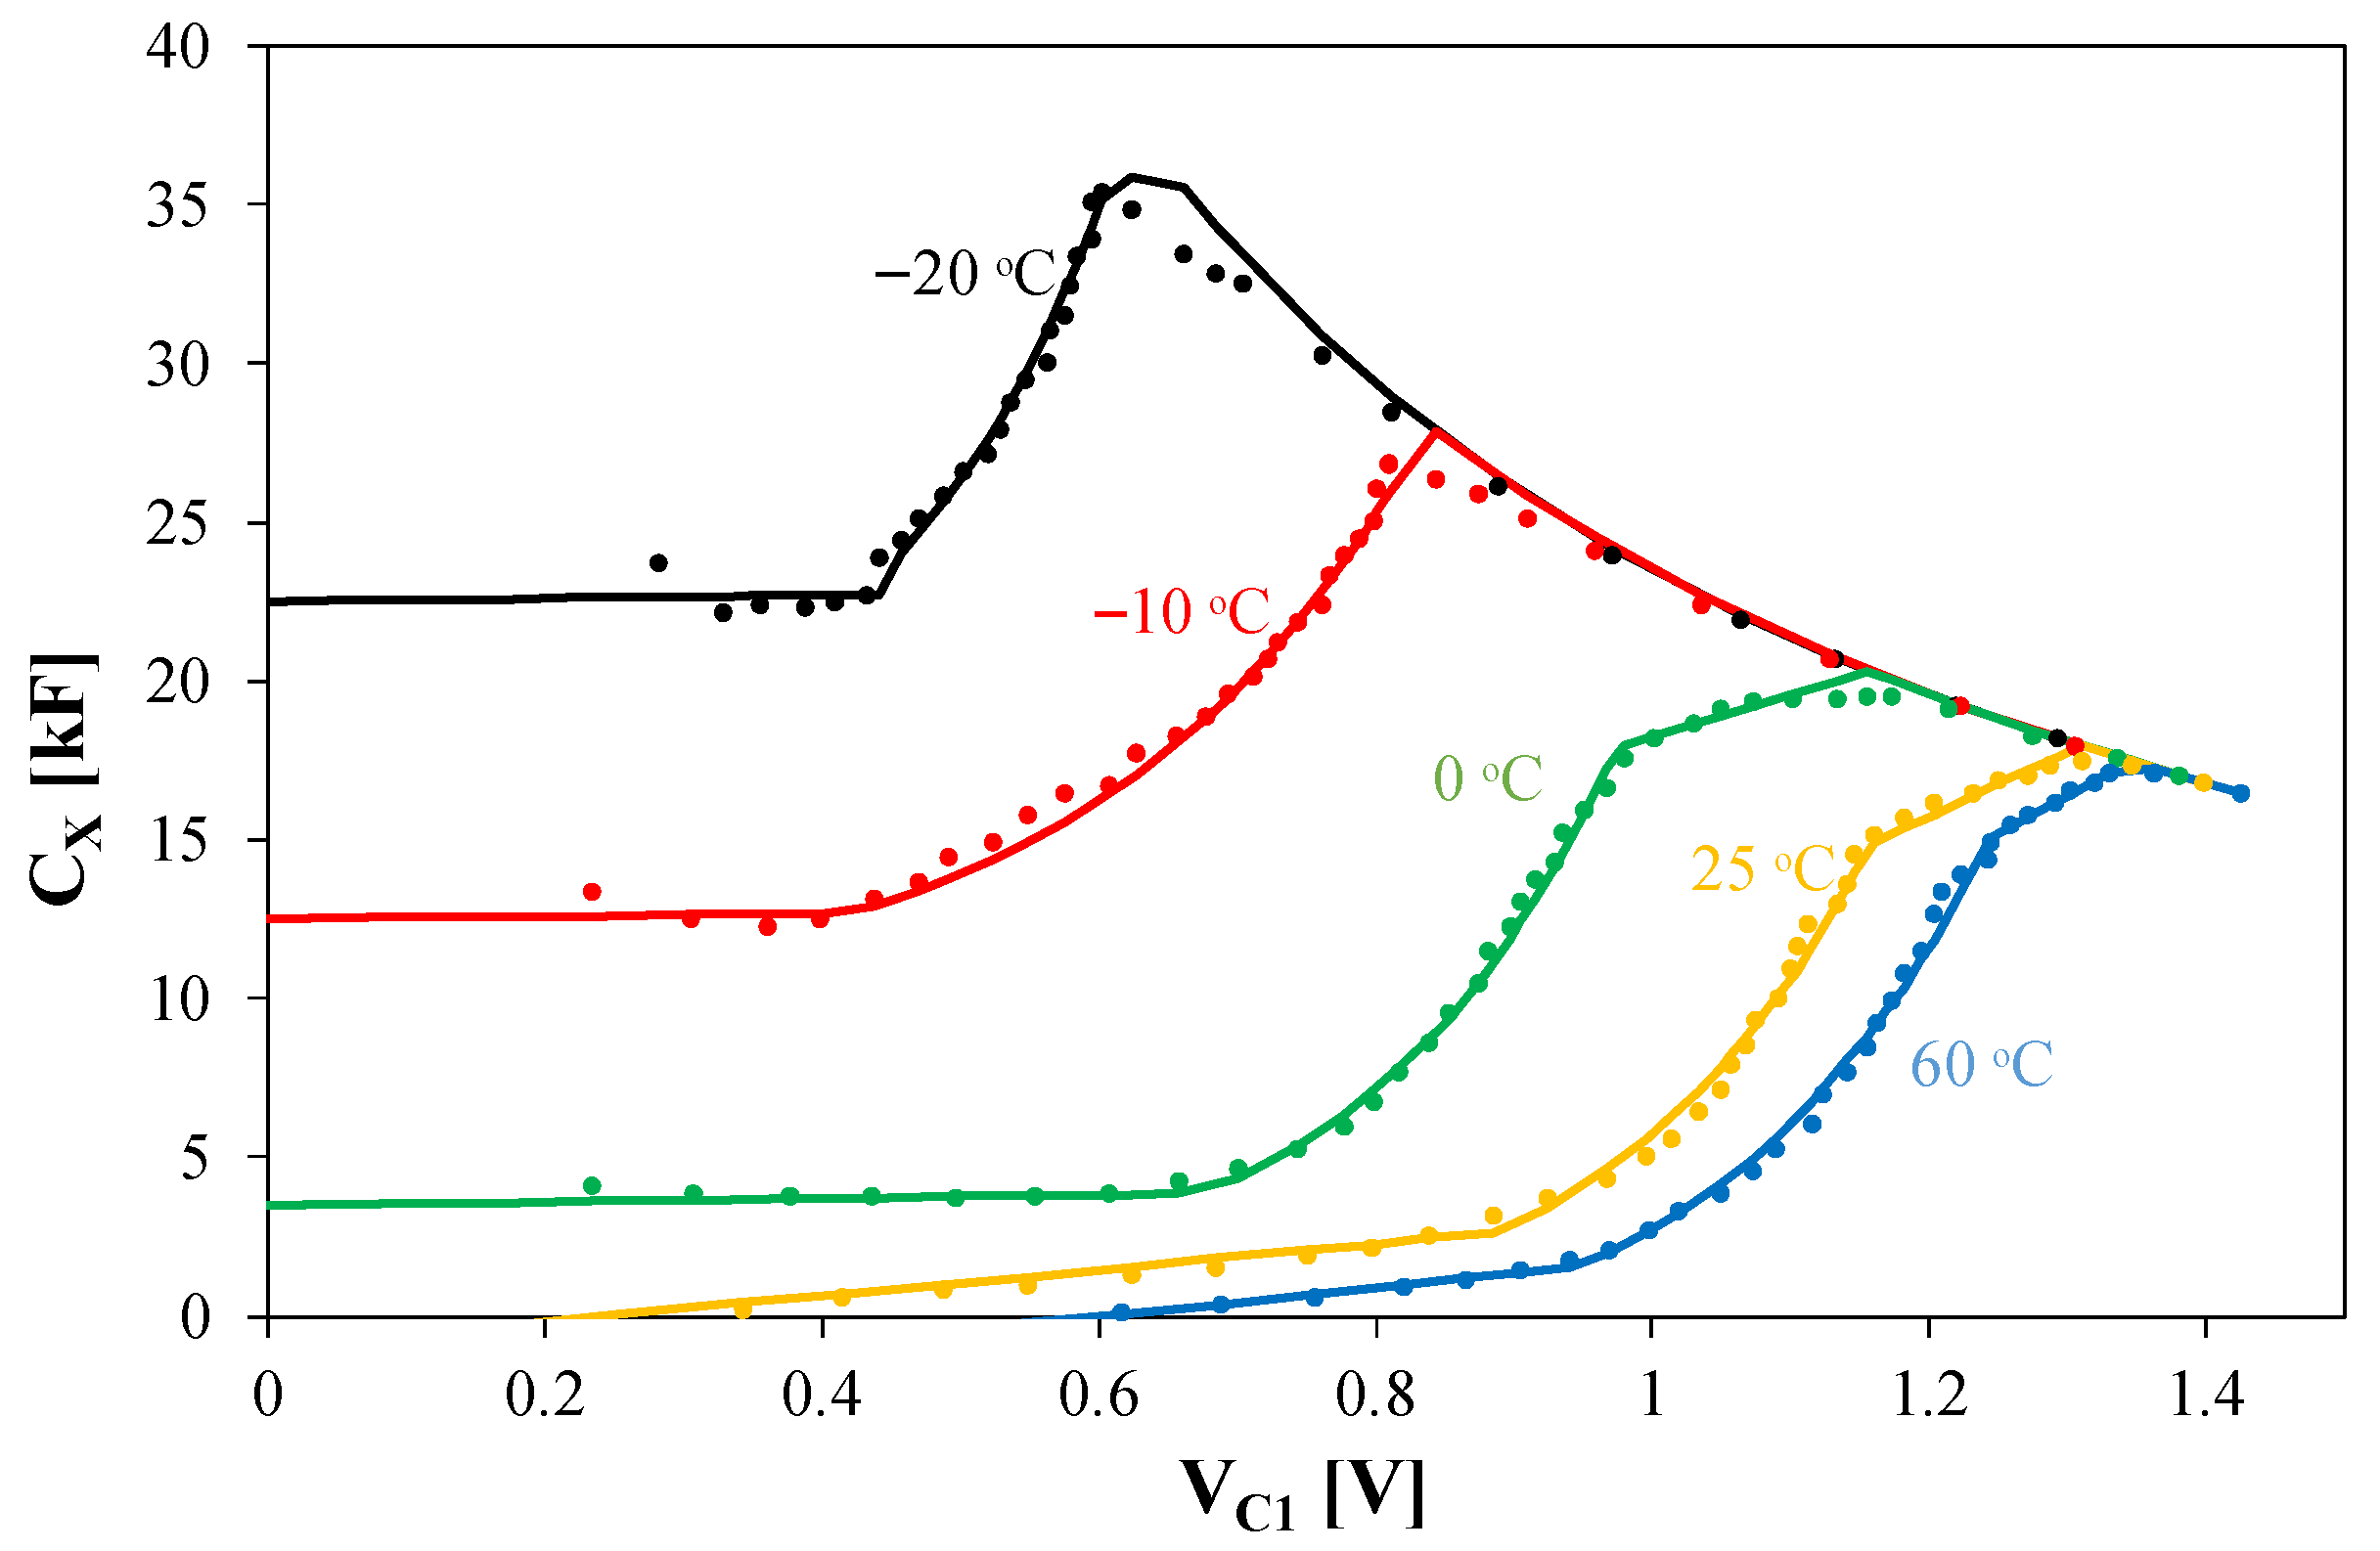
Figure 12 shows the calculated and measured dependencies of the capacitance of capacitor C
1 on the voltage across this capacitor for selected temperature values.
As can be seen, very good agreement was achieved between the calculation and measurement results over a wide range of voltage and temperature changes. An increase in temperature causes a decrease in the capacitance value CX. Each of the presented CX(VC1) relationships has a maximum that shifts to the right with an increase in the VC1 voltage. The maximum values of the capacitance CX decrease from approximately 35 kF at −20 °C to 15 kF at 60 °C.
The description of the G
SD source is given by Formula (2). In turn, the controlled current source G
R1 is described by formula
where R
21 is a model parameter, and the resistance R
20 is given by the relationship of the form
where I
0, R
22, R
23, R
24, V
13, V
14, V
15, a
R23, a
R24, a
R25, and a
R26 are the model parameters.
In turn, the controlled current source G
R2 is described by Formula (7), in which the resistance R
6 is described by a formula of the form
where R
26, R
27, R
28, R
29, R
30, R
31, R
32, R
33, R
34, V
16, V
17, V
18, V
19, V
20, V
21, V
22, a
R27, a
R28, a
R29, and a
R30 are the model parameters.
Selected calculation and measurement results for the considered battery are shown in
Figure 13,
Figure 14 and
Figure 15.
Figure 13 presents the charging characteristics of the ACU4 battery for selected charging current values.
Figure 13 shows that the ACU4 battery charging process with a constant current is characterized by a variable rate of increase in the V
bat voltage. This rate is the highest in the initial phase of the charging process and then decreases. As the charging current increases, the time required to fully charge the battery decreases proportionally. At a current of 1 C, this time does not exceed 1 h.
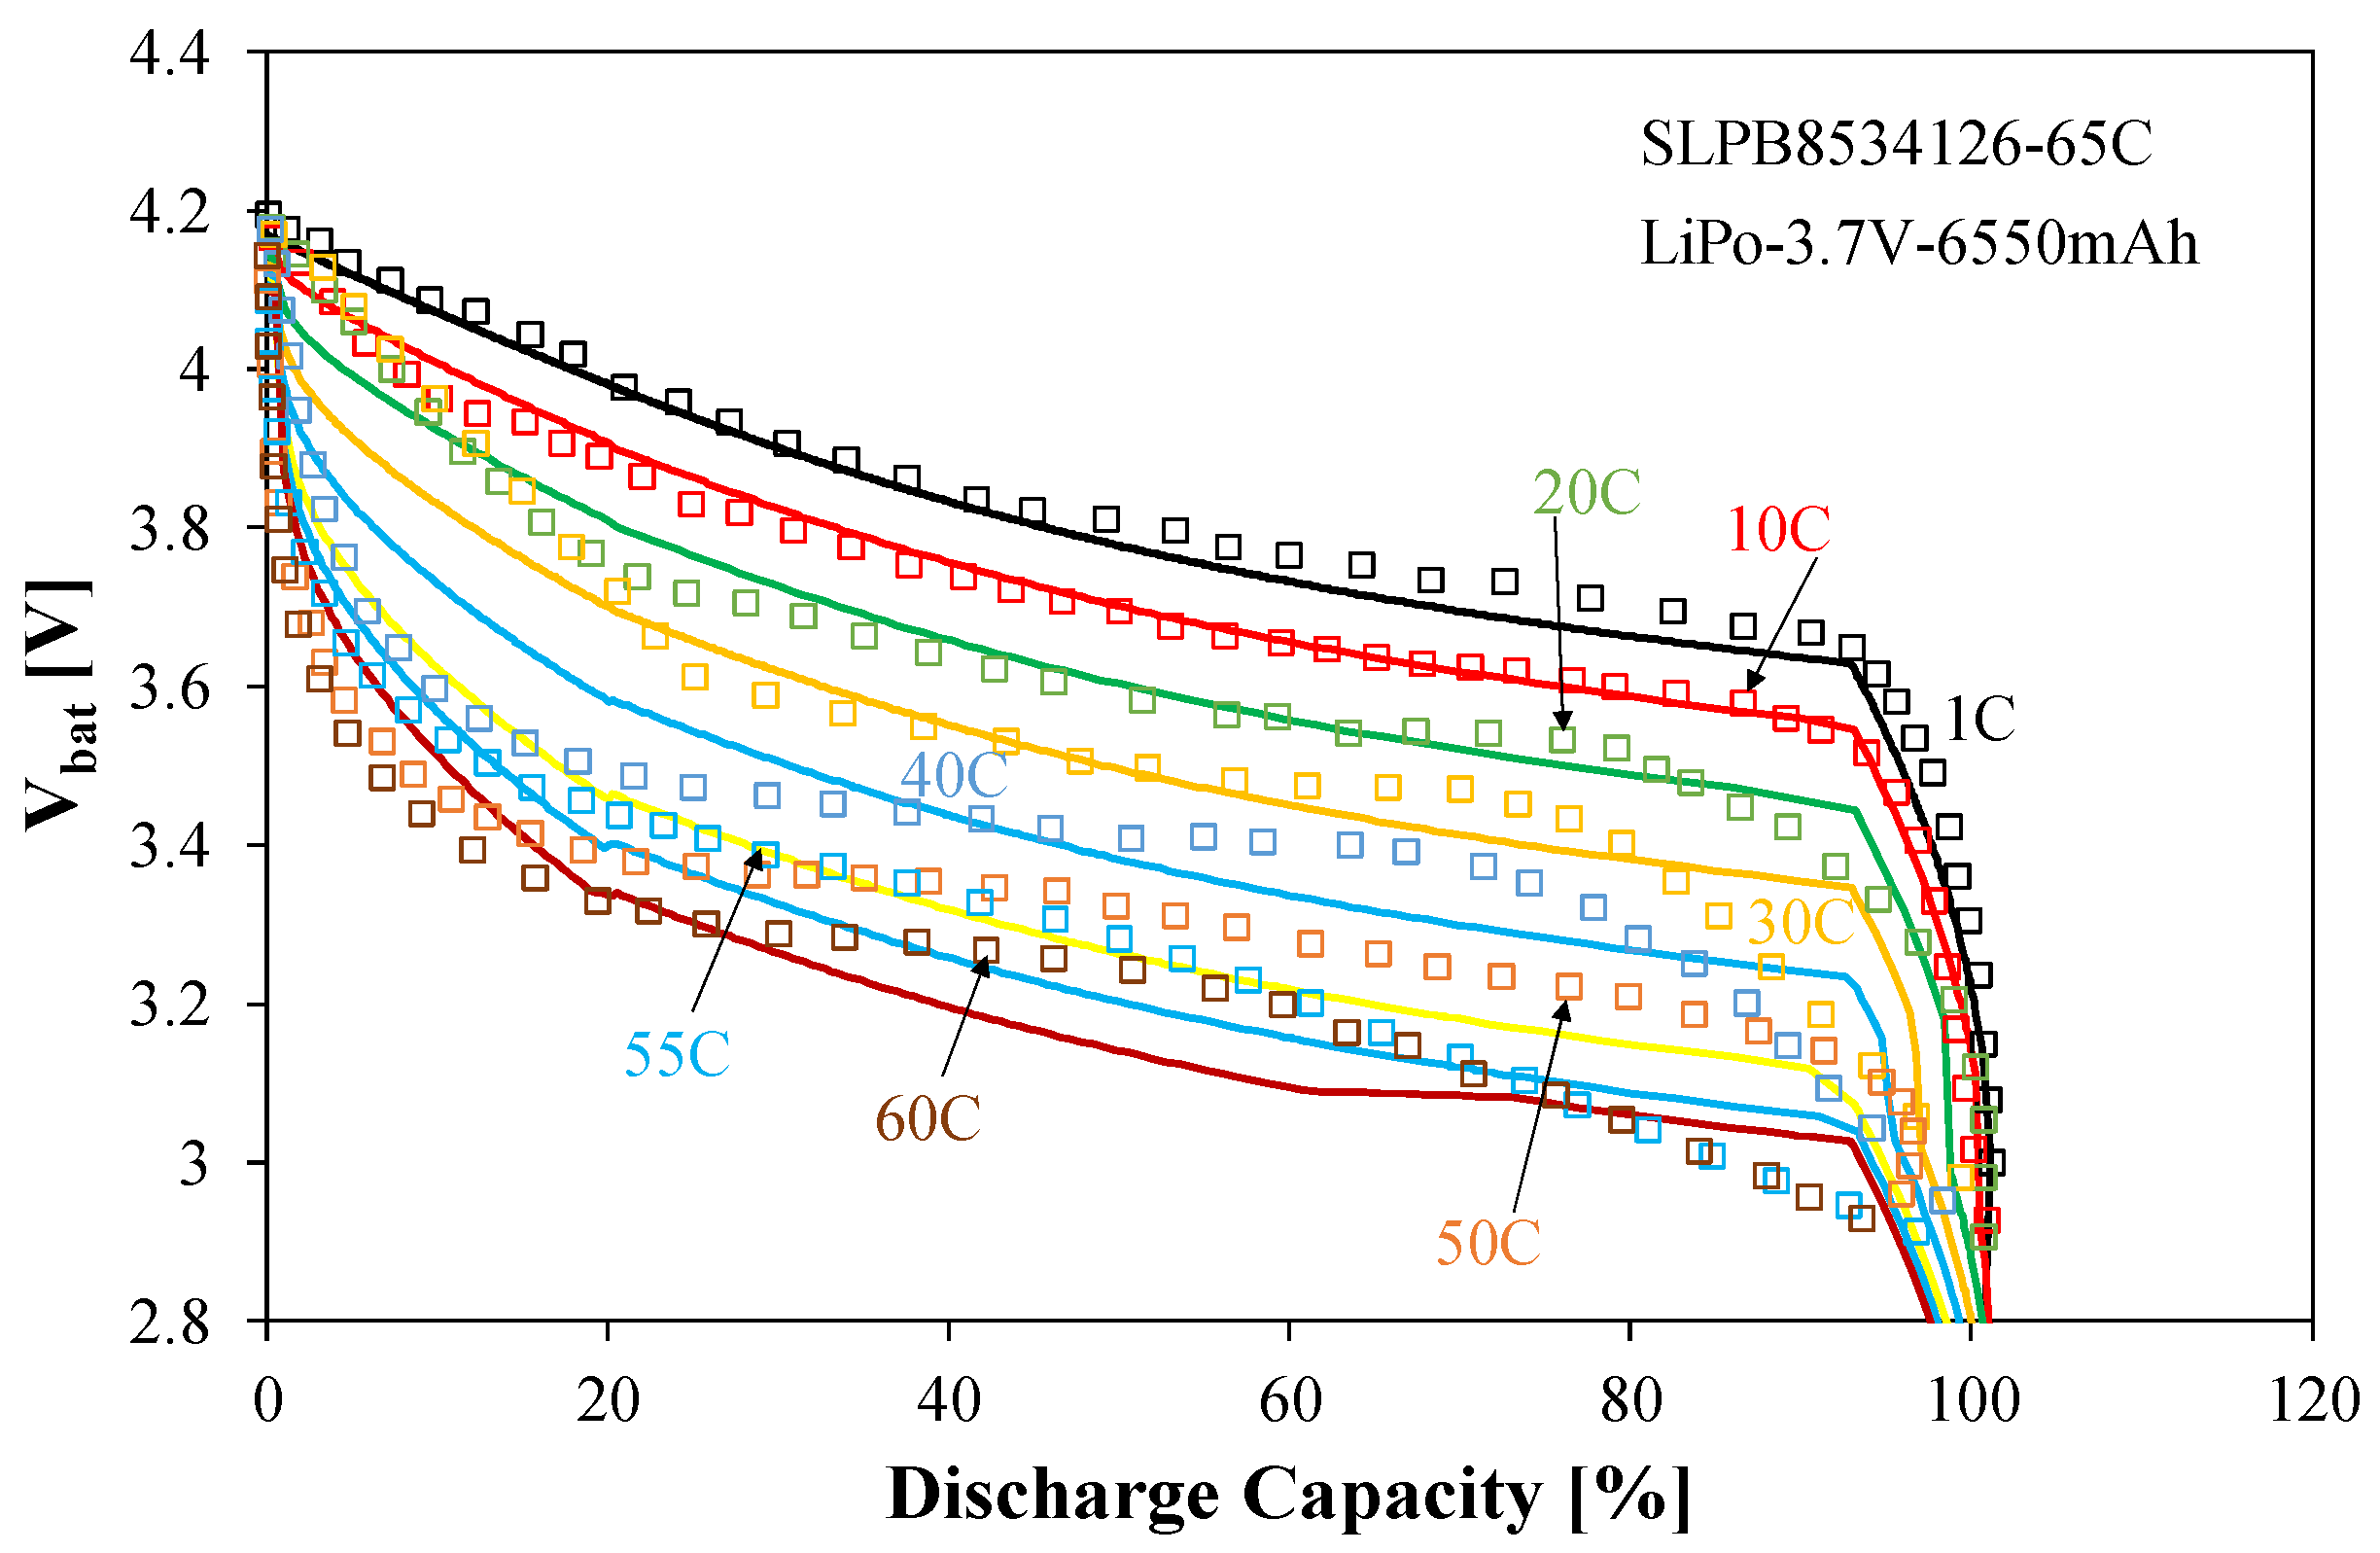
Figure 14 presents the discharge characteristics of the considered battery obtained for different values of the discharge current.
It is worth noting that for the ACU4 battery, the manufacturer provided data for discharge currents ranging from 1 C to 60 C. Of course, the rate of Vbat voltage decay as a function of discharged capacity (DoC) increases with increasing current. The DoC value was determined as the quotient of the charge drawn from the battery to the nominal value of this charge when the battery is fully charged. It is worth emphasizing that the Vbat(DoC) relationship exhibits a slight slope for DoC < 90%. Only after exceeding this DoC value does a rapid drop in Vbat become apparent. This means that the battery in question can be effectively operated almost until fully discharged.
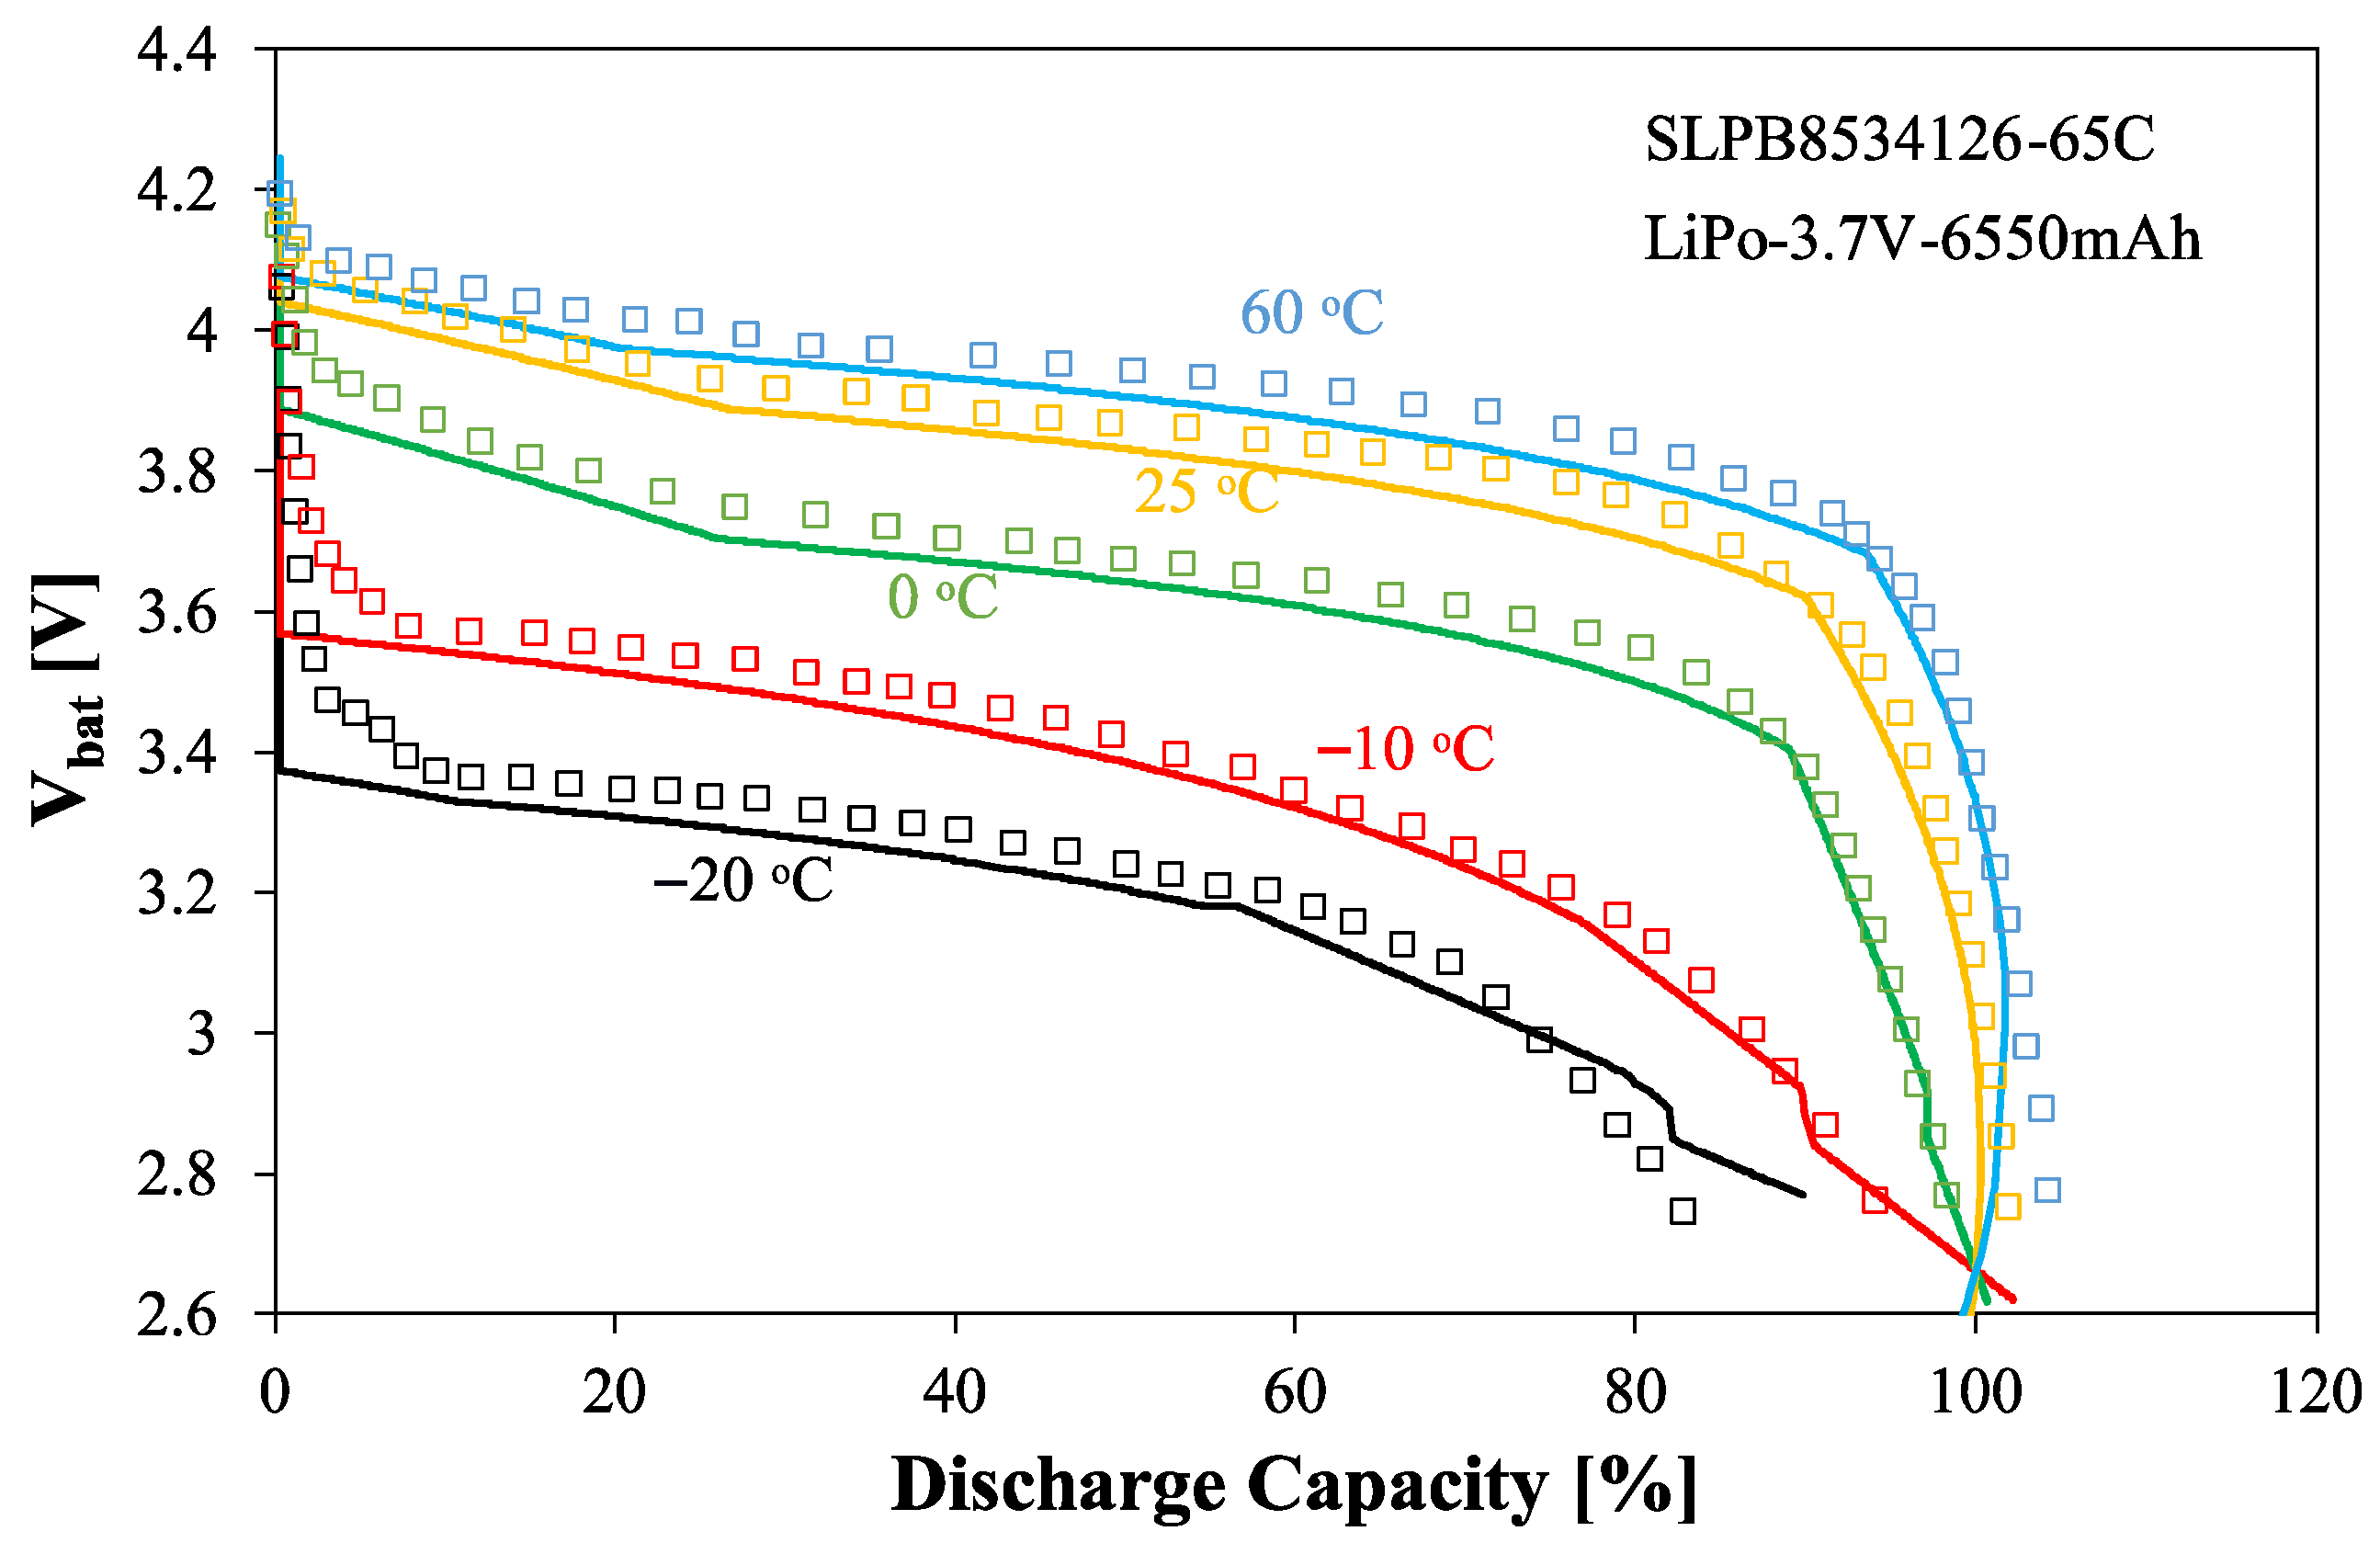
The effect of temperature on the discharge characteristics is illustrated in
Figure 15. The presented characteristics refer to a discharge current of 1 C.
As can be seen, in identical battery discharge states, the Vbat voltage exhibits an increasing temperature dependence. The voltage values obtained at −20 °C are up to 20% lower than at 60 °C. Increasing temperature also expands the DoC range, where the Vbat voltage remains nearly constant. It can also be seen that the ACU4 battery capacity significantly decreases at low temperatures.
4.5. Sodium-Ion Battery ACU5
In the ACU5 battery model, the controlled current source GC was omitted. The dependence of the capacitance C1 on the temperature T is described by Formula (1), and the current source GSD by Formula (2).
The internal resistance of the ACU5 battery during discharge is modeled by the controlled current source G
R1 with the efficiency described by the formula
where the resistance of resistor R
40 is described by a spline function of the form
where R
41, R
42, R
43, R
44, V
23, a
R40, and a
R42 are the model parameters.
In turn, the charging current is described by Formula (7), in which the resistance R
6 is described by the relationship of the form
where R
45, R
46, R
47, R
48, R
49, V
24, V
25, V
26, V
27, a
R43, and a
R44 are the model parameters.
Selected calculation and measurement results for the considered battery are shown in
Figure 16 and
Figure 17.
Figure 16 presents the discharge characteristics of the ACU5 battery for selected current values.
As can be seen, the characteristics shown in
Figure 16 are practically linear when the V
bat voltage is greater than 11 V. As the battery is discharged further, non-linearity in the V
bat(t
discharge) curve becomes apparent, resulting from the increase in the battery’s internal resistance during deep discharge. An increase in the discharge current causes a proportional shortening of the discharge time and a sudden drop in the V
bat voltage at the beginning of the discharge cycle. The presented characteristics indicate that, unlike other batteries, the sodium–polymer battery does not exhibit voltage stability at its terminals during discharge.
Figure 17 illustrates the voltage and current waveforms of the ACU5 battery during charging.
The presented battery charging process is carried out using a current-limited voltage source. During the initial charging phase (for a voltage of Vbat < 12 V), the internal resistance of the battery increases and then decreases. Charging time at a current of 0.1 C reaches 10 h. Once the battery is fully charged, the charging current decreases rapidly. Comparing the Vbat voltage values at the end of the charging process and at the beginning of the discharging process reveals a significant difference. This is due to the battery’s internal resistance, in which a voltage drop equal to the difference between the Vbat voltage and the VC1 + VCmin voltage occurs. This difference is positive during charging and negative during discharging.
Characteristics presented in this section were determined using Pspice A/D 17.2. The simulation time for each of charging and discharging characteristics was shorter than 0.5 s. The longest computation time occurred for self-discharging characteristics. This time did not exceed 1000 s.
5. Conclusions
This paper proposes a new battery model dedicated to SPICE. This model is designed in a circuit format, suitable for various battery designs. However, the formulas describing the efficiency of the individual controlled sources used in the developed model differ. These formulas describe the dependence of the battery capacity on the voltage at its terminals, as well as the dependence of the internal resistance during charging and discharging on this voltage. The model considers the range of permissible changes in the battery voltage during both charging and discharging. The main advantage of the proposed model is its universality and taking into account non-linearities of characteristics of the modeled batteries.
The correctness of the developed model was experimentally verified for five battery types with a different nominal capacity and nominal voltage, manufactured using different technologies. The charging and discharging processes were considered at different load currents, as well as the self-discharge process. The effect of temperature on the obtained characteristics was taken into account. In each case, good agreement was achieved between the calculation and measurement results, confirming the practical usefulness of the developed model.
The measurement and calculation results presented in this paper illustrate the operational properties of individual battery types. In particular, it can be noted that lead-acid AGM batteries are characterized by high voltage stability during discharge, while sodium-ion batteries exhibit high voltage variability during discharge. Lithium–polymer batteries can operate effectively over a wide temperature range, even below 0 °C. Lithium–iron–phosphate batteries are characterized by a narrow range of voltage changes during discharge. AGM batteries experience the fastest self-discharge, and the rate of this process increases with increasing temperature.
All characteristics presented in this paper were obtained using transient analysis. This type of analysis allows for the analysis of charge flow between the power source, battery, and load. This makes the developed model ideal for analyzing the properties of electronic and power electronic systems containing electrochemical energy storage. It can be useful for designers of such systems, enabling the rapid analysis of various operating scenarios.
The experimental verification of the proposed model was performed for nominal characteristics of the tested devices only. Of course, the characteristics of actual devices can differ from nominal characteristics. The real-world cell-to-cell variations can be taken into account using Monte Carlo analyses in SPICE. In these analyses, one can define the range of change in each of the model parameters basing on the data given by the manufacturer.
For the user of batteries, it is also important to be able to estimate the permissible number of charge and discharge cycles of these devices under established environmental conditions [
42]. In further work, the authors will propose a modification of the proposed model that will enable the determination of its SoH.
