Abstract
Accurate estimation of the State-of-Health (SOH) of lithium-ion batteries is crucial for ensuring the safety and longevity of electric vehicles and energy storage systems. However, conventional LSTM models often fail to capture the nonlinear degradation dynamics and long-term dependencies of battery aging. This study proposes a Fractional-Derivative Enhanced LSTM (F-LSTM), which incorporates fractional parameters α and Δt into the cell state update to model multi-scale memory effects. Experiments conducted on the CALCE LiCoO2 dataset and the Tongji University NCA dataset demonstrate that, compared with the standard LSTM, the proposed F-LSTM reduces RMSE and MAE by more than 40% while maintaining robust performance across different chemistries, temperatures, and dynamic conditions. These results highlight the potential of integrating fractional calculus with deep learning to achieve accurate SOH prediction and support intelligent battery management.
1. Introduction
The global transition to sustainable energy and the urgent need to address climate change have positioned electrification as a central strategy for the transportation and power grid sectors. Lithium-ion batteries (LIBs) have emerged as a pivotal technology in this transition [1]. Among them, lithium cobalt oxide (LiCoO2) stands out as a representative cathode material for LIBs due to its high energy density and widespread use in portable electronic devices, and as an important foundation in the early development of lithium-ion batteries, making it a critical component of modern energy systems [2,3]. However, the performance of LiCoO2 inevitably degrades over its operational lifespan, characterized by capacity fade and increased internal resistance [4]. Furthermore, the nonlinear degradation patterns exhibited by LiCoO2 batteries, such as the “slow-then-fast” capacity decay observed under dynamic conditions, present a challenging scenario for models to capture long-term dependencies [5]. This degradation not only reduces device performance and range but, in severe cases, can pose significant safety risks, including electrolyte leakage, internal short circuits, and potential thermal runaway. Consequently, a sophisticated Battery Management System (BMS) is essential to ensure the safety, reliability, and optimal performance of battery-powered systems [6]. A critical function of the BMS is the accurate monitoring of the battery’s State of Health (SOH), a metric that quantifies the degree of aging. Precise SOH estimation is vital for intelligent battery management and extending battery lifespan [7,8].
Lithium-ion battery SOH estimation methods are classified into model-based [9] and data-driven approaches [10]. Model-based methods, such as Equivalent Circuit Models (ECMs) and electrochemical models [11], use mathematical formulations to describe internal physico-chemical processes, providing strong interpretability and insights into aging mechanisms. For instance, Zhi cheng Xu et al. [12] developed a hybrid framework integrating a Minimal Electrochemical Model (MEM) with an ECM, where the ECM models external dynamics and the MEM simulates lithium concentration distribution. By linking SOH to irreversible lithium loss, this framework enhances real-time state-of-charge (SOC) estimation accuracy. Similarly, Chaofan Li et al. [13] proposed an ECM-based method incorporating Electrochemical Impedance Spectroscopy (EIS) and Gaussian Process Regression (GPR), improving fit to EIS data and accuracy in capturing internal degradation. However, these methods often require computationally intensive parameter identification and exhibit limited adaptability to varying battery chemistries and conditions, constraining their practical use [14,15].
In contrast, Data-driven methods for lithium-ion battery SOH estimation and remaining useful life (RUL) prediction leverage operational data to model degradation patterns without requiring electrochemical knowledge. These include machine learning and deep learning networks like Long Short-Term Memory (LSTM) [16] and Gated Recurrent Units (GRU) [17]. For instance, Bin Gou et al. [18] developed a hybrid ensemble method using Pearson correlation to select health indicators, integrating ELM and RVFL with a Nonlinear Autoregressive structure and Bootstrap for robust SOH and RUL prediction. Similarly, Jiantao Qu et al. [19] proposed PA-LSTM, combining LSTM with particle swarm optimization and attention mechanisms, enhanced by CEEMDAN for denoising, outperforming traditional methods on the NASA dataset. However, these methods require large, high-quality datasets, often unavailable for a battery’s full life cycle, limiting generalization [20]. Real-world complexities, such as irregular charge/discharge patterns and varying temperatures, further challenge model accuracy [21]. These factors introduce a high degree of nonlinearity and stochasticity into the degradation process, which conventional data-driven models often struggle to capture effectively.
Among various data-driven approaches, recurrent neural networks (RNNs) [22] such as LSTM networks, have been widely adopted for SOH estimation due to their inherent ability to handle time-series data. For instance, Minggang Zheng et al. [23] proposed a joint estimation method for SOC and SOH of lithium-ion batteries, integrating Support Vector Machine (SVM) and LSTM. However, standard LSTM networks often fall short in modeling the intrinsic long-term dependencies associated with battery degradation, primarily due to the vanishing gradient problem during training, as highlighted in the foundational work of Bengio et al. [24], which demonstrated the exponential decay of error signals in deep sequences. This non-optimality is further evidenced in battery-specific applications; for example, in Van et al. [25], LSTM-based SOH and internal resistance estimation struggled with nonlinear degradation curves, leading to reduced accuracy over extended cycles.
This limitation is exacerbated in battery aging by pronounced “memory effects”, where the current health state is not merely a function of recent inputs but is highly dependent on the entire operational history, including cumulative stress from prior charge–discharge cycles. As noted by Lao-atiman et al. [26], these effects manifest in complex degradation trajectories, such as the nonlinear “slow-then-fast” capacity decay with distinct inflection points observed under dynamic conditions like fast charging or second-life applications. Standard LSTM models, reliant on gating mechanisms, often fail to accurately capture these patterns, as they may not adequately propagate long-range historical information.
To overcome these limitations, researchers have been exploring more advanced hybrid modeling strategies. For instance, Mingyu Gao et al. [27] proposed a novel hybrid framework named HFCM-LSTM, where the High-level Feature Combination Module (HFCM) extracts deep latent features from raw data to assist the LSTM in capturing time-series dependencies, thus enabling end-to-end SOH estimation. Furthermore, Physics-Informed Neural Networks (PINNs) have recently attracted significant attention in SOH estimation by integrating physical degradation mechanisms with data-driven neural architectures, thereby enhancing interpretability and generalization. For example, Chunsong Lin et al. [28] proposed a lightweight two-stage PINN (TSPINN) for SOH estimation of lithium-ion batteries with different chemistries, achieving efficient incorporation of physical constraints. Similarly, Rong Zhu et al. [29] developed a Bayesian-calibrated PINN framework that combines physical modeling with data-driven approaches to estimate the SOH of second-life lithium-ion batteries (SL-LIBs). While these methods effectively bridge physics-based and data-driven modeling, they often involve complex parameter tuning and exhibit limited flexibility in capturing fractional-order dynamics.
Despite recent progress, effectively modeling the inherent long-term memory and nonlinear dynamics of battery degradation remains an unresolved challenge. The aging process of batteries exhibits complex self-similarity and memory dependencies across multiple time scales, phenomena that are well-characterized by Fractional Theory and Fractional Calculus [30]. These mathematical tools provide a robust framework for describing complex dynamical systems with memory and hereditary properties. For instance, Mithun Chakraborty et al. [31] conducted an in-depth analysis of the Grunwald-Letnikov definition, addressing the sensitivity of fractional-order differential equations (FODE) to random noise. They proposed a transformation scheme that converts fractional-order differentiation into integration, leveraging the smoothing effect of integration to mitigate noise influence. Applying this approach to battery SOH estimation can enhance the robustness of models in capturing the dynamics of battery degradation.
Inspired by this, this paper proposes a novel SOH estimation model that fundamentally enhances the capability of deep learning networks to model the long-term dependencies of the battery aging process. Instead of resorting to deeper or more complex network architectures, we innovatively incorporate the concept of the local fractional derivative into the core mechanism of the LSTM network—the cell state update. This approach enables our model to directly capture the intrinsic memory and fractional dynamics of battery degradation at the feature level, thereby learning its complex, nonlinear temporal evolution more accurately. Compared to conventional methods that rely on black-box fitting of large datasets, our approach imbues the model with greater physical insight by integrating the fractional derivative, allowing it to understand the essence of battery aging more effectively.
To summarize, the main contributions of this work are as follows:
- (1)
- We propose a novel LSTM variant that integrates a local fractional derivative operator into the cell state update function, enabling the model to learn the multiscale memory characteristics of battery degradation.
- (2)
- We construct a SOH estimation framework that preserves the interpretability of physical degradation processes while maintaining the flexibility of deep learning, bridging the gap between black-box models and physically inspired ones.
- (3)
- We validate the proposed model using the CALCE lithium-ion battery dataset, and the results show that it consistently outperforms the conventional LSTM model in both prediction accuracy and robustness.
2. Dataset Introduction
2.1. Dataset Description
This study employs publicly available lithium-ion battery data from the Center for Advanced Life Cycle Engineering (CALCE) at the University of Maryland, which is widely recognized for its completeness and reliability in battery health management research [32]. We focus on four LiCoO2 cells from the CS2 series (CS2_35, CS2_36, CS2_37, CS2_38), each with a nominal capacity of 1.1 Ah. The cells were cycled at a constant ambient temperature of approximately 24 °C until their capacity declined to about 70% of the nominal value, which was defined as the end of life (EOL).
In addition, we incorporate a dataset from Tongji University, comprising Nickel Cobalt Aluminum Oxide (NCA) batteries, to extend the analysis to a different chemistry and diverse operating conditions [33]. This dataset includes three NCA cells (CY25, CY35, CY45) with a nominal capacity of 3.5 Ah. These batteries were subjected to accelerated aging tests under varying temperature conditions (ranging from 25 °C to 45 °C) and dynamic charge–discharge profiles, reflecting real world usage scenarios such as electric vehicle operation. The tests continued until the capacity dropped to approximately 71% of the initial value, with comprehensive recordings of voltage, current, temperature, and capacity data. This dataset enhances the study’s generalizability by introducing heterogeneity in battery chemistry and environmental stressors.
Although accelerated aging in a laboratory may not fully replicate complex environments, such as extreme temperatures or fast-charging conditions, it provides reliable benchmark data for the initial validation of predictive models.
For detailed specifications of each battery, Table 1 summarizes the key attributes, including battery type, cycle counts until EOL, capacities and test conditions.

Table 1.
Detailed specifications of CS2 series batteries.
2.2. Feature Engineering and Rationale
To extract salient indicators of battery health from the raw time-series data, we implemented a feature engineering scheme. The selection of these features is grounded in their strong correlation with the internal electrochemical aging mechanisms of the battery, such as the loss of active material and the growth of internal resistance. Based on established battery aging literature, we extracted the following key features from each charge–discharge cycle [34,35]:
- Discharge Capacity (C):
This is the most direct measure of a battery’s SOH. We accurately calculated the actual discharge capacity for each cycle by integrating the current over time during the discharge phase. It directly reflects the battery’s ability to store charge, and its degradation is the ultimate manifestation of aging. Figure 1 illustrates the capacity degradation trajectories of all batteries throughout their full lifespans, highlighting their aging trends and performance decline.
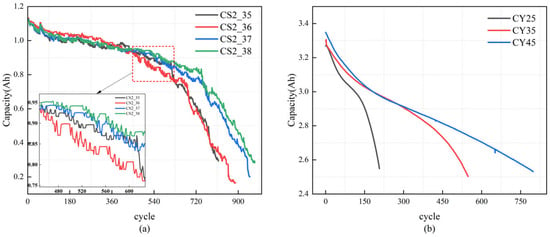
Figure 1.
Capacity degradation curves for the analyzed datasets: (a) CALCE dataset, (b) Tongji University dataset.
A fresh battery begins its life with an SOH near 100%, which gradually declines over its operational lifetime due to irreversible electrochemical degradation processes. SOH is formally defined as the ratio of the current capacity to the initial nominal capacity.
where is the current measured capacity of the battery, and is the rated capacity of the battery.
- 2.
- Mean Internal Resistance (IR):
The increase in internal resistance is a key indicator of lithium-ion battery degradation, as it directly affects energy efficiency and thermal behavior. Internal resistance includes both ohmic resistance and polarization resistance, both of which tend to increase with aging. This rise leads to a larger voltage drop during operation (commonly referred to as the I-R drop), reduced power output, and elevated heat generation—particularly under high current conditions.
In this paper, we approximated the equivalent DC internal resistance for each cycle by calculating the instantaneous ratio of voltage change to current change (ΔV/ΔI) throughout the discharge phase. The average of these values was then taken as the representative internal resistance for that cycle. This feature provides important insight into the cell’s impedance evolution over time and serves as a key input to the SOH estimation model. The internal resistance extraction process and its variation across aging cycles are illustrated in Figure 2.
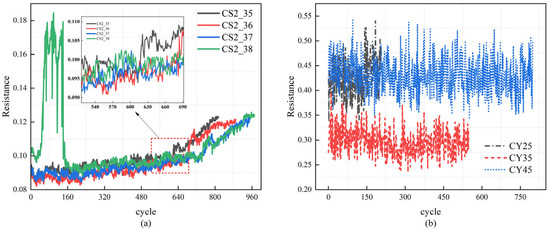
Figure 2.
Evolution of equivalent IR across cycles for the analyzed datasets: (a) CALCE dataset, (b) Tongji University dataset.
- 3.
- Constant Current Charging Time (CCCT):
The CCCT refers to the duration of the constant current (CC) phase during the battery charging process. In this stage, the battery is charged at a fixed current—typically at a 1C rate—until the terminal voltage reaches the upper limit of 4.2 V. As the battery undergoes aging, its internal resistance gradually increases due to degradation of active materials and formation of passivation layers. This increase in resistance causes the terminal voltage to rise more quickly under the same charging current. As a result, the voltage threshold of 4.2 V is reached earlier in the charging process, leading to a shortened CCCT.
The shortening of CCCT over successive charge–discharge cycles reflects the accumulation of electrochemical impedance within the cell, making it a useful indirect indicator of aging. Figure 3 illustrates the evolution of CCCT across aging cycles for all battery cells. As shown, there is a clear and consistent downward trend in CCCT over time, validating its effectiveness as a degradation-sensitive feature for battery health monitoring.
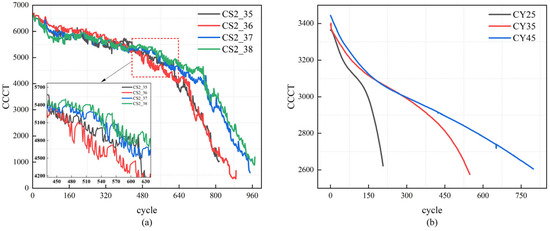
Figure 3.
Evolution of CCCT for the analyzed datasets: (a) CALCE dataset, (b) Tongji University dataset.
- 4.
- Constant Voltage Charging Time (CVCT):
The CVCT measures the time spent in the constant voltage (CV) charging stage, which begins after the battery reaches 4.2 V and continues until the current decreases to 50 mA. As a battery ages and its capacity declines, it requires more time in this phase to absorb the remaining charge due to increased impedance and reduced ion transport efficiency. Hence, CVCT is a sensitive indicator of aging and typically exhibits a notable upward trend, especially in the later stages of the battery’s life. The evolution of CVCT across cycles is shown in Figure 4, capturing its progressive increase with degradation.
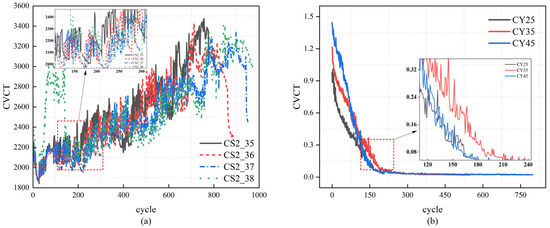
Figure 4.
Evolution of Constant Voltage Charging Time (CVCT) for the analyzed datasets: (a) CALCE dataset, (b) Tongji University dataset.
Notably, there are observable differences in degradation patterns among these batteries, such as the distinct IR and CVCT curves in CS2_38 compared to the others, which may arise from manufacturing variations, subtle differences in cell assembly, or minor inconsistencies in testing setups. These variations enhance the dataset’s representation of real world heterogeneity, thereby improving the reproducibility and generalizability of our study when models are trained and tested across them. Through preprocessing, these fundamental aging indicators provide a robust foundation for accurate SOH estimation, particularly when combined with advanced modeling techniques.
2.3. Data Preprocessing and Preparation
Before feeding the data into the neural network, two crucial preprocessing steps were performed to ensure data quality and improve model training stability:
- Outlier Removal and Trend Smoothing:
The raw feature data—including IR, CCCT, and CVCT—was first examined for anomalous values. These anomalies could originate from sensor errors, electrical noise, or transient environmental fluctuations during testing. To mitigate their impact, we applied a smoothing filter to the capacity degradation curves, which are expected to follow a generally monotonic downward trend as a result of irreversible aging. This step ensures that the degradation profile more accurately reflects the underlying physical deterioration process and avoids misleading fluctuations that could bias the model.
Additionally, outlier points in the extracted features were identified using a statistical thresholding method. Data points lying beyond three standard deviations from the moving average were considered outliers and excluded from the final training dataset.
- 2.
- Feature Normalization:
Since the extracted features span different physical dimensions and numerical ranges (e.g., resistance in ohms, time in seconds), normalization is necessary to prevent disproportionate influence from high-magnitude features and to ensure a balanced learning process within the network. We adopted Min-Max normalization to scale each feature to the range [0, 1], using the following transformation:
where is the original feature value, and and are the minimum and maximum values of that feature across all cycles of a given battery.
This normalization not only improves numerical stability during training but also accelerates convergence by ensuring all input dimensions contribute comparably to the model’s loss function. Following these preparation steps, we obtained a structured time-series dataset for each battery cell. Each data point in the sequence represents one cycle and contains the normalized input features (IR, CCCT, CVCT) and the corresponding ground-truth SOH label.
3. LSTM Based on Fractional Dimension
3.1. Structure of LSTM
LSTM networks are a refined variant of RNNs, specifically developed to overcome the vanishing gradient problem that often hampers the training of standard RNNs, especially on long sequences. The key innovation of LSTM lies in the introduction of a cell state, a memory pathway that persists across time steps and enables the network to retain long-term contextual information. To effectively manage the flow of information through time, LSTM incorporates a set of gating mechanisms—namely the input gate, forget gate, and output gate. These gates dynamically control which information is written to, retained in, or output from the cell state at each time step. This structure allows the LSTM to selectively memorize or discard information, thereby significantly enhancing its ability to capture long-range temporal dependencies in sequential data. The internal architecture of a standard LSTM unit, including its cell state and gating components, is illustrated in Figure 5.
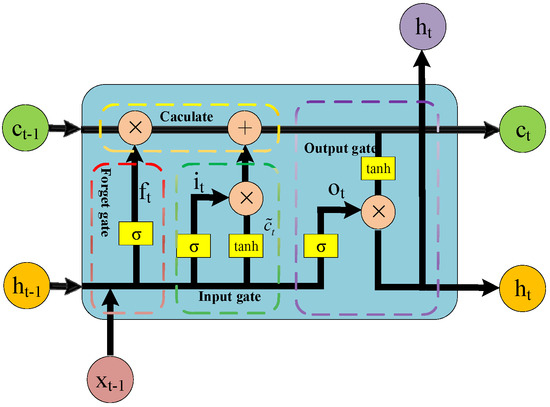
Figure 5.
LSTM gating structure.
The gating mechanism within an LSTM unit comprises three distinct gates: the input gate, the forget gate, and the output gate. Each gate plays a crucial role in regulating the flow of information through the network. Specifically, the input gate determines the extent to which new information from the current input and previous hidden state should be written into the cell state. It effectively controls whether the memory cell should update its content based on the present input. The operation of the input gate is mathematically expressed as follows:
where denotes the activation value of the input gate, is the weight matrix, represents the hidden state from the previous time step, is the input vector at the current time step, and is the bias term.
where denotes the candidate cell state, is the associated weight matrix, and is the bias term.
The forget gate is responsible for deciding which parts of the previous cell state should be retained and which should be discarded. It enables the LSTM to selectively “forget” irrelevant or outdated information, thereby preventing the accumulation of noise over long sequences. This mechanism is essential for maintaining a compact and meaningful memory representation as the sequence progresses. The behavior of the forget gate is governed by the following mathematical expression:
where represents the forget gate, with as its weight matrix and as the bias term.
The output gate determines which portion of the information stored in the cell state is exposed to the next hidden state and, consequently, passed on to the subsequent time step or output layer. By regulating the flow of information from the internal memory to the external output, the output gate plays a crucial role in shaping the LSTM’s temporal response and ensuring relevant features are preserved for downstream tasks. The operation of the output gate is defined by the following equation:
where denotes the output gate, with as its weight matrix and as the bias term.
By combining the operations of the forget gate (Equation (5))—which discards outdated information—and the input gate (Equations (3) and (4))—which incorporates new candidate information, the cell state is updated in a controlled manner. This dual mechanism enables the LSTM to preserve relevant long-term dependencies while integrating new inputs. The updated cell state is computed as follows:
where denotes the current cell state and represents the Hadamard (element-wise) product.
By combining the output gate (Equation (6)) with the current cell state (Equation (7)), the final output is computed as follows:
where denotes the final output of the LSTM unit.
3.2. Local Derivative Based on Fractional Dimension
In classical calculus, derivatives quantify the local rate of change of a function that is assumed to be continuous and smooth. However, many real-world processes—such as State-of-Health (SOH) degradation curves, state-of-charge (SOC) trajectories, and financial time series—often deviate from these assumptions. These signals typically exhibit non-smooth, irregular, or even fractional-like behavior, which is characterized by:
- Apparent roughness coupled with underlying regularity;
- A dimensionality that lies between integers.
To more accurately describe the evolution of such “rough” or irregular dynamics, fractional derivatives (also known as fractional-order derivatives) are employed. Let be a differentiable function defined on . The local fractional derivative based on fractional dimensionality can be defined in the following classical form:
where α denotes the fractional dimension of the independent variable x, serving as a scaling exponent that characterizes the degree of irregularity in the dynamic evolution.
When α = 1, the above expression reduces to the standard first-order difference form, recovering the classical definition of a derivative.
3.3. Improved LSTM
The conventional update of the LSTM cell state, as defined in Equation (7), can be reformulated using a standard first-order difference as follows:
However, this first-order difference formulation limits the model’s ability to capture complex, multi-scale variations inherent in real-world data. To address this limitation, we introduce a local fractional derivative based on fractional dimensionality into the cell state update mechanism of the LSTM. This enhancement enables the model to better characterize the evolution of complex systems that exhibit intrinsic fractional structures.
Accordingly, we compute the local fractional derivative of the current LSTM cell state as follows:
In a discrete setting with time step ∆t, this derivative can be approximated as:
We interpret the right-hand side of Equation (10) as a special case of the local fractional derivative when the fractional order α = 1. Therefore, the generalized form of the derivative can be expressed as:
which holds exactly when α = 1. To generalize this formulation for any (0, 1], we combine (12) and (13) to obtain a modified state update expression:
This improvement is directly relevant to SOH estimation, as battery aging reflects the interplay between rapid electrochemical reactions and gradual structural changes, both of which manifest fractional-order memory effects. The introduction of the fractional derivative in Equation (14) establishes a mechanistic link to the physical degradation processes of lithium-ion batteries. Specifically, the fractional derivative enables the network to account for the cumulative influence of historical charge–discharge cycles, with the parameter α serving as a scaling exponent that regulates the retention of past information. Values of α < 1 place greater emphasis on long-term dependencies while simultaneously mitigating the impact of short-term noise. Meanwhile, the fractional time increment Δt further refines temporal resolution, allowing the model to capture the non-uniform progression of capacity fade, such as the transition from “slow” to “fast” degradation driven by electrolyte decomposition and active material loss. Notably, when α = 1, Equation (14) reduces to the standard LSTM update rule, thereby ensuring both backward compatibility and theoretical consistency.
4. Experimental Result Analysis
4.1. Subsection
To evaluate the performance of the proposed F-LSTM, a comparative experiment was conducted against the standard LSTM under identical parameter settings for SOH estimation. All experiments were performed on a system equipped with an Intel(R) Core(TM) i5-10300H CPU and an NVIDIA GeForce GTX 1650 Ti GPU. The software environment consisted of PyCharm (2024.2.1) as the development platform and PyTorch (v2.5.1) as the deep learning framework.
To evaluate the performance of the proposed F-LSTM network and the standard LSTM network, two commonly used error metrics—Root Mean Square Error (RMSE) and Mean Absolute Error (MAE)—were adopted. The corresponding formulations are given as follows:
where n represents the number of measurements and denotes the reference value of SOH.
4.2. Sensitivity Analysis of Hyperparameters and
The experimental parameter settings are summarized in Table 2. Among them, α and ∆t are specific to the proposed F-LSTM model, while all other parameters are kept identical between the F-LSTM and the standard LSTM for fair comparison. To validate the appropriateness of the selected fractional dimension α (set to 0.8) and fractional time increment Δt (set to 0.7), a one-at-a-time (OAT) sensitivity analysis was conducted. Specifically, α was tested across the values {0.4, 0.6, 0.8, 0.9} while fixing Δt at 0.7, followed by testing Δt across the values {0.6, 0.7, 0.8, 0.9} with α fixed at 0.8. For each parameter combination, evaluate the model using the CS_236 dataset.

Table 2.
Experimental parameter settings.
In Figure 6a, with Δt fixed at 0.7, α values of {0.4, 0.6, 0.8, 0.9} were tested. The SOH prediction aligned best with the reference at α = 0.8, effectively capturing the “slow-then-fast” degradation, while α = 0.4 showed deviations and α = 0.9 neared standard LSTM behavior. In Figure 6b, with α fixed at 0.8, Δt values of {0.6, 0.7, 0.8, 0.9} were evaluated, with Δt = 0.7 yielding the closest match, especially in later cycles.
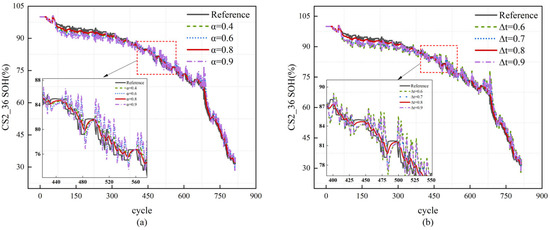
Figure 6.
Sensitivity Analysis of SOH Prediction for CS2_36 with Varying α and Δt: (a) Different α Values (Δt = 0.7), (b) Different Δt Values (α = 0.8).
4.3. Performance Evaluation on CALCE LiCoO2 Dataset
To evaluate the performance of the proposed F-LSTM model, this section conducts a detailed analysis based on the CALCE dataset, which comprises cells CS2_35 to CS2_38 and serves as a benchmark for assessing predictive accuracy.
During the model training phase, a leave-one-out cross-validation strategy is employed, where each battery is sequentially selected as the test subject while the remaining three batteries form the training set. For example, when CS2_35 is designated as the test battery, the full lifecycle data from CS2_36, CS2_37, and CS2_38 are concatenated and fed into the model as time-series inputs, starting from cycle 1 and progressing cycle-by-cycle to preserve temporal dependencies. The input features, including normalized IR, CCCT, and CVCT, together with the corresponding SOH labels, are processed chronologically, and the model is optimized using backpropagation through time. This protocol ensures strict independence between training and testing sets, thereby avoiding data leakage and significantly enhancing the model’s generalization capability.
It is noteworthy that discrepancies exist among the datasets, such as the relatively flat degradation curve of CS2_36 compared with the steeper decline trajectories of CS2_37 and CS2_38. These variations resemble outlier-like behaviors arising from manufacturing inconsistencies or subtle experimental differences. The proposed F-LSTM accommodates such heterogeneity through the incorporation of fractional derivatives in the cell state update, which enable the model to capture multi-scale memory effects and nonlinear degradation patterns. As shown in Figure 7, this enhanced capacity allows the F-LSTM to produce prediction curves that align more closely with the ground truth compared with those of the standard LSTM.
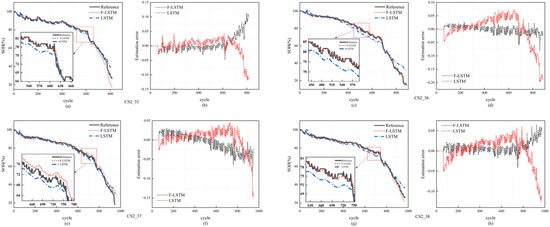
Figure 7.
SOH prediction and error comparison for CALCE CS2 batteries: (a,b) is the prediction result and error of CS2_35; (c,d) is the prediction result and error of CS2_36; (e,f) is the prediction result and error of CS2_37; (g,h) is the prediction result and error of CS2_38.
To further contextualize the performance of the proposed F-LSTM model, we compare its results with other state-of-the-art methods applied to the same CALCE dataset, as shown in Table 3. The comparison includes standard LSTM, SVR [3], MKRVM [14], and the proposed F-LSTM. The RMSE and MAE values for these methods are estimated based on the performance of SVR and MKRVM from the referenced studies. The F-LSTM model achieves the lowest average RMSE of 0.013 and MAE of 0.010 across all CS2 cells.

Table 3.
The experimental results are obtained on the CALCE dataset.
The superior performance of the F-LSTM arises from the synergy between feature preprocessing and fractional-order mechanisms, enabling adaptation to diverse degradation dynamics. With fractional parameters α and ∆t alongside basic feature extraction, the model effectively captures “slow–fast” capacity decay and other nonlinear aging patterns, yielding robust predictions under complex conditions such as temperature variations and irregular cycling. In comparison, SVR [3] and MKRVM [14], as machine learning methods, rely on static regression models that may not fully account for the dynamic memory effects across cycles, even with their respective optimizations (IAO and multi-kernel enhancements). The F-LSTM’s direct incorporation of fractional-order dynamics into the learning process reduces information loss and enhances robustness to noise, such as sensor errors, making it particularly suitable for real-time SOH estimation in battery management systems.
4.4. Validation on Tongji University NCA Dataset Under Diverse Conditions
To evaluate the generalization capability of the F-LSTM model, its performance is further validated using the NCA dataset from Tongji University. This dataset incorporates a different battery chemistry and dynamic operating conditions, including a temperature range of 25 °C to 45 °C and charge–discharge rates of 0.5 C/1 C, thereby simulating real-world scenarios.
The experiments adopt the same leave-one-out cross-validation strategy, with the model parameters α and ∆t fixed at 0.8 and 0.7, consistent with the CALCE dataset experiments. The corresponding prediction results are presented in Figure 8.
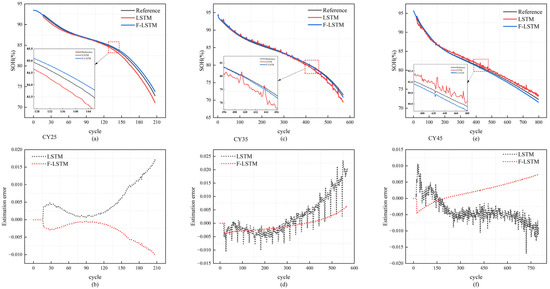
Figure 8.
SOH prediction and error comparison for Tongji University NCA batteries: (a,b) is the prediction result and error of CY25; (c,d) is the prediction result and error of CY35; (e,f) is the prediction result and error of CY45.
The MAE and RMSE were calculated, with the results summarized in Table 4. As shown, the F-LSTM achieved average RMSE and MAE values of 0.00348 and 0.00275, respectively, on the NCA dataset. Compared with the standard LSTM, which yielded 0.00660 and 0.00502, these represent reductions of approximately 47.3% and 45.2%.

Table 4.
The experimental results are obtained on the Tongji University dataset.
The superior performance of F-LSTM on the NCA dataset can be attributed to its fractional-order update mechanism (Equation (14)), which effectively captures the multi-scale memory effects induced by temperature variations and dynamic load conditions. In contrast to the constant-temperature setting of the CALCE dataset, the NCA dataset introduces variable temperatures and multi-rate cycling, thereby highlighting F-LSTM’s adaptability to nonlinear degradation patterns. These results further demonstrate the model’s applicability across different battery chemistries and reinforce its strong generalization capability.
5. Conclusions
This paper proposes a novel F-LSTM architecture that incorporates a local fractional derivative with non-integer order parameter α and a fractional time increment ∆t into the LSTM cell state update. Reformulated as a fractional-order difference equation, the model introduces α and ∆t as additional hyperparameters to better capture the irregular, non-stationary, and multi-scale characteristics of battery SOH degradation, and the impact of these two parameters on the estimation performance of the model was verified. Notably, the F-LSTM remains fully compatible with standard LSTM: when α = 1, it reduces exactly to the conventional formulation.
The experimental results on both the CALCE and Tongji University datasets demonstrate that the F-LSTM model consistently yields predictions that align more closely with ground truth, achieving lower RMSE and MAE values compared to the standard LSTM. This indicates enhanced accuracy and robustness, while also validating the model’s generalization capability across diverse chemistries and varying temperature and charge–discharge rate conditions. Consequently, the F-LSTM model offers a reliable solution for SOH estimation, highlighting its significant potential for application in practical battery management systems.
Author Contributions
Methodology, B.L.; Writing—original draft, J.H.; Writing—review & editing, C.W. All authors have read and agreed to the published version of the manuscript.
Funding
This research received no external funding.
Data Availability Statement
The original contributions presented in the study are included in the article, further inquiries can be directed to the corresponding author.
Conflicts of Interest
Author Jing Han was employed by the company China Aluminum Ningxia Energy Group Co., Ltd. The remaining authors declare that the research was conducted in the absence of any commercial or financial relationships that could be construed as a potential conflict of interest.
References
- Al-Smadi, M.K.; Abu Qahouq, J.A. State of Health Estimation for Lithium-Ion Batteries Based on Transition Frequency’s Impedance and Other Impedance Features with Correlation Analysis. Batteries 2025, 11, 133. [Google Scholar] [CrossRef]
- Feng, J.; Cai, F.; Zhan, X.; Zhang, X.; Zhao, Y.; Wang, S. A Novel State-of-Health Prediction and Assessment Strategies for High-Capacity Mining Lithium-Ion Batteries Based on Multi-Indicator. J. Electrochem. Soc. 2024, 171, 050514. [Google Scholar] [CrossRef]
- Xing, L.; Liu, X.; Luo, W.; Wu, L. State of Health Estimation for Lithium-Ion Batteries Using IAO-SVR. World Electr. Veh. J. 2023, 14, 122. [Google Scholar] [CrossRef]
- Beslow, L.; Landore, S.; Park, J.W. Statistical Modeling Procedures for Rapid Battery Pack Characterization. Batteries 2023, 9, 437. [Google Scholar] [CrossRef]
- Zhong, Y.; Yang, X.; Guo, R.; Zhai, L.; Wang, X.; Wu, F.; Wu, C.; Bai, Y. Protecting Lithium Metal Anodes in Solid-State Batteries. Electrochem. Energy Rev. 2024, 7, 30. [Google Scholar] [CrossRef]
- Zhang, C.; Luo, L.; Yang, Z.; Zhao, S.; He, Y.; Wang, X.; Wang, H. Battery SOH Estimation Method Based on Gradual Decreasing Current, Double Correlation Analysis and GRU. Green Energy Intell. Transp. 2023, 2, 100108. [Google Scholar] [CrossRef]
- Luo, L.; Huang, H. Fast Joint SOC-SOH Estimation Method for Energy Storage Batteries Based on Broadband Excitation Detection. J. Energy Storage 2025, 109, 115107. [Google Scholar] [CrossRef]
- Hong, J.; Chen, Y.; Chai, Q.; Lin, Q.; Wang, W. State-of-Health Estimation of Lithium-Ion Batteries Using a Novel Dual-Stage Attention Mechanism Based Recurrent Neural Network. J. Energy Storage 2023, 72, 109297. [Google Scholar] [CrossRef]
- Vennam, G.; Sahoo, A. A Dynamic SOH-Coupled Lithium-Ion Cell Model for State and Parameter Estimation. IEEE Trans. Energy Convers. 2023, 38, 1186–1196. [Google Scholar] [CrossRef]
- Li, X.; Ju, L.; Geng, G.; Jiang, Q. Data-Driven State-of-Health Estimation for Lithium-Ion Battery Based on Aging Features. Energy 2023, 274, 127378. [Google Scholar] [CrossRef]
- Sun, X.; Zhang, Y.; Zhang, Y.; Wang, L.; Wang, K. Summary of Health-State Estimation of Lithium-Ion Batteries Based on Electrochemical Impedance Spectroscopy. Energies 2023, 16, 5682. [Google Scholar] [CrossRef]
- Xu, Z.; Wang, J.; Lund, P.D.; Zhang, Y. Co-Estimating the State of Charge and Health of Lithium Batteries through Combining a Minimalist Electrochemical Model and an Equivalent Circuit Model. Energy 2022, 240, 122815. [Google Scholar] [CrossRef]
- Li, C.; Yang, L.; Li, Q.; Zhang, Q.; Zhou, Z.; Meng, Y.; Zhao, X.; Wang, L.; Zhang, S.; Li, Y.; et al. SOH Estimation Method for Lithium-Ion Batteries Based on an Improved Equivalent Circuit Model via Electrochemical Impedance Spectroscopy. J. Energy Storage 2024, 86, 111167. [Google Scholar] [CrossRef]
- Zhang, L.; Sun, C.; Liu, S. State of Health Prediction of Lithium-Ion Batteries Based on Multi-Kernel Relevance Vector Machine and Error Compensation. World Electr. Veh. J. 2024, 15, 248. [Google Scholar] [CrossRef]
- Zhang, X.; Feng, J.; Cai, F.; Huang, K.; Wang, S. A Novel State of Health Estimation Model for Lithium-Ion Batteries Incorporating Signal Processing and Optimized Machine Learning Methods. Front. Energy 2025, 19, 348–364. [Google Scholar] [CrossRef]
- Hochreiter, S.; Schmidhuber, J. Long Short-Term Memory. Neural Comput. 1997, 9, 1735–1780. [Google Scholar] [CrossRef] [PubMed]
- Hou, Z.; Xu, W.; Jia, G.; Wang, J.; Cai, M. Estimation of SOH of Lithium-Ion Batteries Based on PSO-Bi GRU-Attention Network. J. Electrochem. Soc. 2024, 171, 020550. [Google Scholar] [CrossRef]
- Gou, B.; Xu, Y.; Feng, X. State-of-Health Estimation and Remaining-Useful-Life Prediction for Lithium-Ion Battery Using a Hybrid Data-Driven Method. IEEE Trans. Veh. Technol. 2020, 69, 10854–10867. [Google Scholar] [CrossRef]
- Qu, J.; Liu, F.; Ma, Y.; Fan, J. A Neural-Network-Based Method for RUL Prediction and SOH Monitoring of Lithium-Ion Battery. IEEE Access 2019, 7, 87178–87191. [Google Scholar] [CrossRef]
- Schmitt, J.; Horstkoetter, I.; Baeker, B. Effective Estimation of Battery State-of-Health by Virtual Experiments via Transfer- and Meta-Learning. J. Energy Storage 2023, 63, 106969. [Google Scholar] [CrossRef]
- Zhang, Q.; Wang, D.; Schaltz, E.; Stroe, D.-I.; Gismero, A.; Yang, B. Lithium-Ion Battery Calendar Aging Mechanism Analysis and Impedance-Based State-of-Health Estimation Method. J. Energy Storage 2023, 64, 107029. [Google Scholar] [CrossRef]
- Bharath, Y.K.; Anandu, V.P.; Vinatha, U.; Sudeep, S. Long-Term Estimation of SoH Using Cascaded LSTM-RNN for Lithium Batteries Subjected to Aging and Accelerated Degradation. Energy Storage 2024, 6, e70066. [Google Scholar] [CrossRef]
- Zheng, M.; Luo, X. Joint Estimation of State of Charge (SOC) and State of Health (SOH) for Lithium Ion Batteries Using Support Vector Machine (SVM), Convolutional Neural Network (CNN) and Long Sort Term Memory Network (LSTM) Models. Int. J. Electrochem. Sci. 2024, 19, 100747. [Google Scholar] [CrossRef]
- Bengio, Y.; Simard, P.; Frasconi, P. Learning Long-Term Dependencies with Gradient Descent Is Difficult. IEEE Trans. Neural Netw. 1994, 5, 157–166. [Google Scholar] [CrossRef] [PubMed]
- Van, C.N.; Quang, D.T. Estimation of SoH and Internal Resistances of Lithium Ion Battery Based on LSTM Network. Int. J. Electrochem. Sci. 2023, 18, 100166. [Google Scholar] [CrossRef]
- Lao-atiman, W.; Bumroongsri, P.; Kheawhom, S.; Olaru, S. A Novel State-of-Health Notion and Its Use for Battery Aging Monitoring of Zinc-Air Batteries. Comput. Chem. Eng. 2024, 180, 108465. [Google Scholar] [CrossRef]
- Gao, M.; Bao, Z.; Zhu, C.; Jiang, J.; He, Z.; Dong, Z.; Song, Y. HFCM-LSTM: A Novel Hybrid Framework for State-of-Health Estimation of Lithium-Ion Battery. Energy Rep. 2023, 9, 2577–2590. [Google Scholar] [CrossRef]
- Lin, C.; Wu, L.; Tuo, X.; Liu, C.; Zhang, W.; Huang, Z.; Zhang, G. A Lightweight Two-Stage Physics-Informed Neural Network for SOH Estimation of Lithium-Ion Batteries with Different Chemistries. J. Energy Chem. 2025, 105, 261–279. [Google Scholar] [CrossRef]
- Zhu, R.; Hu, J.; Peng, W. Bayesian Calibrated Physics-Informed Neural Networks for Second-Life Battery SOH Estimation. Reliab. Eng. Syst. Saf. 2025, 264, 111432. [Google Scholar] [CrossRef]
- Zhang, X.; Li, X.; Yang, K.; Wang, Z. Lithium-Ion Battery Modeling and State of Charge Prediction Based on Fractional-Order Calculus. Mathematics 2023, 11, 3401. [Google Scholar] [CrossRef]
- Chakraborty, M.; Maiti, D.; Konar, A.; Janarthanan, R. A Study of the Grunwald-Letnikov Definition for Minimizing the Effects of Random Noise on Fractional Order Differential Equations. In Proceedings of the 2008 4th International Conference on Information and Automation for Sustainability, Colombo, Sri Lanka, 12–14 December 2008; pp. 449–456. [Google Scholar]
- Battery Data | Center for Advanced Life Cycle Engineering. Available online: https://calce.umd.edu/battery-data (accessed on 20 July 2025).
- Zhu, J.; Wang, Y.; Huang, Y.; Bhushan Gopaluni, R.; Cao, Y.; Heere, M.; Mühlbauer, M.J.; Mereacre, L.; Dai, H.; Liu, X.; et al. Data-Driven Capacity Estimation of Commercial Lithium-Ion Batteries from Voltage Relaxation. Nat. Commun. 2022, 13, 2261. [Google Scholar] [CrossRef]
- Wei, Z.; Sun, X.; Li, Y.; Liu, W.; Liu, C.; Lu, H. A Joint Estimation Method for the SOC and SOH of Lithium-Ion Batteries Based on AR-ECM and Data-Driven Model Fusion. Electronics 2025, 14, 1290. [Google Scholar] [CrossRef]
- Li, X.; Yu, H.; Wang, J.; Xia, Y.; Zheng, H.; Song, H. Prediction of State-of-Health of Lithium-Ion Battery Based on CEEMDAN-SG-LSTM Combined Model. Mater. Today Sustain. 2024, 28, 100999. [Google Scholar] [CrossRef]
Disclaimer/Publisher’s Note: The statements, opinions and data contained in all publications are solely those of the individual author(s) and contributor(s) and not of MDPI and/or the editor(s). MDPI and/or the editor(s) disclaim responsibility for any injury to people or property resulting from any ideas, methods, instructions or products referred to in the content. |
© 2025 by the authors. Licensee MDPI, Basel, Switzerland. This article is an open access article distributed under the terms and conditions of the Creative Commons Attribution (CC BY) license (https://creativecommons.org/licenses/by/4.0/).