Article

Experimental Study and Rheological Modeling of Water-Based and Oil-Based Drilling Fluids Under Extreme Temperature–Pressure Condition

1
China Electronic Product Reliability and Environmental Testing Research Institute, Ministry of Industry and Information Technology Key Laboratory of Industrial Software Engineering Application Technology, Guangzhou 511370, China
2
Chongqing Instrument Factory of Manufacturing Company of China National Petroleum Logging Co., Ltd., Chongqing 400021, China
3
State Key Lab of Oil and Gas Reservoir Geology and Exploitation, Southwest Petroleum University, Chengdu 610500, China
*
Author to whom correspondence should be addressed.
Energies 2025, 18(17), 4687; https://doi.org/10.3390/en18174687
Submission received: 3 July 2025 / Revised: 22 August 2025 / Accepted: 28 August 2025 / Published: 3 September 2025
(This article belongs to the Section B: Energy and Environment)

Abstract

With the growing demand for energy, oil and gas exploration and development are progressively moving into deep and ultra-deep formations, where extreme temperatures and pressures create complex challenges for drilling operations. While drilling fluids are critical for controlling bottom-hole pressure, cooling drill bits, and removing cuttings, accurately characterizing their rheological behavior under high-temperature and high-pressure (HTHP) conditions remains a key focus, as existing research has limitations in model applicability and parameter prediction range under extreme downhole environments. To address this, the study aims to determine the optimal rheological model and establish a reliable mathematical prediction model for drilling fluid rheological parameters under HTHP conditions, enhancing the precision of downhole temperature and pressure calculations. Rheological experiments were conducted on eight field-collected samples (4 water-based and four oil-based drilling fluids) using a Chandler 7600 HTHP rheometer, with test conditions up to 247 °C and 140 MPa; nonlinear fitting via a hybrid Levenberg–Marquardt and Universal Global Optimization algorithm and multivariate regression were employed for model development. Results showed that oil-based and water-based drilling fluids exhibited distinct rheological responses to temperature and pressure, with the Herschel–Bulkley model achieving superior fitting accuracy (coefficient of determination > 0.999). The derived prediction model for Herschel–Bulkley parameters, accounting for temperature-pressure coupling, demonstrated high accuracy (R2 > 0.95) in validation. This research provides an optimized rheological modeling approach and a robust prediction tool for HTHP drilling fluids, supporting safer and more efficient deep and ultra-deep drilling operations.

1. Introduction

With the growing demand for energy, the exploration and development of oil and gas are progressively moving into deep and ultra-deep territories [1,2]. This endeavor primarily encounters challenges posed by extreme temperatures and pressures, as well as complex geological conditions. As the vertical depth of drilling increases by 100 m, the formation temperature and pressure continue to rise. For example, China is currently drilling two 10,000 m-deep wells: the Shendi Tacan-1 well, with a designed depth of 11,100 m, is expected to reach a bottom-hole temperature of 213 °C and a formation pressure of 133 MPa [3]. Similarly, the Shendi Chuanke-1 well, designed to a depth of 10,520 m, is predicted to have a bottom-hole temperature of 224 °C and a pressure of 138 MPa [4]. Additionally, the central and northern Gulf of Mexico basin in the United States is a region of strong overpressure, where reservoir pressures can reach 50–210 MPa, with some areas having oil and gas reservoir temperatures as high as 230 °C [5]. At present, there is no consistent definition for deep and ultra-deep layers. Previous studies have mainly classified them based on formation age, geological characteristics [6], and burial depth [7]. According to the classification scheme proposed by Pang et al. [7], formations can be divided into shallow layers (<2.0 km), intermediate layers (2.0–4.5 km), deep layers (4.5–6.0 km), and ultra-deep layers (>6.0 km).
Both onshore and offshore oil and gas drilling rely on specialized drilling fluids to control bottom-hole pressure, cool/lubricate/clean the drill bit, and remove cuttings [8,9,10]. While rheological effects are often ignored in shallow wells due to minimal temperature/pressure variations, neglecting them in high-temperature, high-pressure (HTHP) wells causes significant issues. Pre-drilling testing of fluid rheology under HTHP conditions is therefore essential for parameter assessment. Complementing experiments, computational fluid dynamics (CFD) methods offer efficient analysis of extreme-environment fluid dynamics with reduced time and costs. CFD effectively simulates complex flow behaviors in extreme conditions—making it valuable for modeling HTHP drilling fluid flow and rheological responses. Critical to CFD reliability is rigorous experimental validation, especially for HTHP fluids with temperature/pressure-induced nonlinear behaviors [11]. Since direct field testing is often unfeasible, a synergistic approach is needed: experimental data (e.g., this study’s empirical correlations) validate CFD models, while verified simulations extend experimental predictive range. Accurate HTHP fluid property prediction thus requires integrating experiments, validated CFD, and theoretical/empirical models.
Accurately describing the rheological behavior of fluids requires three conditions: (1) rheological parameters must reflect the rheological characteristics of the drilling fluid; (2) there should be a wide range of temperature, pressure, and shear rates; and (3) it must facilitate hydraulic calculations [10]. To determine the optimal rheological model for drilling fluids, it is essential to select the model based on rheological experiments [12]. Currently, various rheological models have been developed, yet in practical drilling operations, shear-thinning and yield stress models, such as the Bingham and Herschel–Bulkley models, remain commonly used in the oilfield [13,14].
Drilling fluid is often considered the lifeblood of the petroleum industry, and numerous scholars have dedicated their research to the rheological properties of drilling fluids. Many studies have been conducted on the high-temperature high-pressure behavior of drilling fluids. Numerous previous experiments have shown that as temperature increases, the apparent viscosity of drilling fluids decreases; however, the opposite effect is observed with increasing pressure, especially in oil-based drilling fluids [15,16,17,18,19]. For instance, Bailey et al. studied the relationship between viscosity and temperature-pressure conditions using a high-temperature, high-pressure rheometer. They observed that below 100 °C, the rate of change in drilling fluid viscosity is significantly higher than that above 100 °C, while the effect of pressure on viscosity is relatively minor [15]. In addition, numerous researchers have conducted studies on the rheological parameter models of high-temperature, high-pressure drilling fluids, employing polynomial approaches for predictive analysis. For instance, Alderman et al. carried out high-temperature, high-pressure rheological experiments with a maximum temperature of 130 °C, a maximum pressure of 100 MPa, and shear rates ranging from 0 to 1200 s−1. They proposed a model for the relationship between high shear viscosity and temperature-pressure conditions for the drilling fluid, as shown in Equation (1) [20]:
η ( P , T ) = A η 1 + α ϕ β P P exp E a + P B T C T
where P is drilling fluid’s Pressure, T is drilling fluid’s Temperature, Ea is activation energies in eqns. A(P,T) is the pre-exponential factor, =η(Tr)exp(Ea/Tr), and Tr is a reference temperature; α is a packing factor; β(P) the isothermal compressibility of the mud; B, C are constants which characterize ln η P T for the continuous phase.
Jiang et al. performed rheological experiments on various water-based drilling fluids using a Fann 50C rotational viscometer at a maximum temperature of 150 °C. They proposed a mathematical model to describe the variation in rheological parameters of water-based drilling fluids with respect to changes in temperature and pressure, as shown in Equation (2) [21]:
f T = f T 0 exp a T + b f P = f P 0 exp c P + d
where fT, fP are the apparent viscosity and plastic viscosity of the drilling fluid under temperature T and pressure P, respectively, mPa·s. a, b, c and d are temperature parameters.
Rommetveit et al. [22], based on experimental results, studied the rheology of high-temperature, high-pressure mud systems and analyzed the effects of temperature and pressure on the rheological properties of drilling fluids. They found that oil-based drilling fluids are more significantly affected by pressure compared to water-based drilling fluids. Furthermore, they proposed calculation formulas for the variation in rheological parameters with temperature and pressure, as shown in Equation (3).
f ( P , T , γ ) = e g 1 ( P , T ) γ + e g 2 ( P , T )
where f(P,T,γ) is the apparent viscosity and plastic viscosity of the drilling fluid under conditions of temperature T and pressure P, mPa·s.; g1(P,T) and g2(P,T) are the sum of linear, bilinear, and quadratic terms of pressure P and temperature T, along with a constant term, mPa·s.
Recently, Quitian-Ardila et al. conducted rheological experiments on water-based drilling fluids (WBDF) and fitted the rheological parameters using a power law model based on experimental data. However, the temperature and pressure ranges in their experiments were relatively narrow, resulting in insufficient data to support the rheological behavior of drilling fluids at higher temperatures and pressures. Additionally, the power law model is rarely applied in field operations [23].
Currently, there is a limited amount of research on models describing the variation in rheological parameters of drilling fluids under high-temperature and high-pressure conditions. Most previous studies have focused on parameters such as apparent viscosity and plastic viscosity. However, accurately predicting the behavior of drilling fluids in ultra-deep wells is crucial for precise calculations of temperature and pressure distributions during drilling. Therefore, it is essential to conduct rheological tests on various drilling fluids in the field, analyze the resulting data, and derive empirical formulas for the variation in rheological parameters with temperature and pressure under high-temperature and high-pressure conditions.

2. Experimental Analysis and Procedures

2.1. Equipment

The rheological tests on drilling fluids were conducted using the CHANDLER Model 7600 XHPHT Rheometer at the National Key Laboratory of Oil and Gas Reservoir Geology and Development Engineering, Southwest Petroleum University, Chengdu, China, as shown in Figure 1. This device is a concentric cylinder rheometer that generates shear flow through rotational motion, allowing for the rapid determination of the material’s viscoelastic properties. It features a PC-based data acquisition and control system that automatically regulates the sample’s temperature and pressure via a PID controller and supports data output compatible with Microsoft Excel®. This advanced equipment is currently the only high-temperature rheometer in the oil and gas industry capable of testing rheological properties at pressures up to 276 MPa. The maximum testing temperature and pressure are 316 °C and 276 MPa, respectively, with a shear stress range of 0.51 to 153.3 Pa and a shear stress accuracy of 0.025 Pa.

2.2. Materials

The drilling fluid samples used in this study were collected directly from the field, including four types of water-based drilling fluids and four types of oil-based drilling fluids. The densities of the water-based drilling fluids were 1.54 g/cm3, 1.70 g/cm3, 1.82 g/cm3, and 2.15 g/cm3, while the densities of the oil-based drilling fluids were 1.00 g/cm3, 1.57 g/cm3, 2.08 g/cm3, and 2.25 g/cm3. (The density is measured under normal temperature and pressure.)

2.3. Experimental Design

Rheological experiments were conducted on eight groups of drilling fluids under high-temperature and high-pressure conditions (Tmax = 247 °C, Pmax = 140 MPa). In contrast to previous studies, this experiment utilized drilling fluids collected directly from the field, which were subjected to a temperature of 247 °C and a pressure of 140 MPa. This work establishes a foundation for predicting the rheological parameters of drilling fluids under high-temperature and high-pressure conditions.
Based on experimental data, the rheological parameters of various drilling fluid systems were analyzed concerning their variations with temperature and pressure. Mathematical methods were employed to fit empirical formulas that describe the relationship between rheological parameters and temperature/pressure conditions. To prevent improper testing that may affect equipment performance and accuracy, experimental protocols were designed based on the thermal stability of the drilling fluids, as detailed in Table 1. The maximum testing temperature was set at 247 °C, and the maximum pressure was set at 140 MPa. Additionally, to minimize errors caused by human intervention during the experiments, each rotational speed was maintained for 2 min after stabilizing temperature and pressure conditions, and the last 30 s of data were recorded to calculate the average value for shear stress.

2.4. Experimental Process

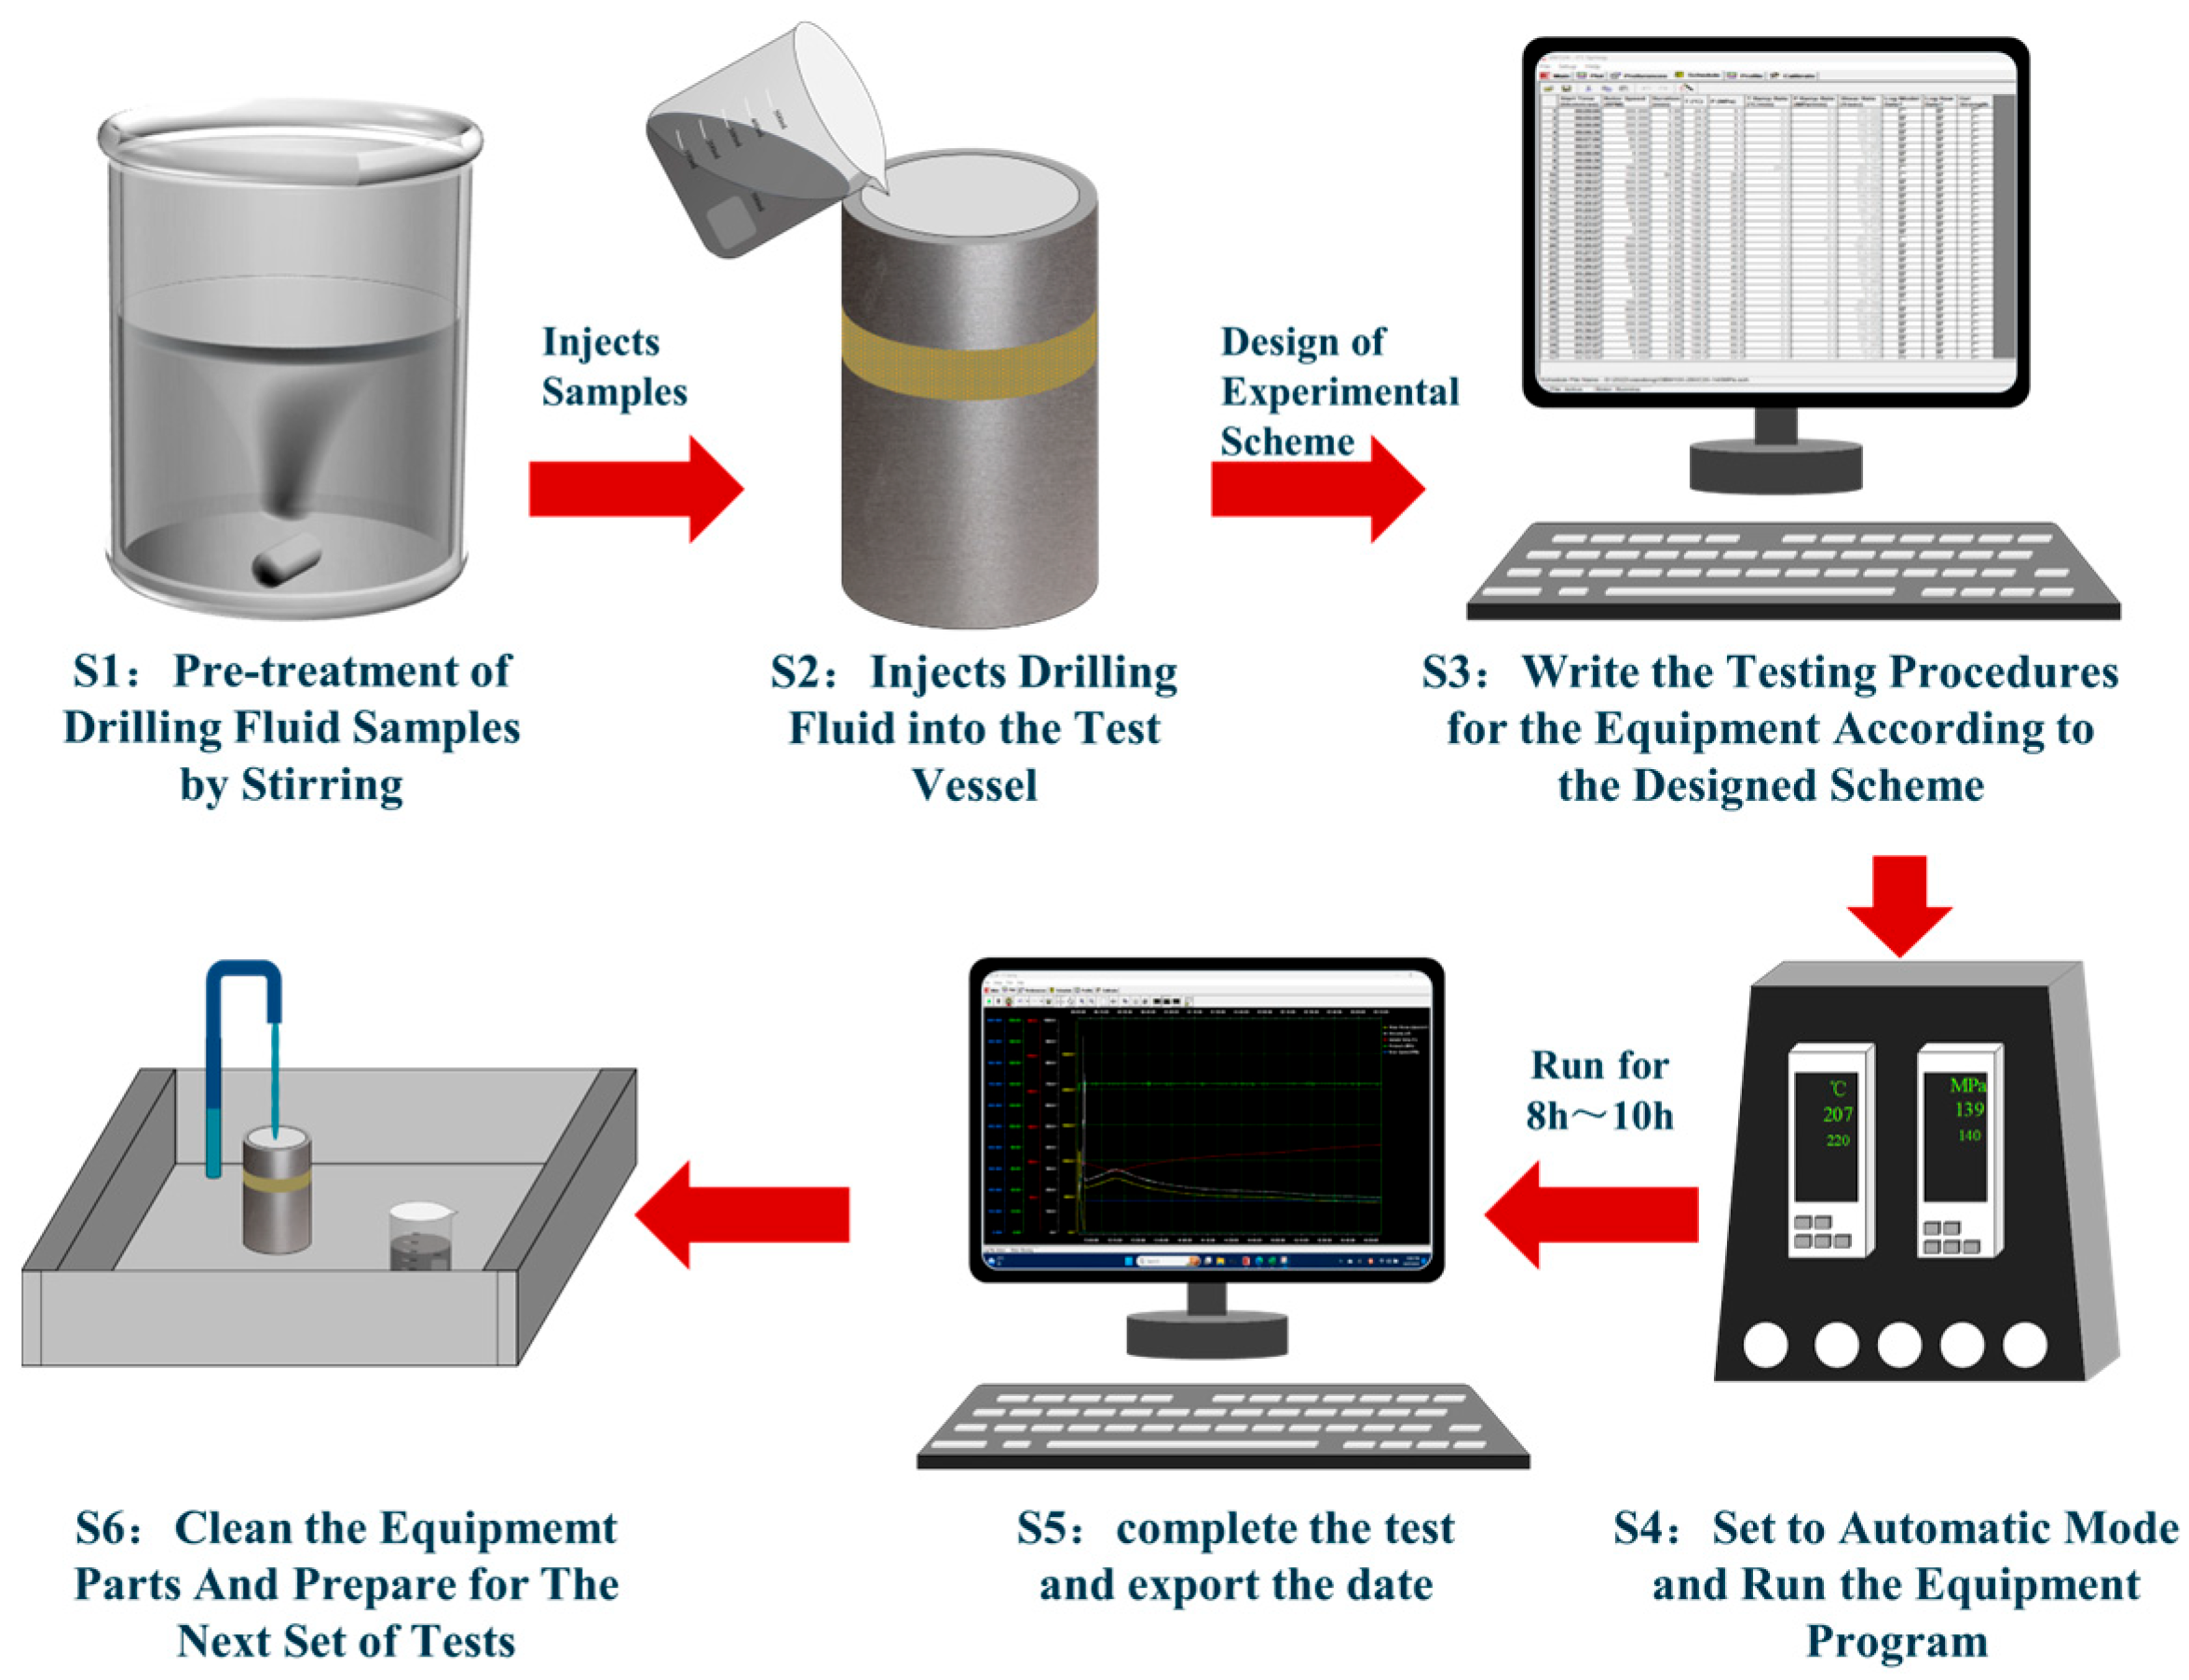
The experimental procedures for evaluating the rheological properties of high-temperature, high-pressure drilling fluids conducted in this study are detailed as follows:
(1) Preparation: First, thoroughly mix approximately 200 mL of the drilling fluid sample and transfer it to the test vessel. Ensure that the rotor can rotate freely, then install the sealing ring and counterweight, applying high-temperature lubricant to the threads of the test vessel. Carefully connect the test vessel to the counterweight section, tighten the threads, and place the entire assembly into the high-temperature, high-pressure rotational viscometer, securing it properly. Finally, connect the pressure pipeline and measurement fittings.
(2) Experiment Execution: Following the pre-established experimental protocol, input the necessary parameters into the equipment’s corresponding program and initiate the process by clicking “Start”. Set the equipment to “Automatic Mode”. The drilling fluid will then be heated and pressurized, and shear stress data will be recorded at eight rotational speeds (600, 300, 200, 100, 60, 30, 6, and 3 r/min) under the specified temperature and pressure conditions.
(3) Data Handling: Save and export the collected data.
(4) Post-Experiment: Clean the equipment and analyze the experimental results. The experimental procedure is illustrated in Figure 2.

3. Results and Discussion

First, a comprehensive analysis of the flow behavior of drilling fluids under high temperature and high pressure conditions is presented. Subsequently, a method is proposed to evaluate the simultaneous effects of pressure, temperature, and shear rate on non-Newtonian behavior based on these findings.

3.1. High-Pressure High-Temperature Behavior

3.1.1. Oil-Base Drilling Fluid

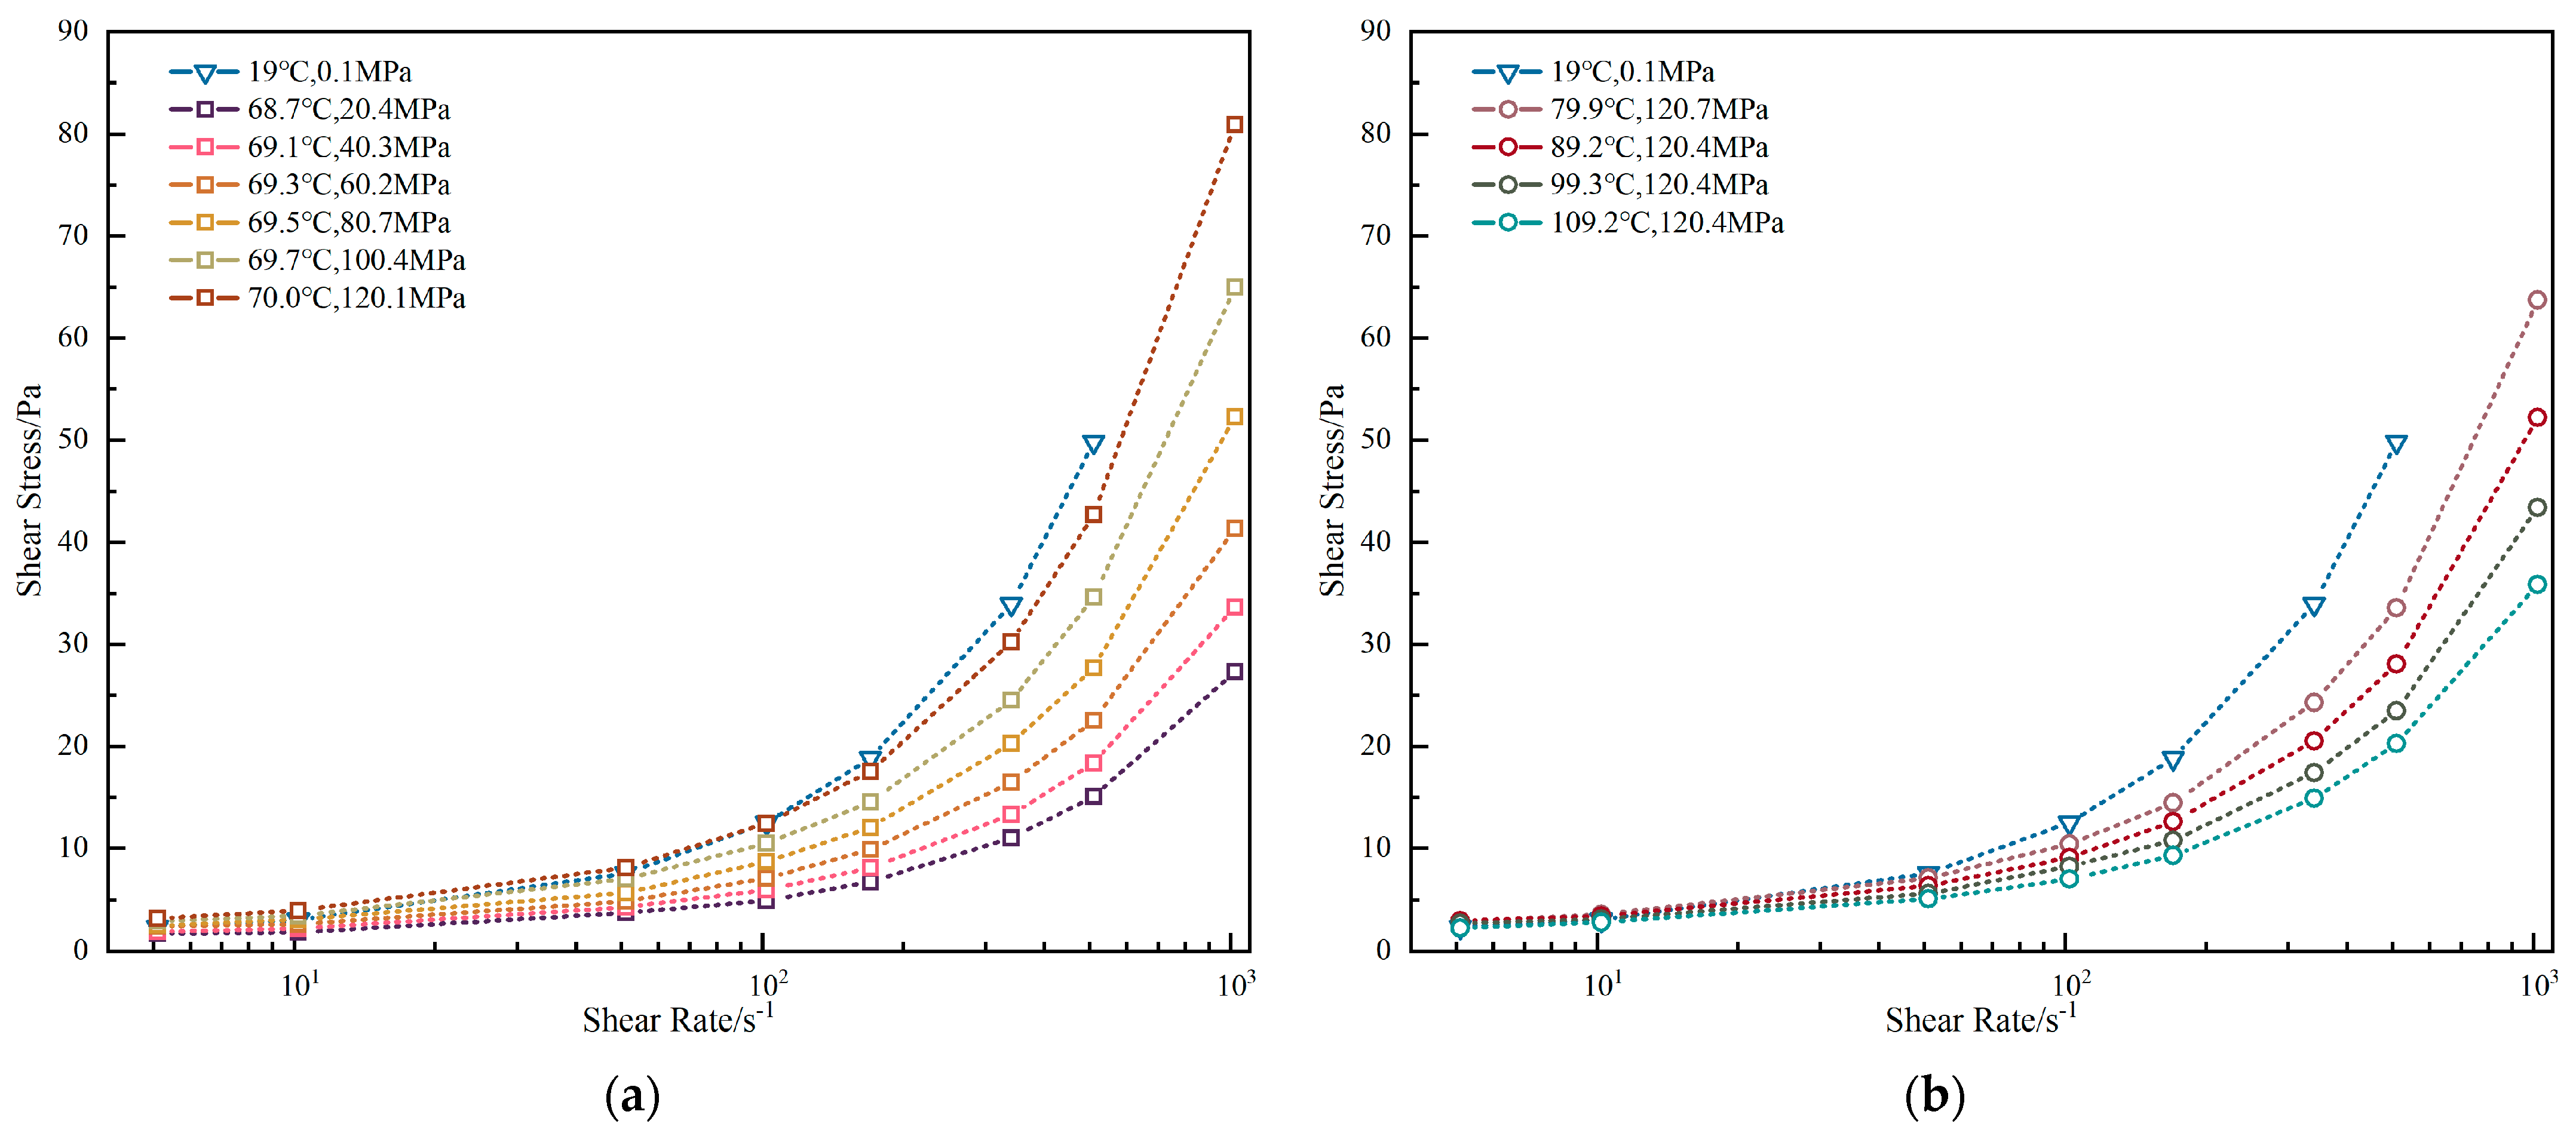
As depicted in Figure 3, with respect to oil-based drilling fluid no. 1, under specific temperature and pressure conditions, in general, the shear stress exhibits an increasing trend as the shear rate increases.
In Figure 3a, when temperature is held constant and pressure is elevated, the shear stress increases correspondingly at identical shear rates. In Figure 3b, when pressure is maintained constant and temperature is increased, the shear stress decreases accordingly at the same shear rate. Notably, the influence of temperature and pressure on shear stress becomes less pronounced at lower shear rates. For instance, at an experimental temperature of ~70 °C and shear rate of 1021.38 s−1, increasing pressure from 20 MPa to ~120 MPa caused shear stress to rise from 27.30 Pa to 80.94 Pa (196.44% increase). Similarly, under ~140 MPa pressure at 1021.38 s−1 shear rate, increasing temperature from ~70 °C to ~180 °C reduced shear stress from 80.94 Pa to 35.84 Pa (55.72% decrease).
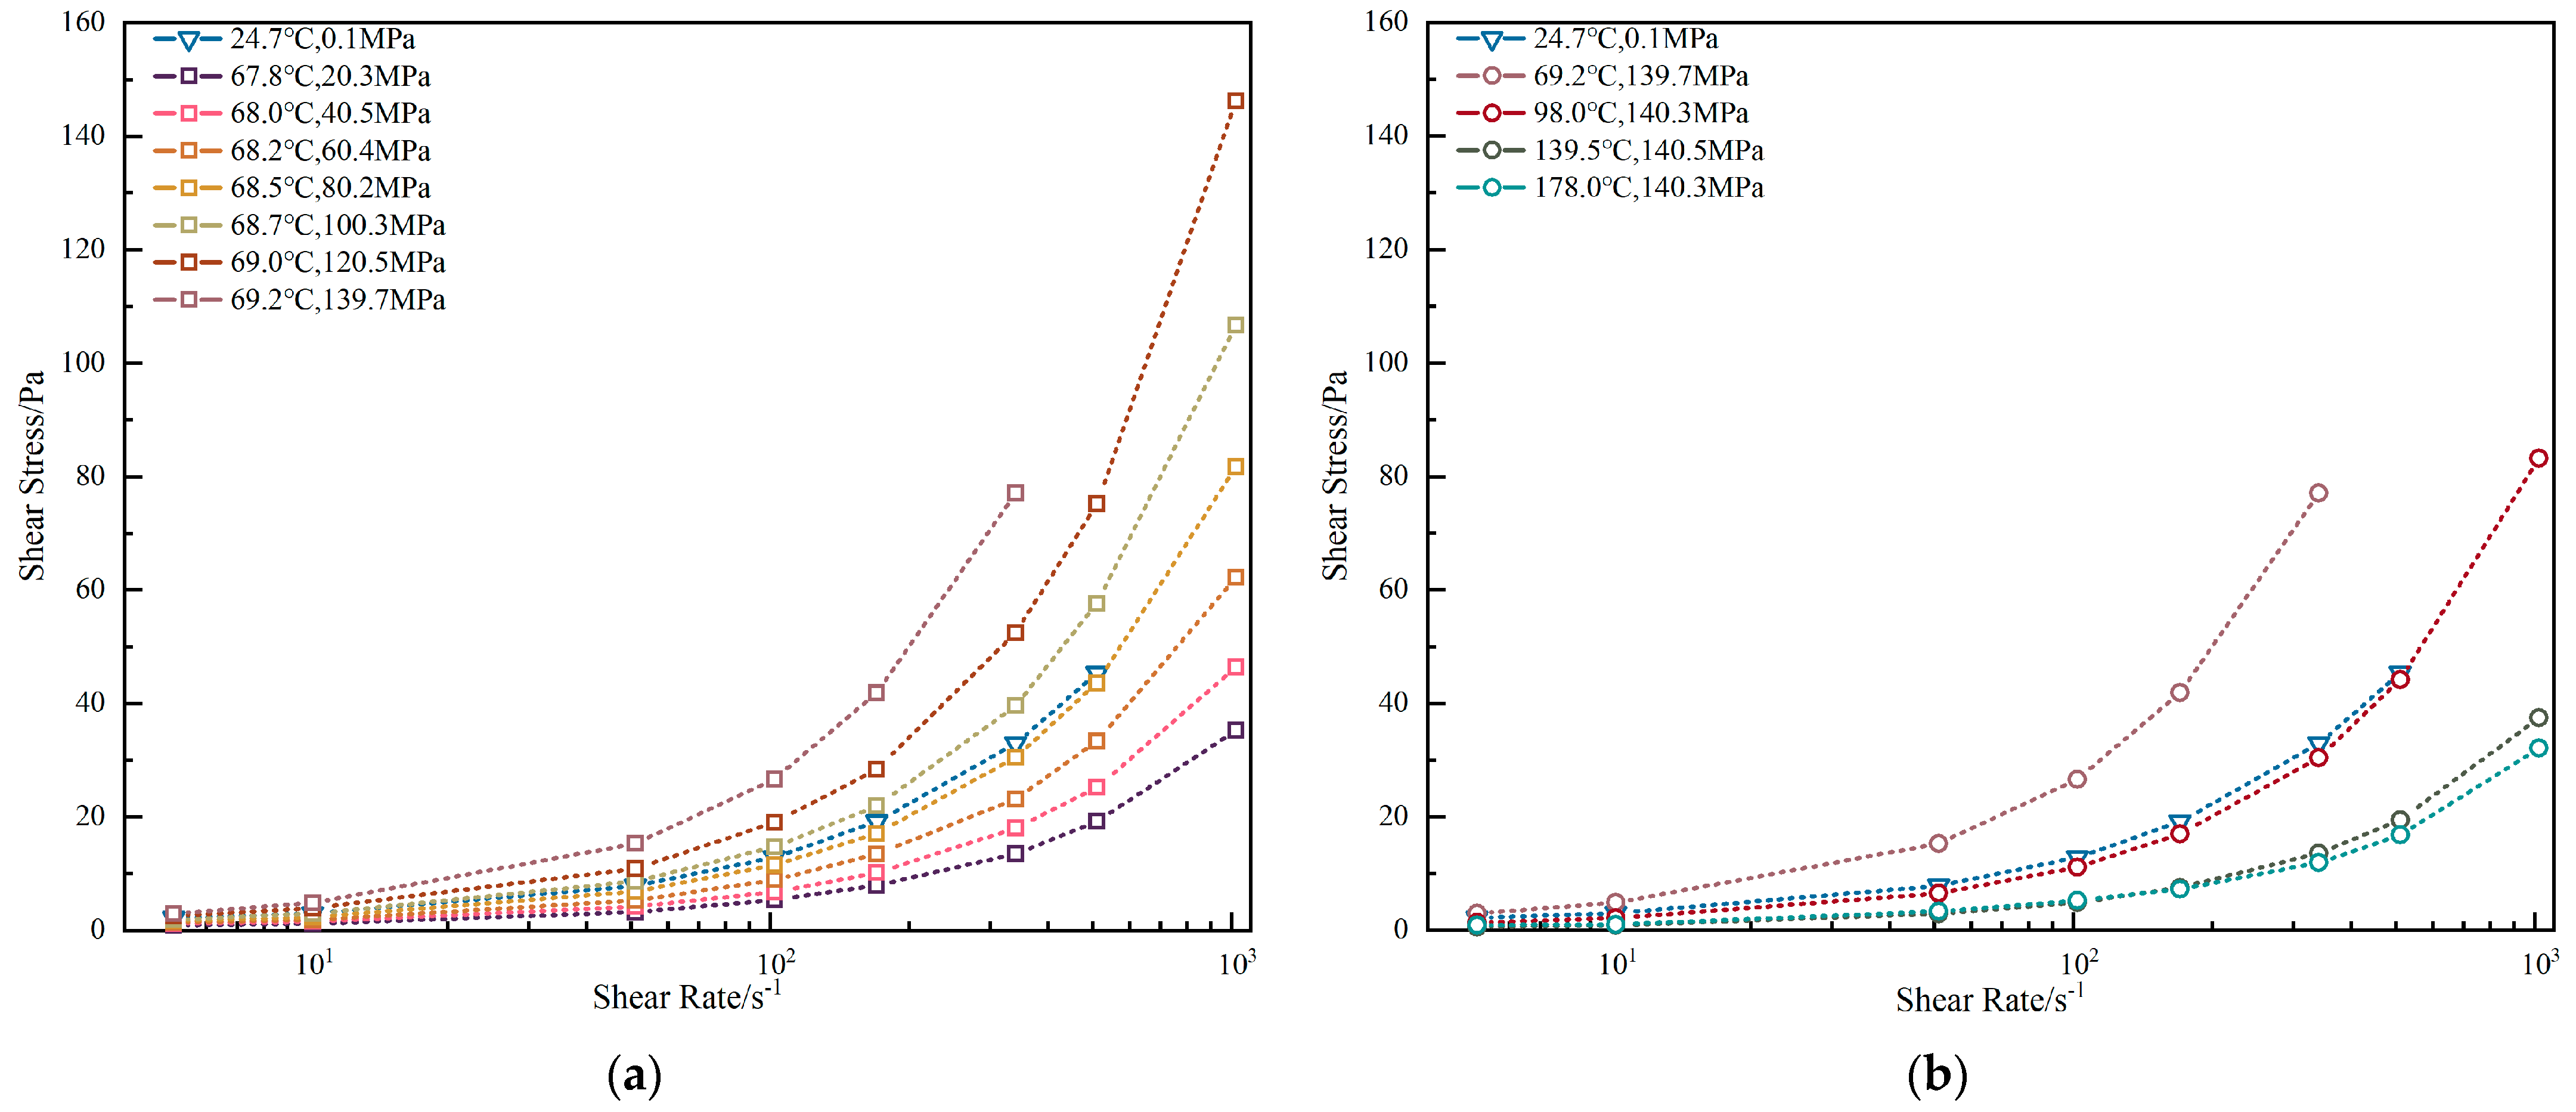
As illustrated in Figure 4, for oil-based drilling fluid no. 2, on the whole, its variation law is consistent with that of oil-based drilling fluid no. 1.
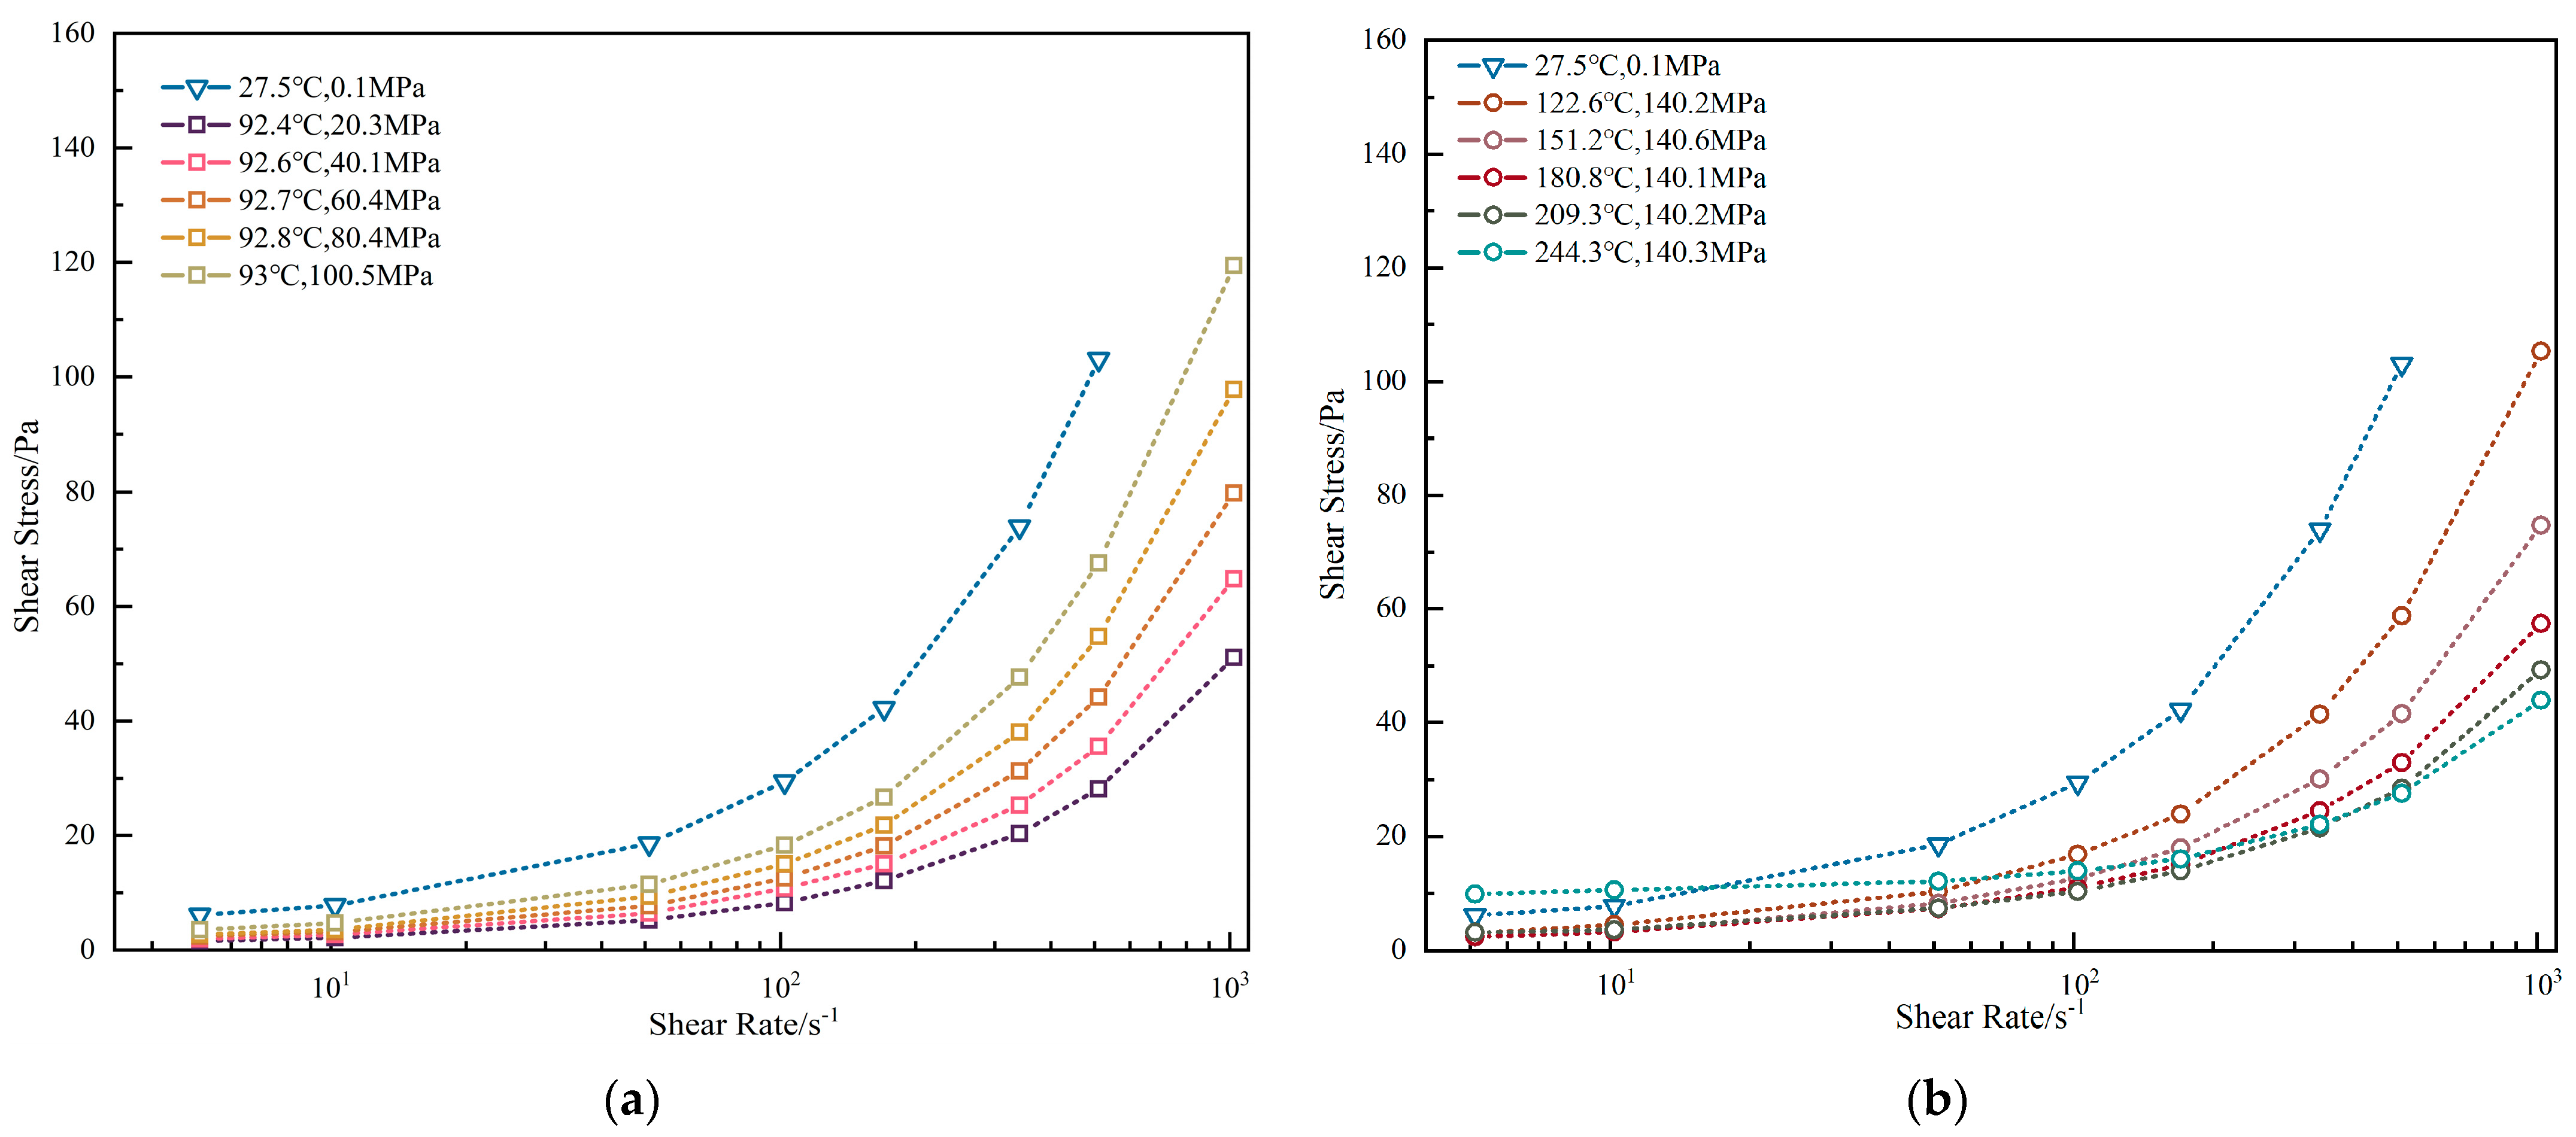
As depicted in Figure 5, oil-based drilling fluid no. 3 adheres to the rheological principle wherein shear stress generally increases with ascending shear rates under specific temperature and pressure conditions. Quantitatively, at approximately 92 °C and a shear rate of 1020.38 s−1, elevating the pressure P from ~20 MPa to ~100 MPa induced a shear stress escalation from 51.10 Pa to 119.41 Pa, representing a 134% increase. Conversely, under ~140 MPa pressure at a shear rate of 1021.38 s−1, raising the temperature from ~120 °C to ~240 °C caused shear stress to decline from 105.36 Pa to 43.91 Pa, equivalent to a 58.3% reduction.
Notably, Figure 5a reveals an anomalous rheological response at 140 MPa: the rheological curve under this pressure lies below the 100 MPa curve. This indicates that elevated pressure reduces shear stress at identical shear rates—a phenomenon diverging from prior reports and hypothesized to originate from compositional factors. Critically, this behavior does not reflect fluid degradation but rather suggests intrinsic material-specific attributes of the drilling fluid formulation.
Figure 5b further delineates the temperature-dependent attenuation of shear stress. At ~70 °C and ~140 MPa, the shear stress value at 1021.38 s−1 exceeded the instrument’s maximum measurable threshold (153.3 Pa), resulting in data unavailability. These findings yield two critical considerations for high-temperature/high-pressure (HTHP) well drilling:
  • Validation of the drilling fluid’s pressure-sensitive rheological properties.
  • Identification of pressure-induced curve anomalies during bottomhole pressure modeling.
This forward-looking analysis significantly enhances the accuracy of bottomhole pressure predictions and operational control capabilities.
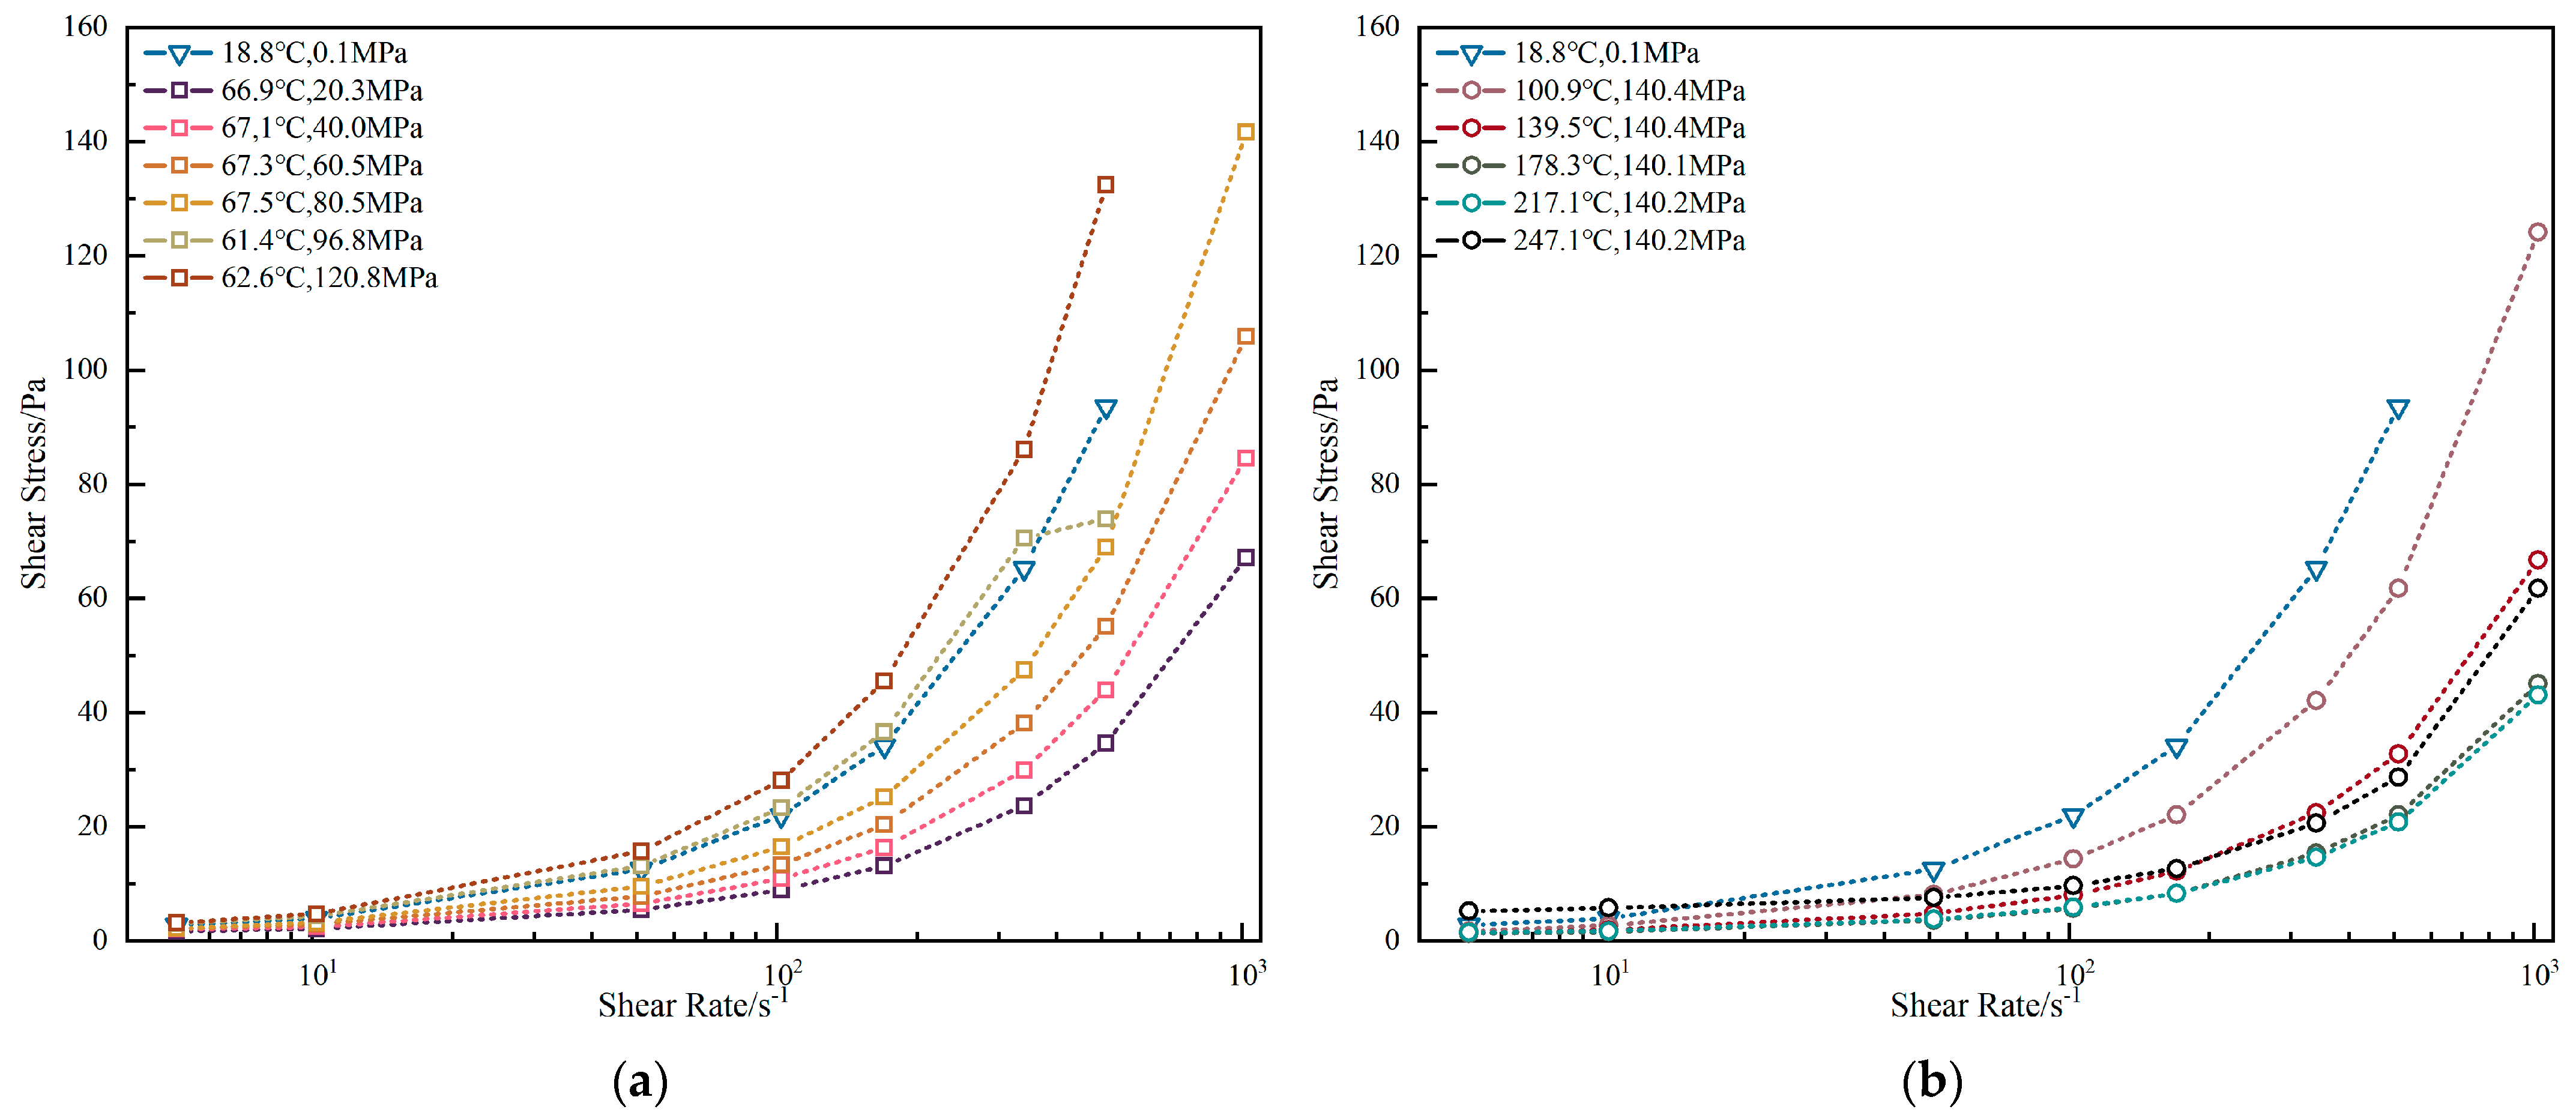
As shown in Figure 6, for oil-based drilling fluid no. 4, generally speaking, it still adheres to the principle that under specific temperature and pressure conditions, the shear stress increases with the increase in the shear rate. However, as presented in Figure 6a, it is clear that under the three conditions of 62.6 °C, 120.8 MPa; 61.4 °C, 96.8 MPa; and 18.8 °C, 0.1 MPa, the shear stress of the drilling fluid at a shear rate of 1021.38 s−1 is absent. This is because the shear stress of the drilling fluid under these conditions exceeds the measurement range of the equipment, which is 153.3 Pa. Evidently, under high-pressure conditions, the change in the shear stress of this drilling fluid is extremely remarkable, and the drilling fluid is also highly viscous at room temperature. As shown in Figure 6b, with the increase in temperature, the shear stress at the same shear rate continuously decreases.

3.1.2. Water-Base Drilling Fluid

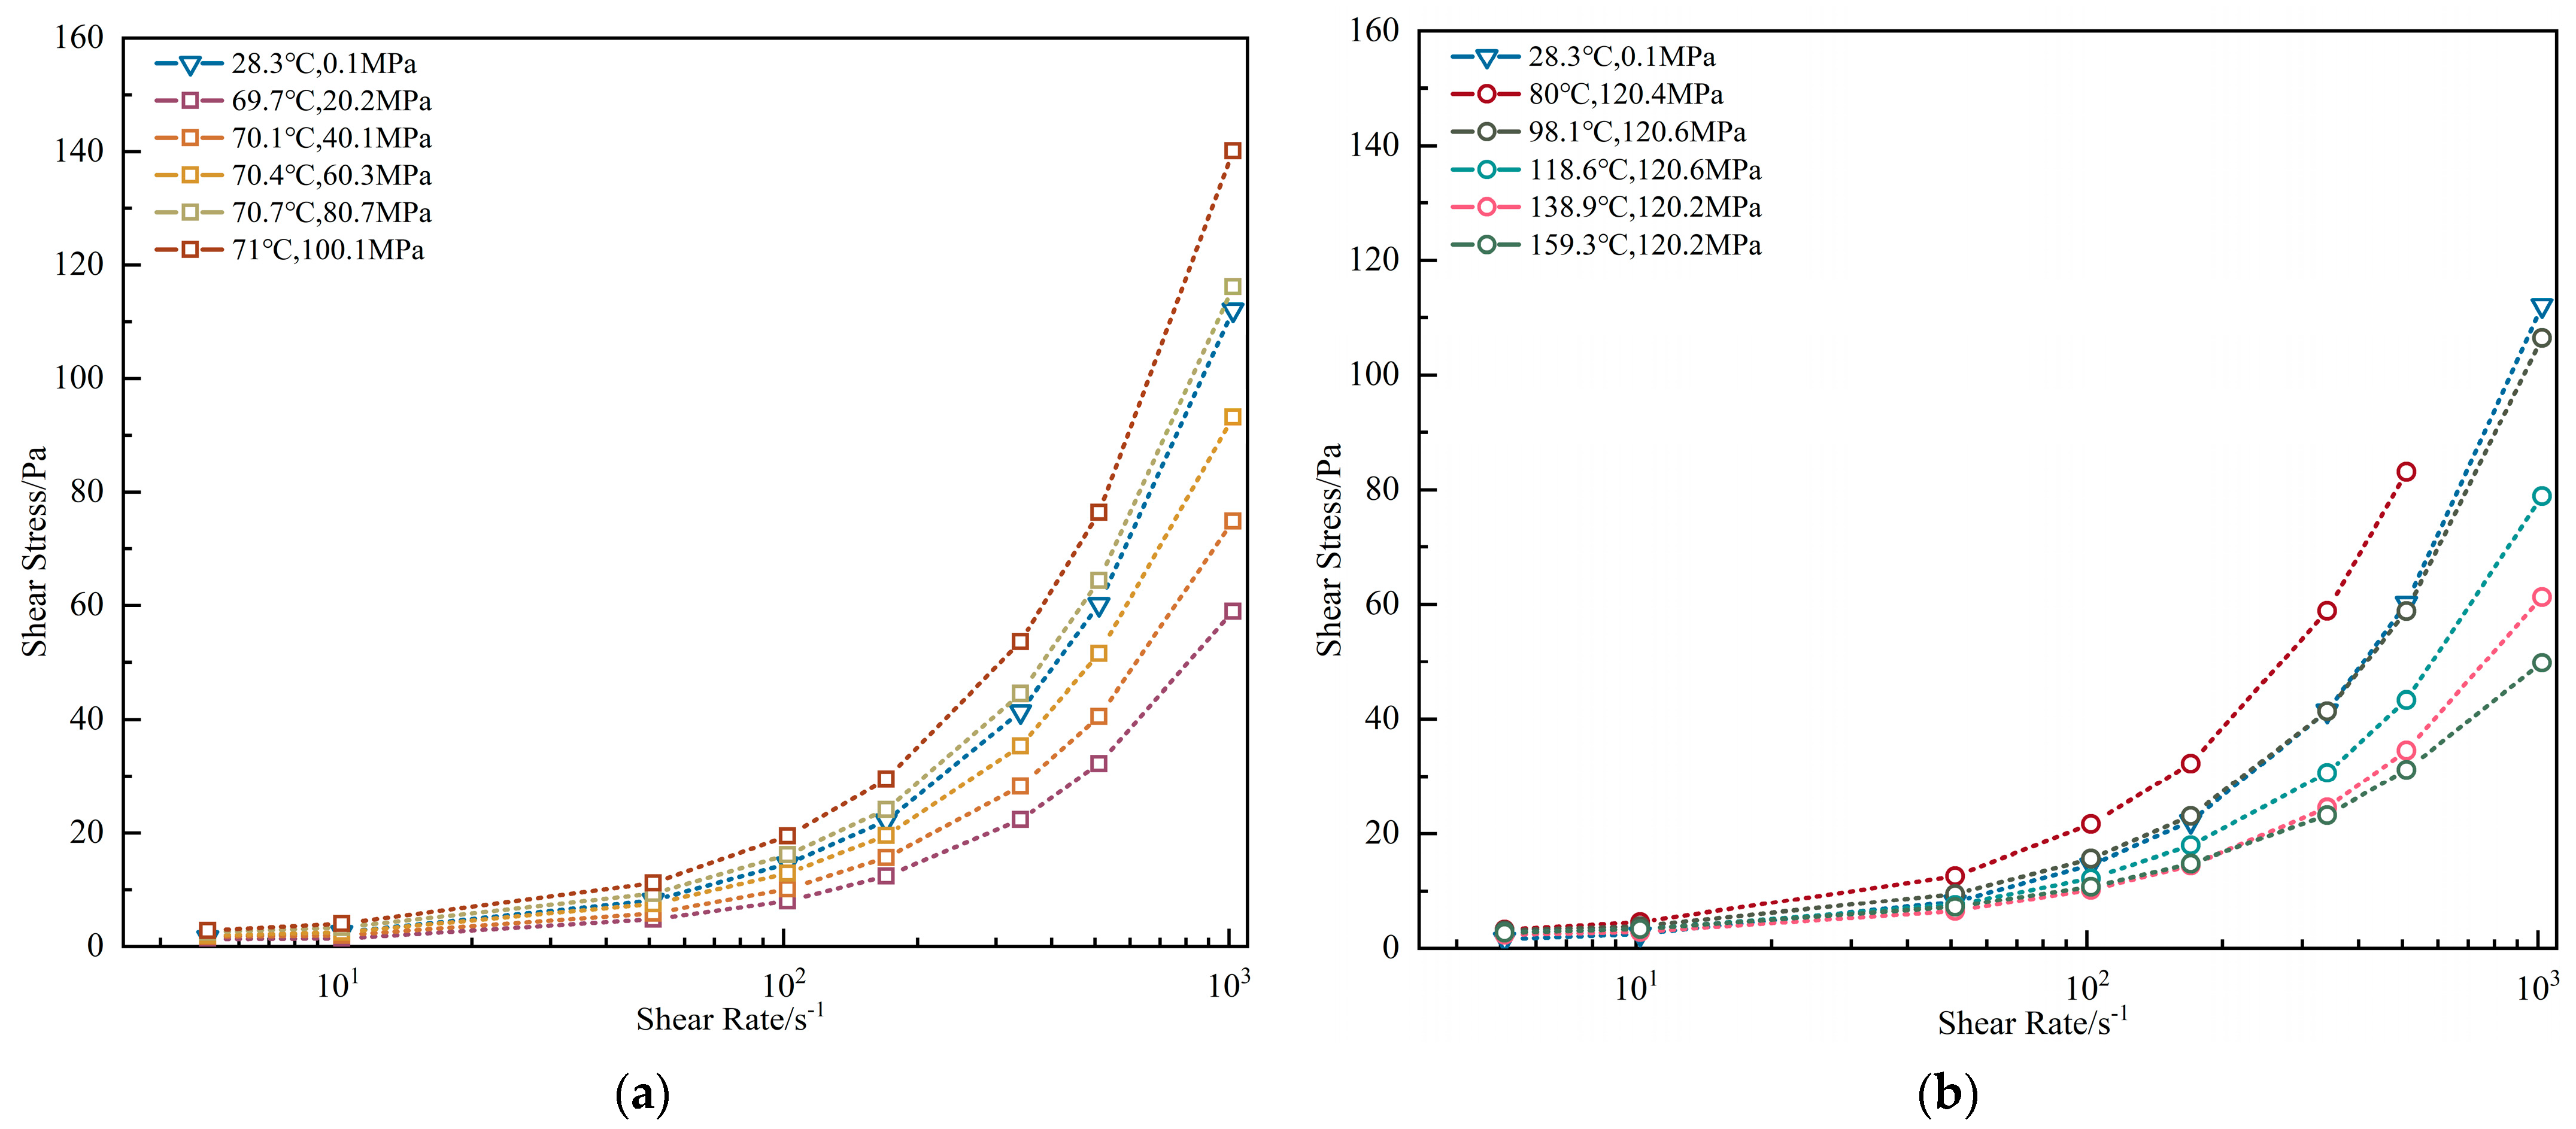
As shown in Figure 7, for water-based drilling fluid no. 1, generally, it still follows the rule that under specific temperature and pressure conditions, the shear stress increases as the shear rate increases. As shown in Figure 7b, with the increase in temperature, the shear stress at the same shear rate is continuously decreasing. Specifically, at approximately 70 °C and a shear rate of 1020.38 s−1, the shear stress increases from 58.98 Pa to 140.12 Pa as the pressure rises from approximately 40 MPa to 100 MPa, representing an increase rate of 137.61%. Conversely, at approximately 120 MPa and a shear rate of 510.69 s−1, the shear stress decreases from 83.12 Pa to 31.15 Pa as the temperature increases from approximately 80 °C to 160 °C, corresponding to a decrease of 62.52%.
However, it is obvious that the same situation also occurs in this drilling fluid. That is, under high-pressure (120.2 MPa) and low-temperature (80 °C) conditions, the shear stress is still greater than 153.3 Pa.
As shown in Figure 8, for water-based drilling fluid no. 2, overall, it still adheres to the principle that under specific temperature and pressure conditions, the shear stress increases with the increase in the shear rate. As presented in Figure 8b, with the rise in temperature, the shear stress at the same shear rate is continuously decreasing. However, it is evident that this drilling fluid also exhibits the same phenomenon, namely, under high-pressure (120.2 MPa) and low-temperature (80 °C) conditions, the shear stress still exceeds 153.3 Pa.
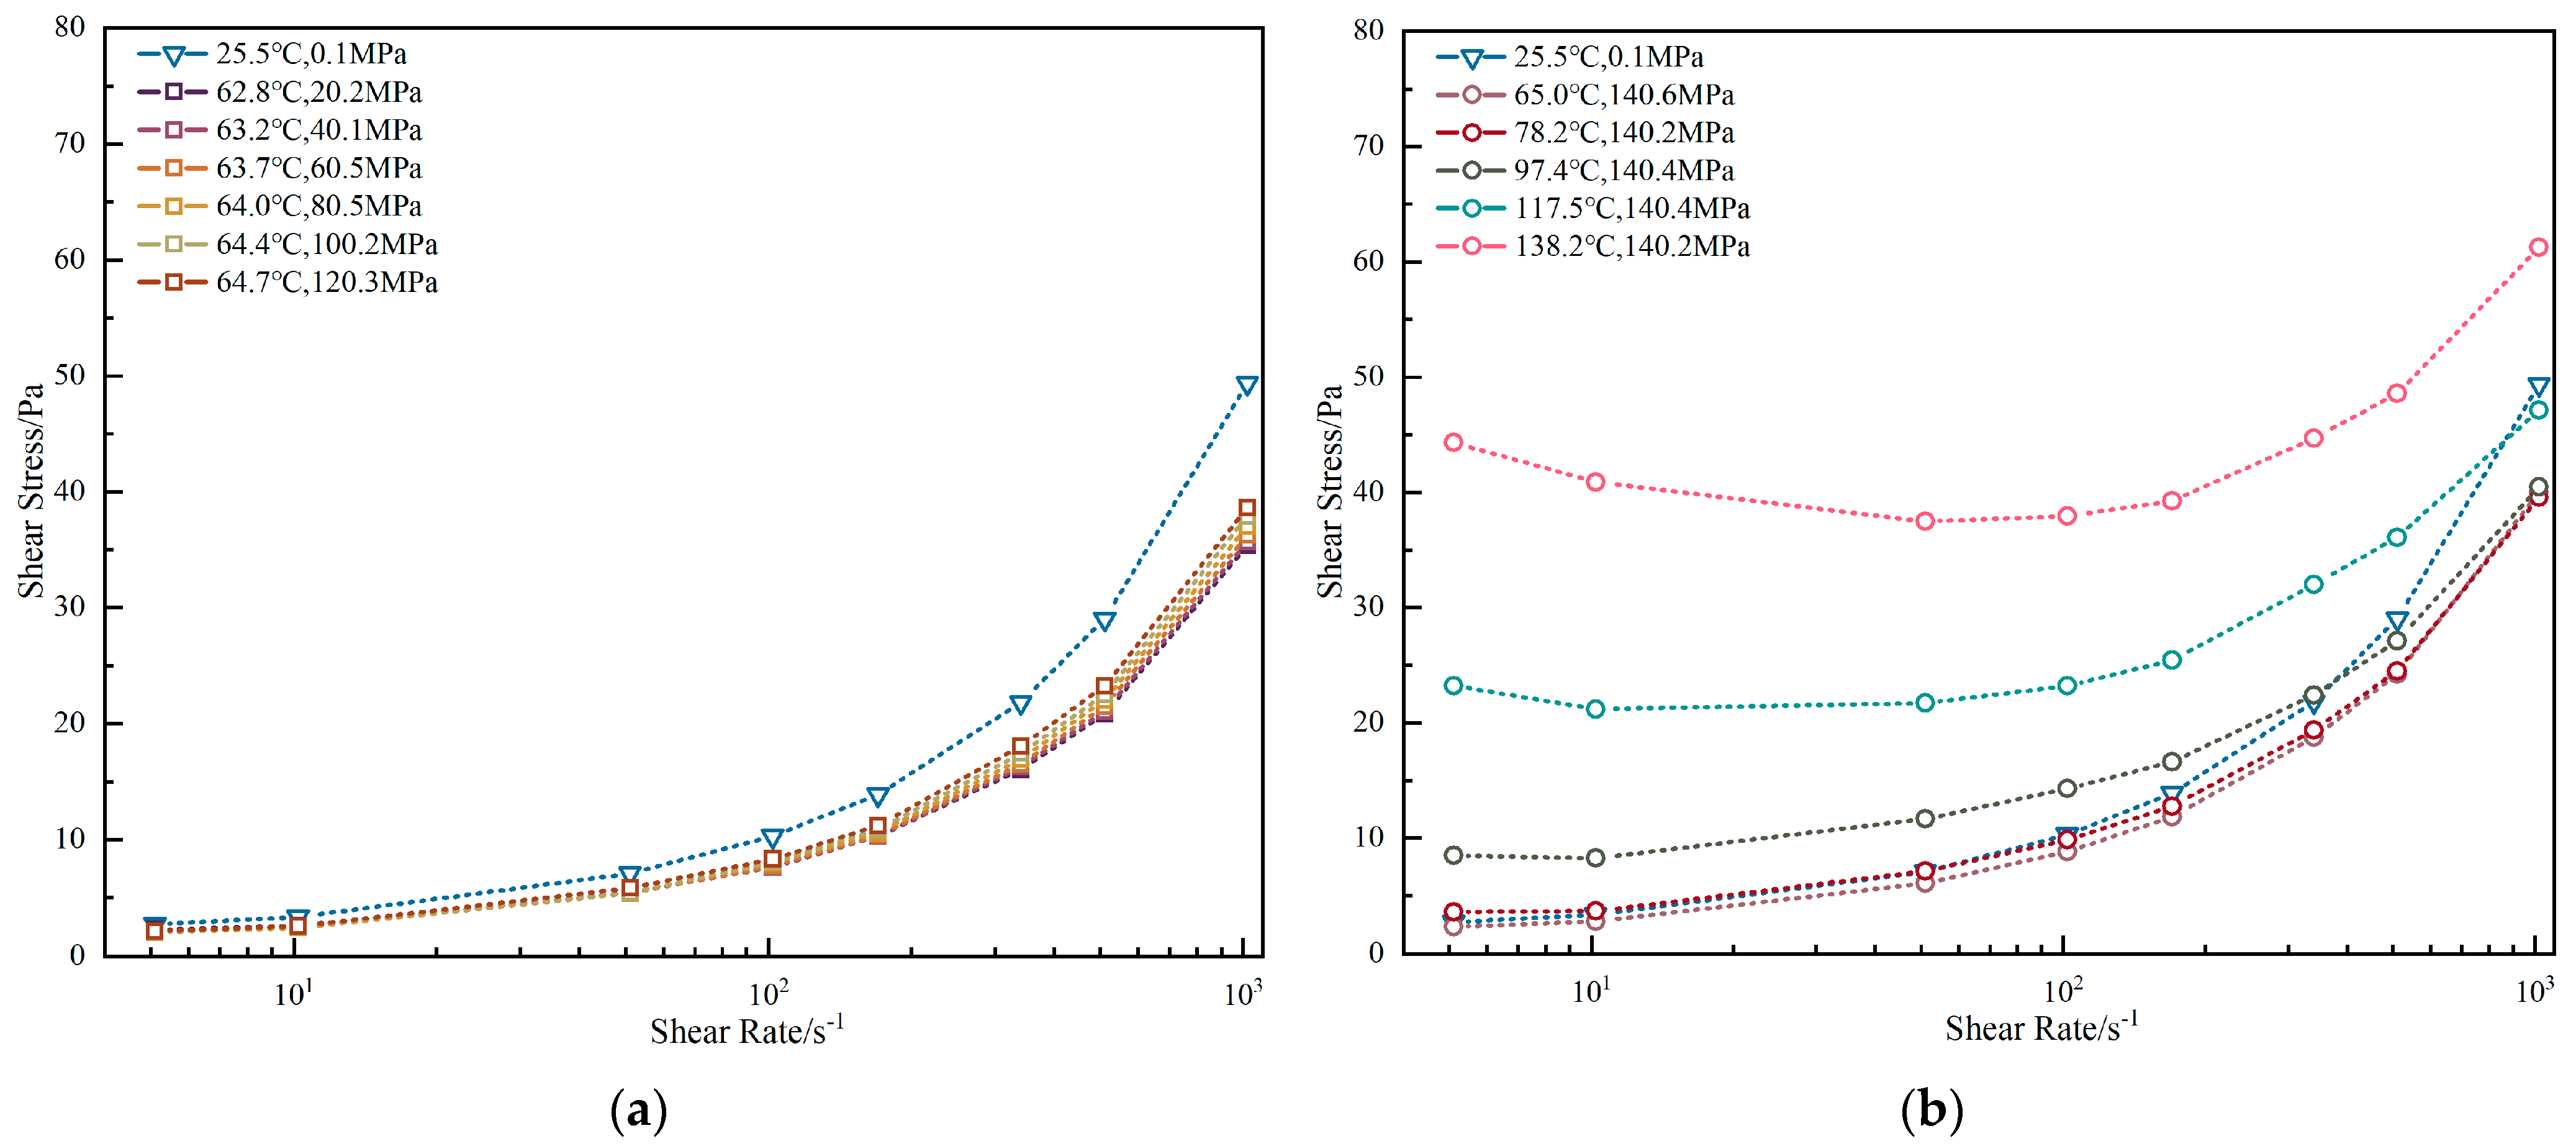
As depicted in Figure 9a, with the increase in pressure, the shear stress of the drilling fluid increases at a specific shear rate. However, for the No. 3 water-based drilling fluid, the variation in shear stress with respect to pressure appears to be insignificant.
As shown in Figure 9b, as the temperature rises, under the conditions of 65 °C, 140.6 MPa, and 78.2 °C, 140.2 MPa, the shear stress increases as the shear rate increases. Moreover, with an increase in temperature, the shear stress at the same shear rate becomes larger.
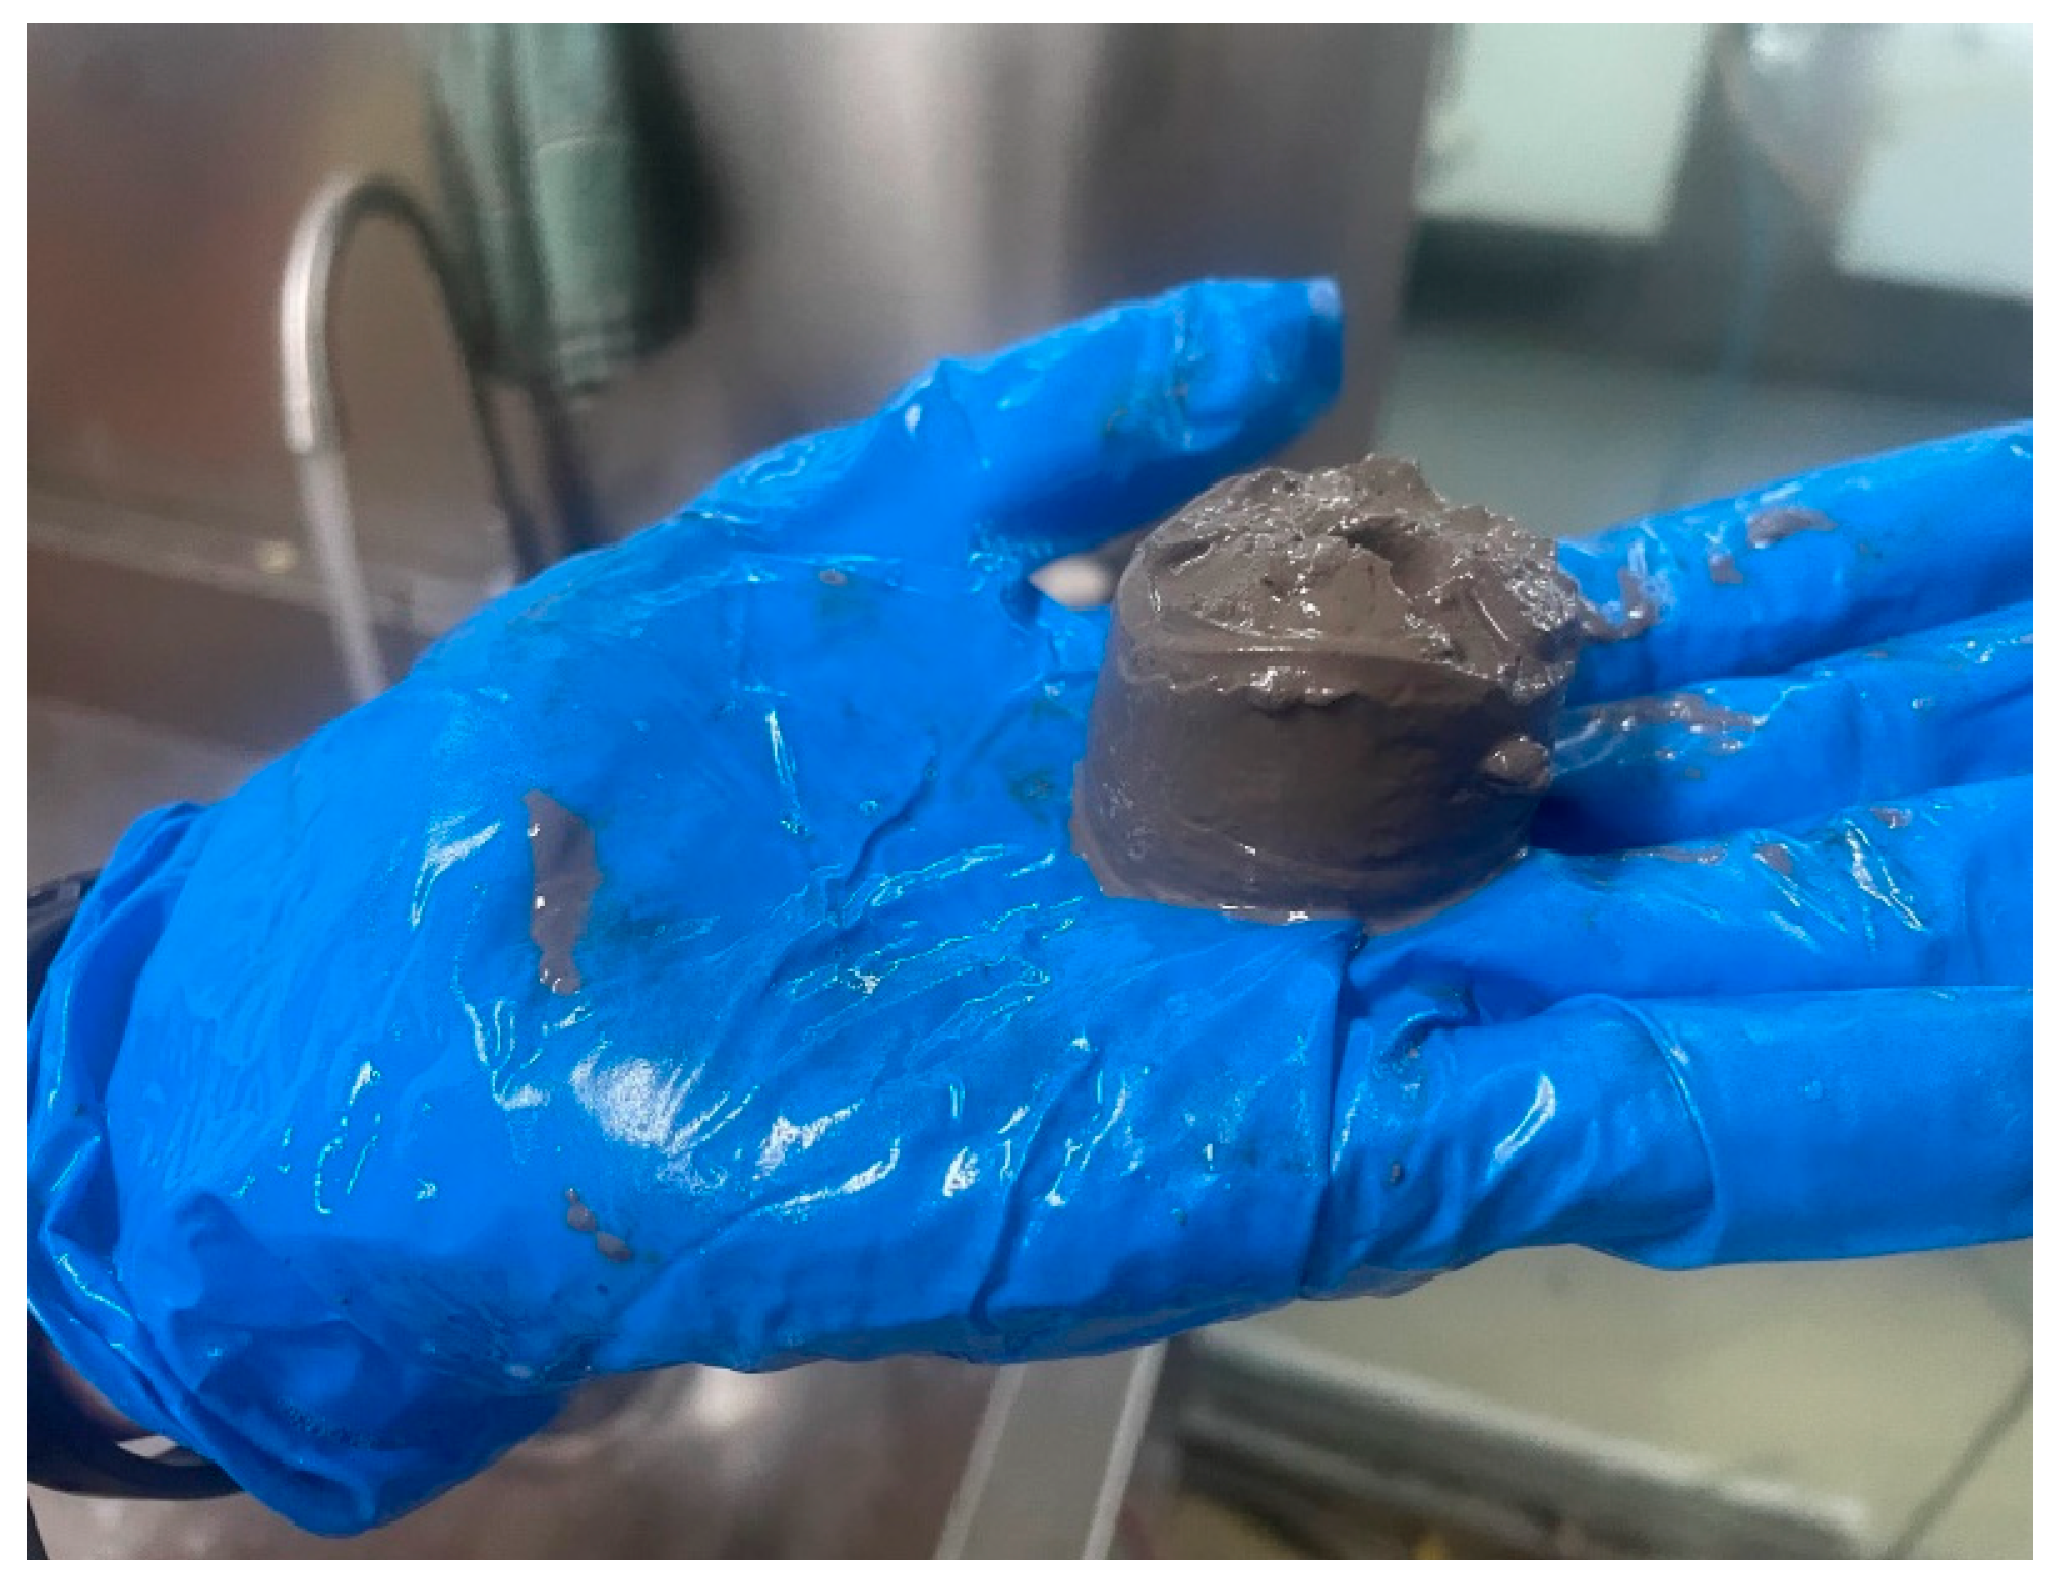
Nevertheless, when the temperature is elevated to 97.4 °C at a constant pressure, an anomalous phenomenon emerges in the relationship between shear pressure and shear stress. Specifically, as the shear rate increases, the shear stress first decreases and then increases. Additionally, at low shear rates, the shear stress is extraordinarily high. After the experiment was completed, the sample was taken out and found to have a jelly-like consistency. As shown in the Figure 10.
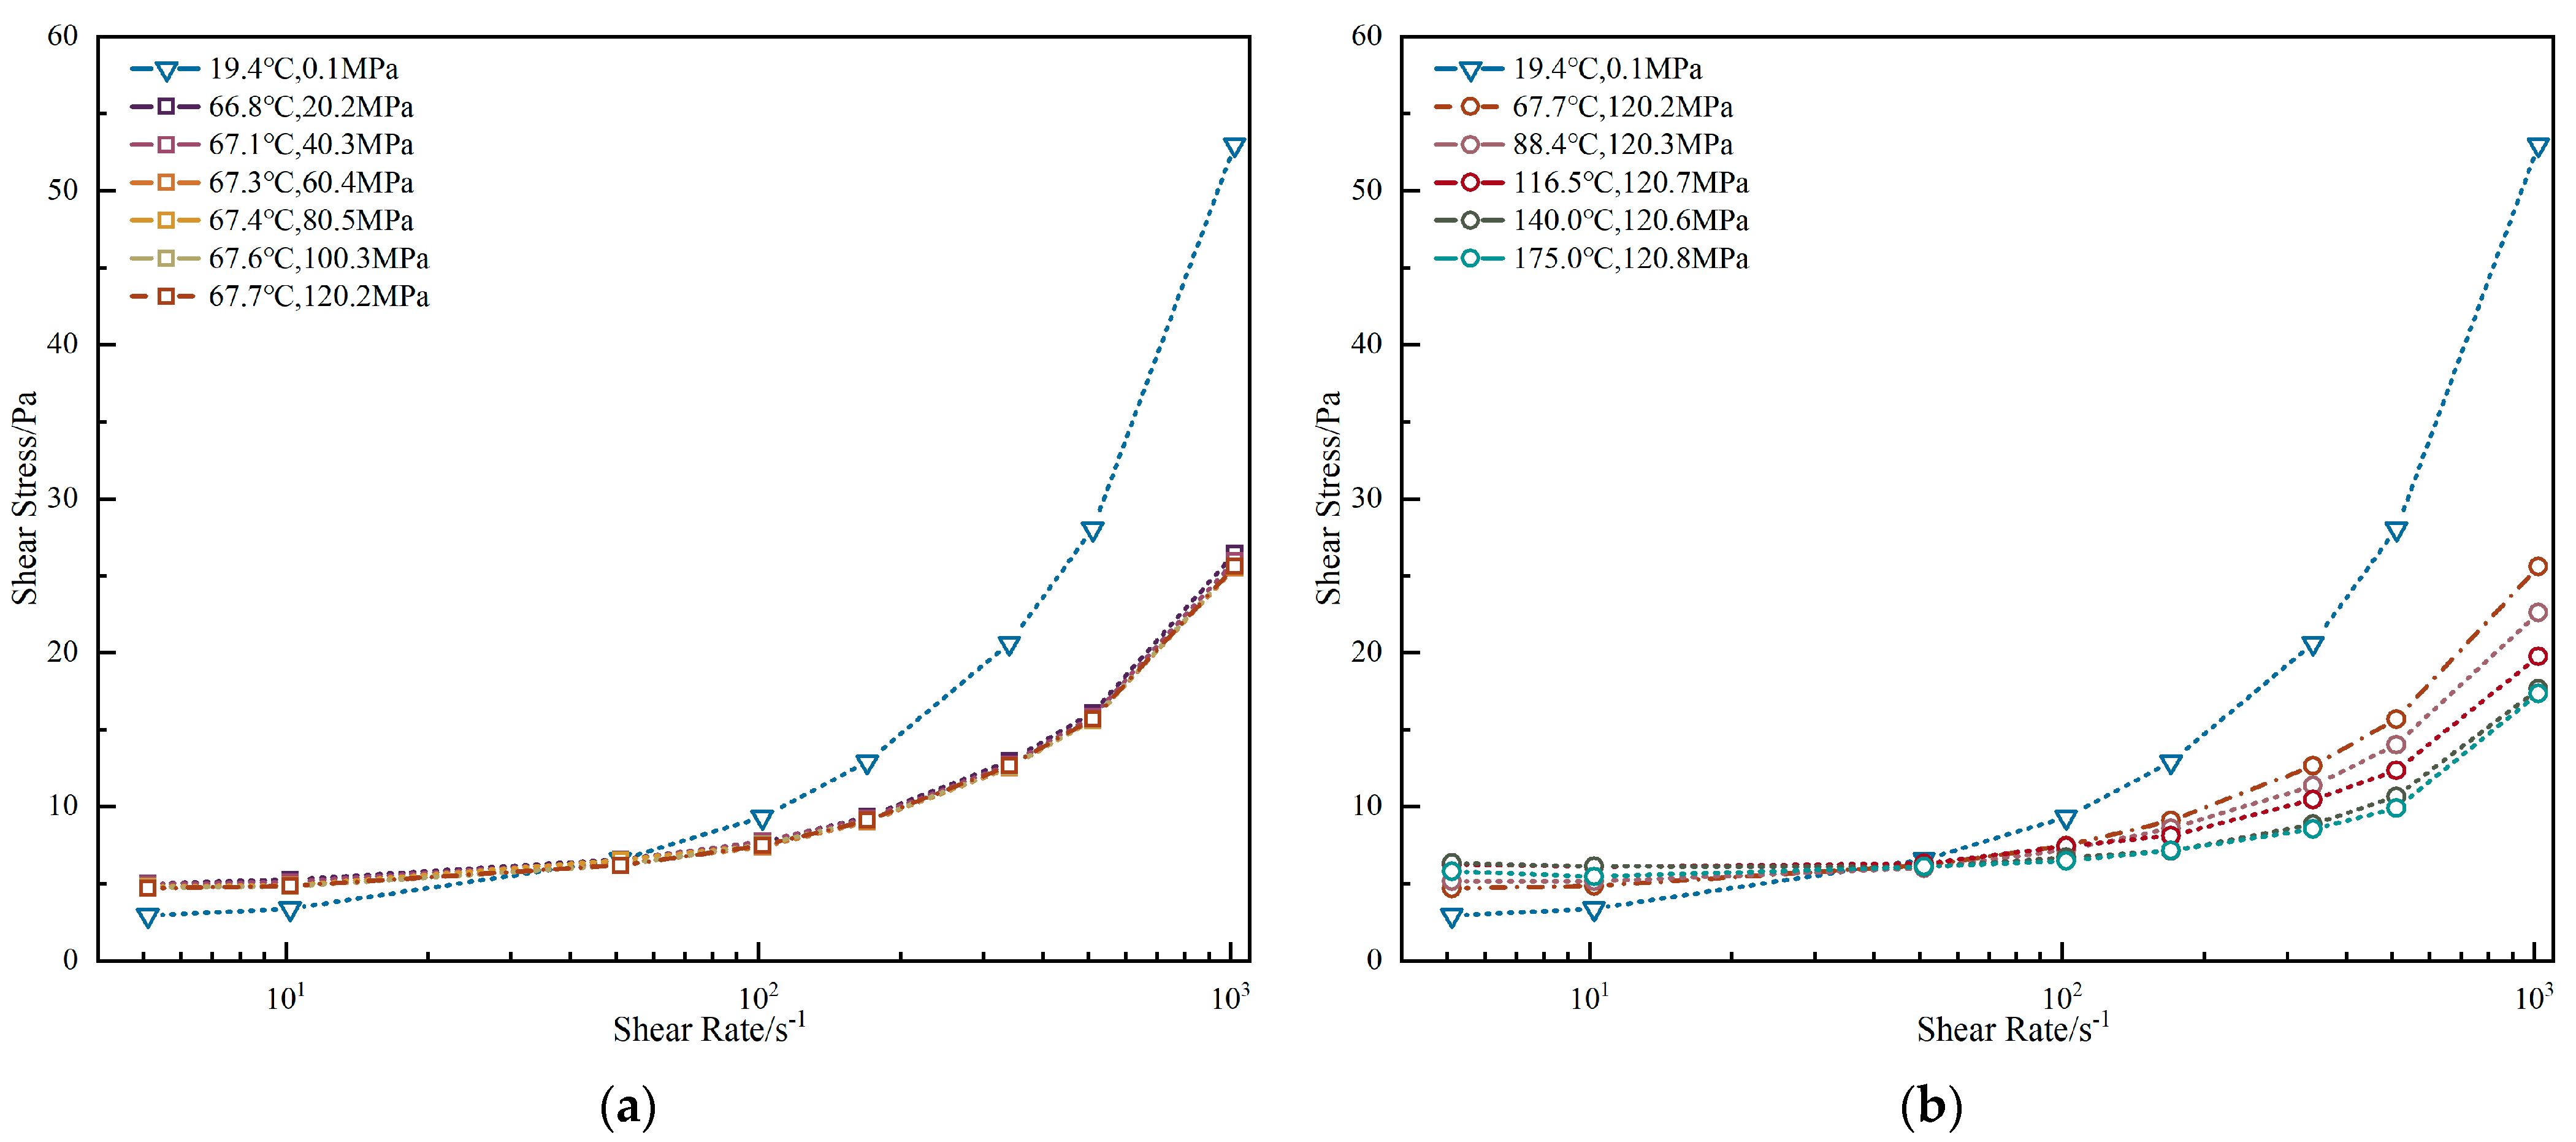
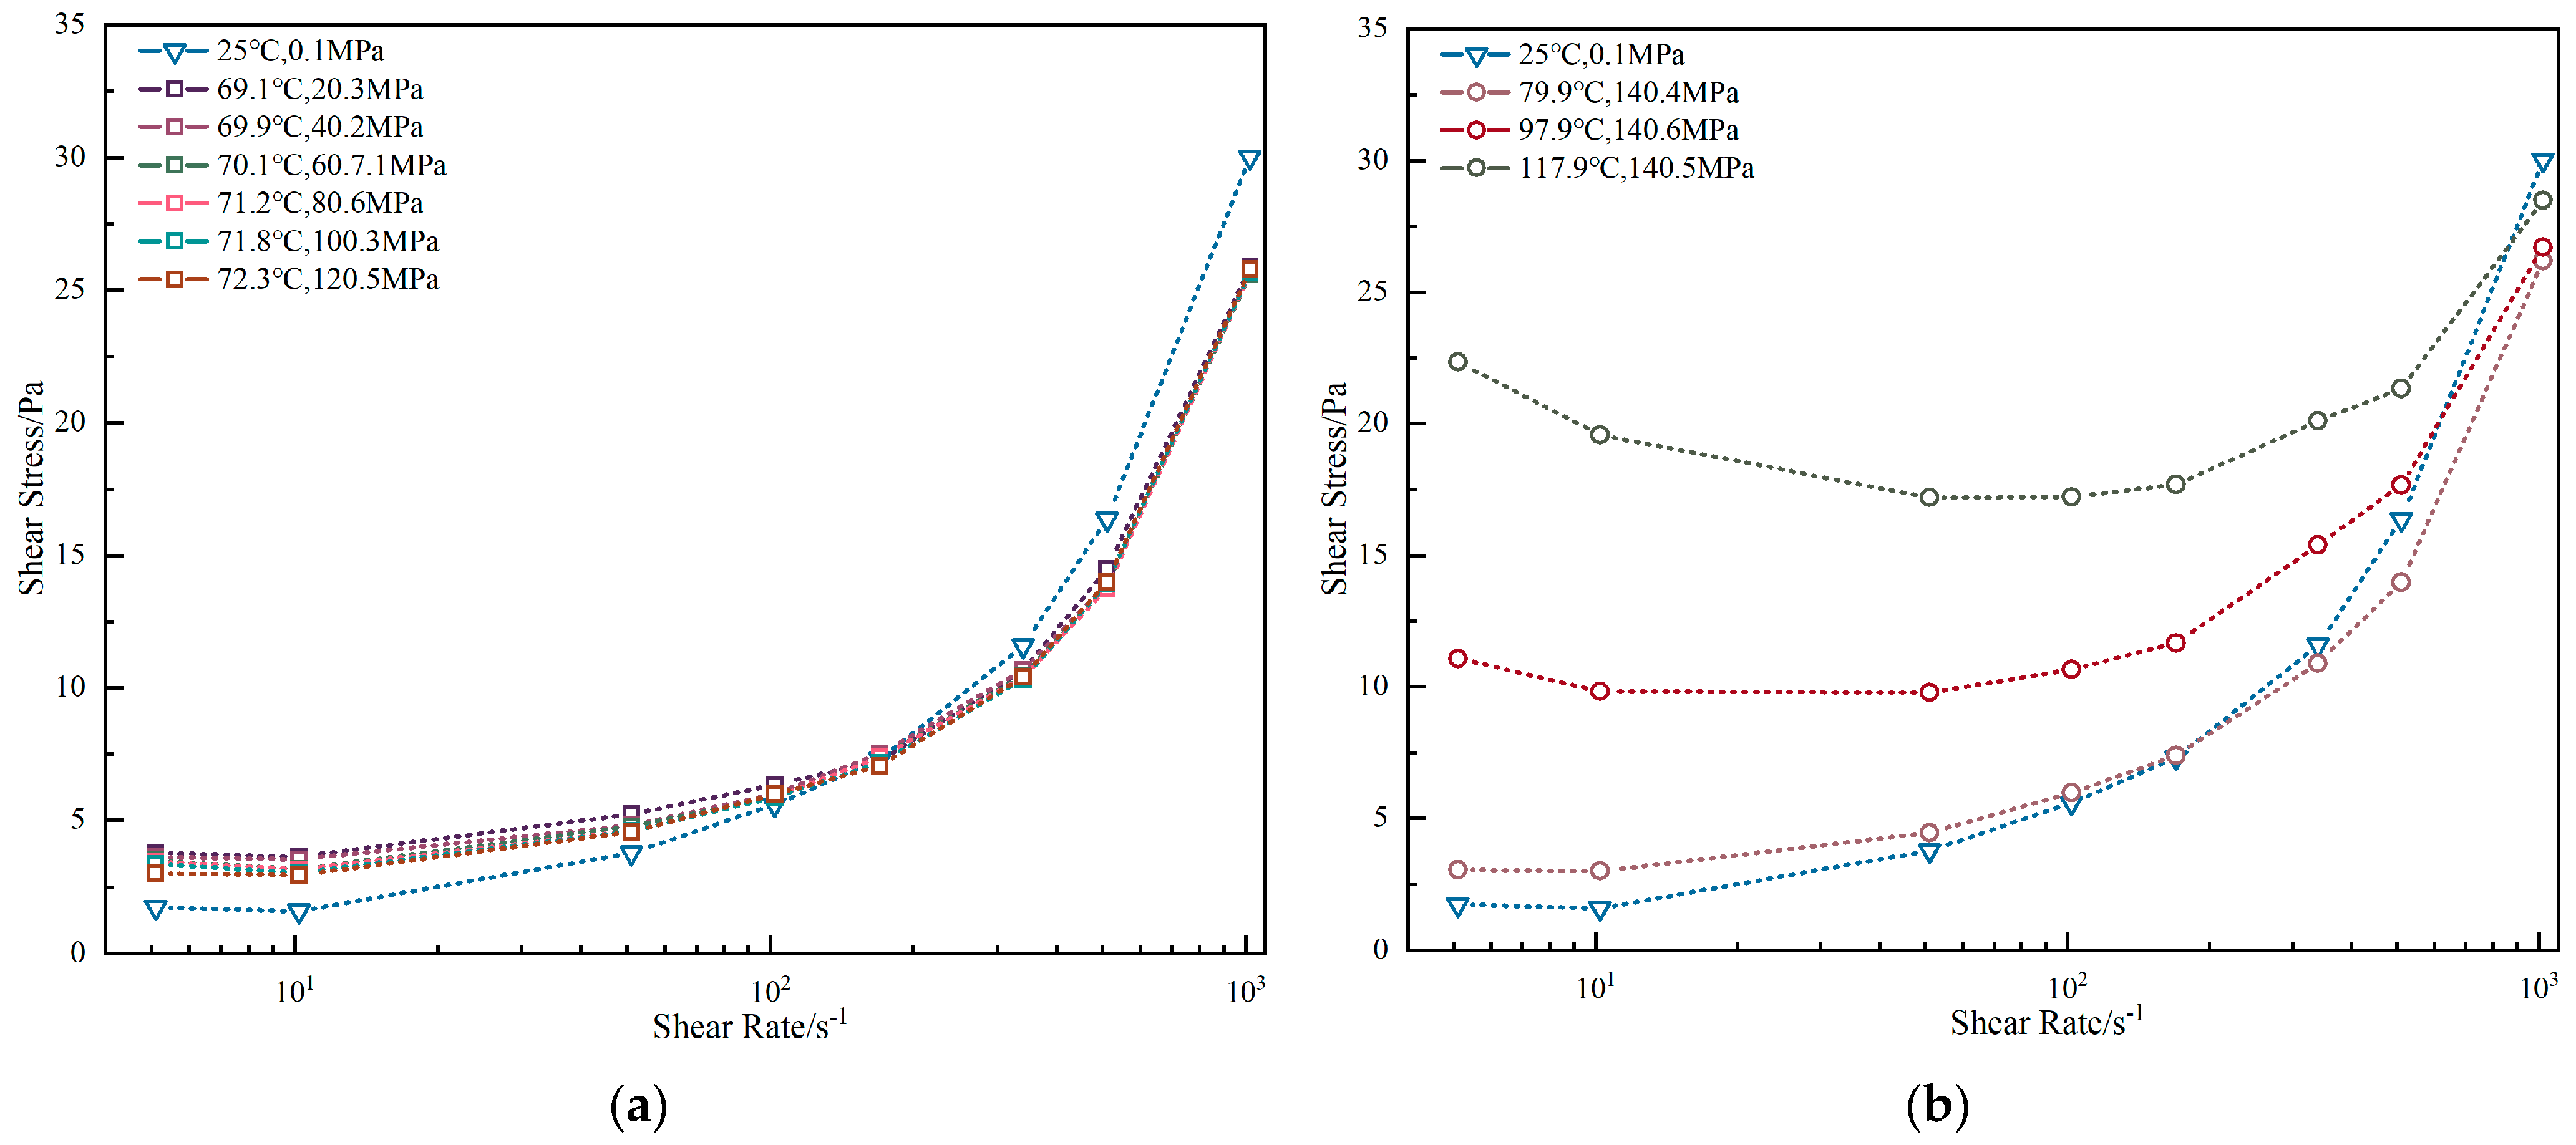
As shown in Figure 11a, when the temperature remains essentially constant, at the same shear rate, an increase in pressure results in almost no change in shear stress. This is more evident at high shear stresses, where the curves nearly overlap. This also indicates that the rheological properties of this water-based drilling fluid hardly change with an increase in pressure, which is almost consistent with the trend of the No. 3 water-based drilling fluid.
As depicted in Figure 11b, as the temperature rises, under the conditions of 79.9 °C and 140.4 MPa, the shear stress increases with the increase in shear rate. Moreover, with an increase in temperature, the shear stress at the same shear rate becomes larger. However, when the temperature is increased to 97.9 °C at the same pressure, an abnormal phenomenon occurs in the variation in shear pressure with respect to shear stress. That is, as the shear rate increases, the shear stress first decreases and then increases, and at low shear rates, the shear stress is extremely high. After being taken out, it shows the same gel-like state as the No. 3 water-based drilling fluid.
This is actually due to the fact that the drilling fluid has undergone a transformation. This can be verified by extracting the drilling fluid after the experiment. As presented in Figure 8, the drilling fluid has turned into a gel-like state. At low shear rates, the gel is compact, leading to a large internal flow resistance and an extremely high shear stress. As the shear rate increases, the gel structure is disrupted, the resistance decreases, and the shear stress drops. When the shear rate is further increased, the gel structure of the drilling fluid is damaged and a new structure is reconstructed. The flow resistance rebounds, causing the shear stress to increase again. Hence, the phenomenon of the shear stress first decreasing and then increasing with the increase in the shear rate occurs.

3.2. Comparative Analysis

Drilling fluids, both oil-based (OBM) and water-based (WBM), exhibit non-Newtonian, shear-thinning behavior, characterized by decreasing apparent viscosity with increasing shear rate. At comparable low-shear viscosities, OBMs typically display lower viscosity than WBMs under high-shear conditions. This difference arises from OBM composition, where the low-viscosity oil phase and surfactants reduce internal friction, resulting in a more pronounced viscosity decrease at high shear rates, as observed experimentally. This property can reduce wellbore pressure drop. Conversely, WBMs maintain higher viscosity under high shear due to the persistence of clay and polymer networks [24].
Temperature significantly impacts rheology, though OBMs and WBMs respond differently. Elevated temperatures reduce the viscosity and yield stress of both types. However, OBMs generally experience a greater relative viscosity reduction. This enhanced thermal thinning in OBMs primarily results from decreased base oil viscosity and thermal disruption of emulsions and colloidal interactions. Further degradation of surfactants or organophilic clays at extreme temperatures can exacerbate this effect [25]. While WBMs also thin thermally, the process is more complex: moderate temperatures reduce viscosity by lowering water viscosity and partially breaking down clay-polymer networks, but very high temperatures can induce irreversible clay flocculation, potentially increasing viscosity despite the aqueous phase thinning. Polymer and lignosulfonate degradation initially thins WBMs but may later promote solid flocculation upon stabilizer loss. Consequently, formulating thermally stable WBMs for high-temperature, high-pressure (HTHP) environments (e.g., up to 200 °C) is challenging and requires specialized additives. Overall, OBMs demonstrate superior thermal stability, largely due to oil’s higher boiling point and reduced tendency to cause clay-related issues compared to water.
The influence of pressure on rheology is generally less significant than temperature. Increased pressure elevates viscosity by compressing the fluid and reducing intermolecular free volume. Oil’s higher compressibility compared to water leads to a more substantial pressure-induced viscosity increase in OBMs, consistent with experimental data. WBMs, conversely, exhibit minimal pressure sensitivity under typical conditions due to water’s low compressibility.
These distinctions have operational implications. OBM’s pressure-thickening behavior requires higher pump pressures at depth than a WBM with equivalent surface viscosity to overcome the additional viscous resistance. Furthermore, in wells with significant thermal gradients, OBM viscosity demonstrates greater variation, decreasing markedly in high-temperature bottom sections but remaining comparatively high in cooler upper zones. In contrast, WBM viscosity variations with depth primarily reflect temperature changes and are less influenced by pressure.

4. Discussion

In the field of research, the widely used rheological models mainly include Bingham, power-law, H-B, etc. These rheological models have different forms, and each emphasizes different aspects of fluid rheological characteristics, which brings difficulties to the selection of an appropriate rheological model in the field. Meanwhile, when drilling through high-temperature and high-pressure intervals during the drilling process, due to the influence of the high-temperature and high-pressure environment, the rheological properties of the drilling fluid are quite different from those under normal temperature and pressure conditions. Therefore, based on conducting rheological experiments of high-temperature and high-pressure drilling fluids, it is necessary to select the optimal rheological model. This plays a crucial role in analyzing and calculating the temperature and pressure distribution in high-temperature and high-pressure wells.

4.1. Introduction to Optimization Algorithms

The Levenberg–Marquardt (L-M) algorithm and the Universal Global Optimization (UGO) method are two commonly used algorithms in the fields of mathematics and optimization, playing significant roles in optimization problems.
The L-M algorithm is an iterative optimization method for minimizing nonlinear least-squares problems. It performs well in handling situations with noisy data and parameter estimation. Its advantages are as follows:
  • Fast Convergence: Compared with the steepest-descent method, the L-M algorithm can converge to the optimal solution more rapidly.
  • Robustness: In the presence of noise and outliers, this algorithm is relatively robust.
  • Applicability: It can effectively deal with nonlinear problems with a large number of parameters.
The UGO method is used to find the global optimal solution or a solution close to the global optimum in the search space. It is applicable to discontinuous, non-smooth, and high-dimensional problems and often helps avoid being trapped in local optimal solutions. Its advantages include the following:
  • Global Optimality: Although it does not guarantee finding the global optimal solution, compared with other methods, it is more likely to find the global optimal solution or a solution close to it.
  • Applicability: It has strong applicability to complex, high-dimensional, and discontinuous problems.
  • Avoidance of Local Optima: Compared with other optimization methods, this type of algorithm is less likely to be confined to local optimal solutions.
Combining the L-M algorithm and the UGO method can overcome the limitations of each single method, give full play to their respective advantages, and improve the globality of optimization and local convergence. This has certain advantages in solving specific types of complex optimization problems.

4.2. Analysis of the Applicability of Drilling Fluid Rheological Models

With the help of the 1stOpt software, the LM&UGO algorithm (combining the Levenberg–Marquardt (LM) algorithm and the Universal Global Optimization (UGO) method) is used to perform nonlinear fitting on the experimental data of four oil-based drilling fluids under different temperatures and pressures, respectively, using the Bingham model, the model, and the H-B model. As quantitatively demonstrated in Appendix A, the Herschel–Bulkley (H-B) model demonstrated superior rheological fitting accuracy in both water-based and oil-based drilling fluids (prior to the denaturation of water-based systems), with coefficient of determination (R2) values exceeding 0.999. In contrast, the Bingham plastic and power-law models showed comparatively lower predictive capability, particularly under high-temperature/high-pressure (HTHP) conditions. This experimental evidence strongly suggests that the H-B model provides optimal characterization for both types of drilling fluid systems under downhole-equivalent conditions.

4.3. Mathematical Prediction Model for Drilling Fluid Rheological Parameters

The Herschel–Bulkley (H-B) rheological parameters (consistency coefficient K, flow behavior index n, and yield stress τ0) of oil-based and water-based drilling fluids under high-temperature/high-pressure (HTHP) conditions were determined through multivariate nonlinear regression using the global optimization algorithm in 1stOpt software (Version 9.0). Leveraging its built-in function library and differential evolution algorithm, 1stOpt enabled robust parameter estimation without requiring initial guesses, effectively addressing the intrinsic nonlinearity of temperature-pressure coupling effects.
Equation (4) was identified as the optimal model through iterative screening, achieving a high determination coefficient (R2 > 0.95) with minimal parameters as follows:
f t , P = f 0 t 0 , P 0 exp A + B t + C t 2 + D P + E P 2
where f(t,P) represents the H-B parameters (K, n, or τ0) under temperature t (°C) and pressure P (MPa). A, B, C, D, and E are parameters obtained by fitting the empirical formula through experiments. This model advances traditional viscosity-centric approaches in the following two critical aspects:
  • Comprehensive parameterization: Unlike empirical models focusing solely on apparent viscosity (μa) or plastic viscosity (μp), Equation (4) explicitly quantifies all three H-B parameters, which are essential for accurate calculation of the generalized Reynolds number (Reg).
  • Thermo-pressure coupling: The inclusion of the cross-term tP captures synergistic interactions between temperature and pressure, reflecting microstructural changes in drilling fluids under HTHP conditions.
This precision resolves a critical limitation in hydraulic calculations: conventional methods relying on μa or μp fail to account for the full H-B parameter set required for Reg-based flow regime identification. By enabling precise prediction of all three H-B parameters, Equation (4) provide a foundation for friction coefficient determination and annular pressure loss modeling in HTHP wells.

4.4. Experimental Verification

To validate the derived equation, an additional set of experiments was conducted using a water-based drilling fluid with a density of 2.15 g/cm3. The experimental temperature range was set from 20 to 120 °C, with the 120 °C data excluded from fitting due to fluid denaturation observed at this temperature. Experimental pressures were varied between 0.1 and 140 MPa. Under these temperature-pressure conditions, the experimental data were fitted to the Herschel–Bulkley model, with the corresponding parameters summarized in Table 2. When these parameters were substituted into Equation (4), the predicted results (presented in Table 3) demonstrated excellent agreement with the new experimental dataset. This is evidenced by a high determination coefficient of R2 = 0.97, which exceeds the threshold of 0.95.

5. Conclusions

With the increasing demand for energy, oil and gas exploration has extended to deep and ultra-deep formations, where extreme temperature and pressure (HTHP) conditions pose significant challenges to drilling operations. To address the limitations of existing rheological models in extreme environments, this study conducted rheological experiments on eight field-collected drilling fluid samples (four water-based and four oil-based) using a Chandler 7600 HTHP rheometer under conditions up to 247 °C and 140 MPa. Nonlinear fitting via a hybrid Levenberg–Marquardt and Universal Global Optimization algorithm and multivariate regression were employed for model development. Main conclusions can be drawn from this work as follows:
  • Oil-based and water-based drilling fluids exhibit distinct rheological responses to temperature and pressure. Elevated pressure increases shear stress, while higher temperature reduces it, with oil-based fluids showing more significant pressure sensitivity and water-based fluids potentially undergoing gelation at extreme temperatures.
  • The Herschel–Bulkley (H-B) model achieves superior fitting accuracy for both fluid types (coefficient of determination > 0.999), outperforming Bingham and power-law models, especially under HTHP conditions.
  • The derived H-B parameter prediction model, accounting for temperature-pressure coupling, demonstrates high validation accuracy (R2 > 0.95). It comprehensively quantifies yield stress, consistency coefficient, and flow behavior index, addressing limitations of traditional viscosity-centric models.
  • This optimized modeling approach provides a robust tool for engineers to predict annular pressure loss in real-time field operations and optimize drilling fluid design, supporting safer and more efficient deep and ultra-deep drilling. Future research could extend to more diverse fluid formulations and broader HTHP ranges to enhance applicability.

Author Contributions

Conceptualization, H.L.; methodology, H.L.; validation, C.C. and D.X.; formal analysis, C.C.; investigation, C.C. and J.L.; resources, J.L. and D.X.; data curation, H.L. and C.C.; writing—original draft preparation, H.L., C.C., J.L. and P.C.; writing—review and editing, C.C. and B.Z.; visualization, C.C.; supervision, B.Z., J.L., P.C. and D.X.; project administration, H.L. and B.Z.; funding acquisition, H.L., B.Z. and P.C. All authors have read and agreed to the published version of the manuscript.

Funding

This research received no external funding.

Data Availability Statement

The original contributions presented in this study are included in the article. Further inquiries can be directed to the corresponding author.

Conflicts of Interest

Author Jing Luo was employed by the Chongqing Instrument Factory of Manufacturing Company of China National Petroleum Logging Co., Ltd. The remaining authors declare that the research was conducted in the absence of any commercial or financial relationships that could be construed as a potential conflict of interest.

Appendix A

Appendix A.1. OB-NO 1

Temperature (°C)Pressure (MPa)Herschel–BulkleyBinghamPower-Law
19.00.1τ0 = 1.91
K = 0.131
n = 0.946
R2 = 1.00
τ0 = 2.48
K = 0.0930
R2 = 0.999
K = 0.668
n = 0.663
R2 = 0.984
68.720.4τ0 = 1.63
K = 0.0486
n = 0.904
R2 = 0.999
τ0 = 2.14
K = 0.0249
R2 = 0.998
K = 0.556
n = 0.520
R2 = 0.956
69.140.3τ0 = 1.91
K = 0.0544
n = 0.919
R2 = 0.999
τ0 = 2.44
K = 0.0308
R2 = 0.998
K = 0.628
n = 0.532
R2 = 0.956
69.360.2τ0 = 2.21
K = 0.0676
n = 0.918
R2 = 1.00
τ0 = 2.87
K = 0.0381
R2 = 0.999
K = 0.758
n = 0.533
R2 = 0.956
69.580.7τ0 = 2.53
K = 0.0747
n = 0.938
R2 = 0.999
τ0 = 3.16
K = 0.0484
R2 = 0.999
K = 0.789
n = 0.562
R2 = 0.960
69.7100.4τ0 = 2.94
K = 0.0882
n = 0.946
R2 = 0.999
τ0 = 3.61
K = 0.0604
R2 = 0.999
K = 0.886
n = 0.578
R2 = 0.962
70.0120.2τ0 = 3.22
K = 0.105
n = 0.953
R2 = 1.00
τ0 = 3.95
K = 0.0758
R2 = 0.999
K = 0.949
n = 0.600
R2 = 0.966
70.2120.3τ0 = 3.28
K = 0.102
n = 0.955
R2 = 1.00
τ0 = 3.96
K = 0.0751
R2 = 0.999
K = 0.958
n = 0.597
R2 = 0.965
79.9120.7τ0 = 3.07
K = 0.0846
n = 0.948
R2 = 0.999
τ0 = 3.69
K = 0.0590
R2 = 0.999
K = 0.912
n = 0.570
R2 = 0.960
89.2120.4τ0 = 2.97
K = 0.0778
n = 0.930
R2 = 0.999
τ0 = 3.67
K = 0.0479
R2 = 0.999
K = 0.968
n = 0.531
R2 = 0.954
99.3120.4τ0 = 2.76
K = 0.0697
n = 0.918
R2 = 0.999
τ0 = 3.45
K = 0.0394
R2 = 0.998
K = 0.924
n = 0.512
R2 = 0.951
109.2120.4τ0 = 2.28
K = 0.0783
n = 0.874
R2 = 0.999
τ0 = 3.19
K = 0.0325
R2 = 0.996
K = 0.817
n = 0.506
R2 = 0.958

Appendix A.2. OB-NO 2

Temperature (°C)Pressure (MPa)Herschel–BulkleyBinghamPower-Law
24.70.1τ0 = 1.15
K = 0.266
n = 0.820
R2 = 1.00
τ0 = 3.15
K = 0.0851
R2 = 0.994
K = 0.652
n = 0.664
R2 = 0.994
67.820.3τ0 = 0.697
K = 0.0739
n = 0.887
R2 = 1.00
τ0 = 1.54
K = 0.0336
R2 = 0.997
K = 0.0336
n = 1.54
R2 = 0.997
68.040.5τ0 = 0.873
K = 0.0946
n = 0.891
R2 = 1.00
τ0 = 1.93
K = 0.0443
R2 = 0.998
K = 0.0443
n = 1.93
R2 = 0.998
68.260.4τ0 = 1.11
K = 0.111
n = 0.911
R2 = 1.00
τ0 = 2.25
K = 0.0595
R2 = 0.998
K = 0.0595
n = 2.25
R2 = 0.998
68.580.2τ0 = 1.32
K = 0.142
n = 0.915
R2 = 1.00
τ0 = 2.74
K = 0.0783
R2 = 0.998
K = 0.423
n = 0.737
R2 = 0.992
68.7100.3τ0 = 1.40
K = 0.192
n = 0.910
R2 = 1.00
τ0 = 3.37
K = 0.103
R2 = 0.998
K = 0.500
n = 0.754
R2 = 0.994
69.0120.5τ0 = 2.37
K = 0.187
n = 0.959
R2 = 1.00
τ0 = 3.54
K = 0.140
R2 = 1.00
K = 0.647
n = 0.756
R2 = 0.990
62.6139.7τ0 = 1.49
K = 0.386
n = 0.905
R2 = 1.00
τ0 = 3.23
K = 0.220
R2 = 0.998
K = 0.804
n = 0.769
R2 = 0.996
98.0140.3τ0 = 1.04
K = 0.137
n = 0.923
R2 = 1.00
τ0 = 2.34
K = 0.0801
R2 = 0.999
K = 0.340
n = 0.775
R2 = 0.995
139.5140.5τ0 = 0.474
K = 0.0558
n = 0.937
R2 = 1.00
τ0 = 0.945
K = 0.0360
R2 = 0.999
K = 0.139
n = 0.790
R2 = 0.995
178.9140.3τ0 = 0.954
K = 0.0524
n = 0.921
R2 = 0.998
τ0 = 1.46
K = 0.0302
R2 = 0.997
K = 0.234
n = 0.684
R2 = 0.985

Appendix A.3. OB-NO 3

Temperature (°C)Pressure (MPa)Herschel–BulkleyBinghamPower-Law
27.50.1τ0 = 4.47
K = 0.459
n = 0.861
R2 = 1.00
τ0 = 7.75
K = 0.191
R2 = 0.997
K = 1.92
n = 0.615
R2 = 0.986
92.420.3τ0 = 1.32
K = 0.121
n = 0.869
R2 = 1.00
τ0 = 2.75
K = 0.0483
R2 = 0.996
K = 0.465
n = 0.652
R2 = 0.987
92.640.1τ0 = 1.70
K = 0.144
n = 0.877
R2 = 1.00
τ0 = 3.38
K = 0.0612
R2 = 0.997
K = 0.561
n = 0.659
R2 = 0.987
92.760.4τ0 = 1.91
K = 0.177
n = 0.878
R2 = 1.00
τ0 = 3.97
K = 0.0757
R2 = 0.997
K = 0.684
n = 0.659
R2 = 0.987
92.880.4τ0 = 1.95
K = 0.225
n = 0.874
R2 = 1.00
τ0 = 4.59
K = 0.0933
R2 = 0.996
K = 0.744
n = 0.679
R2 = 0.989
93.0100.5τ0 = 2.36
K = 0.296
n = 0.863
R2 = 1.00
τ0 = 5.90
K = 0.114
R2 = 0.996
K = 0.994
n = 0.664
R2 = 0.989
122.6140.2τ0 = 2.52
K = 0.243
n = 0.873
R2 = 1.00
τ0 = 5.37
K = 0.100
R2 = 0.997
K = 0.912
n = 0.659
R2 = 0.987
151.2140.6τ0 = 2.03
K = 0.194
n = 0.855
R2 = 1.00
τ0 = 4.37
K = 0.0704
R2 = 0.995.
K = 0.704
n = 0.649
R2 = 0.988
180.8140.1τ0 = 2.09
K = 0.196
n = 0.814
R2 = 1.00
τ0 = 4.49
K = 0.0533
R2 = 0.992
K = 0.811
n = 0.589
R2 = 0.984
209.3140.2τ0 = 2.87
K = 0.163
n = 0.815
R2 = 0.999
τ0 = 4.86
K = 0.0446
R2 = 0.991
K = 1.11
n = 0.515
R2 = 0.970
244.3140.3τ0 = 9.94
K = 0.0492
n = 0.944
R2 = 1.00
τ0 = 10.3
K = 0.0332
R2 = 0.999
K = 5.35
n = 0.255
R2 = 0.838

Appendix A.4. OB-NO 4

Temperature (°C)Pressure (MPa)Herschel–BulkleyBinghamPower-Law
18.80.1τ0 = 1.54
K = 0.272
n = 0.934
R2 = 1.00
τ0 = 2.88
K = 0.180
R2 = 0.999
K = 0.652
n = 0.771
R2 = 0.995
66.920.3τ0 = 1.63
K = 0.0741
n = 0.979
R2 = 1.00
τ0 = 1.89
K = 0.0640
R2 = 1.00
K = 0.431
n = 0.693
R2 = 0.980
67.140.0τ0 = 1.72
K = 0.0993
n = 0.971
R2 = 1.00
τ0 = 2.20
K = 0.0810
R2 = 1.00
K = 0.495
n = 0.707
R2 = 0.983
67.360.5τ0 = 1.73
K = 0.136
n = 0.959
R2 = 1.00
τ0 = 2.58
K = 0.102
R2 = 1.00
K = 0.530
n = 0.734
R2 = 0.988
67.580.5τ0 = 2.54
K = 0.111
n = 1.03
R2 = 0.999
τ0 = 1.79
K = 0.136
R2 = 1.00
K = 0.517
n = 0.779
R2 = 0.986
61.496.8τ0 = 2.06
K = 0.234
n = 0.974
R2 = 1.00
τ0 = 6.31
K = 0.152
R2 = 0.942
K = 0.832
n = 0.732
R2 = 0.969
62.6120.8τ0 = 2.58
K = 0.228
n = 1.02
R2 = 0.999
τ0 = 2.15
K = 0.253
R2 = 1.00
K = 0.744
n = 0.809
R2 = 0.992
100.9140.4τ0 = 1.73
K = 0.113
n = 1.01
R2 = 1.00
τ0 = 1.54
K = 0.120
R2 = 1.00
K = 0.402
n = 0.801
R2 = 0.991
139.5140.4τ0 = 1.53
K = 0.0519
n = 1.03
R2 = 1.00
τ0 = 1.17
K = 0.0637
R2 = 1.00
K = 0.339
n = 0.725
R2 = 0.979
178.3140.1τ0 = 1.42
K = 0.0320
n = 1.04
R2 = 0.999
τ0 = 1.10
K = 0.0426
R2 = 0.999
K = 0.334
n = 0.662
R2 = 0.966
217.1140.2τ0 = 1.73
K = 0.0274
n = 1.06
R2 = 0.999
τ0 = 1.32
K = 0.0403
R2 = 0.999
K = 0.407
n = 0.623
R2 = 0.955
247.1140.2τ0 = 5.83
K = 0.0116
n = 1.22
R2 = 0.999
τ0 = 3.93
K = 0.0545
R2 = 0.992
K = 1.88
n = 0.428
R2 = 0.852

Appendix A.5. WB-NO 1

Temperature (°C)Pressure (MPa)Herschel–BulkleyBinghamPower-Law
28.30.1τ0 = 0.794
K = 0.198
n = 0.914
R2 = 1.00
τ0 = 2.79
K = 0.109
R2 = 0.999
K = 0.380
n = 0.806
R2 = 0.997
69.720.2τ0 = 0.668
K = 0.118
n = 0.895
R2 = 1.00
τ0 = 1.97
K = 0.0569
R2 = 0.998
K = 0.296
n = 0.742
R2 = 0.994
70.140.1τ0 = 0.924
K = 0.142
n = 0.903
R2 = 1.00
τ0 = 2.44
K = 0.0721
R2 = 0.998
K = 0.391
n = 0.734
R2 = 0.993
70.460.3τ0 = 0.977
K = 0.196
n = 0.888
R2 = 1.00
τ0 = 3.18
K = 0.0900
R2 = 0.997
K = 0.468
n = 0.743
R2 = 0.994
70.780.7τ0 = 1.28
K = 0.247
n = 0.887
R2 = 1.00
τ0 = 4.08
K = 0.112
R2 = 0.997
K = 0.623
n = 0.732
R2 = 0.994
71.0100.1τ0 = 1.64
K = 0.287
n = 0.892
R2 = 1.00
τ0 = 4.84
K = 0.135
R2 = 0.998
K = 0.717
n = 0.740
R2 = 0.994
72.1108.5τ0 = 1.98
K = 0.363
n = 0.875
R2 = 1.00
τ0 = 3.05
K = 0.187
R2 = 0.998
K = 1.09
n = 0.658
R2 = 0.993
80.0120.4τ0 = 2.02
K = 0.321
n = 0.887
R2 = 1.00
τ0 = 4.14
K = 0.158
R2 = 0.998
K = 0.914
n = 0.704
R2 = 0.993
98.1120.6τ0 = 2.14
K = 0.221
n = 0.889
R2 = 1.00
τ0 = 4.62
K = 0.102
R2 = 0.997
K = 0.825
n = 0.672
R2 = 0.987
118.6120.6τ0 = 2.23
K = 0.156
n = 0.894
R2 = 1.00
τ0 = 3.96
K = 0.0746
R2 = 0.998
K = 0.774
n = 0.635
R2 = 0.981
138.9120.2τ0 = 1.87
K = 0.149
n = 0.864
R2 = 1.00
τ0 = 3.64
K = 0.0577
R2 = 0.996
K = 0.691
n = 0.617
R2 = 0.982
159.3120.2τ0 = 1.66
K = 0.322
n = 0.723
R2 = 1.00
τ0 = 5.17
K = 0.0461
R2 = 0.982
K = 0.945
n = 0.552
R2 = 0.990

Appendix A.6. WB-NO 2

Temperature (°C)Pressure (MPa)Herschel–BulkleyBinghamPower-Law
19.40.1τ0 = 3.10
K = 0.0739
n = 0.939
R2 = 0.998
τ0 = 3.71
K = 0.0484
R2 = 0.998
K = 0.965
n = 0.534
R2 = 0.953
66.820.2τ0 = 4.98
K = 0.0408
n = 0.904
R2 = 0.999
τ0 = 5.41
K = 0.0208
R2 = 0.998
K = 2.50
n = 0.292
R2 = 0.872
67.140.3τ0 = 4.93
K = 0.0415
n = 0.898
R2 = 0.999
τ0 = 5.38
K = 0.0204
R2 = 0.997
K = 2.48
n = 0.292
R2 = 0.874
67.260.4τ0 = 4.66
K = 0.0443
n = 0.888
R2 = 0.999
τ0 = 5.16
K = 0.0202
R2 = 0.997
K = 2.34
n = 0.298
R2 = 0.878
67.480.5τ0 = 4.78
K = 0.0425
n = 0.893
R2 = 0.999
τ0 = 5.25
K = 0.0202
R2 = 0.997
K = 2.39
n = 0.295
R2 = 0.877
67.6100.3τ0 = 4.61
K = 0.0476
n = 0.878
R2 = 0.999
τ0 = 5.16
K = 0.0203
R2 = 0.996
K = 2.30
n = 0.301
R2 = 0.884
67.8120.2τ0 = 4.57
K = 0.0498
n = 0.872
R2 = 0.999
τ0 = 5.15
K = 0.0204
R2 = 0.996
K = 2.29
n = 0.302
R2 = 0.886
87.4120.3τ0 = 5.02
K = 0.0288
n = 0.925
R2 = 0.999
τ0 = 5.29
K = 0.0171
R2 = 0.998
K = 2.69
n = 0.259
R2 = 0.847
116.5120.7τ0 = 6.07
K = 0.00829
n = 1.07
R2 = 0.998
τ0 = 5.90
K = 0.134
R2 = 0.998
K = 3.67
n = 0.192
R2 = 0.758
146.0120.6τ0 = 6.12
K = 0.00110
n = 1.34
R2 = 0.998
τ0 = 5.59
K = 0.0112
R2 = 0.983
K = 3.93
n = 0.158
R2 = 0.650
175.0120.8τ0 = 5.83
K = 0.000921
n = 1.36
R2 = 0.994
τ0 = 5.27
K = 0.0112
R2 = 0.980
K = 3.55
n = 0.171
R2 = 0.678

Appendix A.7. WB-NO 3

Temperature (°C)Pressure (MPa)Herschel–BulkleyBinghamPower-Law
34.40.9τ0 = 2.30
K = 0.200
n = 0.788
R2 = 0.999
τ0 = 4.70
K = 0.0452
R2 = 0.990
K = 0.960
n = 0.541
R2 = 0.980
62.820.2τ0 = 1.91
K = 0.151
n = 0.779
R2 = 0.999
τ0 = 3.71
K = 0.0321
R2 = 0.989
K = 0.811
n = 0.516
R2 = 0.976
63.240.1τ0 = 1.77
K = 0.160
n = 0.773
R2 = 0.999
τ0 = 3.66
K = 0.0325
R2 = 0.988
K = 0.759
n = 0.529
R2 = 0.980
63.760.5τ0 = 1.63
K = 0.169
n = 0.767
R2 = 0.999
τ0 = 3.62
K = 0.0332
R2 = 0.988
K = 0.722
n = 0.540
R2 = 0.982
64.080.5τ0 = 1.56
K = 0.183
n = 0.759
R2 = 0.999
τ0 = 3.69
K = 0.0339
R2 = 0.987
K = 0.714
n = 0.545
R2 = 0.984
64.4100.2τ0 = 1.58
K = 0.188
n = 0.759
R2 = 1.00
τ0 = 3.77
K = 0.0347
R2 = 0.986
K = 0.736
n = 0.544
R2 = 0.984
64.7120.3τ0 = 1.53
K = 0.215
n = 0.743
R2 = 1.00
τ0 = 3.96
K = 0.0354
R2 = 0.985
K = 0.748
n = 0.547
R2 = 0.987
65.0140.6τ0 = 1.67
K = 0.230
n = 0.738
R2 = 1.00
τ0 = 4.24
K = 0.0366
R2 = 0.984
K = 0.824
n = 0.537
R2 = 0.986
78.2140.2τ0 = 2.75
K = 0.240
n = 0.726
R2 = 0.999
τ0 = 5.37
K = 0.0351
R2 = 0.982
K = 1.36
n = 0.458
R2 = 0.973
97.4140.4τ0 = 7.59
K = 0.228
n = 0.717
R2 = 0.999
τ0 = 10.0
K = 0.0312
R2 = 0.980
K = 4.30
n = 0.290
R2 = 0.925
117.5140.4τ0 = 21.1
K = 0.0481
n = 0.911
R2 = 0.977
τ0 = 21.6
K = 0.0259
R2 = 0.982
K = 15.5
n = 0.127
R2 = 0.729
138.2140.2τ0 = 39.9
K = 0.000500
n = 1.54
R2 = 0.869
τ0 = 38.5
K = 0.0208
R2 = 0.860
K = 35.3
n = 0.0467
R2 = 0.336
158.2140.1τ0 = 46.2
K = 0.0000000983
n = 2.76
R2 = 0.512
τ0 = 44.5
K = 0.0172
R2 = 0.473
K = 46.5
n = 0.0100
R2 = 0.0227

Appendix A.8. WB-NO 4

Temperature (°C)Pressure (MPa)Herschel–BulkleyBinghamPower-Law
22.80.1τ0 = 36.4
K = 0.159
n = 0.893
R2 = 1.00
τ0 = 38.2
K = 0.0751
R2 = 0.998
K = 22.8
n = 0.192
R2 = 0.821
64.920.2τ0 = 36.6
K = 0.0440
n = 0.956
R2 = 0.999
τ0 = 36.9
K = 0.0324
R2 = 0.999
K = 27.9
n = 0.104
R2 = 0.750
65.540.3τ0 = 36.6
K = 0.0463
n = 0.947
R2 = 0.999
τ0 = 36.9
K = 0.0319
R2 = 0.999
K = 27.9
n = 0.103
R2 = 0.753
66.160.3τ0 = 36.6
K = 0.0470
n = 0.947
R2 = 0.999
τ0 = 37.0
K = 0.0324
R2 = 0.999
K = 27.9
n = 0.104
R2 = 0.752
66.780.4τ0 = 36.6
K = 0.0512
n = 0.937
R2 = 1.00
τ0 = 37.0
K = 0.0331
R2 = 0.999
K = 27.8
n = 0.106
R2 = 0.757
67.2100.0τ0 = 36.8
K = 0.0496
n = 0.945
R2 = 0.999
τ0 = 37.2
K = 0.0339
R2 = 0.999
K = 27.8
n = 0.107
R2 = 0.755
67.7119.8τ0 = 36.8
K = 0.0538
n = 0.939
R2 = 1.00
τ0 = 37.2
K = 0.0351
R2 = 0.999
K = 27.6
n = 0.110
R2 = 0.759
88.7120.4τ0 = 37.5
K = 0.0412
n = 0.945
R2 = 1.00
τ0 = 37.8
K = 0.0281
R2 = 0.999
K = 29.5
n = 0.0908
R2 = 0.743
117.5120.5τ0 = 39.7
K = 0.0179
n = 1.02
R2 = 1.00
τ0 = 39.6
K = 0.0210
R2 = 1.00
K = 33.1
n = 0.0665
R2 = 0.694
146.8120.6τ0 = 42.5
K = 0.00636
n = 1.14
R2 = 0.998
τ0 = 42.2
K = 0.0166
R2 = 0.995
K = 37.1
n = 0.0489
R2 = 0.629
176.0120.8τ0 = 50.6
K = 0.0000466
n = 1.77
R2 = 0.869
τ0 = 49.9
K = 0.00920
R2 = 0.829
K = 48.4
n = 0.0172
R2 = 0.264

Appendix B. Model Algorithm Pseudocode

To achieve dynamic prediction of H-B rheological parameters under HTHP conditions, this study developed an iterative computational framework incorporating temperature–pressure coupling effects based on a hybrid LM&UGO algorithm. The proposed methodology operates through three core phases:
1. Thermodynamic parameter initialization of drilling fluids;
2. Spatial discretization solution for wellbore geometry;
3. Implicit iterative convergence of temperature-pressure fields.
The framework establishes a computational foundation for developing petroleum industry-specific software packages requiring high-fidelity wellbore modeling, particularly in extreme environments exceeding 273 °C/140 MPa.
1. Input Parameters:
• Drilling Parameters:
    H (Well depth, m)
    t_cycle (Circulation time, h)
    Q_surface (Surface flow rate, m3/s)
    T_surface (Surface temperature, °C)
    G_geo (Geothermal gradient, °C/m)
    ρ_mud0 (Surface drilling fluid density, kg/m3)

• Material Properties:
    λ_casing (Casing thermal conductivity, W/(m·°C))
    λ_cement (Cement sheath thermal conductivity, W/(m·°C))
    α_formation (Formation thermal diffusivity, m2/s)

•  Rheological Model:
     τ_y (Yield stress, Pa)
     K_consistency (Consistency index, Pa·s^n)
     n (Flow behavior index)

2. Spatial Discretization:
Δz = BC (Spatial step size, m)
N =〔H/Δz〕(Number of grid nodes)

•  Initialize 2D arrays:
P_annulus[N+1][200] (Annular pressure field, Pa)
P_pipe[N+1][200] (Drill pipe pressure field, Pa)
T_annulus[N+1][200] (Annular temperature field, °C)
T_pipe[N+1][200] (Drill pipe temperature field, °C)

3. Main Computation Loop (Temporal Iteration)
for t_step in 1 to 200:
  #Forward Sweep (Top→Bottom)
  for node in 0 to N:
             #Geometry Update
             D_pipe_in[node] = f_diameter(node·Δz, casing_spec)
             D_pipe_out[node] = f_diameter(node·Δz, drill_string_spec)
             D_annulus[node] = D_casing[node] D_pipe_out[node]
 #Mud Density Correction:
             P = P_annulus[node][t_step-1]
             T = T_annulus[node][t_step-1]

             if 1200 ≤ ρ_mud0 ≤ 1600:
                  ρ_mud = (ρ_mud0/1400) × 103 × exp(α1P + β1T + γ1PT)
             elif 1600 < ρ_mud0 ≤ 2000:
                  ρ_mud = (ρ_mud0/1800) × 103 × exp(α2P + β2T + γ2PT)
             else:
                  ρ_mud = (ρ_mud0/2400) × 103 × exp(α3P + β3T + γ3PT)
             #Herschel–Bulkley Model Update
             τ_eff = τ_y × Φ(T_annulus[node][t_step-1], P_annulus[node][t_step-1])
             K_eff = K_consistency × Ψ(T_annulus[node][t_step-1])
             n_eff = n × Θ(P_annulus[node][t_step-1])
             #Flow Regime Determination
             Re_annulus = (12^(1-n_eff) × ρ_mud × D_annulus[node]^n_eff × V_annulus^(2-n_eff)
                     / (K_eff × (3 + 1/n_eff)^n_eff)
             if Re_annulus < Re_critical:
                  ΔP_friction = (4 × K_eff × Δz)/D_annulus[node] × [(3n_eff + 1)/n_eff × V_annulus/D_annulus[node]]^n_eff
             else:
                  f = Newton-Raphson_Solver(ε/D_annulus[node], Re_annulus)
                  ΔP_friction = f × (ρ_mud × V_annulus2 × Δz)/(2 × D_annulus[node])
             #Pressure Update
             P_annulus[node+1][t_step] = P_annulus[node][t_step]
                        + ρ_mud × g × Δz × sinθ
                        + ΔP_friction
             #Thermal Calculation
              t_dimensionless = α_formation × t_cycle / D_annulus[node]^2
             if t_dimensionless ≤ 1.5:
                  T_dimensionless = 1.1281√t_dimensionless (1 0.3√t_dimensionless)
             else:
                  T_dimensionless = (0.4063 + 0.5 ln t_dimensionless)(1 + 0.6/t_dimensionless)

             T_pipe[node][t_step] = C1exp(-k1Δz) + C2exp(-k2Δz)
                         + (T_injection B·G_geo)
                         + G_geo·Δz

  # Backward Update (Bottom→Top)
  for node in N downto 1:
             # Similar friction calculation for pipe flow
             P_pipe[node-1][t_step] = P_pipe[node][t_step]
                            ρ_mud × g × Δz × sinθ
                            + ΔP_friction_pipe

   # Convergence Check
   if max(|T_annulus[:,t_step] T_annulus[:,t_step-1]|) < 1e-3:
             converged_step = t_step
             break

References

  1. Sun, J.; Yang, J.; Bai, Y.; Lyu, K.; Liu, F. Research Progress and Development of Deep and Ultra-Deep Drilling Fluid Technology. Pet. Explor. Dev. 2024, 51, 1022–1034. [Google Scholar] [CrossRef]
  2. Shen, A.; Hu, A.; Qiao, Z.; Zheng, J.; She, M.; Pan, L. Development and Preservation Mechanism of Deep and Ultra-Deep Carbonate Reservoirs. Sci. China Earth Sci. 2024, 67, 3367–3385. [Google Scholar] [CrossRef]
  3. Wang, C.; Feng, S.; Zhang, Z.; Zhou, B.; Lyu, X.; Zhou, B. Key Technologies for Drilling Design of Well Shendi Take-1. Pet. Drill. Tech. 2024, 52, 78–86. [Google Scholar] [CrossRef]
  4. Zhang, X.; Yan, K.; Zhong, Y. Seeking Answers from the Depths of the Earth: A Record of Southwest Oil and Gas Field’s Promotion of the Exploration of Chuanke-1 Well in Deep Strata. China Pet. News, 10 August 2023. [Google Scholar]
  5. Chavez, M.A.; Garcia, G.A.; Pogoson, O.; Li, Y.L.; Cardona, A.H.; Nelson, R.N. Lower Tertiary—A Fully Comprehensive Well Completion Design Methodology to Overcome Reservoir Challenges. In Proceedings of the SPE Artificial Lift Conference-Latin America and Caribbean, Salvador, Brazil, 27–28 May 2015; OnePetro: Baton Rouge, LA, USA, 2013. [Google Scholar]
  6. Sugisaki, R. Deep-Seated Gas Emission Induced by the Earth Tide: A Basic Observation for Geochemical Earthquake Prediction. Science 1981, 212, 1264–1266. [Google Scholar] [CrossRef] [PubMed]
  7. Pang, X.-Q.; Jia, C.-Z.; Wang, W.-Y. Petroleum Geology Features and Research Developments of Hydrocarbon Accumulation in Deep Petroliferous Basins. Pet. Sci. 2015, 12, 1–53. [Google Scholar] [CrossRef]
  8. Li, Q. Numerical Insights into Factors Affecting Collapse Behavior of Horizontal Wellbore in Clayey Silt Hydrate-Bearing Sediments and the Accompanying Control Strategy. Ocean Eng. 2024, 297, 117029. [Google Scholar] [CrossRef]
  9. Li, Q. Settling Behavior and Mechanism Analysis of Kaolinite as a Fracture Proppant of Hydrocarbon Reservoirs in CO2 Fracturing Fluid. Colloids Surf. A Physicochem. Eng. Asp. 2025, 724, 137463. [Google Scholar] [CrossRef]
  10. Zhang, H.; Fan, H.; Pang, S. Calculation Method of Drilling Fluid Rheological Parameters and Software Development for Field Application. West-China Explor. Eng. 2008, 20, 72–73. [Google Scholar]
  11. Karpenko, M. Aircraft Hydraulic Drive Energy Losses and Operation Delay Associated with the Pipeline and Fitting Connections. Aviation 2024, 28, 1–8. [Google Scholar] [CrossRef]
  12. Zhou, X.; Yu, P.; Qian, X. Optimization of rheological models for cationic polymer drilling fluid system. West-China Explor. Eng. 2009, 21, 43–44. [Google Scholar]
  13. Frigaard, I.A.; Paso, K.G.; de Souza Mendes, P.R. Bingham’s Model in the Oil and Gas Industry. Rheol. Acta 2017, 56, 259–282. [Google Scholar] [CrossRef]
  14. Demirdal, B.; Miska, S.; Takach, N.; Cunha, J.C. Drilling Fluids Rheological and Volumetric Characterization Under Downhole Conditions. In Proceedings of the SPE Latin America and Caribbean Petroleum Engineering Conference, Buenos Aires, Argentina, 15–18 April 2007; SPE: Buenos Aires, Argentina, 2007. SPE-108111-MS. [Google Scholar]
  15. Bailey, T.J.; Bern, P.A.; McEwan, F. Low-Toxicity Oil Muds: A Knowledge of Downhole Rheological Behavior Assists Successful Field Application. SPE Drill. Eng. 1986, 1, 107–114. [Google Scholar] [CrossRef]
  16. Politte, M.D. Invert Oil Mud Rheology as a Function of Temperature and Pressure; OnePetro: Baton Rouge, LA, USA, 1985. [Google Scholar]
  17. Srini-Vasan, S.A.C.G.; Gatlin, C. The Effect of Temperature on the Flow Properties of Clay-Water Drilling Muds. J. Pet. Technol. 1958, 10, 59–60. [Google Scholar] [CrossRef]
  18. McMordie, W.C., Jr.; Bennett, R.B.; Bland, R.G. The Effect of Temperature and Pressure on the Viscosity of Oil-Base Muds. J. Pet. Technol. 1975, 27, 884–886. [Google Scholar] [CrossRef]
  19. Fisk, J.V.; Jamison, D.E. Physical Properties of Drilling Fluids at High Temperatures and Pressures. SPE Drill. Eng. 1989, 4, 341–346. [Google Scholar] [CrossRef]
  20. Alderman, N.J.; Gavignet, A.; Guillot, D.; Maitland, G.C. High-Temperature, High-Pressure Rheology of Water-Based Muds; OnePetro: Houston, TX, USA, 1988; pp. 187–195. [Google Scholar]
  21. Jiang, G.; Wu, X.; Yan, J.; Wu, F.; Wang, S. Study on the Rheology Property of Water Based Drilling Fluid at High Temperature and High Pressure. Drill. Fluid Complet. Fluid 1994, 11, 21–26. [Google Scholar]
  22. Rommetveit, R.; Bjorkevoll, K.S. Temperature and Pressure Effects on Drilling Fluid Rheology and ECD in Very Deep Wells; OnePetro: Manama, Bahrain, 1997; pp. 297–305. [Google Scholar]
  23. Quitian-Ardila, L.H.; Andrade, D.E.V.; Franco, A.T. A Proposal for a Constitutive Equation Fitting Methodology for the Rheological Behavior of Drilling Fluids at Different Temperatures and High-Pressure Conditions. Geoenergy Sci. Eng. 2024, 233, 212570. [Google Scholar] [CrossRef]
  24. Rafieefar, A.; Sharif, F.; Hashemi, A.; Bazargan, A.M. Rheological Behavior and Filtration of Water-Based Drilling Fluids Containing Graphene Oxide: Experimental Measurement, Mechanistic Understanding, and Modeling. ACS Omega 2021, 6, 29905–29920. [Google Scholar] [CrossRef] [PubMed]
  25. Fakoya, M.F.; Ahmed, R.M. A Generalized Model for Apparent Viscosity of Oil-Based Muds. J. Pet. Sci. Eng. 2018, 165, 777–785. [Google Scholar] [CrossRef]
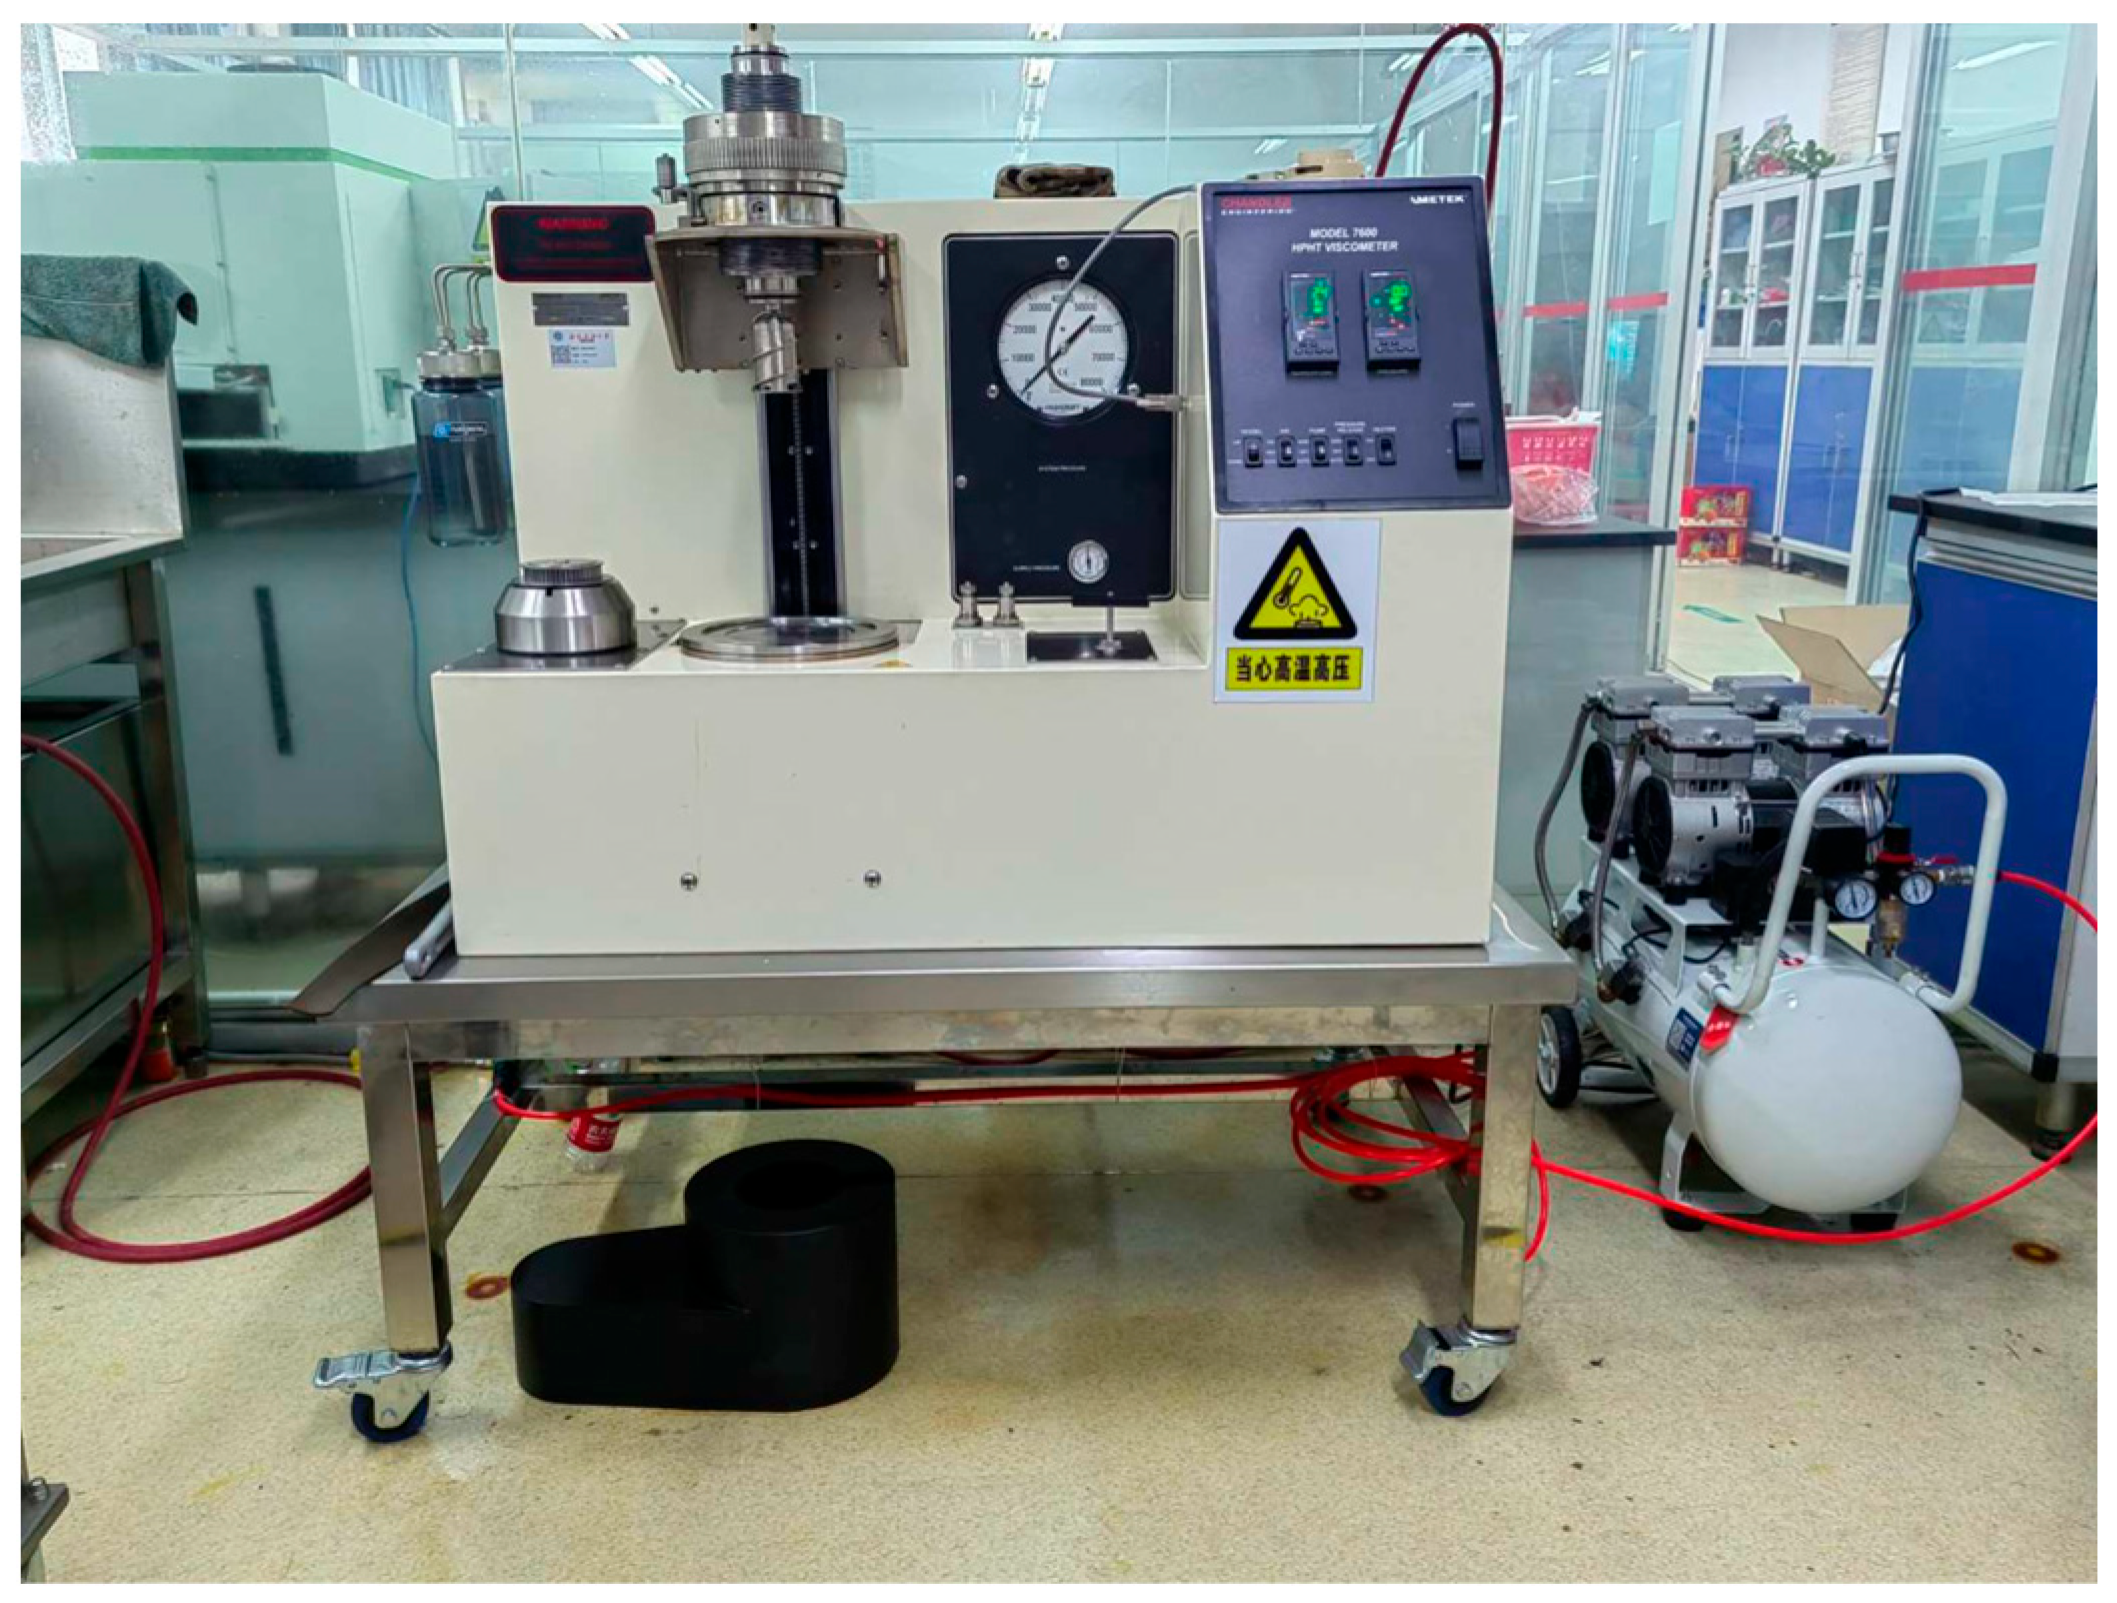
Figure 1. Chandler 7600 HTHP rheometer.
Energies 18 04687 g001
Figure 2. Test process of high temperature and high pressure rheology of drilling fluid.
Energies 18 04687 g002
Figure 3. Rheological curves of oil-based drilling fluid no. 1 under different temperatures and pressures: subfigure (a) presents results where temperature is the variable parameter under distinct pressure conditions. Subfigure (b). displays data where pressure varies across different temperatures.
Energies 18 04687 g003
Figure 4. Rheological curves of oil-based drilling fluid no. 2 under different temperatures and pressures: subfigure (a) presents results where temperature is the variable parameter under distinct pressure conditions. Subfigure (b) displays data where pressure varies across different temperatures.
Energies 18 04687 g004
Figure 5. Rheological curves of oil-based drilling fluid no. 3 under different temperatures and pressures: subfigure (a) presents results where temperature is the variable parameter under distinct pressure conditions. Subfigure (b) displays data where pressure varies across different temperatures.
Energies 18 04687 g005
Figure 6. Rheological curves of oil-based drilling fluid no. 4 under different temperatures and pressures: subfigure (a) presents results where temperature is the variable parameter under distinct pressure conditions. Subfigure (b) displays data where pressure varies across different temperatures.
Energies 18 04687 g006
Figure 7. Rheological curves of water-based drilling fluid no. 1 under different temperatures and pressures: subfigure (a) presents results where temperature is the variable parameter under distinct pressure conditions. Subfigure (b) displays data where pressure varies across different temperatures.
Energies 18 04687 g007
Figure 8. Rheological curves of water-based drilling fluid no. 2 under different temperatures and pressures: subfigure (a) presents results where temperature is the variable parameter under distinct pressure conditions. Subfigure (b) displays data where pressure varies across different temperatures.
Energies 18 04687 g008
Figure 9. Rheological curves of water-based drilling fluid no. 3 under different temperatures and pressures: subfigure (a) presents results where temperature is the variable parameter under distinct pressure conditions. Subfigure (b) displays data where pressure varies across different temperatures.
Energies 18 04687 g009
Figure 10. The gel-like morphology of no. 3 water-based drilling fluid after the experiment.
Energies 18 04687 g010
Figure 11. Rheological curves of water-based drilling fluid no. 4 under different temperatures and pressures: subfigure (a) presents results where temperature is the variable parameter under distinct pressure conditions. Subfigure (b) displays data where pressure varies across different temperatures.
Energies 18 04687 g011
Table 1. Experimental Parameters of oil-based and water-based drilling fluids: density, temperature and pressure.
Types of Drilling FluidsNumberDensity (g/cm3)Temperature (°C)Pressure (MPa)
Oil-basedOB-11.0025~1100.1~120
OB-21.5725~1800.1~140
OB-32.0825~2470.1~140
OB-42.2525~2470.1~140
Water-basedWB-11.5425~1600.1~120
WB-21.7025~1750.1~120
WB-31.8225~1200.1~140
WB-42.1525~1200.1~140
Table 2. Herschel–Bulkley model parameters of the water-based drilling fluid under validated temperature-pressure conditions.
Temperature (°C)Pressure (MPa)τ0knR2
20.580.102.2070.0005.9240.994
69.1720.303.8300.0171.0310.998
69.9040.173.6710.0171.0320.998
70.5860.653.4760.0181.0250.997
69.7880.573.4350.0181.0300.997
69.93100.283.3290.0181.0240.997
70.85120.493.1300.0221.0000.997
70.85140.383.1200.0250.9860.996
79.86140.634.6030.0191.0110.999
97.95140.599.9080.0061.1420.989
Table 3. Comparison of predicted vs. experimental Herschel–Bulkley parameters using Equation (4).
CoefficientsABCDER2
H-B Parameter
τ00.238−1.918 × 10−23.582 × 10−4−3.930 × 10−31.318 × 10−50.998
K−3.0080.212−1.567 × 10⁻³−3.799 × 10−34.136 × 10−50.994
n1.471−8.208 × 10−25.151 × 10−46.159 × 10⁻⁶−6.161 × 10−70.999
Disclaimer/Publisher’s Note: The statements, opinions and data contained in all publications are solely those of the individual author(s) and contributor(s) and not of MDPI and/or the editor(s). MDPI and/or the editor(s) disclaim responsibility for any injury to people or property resulting from any ideas, methods, instructions or products referred to in the content.