1. Introduction
The global energy system is in the midst of a critical transformation, fundamentally driven by the imperative to mitigate anthropogenic climate change and achieve the objectives outlined in the Paris Agreement, particularly the goal of limiting global warming to 1.5 °C above pre-industrial levels. The Intergovernmental Panel on Climate Change (IPCC) reports that human-induced warming has already reached 1.1 °C, precipitating unprecedented climatic shifts [
1]. To remain within the 1.5 °C threshold, global greenhouse gas (GHG) emissions must peak before 2025 and subsequently decline dramatically. This narrow timeframe underscores the critical inadequacy of current policy and deployment inertia, demanding immediate and systemic acceleration of mitigation efforts. Decarbonizing the electricity sector is of paramount importance in this endeavor, necessitating a swift transition from fossil fuels to renewable energy sources (RESs). The International Energy Agency (IEA) has characterized this shift as the dawn of an “Age of Electricity,” where cleaner energy sources [
2], predominantly wind and solar power, are poised to dominate the future energy landscape. This transition signifies more than a mere fuel substitution; it implies a fundamental restructuring of energy governance, market designs, and infrastructure, presenting both substantial opportunities and significant transitional complexities.
In recent years, the deployment of renewable electricity generation technologies, especially solar photovoltaics (PV) and wind power, has experienced record global growth. Within the European Union (EU), renewable sources accounted for an estimated 24.1% of the final energy use in 2023, with the bloc having successfully met its 20% renewable energy target for 2020 [
3]. Technological advancements have dramatically reduced the costs associated with RES. Solar PV, for example, is now the most economical power generation technology in many regions, and innovations continue to enhance efficiency, such as the development of N-type solar cells and larger, more powerful wind turbines. In 2023, the average power rating for new onshore wind turbines installed in Europe reached 4.5 MW, while new offshore turbines averaged 9.7 MW [
4]. Despite this progress and the increasing cost competitiveness of renewables, current deployment rates are insufficient to meet more ambitious targets, such as the EU’s revised goal of at least 42.5% (aspiring to 45%) renewables in gross final energy consumption by 2030 [
5]. The International Renewable Energy Agency (IRENA) cautions that the global energy transition remains “off course” and that achieving the 1.5 °C target necessitates tripling global renewable power capacity by 2030 [
6]. Persistent challenges, including grid integration complexities, the intermittency of variable RESs, protracted permitting procedures, and supply chain vulnerabilities, continue to impede progress. The rapid cost declines and technological improvements might foster a misleading perception of an effortless transition, obscuring the profound systemic and institutional changes—such as grid infrastructure modernization, market redesign, and ensuring social acceptance—that are crucial for the large-scale integration of variable RESs. Furthermore, the EU’s ambitious renewable energy targets are increasingly intertwined with broader industrial and geopolitical strategies, such as those articulated in the REPowerEU plan [
7], which aim to bolster energy independence and technological leadership, thereby adding layers of complexity and urgency to the transition.
The imperative to escalate renewable generation is further intensified by the emergence of substantial new sources of electricity demand. The electrification of the transport sector, driven by the increasing adoption of electric vehicles (EVs), represents a significant factor. Projections indicate that EVs could constitute over 4% of the European electricity demand by 2030, potentially increasing to 9.5% by 2050 [
8]. Ideally, the charging process of EVs should be controlled to allow balancing consumption and generation when using intermittent RESs [
9]. This requires optimization and machine learning algorithms capable of adapting consumption with generation while respecting user preferences [
10].
Simultaneously, the rapid advancement and widespread adoption of artificial intelligence (AI) are fueling an unprecedented surge in energy consumption from data centers and associated computational processes. The IEA projects that global electricity demand from data centers will more than double by 2030 [
11], reaching approximately 945 TWh, with AI identified as the primary driver of this growth. In advanced economies, data centers are anticipated to drive over 20% of the electricity demand growth by 2030, and some analyses suggest AI could account for 4–5% of the total European electricity demand by that year [
12]. The EU AI Act acknowledges this growing energy footprint by mandating transparency requirements for general-purpose AI models. This concurrent escalation in demand from EVs and AI presents a formidable challenge for electricity systems, potentially offsetting some emissions benefits derived from transport electrification if the new demand is not predominantly met by additional renewable capacity. This underscores the critical importance of the pace of renewable deployment. While AI itself is a significant new energy consumer, it concurrently offers substantial potential for optimizing energy systems, including the combined management between EV charging and renewable energy sources [
13]. This duality creates a complex interplay where AI could be instrumental in solving challenges it simultaneously exacerbates.
In this context of increasing demand and the pressing need for accelerated, decentralized renewable deployment, Renewable Energy Communities (RECs) and Citizen Energy Communities (CECs) are gaining prominence as significant actors, particularly within the EU. The EU’s Clean Energy for all Europeans Package [
14], encompassing the revised Renewable Energy Directive (RED II and its 2023 amendment) and the Electricity Market Design Directive, establishes a legal framework for their formation and operation. RECs offer considerable potential for enhancing public acceptance of renewable energy projects, mobilizing private investment, and fostering local energy democracy and participation. The EU’s formal recognition of RECs represents a distinctive governance experiment in decentralizing energy systems; however, their success is contingent upon overcoming substantial barriers such as grid access, financing, and complex administrative procedures. These communities could play a pivotal role in managing local grid impacts from EV charging and integrating distributed energy resources [
15], particularly if empowered by smart technologies and AI-driven optimization tools. The “social innovation” dimension of RECs, including their capacity to engage diverse local actors and address issues such as energy poverty, is critical for ensuring a just and equitable energy transition.
The ongoing and desirable increase in demand for electrical energy should be met with an increased generation from RESs. This, in turn, requires a rigorous evaluation of investment paybacks in RESs and the resulting cost of energy for businesses and household consumers. The evaluation of these metrics in different countries supports informed decision-making by consumers and policymakers. This is the scope of this paper—its main contribution is a comparative economic assessment of photovoltaic investments in different European countries, with a special focus on the Iberian Peninsula. In this context, the objective of this study is to evaluate the profitability of investments in PV generation, through economic metrics, in different European countries.
The rest of this article is organized into five sections that guide the reader through a comprehensive analysis of the economic viability of photovoltaic investments in Europe.
Section 2 performs a systematic review of the existing literature, identifying critical gaps in previous studies, particularly the lack of robust comparative analyses between European countries on the economic aspects of photovoltaic energy investments.
Section 3 presents the main economic indicators commonly used in the evaluation of renewable energy investments, including the payback period, the Levelized Cost of Electricity (LCOE), the Net Present Value (NPV), the Internal Rate of Return (IRR), and the return on investment (ROI), as well as the factors that influence these parameters. Then,
Section 4 presents the results obtained in this study, with an in-depth comparative analysis between several European countries, with special emphasis on the cases of Portugal and Spain, in the Iberian Peninsula.
Section 5 discusses the obtained results, analyzing in depth how factors such as solar irradiation, energy costs, and self-consumption rates affect the economic viability of photovoltaic projects in different geographical contexts. Finally,
Section 6 concludes this paper with a summary of the main results of this study.
2. Background Analysis
The global energy transition has boosted the role of solar PV as a central element in decarbonization efforts, with record growth in 2024 between 554 and 602 GW of new installations. China leads this advance with 357 GW, accounting for more than 60% of the global expansion, while the European Union contributed 63 GW and the United States 47 GW [
16]. With a global cumulative capacity of more than 2.2 TW, the PV sector has been dominated by large utility projects (67%), although increasing solar penetration in countries such as Greece (27.9%) has highlighted challenges to grid stability, requiring policy adaptations, storage investments, and new business models to deal with price volatility and production overcapacity [
16].
However, PV adoption varies markedly across Europe due to divergent policy frameworks, solar resources, and market structures. Comparative studies reveal that Southern European countries (e.g., Spain, Italy, Greece) benefit from higher irradiation but have faced legislative instability (e.g., retroactive feed-in tariff cuts), while Northern European nations (e.g., Germany, the Netherlands) compensate for lower sunlight with robust incentives, net metering schemes, and innovative financing models [
17,
18]. Cross-country benchmarking further shows that although the LCOE for PV is lower in sunnier regions, Northern Europe achieves competitiveness through economies of scale and regulatory support [
19,
20].
Technological advancement has been decisive for the reduction in the LCOE, particularly with the evolution of Passivated Emitter and Rear Cell (PERC) solar cells, which achieved market dominance in 2018. Innovations such as passivation with Al
2O
3; and laser-fired contacts have made it possible to raise the average efficiency from 20% (2011) to 23.4% (2023) while reducing CAPEX and OPEX, directly affecting the LCOE in European projects [
21]. The industrialization of bifacial modules and cells in half units has also contributed to economic gains, although new challenges arise with competition from Tunnel Oxide Passivated Contact (TOPCon) technologies and regulatory limitations in mature markets, such as Germany and Spain [
21].
The application of the LCOE as a reference metric for economic evaluation of photovoltaic projects has been widely recognized by institutions such as the National Renewable Energy Laboratory (NREL), which demonstrates its effectiveness, especially in technologies with low technological risks and predictable revenues [
22]. However, the progressive discontinuation of tax incentives may jeopardize this competitiveness by 2030, which underscores the importance of complementary analysis tools.
In Europe, the Horizon Europe program and the European Green Deal seek to mitigate these gaps by focusing on innovation and renewable integration, even as private sector underfunding continues to limit the scale of clean projects, especially in critical commercialization phases (“valley of death”) [
23,
24].
Within this broader transition context, a number of recent reports and comparative analyses have deepened the understanding of photovoltaic adoption across Europe. At this level, the IEA PVPS Task 1 reports—including the “Trends in Photovoltaic Applications 2024” and the “Snapshot of Global PV Markets 2025”—provide annual country-level data on capacity, system prices, and policy frameworks [
25,
26]. For utility-scale installations, the Joint Research Centre (JRC) of the European Commission has projected significant reductions in the LCOE by 2050, with values expected to reach nearly EUR 0.020/kWh in Northern Europe and EUR 0.020/kWh in Southern Europe [
27]. Additional statistical insights are found in the Fraunhofer ISE Photovoltaics Report 2025 [
28] and Solar Power Europe’s EU Market Outlook 2024–2028 [
29], both of which quantify the regional distribution of new installations. Ember’s European Electricity Review 2025 further highlights the weight of PV in national electricity mixes [
30]. On the academic side, Bessin et al. [
31] and Alghanem et al. [
32] examine locational determinants and regional capacity dynamics, respectively, reinforcing the observed south–north asymmetries in deployment. Complementary snapshots by Jäger-Waldau [
33] provide yearly capacity series, while Kakoulaki et al. [
34] assess PV potential in European infrastructure, including associated LCOE scenarios. Finally, Fraunhofer’s LCOE studies [
35] and Lebedeva et al. [
36] deliver robust benchmarks on PV costs, with the latter focusing on the Baltic states as a Northern European case study. In this context,
Table 1 presents a comparative assessment of the gaps identified in previous studies. Although numerous works have investigated the economic viability of solar PV, few have provided a systematic cross-national analysis within the European context.
The systematic review of the studies in
Table 1 highlights three central paradigms in the diffusion of photovoltaic systems in Europe, marked by geographical and institutional asymmetries. The first refers to the dichotomy between energy potential and regulatory stability. Southern regions, such as Spain, Italy, and Greece, have solar irradiation levels up to 30% higher than those in the north, with annual averages above 1800 kWh/m
2. However, this natural advantage is mitigated by legislative instability, exemplified by retroactive feed-in tariff (FITs) cuts in Spain (2013) and recurrent revisions of support mechanisms in Italy. In contrast, northern countries, such as Germany and the Netherlands, have consolidated robust institutional frameworks, with competitive auctions associated with long-term Power Purchase Agreements (PPAs), optimized Net Energy Metering (NEM) schemes for residential prosumers, and energy community models with broad citizen participation. The second paradigm relates to the evolution of the LCOE. Data from the Joint Research Centre and Fraunhofer ISE point to strong convergence, with inter-regional disparities that, from 150% in 2020, are expected to be reduced to around 50% by 2050. This trend stems from economies of scale in utility-scale projects (>10 MW) in the north, advances in bifacial modules and single-axis tracking systems, and regulations that internalize systemic externalities. The third refers to technological complementarity between regions. While the south concentrates 58% of the installed capacity in large-scale solar parks (average of 25 MW), the north leads the diffusion of distributed systems (<1 MW), with incorporation rates of stationary storage above 65% in new connections. These findings point to three strategic directions for the European energy transition: transnational harmonization of regulatory instruments, acceleration of technology transfer via collaborative platforms, and development of hybrid architectures capable of integrating regional comparative advantages. Overcoming the identified asymmetries requires multi-scale approaches that articulate technical, economic, and institutional dimensions, ensuring coherence with the objectives of the European Green Deal.
Despite the central role of the LCOE, several studies highlight the need to adapt this metric to the specific contexts of RECs. At this level, study [
37] proposes an extension of the LCOE to these environments, using the Taylor Series Expansion (TSE) and Monte Carlo simulations to quantify the impact of uncertainties. It is identified that the purchase/sale price of electricity, the annual load, and self-consumption rates are the most determining factors for the variability in the LCOE in the Spanish and Italian contexts.
In a similar way, ref. [
38] presents an optimization model for the sizing of PV/wind systems in CERs, showing that the relationship between the LCOE and the Market Clearing Price (MCP) can be optimized by complementarity between resources and local consumption patterns. On the other hand, ref. [
39] introduces the concept of “permissible LCOE”, used to evaluate technologies in remote communities in Canada, and shows that, even with high capital costs, wave energy can be viable when environmental and social impacts are considered. In markets with high penetration of variable sources, ref. [
40] warns of the limitations of the traditional LCOE and proposes the Cost of Valued Energy (COVE), which incorporates the devaluation of generation at times of lower demand—being particularly relevant in markets such as Germany and California.
Besides the LCOE, the payback period metric has also been widely used as a decisive tool to assess the feasibility of PV projects. Study [
41], focusing on Cagliari (Italy), demonstrates that public policies, such as Ecobonus 50%, reduce payback time to 8–11 years when combined with storage systems. By contrast, in the Austrian case analyzed by [
42], even with energy sharing between neighbors, annual gains (between EUR 9 and EUR 172) remain modest, and economic viability depends on very low take-up rates. Study [
43], based on data from the United Kingdom and the Netherlands, compares models of self-investment and third-party investment, showing that, although the 15-year payback is acceptable for external investors, community members can enjoy almost free energy after this period, bearing only operating costs. More sophisticated approaches to energy management have shown a direct impact on both payback and self-consumption (SC) rates. Study [
44], carried out in Barcelona, uses genetic algorithms to optimize the distribution of energy among community members, achieving 100% self-consumption and an average payback of only 2.8 years. However, the rigidity of Spanish regulations—which restrict the updating of sharing coefficients—may limit this efficiency in the face of variable consumption patterns.
The concept of collective self-consumption, consolidated with the EU’s Clean Energy Package, has gained prominence as an axis for democratizing the energy transition. Study [
45] shows that European legislation protects self-consumers against excessive burdens and ensures fair remuneration for surpluses, although there are significant differences in its implementation between Member States. While Spain, France, and Portugal already allowed forms of collective self-consumption before the European legislation, countries such as Greece and Germany have adopted more specific models, such as “virtual net metering” and the “Tenant electricity model” [
45].
From a technical point of view, the use of dynamic algorithms shows promise for the efficient management of shared energy. Study [
46] compares five methods applied in Italian contexts, concluding that models based on temporal correlation between consumption and production or penalization of overconsumption promote more sustainable consumption patterns than simple proportional distribution. In addition, ref. [
47] explores artificial intelligence techniques to predict consumption generation and profiles, showing that while these tools increase the potential for self-consumption (SC and SS), their effectiveness depends on behavioral and contextual factors, as evidenced in the pilot project in Belgium during the pandemic. Finally, study [
48] presents the SIMUL-REC framework for CER modeling, applied in Lignano Sabbiadoro (Italy), and introduces relevant distinctions between direct self-consumption and virtual shared energy, the latter representing 57.5% of the total self-consumption in the case studied. The Italian model, with premium tariffs applied to shared energy, emerges as an effective example of how regulatory frameworks can encourage photovoltaic investment in local communities. The analysis of the previous literature reveals three fundamental pillars for an effective comparative economic evaluation of photovoltaic investments in Europe: (1) the adaptation of metrics such as the LCOE to different technical and regulatory contexts, (2) the consideration of payback as an indicator of attractiveness under different financing models, and (3) the accurate quantification of self-consumption rates, including virtual sharing models and artificial intelligence.
However, important gaps persist, such as the scarcity of comparative studies between Member States, the underrepresentation of Southern European countries, such as Portugal and Spain, and the absence of standardized financial metrics that simultaneously integrate technical feasibility and economic return under different tariff structures [
16,
49,
50,
51,
52]. In this context,
Table 2 presents a comparative analysis of the gaps identified in relation to the existing coverage in previous studies. While several studies have examined the economic viability of solar PV, few provide a systematic analysis among European nations.
This research fills these gaps by offering a complete assessment of the profitability of investments in solar PV, focusing on the LCOE and the payback period. Different levels of self-consumption ratios are considered, allowing a more informed decision on the investment potential.
3. Evaluation Metrics of Photovoltaic Installations
Different metrics are used to make informed investment decisions in photovoltaic installations, namely, the payback period [
53], the LCOE [
40], the NPV [
54], the IRR [
54], and the ROI [
55]. In the following, we describe each one of these metrics.
The payback period [
56] is a statistical measure that estimates the time needed for the savings generated by the production of solar energy to equal the cost of investment. The calculation of the payback period requires obtaining the energy generated per Wp installed, which depends on its geographical location, the installed capacity, the installation costs, the consumption pattern of the installation, the price and tariff rates of buying and selling electricity from a certain DSO, the efficiency of the system, and the maintenance costs. Having surpluses of renewable energy negatively affects the payback period, as the selling price is normally much lower than the buying price, or zero.
So, the sizing of a photovoltaic system must be based on the user’s energy consumption, evaluating not only the degree of self-sufficiency but also of self-consumption. The degree of self-sufficiency indicates the proportion of the energy consumed that is generated by the photovoltaic system. The degree of self-consumption, on the other hand, refers to the amount of energy generated that is consumed on site, without being exported to the grid.
The sizing process involves analyzing the annual energy consumption and the production capacity of the system, considering factors such as location, the efficiency of the panels, and the available area.
The basic equation for calculating the payback period consists of dividing the initial investment cost by the annual cash inflow or savings generated by the project [
57]. However, since the
Payback Periods often involve fractions of years, a more practical equation is:
where the
Annual Savings translate the monetary benefit gained in each year from the investment, compared to the baseline situation and the
Annual Maintenance Costs translate the annual ongoing costs to maintain the investment running properly.
The LCOE [
40] is a measure used to evaluate the average cost of electricity production over the lifetime of an energy system. The calculation of the LCOE requires information on the
Value of Costs and
Value of Energy per year according to:
In turn, the calculation of these values requires the values for the
Initial Investment,
Annual Maintenance Cost, and
Discount Rate. It is important to note that, for the calculation of the
Value of Costs, the initial investment is only considered in the first year since the investment takes place only at the beginning of the photovoltaic system installation.
The NPV [
54] calculates the present value of all expected cash inflows and outflows associated with a project, discounted at a specified rate, that reflects the time value of money. It helps investors determine if an investment will generate positive or negative returns over its lifetime. However, the long-term nature of RES investments can affect the reliability of traditional indicators like the NPV. Its calculation requires information about the discount rate, the initial cost of the investment, and the useful life of the system.
The IRR [
54] is the discount rate that makes the NPV of all cash flows from a project equal to zero. It represents the effective rate of return that an investment is expected to yield and helps assess a project’s potential for generating long-term returns and compare it with other investment opportunities. The IRR is also used in determining the Early Adopter Cost of Energy (CoE), with target rates of 12–20% observed in various early-stage renewable energy projects. To calculate this method, it is necessary to take into account the price of electricity, the initial investment, and the maintenance fee.
The ROI [
55] measures the profitability of an investment by comparing the net profit to the initial investment cost. It is often used to compare the efficiency of different projects and assess their overall financial performance. ROI models for renewable energy should include the effects of technology on both revenue increases and cost avoidances. A related concept is the Energy Return on Investment (EROI), which assesses the efficiency and economic viability of energy-producing systems by comparing the energy produced to the energy used in the production process. For this method, information about the net profit and the initial cost of the investment is required. The ROI has some limitations, such as a lack of consideration of time value, making it less effective for long-term evaluations.
The payback period and the LCOE are commonly used [
58] to assess the feasibility of photovoltaic systems, as they provide a simple and accurate analysis of the time needed to recover the initial investment and the real cost of the energy generated over the life of the system. In turn, metrics such as the ROI, NPV, and IRR are more complex, depend heavily on financial assumptions, and are less effective in assessing the economic competitiveness of a solar system in the long term.
4. Economic Assessment of PV Investments Across European Countries
In this section, we present a comprehensive analysis of the economic and technical feasibility of photovoltaic systems across several European countries, including Portugal, Spain, France, the Netherlands, Germany, Ireland, Austria, Bulgaria, Czechia, Estonia, Belgium, Romania, Poland, Luxembourg, Cyprus, Hungary, Slovakia, Denmark, Slovenia, Greece, Italy, and the United Kingdom. A particular emphasis is given to the Iberian Peninsula. It is important to note that for the calculation of the values in Europe, the capitals of each country were used as a reference.
This study evaluates solar energy generation potential, investment costs, energy prices, and self-consumption rates, considering both household and non-household consumers. We assess the performance of photovoltaic installations by calculating key indicators, such as the payback period and the LCOE, using data specific to each country. By exploring various self-consumption scenarios and incorporating factors like efficiency and maintenance costs, this section provides an in-depth understanding of the financial viability of solar energy systems across different regions of Europe.
One of the important parameters that contributes to the payback of an installation is the energy cost in each country, which is used to calculate the annual savings.
To assess these costs, information from [
59] was used, which translates the average price of energy (in euros per kWh) for both household and non-household consumers in 2024. Residential consumers, also called household consumers, were classified as having an annual consumption between 2500 kWh and 5000 kWh. Non-household consumers were defined, for the purpose of this article, as medium-sized consumers with an annual consumption between 500 MWh and 2000 MWh. At this level,
Table 3 presents some of the energy costs in different countries considered in this study. It should be noted that the cost of electricity for household consumers is generally higher than for non-household consumers, except in the case of Hungary. Constant electricity prices over the PV system lifetime were used since significant variability in market prices over the last years made it difficult to estimate future values.
The cost of the initial investment of a photovoltaic installation (in euros per kWp) in each of the countries was also required. To obtain it, data from [
60,
61,
62] were used, which encompassed all the countries in our study.
To determine the installation costs, it was necessary to use three sources, since a single reference does not include all the study regions. The cost, expressed in American dollars per kWp, was converted to euros per kWp, based on the exchange rate corresponding to the reference year. For countries like Portugal, Spain, Belgium, France, the Netherlands, Romania, Germany, Poland, Ireland, Luxembourg, Austria, Cyprus, Bulgaria, Hungary, Czechia, Slovakia, and Estonia, the 2023 exchange rate (USD 1 = EUR 0.924) was used. In the rest of the countries, the 2022 rate was used (USD 1 = EUR 0.951).
Table 4 presents some of the installation costs for the consumer premises considered in this study.
The economic analysis of the project considers three essential parameters, namely, efficiency, maintenance costs, and self-consumption ratios of photovoltaic systems, assuming uniform values for all regions under study. The efficiency of the photovoltaic installations was adjusted to 80%, accounting for several losses caused by inverter conversion losses, temperature effects in panels, wiring and connection losses, soiling, shading, and mismatch losses between modules. An annual loss of efficiency of 0.5% was also considered to reflect the gradual degradation of photovoltaic output over time. The maintenance cost rate was set to 3% [
63] of the initial investment, as photovoltaic systems require low maintenance. Self-consumption corresponded to the direct use of the electricity produced at the installation site.
One important factor affecting the payback period is the percentage of self-consumption. Values closer to 100% will result in shorter payback periods, so the dimensioning of the PV system must be performed carefully, according to the consumption profile of the installation [
64]. In order to estimate it, actual data for the whole of the European Union were used from [
65]. As some of the countries included in our study did not have data available, it was not possible to estimate individual values per country. The self-consumption value was estimated at three levels: (1) 63.55% for non-household consumers and (2) 40.14% for household consumers, in the real scenario, and (3) 100% in the ideal scenario. For the purpose of this study, we assumed that revenues from selling excess electricity can be disregarded as negligible.
Self-consumption rates can vary significantly in different consumers, countries, and policy environments. As lower rates negatively impact the return period of investments, it is advisable to take into consideration consumer and local generation patterns to compute the values of payback periods that are more aligned with the actual facility.
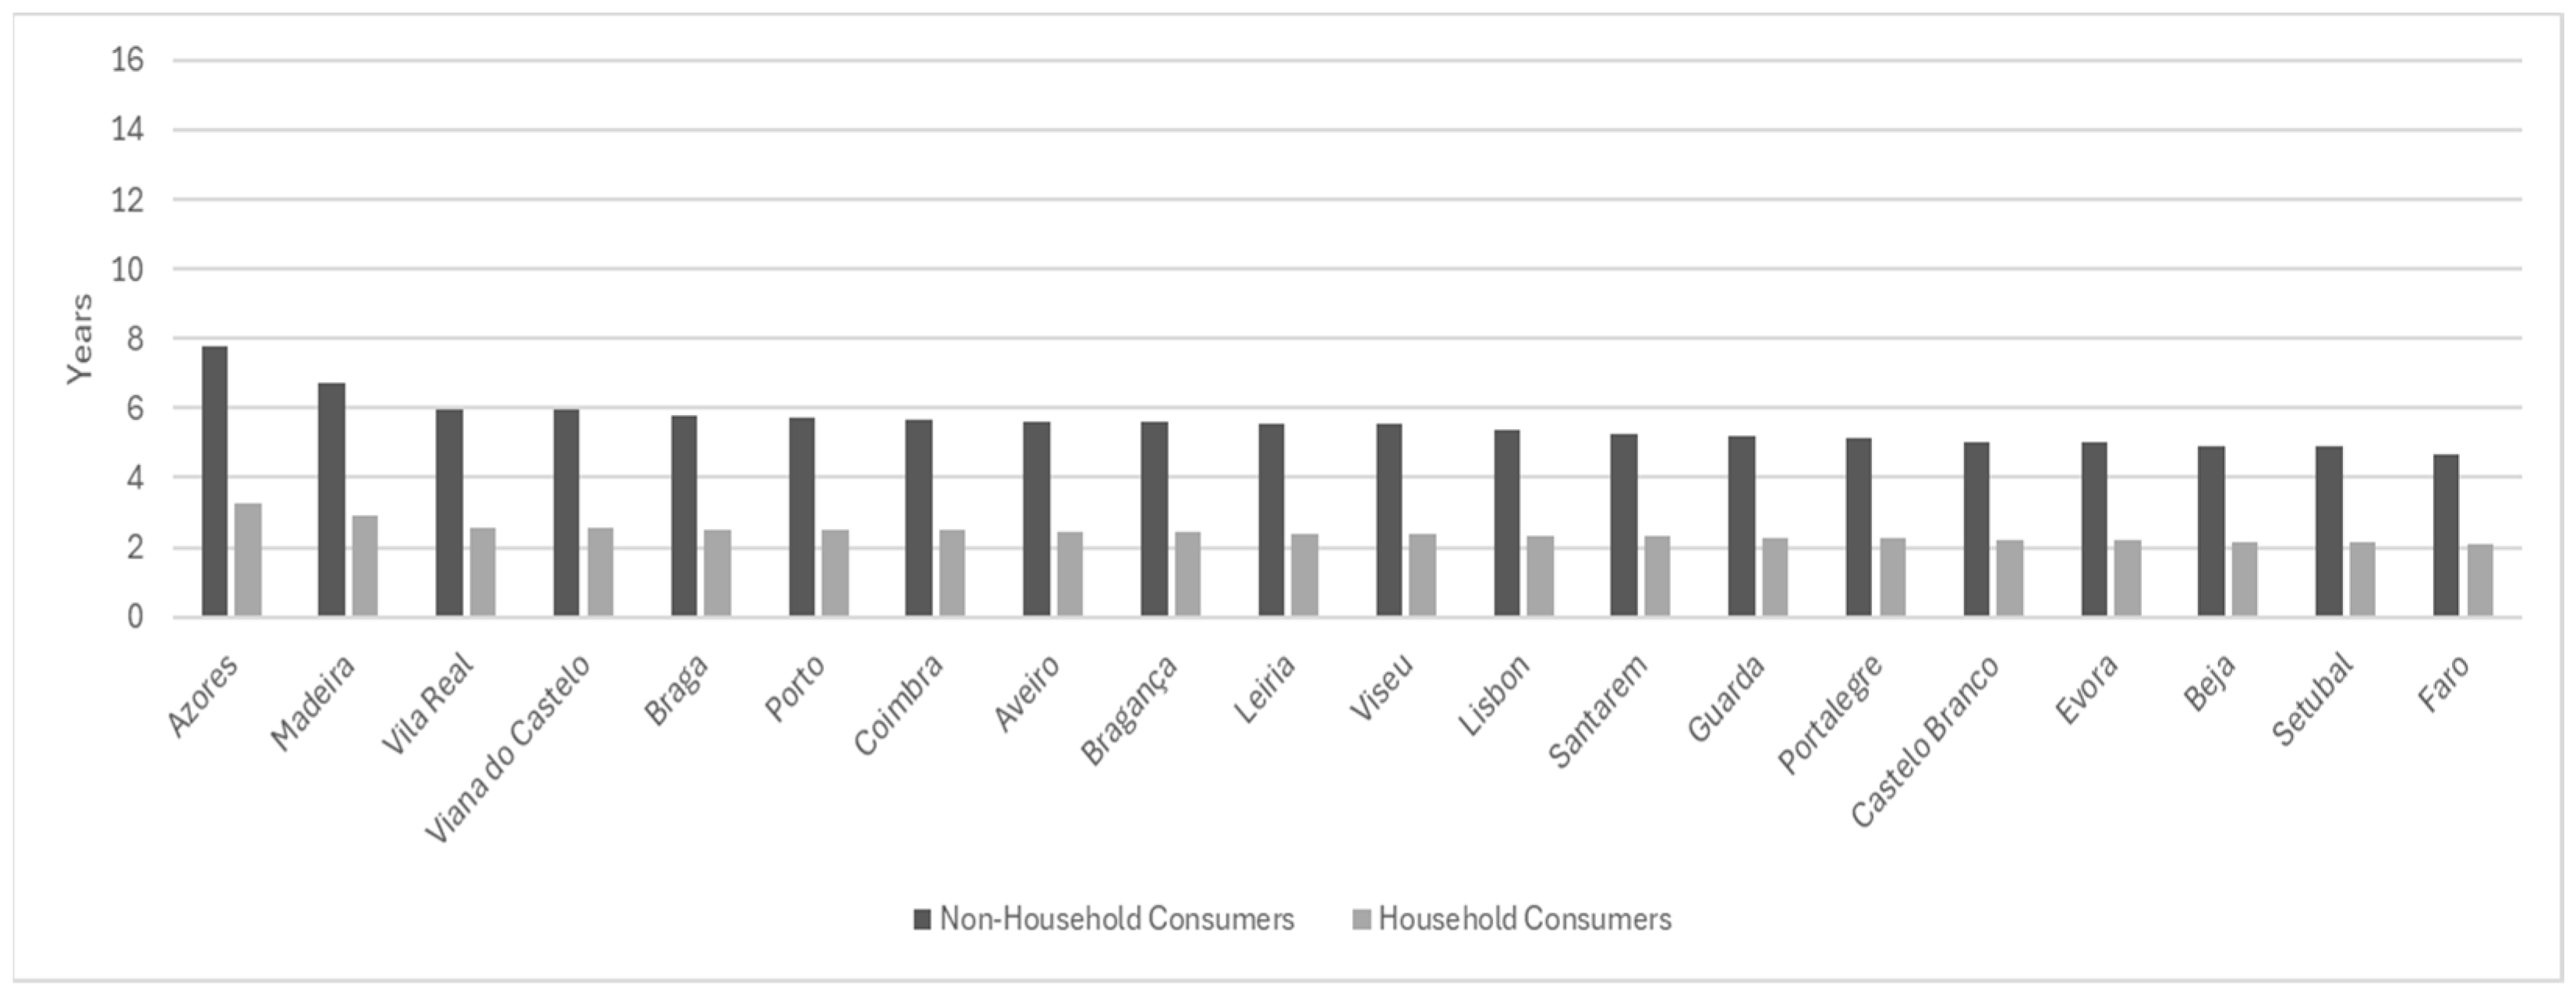
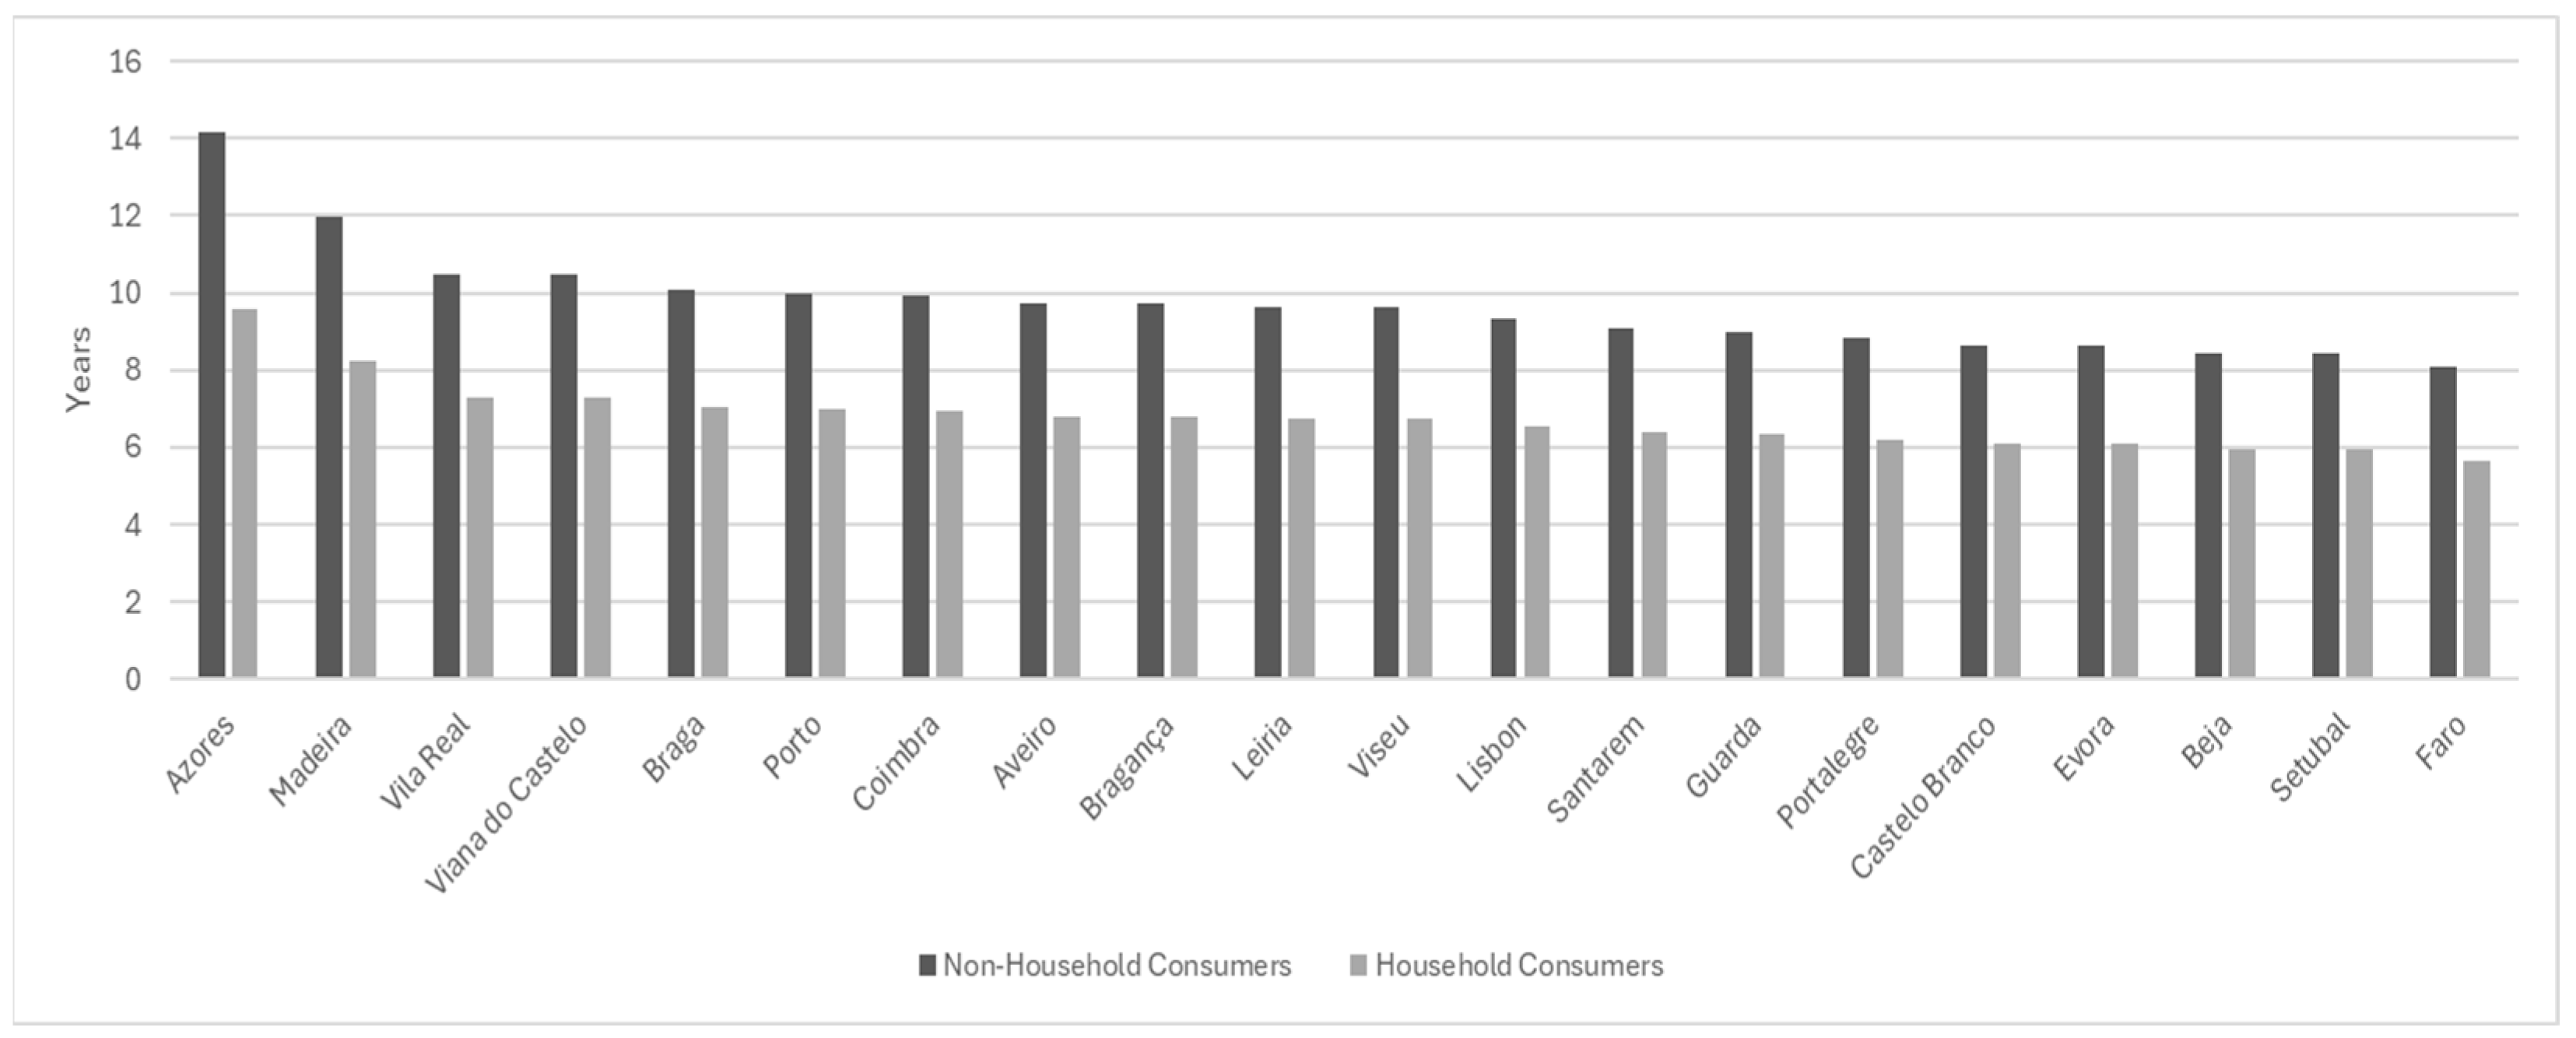
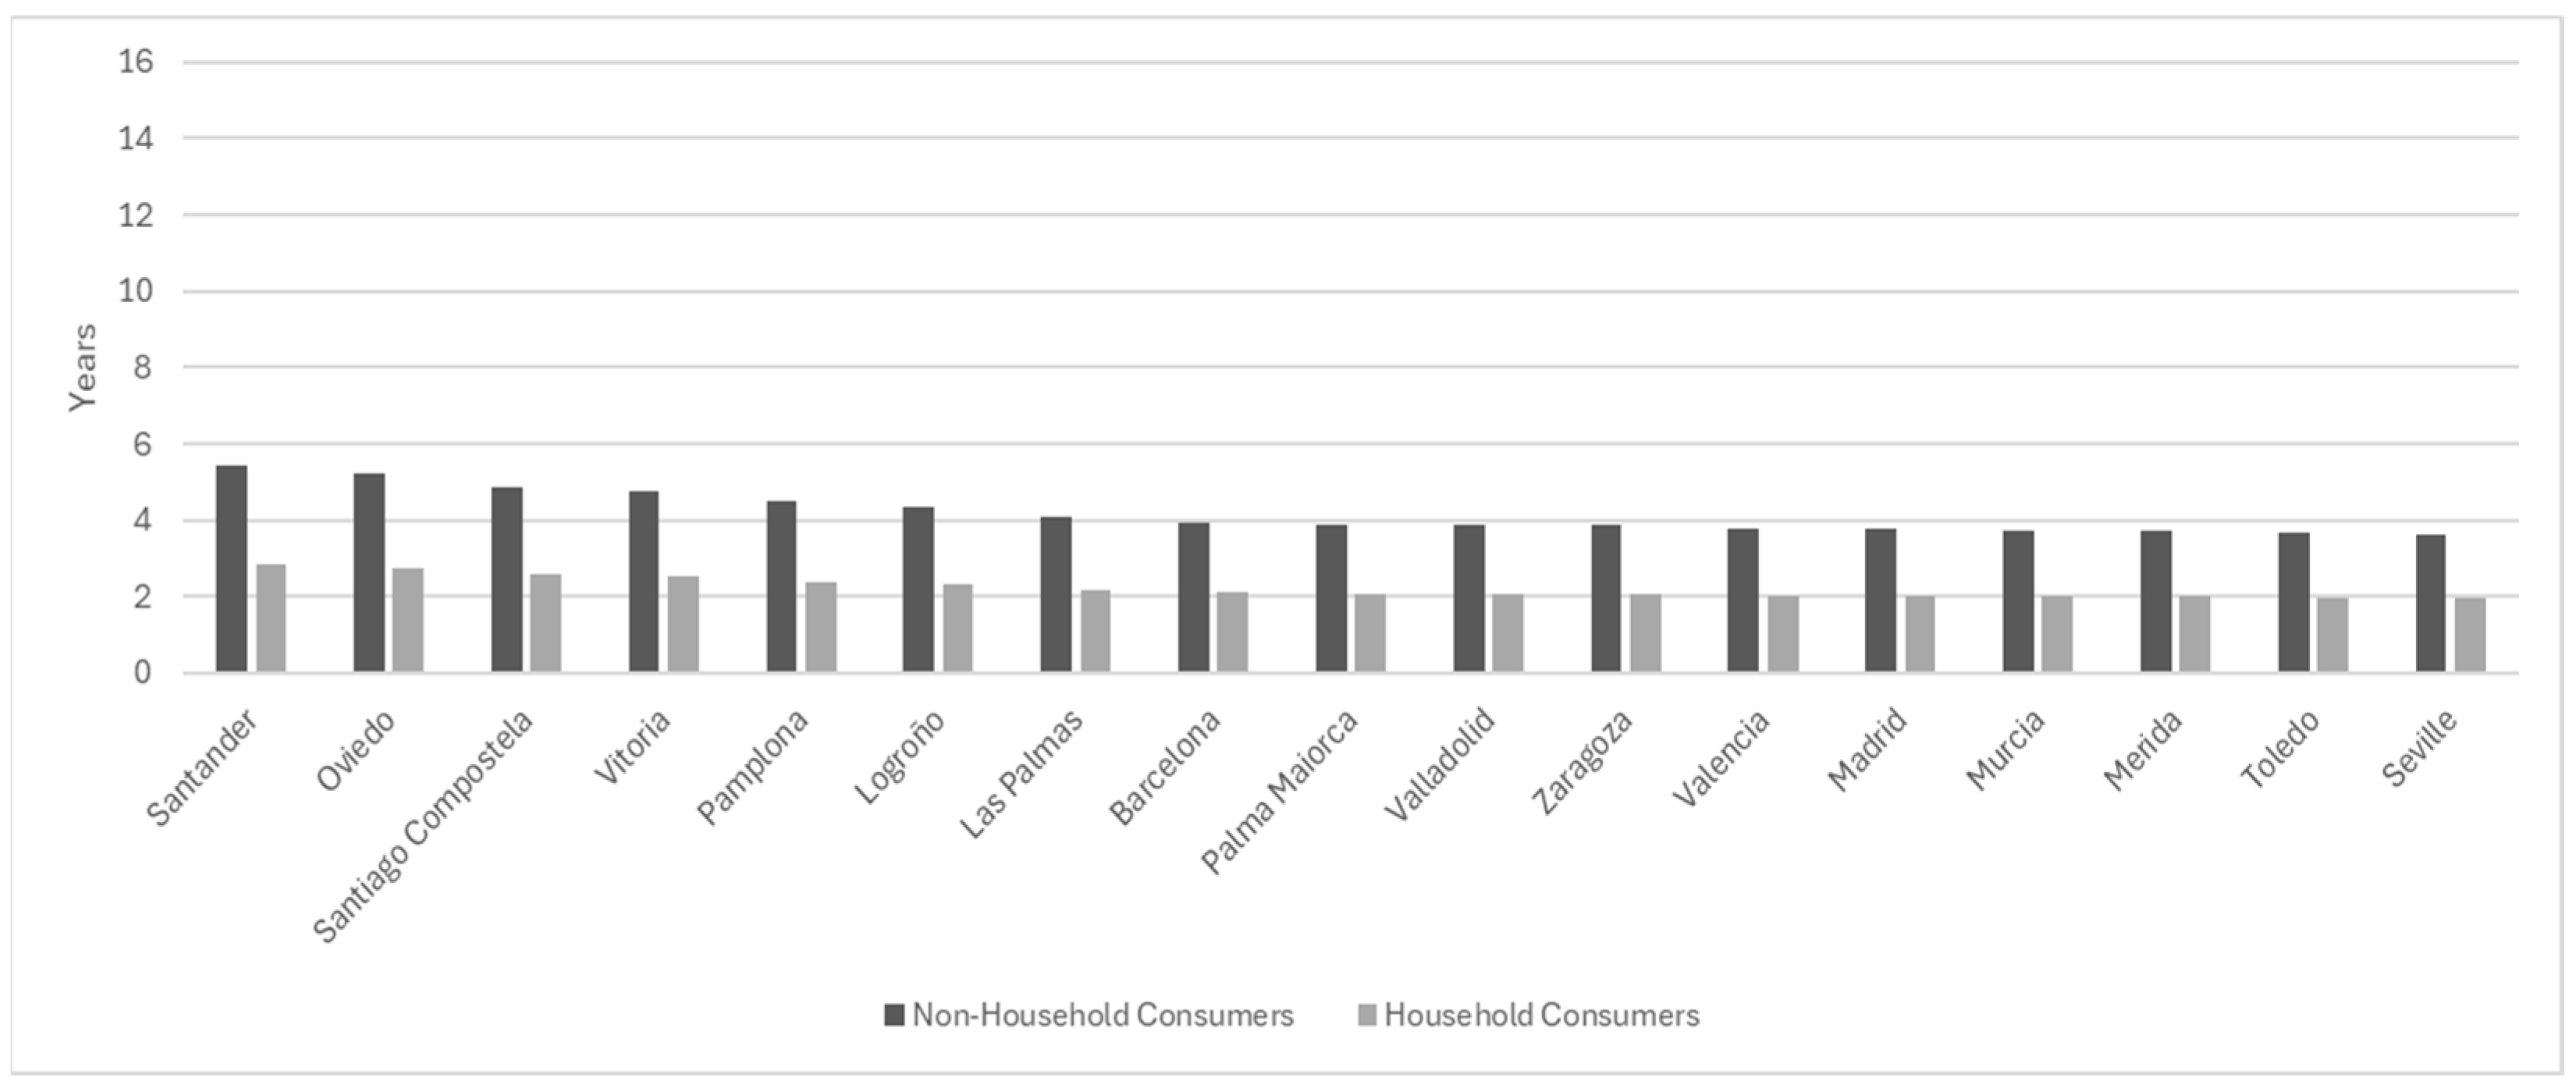
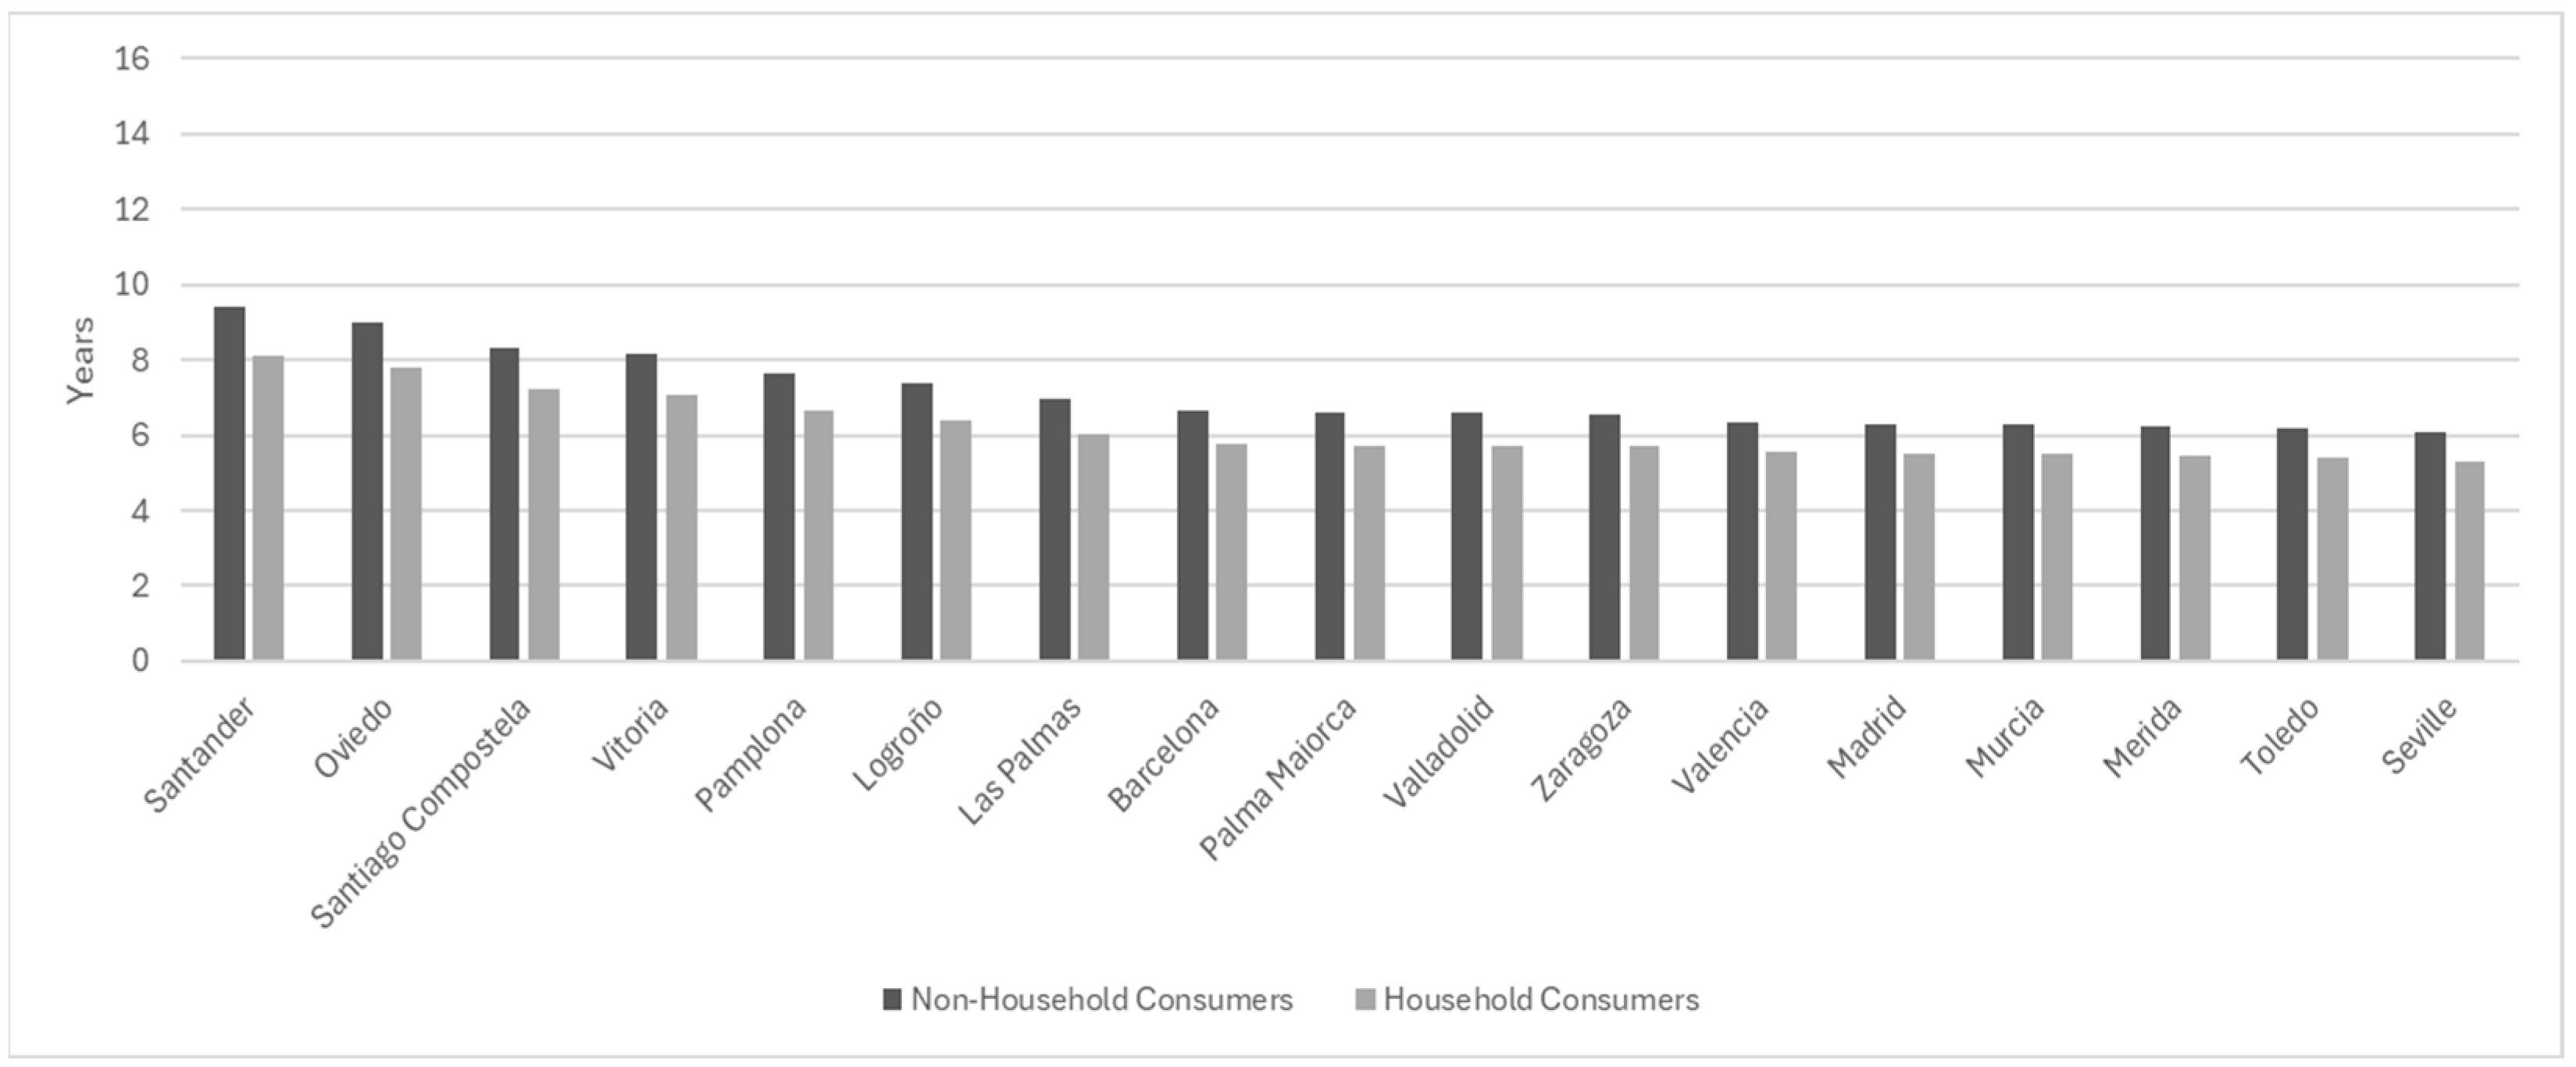
The data play a key role in determining the payback period. This indicator was calculated for several regions of Portugal and Spain, as well as for the capitals of the other European countries analyzed, with the results illustrated in
Figure 1,
Figure 2,
Figure 3 and
Figure 4.
To evaluate the average cost of energy production of the project over 25 years, the LCOE was used [
66]. The discount rate used in the LCOE calculation was set to 7% [
67] as this study focuses on EU countries. This indicator is expressed in EUR/kWh, representing the average cost per unit of energy produced, i.e., an LCOE of EUR 0.05/kWh indicates that to produce 1 kWh of energy, it is necessary to spend EUR 0.05.
4.1. Results for Several Regions of Portugal and Spain
Figure 1 represents the payback period of distinct regions in Portugal, represented by their district capitals, considering self-consumption ratios of 100%. It compares non-household consumers and household consumers.
As expected, the payback period is consistently shorter for household consumers compared to non-household consumers across all regions of Portugal. The long amortization periods observed in the Azores and Madeira for non-domestic consumers, which can reach 8 years, result from the combination of several critical factors. Firstly, the low solar radiation in these island regions plays a decisive role. Due to their location in the Atlantic and higher cloudiness, the Azores and Madeira have significantly fewer hours of direct sunshine compared to the Portuguese mainland and other regions of southern Europe. Studies such as the one by [
68] show that areas with radiation lower than 1500 kWh/m
2/year—as is the case of these archipelagos—have substantially reduced photovoltaic generation, which extends the time needed to recover the initial investment. For example, in the Azores, the average solar radiation is about 30% lower than in the Algarve (more specifically, in the city of Faro), drastically limiting energy production and, consequently, the economic benefits of photovoltaic systems. Another crucial factor is the artificially low electricity prices in these regions. On islands, energy tariffs are often subsidized by regional governments, with production costs being amortized through public pricing mechanisms. When grid electricity is cheaper, the savings generated by photovoltaic self-consumption become less significant, thus extending the payback period. This reality is particularly relevant for non-domestic consumers, who, benefiting from more competitive tariffs than domestic consumers, see the financial incentive associated with the installation of photovoltaic systems even lower, as highlighted in [
64]. In addition to these two main factors, there is also a third element: the higher installation costs in island regions. The complex logistics associated with transporting equipment to islands, combined with the need for skilled labor, make photovoltaic systems more expensive by about 15 to 20% compared to the mainland, as indicated in IRENA data [
60]. This increase in upfront costs also contributes to extending the repayment time.
In summary, the high payback periods observed in the Azores and Madeira are mainly due to the combination of lower efficiency in photovoltaic production (due to weather conditions) with subsidized electricity tariffs that reduce the profitability of self-consumption. The increase in the cost of installation in these regions is added to these factors, creating a less favorable economic scenario for the adoption of solar energy, especially for non-domestic consumers. These challenges require specific policies—such as tax incentives or installation support—to make photovoltaics more competitive in these territories. The Azores and Madeira have the longest payback periods, especially for non-household consumers, reaching up to 8 years in the Azores. In the mainland, southern regions like Faro and Setúbal exhibit the shortest payback periods, with values close to 2 years for household consumers and 4.5 years for non-household consumers. In summary, households recover their investment faster, allowing these regions to play a key role in investment payback.
Since not all installations will be able to achieve such high self-consumption levels, in
Figure 2, we present the payback period of the same regions, but with self-consumption rates of 63.55% for non-household consumers and 40.14% for household consumers.
As expected, the payback periods are significantly longer than in the ideal scenario. The Azores and Madeira regions continue to present the longest payback periods, especially for non-household consumers, reaching above 14 years in the Azores. Even though household consumers still have shorter payback periods than non-household consumers, the percentual difference between them is less pronounced. The southern regions, such as Faro and Setúbal, maintain the lowest payback times, but they are higher than before. This highlights the strong influence of real self-consumption rates on investment return time.
Figure 3 represents the payback period of different regions in Spain, considering self-consumptions of 100%. The payback periods are very similar to the ones obtained for Portuguese consumers. In general, household consumers have even lower payback times, often under 3 years. Among non-household consumers, the values range from around 5.5 years (in Santander and Oviedo) to under 4 years (in cities such as Seville, Toledo, and Mérida).
Figure 4 represents the payback period of the same Spanish regions, but with self-consumptions of 63.55% for non-household consumers and 40.14% for household consumers. As can be observed, these ratios of self-consumption approximate the payback periods between household and non-household consumers. In absolute terms, the payback period for household consumers ranges from around 5.5 years (in Seville and Toledo) to about 8.5 years (in Santander), while for non-household consumers it ranges from approximately 6.0 to 9.5 years. It is also observed that payback periods are generally longer in the north (such as in Santander, Oviedo, and Santiago de Compostela) and shorter in the south (such as in Seville, Toledo, and Mérida), for both household and non-household consumers. This is because solar irradiation in the south of Spain is higher than in the north of Spain.
4.2. Results for Several European Countries
In this section, we extend the previous analysis to include other European countries. At this level,
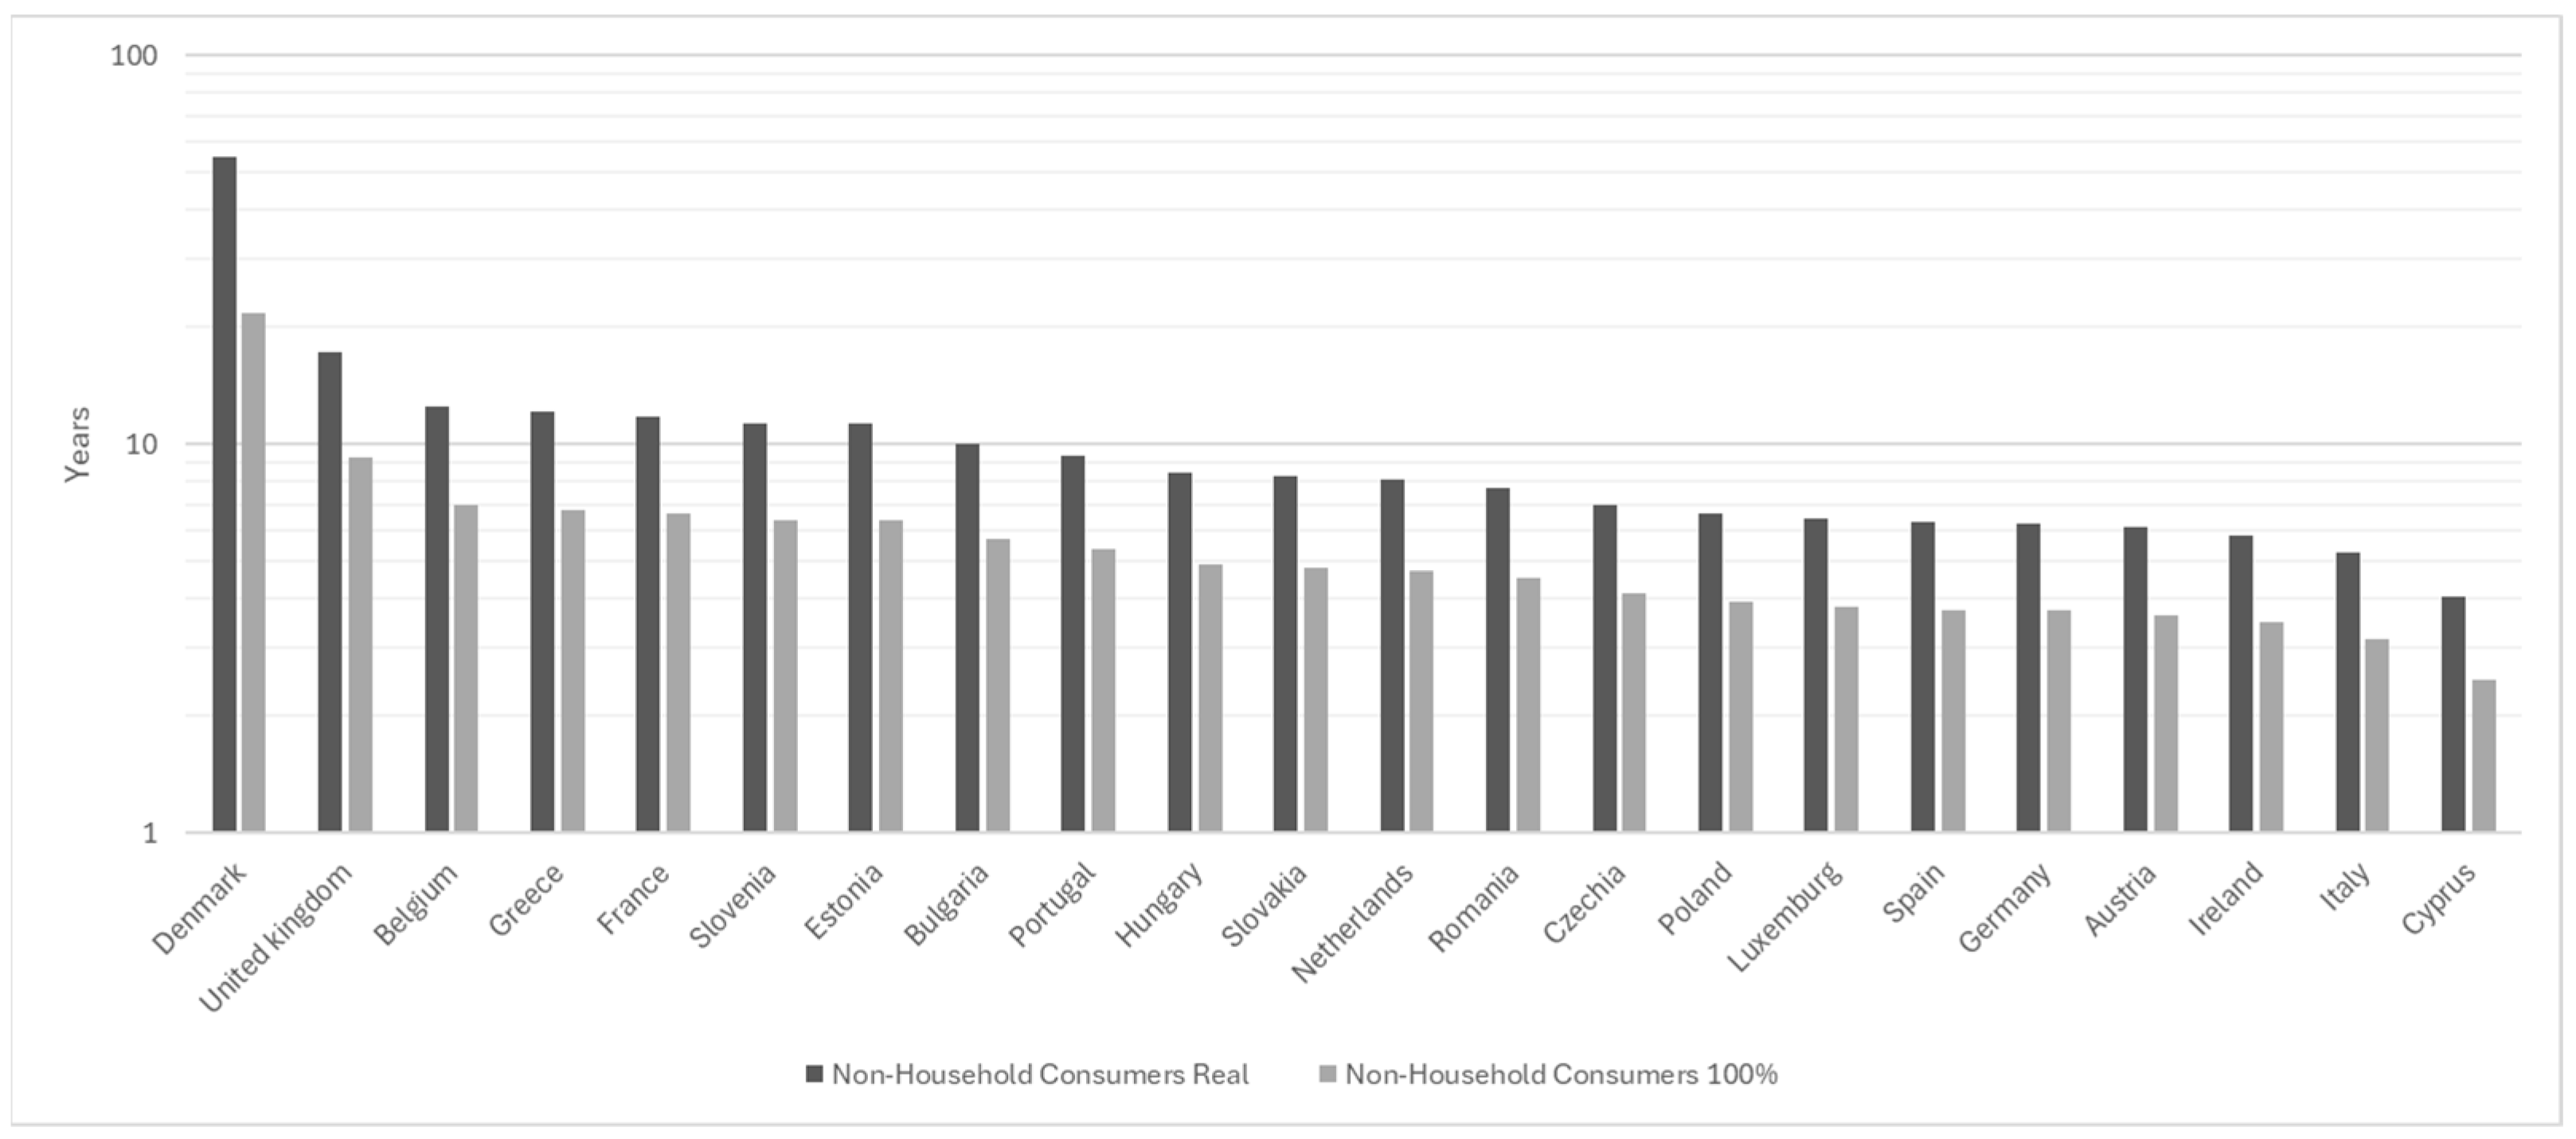
Figure 5 represents the payback period for non-household consumers across several European countries, considering both real and ideal self-consumption levels. It can be verified that Denmark stands out as the country with the longest payback periods. This results from combining low costs of electricity for non-household consumers with low levels of PV generation. On the other hand, some southern countries, like Cyprus and Italy, have the shortest. However, as the price of electricity plays an important role in investment payback, countries like Ireland, Austria, and Germany are also among the set of countries with the shortest payback.
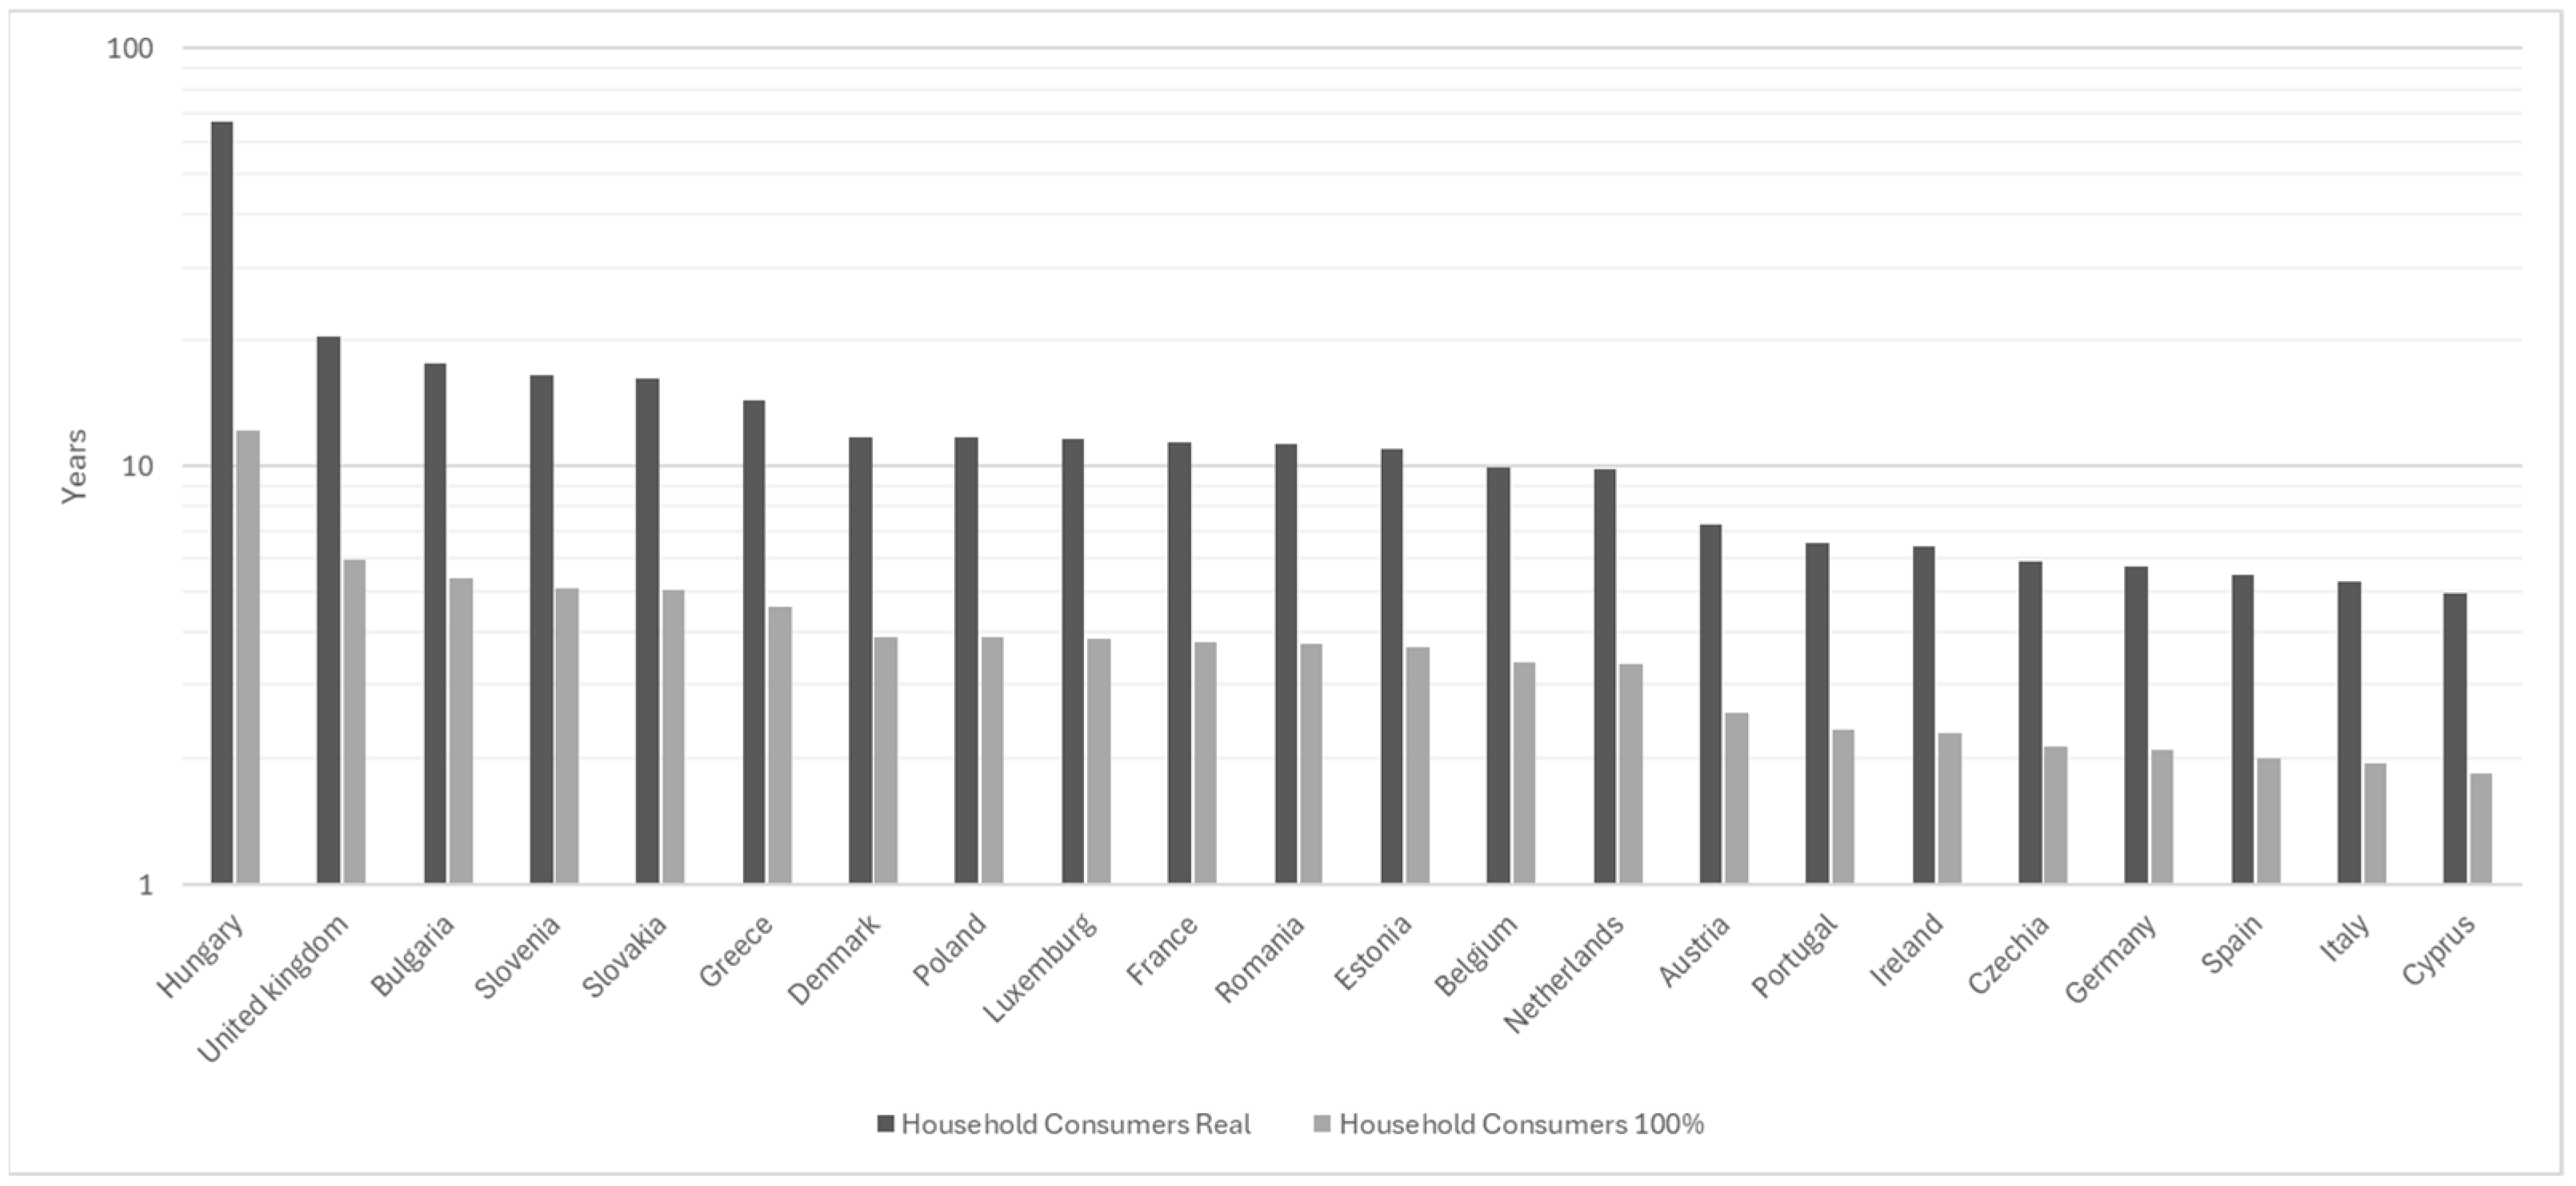
In terms of household consumers,
Figure 6 presents the payback periods for various European countries, comparing the real self-consumption levels with an ideal self-consumption rate of 100%.
In this case, the longest payback periods were obtained for Hungary. As in the case of non-household consumers, southern countries tend to exhibit shorter payback periods, with some exceptions like Greece, for instance.
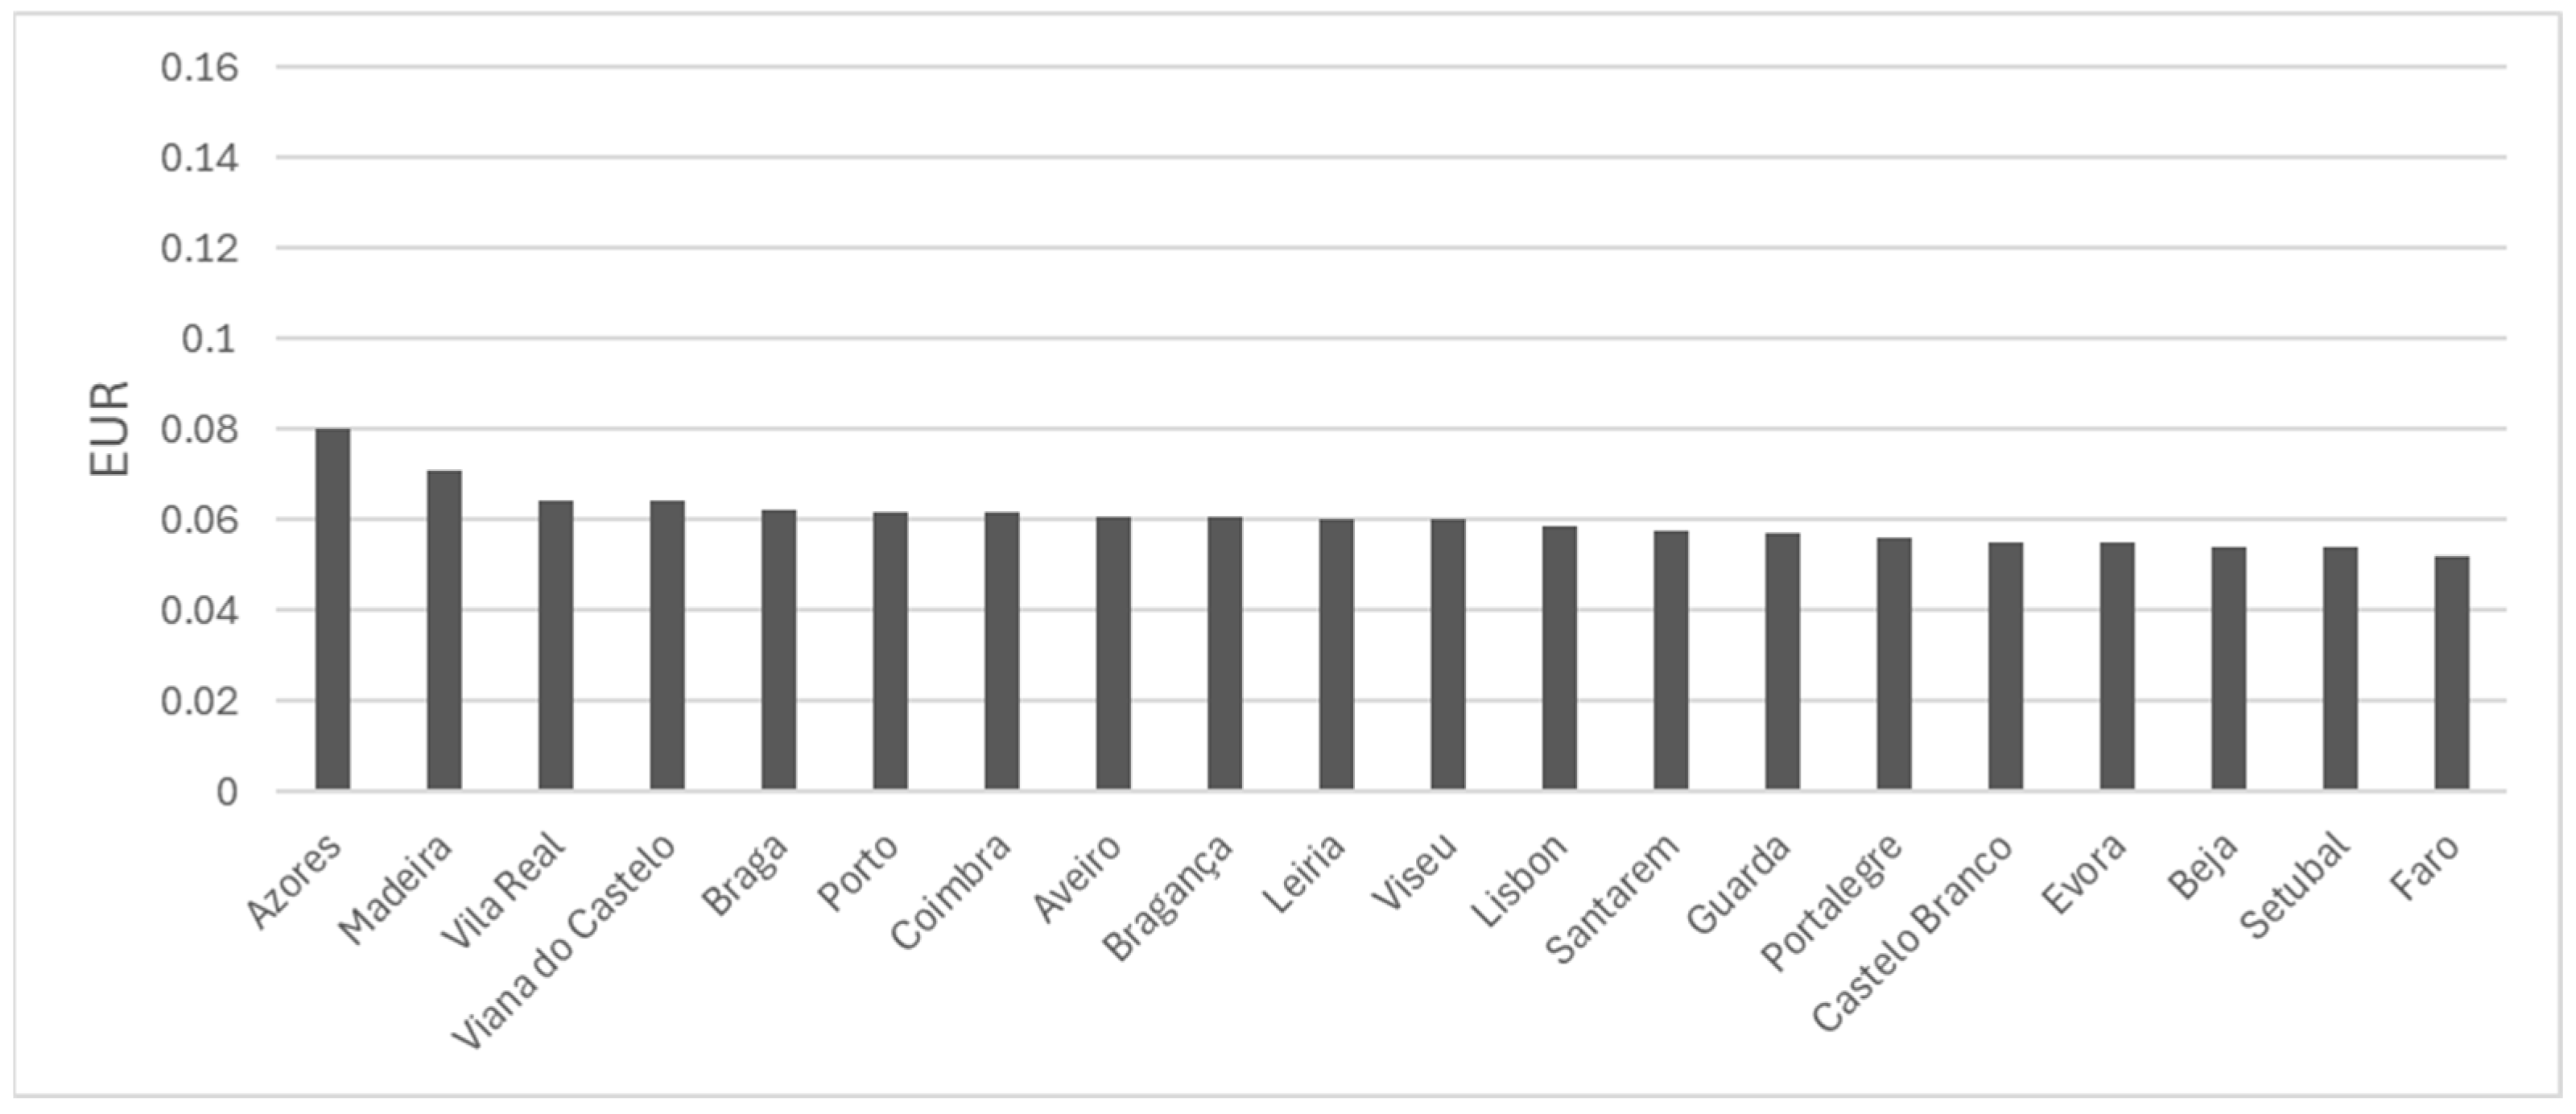
In terms of the LCOE for PV installations,
Figure 7 illustrates the values (in euros) across different regions of Portugal. The highest LCOE values are observed in the Azores and Madeira, whereas the lowest values are found in southern mainland regions, such as Faro, Setúbal, and Beja. This trend reflects the influence of higher solar irradiation in southern Portugal, which leads to more favorable economic conditions for PV systems.
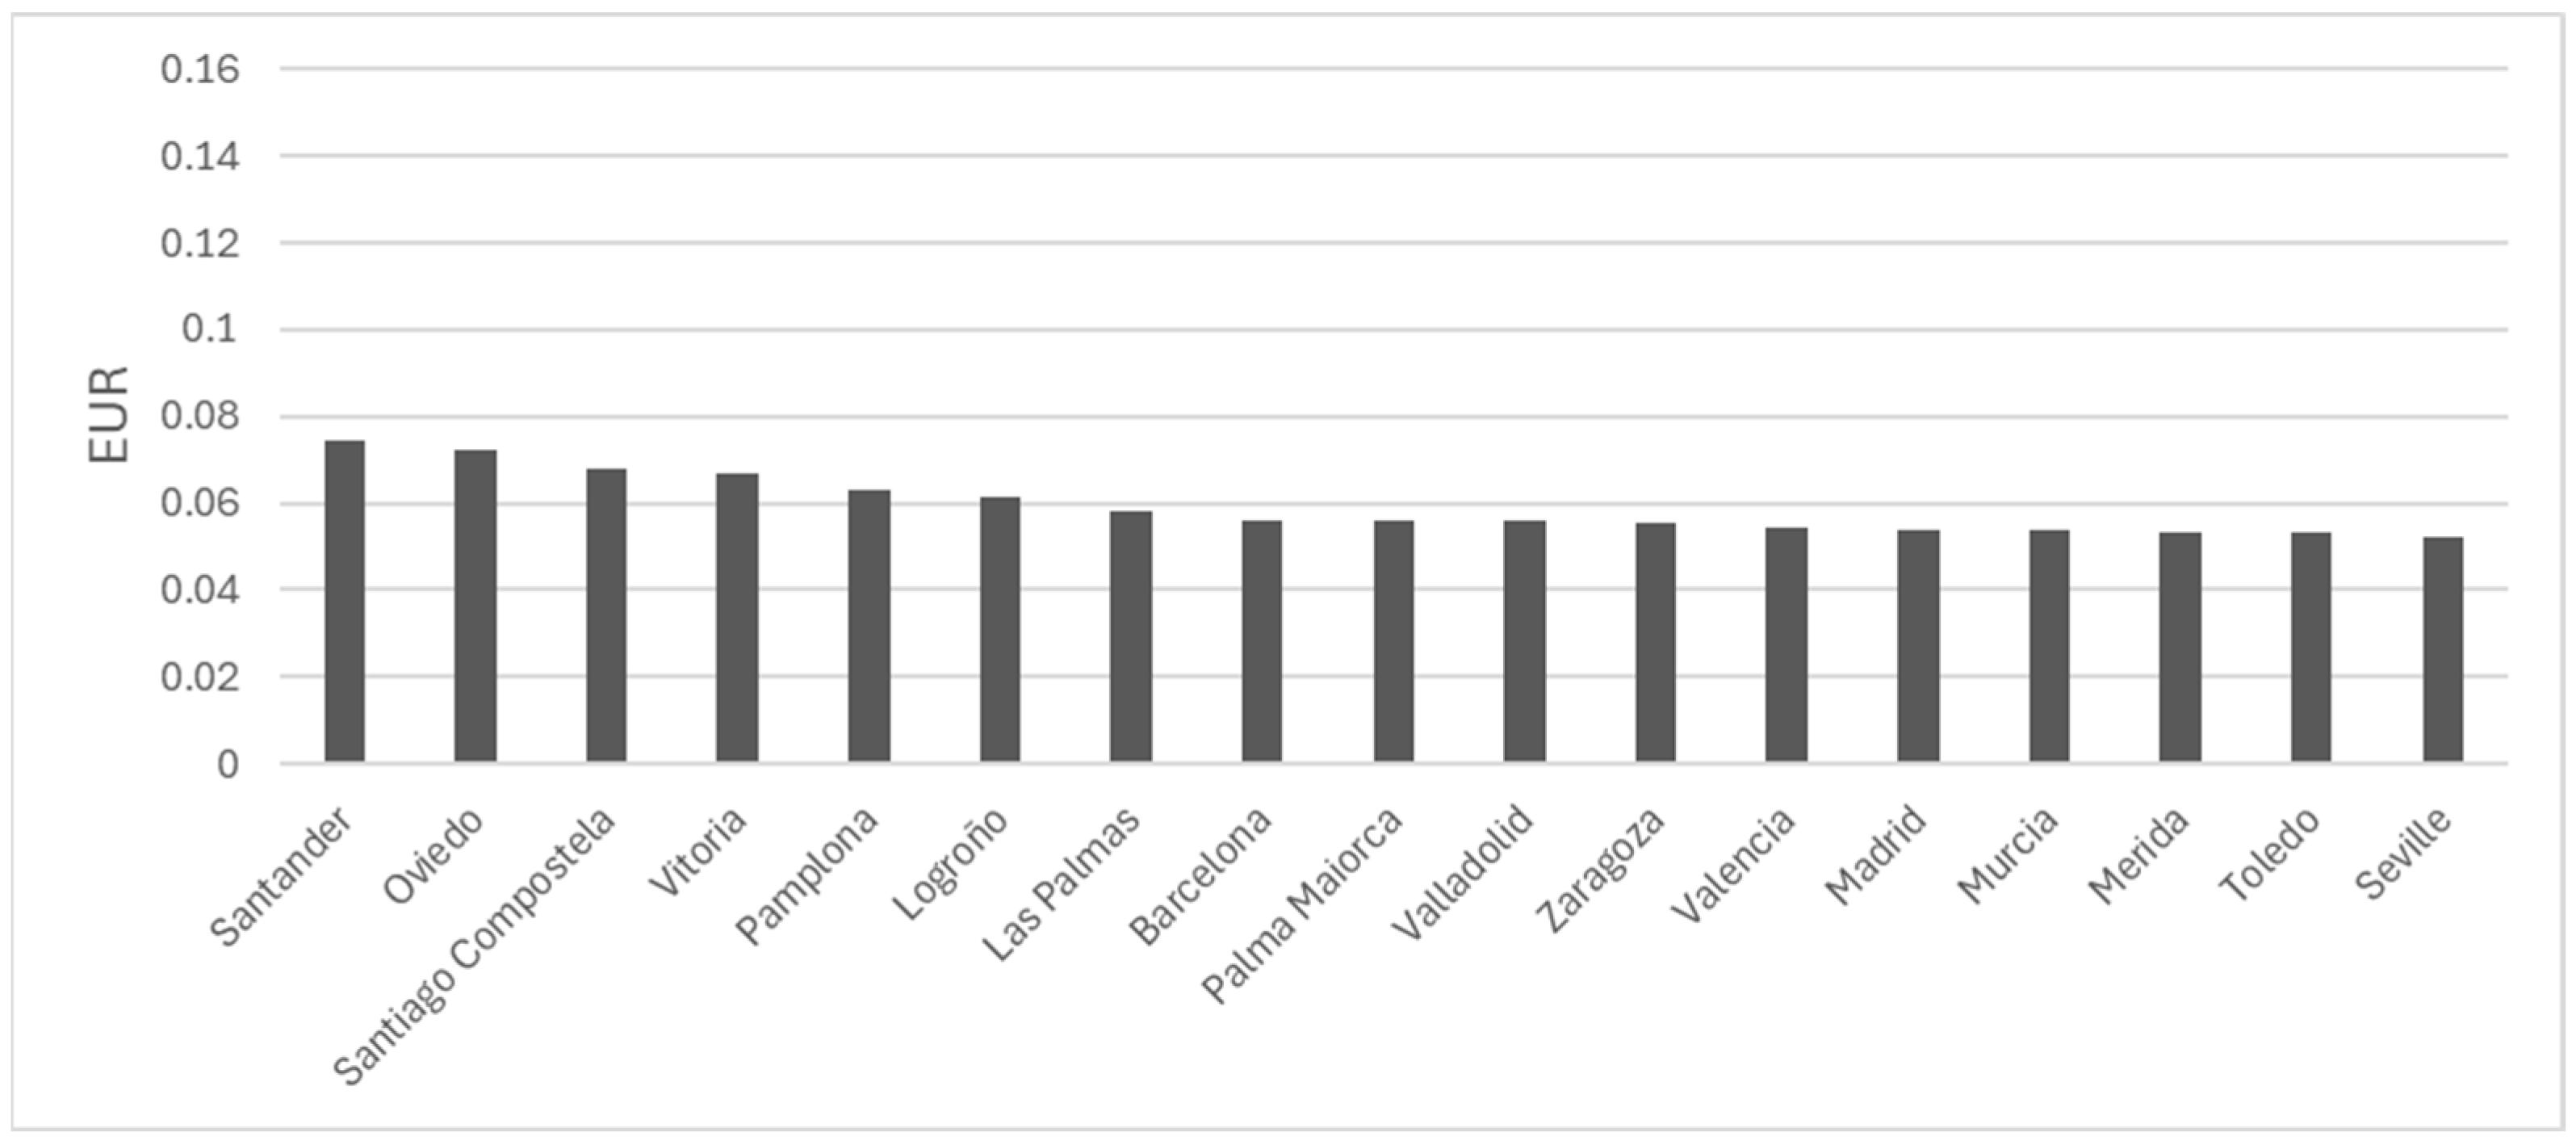
Figure 8 displays the LCOE, in euros, for PV installations across various Spanish cities. The highest LCOE values are found in northern cities, such as Santander, Oviedo, and Santiago de Compostela, where solar irradiation levels tend to be lower. In contrast, southern cities, like Seville, Toledo, and Mérida, exhibit the lowest LCOE values, reflecting the more favorable solar conditions in these regions. This geographical disparity highlights the strong influence of local solar resources on the economic viability of photovoltaic systems.
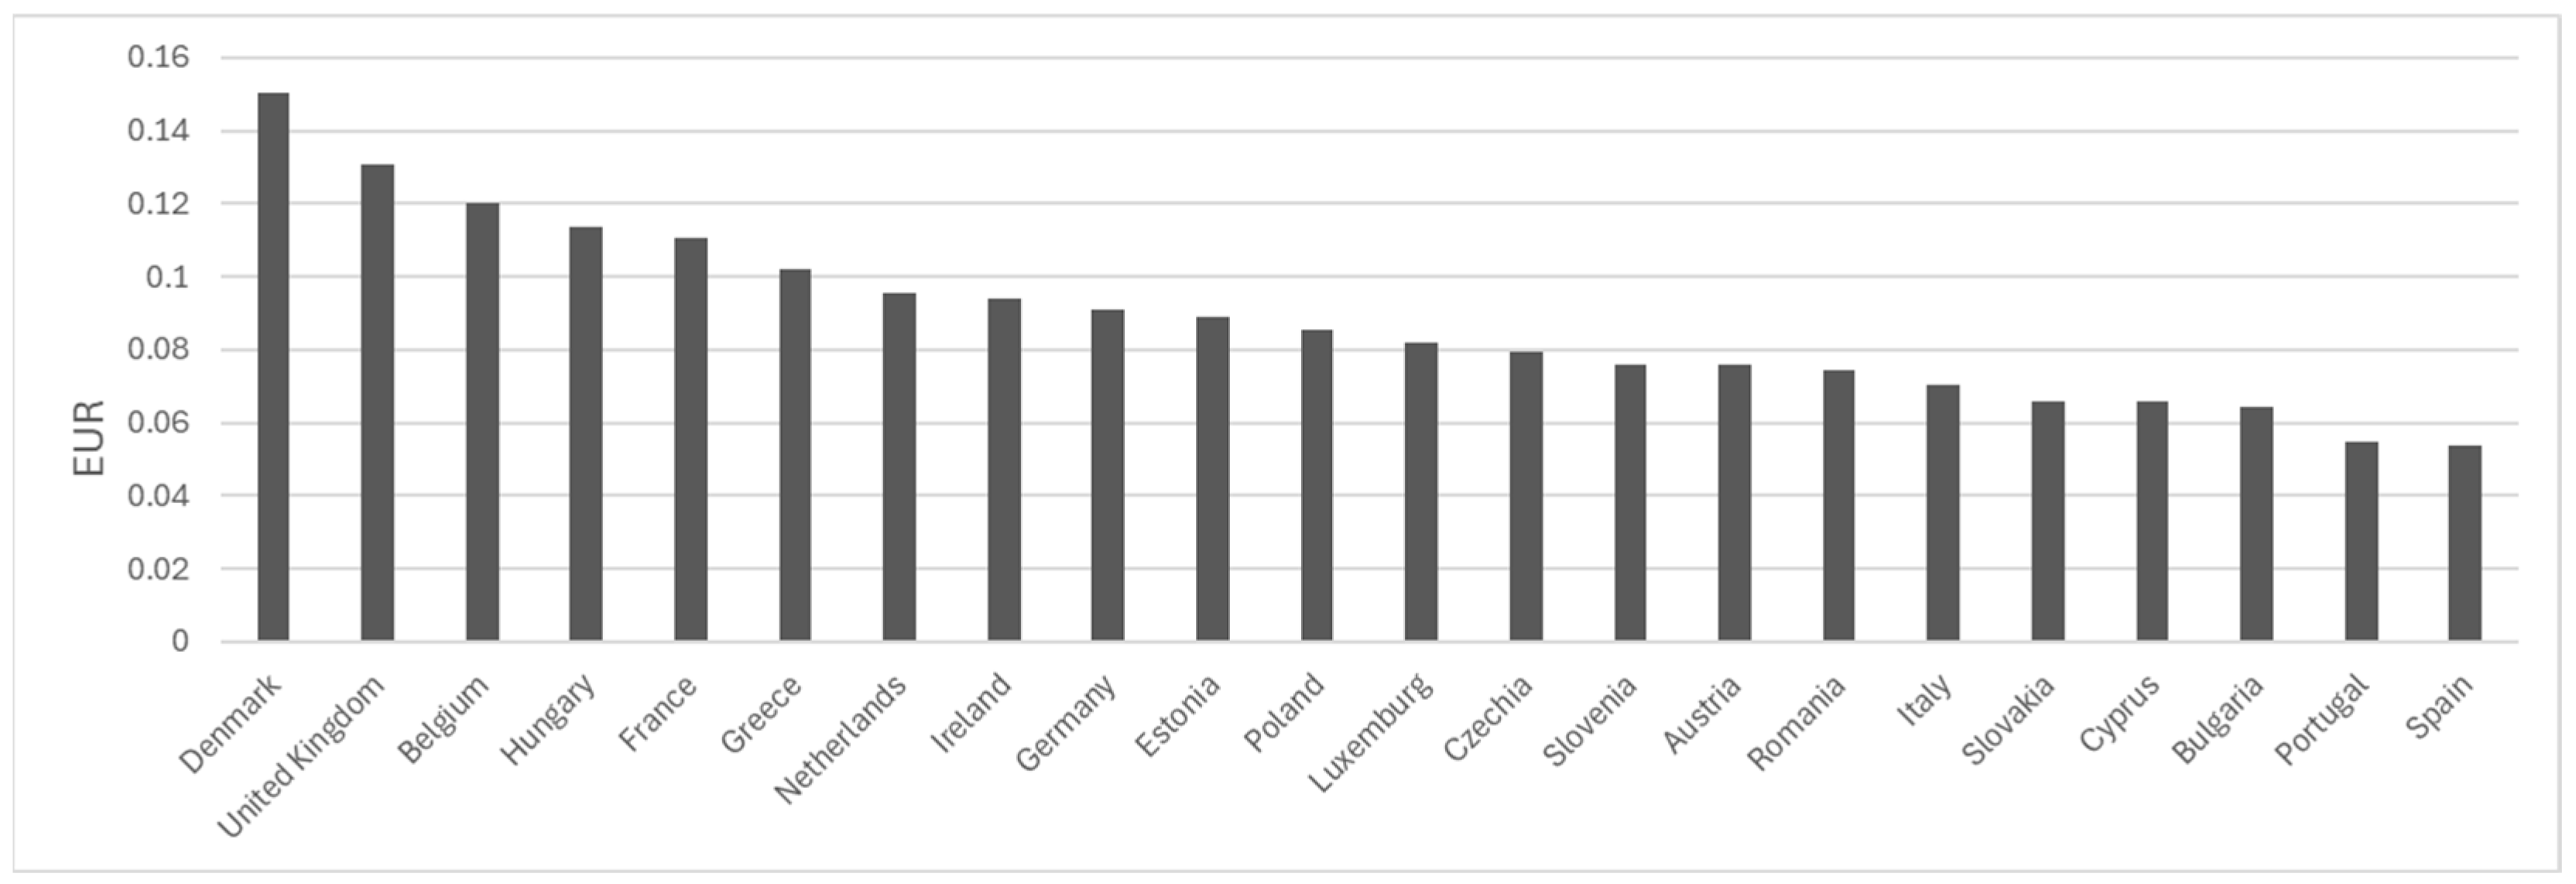
Figure 9 shows the LCOE, in euros, for PV installations across several European countries. Northern and Western European countries, such as Denmark, the United Kingdom, and Belgium, exhibit the highest LCOE values, driven primarily by lower solar irradiation and higher installation. In contrast, southern countries like Spain and Portugal register the lowest LCOE values, indicating more favorable economic conditions for photovoltaic systems due to higher solar resource availability.
5. Discussion
The obtained results provide a view of the investment landscape for photovoltaic systems across Europe, revealing that the economic viability is not uniform but is instead governed by a complex interplay of geographical, economic, and policy-driven factors. The principal findings underscore a distinct north–south gradient in investment attractiveness while also highlighting the importance of self-consumption rates and local electricity pricing in determining the financial outcomes for both household and non-household consumers.
Given the results obtained, the most advantageous country for investment in PV units is Cyprus, as it has the shortest payback time. This is due to the high annual solar irradiation and the relatively high price of electricity. On the other hand, the worst country for investment in the case of non-domestic consumers is Denmark, due to the low annual solar incidence, which limits the production of energy in photovoltaic systems. In relation to domestic consumers, the least favorable country is Hungary, where the price of electricity is low, which negatively impacts the return on investment time. Regarding the Iberian Peninsula, the region of Andalucia in Spain, represented by its capital, Seville, stands out as the most attractive for investment, due to its high annual solar irradiation, which contributes significantly to a short period of return on investment. Compared to the LCOE in the Iberian Peninsula, the LCOE in Spain is, on average, more favorable, as it requires a lower investment to produce the same amount of energy.
Globally, the most salient trend observed is the superior economic performance of PV installations in Southern European nations. As illustrated by the payback period and LCOE analyses, countries like Cyprus, Spain, and Portugal present the most favorable conditions. For instance, the LCOE in Spain and Portugal averages EUR 0.056/kWh and EUR 0.064/kWh, respectively, which is substantially lower than in northern countries like Denmark, where it reaches approximately EUR 0.15/kWh (
Figure 9). This differential is a direct consequence of higher annual solar irradiation in the south, which maximizes the energy yield per installed kWp, thereby lowering the unit cost of generated electricity and accelerating the return on investment.
While solar irradiation sets the potential for generation, local electricity prices determine the return periods of these investments. High domestic electricity tariffs are a powerful accelerator for PV adoption. This is clearly visible in countries like Germany and Ireland, which, despite not having the highest irradiation levels, offer attractive payback periods due to their high retail electricity costs. This makes the savings from self-consumed solar power more substantial, effectively shortening the investment recovery time.
The results also highlight a crucial distinction between household and non-household consumers. Under an ideal 100% self-consumption scenario, households consistently achieve shorter payback periods (
Figure 1 and
Figure 3). This is attributable to the higher retail electricity prices they typically face compared to industrial or commercial consumers. However, this advantage is highly sensitive to the actual self-consumption rate. When realistic, lower self-consumption rates are applied (40.14% for households vs. 63.55% for non-households), the economic gap narrows considerably, and payback periods for households lengthen dramatically (
Figure 2 and
Figure 4). This finding is critical, as it suggests that without measures to increase self-consumption—such as battery storage, demand-side management, or participation in energy communities—the inherent financial advantage for residential installations can be significantly eroded. The results for Hungary, where low, subsidized residential electricity prices lead to the longest payback periods for households in Europe (
Figure 6), further cement the conclusion that local tariff structures can override even favorable solar conditions.
The dramatic divergence between the ideal (100%) and real-world self-consumption scenarios across all analyses underscores that the self-consumption rate is the most pivotal variable influencing the profitability of a PV investment, once geographical location is fixed. An installation that exports a large fraction of its energy at a low feed-in tariff (or for free) will see its payback period extend significantly. This reinforces the arguments made in the literature [
29,
32] that optimizing the alignment between generation and consumption is essential. It also elevates the importance of regulatory frameworks that enable collective self-consumption and Renewable Energy Communities, as discussed in the Background Analysis Section [
30,
33]. By allowing energy to be shared among neighbors, these models can effectively increase the overall self-consumption rate of a project, improving its economic viability for all participants.
6. Conclusions
The ongoing transformation that involves the increasing integration of renewable energy sources, the conversion of the consumer to the prosumer, and the distributed generation of energy requires the evaluation of payback times in investments and the resulting costs of locally produced energy.
The obtained results of this article show that Southern Europe, especially Cyprus, Portugal, and Spain, has significant advantages over the north and east of the continent, such as Denmark and Hungary, due to higher solar irradiation (between 1600 and 2000 kWh/m2/year, against 1000 to 1200 kWh/m2/year) and more competitive installation costs. Secondly, this study quantifies the impact of self-consumption rates on the profitability of photovoltaic systems, demonstrating, based on real scenarios, how rates of 40.14% for domestic consumers and 63.55% for non-domestic consumers directly influence economic results, taking into account variables such as electricity prices and tax incentives. In addition, it evaluates the financial benefits of RECs through case studies in Portugal and Spain.
Finally, based on economic modeling, this work also proposes public policy recommendations, such as the implementation of tax exemptions and a reduction in tariffs for access to the electricity grid, with the aim of boosting the adoption of photovoltaic energy in European regions with lower penetration, such as Hungary and Poland. This research offers insights for policymakers and investors, especially in the Iberian Peninsula, where solar potential (1800 kWh/m2;/year on average) remains underutilized despite favorable conditions.
In conclusion, this study confirms that while Southern Europe holds a natural advantage for PV investment due to superior solar resources, the ultimate economic feasibility is a function of local electricity prices and, most importantly, the achieved rate of self-consumption. We should add that the results obtained are based on average data, which can vary geographically, in different regions of a country, and temporarily, as a consequence of changes in policy or market conditions.
The findings send a clear message to policymakers: a “one-size-fits-all” approach to promoting solar energy is bound to be inefficient. In markets with high solar irradiation and high electricity costs, PV is already a compelling investment. In contrast, regions with lower solar or artificially low/subsidized electricity prices require targeted policy interventions—such as upfront capital subsidies, tax credits, or premium tariffs for shared energy—to make PV investment financially attractive. Promoting frameworks for collective self-consumption and facilitating the integration of battery storage appear to be universally beneficial strategies for unlocking the full economic potential of distributed solar generation across the diverse landscapes of Europe.
