Article

Optimizing Load Dispatch in Iron and Steel Enterprises Aligns with Solar Power Generation and Achieves Low-Carbon Goals

1
School of Electrical and Electronic Engineering, North China Electric Power University, Beijing 102206, China
2
Beijing Key Laboratory of Demand Side Multi-Energy Complementary Optimization and Supply-Demand Interaction Technology, China Electric Power Research Institute Co., Ltd., Beijing 100035, China
*
Author to whom correspondence should be addressed.
Energies 2025, 18(17), 4662; https://doi.org/10.3390/en18174662
Submission received: 5 August 2025 / Revised: 27 August 2025 / Accepted: 31 August 2025 / Published: 2 September 2025

Abstract

This study develops an optimization-based scheduling framework for coordinating the energy-intensive operations of a steel enterprise with estimated solar power availability. Unlike prior approaches that focus primarily on process efficiency or carbon reduction in isolation, the proposed model integrates demand response with linear programming to improve solar utilization while respecting load priorities. The solar generation profile is derived from typical meteorological year (TMY) irradiance data, adjusted for panel efficiency and system parameters, thereby serving as an estimated input rather than measured data. Simulation results over a 31-day horizon show that coordinated scheduling can reduce grid dependence and increase solar energy utilization by up to 99% under the simulated conditions. While the findings demonstrate the potential of load scheduling for industrial decarbonization, they are based on estimated solar data and a simplified system representation. Future work should incorporate real-world solar measurements and stochastic models to address uncertainty and further validate industrial applicability.

1. Introduction

The iron and steel industry is one of the most energy-intensive sectors worldwide, accounting for approximately 7–9% of global carbon dioxide emissions [1,2,3]. Despite its high carbon footprint, it remains fundamental to modern infrastructure and industrial development. Consequently, decarbonization in this sector is both an urgent environmental necessity and an industrial challenge [1,4,5,6].
Recent efforts focus on integrating renewable energy sources, improving energy efficiency, and adopting sustainable practices to reduce emissions [7,8,9,10]. Among renewable options, solar energy stands out as a promising and cost-effective pathway for decarbonizing industrial processes [11,12]. However, its intermittent nature complicates direct application in energy-intensive operations such as steelmaking. To address this, recent studies have emphasized multi-objective optimization frameworks that integrate renewable energy, storage technologies, and demand response strategies. For instance, ref. [13] proposed an energy storage-based hybrid strategy for decarbonization in steelmaking using demand–response optimization, while ref. [14] introduced a low-carbon decision model considering energy structure adjustment and process optimization. Reheating furnaces have been identified as a key contributor to energy consumption in steelmaking, with notable scope for efficiency gains and waste heat recovery [15]. Such perspectives reinforce the relevance of optimization-driven energy management strategies in supporting decarbonization efforts [16].
Advances in predictive control and digital twins [14,17], along with AI-driven forecasting methods such as XGBoost and LSTM by [18,19], have further improved real-time energy management. These works demonstrate that coordinated operation of equipment can reduce peak demand, lower operational costs, and facilitate renewable integration. However, most studies either rely on generic industrial case studies or focus on residential and commercial applications, with limited attention to real-world steelmaking enterprises.
Furthermore, the iron and steel industry highly depends on high-temperature processes and fossil fuel-based energy sources, which leads to approximately 7–9% of global carbon dioxide emissions [20]. To address this challenge, prior studies have explored diverse pathways for reducing environmental impacts. For example, technological innovations such as solar-assisted desalination using iron oxide coatings [21] or advanced modeling of heavy-metal transformation and pollutant distribution during smelting [22] have expanded the scope of energy and environmental research in the sector. From a systems perspective, studies have also investigated the co-control of CO2 and air pollutants [23], regional energy-saving scenarios [24], and the role of negative-emission technologies [25]. While these studies provide valuable insights into material innovations, pollutant control, and long-term policy pathways, they often lack a focus on short-term operational strategies that can be practically implemented at the plant level. In particular, the integration of renewable energy such as solar power into steelmaking has been discussed conceptually, but few works demonstrate how load scheduling and demand-side management can directly enhance solar utilization and reduce grid dependence under real industrial operating conditions.
Recent conference studies delve into the growing integration of energy flexibility and grid independence in manufacturing environments [18,24] underscoring the need for adaptable frameworks to manage renewable energy variability. Traditional approaches to improving efficiency, such as equipment upgrades, waste heat recovery, and process optimization, are now complemented by renewable integration, with solar energy recognized as a promising decarbonization pathway despite its intermittency [26]. Experimental works have examined direct solar-driven iron ore reduction [27] and hydrogen-based reduction under concentrated light flux [28], demonstrating technical feasibility but also revealing practical challenges for large-scale application.
Beyond direct carbon monitoring, surrogate indicators such as energy efficiency, grid independence, and solar utilization are increasingly used to evaluate decarbonization in [28,29,30] broader, system-level steelmaking approaches, including multi-generation plants integrating solar power, wastewater treatment, carbon capture, and hydrogen production [30], as well as solar-assisted agglomeration processes to lower CO2 emissions [31], have expanded the research landscape.
This study addresses these gaps by proposing an optimization framework tailored to iron and steel enterprises. The framework maximizes solar energy utilization, minimizes grid dependency, enhances sustainability, and assesses carbon reduction potential through surrogate measures. The main contributions and innovation points of this study are as follows:
  • Integration of load scheduling with estimated solar generation in a steelmaking context, enabling renewable utilization even in the absence of measured solar data.
  • A practical optimization framework based on demand response and linear programming, designed to balance solar utilization, load priorities, and grid dependence.
  • Introduction of a three-dimensional evaluation system (SUR, GIF, EE) to assess system performance from both energy efficiency and grid interaction perspectives.
  • Simulation-based validation using real industrial load data. The datasets used in this study, including the User Gate Load Data and User Loop Load Data, are described in detail in the Appendix A, demonstrating the potential for significant solar utilization improvements under realistic operating constraints.
The remainder of this paper is structured as follows: Section 2 presents the site background and data sources, including industry-specific mechanism models. Section 3 details the methodology, covering optimization model design and data-driven approaches. Section 4 discusses the results, highlighting improvements in solar utilization, grid independence, and energy efficiency. Finally, Section 5 concludes with the key findings and implications for advancing low-carbon strategies in energy-intensive industries.

2. Data Collection Methodology and Industry Mechanism Models

2.1. Data Collection

The data for this study were gathered using a combination of online and offline industry screening methods, ensuring a comprehensive and efficient collection of relevant information.
Online Data Collection: Various online methods were employed to gather foundational information about the industry operations. These included the following:
  • System Inquiries: Accessing user systems remotely to retrieve data such as wiring diagrams and power loads.
  • Telephone Inquiries: Conduct interviews to clarify operational details and verify available energy data.
  • Questionnaires: Distributing structured questionnaires to gather insights into the following:
    User wiring diagrams.
    Historical power loads.
    Major energy-consuming equipment.
    Historical responses to energy management programs, such as demand response events.
These methods provided a robust dataset of basic operational information to frame the analysis.
Offline On-Site Investigation: To acquire a deep understanding of the energy usage pattern and operational flexibility, in-person investigations were conducted at the industry sites of Jiangsu company in Tianjin Province. These investigations focused on the following:
  • Energy Consumption Profiles: Measuring and recording the energy consumption of various equipment.
  • Production Control Systems: Examining internal production systems to evaluate how energy usage aligns with production schedules.
  • Adjustable Capacity Analysis: Assessing the actual flexibility in the production line and equipment to determine the potential for load adjustments.
This detailed on-site assessment ensured that the collected data accurately reflected real-world operations and capabilities.

2.2. Accurate Construction Industry Mechanism Models

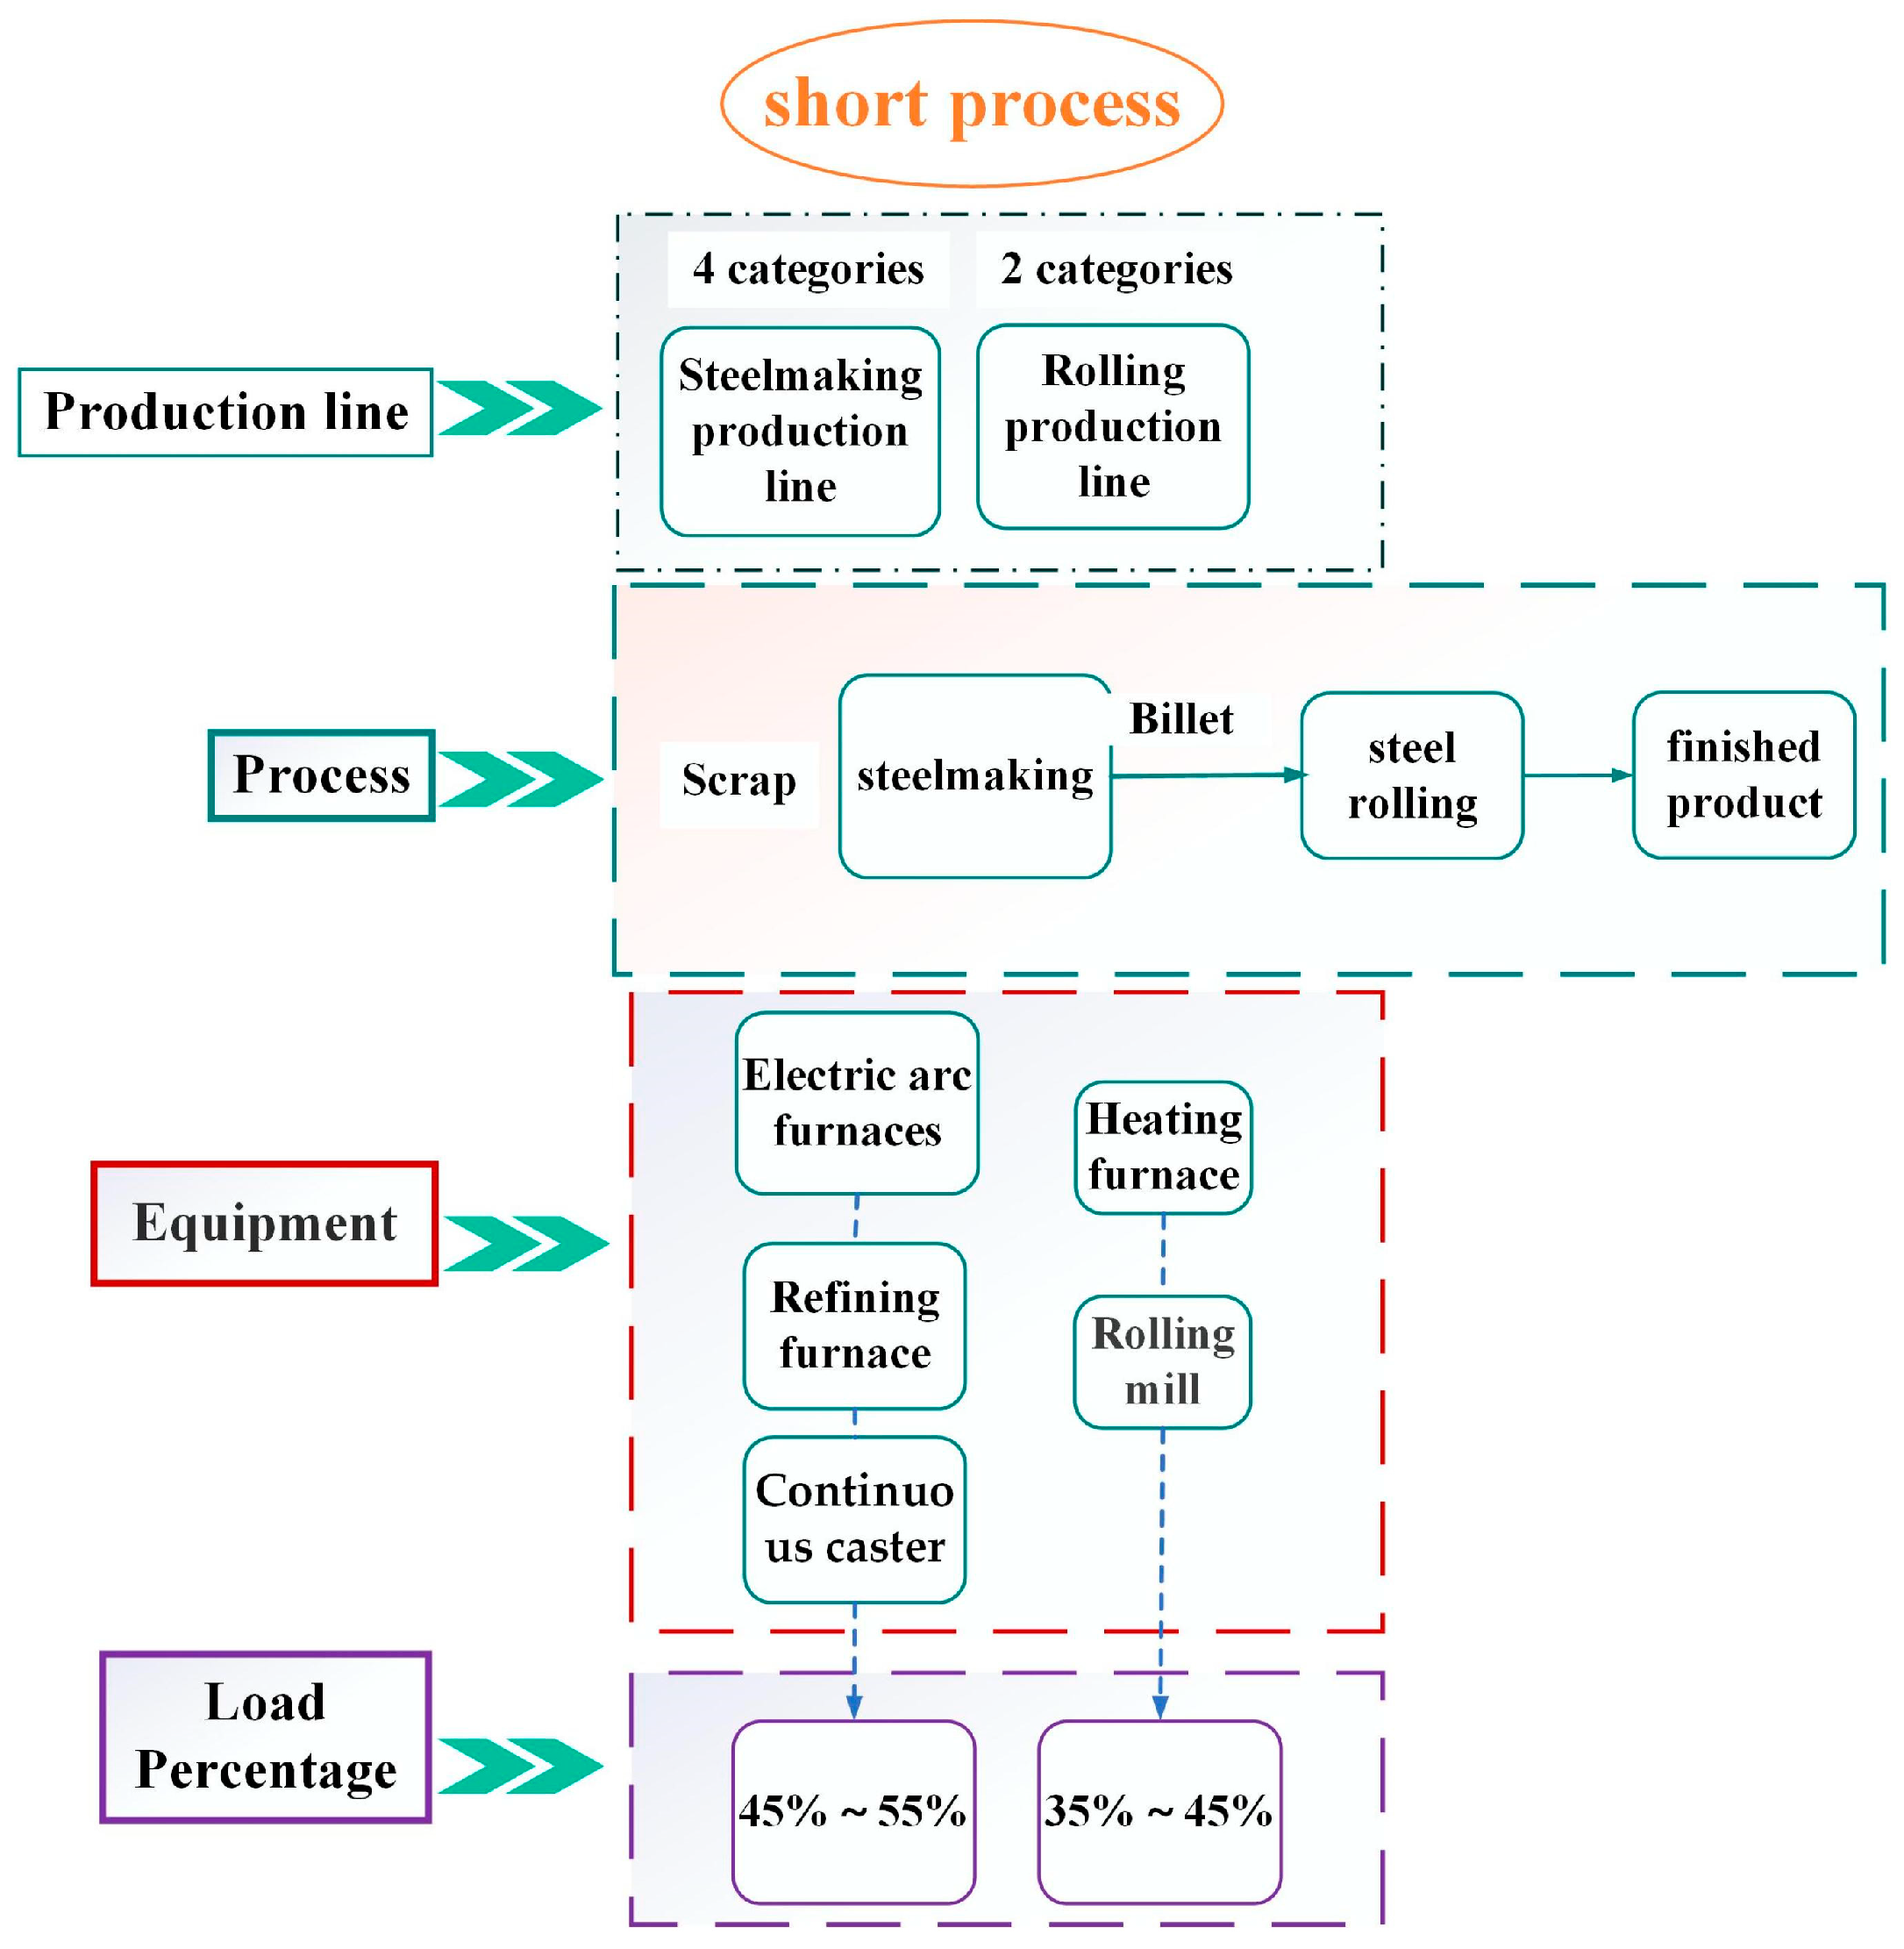
The developed industry mechanism model comprehensively captures the operational dynamics and constraints of both long and short processes within the iron and steel industry of Jiangsu Company, located in Tianjin province, as depicted in Figure 1 and Figure 2.
Long process model: This process typically employs a combination of coal and iron ore as raw materials, representing a traditional production method. It includes essential equipment such as a coke oven, sintering machine, blast furnace, refining furnace, converter, continuous caster, heating furnace, and rolling mill. The load percentage for the coke oven, sintering machine, and blast furnace ranges from 5% to 15%, indicating that they account for a relatively small share of the total energy capacity compared to other processes. In contrast, the refining furnace, converter, continuous caster, heating furnace, and rolling mill have load percentages between 30% and 40%, reflecting their role in steelmaking and shaping stages that require significantly higher energy consumption.
Short process model: This process features scrap-based steel production, with scrap metal serving as the primary raw material. Consequently, it bypasses the need for coal and iron ore, significantly reducing carbon emissions. The process involves electric arc furnaces, refining furnaces, continuous casters, heating furnaces, and rolling mills. The load percentage for electric arc furnaces, refining furnaces, and continuous casters ranges from 45% to 55%, indicating that the intense and concentrated energy required for melting demands a substantial energy input, which is essential in the short process model. The load percentage for heating furnaces and rolling mills is 35% to 45%, as these processes follow steelmaking and are part of the shaping and finishing stages.

3. Methodology

3.1. Data Overview

The optimization model leverages Python 3.12.0 with the PuLP library to maximize estimated solar power utilization while effectively addressing the energy demand of iron and steelmaking processes. This research is grounded in a robust dataset comprised of time-series data collected at 15-min intervals over 31 days, sourced from the iron and steel industry in Jiangsu Province, Tianjin.
The dataset is organized into three key components that are critical for optimization operations in the iron and steel industry:
1.
User gate load data: This section captures the total power demand or energy consumption across two primary processes:
  • Ironmaking processes: Transformation of raw materials into molten iron.
  • Steelmaking processes: Convert molten iron into finished steel products.
These datasets refer to the total power demand for the iron and steel plants at the interface point between the industrial facility and the power grid.
2.
User loop load data: The details of the power consumption of individual workshops and equipment within the ironmaking and steelmaking processes. These are the following:
  • Ironmaking Smart Factory Sintering Workshop 111: Handles the sintering of raw iron ore.
  • Steelmaking New Fourth Furnace Workshop 113: Comprising subcomponents:
    Blast Furnace Body
    Blast Furnace Pumping Station
    Fan
  • Steelmaking II Workshop 114: Includes rolling mill and casting machine
  • Steelmaking I Workshop 118: Includes rolling mill and casting machine
  • Electric furnace: Engaging in steel melting operations
  • Carrier machine: Engaging in steel melting operations
3.
Solar power energy estimation: due to the unavailability of real-time solar power energy data, we utilize estimated solar power generation values, denoted as P ^ s o l a r ( t ) . These values are derived from a predictive model and provide crucial insights into the potential of renewable energy sources to displace non-renewable energy consumption within iron and steelmaking operations. This integration model is built on informed assumptions surrounding solar power energy capabilities.

3.1.1. Data Structure

The dataset is organized as a time-indexed series of power values for each component, with User Gate Load data and estimated solar energy power represented as aggregated scalar values for each time interval. In contrast, the User Loop Load data offers detailed insights into the power consumption of individual workshops and equipment. Furthermore, this dataset serves as a foundation for designing an optimization problem aimed at aligning power demand with estimates of solar energy production while minimizing reliance on grid power. Moreover, it is essential for developing a mathematical model that dynamically allocates power resources across the production processes, giving priority to high-impact and high-priority equipment.

3.1.2. Data Specifications and Preprocessing

All load and solar-related values are expressed in kilowatts (kW). The time-series dataset consists of 2976 data points per variable, based on 15-min intervals over 31 days (96 intervals per day). To address missing load values, linear interpolation was employed to preserve temporal continuity. No normalization was applied to the load data, as the interpretability of raw power values is crucial in industrial applications. Since real-time solar power generation data was unavailable, estimated solar generation profiles were employed. These estimations were derived from Typical Meteorological Year (TMY) irradiance data, adjusted for panel tilt, surface area, and efficiency (assumed at 18%). To reduce fluctuations and better align with operational use, the estimated solar values were smoothed using a moving average filter. Although the estimates are not site-specific measurements, their plausibility was validated through comparison with historical solar performance data from a similar nearby facility.
For modeling, the dataset was partitioned into training (70%), validation (15%), and testing (15%) subsets to support the evaluation of optimization outcomes. Only load and irradiance-derived solar estimates were selected as inputs, as they directly impact scheduling. While environmental factors such as humidity, wind speed, and ambient temperature can influence photovoltaic performance, their effects are secondary compared to irradiance within short-term scheduling horizons. Therefore, they were not explicitly included in the optimization framework, though their potential role in future long-term or more granular modeling has been noted.

3.2. Optimization Model

The optimization goal is to maximize the utilization of estimated solar energy generation and minimize grid power consumption to align with low-carbon aims. Moreover, it prioritizes high-value industrial processes based on their importance to production. The mathematical model can be described as follows:
M a x i m i z e = t = 1 T i = 1 N P r i o r i t y i P l o o p , i t x i , t ) λ t = 1 T P g r i d ( t )
where:
  • P r i o r i t y i : Represents the priority weight assigned to equipment i
  • P l o o p , i t : The power demand for equipment i at a time t , and for each i contributes to P g a t e ,   i r o n ( t ) or P g a t e ,   s t e e l ( t ) , depending on whether the equipment belongs to the ironmaking or steelmaking operations.
  • P g a t e ,   i r o n ( t ) : Represents the power demand of ironmaking operations at a time t
  • P g a t e ,   s t e e l ( t ) Represents the power demand of steelmaking operations at a time t
  • x i , t { 0,1 } : Is the binary decision variable indicating whether the equipment i operates at a time t .
  • T : Total number of time intervals in 31 days (T = 31 × 96 = 2976)
  • i : Index for equipment
  • N : Total number of equipment/workshops in operation.
  • λ : Represents the weight factor for penalizing grid power usage.
  • P g r i d t : Grid power usage at a time t .
The total demand across all workshops at time t is described as follows:
P t o t a l t = i P l o o p , i t
The objective of the optimization model is to reduce carbon emissions associated with grid electricity, aligning with decarbonization by minimizing the reliance on grid power, P g r i d t , while meeting the operational priorities and being constrained to be non-negative. This is defined as follows:
P g r i d t = P t o t a l t P ^ s o l a r ( t )
where: P ^ s o l a r ( t ) : Represents the estimated solar power energy at a time t .
Objective Function:
m i n t = 1 T P g r i d t
Subject to:
P g r i d t = i P l o o p ,   i t x i , t P s o l a r t , t
P g r i d t 0 , t
Constraints: Binary operation status:
x i , t 0,1 t
Critical load enforcement:
x i , t = 1 , i f   e q u i p m e n t   i   i s   c r i t i c a l , t
Flexibility for non-critical loads: x i , t can vary with time, subject to solar availability and scheduling priorities. Power balance constraint: Total power demand across all active equipment cannot exceed the sum of available solar power and grid power. This can be defined as follows:
i = 1 N P l o o p , i t x i , t P ^ s o l a r t + P g r i d t , t   { 1 , . , T }
Equipment operation constraint: Each piece of equipment can only operate up to its demand limit, and this can be described as follows:
i = 1 N P l o o p , i t x i , t P l o o p , i t , i , t
Solar power utilization preference: To ensure priority is given to solar power, grid power usage is constrained, and this is described as follows:
P g r i d t P g r i d , m a x , t
where P g r i d , m a x , is a predefined limit for grid power usage based on sustainability goals.
Equipment priority constraint: Higher priority equipment should be allocated power first in the optimization process. This can be obtained as follows:
x i , t P l o o p , i t P r i o r i t y i P ^ s o l a r t + P g r i d t i , t
Assumptions:
  • The solar estimate P ^ s o l a r t is deterministic.
  • Equipment can be either ON or OFF (binary decision).
  • Critical equipment must always run; flexible equipment can be scheduled.
  • No energy storage is included in the model.

Mathematical Modelling of Indirect Carbon Reduction Metrics

Since direct carbon emission data is unavailable, we inferred low carbon outcomes using indirect metrics. These metrics focus on optimizing solar utilization, minimizing grid reliance, and improving energy efficiency, which collectively contribute to carbon reduction.
The Solar Utilization Rate (SUR): Measures how effectively the equipment utilizes the available solar energy and reflects the proportion of estimated solar energy that is used. This is defined as follows:
S U R = t = 1 T S o l a r   P o w e r   U s e d ( t ) t = 1 T P ^ s o l a r t × 100
where:
  • S o l a r   P o w e r   U s e d t = m i n P ^ s o l a r t ,   i = 1 N P l o o p , i t x i , t
  • T : Total number of time intervals.
Solar Coverage Ratio (SCR): Indicates the share of total energy demand that was met by solar power. It is useful to assess the contribution of solar in the overall energy mix:
S C R = t = 1 T S o l a r   P o w e r   U s e d ( t ) t = 1 T T o t a l   L o a d t × 100
where:
  • T o t a l   l o a d ( t ) = i = 1 N P l o o p , i t x i , t
Here, the numerator guarantees that only the portion of solar power directly used by the equipment is considered. Equation (14) measures the degree of solar power penetration into the industrial demand.
Grid Independence Factor (GIF): Measures the reduction in grid electricity consumption relative to total energy demand, with a higher GIF indicating greater independence from grid electricity and contributing to lower carbon emissions, as grid power is often carbon-intensive.
G I F = t = 1 T P g r i d t t = 1 T T o t a l   L o a d t × 100
The objective of Equation (15) is to maximize GIF by reducing Pgrid(t), and measures the residual reliance on external electricity.
Energy Efficiency (EE): This metric reflects the effective use of total energy inputs, indicating reductions in energy waste and alignment with renewable generation. While SUR focuses exclusively on solar usage, EE provides a broader measure of operational optimization across both renewable and grid sources. It evaluates improvements from optimized dispatch by comparing the energy supplied to equipment with their actual demand. It is defined as follows:
E E = t = 1 T i = 1 N U s e f u l   E n e r g y ( i , t ) t = 1 T i = 1 N P l o o p , i t × 100
where:
  • Useful Energy ( i , t ) = P l o o p , i t   x i , t : The energy used by the equipment i at time   t .
  • P l o o p , i t : The theoretical power demand of equipment i at time   t .
To maximize simultaneously all three metrics, the optimization model can be expressed as a multi-objective optimization problem or converted into a single-objective problem using a weighted-sum approach. This is defined as follows:
M a x i m i z e   =   α     S U R   +   β     G I F   +   γ     E E
where:
  • α, β, γ: Weighting factors representing the relative importance of each metric.
  • α + β + γ = 1
In this study, the weights were selected based on the operational priorities of the iron and steel enterprise, with higher emphasis placed on maximizing solar utilization (α), followed by ensuring grid independence (β), and finally improving overall energy efficiency (γ). The sum of the weights is constrained to 1 to maintain a normalized objective function. Sensitivity analysis was also performed to ensure that the optimization results remain robust under different weight configurations.

4. Results and Discussion

4.1. The Energy Consumption of Ironmaking and Steelmaking

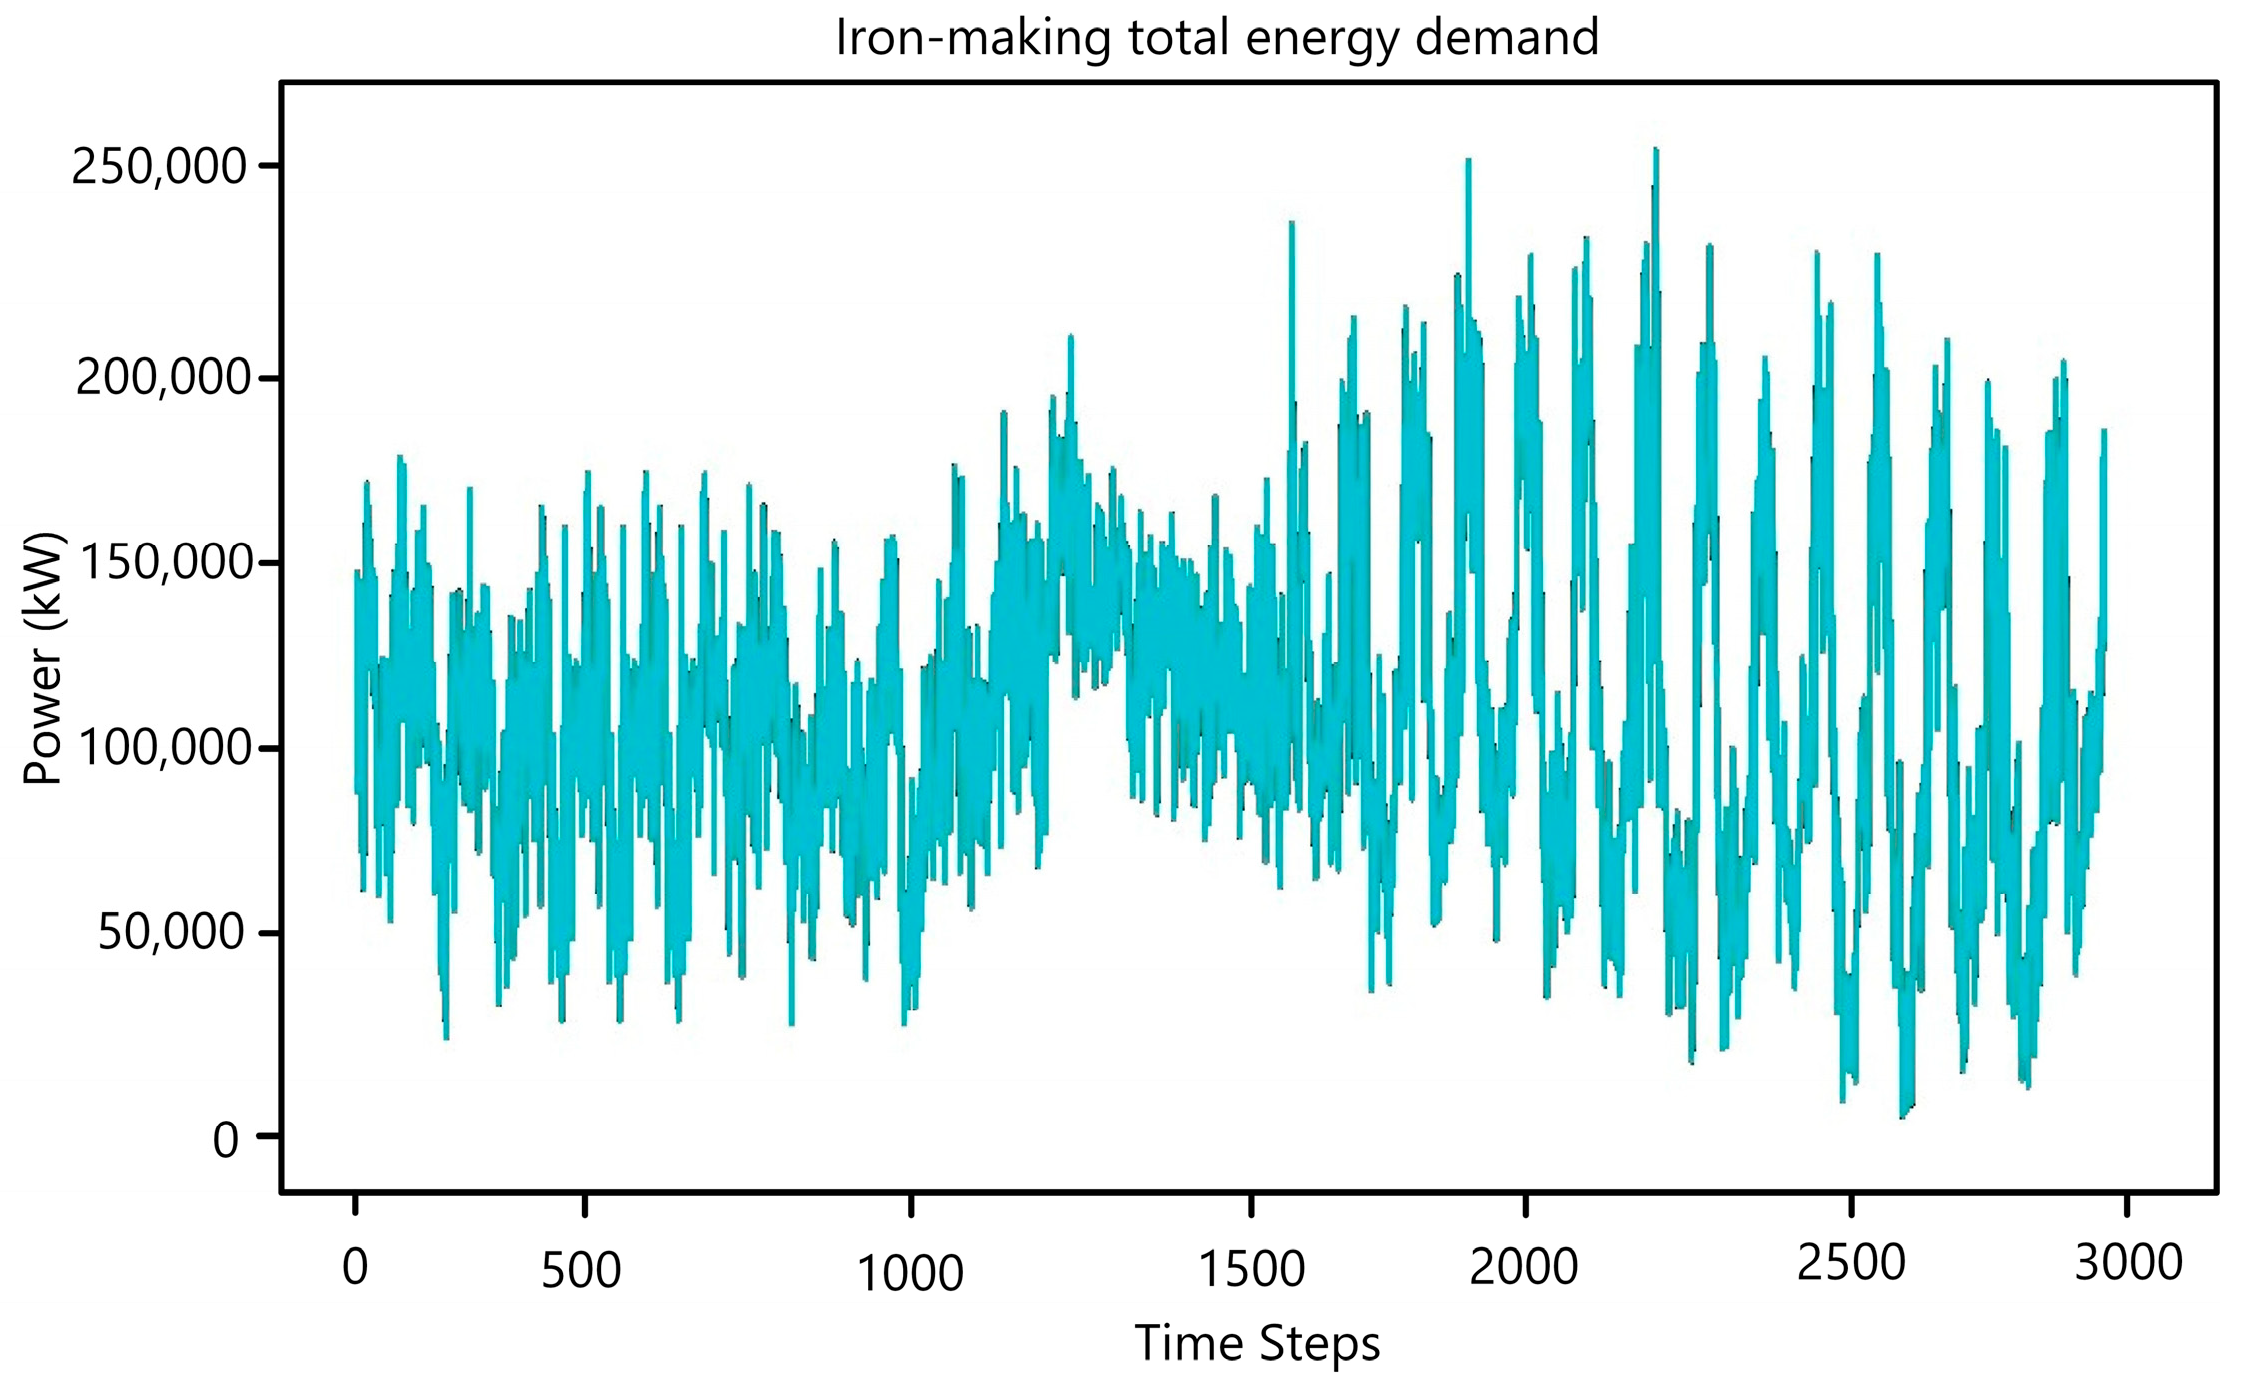
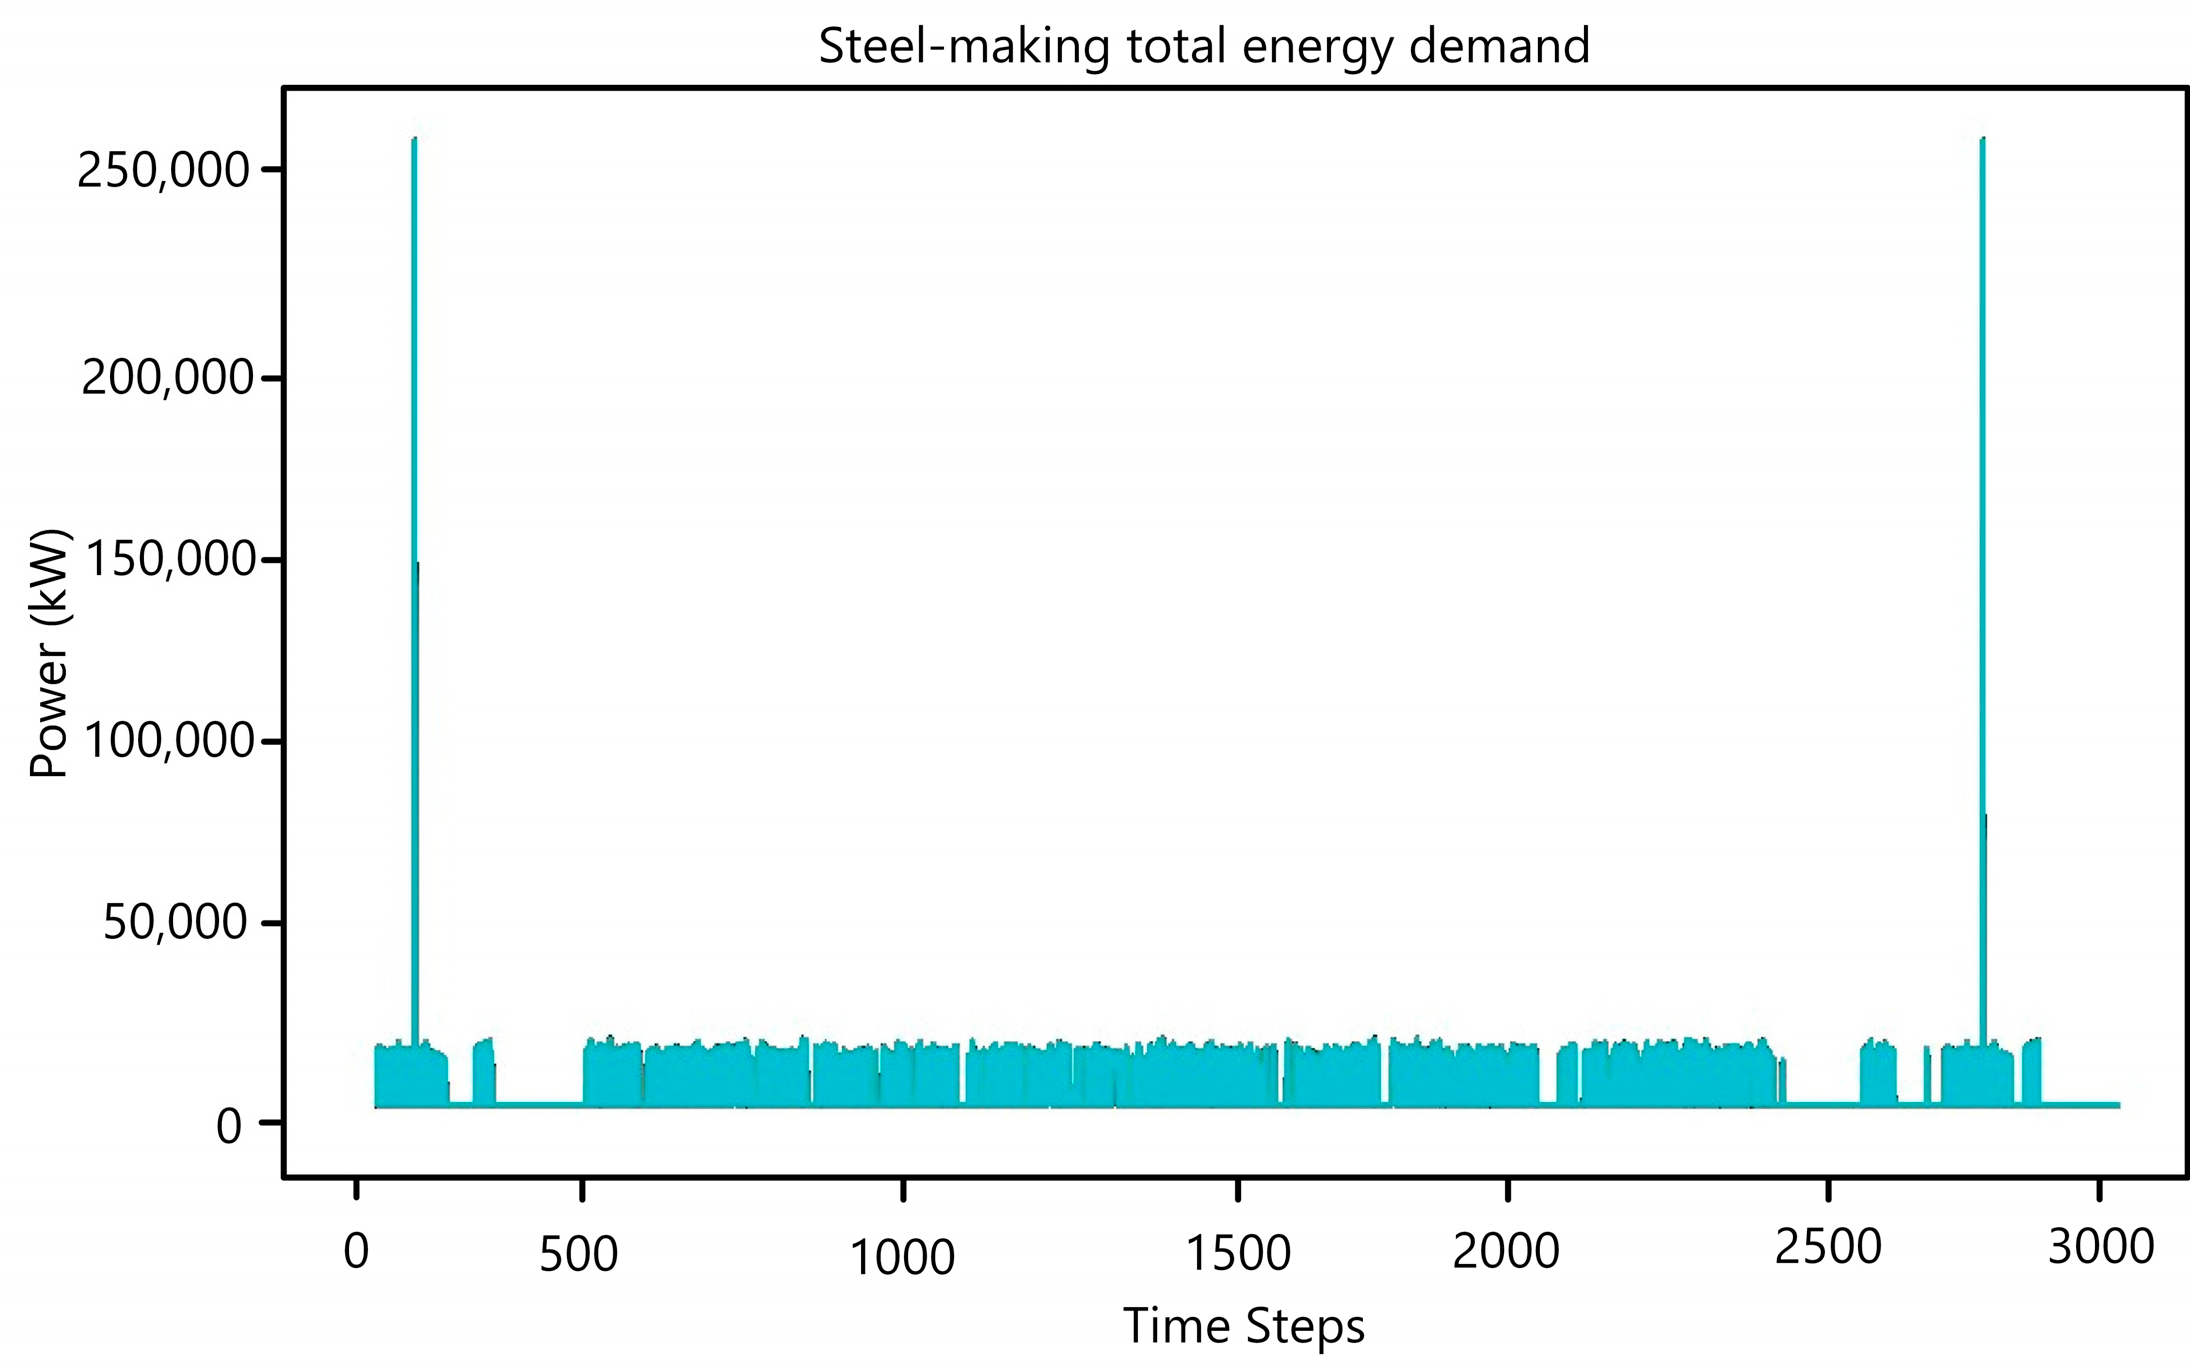
Figure 3 and Figure 4 show the load profiles of the ironmaking facilities and steelmaking facilities, respectively. These visualizations reveal the energy-intensive nature of ironmaking, particularly during the refining furnace and heating furnace operations, which involve substantial thermal and mechanical processes. On the other hand, the load profile for steelmaking is less energy-demanding due to the transformation of processed iron into steel, particularly in rolling mills, casting machines, electric furnaces, and carrier machines.

4.2. Grid Power Usage Without Incorporating Estimated Solar Power Energy

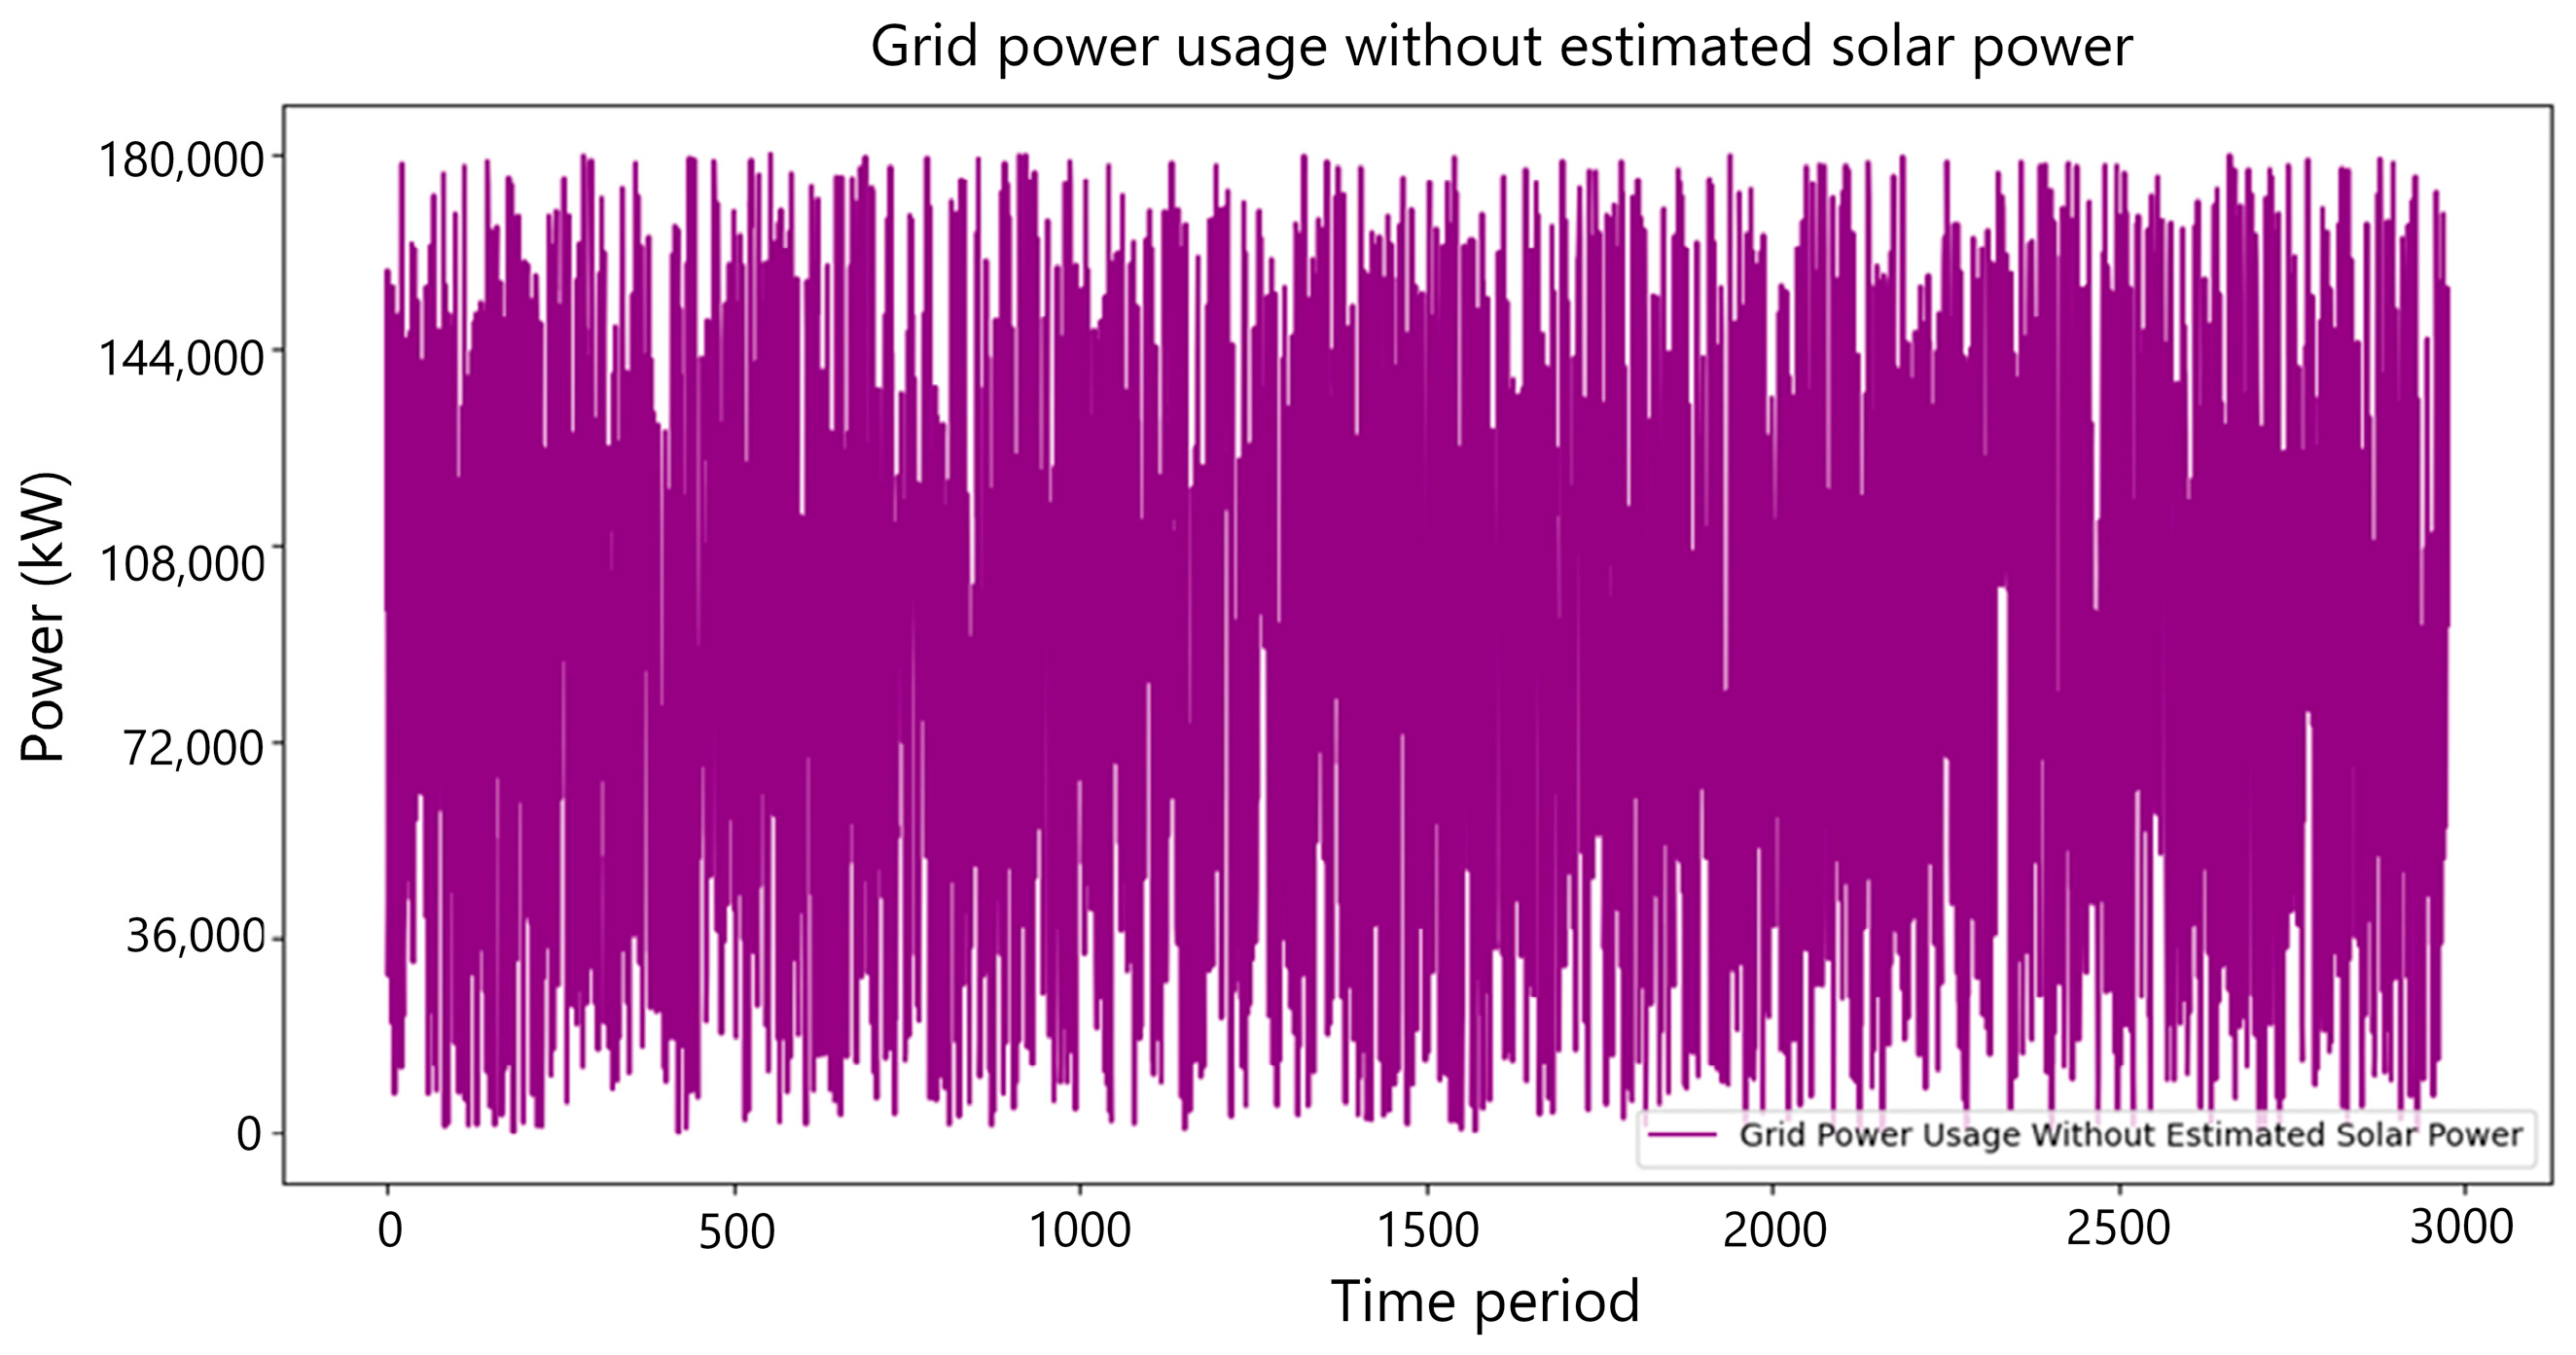
Figure 5 illustrates the total grid energy power usage without estimated solar energy, and in this scenario, the grid supplies the entirety of the operational demand across all workshops and equipment. This observation reveals a heavy reliance on the grid during high-demand intervals, the constant load required to sustain essential operations, and the grid usage fluctuates from 0 kW to 180,000 kW, reflecting the variability of industrial energy consumption across 31-day periods.

4.3. Estimated Solar Power Data

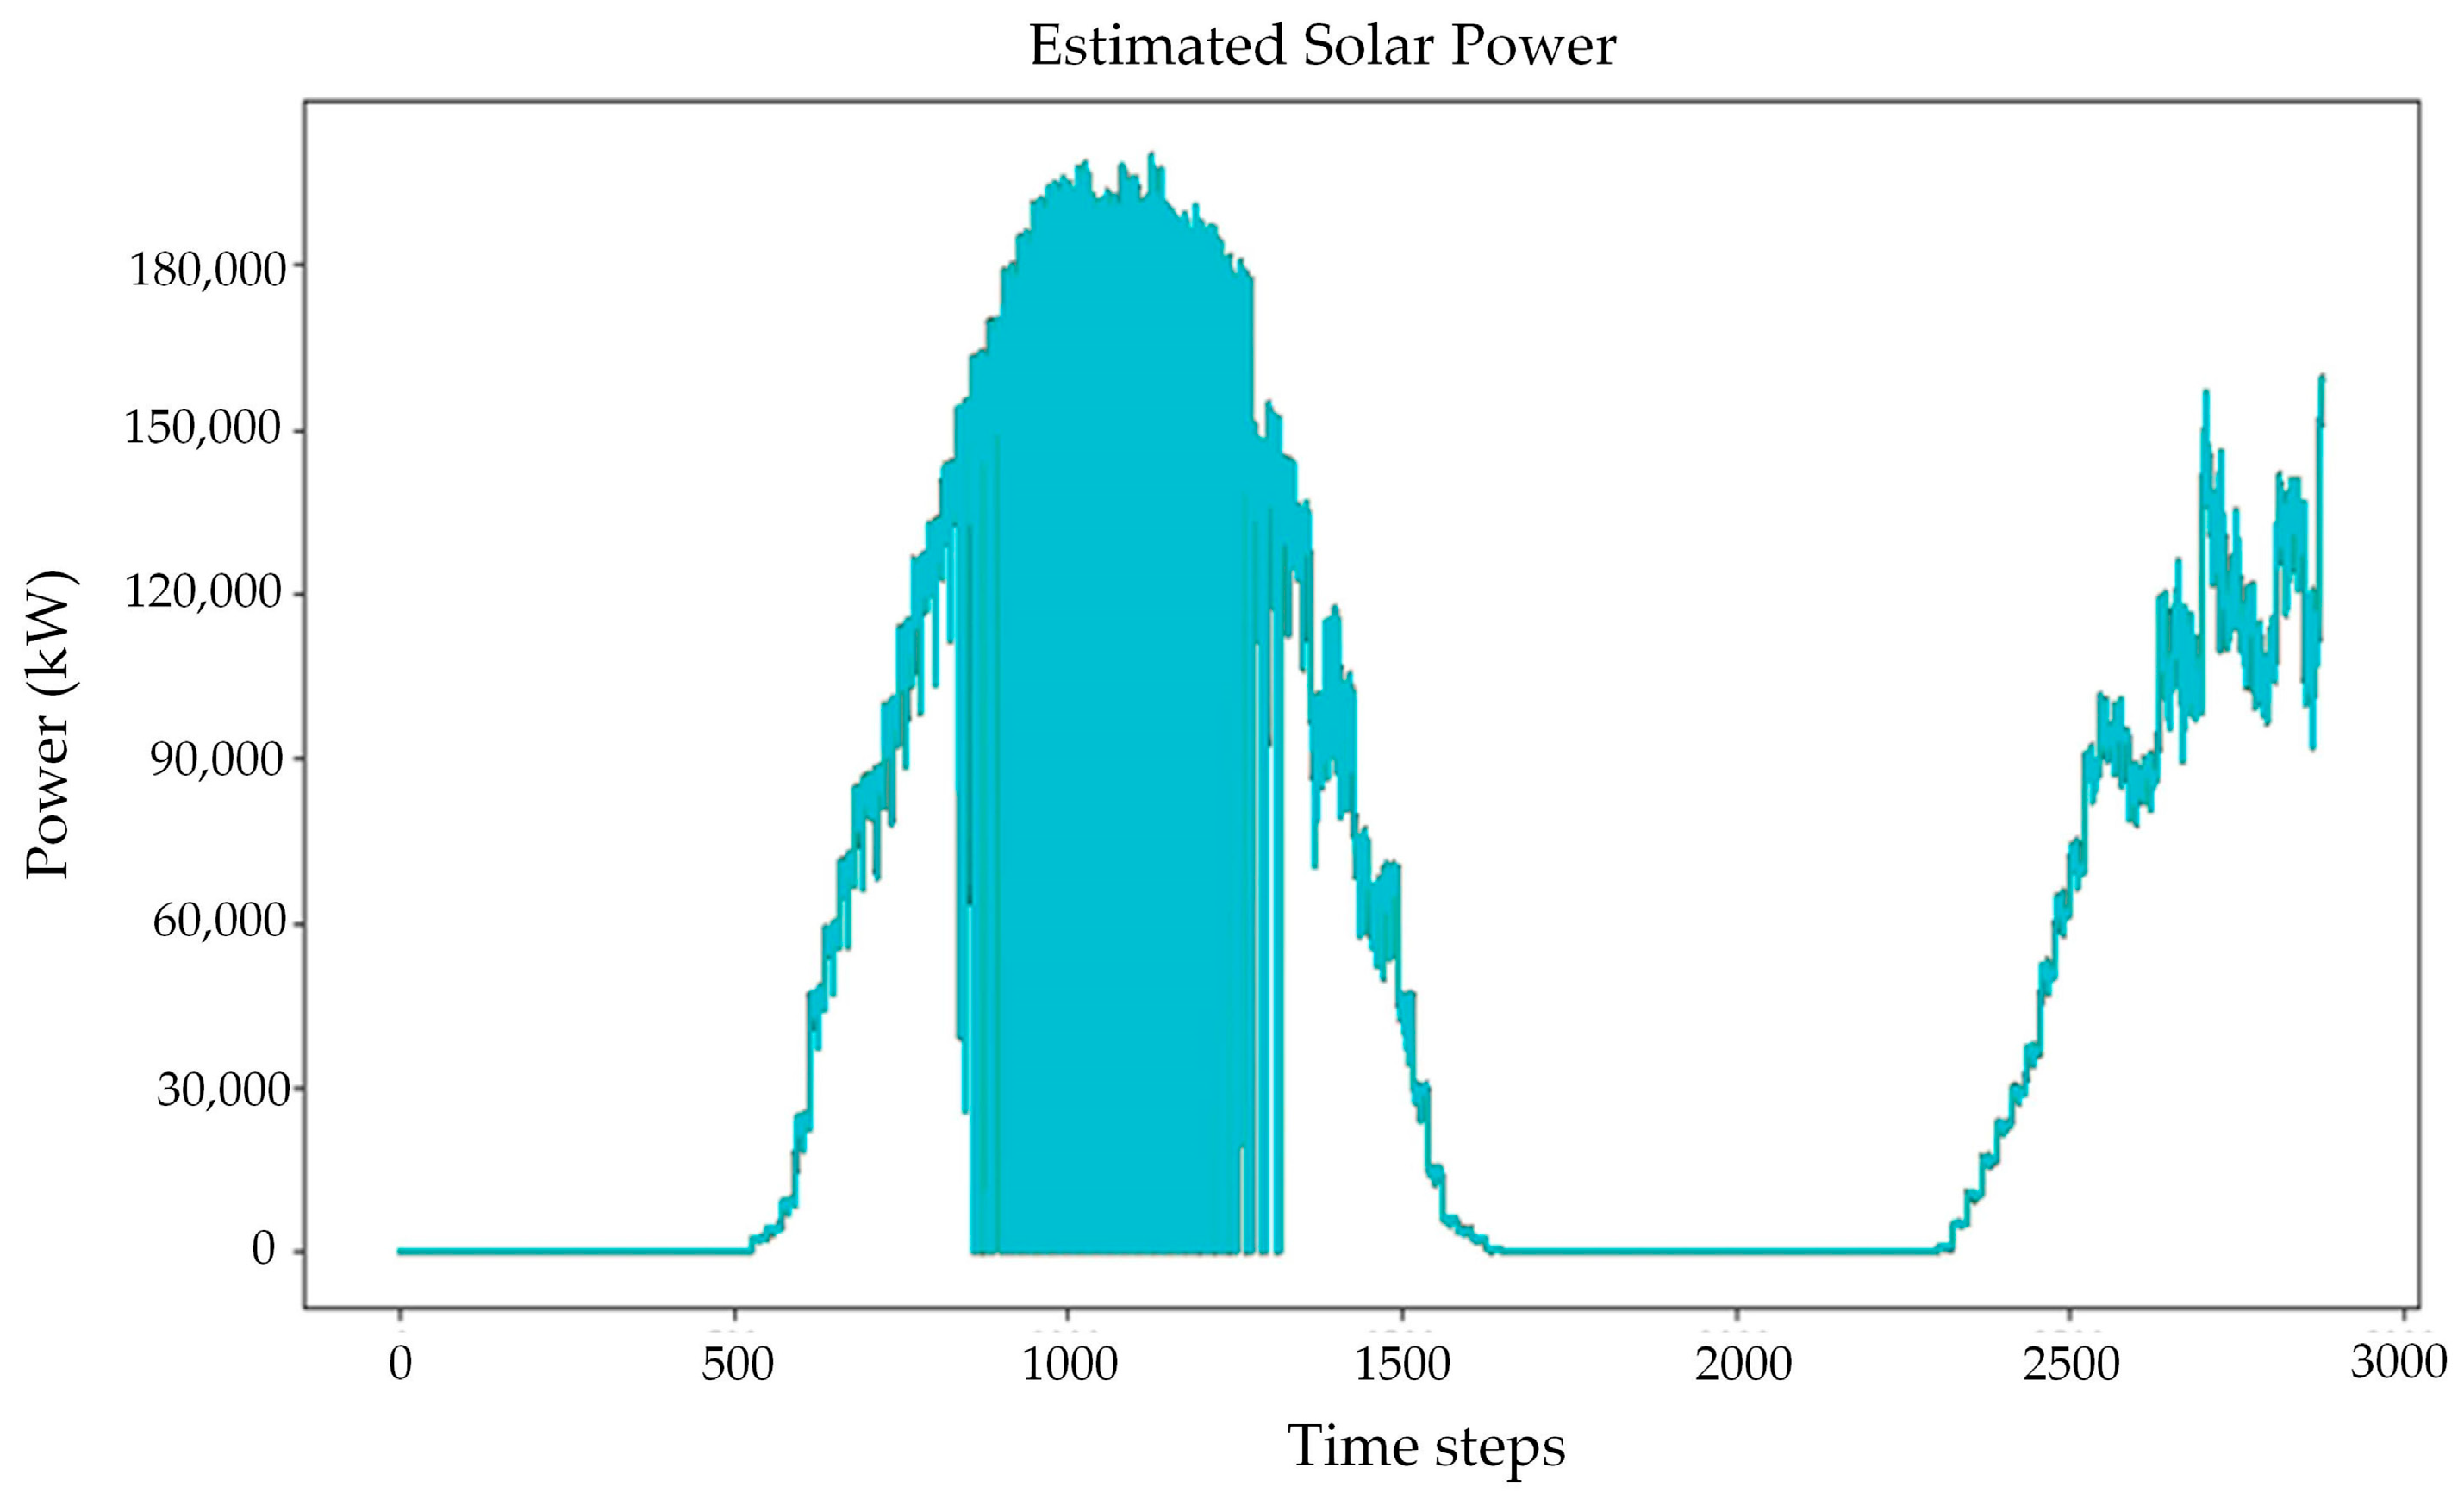
Figure 6 shows the estimated solar power data for operational integration. The fluctuation in power from 0 kW to 180,000 kW emphasizes the importance of dynamic load scheduling and energy storage systems to effectively use solar energy and other renewable energy while maintaining stable operations.

Handling of Solar Variability

The estimated solar power generation used in this study follows a deterministic, time-varying profile based on historical solar irradiance data relevant to the plant’s location. This profile, as shown in Figure 6, reflects typical fluctuations in solar availability resulting from daily cycles and weather patterns. While the model dynamically adjusts equipment operation in response to these variations, it does not currently incorporate stochastic uncertainty or real-time feedback mechanisms. Future work may extend this framework by introducing probabilistic forecasts and real-time optimization via predictive control.

4.4. Grid Power Usage with Estimated Solar Energy

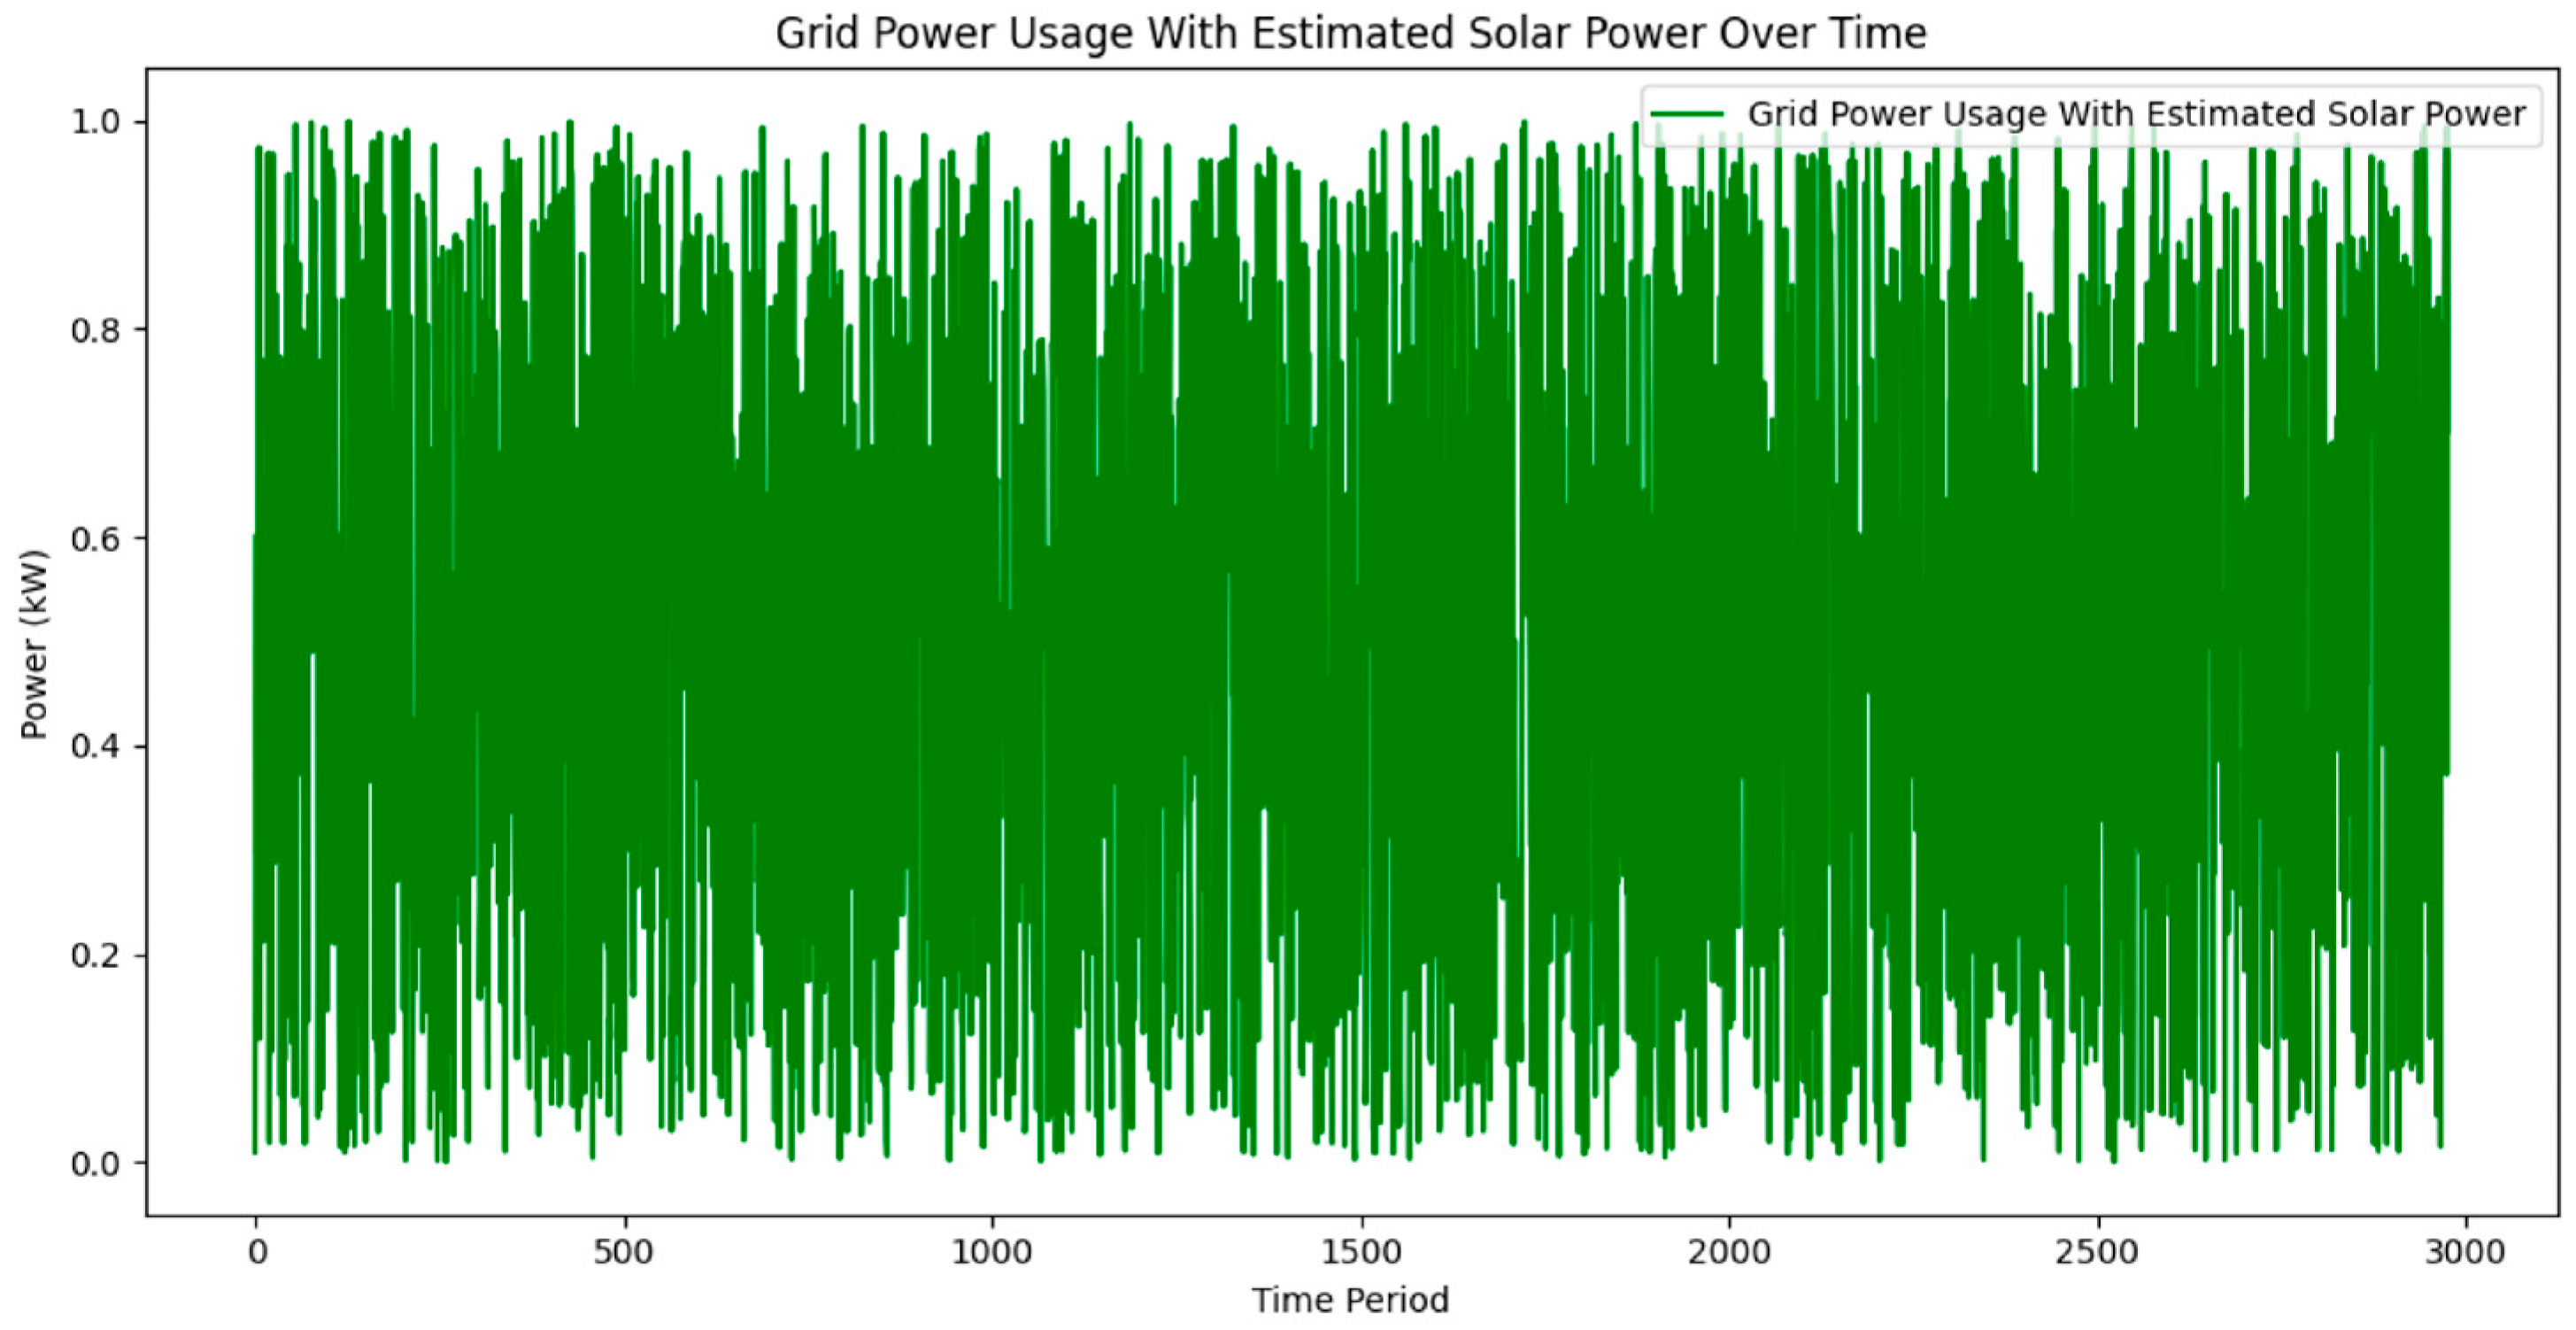
Figure 7 illustrates simulation results based on modeled solar generation and optimized load scheduling, rather than direct measurements from an installed PV system. The sharp reduction in grid power usage from 180,000 kW to 1 kW reflects the potential outcome of the optimization framework under idealized conditions. As a result, the effectiveness of the proposed optimization strategy shows the following objectives as achieved:
1.
Maximum Solar Utilization: The reduction in grid power and the requirement of only 1 kW of grid power signify that the system effectively leveraged the estimated solar power to meet nearly all operational demands. This indicates the optimization model’s ability to prioritize solar power for industrial processes, demonstrating its effectiveness in maximizing the utilization of renewable energy resources.
2.
Energy Cost Savings: Reducing grid power usage leads to a substantial reduction in operating costs, particularly in energy-intensive industries such as the iron and steel industry. Therefore, minimizing reliance on the grid power facility achieves greater energy autonomy.
3.
Decarbonization and Sustainability: Aligning with grid electricity often involves carbon-intensive energy sources; therefore, even without carbon emission data, eliminating grid dependency achieves a significant decarbonization goal.
4.
Operational Flexibility: This optimization strategy demonstrates the flexibility of the load scheduling strategy by prioritizing solar energy. Furthermore, achieving such low grid power usage demonstrates that industrial operations can adapt to renewable energy variability while maintaining productivity.

4.5. Sensitivity Analysis: Impact of Solar and Load Variations

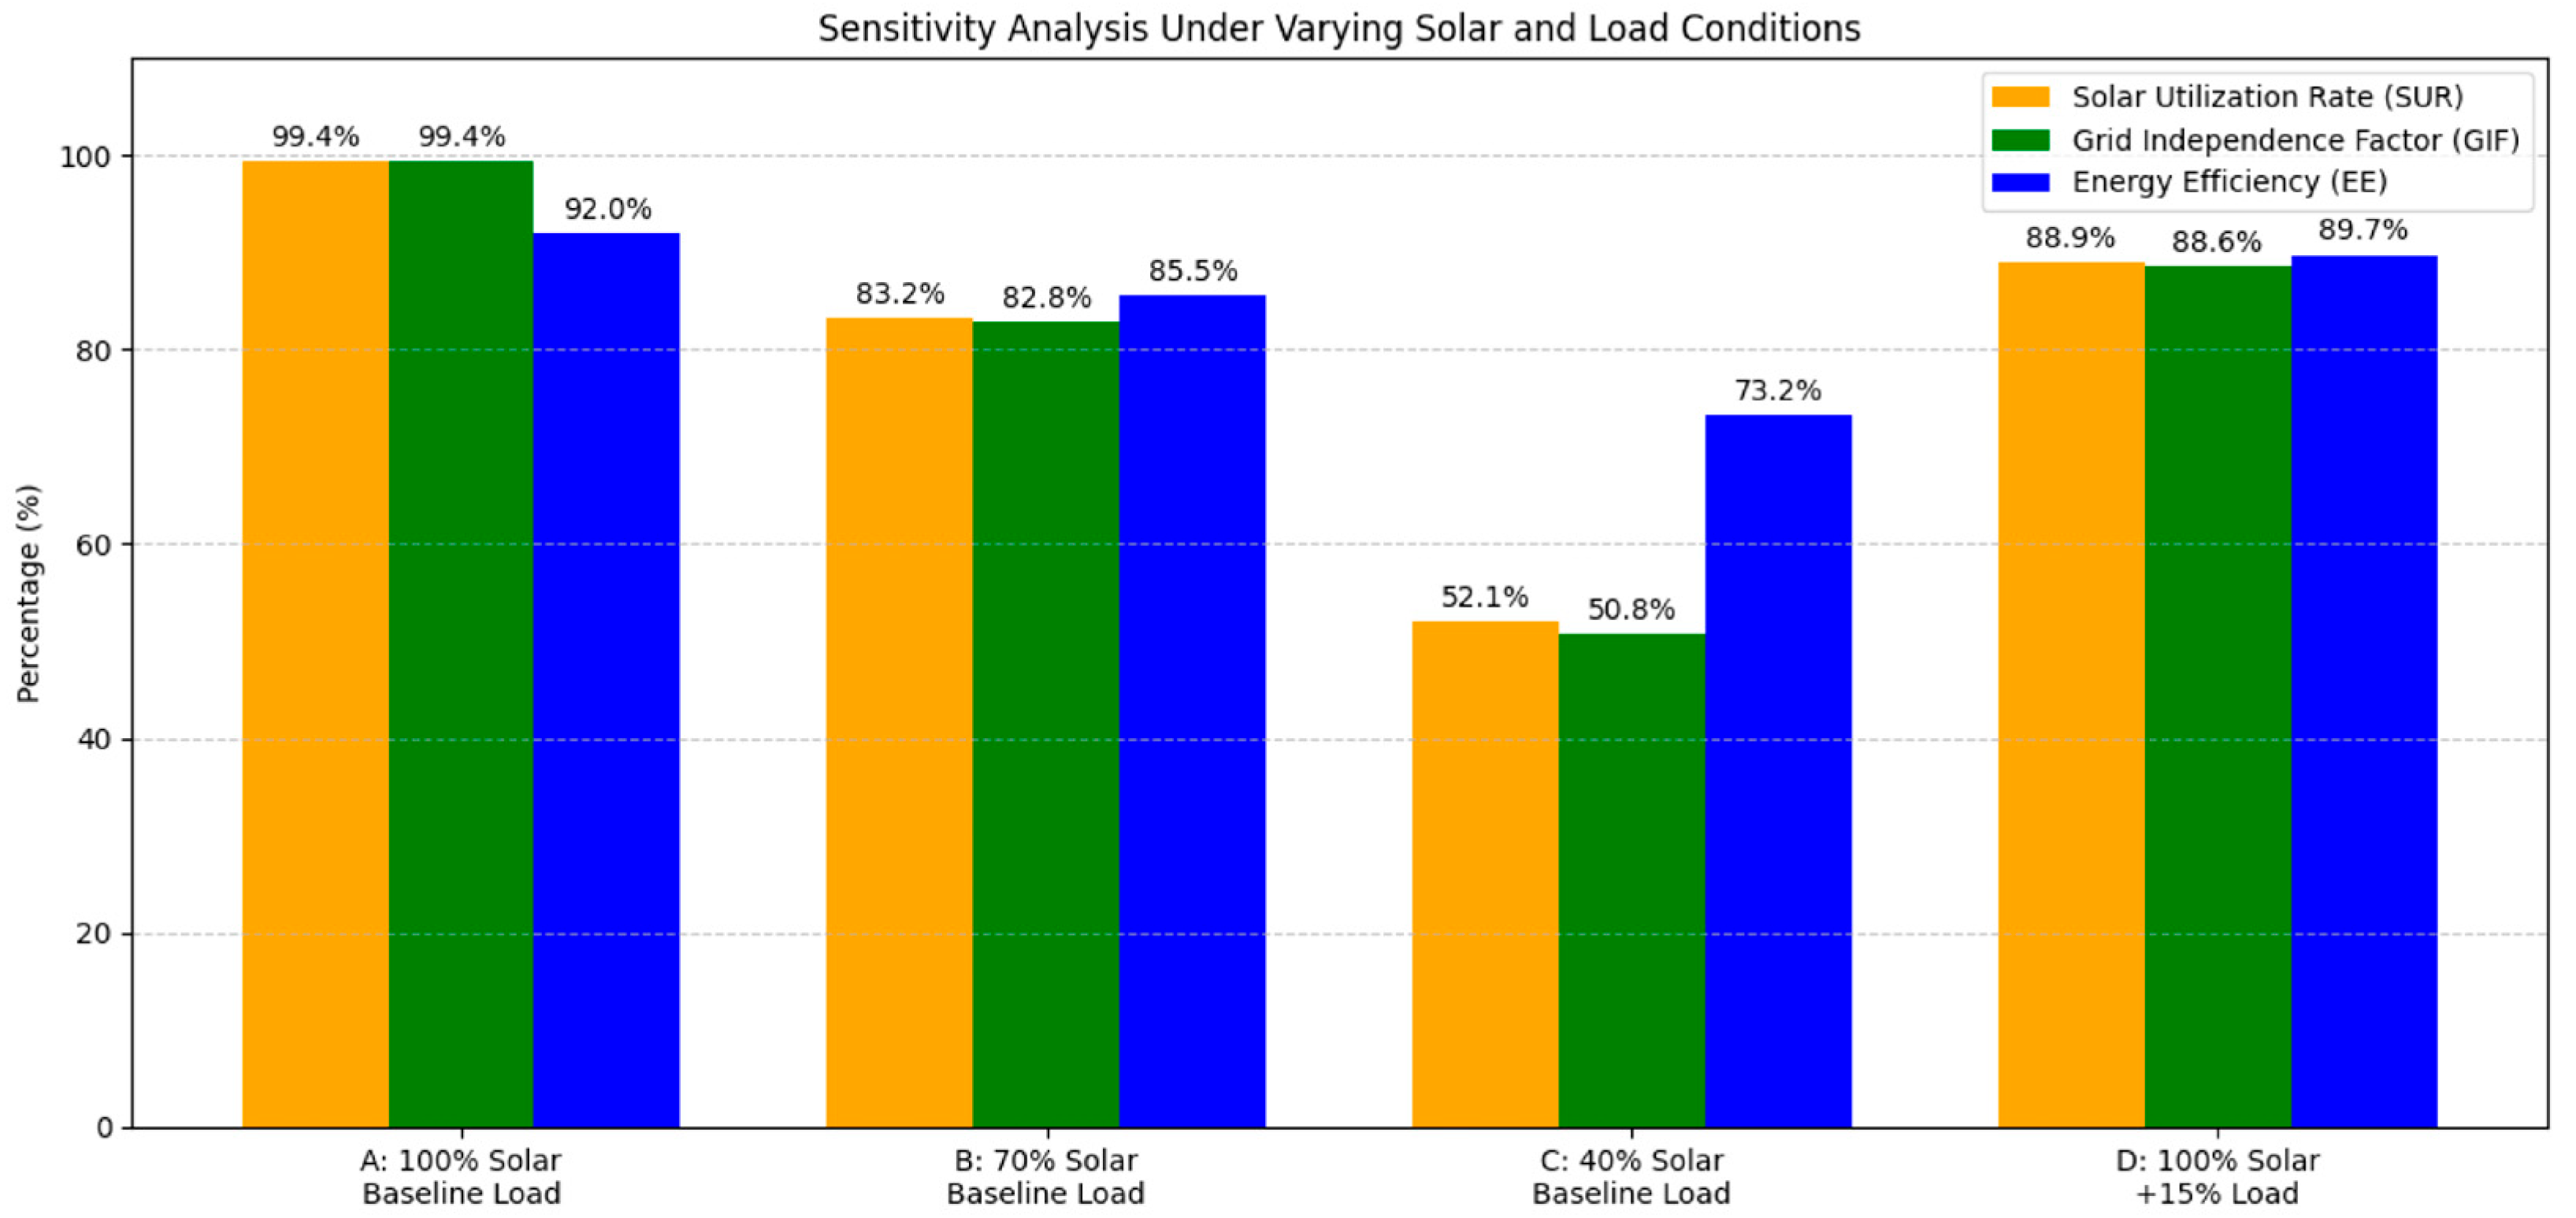
The sensitivity analysis, illustrated in Figure 8, evaluates the robustness of the proposed model under varying solar availability scenarios (100%, 70%, and 40%) and increased load conditions (+15% over baseline). Under baseline conditions (100% solar availability and nominal load), the model achieves near-optimal performance with a Solar Utilization Rate (SUR), Grid Independence Factor (GIF), and Energy Efficiency (EE) all reaching approximately 99.44%.
When solar availability drops to 70%, both SUR and GIF decline moderately to approximately 83%, while EE remains relatively high at 85.5%, indicating that the model maintains efficient scheduling and effective use of available solar energy. At 40% solar availability, SUR and GIF further decrease to around 52% and 51%, respectively, whereas EE remains above 73%, demonstrating the model’s resilience even under severe solar scarcity. Additionally, under increased load conditions (+15%) with 100% solar availability, all three metrics exhibit improvement: SUR and GIF rise to approximately 89%, and EE improves to 90%. This is because the additional demand allows for fuller utilization of the available solar energy, which would otherwise remain underutilized during periods of lower load. As more equipment operates concurrently, the model aligns their schedules with peak solar output, thereby enhancing both the Solar Utilization Rate (SUR) and Grid Independence Factor (GIF). This effective matching of supply and demand also reduces reliance on the grid and increases overall Energy Efficiency (EE).

4.6. Equipment Operational Schedule over Time

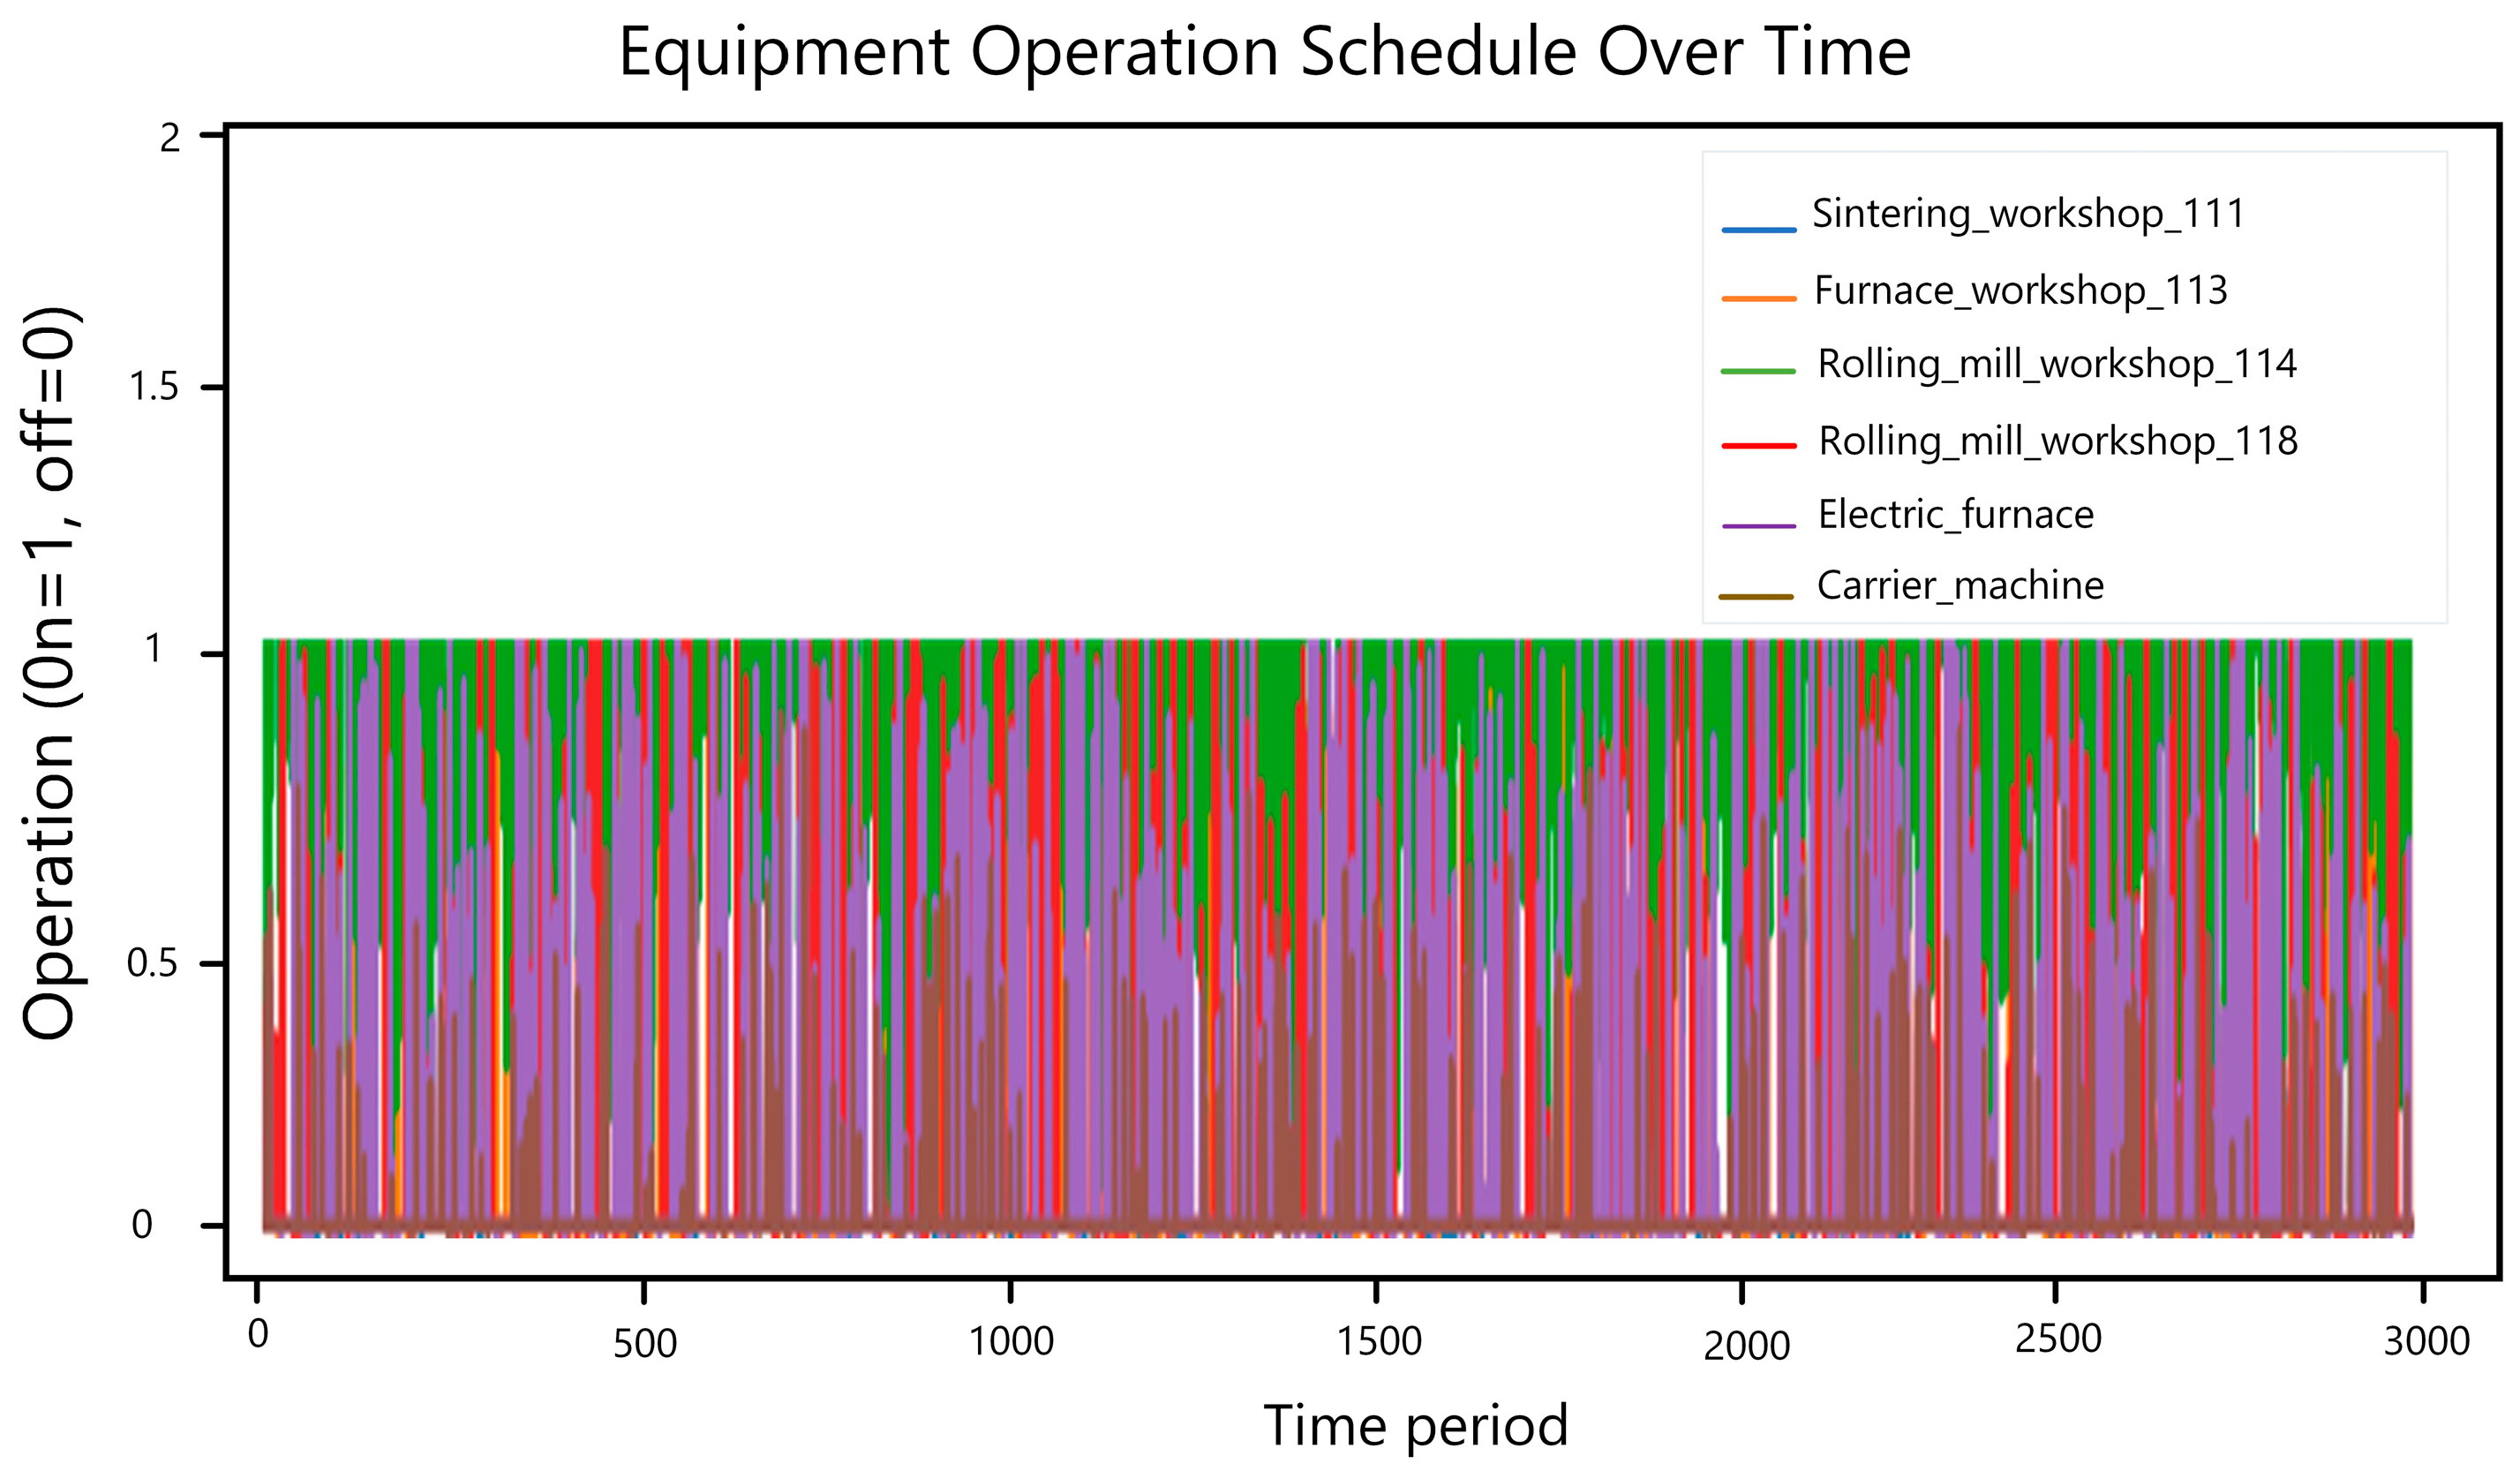
Figure 9 shows the operational schedule over time, which significantly indicates how the optimization aligns equipment activity with estimated solar energy availability. Binary decisions 1 and 0 indicate whether a piece of equipment operates, which is 1, or remains idle, which is 0, at a given time. The schedule ensures critical loads are prioritized while less essential operations are shifted to periods of higher solar power availability. This approach minimizes grid power usage, enhances energy efficiency, and supports decarbonization objectives by optimizing the operational timeline across all workshops.

5. Conclusions

This paper presents an optimization-based energy management strategy aimed at reducing grid dependency and increasing solar energy utilization in the iron and steel industry. Using real-world data from a 31-day operation of a steel enterprise, the proposed model effectively schedules flexible and critical loads to coincide with estimated solar power peaks. The results demonstrate a substantial reduction in grid electricity use and an increased reliance on solar power, contributing to measurable improvements in energy efficiency and sustainability.
While the study provides valuable insights, it is important to acknowledge that direct carbon emission data were not available, and therefore, carbon reduction is inferred indirectly through energy efficiency and grid independence. This limitation highlights the need for future work to incorporate emission-specific data to strengthen the link between energy management and decarbonization outcomes.
The model shows potential to enhance operational alignment with renewable availability; however, claims regarding scalability and broader applicability should be treated cautiously until validated in larger and more diverse industrial contexts. Future research will focus on practical extensions such as integrating stochastic solar forecasting, exploring the role of energy storage, and evaluating pathways for market participation. These directions will enhance the real-world applicability of the framework and support more systematic low-carbon transitions in energy-intensive sectors.

Author Contributions

Writing the original manuscript, S.B.F.; reviewing and editing the original draft, S.B.F. and B.L.; Conceptualization, S.B.F., B.L., and B.Q.; Methodology, S.B.F., B.L., and S.C.; Software, S.B.F.; Formal analysis, S.B.F., B.L., B.Q., and F.G.; Visualization, S.B.F., B.L., and F.G.; Validation, S.B.F., B.L., and S.C.; Funding acquisition, B.L., and B.Q.; Data curation, B.L., B.Q., S.C., and F.G.; Supervisor, B.L., and B.Q. All authors have read and agreed to the published version of the manuscript.

Funding

Project supported by the Science and Technology Projects from the State Grid Corporation, 5400-202316228A-1-1-ZN.

Data Availability Statement

Data is contained within the article.

Conflicts of Interest

Authors Songsong Chen and Feixiang Gong are employed by China Electric Power Research Institute Co., Ltd. The remaining authors declare that the research was conducted in the absence of any commercial or financial relationships that could be construed as a potential conflict of interest.

Appendix A

The datasets used in this study, including the User Gate Load Data and User Loop Load Data, are publicly available to ensure transparency and reproducibility. These datasets encompass timestamps, load values, and workshop details, providing comprehensive insight into the optimization process for load dispatch in the iron and steel industry.
The datasets were collected from 1 December 2023 to 31 December 2023, spanning 31 days at 15-min intervals. This can be accessed via the following link:
For further details about the dataset structure and variables, please refer to the documentation provided within the repository.

References

  1. Bilici, S.; Holtz, G.; Jülich, A.; König, R.; Li, Z.; Trollip, H.; Mc Call, B.; Tönjes, A.; Vishwanathan, S.S.; Zelt, O.; et al. Global trade of green iron as a game changer for a near-zero global steel industry?—A scenario-based assessment of regionalized impacts. Energy Clim. Change 2024, 5, 100161. [Google Scholar] [CrossRef]
  2. Lundmark, R.; Wetterlund, E.; Olofsson, E. On the green transformation of the iron and steel industry: Market and competition aspects of hydrogen and biomass options. Biomass Bioenergy 2024, 182, 107100. [Google Scholar] [CrossRef]
  3. Vigneswaran, V.S.; Gowd, S.C.; Rajendran, K. Pathways for decarbonizing the sponge iron industries: Effect of energy balance and impact assessment. J. Clean. Prod. 2024, 450, 141962. [Google Scholar] [CrossRef]
  4. Yang, Y.; Zhang, L.; Yuan, Y.; Sun, J.; Che, Z.; Qiu, Z.; Du, T.; Na, H.; Che, S. Muti-objective optimization on energy consumption, CO2 emission and production cost for iron and steel industry. J. Environ. Manag. 2023, 347, 119102. [Google Scholar] [CrossRef] [PubMed]
  5. Inayat, A. Current progress of process integration for waste heat recovery in steel and iron industries. Fuel 2023, 338, 127237. [Google Scholar] [CrossRef]
  6. Li, Q.; Wang, J.S.; She, X.F.; Xue, Q.G.; Wang, G.; Zuo, H.B. Feasibility and comprehensive evaluation of the application of different low-carbon technologies in the iron and steel industry. Fuel 2025, 381, 133434. [Google Scholar] [CrossRef]
  7. Ja’fari, M.; Khan, M.I.; Al-Ghamdi, S.G.; Jaworski, A.J.; Asfand, F. Waste heat recovery in iron and steel industry using organic Rankine cycles. Chem. Eng. J. 2023, 477, 146925. [Google Scholar] [CrossRef]
  8. Shen, J.; Zhang, Q.; Tian, S.; Li, X.; Liu, J.; Tian, J. The role of hydrogen in iron and steel production: Development trends, decarbonization potentials, and economic impacts. Int. J. Hydrogen Energy 2024, 92, 1409–1422. [Google Scholar] [CrossRef]
  9. Zhang, L.; Yuan, Y.; Xi, J.; Sun, J.; Yan, S.; Du, T.; Na, H. Synergistic enhancement for energy-saving, emission reduction and profit improvement in iron and steel manufacturing system: Strategies for parameter regulation and technologies integration. Energy Convers. Manag. 2024, 322, 119101. [Google Scholar] [CrossRef]
  10. Liu, Z.; Zheng, L.; Liu, X.; Guo, X.; Dai, S. Study on the influence of high permeability magnetic iron on energy consumption reduction in high gradient magnetic separator. Miner Eng. 2024, 219, 109064. [Google Scholar] [CrossRef]
  11. Yousuf, M.U.; Irshad, M.A.; Umair, M. Identifying barriers and drivers for energy efficiency in steel and iron industries of Karachi, Pakistan: Insights from executives and professionals. Energy Nexus 2024, 14, 100284. [Google Scholar] [CrossRef]
  12. Liu, X.; Li, J.; Bai, C.; Peng, R.; Chi, Y.; Liu, Y. Optimum low-carbon transformation pathways of China’s iron and steel industry towards carbon neutrality based on a dynamic CGE model. Energy 2024, 313, 134023. [Google Scholar] [CrossRef]
  13. Narasipuram, R.P.; Mopidevi, S. Assessment of E-mode GaN technology, practical power loss, and efficiency modelling of iL2C resonant DC-DC converter for xEV charging applications. J. Energy Storage 2024, 91, 112008. [Google Scholar] [CrossRef]
  14. Ray, S.; Kasturi, K.; Nayak, M.R. Multi-objective electric vehicle charge scheduling for photovoltaic and battery energy storage based electric vehicle charging stations in distribution network. Green Energy Intell. Transp. 2025, 4, 100296. [Google Scholar] [CrossRef]
  15. Zhao, J.; Ma, L.; Zayed, M.E.; Elsheikh, A.H.; Li, W.; Yan, Q.; Wang, J. Industrial reheating furnaces: A review of energy efficiency assessments, waste heat recovery potentials, heating process characteristics and perspectives for steel industry. Process. Saf. Environ. Prot. 2021, 147, 1209–1228. [Google Scholar] [CrossRef]
  16. Laasri, S.; El Hafidi, E.M.; Mortadi, A.; Chahid, E.G. Solar-powered single-stage distillation and complex conductivity analysis for sustainable domestic wastewater treatment. Environ. Sci. Pollut. Res. 2024, 31, 29321–29333. [Google Scholar] [CrossRef]
  17. Banothu, C.S.; Gorantla, S.R.; Attuluri, R.V.B.; Evuri, G.R. Impacts of wireless charging system for electric vehicles on power grid. e-Prime Adv. Electr. Eng. Electron. Energy 2024, 8, 100561. [Google Scholar] [CrossRef]
  18. Tabassum, S.; Babu, A.R.V.; Dheer, D.K. Real-time power quality enhancement in smart grids through IoT and adaptive neuro-fuzzy systems. Sci. Technol. Energy Transit. (STET) 2024, 79, 89. [Google Scholar] [CrossRef]
  19. Banothu, C.S.; Rao, G.S.; Vijay Babu, A.R. Magnetic Coupling Spiral-Square Coil Mutual Inductance Evaluation for Interoperable Conditions with Different Misalignments. In Proceedings of the 2023 3rd International Conference on Emerging Frontiers in Electrical and Electronic Technologies, ICEFEET 2023, Patna, India, 21–22 December 2023; Institute of Electrical and Electronics Engineers Inc.: New York, NY, USA, 2023. [Google Scholar] [CrossRef]
  20. Tikadar, B.; Swami, D.; Chowdhary, V. Process-level emission analysis and decarbonization pathway for BF-BOF route in Indian iron and steel industry. J. Environ. Manag. 2024, 373, 123483. [Google Scholar] [CrossRef]
  21. Dhasan, K.S.; Sathyamurthy, R.; Mohanasundaram, K.; Sudalaimuthu, P. Performance analysis on single slope solar still with absorber coated using iron oxide nanoparticles at different water thickness. Solar Energy 2023, 264, 112083. [Google Scholar] [CrossRef]
  22. Fang, H.; Gao, J.; Tong, Y.; Liu, Q.; Cheng, S.; Li, G.; Yue, T. Advances in the sources, chemical behaviour, and whole process distribution of Hg, As, and Pb in the iron and steel smelting industry. J. Hazard. Mater. 2024, 480, 135912. [Google Scholar] [CrossRef]
  23. Liu, D.; Wang, P.; Sun, Y.; Zhang, H.; Xu, S. Co-abatement of carbon and air pollutants emissions in China’s iron and steel industry under carbon neutrality scenarios. Renew. Sustain. Energy Rev. 2024, 191, 114140. [Google Scholar] [CrossRef]
  24. Xin, H.; Wang, S.; Chun, T.; Xue, X.; Long, W.; Xue, R.; Zhang, R. Effective pathways for energy conservation and emission reduction in iron and steel industry towards peaking carbon emissions in China: Case study of Henan. J. Clean. Prod. 2023, 399, 136637. [Google Scholar] [CrossRef]
  25. Andrade, C.; Desport, L.; Selosse, S. Net-negative emission opportunities for the iron and steel industry on a global scale. Appl. Energy 2024, 358, 122566. [Google Scholar] [CrossRef]
  26. Elsheikh, H.; Eveloy, V. Assessment of variable solar- and grid electricity-driven power-to-hydrogen integration with direct iron ore reduction for low-carbon steel making. Fuel 2022, 324, 124758. [Google Scholar] [CrossRef]
  27. Abanades, S.; Rodat, S. Solar-aided direct reduction of iron ore with hydrogen targeting carbon-free steel metallurgy. Renew Energy 2024, 235, 121297. [Google Scholar] [CrossRef]
  28. Sanglard, B.; Huneau, B.; Carrey, J.; Lachaize, S. Towards solar iron metallurgy: Complete hydrogen reduction of iron ore pellets under a concentrated light flux. Solar Energy 2024, 284, 113072. [Google Scholar] [CrossRef]
  29. Amir, M.; Ahmad, I.; Waseem, M.; Tariq, M. A Critical Review of Compensation Converters for Capacitive Power Transfer in Wireless Electric Vehicle Charging Circuit Topologies. Green Energy Intell. Transp. 2024, 4, 100196. [Google Scholar] [CrossRef]
  30. Gargari, L.S.; Joda, F.; Ameri, M.; Nami, H. Optimization and exergoeconomic analyses of water-energy-carbon nexus in steel production: Integrating solar-biogas energy, wastewater treatment, and carbon capture. Int. J. Hydrogen Energy 2024, 86, 275–292. [Google Scholar] [CrossRef]
  31. Purohit, S.; Brooks, G.; Rhamdhani, M.A.; Pownceby, M.I. Evaluation of concentrated solar thermal energy for iron ore agglomeration. J. Clean. Prod. 2021, 317, 128313. [Google Scholar] [CrossRef]
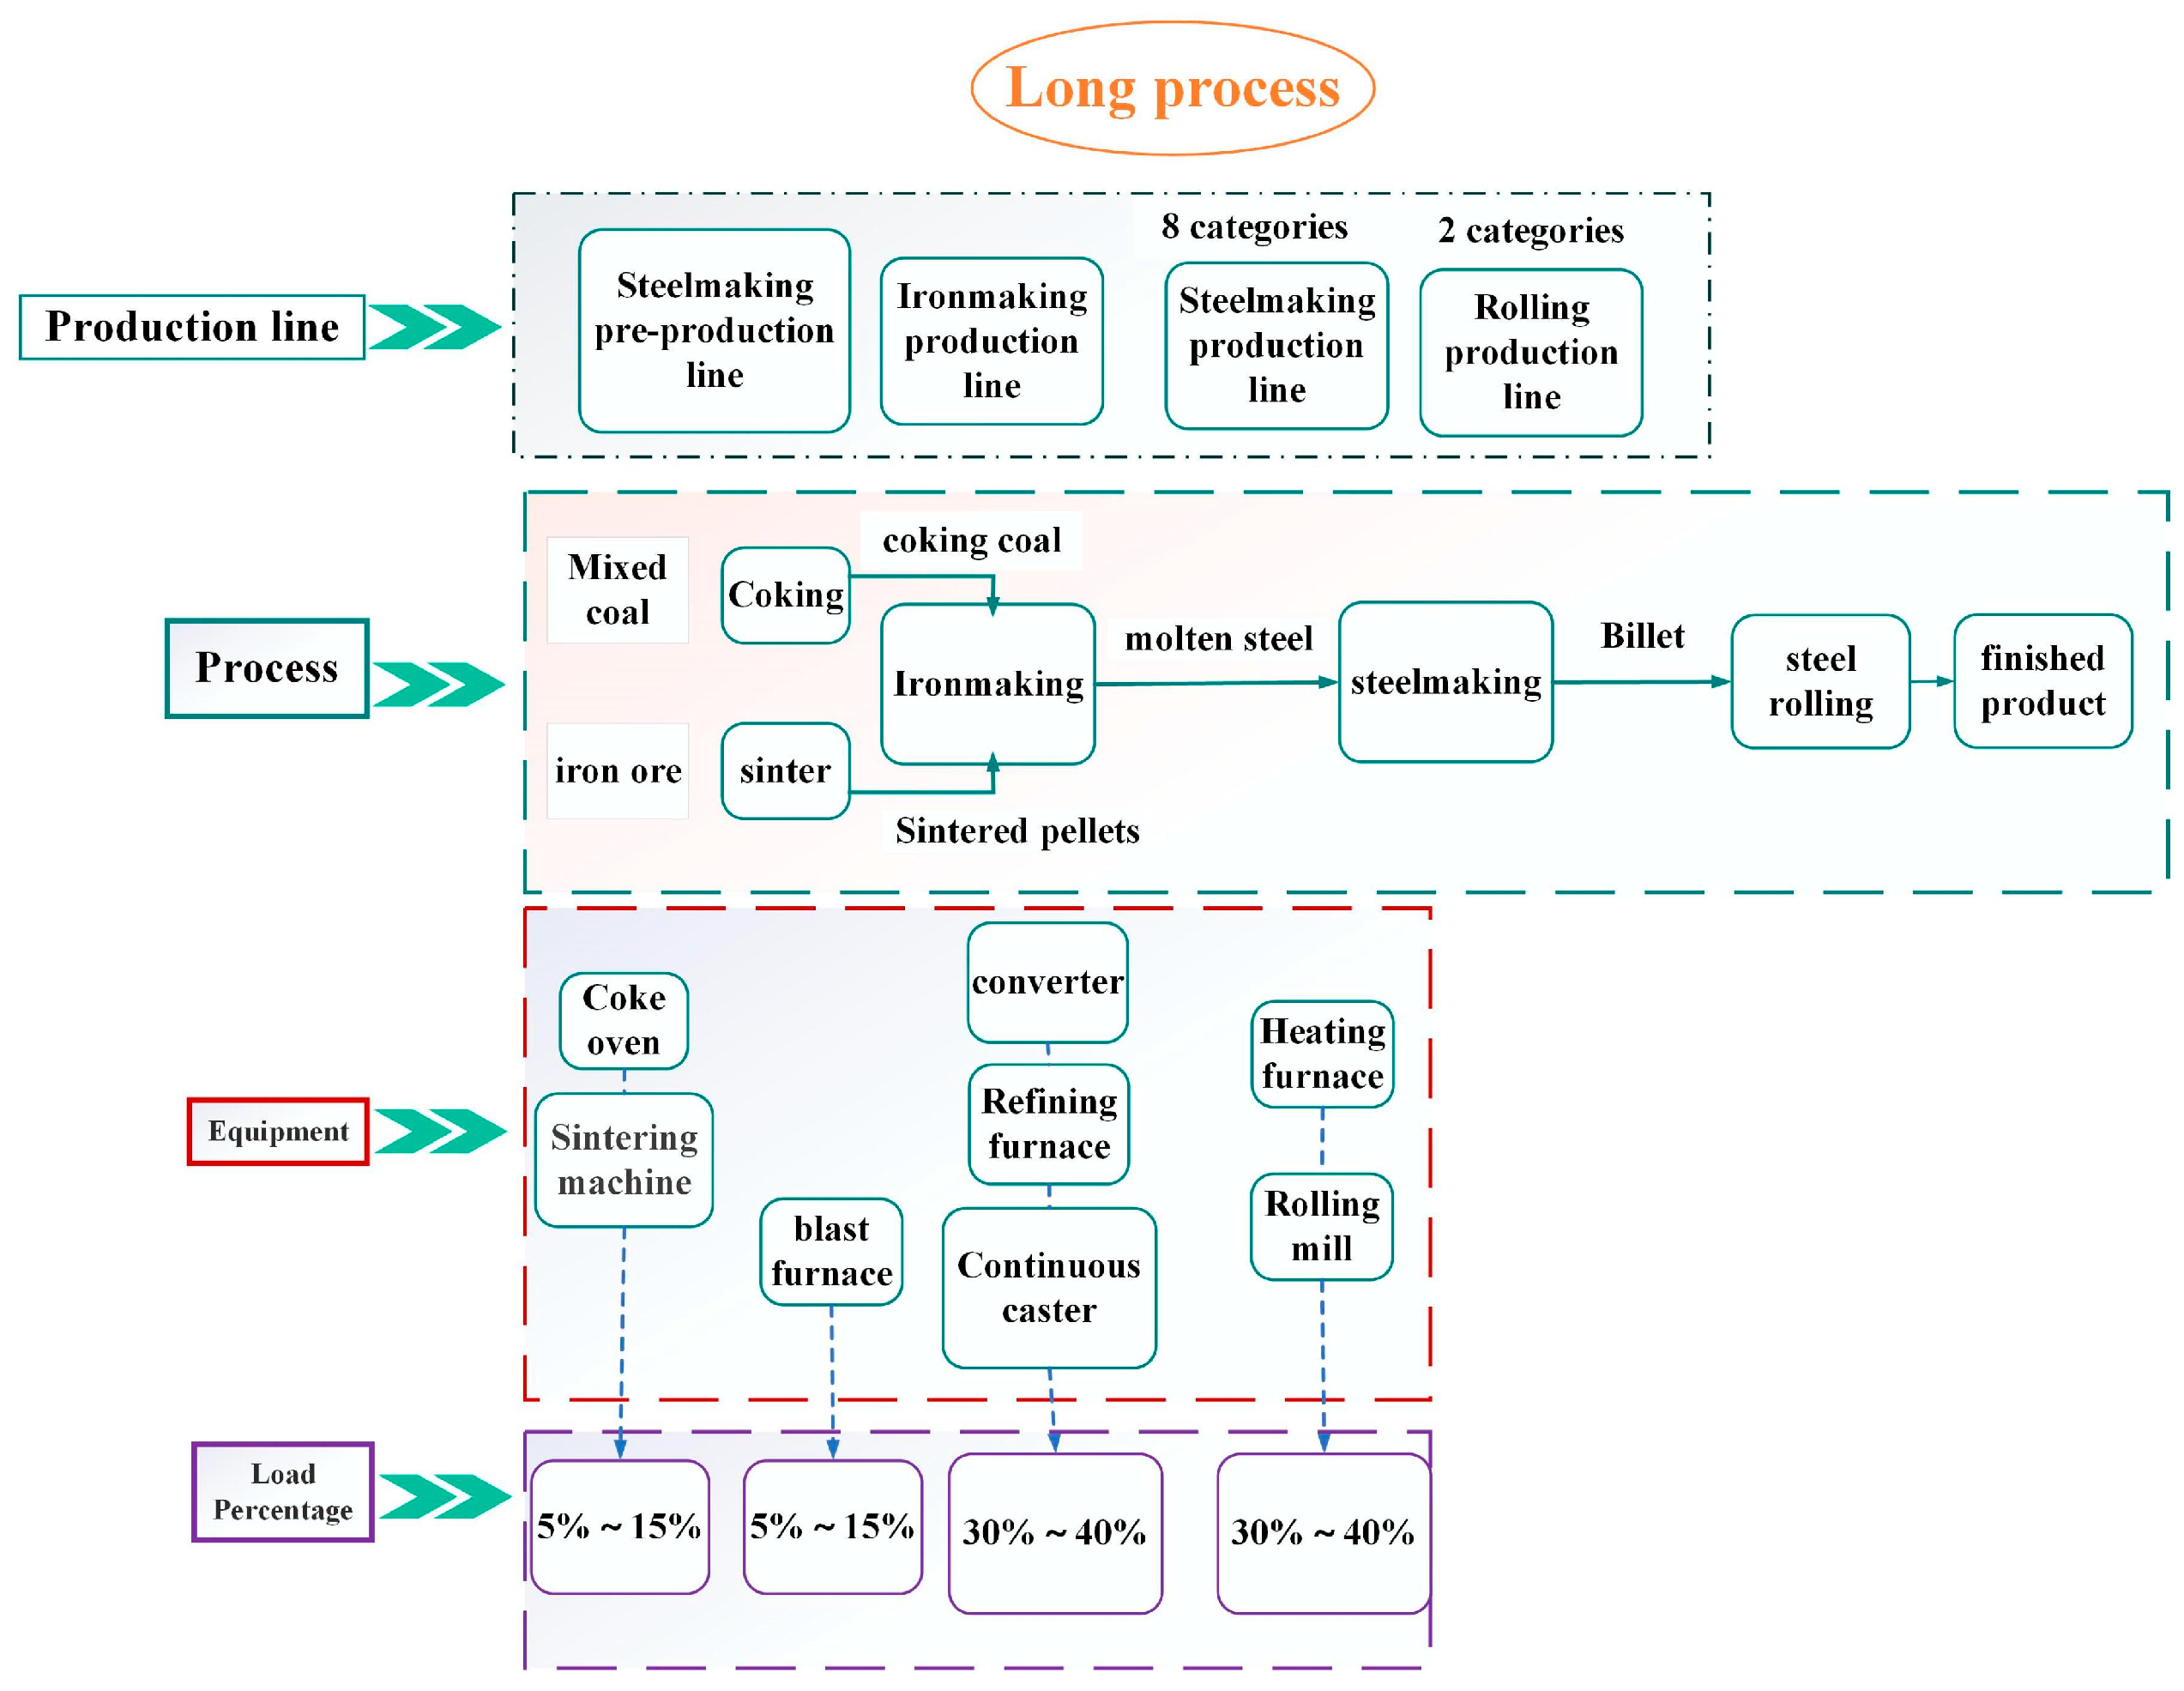
Figure 1. The long process mechanism model of the construction industry, illustrating key stages of production and energy flow.
Energies 18 04662 g001
Figure 2. The construction industry’s short process mechanism model highlights the simplified pathway with reduced energy intensity.
Energies 18 04662 g002
Figure 3. Load profile of the ironmaking facilities.
Energies 18 04662 g003
Figure 4. Load profile of the steelmaking facilities.
Energies 18 04662 g004
Figure 5. Total grid power usage without estimated solar energy.
Energies 18 04662 g005
Figure 6. Estimated solar power profile used for operational alignment, highlighting daily variability and peak output.
Energies 18 04662 g006
Figure 7. Simulated grid power consumption after integrating estimated solar energy, demonstrating a significant reduction compared to the baseline.
Energies 18 04662 g007
Figure 8. Sensitivity analysis of system performance under varying levels of solar availability scenarios, indicating the robustness of the optimization framework.
Energies 18 04662 g008
Figure 9. Optimized operational schedule of equipment over time, aligning flexible loads with solar generation peaks.
Energies 18 04662 g009
Disclaimer/Publisher’s Note: The statements, opinions and data contained in all publications are solely those of the individual author(s) and contributor(s) and not of MDPI and/or the editor(s). MDPI and/or the editor(s) disclaim responsibility for any injury to people or property resulting from any ideas, methods, instructions or products referred to in the content.