Article

Integrated Experimental and Numerical Investigation on CO2-Based Cyclic Solvent Injection Enhanced by Water and Nanoparticle Flooding for Heavy Oil Recovery and CO2 Sequestration

Faculty of Engineering and Applied Science, University of Regina, Regina, SK S4S 0A2, Canada
*
Authors to whom correspondence should be addressed.
Energies 2025, 18(17), 4663; https://doi.org/10.3390/en18174663
Submission received: 1 August 2025 / Revised: 27 August 2025 / Accepted: 1 September 2025 / Published: 2 September 2025

Abstract

Cyclic solvent injection (CSI) with CO2 is a promising non-thermal enhanced oil recovery (EOR) method for heavy oil reservoirs that also supports CO2 sequestration. However, its effectiveness is limited by short foamy oil flow durations and low CO2 utilization. This study explores how waterflooding and nanoparticle-assisted flooding can enhance CO2-CSI performance through experimental and numerical approaches. Three sandpack experiments were conducted: (1) a baseline CO2-CSI process, (2) a waterflood-assisted CSI process, and (3) a hybrid sequence integrating CSI, waterflooding, and nanoparticle flooding. The results show that waterflooding prior to CSI increased oil recovery from 30.9% to 38.9% under high-pressure conditions and from 26.9% to 28.8% under low pressure, while also extending production duration. When normalized to the oil saturation at the start of CSI, the Effective Recovery Index (ERI) increased significantly, confirming improved per-unit recovery efficiency, while nanoparticle flooding further contributed an additional 5.9% recovery by stabilizing CO2 foam. The CO2-CSI process achieved a maximum CO2 sequestration rate of up to 5.8% per cycle, which exhibited a positive correlation with oil production. Numerical simulation achieved satisfactory history matching and captured key trends such as changes in relative permeability and gas saturation. Overall, the integrated CSI strategy achieved a total oil recovery factor of approximately 70% and improved CO2 sequestration efficiency. This work demonstrates that combining waterflooding and nanoparticle injection with CO2-CSI can enhance both oil recovery and CO2 sequestration, offering a framework for optimizing low-carbon EOR processes.

1. Introduction

Heavy oil resources constitute a substantial portion of global oil reserves [1]. However, traditional thermal recovery methods are often ineffective in thin pay zones because of excessive heat loss [2]. As a result, non-thermal techniques such as cyclic solvent injection (CSI) using CO2 have emerged as promising alternatives, offering advantages including reduced energy consumption and the potential for simultaneous CO2 sequestration [3,4,5]. Nevertheless, a significant drawback of CO2-CSI is the short duration of the foamy oil flow, which leads to suboptimal oil recovery and limited CO2 storage efficiency [6,7].
Recent studies have explored diverse strategies to enhance the performance of CO2-CSI process, with particular emphasis on optimizing operating parameters. For instance, Qazvini Firouz and Torabi (2012) conducted 14 CSI experiments to evaluate the influence of injection pressure, identifying an optimal recovery factor of 71% with pure CO2 under near-supercritical conditions (7239 kPa, 28 °C) [8]. Research on waterflooding and solution gas drive further provides transferable insights that are highly relevant to CO2-CSI process. Adams (1982) analyzed multiple waterflooding cases in the Lloydminster area of western Canada and demonstrated that solution gas drive positively influenced heavy-oil recovery [9]. Smith (1992) further suggested that water could compress free gas into heavy oil, thereby reducing gas production and conserving solution-gas drive energy to propel oil towards the wellbore [10]. More recent studies have shown that coupling CO2 injection with waterflooding improves sweep efficiency, mitigates early gas breakthrough, sustains foamy-oil flow, and enhances heavy-oil recovery under reservoir-representative conditions [11,12,13,14]. Parallel efforts have focused on improving foam stability. Horozov (2008) demonstrated that nanoparticles can independently stabilize foams [15], while Mo et al. (2012) confirmed that nanoparticle-stabilized CO2 foams improve oil recovery across various rock types and perform particularly well at higher pressures, though with reduced effectiveness at elevated temperatures [16]. Building on this foundation, nanoparticle-assisted CO2 flooding has emerged as a promising approach for strengthening mobility control, reducing gas override, and improving both recovery performance and storage security [17,18,19,20]. Collectively, these studies highlight the potential of integrating high injection pressures, waterflooding, and nanoparticle technologies into CO2-CSI process.
Despite these advances, several critical challenges remain. The effectiveness of CO2-CSI is still constrained by the rapid collapse of foamy oil, gas channeling, and the inefficient utilization of injected CO2. Although nanoparticles and waterflooding have individually shown potential in addressing these issues, their combined effects in an integrated CSI process have not been systematically evaluated, particularly through coupled experimental and numerical approaches.
To address this research gap, the present study systematically investigates the synergistic effects of waterflooding and nanoparticle solution flooding on CO2-CSI performance, using both laboratory experiments and numerical simulations. By providing insights into oil recovery mechanisms, foamy-oil stability, and CO2 storage efficiency, this work aims to advance the development of more effective low-carbon EOR strategies for heavy oil reservoirs.

2. Materials and Methods

2.1. Materials

Heavy oil from the Manatokan field was used in this study, with a density of 964.3 kg/m3 and a viscosity of 2200 mPa·s at 21 °C. High-purity CO2 and N2 gases (99.99%) were supplied by Praxair Canada. The nanoparticle solution was prepared using Hydrophilic-300 nanoparticles (7–40 nm in diameter, surface area of 300 m2/g) at a concentration of 1000 mg/L. The sandpack model consisted of a 95 cm long, 3.8 cm inner diameter stainless steel tube, packed with sand ranging from 100 to 170 U.S. mesh.

2.2. Experimental Design

Figure 1 presents a schematic diagram of the experimental setup, which consists of three main components: an injection unit, a sandpack model, and a CO2 and oil production unit.
Prior to initiating the experiments, a thorough preparation procedure was conducted. The system was first flushed using toluene, kerosene, and ethanol to clean all tubes and pipelines, followed by air drying. Subsequently, a leak test was performed by introducing nitrogen. Finally, three injection cylinders, a back-pressure regulator (BPR), oil and gas collection devices were connected to the sandpack model.
The injection unit comprises three sections for CO2, water, and nanoparticle solution injections, each equipped with a dedicated cylinder and syringe pump. CO2 is introduced from the right side of the sandpack model, while water or nanoparticle solution are injected from the opposite end.
The sandpack model includes six ports and the inner wall was coated with electrical tape to create a rough surface. The model was positioned horizontally, with the CSI injector and producer located at the center of the right side, the water and nanoparticle solution was injected from the left side port. The model features four evenly spaced pressure monitoring points on one side, each equipped with a pressure transducer (PXM409-070BG10V, OMEGA Engineering Inc., Richmond Hill, ON, Canada). Pressure data were collected using LabVIEW 2012 software (NI CompactDAQ, National Instruments, Toronto, ON, Canada). An EquiliBAR BPR (EB1ZD1-SS316, Fletcher, NC, USA) was connected to control outlet pressure, regulated by a syringe pump.
During sandpack preparation, both sand weight and vibration time were strictly controlled within a 1% margin of error to ensure uniform porosity and permeability among all tests. Porosity was determined using the imbibition method, and permeability was measured by applying Darcy’s law with deionized water. The porosity and permeability of the three sandpack tests were consistently around 33% and 7.5 D, respectively.
The CO2 and oil production units comprise an oil collection section and a gas measurement section. The oil collection system, connected to the BPR, uses cone-shaped tubes. After each CSI cycle, the tubes were centrifuged for 60 min to separate oil and water, which were then measured individually. The gas measurement section consists of a gas flow meter (Rigamo, Bellheim, RP, Germany) connected to the cone tubes, with excess CO2 safely vented to a dedicated line.

2.3. Experimental Methodology

Prior to each test, Manatokan heavy oil was injected into the sandpack at an injection rate of 0.1 cc/min. Because each sandpack was prepared to have nearly identical properties (porosity and permeability), the resulting initial fluid saturations were highly reproducible: oil saturation was ~92.5%, and water saturation was ~7.5%.
The detailed steps of the experimental procedure are presented in Table 1. Test 1 (baseline) used standard CO2-CSI at 7100 kPa. Test 2 applied water flooding before CO2-CSI at the same pressure. Test 3 followed a hybrid process: initial CO2-CSI (6100 kPa), water flooding, second CO2-CSI (6100 kPa), nanoparticle flooding, and final CO2-CSI (6100 kPa). Water and nanoparticle solutions were injected at a constant rate of 0.1 cc/min, with a total injection volume equivalent to 1.5 pore volumes. CO2 was injected at 50 cc/min until the system reached the target pressure. Each CSI cycle consisted of a 1 h soaking stage, followed by production at a controlled depletion rate of 6 kPa/min.
Key parameters such as oil/water production, CO2 output, and system pressure were continuously monitored. Production fluids were separated and measured post-centrifugation.

2.4. Numerical Simulation Framework

All CO2-CSI processes were simulated using CMG STARS® (2023 Version), with the numerical model dimensions replicating those of the experimental setup. A one-dimensional reservoir model was constructed, with a total length of 95 cm and cross-sectional dimensions of 3.368 cm × 3.368 cm. The model comprises 95 grid blocks, each measuring 1 cm in length and 3.368 cm in both width and height. Grid sizes were proportionally scaled to ensure consistency with the cross-sectional area of the laboratory sandpack. Reservoir characteristics such as porosity, permeability, and initial fluid saturations were assigned directly from the experimental measurements to preserve comparability. These pivotal parameters ensured that the flow modeling accurately represented the experimental system and provided a reliable framework for analyzing CO2-CSI performance.
A numerical model specifically designed for the CO2-CSI process was developed to capture multiphase behavior during the injection and production stages. The modeling approach comprised two main steps: (1) generating distinct relative permeability curves for the injection and production stages based on Corey’s correlations, and (2) incorporating a dispersed gas model during the production phase.
Previous studies have underscored the necessity of using distinct relative permeability curves, derived from Corey’s correlations, to accurately simulate CSI processes [21,22].
The dispersed gas model, developed using the Foamy Oil Model Wizard in CMG Builder® (2023 Version), was applied during the production phase to convert low-mobility solution gas into high-mobility free gas as the pressure declined to the pseudo-bubble point, in accordance with Equations (1) and (2). This model regulates gas relative permeability as a function of gas saturation and solution gas content, thereby capturing the foamy-oil behavior observed in the experiments [23].
Soln gas→ Free gas
R e a c t i o n   r a t e = r r f × e E a R T
where rrf is the reaction frequency factor (CMG keyword: *FREQFAC), Ea denotes the activation energy (CMG keyword: *EACT), R is the universal gas constant, and T is the absolute temperature.
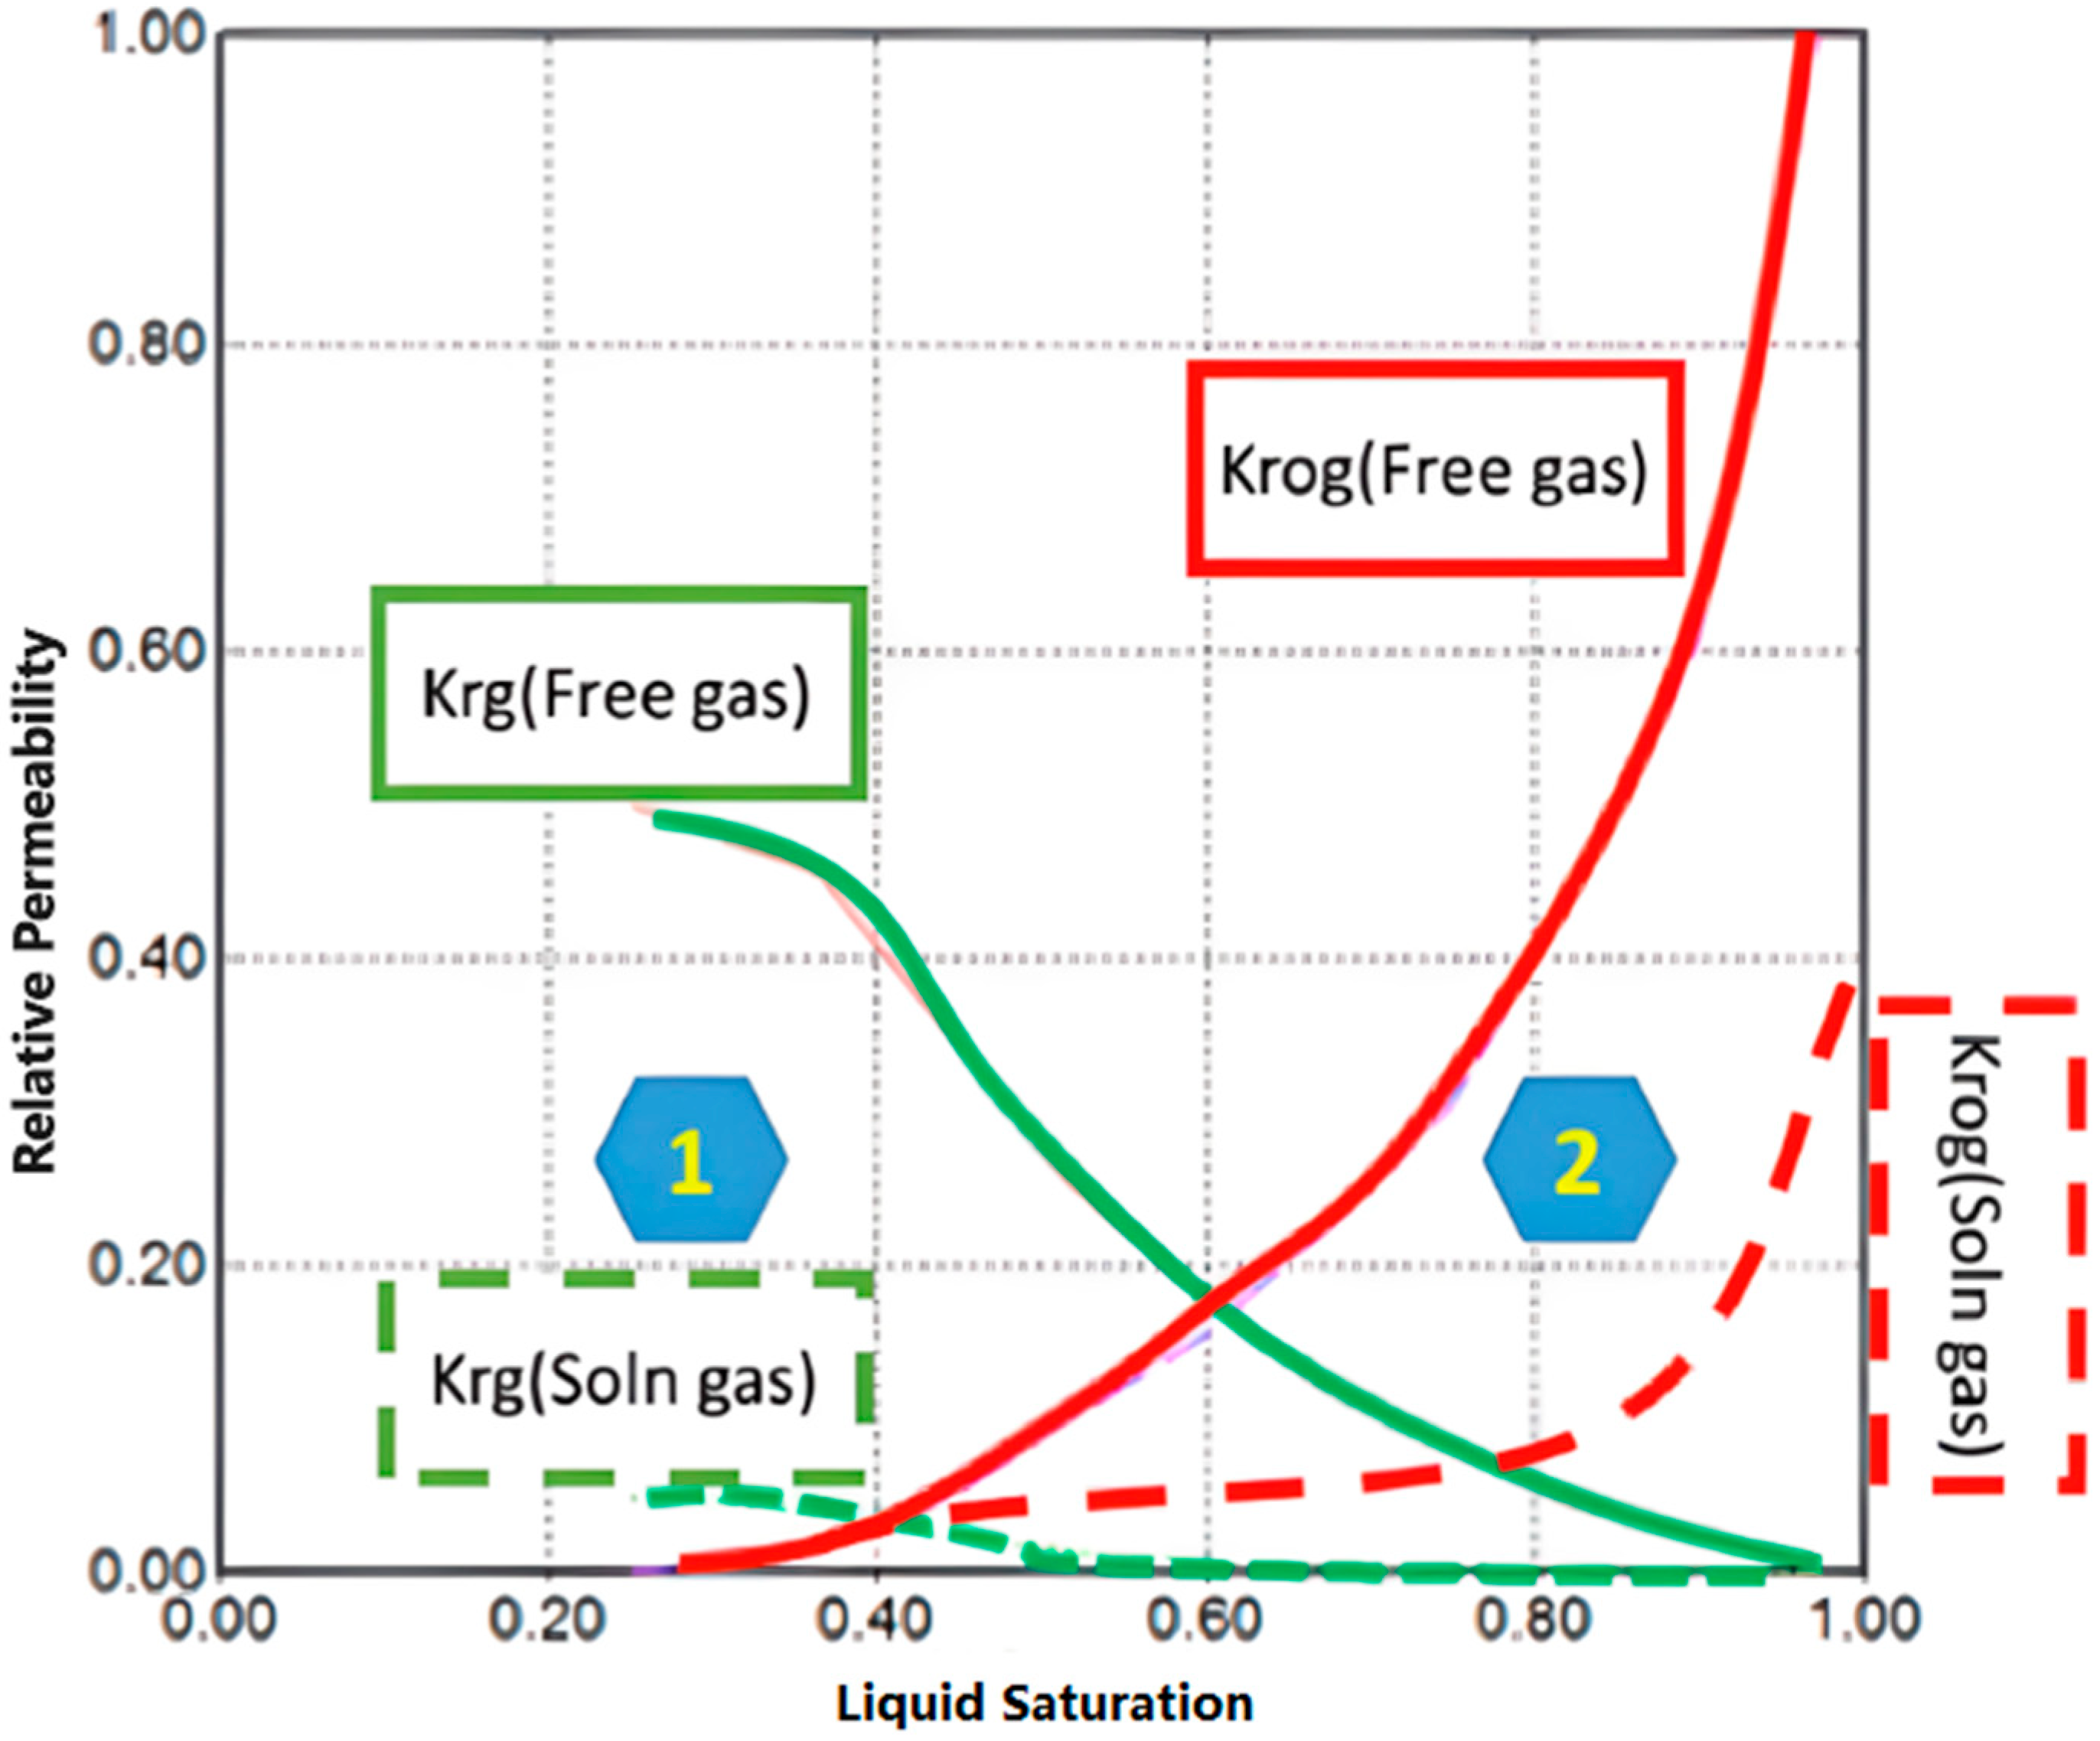
During the production stage, Krg and Krog are linearly interpolated between their values for solution gas and free gas, as illustrated by Hexagons 1 and 2 in Figure 2. The interpolation method is detailed in Equations (3) and (4),
K r g i = 1 ω i K r g A + ω i K r g B
K r o g i = 1 ω i K r o g A + ω i K r o g B
where Krg is the gas relative permeability, Krog denotes the oil relative permeability in the presence of gas and connate water, ωi is the mole fraction factor computed from Equation (5),
ω i = X i X A X B X A
where XA and XB represent the specified molar fraction values of X assigned to sets A and B, respectively. These correspond to the *DTRAPN and *DTRAPW parameters within sets A and B.
During history matching with CMG CMOST® Studio (2023 Version), two sets of relative permeability curves were first calibrated for the injection and production stages. Subsequently, key parameters—including FREQFAC, EACT, DTRAPN, DTRAPW, SGR, and KRGCW—were adjusted accordingly. In the CMG dispersed gas model, DTRAPN and DTRAPW regulate gas permeability changes based on solution gas content; SGR defines the critical gas saturation, and KRGCW represents gas permeability at connate water saturation.

3. Results

3.1. Experimental Results

Production data from the experiments are compiled in Table 1. In Test 1, cumulative oil recovery reached 30.9%. Test 2 achieved 33.2% recovery from water flooding, followed by 38.9% from CSI, totaling 72.1%. Test 3 attained a final oil recovery factor of 69.5%, with nanoparticle flooding contributing an extra 5.9% Original Oil-In-Place (OOIP). These results demonstrate that the integrated CO2-CSI with water and nanoparticle fluid flooding delivered remarkable performance, achieving a total oil recovery of approximately 70%, and highlighting the effectiveness of the combined EOR strategy.
The performance of CO2-CSI improved significantly after waterflooding, yielding a higher oil recovery of 38.9% from a lower residual oil saturation of 59.6%, compared to 30.9% recovery from the initial oil saturation of 92.1% in the first test. A similar trend was observed at lower injection pressure, where post-waterflooding CSI achieved a recovery factor of 28.8% at a residual oil saturation of 58.0%, in contrast to 26.9% recovery without prior waterflooding at an initial oil saturation of 92.6%.
To better reflect the efficiency of the CO2-CSI process, the oil recovery was normalized to the oil saturation at the start of CSI which is called the Effective Recovery Index (ERI) as Equation (6) shows [24,25,26]. ERI in Test 2 and Test 3 CSI was 65.3% and 49.7% after water flooding process, significantly higher than 33.6% and 29.0% in Tests 1 and 3-1. This indicates that waterflooding preconditioning substantially enhanced the per-unit recovery efficiency of CO2-CSI,
E R I = O R F S o i   o r   O R F S o r
where ERI is the effective recovery index, ORF is the oil recovery factor, Soi is the initial oil saturation, and Sor is the residual oil saturation.
Following nanoparticle solution flooding, the subsequent 3-3 CO2-CSI yielded an additional 5.9% OOIP. This demonstrates that nanoparticles can further improve recovery by stabilizing CO2 foam, enhancing sweep efficiency, and mitigating gas channeling. Notably, despite the low residual oil saturation at this stage, the CSI process still achieved an ERI of 20%, indicating effective mobilization of the remaining oil. These results highlight the strong potential of nanoparticles as effective foam stabilizers and EOR enhancers, particularly in late-stage recovery scenarios where conventional methods exhibit limited efficiency.
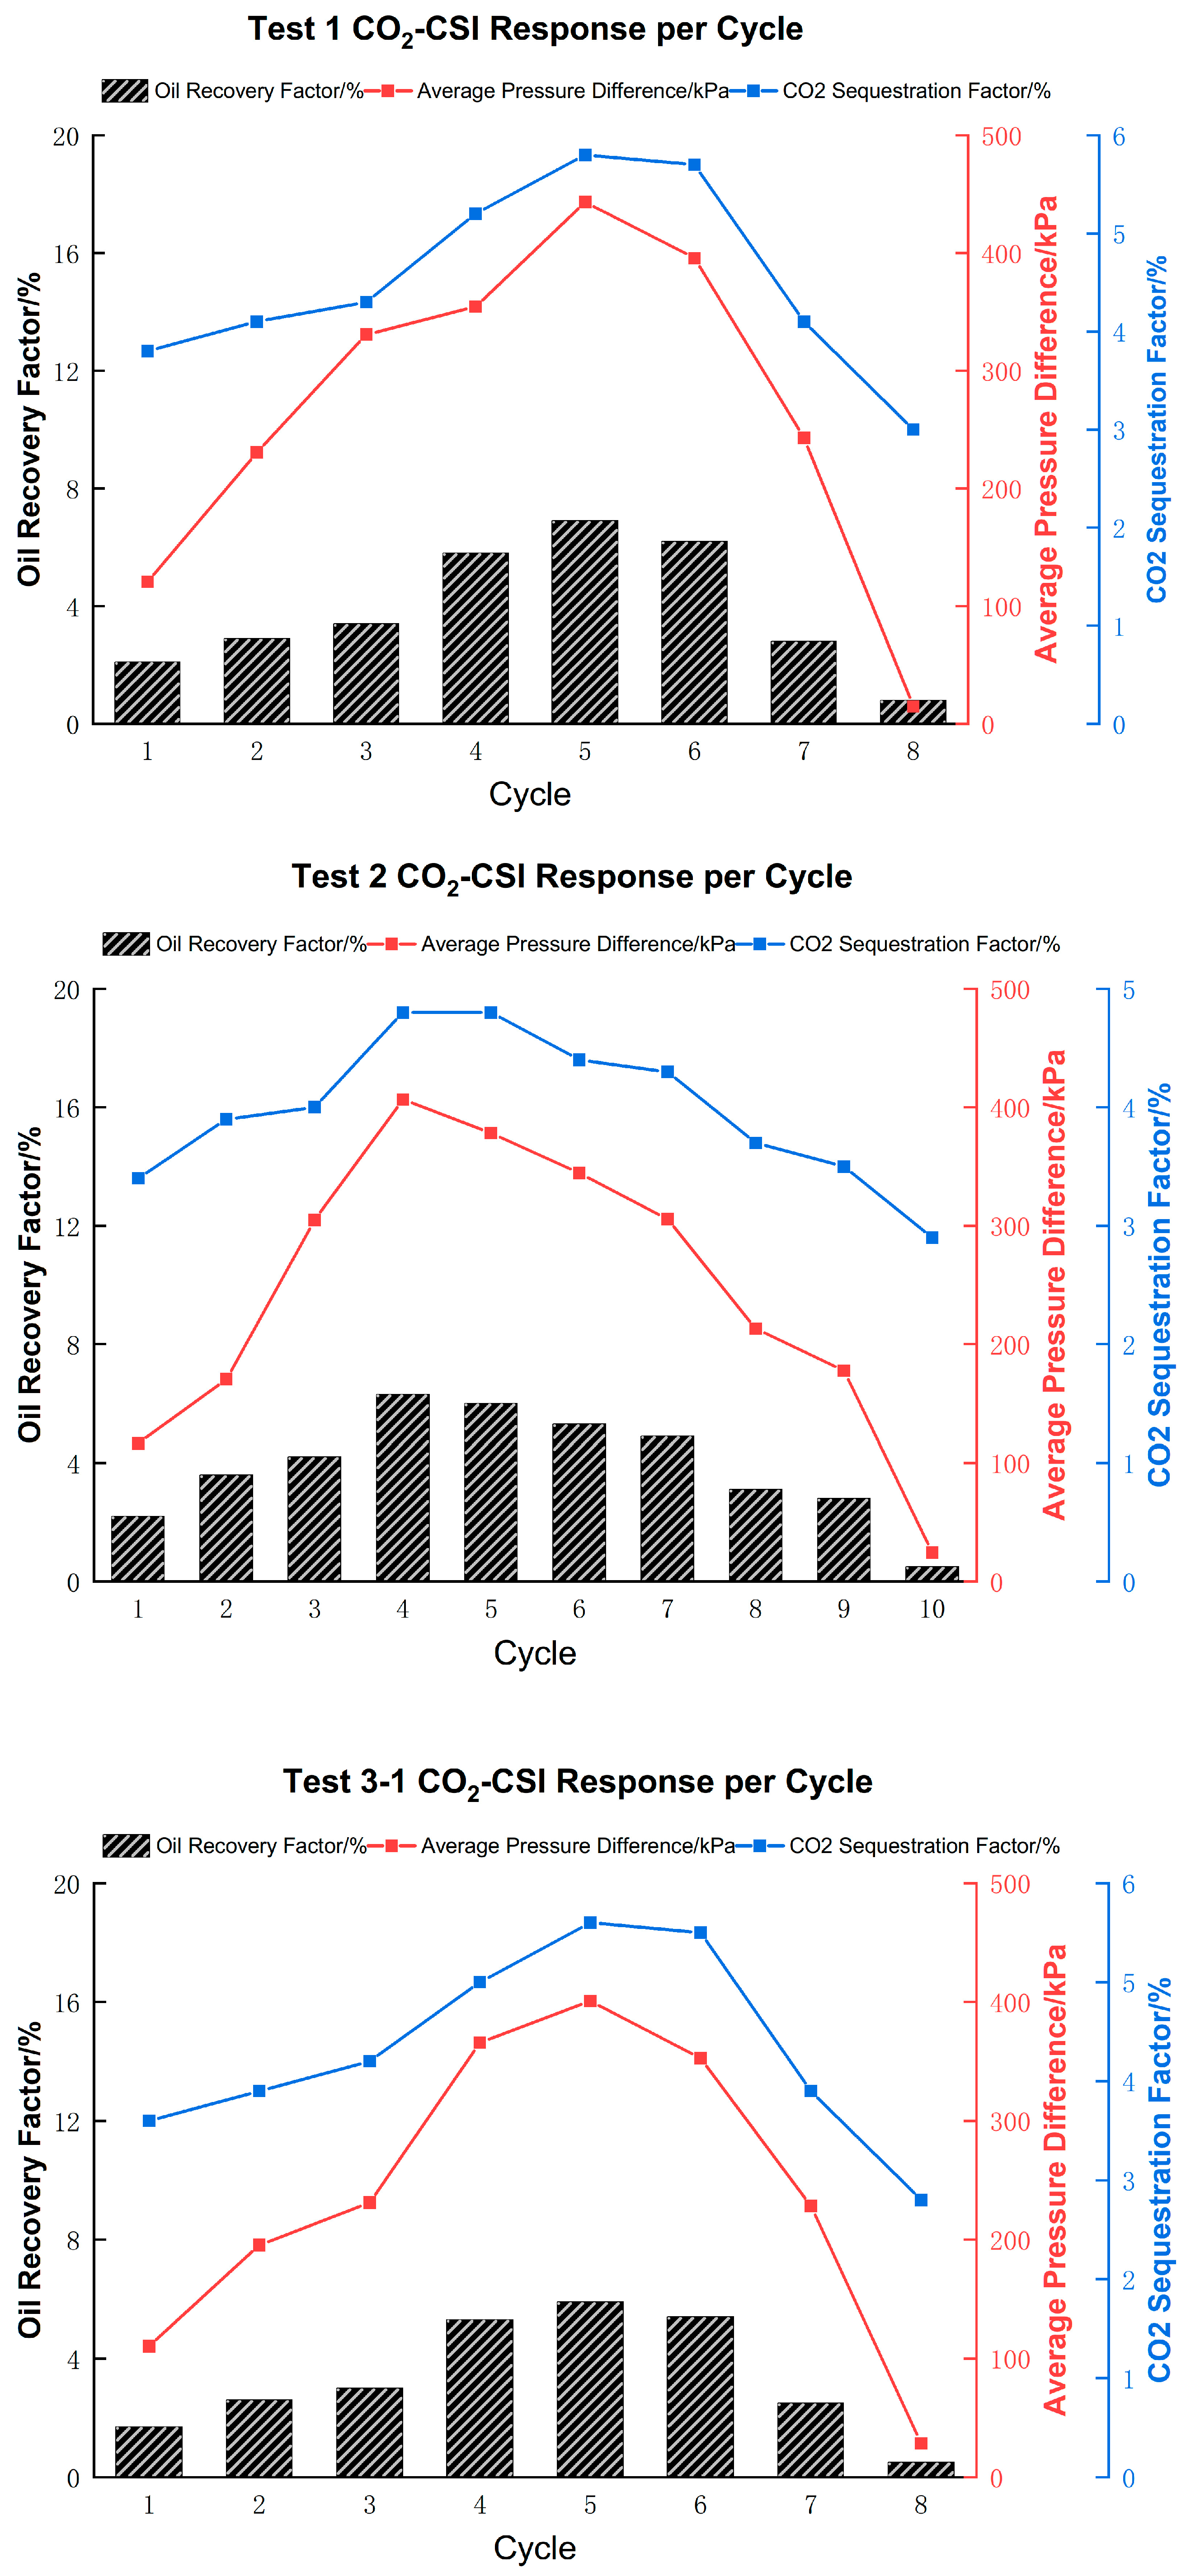
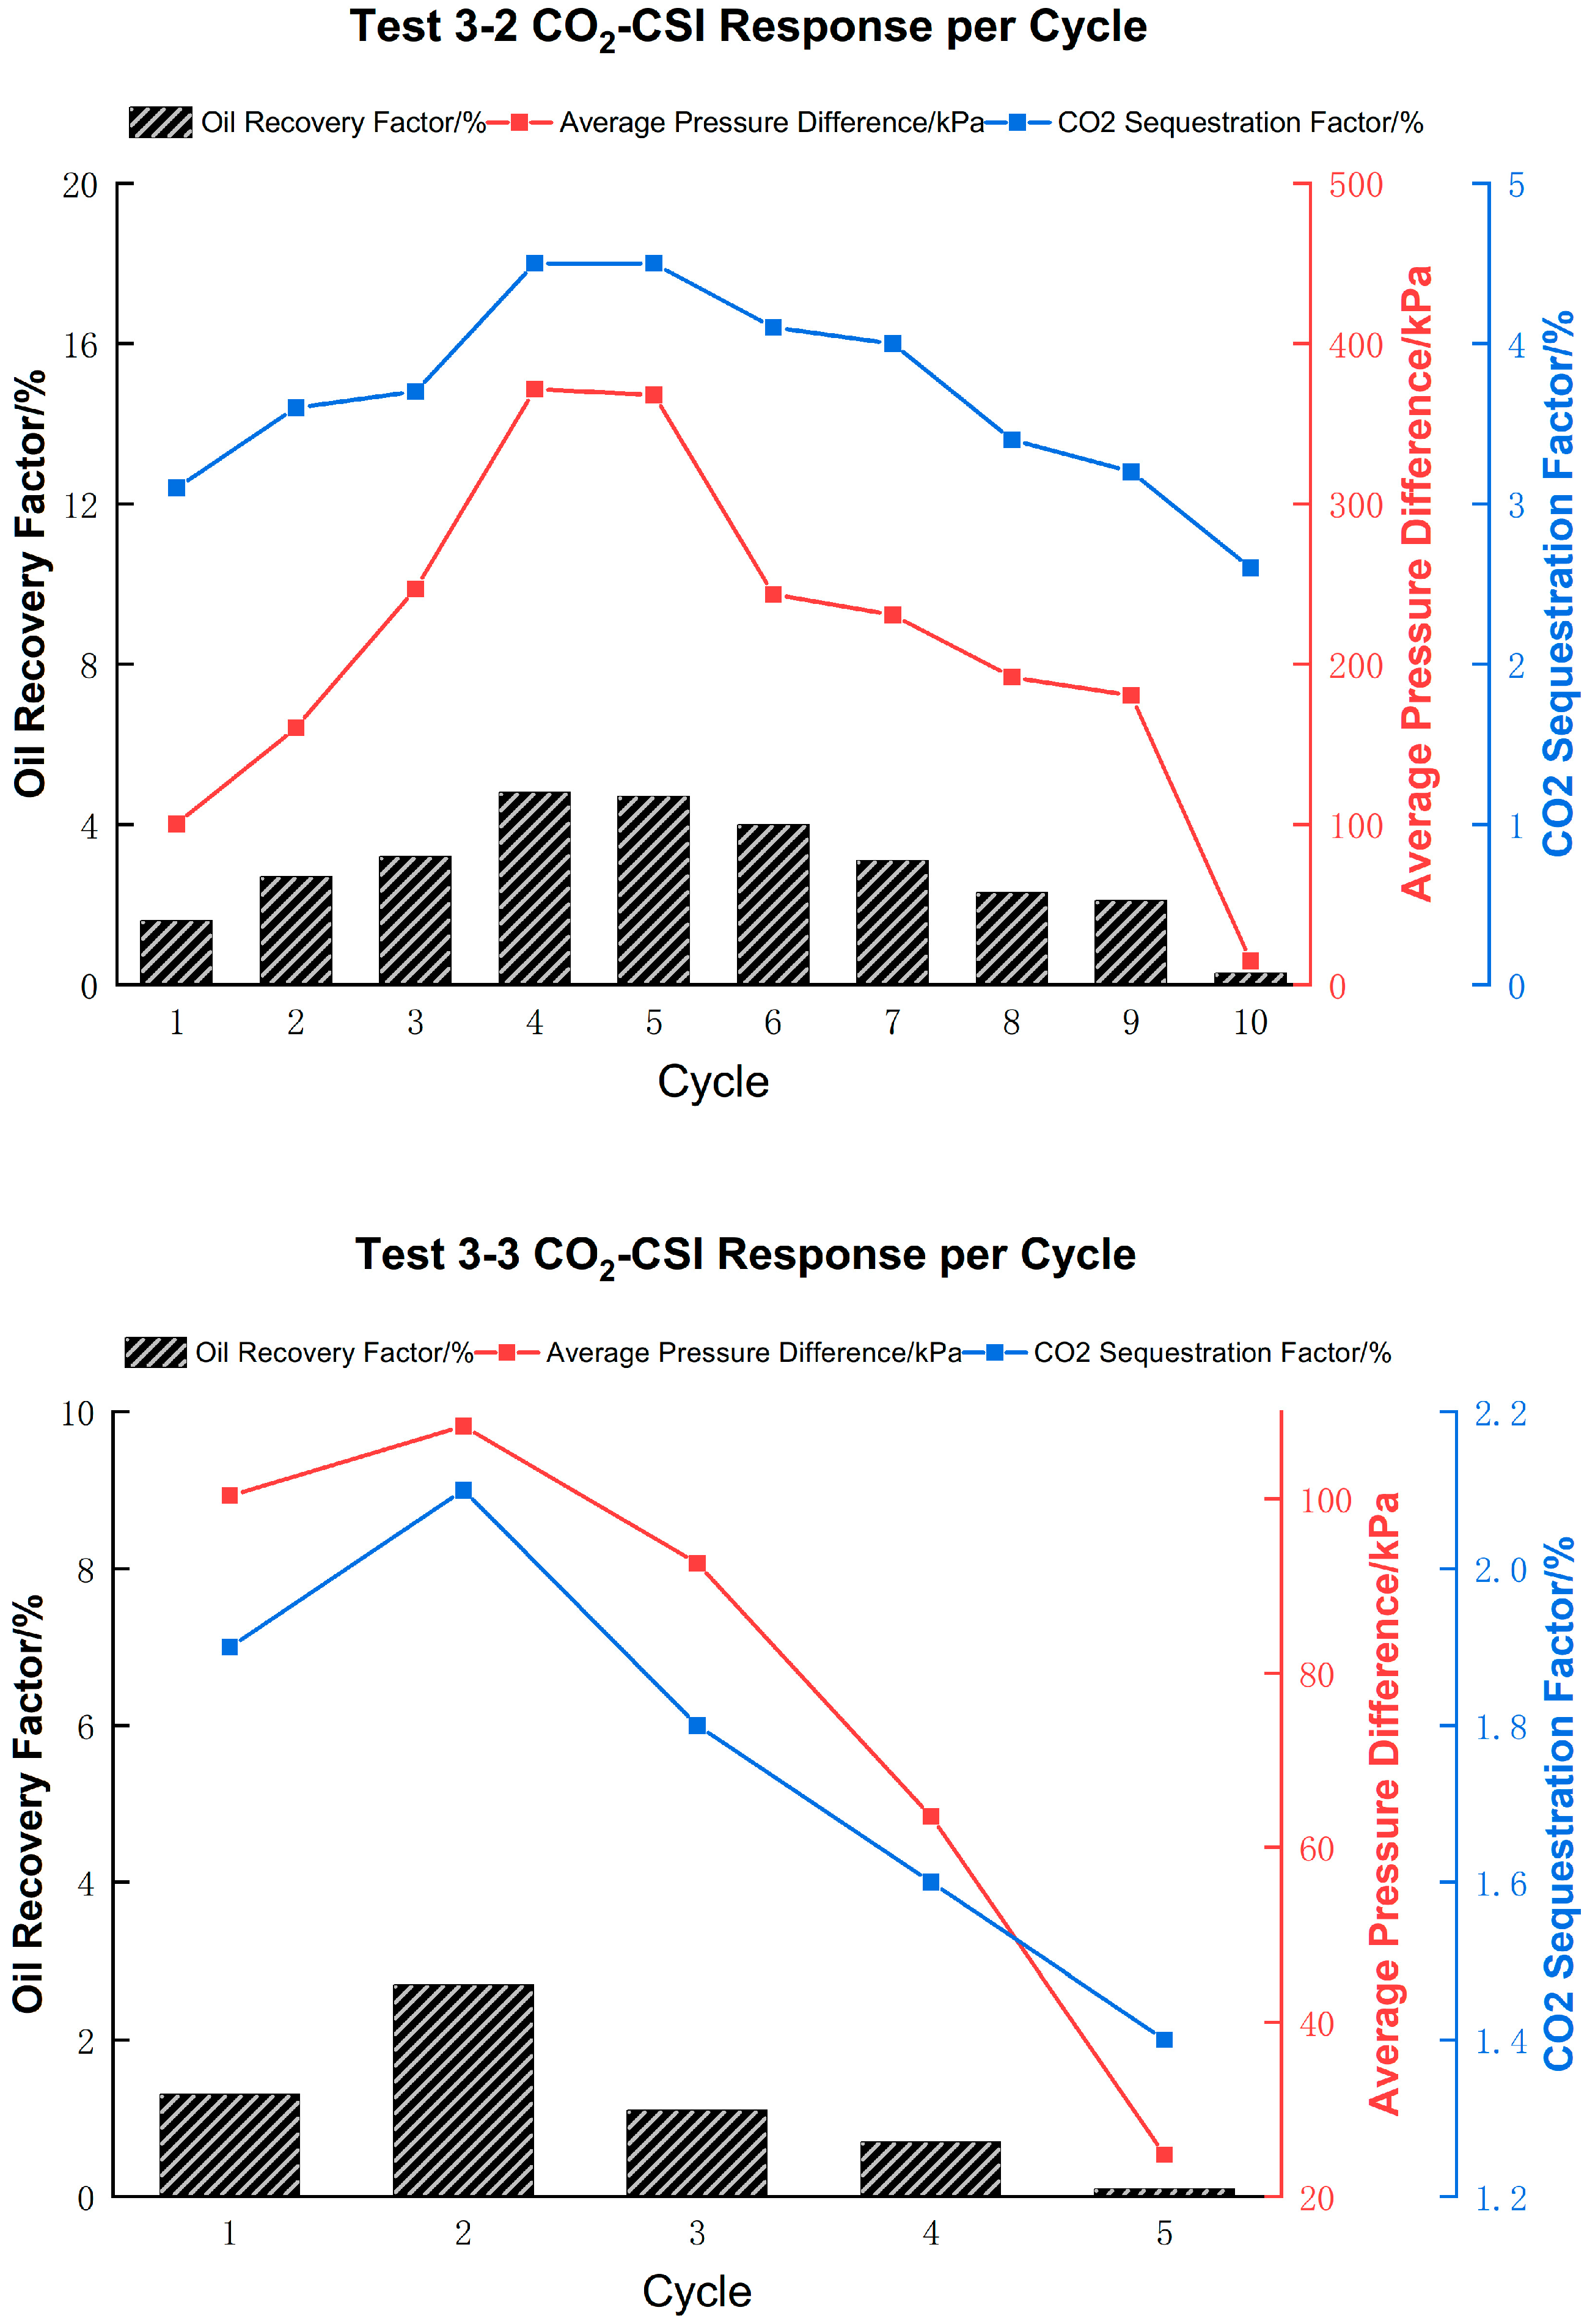
Figure 3 presents the oil recovery factor, CO2 sequestration factor, and average pressure difference for each cycle of five CO2-CSI processes in Tests 1 to 3. Foamy oil flow plays a critical role in this process. It facilitates continuous oil production under high gas saturation conditions by forming a dispersed gas-in-oil structure that suppresses gas mobility and promotes liquid flow. The presence of foamy oil not only delays gas breakthrough but also enhances pressure support, allowing the system to maintain production over multiple cycles [27,28].
In all tests, oil production per cycle exhibited a typical trend: it gradually increased, reached a peak, and then declined. This behavior has been widely reported in the literature and is primarily attributed to the progressive depletion of oil and the expansion of available pore space. As oil is produced, more pore volume becomes available to accommodate additional CO2 in subsequent cycles, thereby enhancing the injection capacity and improving overall process efficiency [29].
The CO2 sequestration factor, defined as the ratio of (CO2 injected—CO2 produced) to the total CO2 injected, was found to correlate positively with the oil recovery factor in each cycle. Cycles with higher oil production exhibited stronger foamy oil behavior, resulting in greater CO2 entrapment as residual foam within the porous medium and leading to higher sequestration rates.
The average pressure difference in each cycle, calculated by subtracting the port pressures from the BPR pressure, exhibited a strong correlation with oil production trends—higher differentials were associated with greater recovery. The strength of the foamy oil flow can be inferred from the magnitude of the pressure difference—larger pressure drops indicate more vigorous foamy oil behavior and more effective displacement [30].
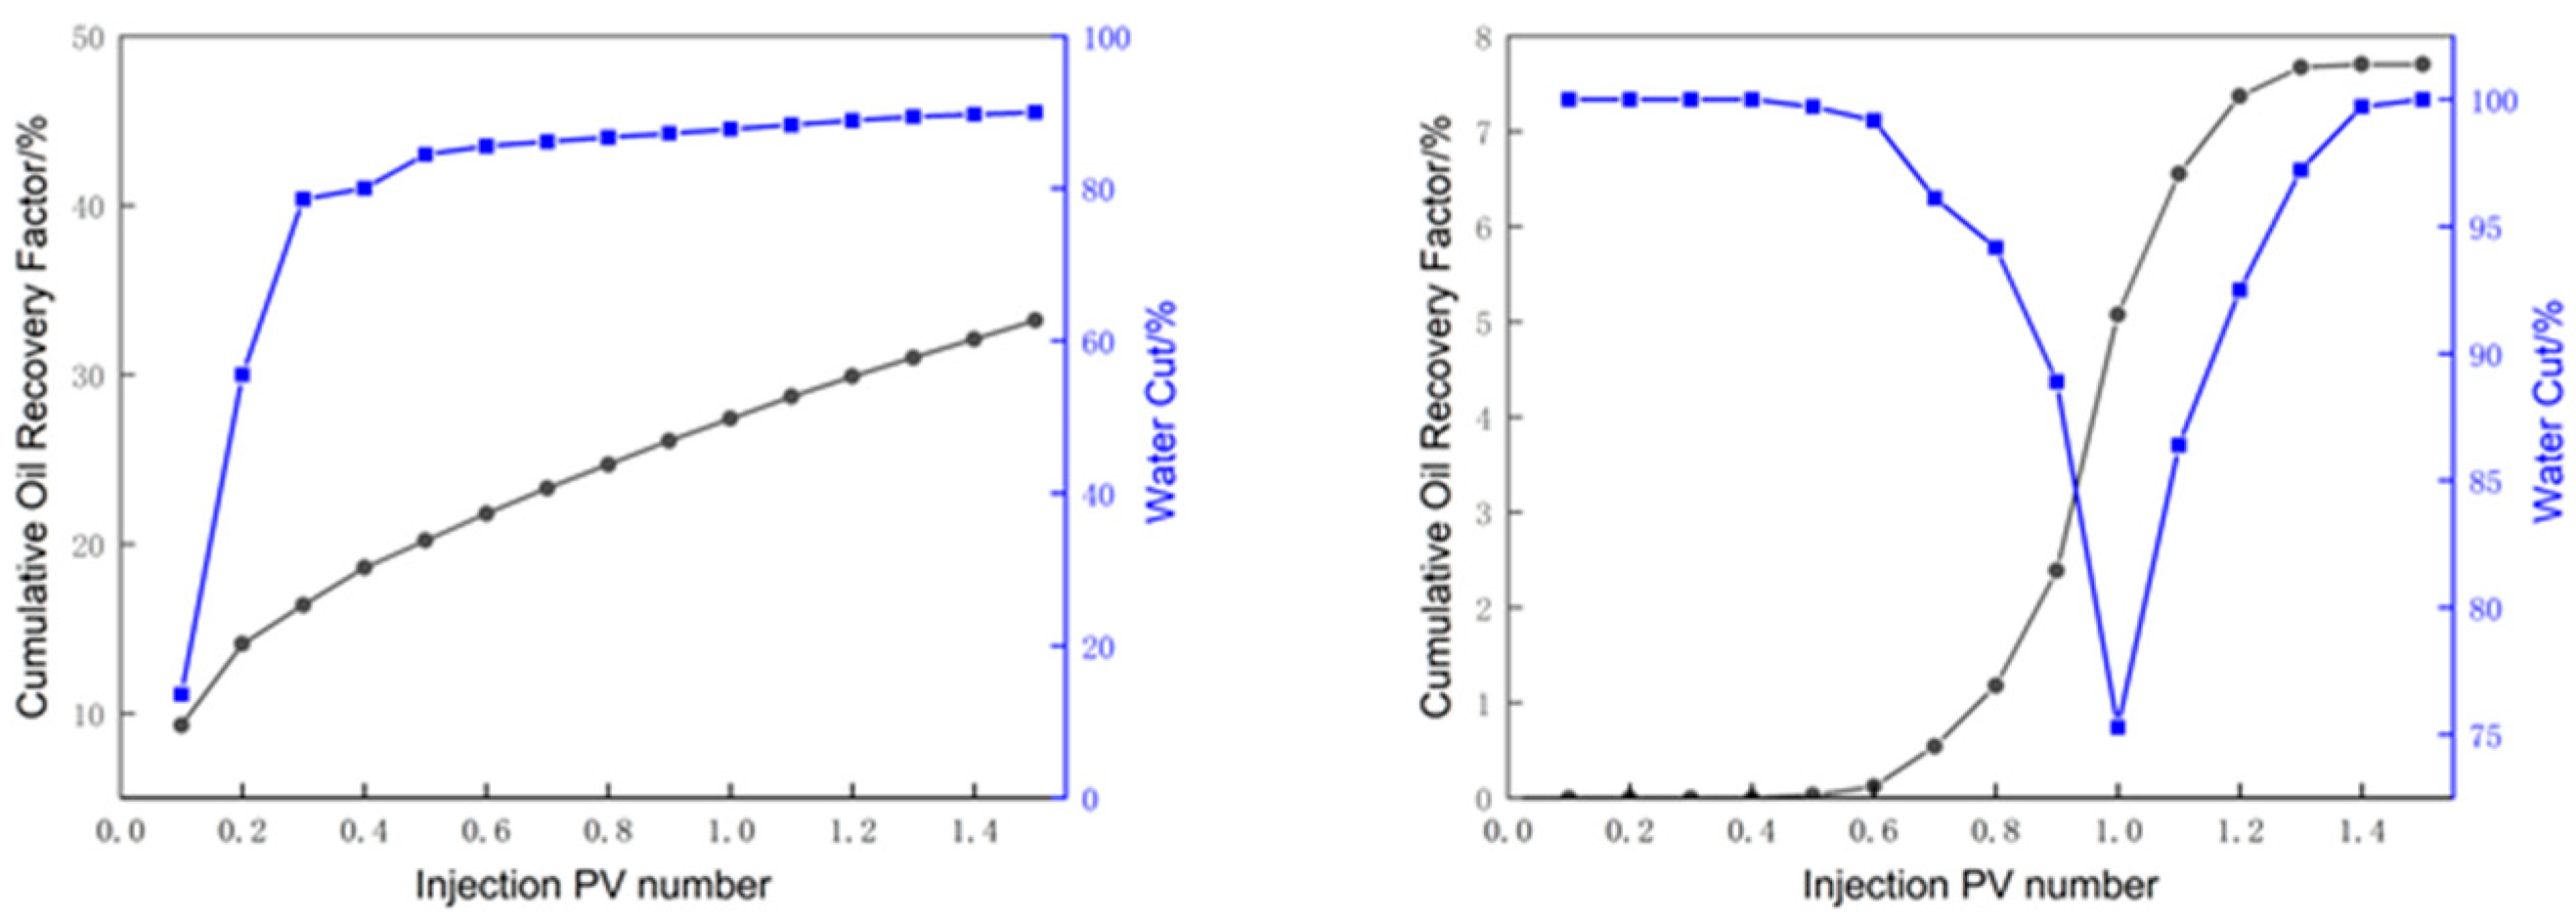
Figure 4 shows the oil production and water cut during waterflooding in Tests 2 and 3. Test 2 achieved 33.2% recovery after 1.5 PV injection, with continued oil production after breakthrough. In contrast, In Test 3, the water cut initially decreased and then increased during water injection. This initial decline is attributed to the preceding CO2-CSI process, which removed most of the oil near the production end. As a result, no oil was produced during the first 0.4 PV of water injection. As water gradually advanced and displaced oil from deeper regions, oil production increased, and the water cut dropped. However, with continued injection, water channeling occurred, leading to a decline in oil production and a rise in water cut to over 90%. The cumulative oil recovery factor was only 7.7%, suggesting that although waterflooding can mobilize heavy oil, the development of water channels significantly limits its efficiency. From a cost-effectiveness perspective, applying waterflooding prior to CO2 CSI is more advantageous, as it better prepares the reservoir and enhances subsequent recovery.

3.2. Simulation Results

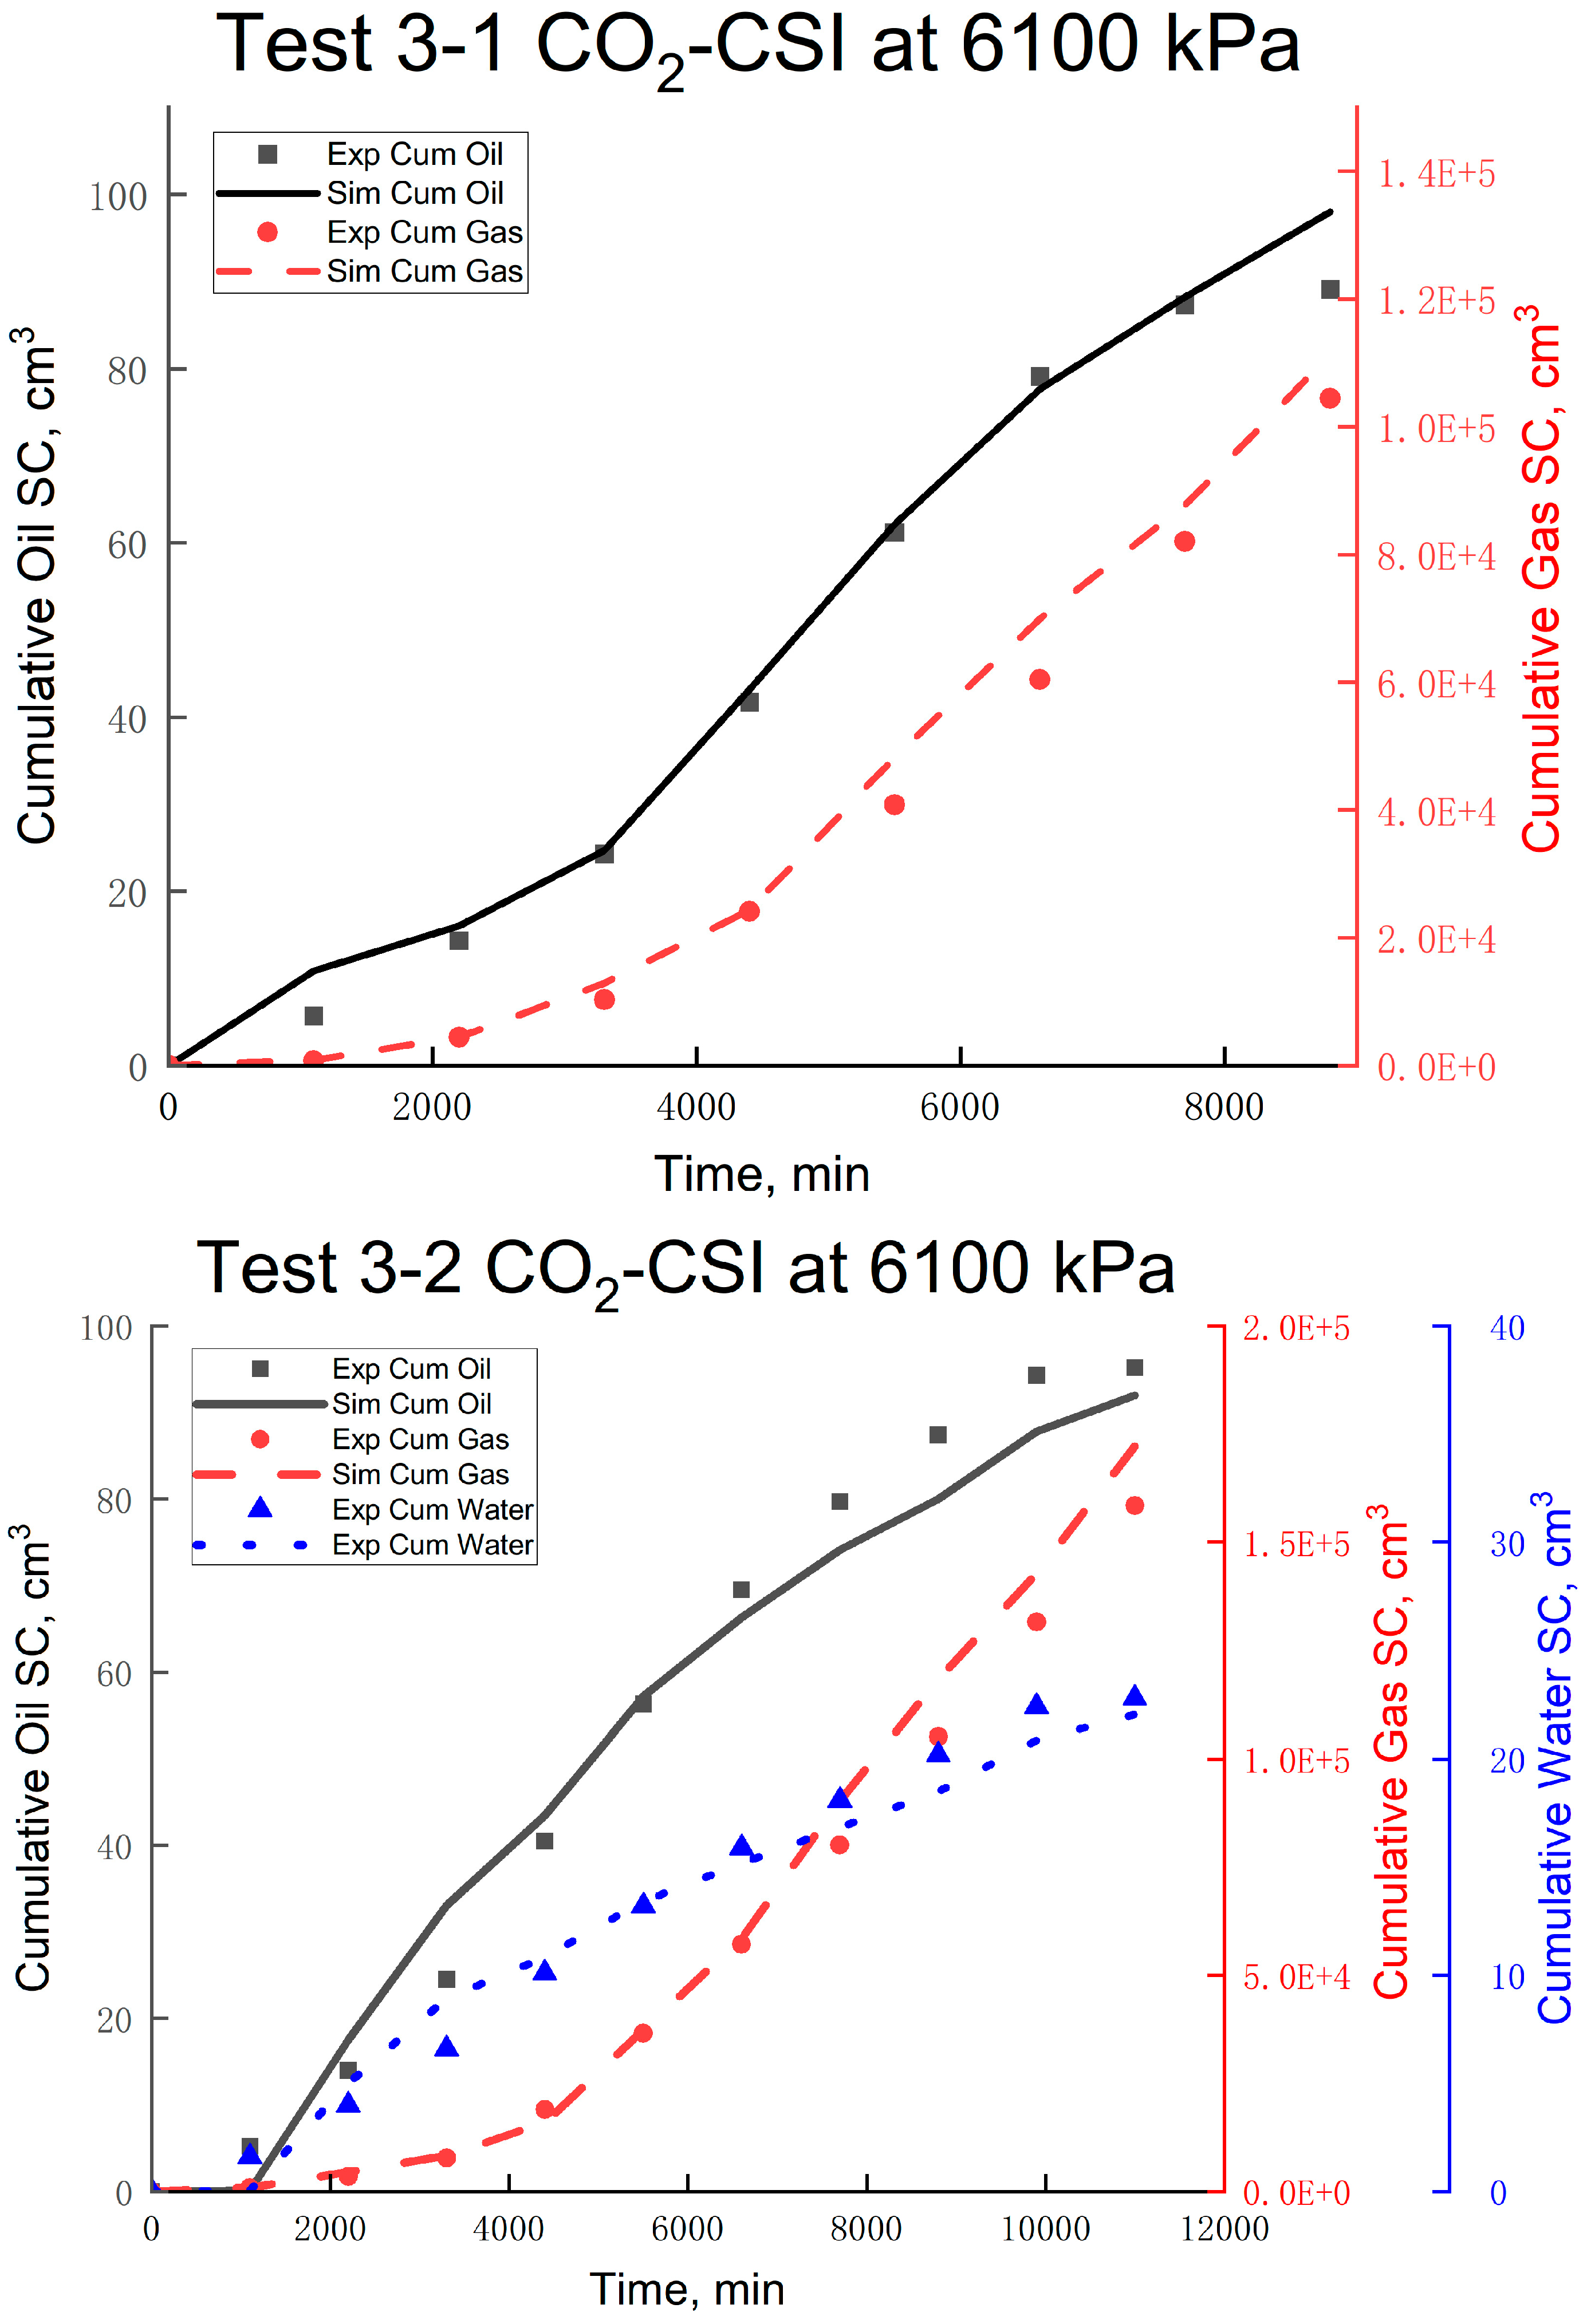
Figure 5 presents the experimental results and corresponding history-matching outcomes of the CSI tests. By employing two sets of relative permeability curves for the injection and production stages, combined with a dispersed gas model, accurate matches were obtained for oil, gas, and water production. This approach effectively simulates the performance of CO2-CSI in heavy oil systems within porous media.
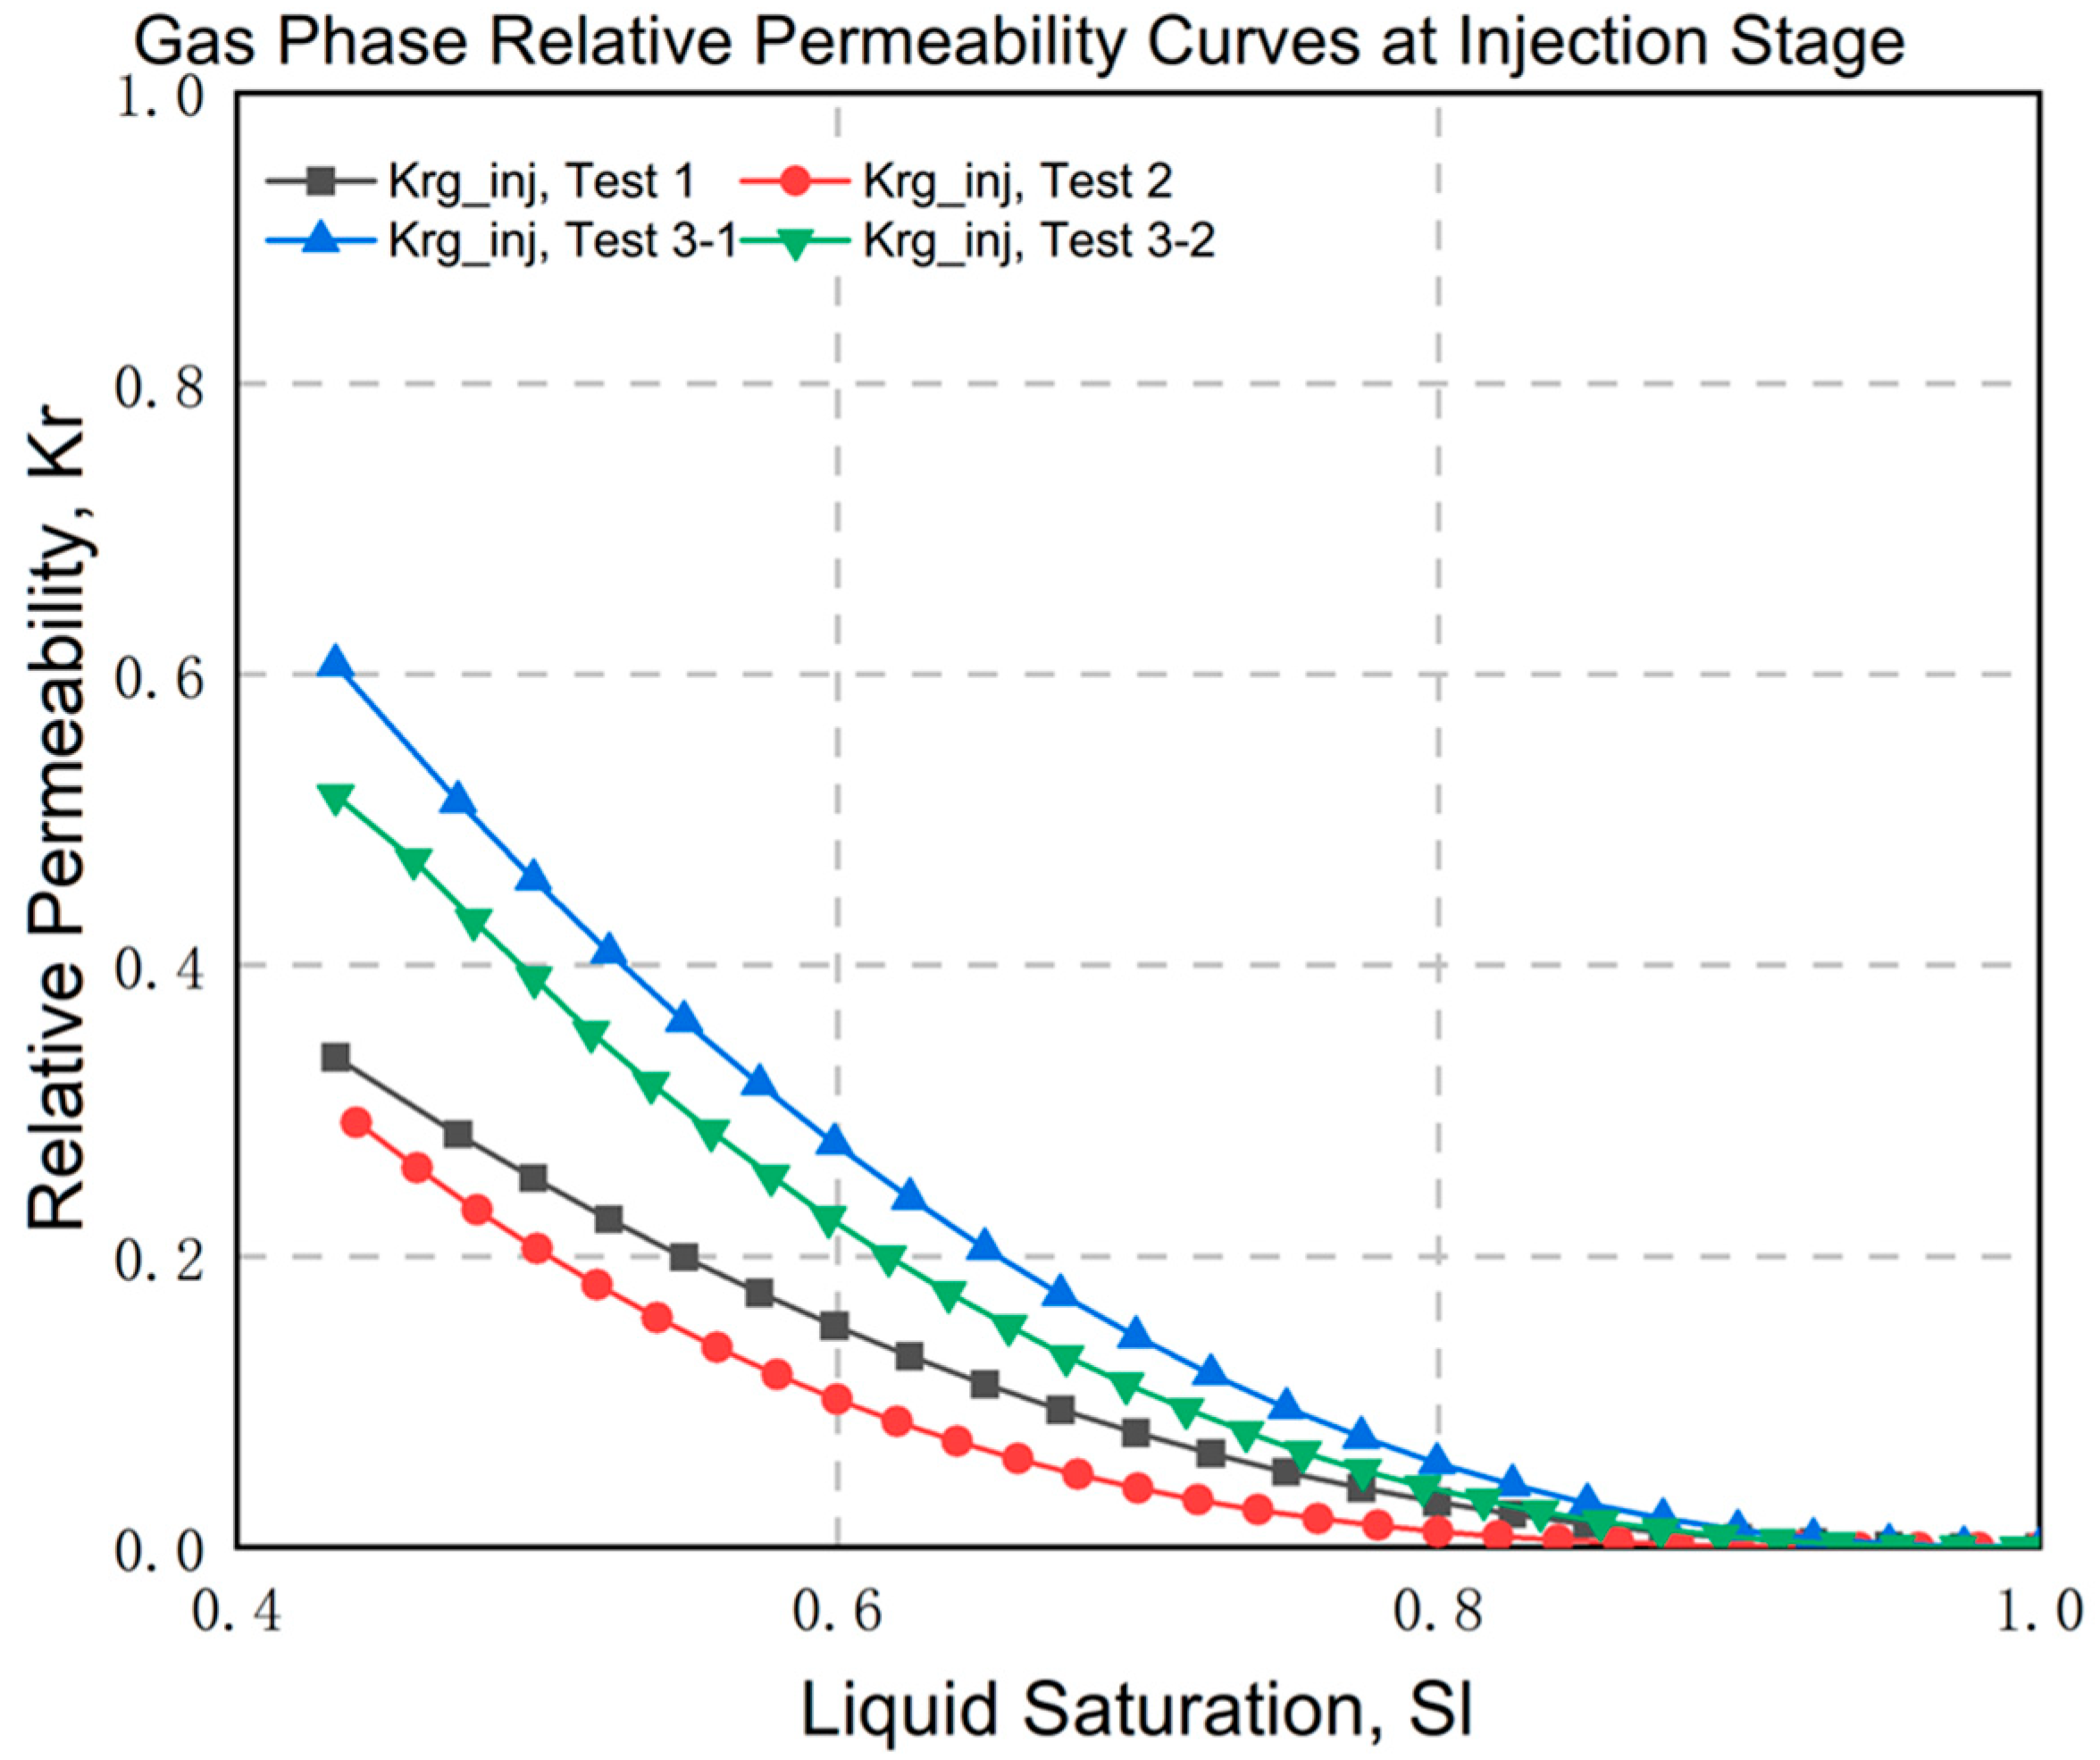
Figure 6 presents the adjusted gas relative permeability curves during the injection stage for Test 1, Test 2, Test 3-1, and Test 3-2. Test 3-3 is excluded due to substantial deviations in oil and gas production behavior. Tests 3-1 and 3-2, conducted at an injection pressure of 6100 kPa, exhibit higher Krg values than Tests 1 and 2, which were injected at 7100 kPa. Lower injection pressure results in reduced gas–oil mixing and dissolution, leading to higher gas mobility, whereas higher pressure enhances dissolution through improved phase interaction. Following waterflooding, Krg values decline across both pressure groups, suggesting reduced gas mobility.
Figure 7 and Figure 8 compare the tuned gas–liquid relative permeability curves for the free gas and solution gas phases at the production stage, categorized by injection pressure. The Krg and Krog values for both gas phases exhibit consistent behavior, with the difference between them decreasing as water saturation increases. Furthermore, the gas–liquid relative permeability curves progressively shift toward lower liquid saturations following waterflooding and shift even further after nanoparticle solution flooding. For example, the Krg and Krog curves in Test 2 (post-waterflood CSI) exhibit a significant leftward shift compared to Test 1 (CSI only). This shift indicates that both gas and oil phases achieve higher mobility at lower liquid saturations. Furthermore, the reduced area between Krg and Krog in Test 2 suggests decreased phase competition, which may reflect enhanced foamy oil flow behavior.
Table 2 and Table 3 summarize the calibrated parameters used in the dispersed gas model during the production stage, categorized by injection pressure to facilitate comparison. Among these parameters, EACT, FREQFAC, and the interpolated values of DTRAP_A and DTRAP_B show minimal variation across cases. In contrast, SGR exhibits a significant increase following water and nanoparticle solution flooding. The observed increase in SGR after water and nanoparticle flooding suggests that gas requires a higher saturation level to initiate flow. This can be attributed to the presence of residual water blocking gas pathways, changes in pore-scale wettability, and the disruption of oil continuity, all of which reduce early gas mobility. Consequently, higher critical gas saturation is needed to establish effective gas connectivity and foamy oil flow.

4. Discussion

4.1. Waterflooding Impact on CO2-CSI Efficiency

Waterflooding has been shown to significantly enhance the effectiveness of the subsequent CO2-CSI process. At both 7100 and 6100 kPa injection pressures, the waterflood-assisted cases (Test 2 and Test 3-2) achieved higher oil recovery and ERI than the standalone CSI cases (Test 1 and Test 3-1), confirming the benefits of waterflooding as a pretreatment strategy.
This improvement can be attributed to two key mechanisms. First, waterflooding reduces residual oil saturation near the wellbore, freeing up additional pore volume for CO2 injection and facilitating better gas-phase connectivity. Second, the mobility contrast between water and oil creates viscous fingering pathways, which not only enable CO2 to penetrate deeper into the reservoir but also increase the contact surface area between CO2 and the remaining oil, enhancing foamy oil generation.
These mechanisms are supported by simulation results. The relative permeability curves of both oil and gas (Krog and Krg) in the waterflood-assisted cases shift to the left, indicating that both phases become mobile at lower liquid saturations. Moreover, the reduced overlap area between Krg and Krog suggests diminished phase interference and a more stable foamy oil flow regime. Notably, an increase in critical gas saturation (SGR) was also observed. This can be directly linked to the increased pore space created by waterflooding, which delays the formation of a continuous gas phase. In addition, the dispersed oil distribution and preferential flow paths enhance CO2–oil interactions, thereby requiring a higher gas saturation to initiate effective gas flow. Together, these changes result in a higher SGR and more controlled, efficient oil displacement during the CSI stage.

4.2. Nanoparticle Solution Flooding Impact on CO2-CSI Efficiency

Following nanoparticle solution flooding, the subsequent CO2-CSI process in Test 3-3 yielded an additional 5.9% OOIP, demonstrating the effectiveness of nanoparticles in further enhancing oil recovery. Despite the already low residual oil saturation at this stage, the CSI still achieved an effective recovery index of 20%, indicating that the remaining oil was efficiently mobilized.
This improvement can be attributed to the role of nanoparticles in stabilizing CO2 foam and enhancing sweep efficiency. By increasing foam stability, nanoparticles help maintain better gas–liquid phase separation, prolonging the presence of foamy oil and improving displacement uniformity within the reservoir. These effects are particularly valuable during late-stage recovery, where conventional EOR methods typically become less effective.
Simulation results support these mechanisms. The gas–liquid relative permeability curves (Krg and Krog) progressively shift toward lower liquid saturations following waterflooding and shift even further after nanoparticle solution injection. This shift reflects earlier gas and oil mobility and suggests improved foam-assisted displacement. In addition, the overlap area between Krg and Krog is further reduced in Test 3-3 (yellow and purple curves), indicating diminished phase interference and a more stable displacement regime. Notably, the critical gas saturation (SGR) increases to 0.40 after nanoparticle flooding, reinforcing the interpretation that more pore space must be occupied before gas flow initiates—consistent with enhanced foam stability and delayed gas breakthrough.

4.3. Injection Pressure Impact on CO2-CSI Efficiency

The effect of injection pressure was also investigated by comparing two levels: 7100 kPa and 6100 kPa. Under the higher pressure condition (7100 kPa), the CSI process yielded both higher cumulative oil production and greater oil recovery per cycle compared to the lower pressure case. This improvement can be attributed to the fact that higher injection pressure allows more CO2 to enter the reservoir, increasing the amount of CO2 dissolved in the oil and promoting the formation of more stable foamy oil, thereby enhancing recovery efficiency.
The results highlight the advantages of integrating water and nanoparticle flooding with CO2-CSI in heavy oil reservoirs. Compared to CSI alone, the combined approach offers higher recovery factors, extended production cycles, and better CO2 utilization. The experimental insights align with numerical findings, providing robust support for field-scale applications.
Future work should explore scale-up in heterogeneous reservoirs and evaluate economic feasibility. Additionally, optimizing nanoparticle concentration and injection schedules could further enhance performance.

5. Conclusions

This study provides comprehensive experimental and simulation-based insights into the EOR performance of CO2-CSI processes, particularly when integrated with waterflooding and nanoparticle-assisted foam stabilization. The findings demonstrate that waterflooding significantly enhances the effectiveness of CO2-CSI, leading to higher oil recovery and extended production cycles compared to standalone CSI processes. Nanoparticle solution flooding further improves recovery performance by stabilizing CO2 foam, even in late-stage scenarios with low residual oil saturation, contributing an additional 5.9% of the original oil in place. When combined, the integrated process of CO2-CSI, waterflooding, and nanoparticle flooding achieved a total recovery factor of approximately 70%, indicating strong synergistic effects and excellent EOR potential. The simulation results successfully history-matched oil, gas, and water production, thereby confirming the model’s validity across multiple production stages. Moreover, relative permeability analysis and the observed increase in critical gas saturation validated the experimental mechanisms, particularly with respect to foam stability and improved sweep efficiency. Collectively, these results support the conclusion that CO2-CSI–dominated multi-stage techniques represent a promising EOR strategy for maximizing oil recovery while extending the productive life of mature heavy oil reservoirs.

Author Contributions

Methodology, Y.L.; Validation, Y.L.; Investigation, Y.L.; Data curation, Y.C. (Yufeng Cao); Writing—original draft, Y.L.; Writing—review and editing, Y.C. (Yiming Chen); Supervision, F.Z. All authors have read and agreed to the published version of the manuscript.

Funding

This research was funded by Petroleum Technology Research Centre (PTRC) grant number [HO-UR-03-2021].

Data Availability Statement

The raw data supporting the conclusions of this article will be made available by the authors on request.

Conflicts of Interest

The authors declare no conflicts of interest.

Abbreviations

The following abbreviations are used in this manuscript:
CSICyclic solvent injection
EOREnhanced oil recovery
ERIEffective recovery index
BPRBack-pressure regulator
ORFOil recovery factor
CORFCumulative oil recovery factor
Soi/rInitial/Residual oil saturation

References

  1. Liu, Z.; Wang, H.; Blackbourn, G.; Ma, F.; He, Z.; Wen, Z.; Wu, Z. Heavy oils and oil sands: Global distribution and resource assessment. Acta Geol. Sin. Engl. Ed. 2019, 93, 199–212. [Google Scholar] [CrossRef]
  2. Srivastava, R.K.; Huang, S.S.; Mourits, F.M. A laboratory evaluation of suitable operating strategies for enhanced heavy oil recovery by gas injection. J. Can. Pet. Technol. 1997, 36, 33–41. [Google Scholar] [CrossRef]
  3. Ivory, J.; Chang, J.; Coates, R.; Forshner, K. Investigation of cyclic solvent injection process for heavy oil recovery. J. Can. Pet. Technol. 2010, 49, 22–33. [Google Scholar] [CrossRef]
  4. Du, Z.; Peng, X.; Zeng, F. Experimental investigation of cyclic solvent injection based on mixture solvent of carbon dioxide and propane. Fuel 2018, 225, 646–654. [Google Scholar] [CrossRef]
  5. Zou, W.; Yao, J.; Gu, Y. Optimum timing of CO2-cyclic solvent injection (CO2-CSI) in the heavy oil reservoirs. Geoenergy Sci. Eng. 2024, 239, 212931. [Google Scholar] [CrossRef]
  6. Pugh, R.J. Foaming, foam films, antifoaming and defoaming. Adv. Colloid Interface Sci. 1996, 64, 67–142. [Google Scholar] [CrossRef]
  7. Pugh, R.J. Experimental techniques for studying the structure of foams and froths. Adv. Colloid Interface Sci. 2005, 114, 239–251. [Google Scholar] [CrossRef] [PubMed]
  8. Qazvini Firouz, A.; Torabi, F. Feasibility study of solvent-based huff-n-puff method (cyclic solvent injection) to enhance heavy oil recovery. In Proceedings of the SPE Heavy Oil Conference Canada, Calgary, AB, Canada, 12–14 June 2012. Paper SPE 157853. [Google Scholar]
  9. Adams, D.M. Experiences with waterflooding Lloydminster heavy-oil reservoirs. J. Pet. Technol. 1982, 34, 1643–1650. [Google Scholar] [CrossRef]
  10. Smith, G.E. Waterflooding heavy oils. In Proceedings of the SPE Rocky Mountain Regional Meeting, Casper, WY, USA, 18–21 May 1992. SPE Paper 24367. [Google Scholar]
  11. Rawat, A.; Khanikar, B.; Samanta, A.K.; Nguessan, P.; Mehta, B.; Sircar, A.; Desai, B.; Bera, A.; Bist, N. Experimental analysis of sequential water alternating CO2 gas injection for enhancing oil recovery in X-field sandstone reservoir of Cambay Basin. Sci. Rep. 2025, 15, 21238. [Google Scholar] [CrossRef]
  12. Yang, G.; Bai, Y.; Song, Y.; Metwally, A.S.M.; Mahmoud, O. An experimental study to measure oil recovery factor by chemical agents and carbon dioxide after waterflooding. Sci. Rep. 2022, 12, 9464. [Google Scholar] [CrossRef]
  13. Khan, J.A.; Kim, J.; Irawan, S.; Permatasar, K.A.; Verdin, P.G.; Cai, B.; Yekeen, N. Application of foam-assisted water-alternating-gas flooding and quantification of resistivity and water saturation by experiment and simulation to determine foam propagation in sandstone. Heliyon 2024, 10, e25061. [Google Scholar] [CrossRef]
  14. Bandyopadhyay, P.; Andel, D.; Hampton, D.W.; Stone, L.D. CO2 WAG huff-n-puff for waterflooded conventional reservoirs: Design and field learnings from deployment in the Permian Basin of West Texas. In Proceedings of the SPE Annual Technical Conference and Exhibition, San Antonio, TX, USA, 16–18 October 2023; Society of Petroleum Engineers: Richardson, TX, USA, 2023. Paper SPE-215423-MS. [Google Scholar]
  15. Horozov, T.S. Foams and foam films stabilised by solid particles. Curr. Opin. Colloid Interface Sci. 2008, 13, 134–140. [Google Scholar] [CrossRef]
  16. Mo, D.; Yu, J.; Liu, N.; Lee, R. Study of the Effect of Different Factors on Nanoparticle-Stabilized CO2 Foam for Mobility Control. In Proceedings of the SPE Annual Technical Conference and Exhibition, San Antonio, TX, USA, 8–10 October 2012; Society of Petroleum Engineers: Richardson, TX, USA OnePetro. [Google Scholar]
  17. Bello, A.; Dorhjie, D.B.; Ivanova, A.; Cheremisin, A. A numerical feasibility study of CO2 foam for carbon utilization and storage in a depleted, high salinity, carbonate oil reservoir. Sci. Rep. 2024, 14, 20585. [Google Scholar] [CrossRef]
  18. Khandoozi, S.; Pourafshary, P.; Aidarova, S.; Sharipova, A. A comparative analysis of the effect of nanoparticles/surfactant assisted foam injection on the gas mobility control at different heterogeneities. Fuel 2023, 350, 128810. [Google Scholar] [CrossRef]
  19. Rahman, A.; Shirif, E.; Torabi, F. Nanoparticle-stabilized CO2 foam flooding for enhanced heavy oil recovery: A micro-optical analysis. Petroleum 2024, 10, 696–704. [Google Scholar] [CrossRef]
  20. Bello, A.; Dorhjie, D.B.; Ivanova, A.; Cheremisin, A.; Ilyasov, I.; Cheremisin, A. Numerical study of the mechanisms of nano-assisted foam flooding in porous media as an alternative to gas flooding. Heliyon 2024, 10, e29852. [Google Scholar] [CrossRef] [PubMed]
  21. Hong, S.Y.; Zeng, F.; Du, Z. Characterization of gas–oil flow in cyclic solvent injection (CSI) for heavy oil recovery. J. Pet. Sci. Eng. 2017, 152, 639–652. [Google Scholar] [CrossRef]
  22. Chang, J.; Ivory, J. Field-scale simulation of cyclic solvent injection (CSI). J. Can. Pet. Technol. 2013, 52, 251–265. [Google Scholar] [CrossRef]
  23. Arrhenius, S. Über die Dissociationswärme und den Einfluss der Temperatur auf den Dissociationsgrad der Elektrolyte. Z. Phys. Chem. 1889, 4, 96–116. [Google Scholar] [CrossRef]
  24. Plata, M.; Bryan, J.; Kantzas, A. Experimental study of heavy oil recovery mechanisms during cyclic solvent injection processes. SPE J. 2021, 26, 1499–1514. [Google Scholar] [CrossRef]
  25. Morrow, N.R.; Mason, G. Recovery of oil by spontaneous imbibition. Curr. Opin. Colloid Interface Sci. 2001, 6, 321–337. [Google Scholar] [CrossRef]
  26. Mai, A.; Bryan, J.; Goodarzi, N.; Kantzas, A. Insights into non-thermal recovery of heavy oil. J. Can. Pet. Technol. 2009, 48, 27–35. [Google Scholar] [CrossRef]
  27. Sheng, J.J.; Maini, B.B.; Hayes, R.E.; Tortike, W.S. Critical review of foamy oil flow. Transp. Porous Media 1999, 35, 157–187. [Google Scholar] [CrossRef]
  28. Maini, B.B. Foamy-oil flow. J. Pet. Technol. 2001, 53, 54–64. [Google Scholar] [CrossRef]
  29. Zhou, X.; Yuan, Q.; Peng, X.; Zeng, F.; Zhang, L. A critical review of the CO2 huff ‘n’ puff process for enhanced heavy oil recovery. Fuel 2018, 215, 813–824. [Google Scholar] [CrossRef]
  30. Wu, M.; Lu, X.; Yang, J.; Lin, Z.; Zeng, F. Experimental analysis of optimal viscosity for optimizing foamy oil behavior in the porous media. Fuel 2020, 262, 116602. [Google Scholar] [CrossRef]
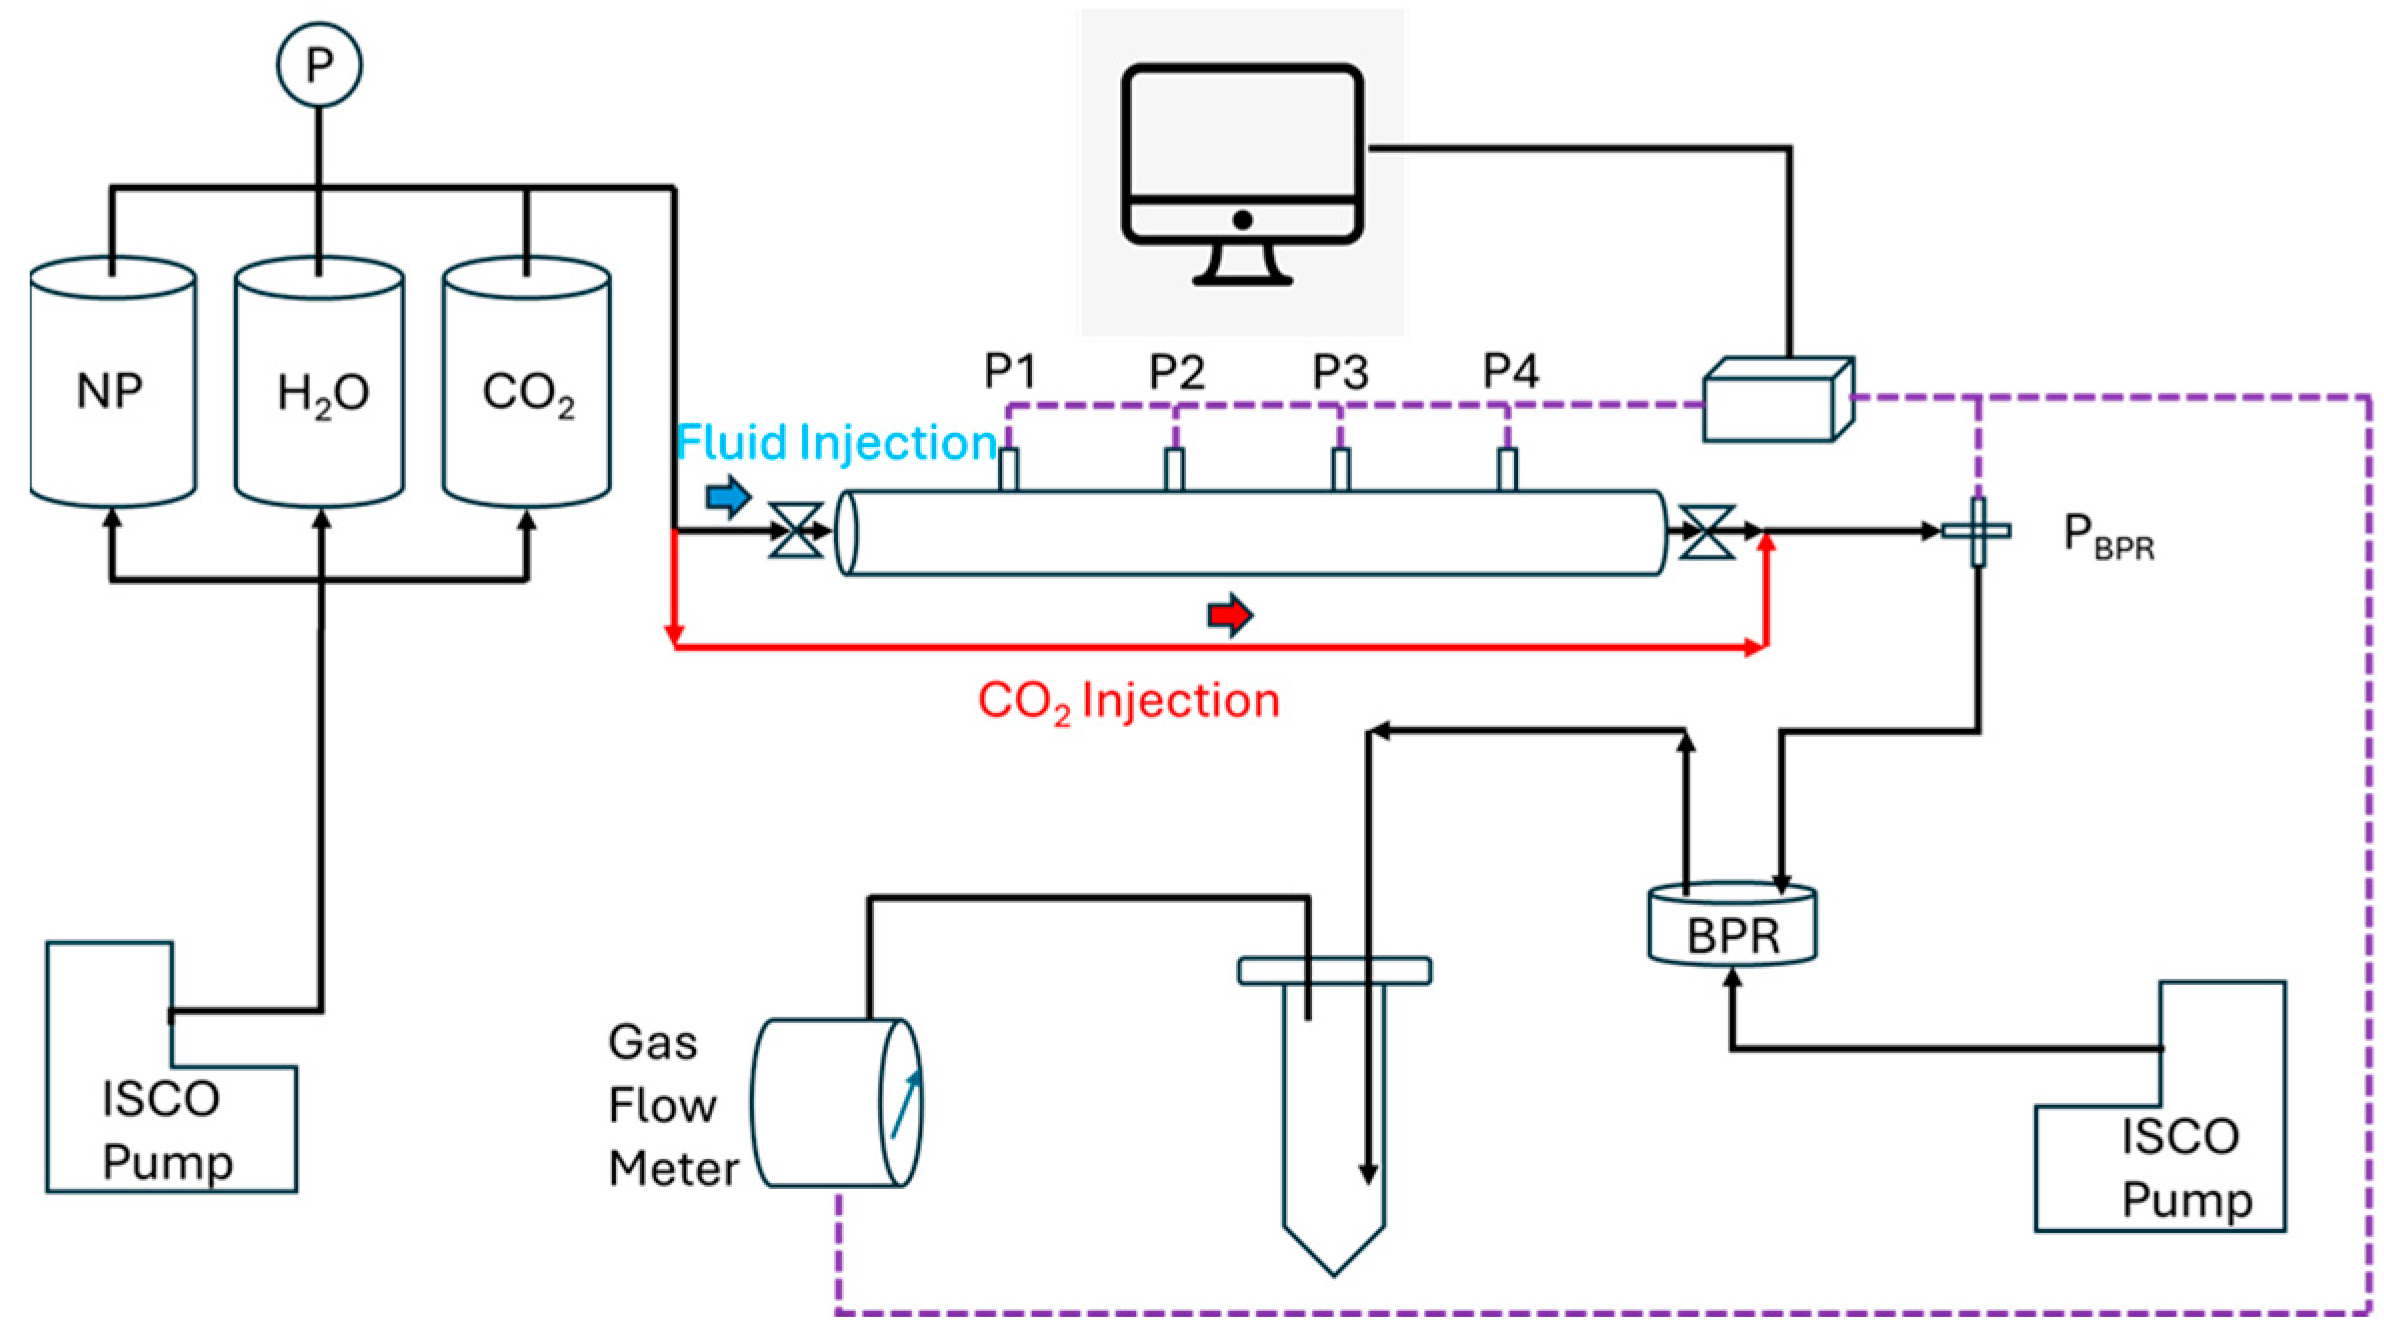
Figure 1. Schematic of the experimental setup. Notes: P = pressure gauge; NP = nanoparticle solution.
Energies 18 04663 g001
Figure 2. Relative permeability interpolation of dispersed gas model.
Energies 18 04663 g002
Figure 3. Per-cycle CO2-CSI performance across five tests.
Energies 18 04663 g003aEnergies 18 04663 g003b
Figure 4. Water flooding performance in Test 2 (left) and Test 3 (right).
Energies 18 04663 g004
Figure 5. History matching results of five CO2-CSI tests.
Energies 18 04663 g005aEnergies 18 04663 g005bEnergies 18 04663 g005c
Figure 6. Comparison of gas relative permeability curves at injection stage.
Energies 18 04663 g006
Figure 7. Comparison of gas–liquid relative permeability curves for free and solution gas phases in Tests 1 and 2 at 7100 kPa injection pressure.
Energies 18 04663 g007
Figure 8. Comparison of gas–liquid relative permeability curves for free and solution gas phases in Tests 3-1 to 3-3 at 6100 kPa injection pressure.
Energies 18 04663 g008
Table 1. Summary of experiment results.
Test No.Pressure
(kPa)
Experimental
Procedure
ORF
(%)
CORF
(%)
Soi/r
(%)
ERI
(%)
17100CO2-CSI30.930.992.133.6
27100Waterflooding33.272.192.8
→CO2-CSI38.959.665.3
361003-1 CO2-CSI26.969.592.629.0
→Waterflooding7.765.7
→3-2 CO2-CSI28.858.049.7
→NP Fluid Flooding0.229.2
→3-3 CO2-CSI5.929.020.3
Notes: ORF = oil recovery factor; CORF = cumulative oil recovery factor, Soi/r = initial/residual oil saturation; ERI = effective recovery index.
Table 2. Comparison of simulation results of CSI at injection pressure of 7100 kPa.
TestInjection Pressure, kPaEACT, J/gmolFREQFACDTRAP_ADTRAP_BSGRKRGCW
17100579091500.230.880.050.0945
27100600084500.240.860.230.0833
Table 3. Comparison of simulation results of CSI at injection pressure of 6100 kPa.
Test Injection Pressure, kPaEACT, J/gmolFREQFACDTRAP_ADTRAP_BSGRKRGCW
3-16100569093500.250.900.070.088
3-26100603090000.220.870.240.076
3-36100838096300.400.900.400.050
Disclaimer/Publisher’s Note: The statements, opinions and data contained in all publications are solely those of the individual author(s) and contributor(s) and not of MDPI and/or the editor(s). MDPI and/or the editor(s) disclaim responsibility for any injury to people or property resulting from any ideas, methods, instructions or products referred to in the content.