Review

A Comprehensive Review of Green Methane Production from Biogas and Renewable H2 and Its Techno-Economic Assessment: An Australian Perspective

1
CSIRO Energy Research Unit, Kensington, Perth, WA 6151, Australia
2
Department of Chemistry and Biotechnology, School of Science, Computing and Engineering Technologies, Swinburne University of Technology, Melbourne, VIC 3122, Australia
3
CSIRO Energy Research Unit, Clayton, Melbourne, VIC 3168, Australia
4
Institute of Industrial Carbon Materials and Hydrogen Energy Techonology, Wenhou University, Rui’an 325206, China
*
Author to whom correspondence should be addressed.
Energies 2025, 18(17), 4657; https://doi.org/10.3390/en18174657
Submission received: 17 July 2025 / Revised: 15 August 2025 / Accepted: 21 August 2025 / Published: 2 September 2025

Abstract

Green methane has been deemed as a low CO2 emission gas. The cost to produce green ethane varies considerably by location and technologies (USD 15/GJ to USD 60/GJ). Although green methane has higher price than the average price of market natural gas in Australia (USD 11–40/GJ between 2019 and 2023), it is currently significantly lower than the production cost for green hydrogen, with the levelized cost of hydrogen (LCOH) at USD 6.6/kg. Green methane production can utilise different processing steps. Separation processes require energy to separate CO2, with the remaining issue of safely storing the captured CO2 or venting it to the atmosphere. Direct catalytic biogas methanation (e-methane) does not require the separation of CO2 but converts CO2 together with CH4 to a purer stream of CH4, converting the CO2 to an energy product. E-methane consequently can be considered as an alternative energy carrier to store off-peak electricity from the grid, commonly called power-to-gas technology (P2G). Furthermore, injecting green methane into gas pipelines does not require significant gas infrastructure upgrading and has no upper limit, as it is compatible with natural gas. Here we review the status of biogas and direct green methane production from biogas around the world and assess technologies that are used to produce green methane via separation or direct catalytic conversion. We evaluate their techno-economic assessment results, with a particular focus on e-methane, identifying the opportunity as a pathway to supply low-emission gas with the perspective of a future e-methane industry within Australia.

1. Introduction

E-methane is a synthetic methane produced by combining green hydrogen with captured CO2. Its key advantage lies in compatibility with existing natural gas infrastructure, making it a drop-in replacement. However, its production cost is currently high due to low process efficiency and the need for a continuous CO2 supply. Green hydrogen is generated via electrolysis using renewable energy. It is the cleanest form of hydrogen but requires substantial investment in new infrastructure like electrolysers, renewable power sources, and dedicated transport and storage systems. Costs are expected to fall significantly by 2030 as technology matures but are quite high in the current context. Blue hydrogen is produced from natural gas using steam methane reforming (SMR) with carbon capture and storage (CCS). It leverages existing fossil fuel infrastructure and offers a lower-carbon alternative to grey hydrogen. However, it faces high upfront capital costs and environmental scrutiny over CCS sustainability.
Biogas, like solar, hydro, and wind energy, is regarded as an important renewable resource. The additional benefit of biogas is it contains ~50% CO2 and ~50% CH4, which makes it a valuable natural CO2 source supply. Historically, biogas has been used as a distributed energy source for rural and developing areas. However, in recent decades the use of biogas has expanded to include regions that already have sophisticated energy networks, like Europe, and the United States of America (USA), with Europe having 1322 green methane producing facilities, over half of which are connected to distribution grids [1].
Australia’s dairy, meat, agriculture, and farming industries produce biogas potential at 371 PJ, representing up to about 90,000 biogas production plants [2]. Green methane, which can be produced through separation or catalytic biogas methanation, has a chemical composition identical to fossil fuel methane but can also be regarded as a low CO2 emission gas. The cost to produce green methane varies considerably by location and technology (USD 15/GJ to USD 60/GJ) [2]. Although the cost of green methane production is still higher than the average price of the market natural gas in Australia (USD 11–40/GJ between 2019 and 2023), it is currently significantly lower than the current production cost for green hydrogen, which is calculated to be around LCOH USD 6.6/kg [3] (equivalent to AUD55/GJ). Consequently, e-methane can be considered an alternative energy carrier to store off-peak electricity.
Furthermore, injecting green methane into the gas pipelines does not require significant gas infrastructure upgrading and has no upper limit, as green methane is compatible with natural gas. Green methane production via separation or catalytic biogas methanation processes involves different processing steps. Separation processes require energy to separate the CO2, with a remaining issue of safely storing the captured CO2. Direct catalytic biogas methanation does not require the separation of CO2 but alternatively converts CO2 together with CH4 to a purer stream of CH4 through a thermal catalytic process and preliminary gas cleaning. Here, we review the status of biogas and green methane production around the world and assess technologies that are used to produce biomethane and e-methane and their techno-economic assessment results, with a particular focus on e-methane, evaluating the opportunity and potential of e-methane in future scenarios as a pathway to supply low-emission or renewable gas.

2. Biogas Resources

2.1. Biogas Composition

Biogas is produced readily through anaerobic digestion (AD) by the breakdown of organic matter in the absence of oxygen. The organic matter used in AD includes agricultural waste, manure, municipal waste, plant material, sewage, green waste, or food waste. The biogas composition [4] depends mostly on raw materials and process conditions, normally with composition as follows: 50–85% methane (CH4); 20–50% carbon dioxide (CO2); 0.1–0.8% hydrogen sulphide (H2S); 0–5% hydrogen (H2); 0–3% nitrogen (N2); 0–1% oxygen (O2); 0–1% carbon monoxide (CO); traces of ammonia (NH3) and siloxanes; and saturated water, shown in Table 1.
While CO2 commonly is treated as the largest major impurity component, and lowers the energy value, it is not the most important impurity. The impurities that are of higher concern than CO2 are hydrogen sulphide (H2S), water (H2O), ammonia (NH3), oxygen (O2), and siloxanes [5]. Water, at saturation, and CO2 are always present in biogas from anaerobic digesters [6].
Table 1. Typical composition (%) of biogas [7,8,9].
ComponentAgricultural WasteIndustrial WasteWastewaterLandfill
(Extremes)
Refs.
Methane (CH4), vol%50–8050–7060–7050–80 (30–80)[7,8,9]
Carbon dioxide (CO2), vol%30–5030–5019–4020–50 (15–50)[7,8,9]
Water (H2O), vol%<61–51–5(≤5)[7,9]
Hydrogen (H2), vol%0–20–200–5[7,8,9]
Nitrogen (N2), vol%0–10–10–10–3 (≤50)[7,8,9]
Oxygen (O2), vol%0–10–1<0.50–1 (≤10)[7,8,9]
Siloxanes, vol%---(≤0.004)[7,9]
Hydrogen sulphide (H2S), ppm2160–10,0000.80–40000.1[7,8,9]
Ammonia (NH3), ppm50–144-100(≤5)[7,9]
H2S, NH3, and water all contribute to corrosion of metallic components in gas systems [6,7,10]. H2S also has the added detriment of poisoning catalysts, which has negative implications for biogas catalytic conversion processes [11,12]. Oxygen in biogas is a significant explosion risk and is kept to a low level in part through the chemical and biological oxygen demands of AD [13]. Siloxanes are silicone-based molecules that can be corrosive by forming silicate when exposed to high temperatures [14].

2.2. Global Biogas and Green Methane Production

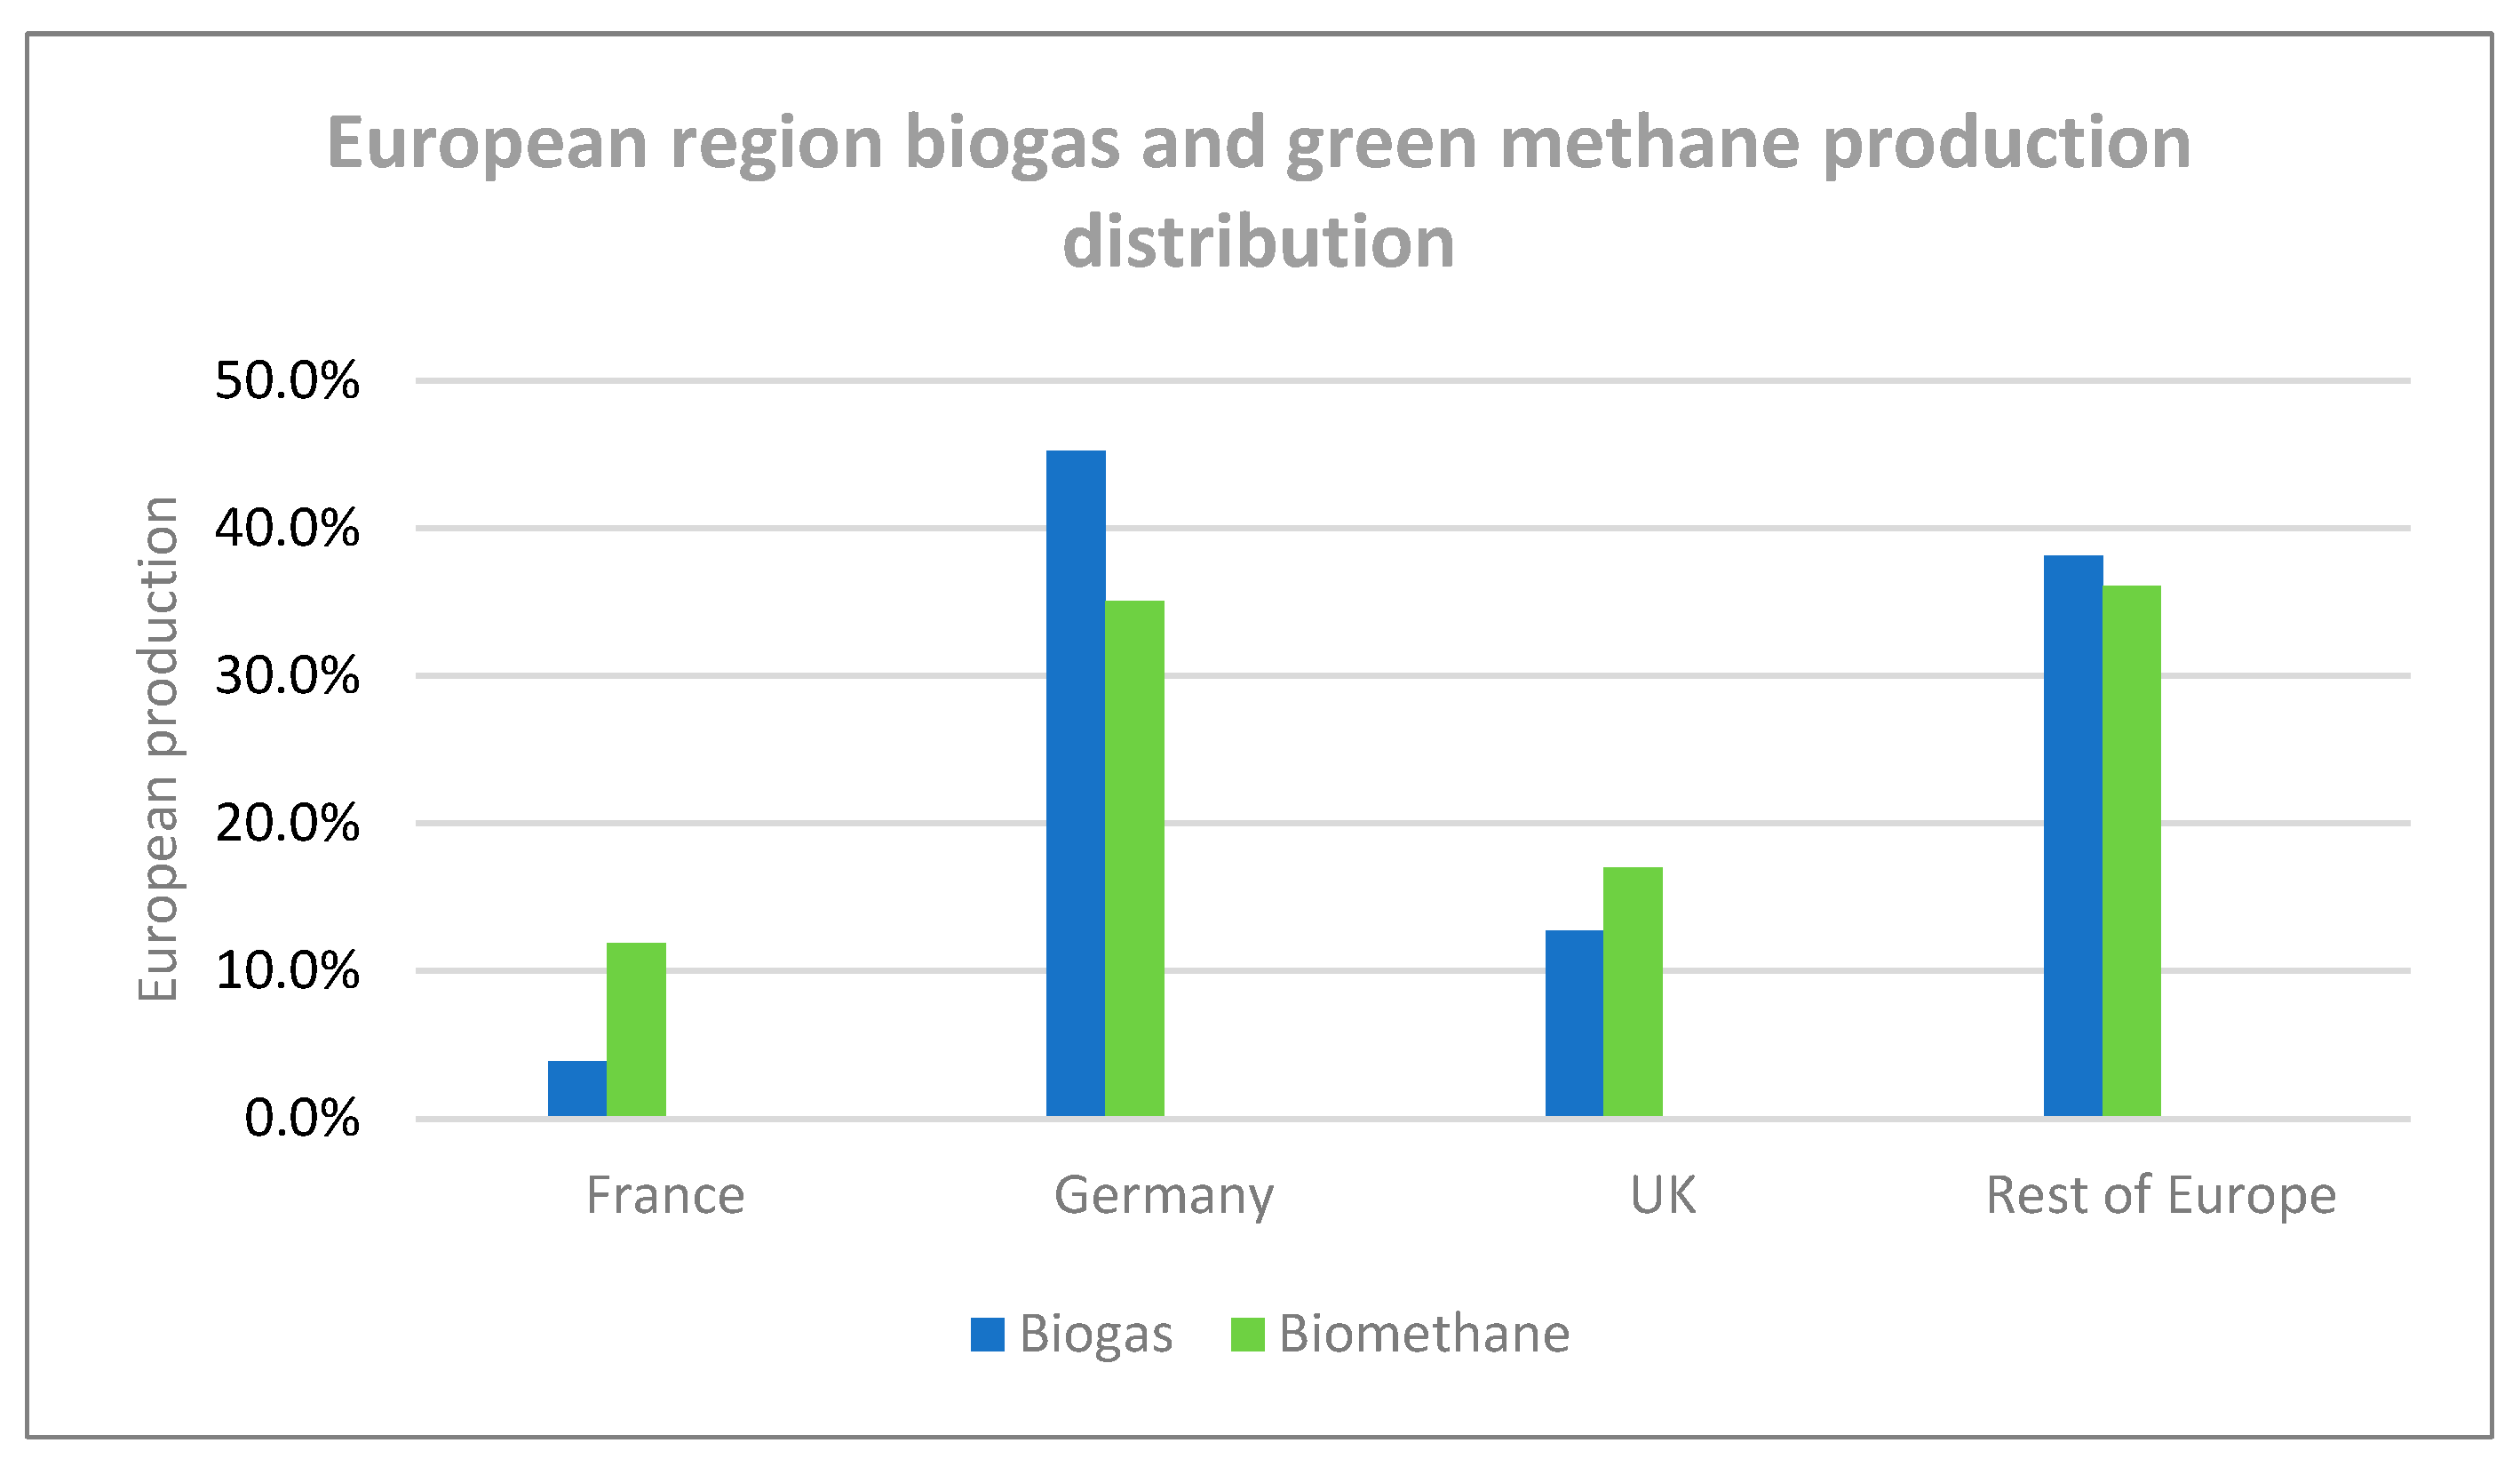
In the contemporary setting, developed nations are utilising biogas and green methane as methods of producing electricity and heat and as a transport fuel. Figure 1 presents the geographic mapping for biogas distribution in some of the major countries that utilise biogas as an energy source. The figure also contains mapping for green methane (production and distribution). Biogas is the product of anaerobic digestion that contains a significant proportion of CO2, which may or may not have further impurities depending on if it is raw or cleaned. Green methane is the upgraded product gas of anaerobic digestion that contains CH4 and very limited impurities.

2.2.1. China

China is the largest single country producing biogas as a consumable product. In 2021 they produced an estimated 137 TWh of biogas, which was utilised for cooking purposes [15]. Most of the production was from household manure digestors in rural areas [19,20]. China has had a significant interest in the development of biogas as a resource in the past. It must, however, be noted that the development of biogas in China is declining with the introduction of competing energy sources [15,19,20], even though programmes designed to increase the commercial availability of biogas were put in place. The first green methane production plant for China was anticipated to be in operation in 2022 [21]. However, no follow-up information has been reported on the operational status of the project.

2.2.2. Europe

The European region is the leading producer and market for both biogas and green methane production currently. In 2021 Europe produced 157 TWh of biogas, and 36.5 TWh of green methane [17]. The largest contributor to this production was Germany, which produced close to 71 TWh of biogas, and 12.8 TWh of green methane [17,18] (Figure 2).
Europe is the largest biogas and green methane market and production region globally. Of the European countries, Germany, Denmark, and Sweden, are some of the most advanced in biogas valorisation, mainly via the combined heat and power (CHP) pathway, although France and Italy are leaders in the transition towards green methane production [22].
The European Union (EU) currently has ambitious targets to reduce its dependence on fossil fuels. This is in part due to the EU’s dependence on external sources of gas and a policy setting shifting towards more energy self-reliance. A significant part of the fossil fuel reduction strategy is the implementation of increased levels of green methane use [23]. The EU has stated that it needs to boost green methane production to 1260 PJ by 2030. Strategies to achieve this target include improved infrastructure development, financial investment, and a supportive environment for research development and innovation [23].
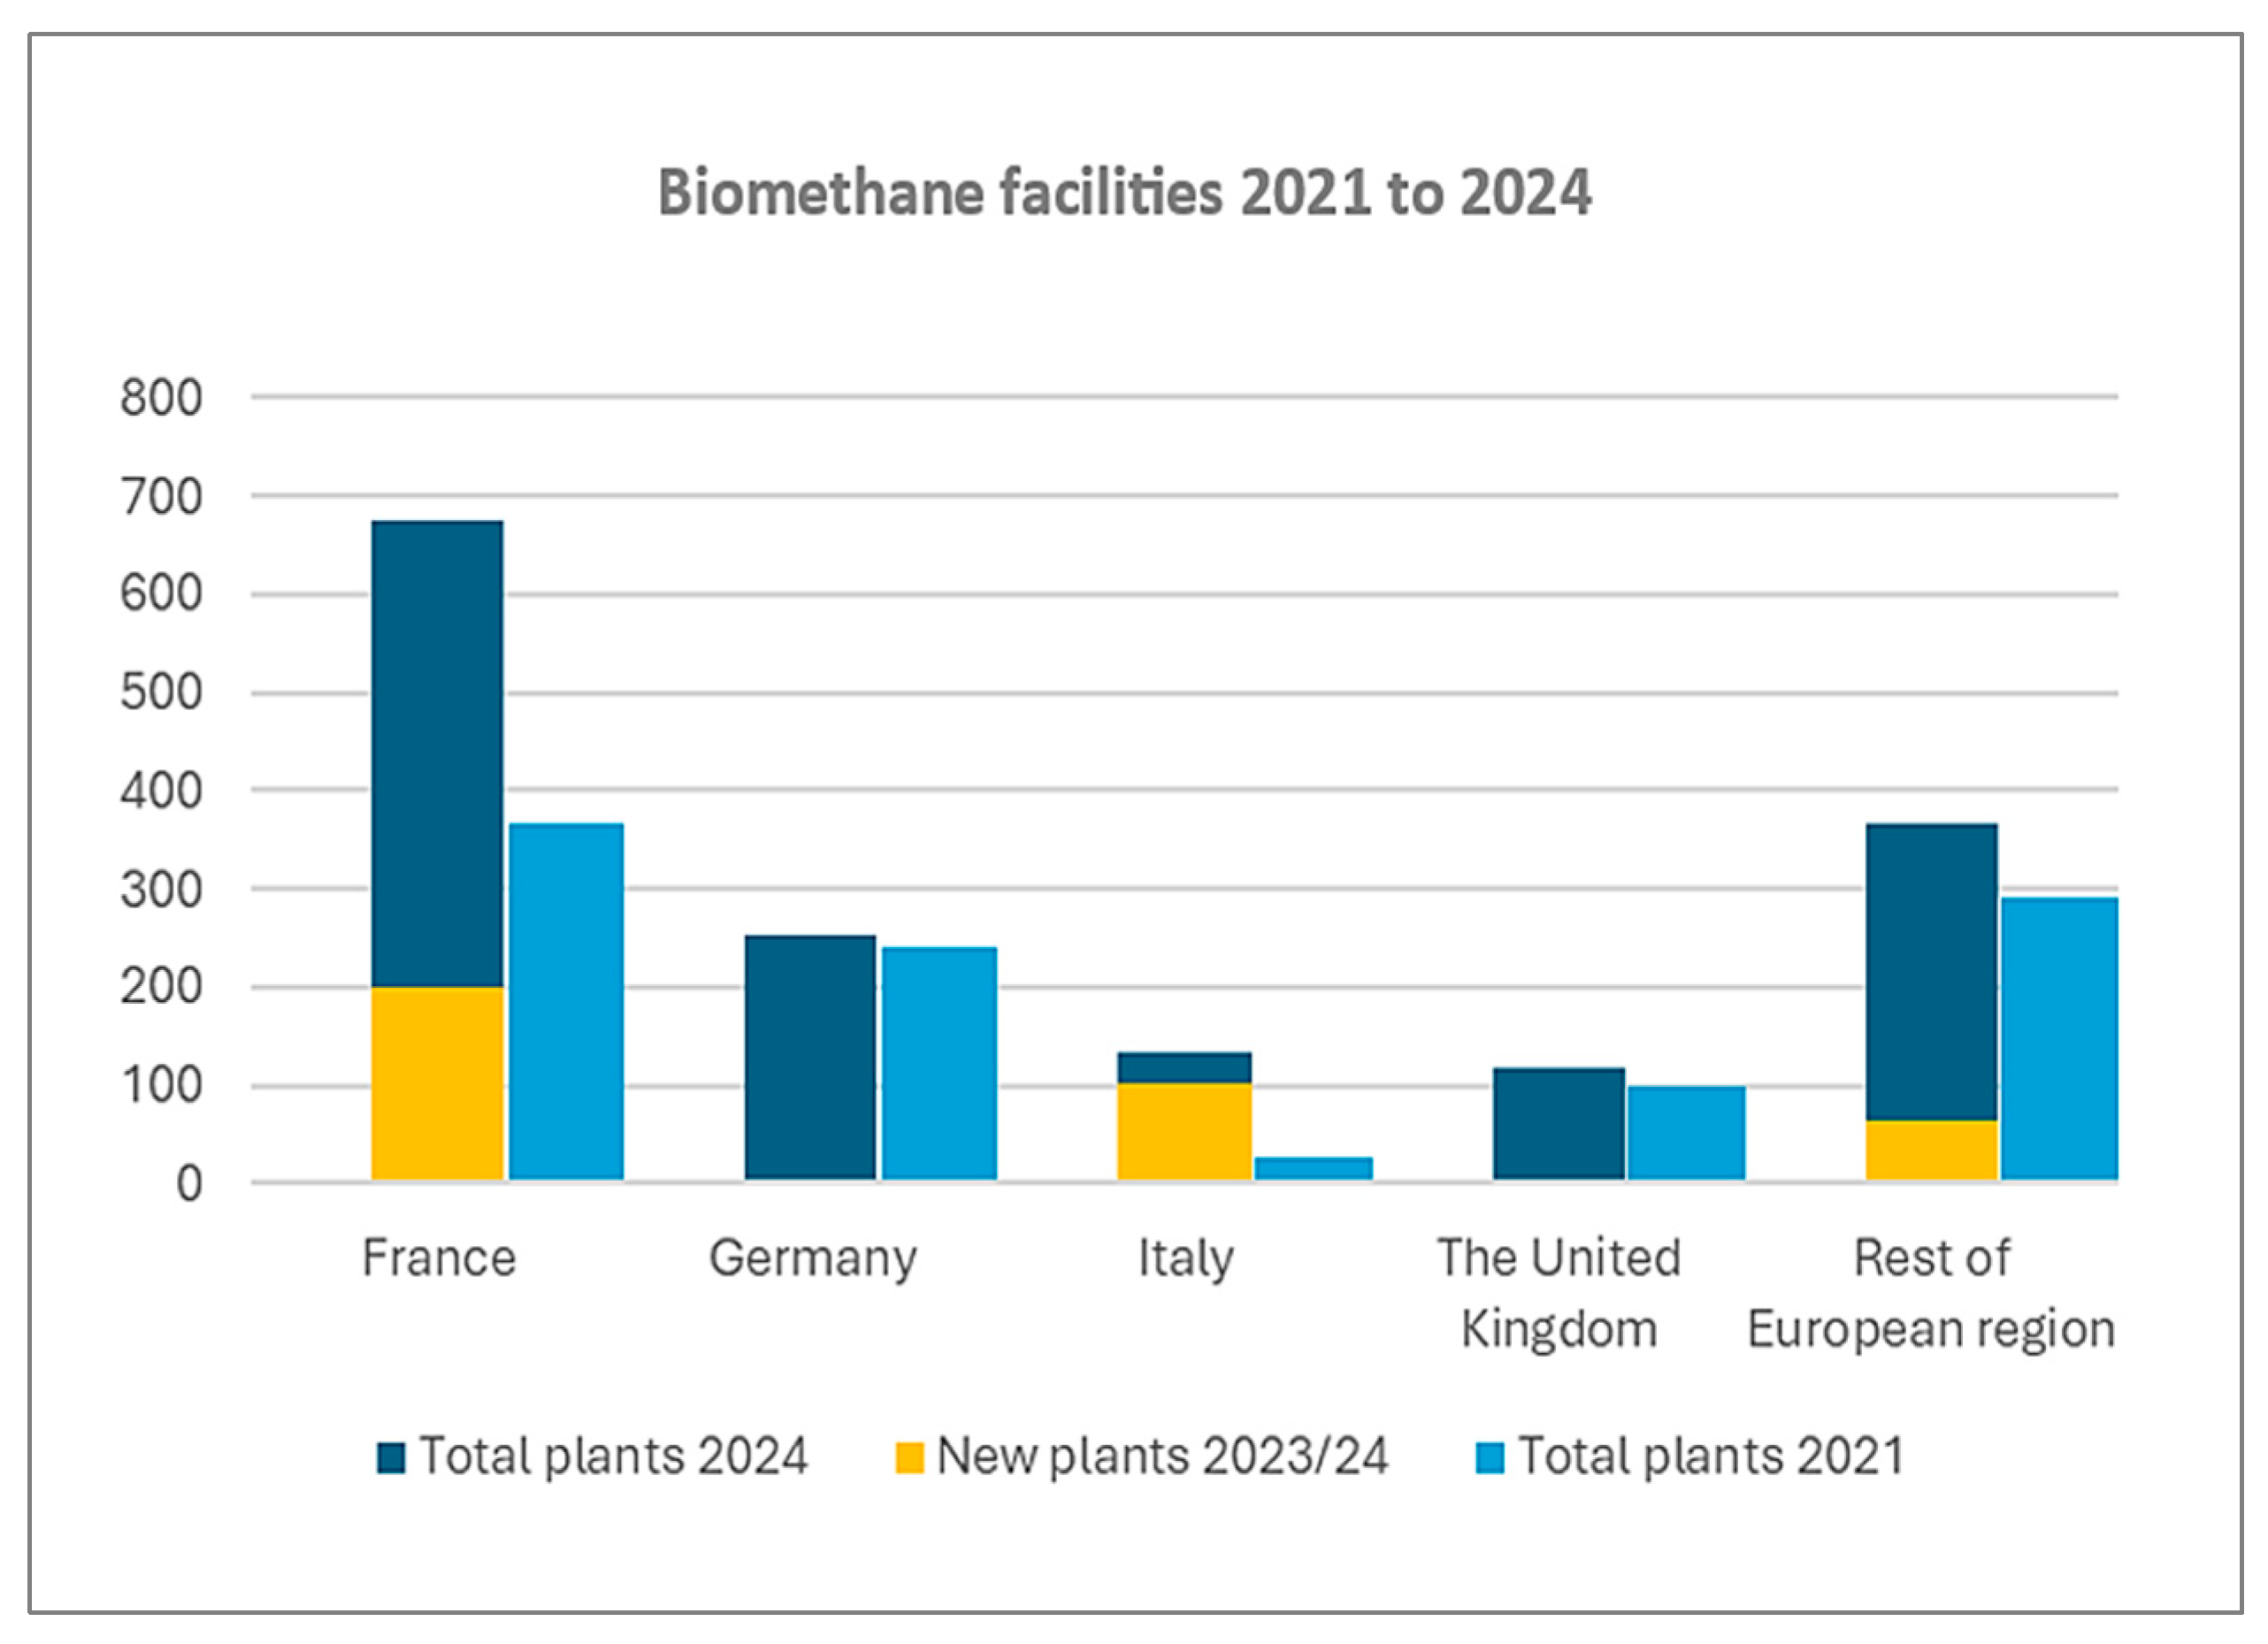
European AD feedstocks are dominantly energy crops at 35–38% livestock manure at 33%, with municipal solid waste, agricultural residues plus sequential crops, and sewage making up the remainder [22]. Optimised EU green methane feedstock scenario forecasts for 2050 include sequential crops at 64% and livestock manure at 25%, making up the majority of green methane feedstocks [23]. The future feedstock forecast for the EU relies heavily on the sequential crop increases, where nearly a doubling of contribution is forecast. Detailed analyses of feedstock composition and energy values have been provided in a previous paper [24] and will not be covered in detail in this report. The change in the number of green methane facilities for the European region between 2021 and 2024 is shown in Figure 3. Germany is the most active biogas user in the European region [18,25]. Although France is not the largest producer of biogas or green methane, France has had the largest number of biogas upgrading facilities established within Europe since 2021 [26,27,28].

2.2.3. USA

Most of the biogas produced in the USA is utilised for electricity generation, followed by the production of renewable natural gas for direct use as a renewable fuel or for injection into natural gas pipelines [29]. The majority of biogas production within the USA (~71%) [30] comes from landfill biogas facilities. Of the 664 landfill gas facilities in the USA, 84 provide biogas for external fuel and energy purposes [31]. The production of biogas from animal manure within the USA is increasing, with an estimated 322 manure-based AD facilities as of 2022 [32,33]. Manure-based biogas accounts for ~20% of biogas production [30]. Food waste and wastewater collectively accounted for 9% of the biogas and green methane production in the USA [30]. In 2021, USA was the largest green methane-producing country, with approximately 100.8 PJ produced yearly, which is nearly 30% of the global production of green methane for that year [34].

2.2.4. Australia

Australia has significant biogas and green methane potential, largely due to its large agricultural sector. It is estimated that more than 53 Mt of biogas feedstocks are produced by Australia’s agricultural sector annually, of which between 19 and 35 Mt is estimated to be collectable [35]. The collection of feedstocks for biogas production is challenging for most types of biomass due to the distributed nature of resources, with the exception of sewage sludge, as it is already managed via wastewater infrastructure, providing a centralised resource for AD. Agricultural biomass has a broad range of potential collection rates, which ranges from 30 to 100%, depending on the feedstock type and source [35].
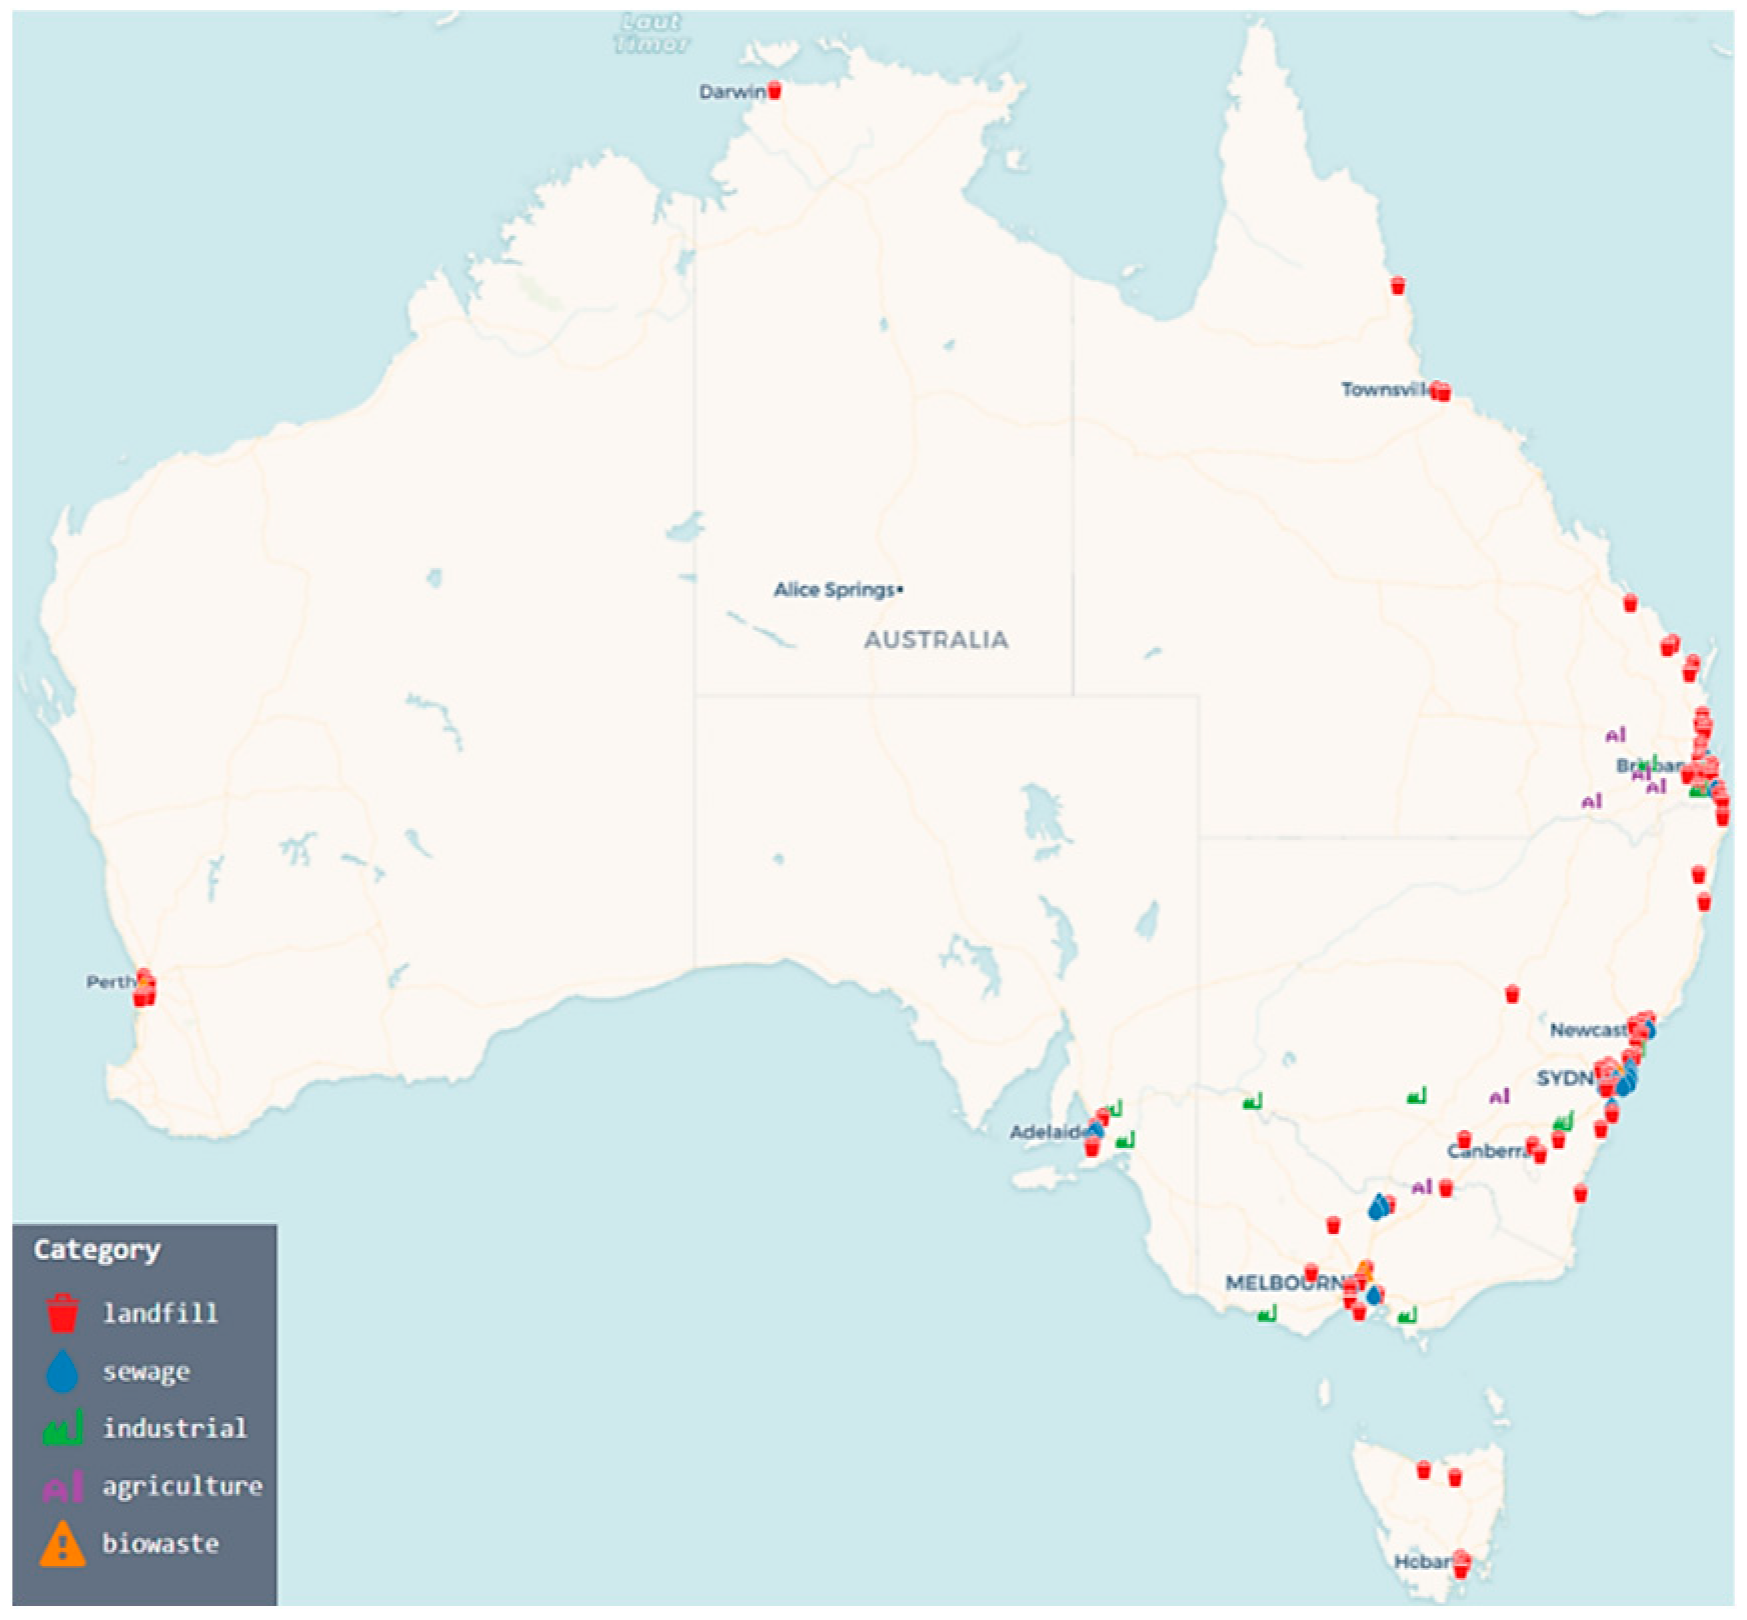
Currently Australia is estimated to have a growing number of biogas facilities [35], with estimates of up to 135 facilities [36]. Figure 4 provides an overview of the locations of the current operational biogas facilities in Australia. The current gross biogas/green methane energy potential from Australia’s food and biowaste, wastewater, and agricultural industries is estimated to be approximately 114.1 PJ/year [35]. However, this potential currently is not being fully utilised due to limited collection rates (Table 2), high capital costs, and low investment incentives for biogas production, combined with significant rates of energy wastage through landfill gas flaring [35].
As of October 2023, Australia had only one operational pilot-scale green methane facility, based in Malabar, New South Wales [35,37,38]. This facility produces biogas from wastewater, which is upgraded utilising hollow fibre membrane technology. The Malabar project is planned to initially produce 95.0 TJ of green methane, which is intended to be scaled up to 200.2 TJ annually by 2030. Australia is currently limited in biogas and green methane production due to collection, legislative, investment, and community knowledge hurdles [35].

2.3. Australia’s Future Biogas Potential

The growth of the biogas and green methane industries in Australia, once started in earnest, will likely need a period of public sector support to increase knowledge of the biogas industry and achieve ecologically and commercially sustainable biogas production levels. Community engagement is required to understand the concerns, impacts, and implications of biogas projects as seen by individual communities. Once the ecological and financial sustainability levels of biogas and green methane production are achieved, reliance on and sensitivity to external energy sources are expected to decrease significantly.
There are several biogas projects in planning [35]. Optimal renewable gas (ORG) has two planned green methane plants, one in Victoria [39] and one in Tasmania [40]. Some of the potential uses for green methane include as an H2 carrier and a carbon source, as seen in the process of producing hydrogen and graphite from wastewater biogas demonstrated by the Hazer group [41].
Accelerated future green methane production would require simple-to-install and simple-to-operate processes for biogas upgrading and green methane production. This would likely include the utilisation of membrane upgrading systems, scrubbing technologies, and catalytic biogas methanation.
In summary, biogas and green methane are increasingly vital components of global renewable energy strategies. Europe leads in both production and policy, with Germany and France at the forefront of infrastructure development. The USA has a strong landfill-based biogas sector and is expanding into other feedstocks. China, despite being a major producer, is seeing a decline due to energy market shifts. Australia holds significant untapped potential, especially in agricultural biomass, but faces logistical and policy challenges.

3. Biogas Cleaning and Upgrading Technologies

3.1. Biogas Cleaning Technologies

The review of biogas production and upgrading systems has allowed for comprehensive comparisons and updates for various technological approaches. A comparison of all available upgrading technologies and operational parameters are documented in Table 3. Considering impurities in biogas will impact the downstream biogas processing, preliminary pretreatment processes are necessary to remove impurities from biogas, which is also associated with costs.
Techniques for biogas pre-cleaning include activated carbon and iron oxide adsorption, membrane separation, biological impurity reduction, and absorption via gas washing [48]. Conditions used for gas purification using activated carbon tend to be between 50 and 70 °C and 7–8 bar. The lifetime of the activated carbon is suggested to be between 4000 and 8000 h, although this is contingent on saturation rate [48]. The removal of water from the gas stream can be achieved through several methods, including gas condensing and physical adsorption. The adsorption of water onto an adsorbate, like silica gel, allows for the gas to be dried to lower dew points suitable for gas grid injection [42,49].

3.2. Biogas Upgrading Technologies by Absorption and Adsorption

Several biogas upgrading methodologies are used to remove CO2, allowing for the upgrading of the calorific value of the gas. Separation upgrading technologies include pressure swing adsorption (PSA), water scrubbing, organic physical scrubbing, chemical scrubbing, amine scrubbing, membrane separation, and cryogenic separation. Schematics of the various separation and upgrading technologies can be seen in Figure 5.
PSA requires prior gas desulphurisation and drying to maximise the lifespan of the column packing materials [6,50,51]. These packing materials utilise pore size to adsorb CO2 and remove it. Each column is utilised and regenerated in a batch sequence with an operational pressure of between 4 and 10 bar [44,51]. The column is regenerated by backflushing the column with a purge gas and a partial vacuum of 200–500 millibar (mbar) [6,44].
Figure 5. Simplified schematics of biogas upgrading technologies. (a) Pressure swing adsorption, (b) water scrubbing, (c) organic scrubbing, and (d) alkaline scrubbing adapted from [52]. (e) Membrane separation and (f) cryogenic separation adapted from [53].
Energies 18 04657 g005
Membrane upgrading technology has in recent years become an increasingly utilised method of biogas upgrading [54]. The increase in uptake of membrane separation is thought to be due to the modular design, simple operation, lower energy requirements, variety of membrane materials, scalability, and high-purity green methane production [10,42,54]. Membrane materials include polymeric, ceramic, inorganic, and composite materials [55,56]. The three main configurations of membrane separation units are hollow fibre, spiral wound, and envelope or flat sheet membranes [54]. The membrane configuration and material type impact the selectivity, permeation of components, membrane material packing density, and level of pretreatment required [43,54,56]. The process of membrane separation has the following three common transport mechanisms: molecular sieving, facilitated transport, and solution–diffusion [43]. Each of these mechanisms mediates which gases preferentially permeate through physiochemical properties [43].
Scrubbing upgrading technologies include water scrubbing, physical chemical scrubbing, and alkaline chemical scrubbing. All the scrubbing methods utilise a process of absorption where impurities from the biogas are transported into the internal matrix of the scrubbing medium. Water scrubbing or high-pressure water scrubbing has been one of the most significant biogas upgrading technologies due to the high purity of CH4 after upgrading and drying [10,42,57]. However, water consumption is often significant, which may not be sustainable [10] due to wastewater management requirements. Chemical and amine scrubbing have lower water consumption compared to water scrubbing and can achieve very high purity green methane. Both technologies have low tolerances for H2S and sometimes suffer losses of green methane to some degree due to the partial solubility of CH4 in scrubbing matrix [42]. Other potential issues can include foam formation and precipitate formation [10]. Organic physical scrubbing can produce high-purity green methane with a smaller footprint area compared to water scrubbing and can be operated without water [10,42]. However, operational and regeneration requirements can increase energy demand without water, and the addition of water can increase the potential of green methane losses [10,42].
Cryogenic separation is the newest upgrading technology and has the potential to have several product streams beyond biomethane and green methane. However, the energy requirements and pretreatments for cryogenic separation, including gas drying, desulphurisation and compression, have the effect of limiting the economic potential of the products.
The estimated investment and costs for biogas upgrading vary based on the technology utilised. Table 4 presents an overall comparison for all available biogas upgrading technologies in terms of sizing, energy consumption, and operational cost.
Table 4. Overall comparison for all available biogas upgrading technologies in terms of sizing, energy consumption, and operational cost. Adapted from [8,10,42,43,44,45,46,47].
PSAMembrane SeparationWater
Scrubbing
Organic Physical ScrubbingChemical ScrubbingCryogenic SeparationRef.
Energy demand, (kWh/Nm3 cleaned gas) 0.3–10.25–0.430.3–0.50.4–0.670.1–0.3
Regeneration heat
0.5–1
0.8–1.54[7,8,42,44,45,46,47]
Energy efficiency, (%)89.2
(84.8–93.6)
90.2
(82.4–98.0)
94.4
(92.7–96.0)
92.8
(90.0–95.5)
93.1
(88.5–97.7)
90.8
(84.9–96.7)
[42]
Flow rate, (m3/h)100–500 100–500100–500 100–500100–500[8,43,47]
Pre-treatmentH2S removal, compression, gas cooling, and gas dryingH2S removal, compression, gas cooling, and gas dryingGas compression and coolingCompression, H2S removal, and gas dryingH2S removalCompression, H2S removal, and gas drying[8,43,44,47]
* Upgrading cost, (EUR/m3) 0.092–0.101 0.065–0.1160.091–0.103 0.090–0.1020.175–0.225[8,43]
* The smaller number of the estimated cost of upgrading relates to the higher rate of production.
Upgrading options for increasing the methane content of biogas also include thermochemical biogas methanation, electrochemical biogas methanation, and biological biogas methanation. While several of these processes require pretreatment of the biogas, others, like biological methanation, can be used directly.

3.3. Biogas Upgrading Technologies by Thermal Chemical Methanation

Biogas consists of a composition that is generally 50% CH4 and 50% CO2 [58]. The hydrogenation of biogas to methane utilises the CO2 in biogas and converts it into a low-emission methane product. The carbon associated with CO2 can, once hydrogenated, enable the biogas to meet its full potential as a renewable gas fuel. By performing biogas hydrogenation to methane directly, the separation step can be avoided while producing an increased amount of energy content by doubling the methane content in the product gas. Meanwhile, as waste CO2 has been fully utilised in the conversion process, no post-process CO2 is produced, avoiding the challenging issue of how to deal with the captured CO2 in the separation process. The resulting value-added green methane product can be used to offset the carbon intensity of the fossil fuel gas and the gas infrastructure. Potentially this technology not only offers a pathway to store renewable energy in the form of e-methane but also offers a pathway to decarbonise gas infrastructure when it is injected into the gas pipelines.
One of the challenges for biogas methanation processing is catalyst deactivation. Catalyst deactivation occurs because of the poison effect from trace impurity components in biogas and carbon deposition on the catalyst surface during the reaction [59]. Carbon deposition sometimes can be due to ineffective temperature management of the reaction [60], as the reaction is an exothermic process. The development of catalysts resistant to deactivating conditions will be advantageous for optimising processing conditions.
In general, catalyst systems for biogas methanation are similar to CO2 methanation catalysts, as the main reaction occurring in the process is the hydrogenation of CO2 to methane. Table 5 presents the literature-reported catalysts used in biogas methanation processes. It is apparent that the active metals, supports, and promoters that are suitable for CO2 methanation are still the most suitable choices for biogas methanation. However, given the impurities in biogas, catalyst deactivation has often been identified as a problem, especially for Ni-supported catalysts [61]. It was believed that the major contribution to catalyst deactivation is sulphur in biogas [62]. To prevent catalyst deactivation by sulphur, two strategies have been proposed. One is to use the bimetallic system where additional active metal acts as a trap to adsorb the sulphur, e.g., Ni can act as a sacrificial agent to inhibit Ru from being poisoned [63]. Another method to inhibit deactivation is to add a promoter that can lower the sulphur adsorption capacity on the catalyst surface, e.g., Ce doping into metal-oxide support to improve the catalyst durability [64,65]. However, it was found that, when CeO2 acts as support material, CeO2 can react with H2S to form Ce2O2S, a compound that promoted the reforming activity to produce by-product CO [65]. As a commonly used catalyst support, Al2O3 is often chosen as it can maintain the activity longer than CeO2 supported catalysts in the presence of H2S [58]. Treatment of sulphur before the reactor inlet to minimise its impact on the catalyst is a common method to lower the sulphur content. For example, adding a ZnO adsorber upstream can trap sulphur as ZnS and improve the catalyst lifetime [66,67]. Other materials are available to remove sulphur catalytically. However, there are always trade-offs to consider, such as the consumable expense of the catalysts or the energy penalty. Alternatively, an oversized bed can be designed where deactivation can be handled by a sacrificial section of the reactor [68].

4. Biogas Methanation Pilot Studies

The concept of power-to-gas (P2G) is used to define the storage of renewable energy via the production of green hydrogen or e-methane. In the context of green hydrogen production, renewable energy in the form of wind or solar generated electricity is used to power electrolysers to produce H2. The scale of the P2G facilities can be defined by the power input requirement of the electrolyser producing renewable hydrogen, represented in kilowatts (kW) [75].
Pilot-scale studies have been developed to demonstrate the biogas P2G concept. Lab-based evaluation of biogas methanation, although important for fundamental studies, is not representative of industrial applications. Pilot-scale studies are important for testing the scale-up of technologies that ultimately operate within industrial settings. Operating at scale and with typically real condition examples, such as variable feed gas and intermittent power supply can provide insight into industrial-scale systems. The real biogas source can differ in trace contaminant concentration, as well as overall gas composition, and can exhibit variability from day to day and from site to site. This variability can impact plant operability and ultimately the efficacy of the plant. In the following section, several pilot-scale thermal biogas methanation demonstration plants have been reviewed. Examples are of demonstration projects that provide industrially relevant data, with key points documented for reference. As well as general examples of technologies and methods, insights have been provided into the challenges associated with industrial biogas methanation applications.

4.1. M. Spect et al. Pilot Plant Design and Set-Up

ETCOGAS GmbH commissioned the design and construction of a 25 kW biogas methanation plant. The plant converting CO2 from amine scrubbing and pressure swing adsorption, or alternatively, the direct conversion of biogas to e-methane. The plant was commissioned in 2009 [75]. The pilot plant consisted of a two-stage reactor system, double jacketed with heat transfer oil used to manage reactor temperature with a condensation knock out tank between the two reactors. A product recycle loop was used to manage hot spots in the first reactor, and steam was used to manage catalyst deactivation [75]. The set-up is designed to be containerised, with all ancillary gas-handling infrastructure located within a converted sea container for ease of modularity.
Spect et al.’s [75] 25 kW plant used feed gas of two different compositions, including CO2/H2 and CH4/CO2/H2. The CO2/H2 composition was derived from PSA separation with H2 added separately, where the CH4/CO2/H2 is representative of a biogas composition, again with H2 added as a separate stream. Both feed gas compositions had gas cleaning applied. It was noted that the methane component of the direct methanation process contains the H2S contaminant or possibly organic sulphur, given it is associated with the e-methane. This would suggest that added sulphur cleaning would be required for the direct methanation process [75].
A 250 kW biogas methanation system was also built, which consisted of a high-pressure alkaline electrolyser coupled with dual reactor systems. The first reactor system consisted of a traditional multi-tube set-up with molten salt reactor cooling. The second reactor system consisted of a plate heat exchanger arrangement where water was used as the cooling medium; the systems could either be run in parallel or independently. A membrane separation unit was installed to upgrade the product gas, and the captured H2 was recycled to the feed stream. The plant was commissioned in 2012 [75].
Results from the 250 kW reactor are indicative of successful scale-up where the reactor design concept was developed from a single-tube reactor and scaled up to a tube-bundle reactor [75]. Although a plate reactor was incorporated into the design, it is indicated that the scaling of this reactor type was more problematic where plate reactor scale-up is not linear. Testing the tube reactor design consisted of a period of run time at steady state before an introduction of a repeated load change. It was reported that up to a 30% load change had no impact on the operational performance. A lag in startup from standby was observed due to the thermal inertia of the system and the fact that the system had been purged of reagent gases [75]. These factors are an important indication of operational suitability that will potentially guide future e-methane pilot plants. The 30% load change limit on operational performance is an important indicator of feed variability tolerance. The lag in start-up is also an important parameter to be noted given that the reactor would be required to be maintained under reduced conditions and at a standby temperature whist in idle state.
A 6000 kW industrial pilot biogas methanation system was constructed in Werlte, Lower Saxony (Germany), by ETOGAS-GmbH and was completed in 2013 [75]. The system was a single-pass methanation unit producing 325 m3 STP/hr of e-methane, feeding the product gas directly into the gas grid at 1.8 bar. CO2 for the process was sourced from a digester plant, and CO2 was separated via amine scrubbing. The heat from the methanation unit was used for the amine stripping cycle. During low gas demand, e-methane was stored at 35–45 bar for use in mobility applications. Another unique feature of this set-up was the ability to store hydrogen in a buffer tank at 10 bar, allowing for management of electrolyser intermittency [75]. This system has the built-in ability to accommodate renewable intermittency with the provision of the H2 buffer tank as well as the ability to manage producer gas usage via product gas storage at pressure.

4.2. J. Guilera et al. Pilot Plant Design and Set-Up

J. Guilera et al. [76] report on an industrial methanation plant-based on a 37 kWh alkaline electrolyser. In this instance the biogas consisted of a high proportion of methane, with the remainder of the composition comprising carbon dioxide with some residual nitrogen. Trace levels of contaminants were also present [76]. The set-up was designed around three containerised unit operations, including biogas cleaning, biogas membrane upgrading, and a thermal methanation unit [76]. The gas cleaning unit employed a glycol dehydration system and activated carbon filters. From the gas cleaning unit, the gas was pressurised to 10–15 bar before being directed to the upgrading unit or, alternatively, to the methanation unit. The upgrading unit consisted of a 3-step commercial membrane separation process with a capacity of 50 Nm3/h of biogas. Three separate streams of feed gas can potentially be delivered to the methanation reactor, including biogas, partially upgraded biogas from the first separation step, and a low-pressure CO2 stream, although this stream required pressurising before methanation due to low-pressure permeation through the three-stage separation step [76].
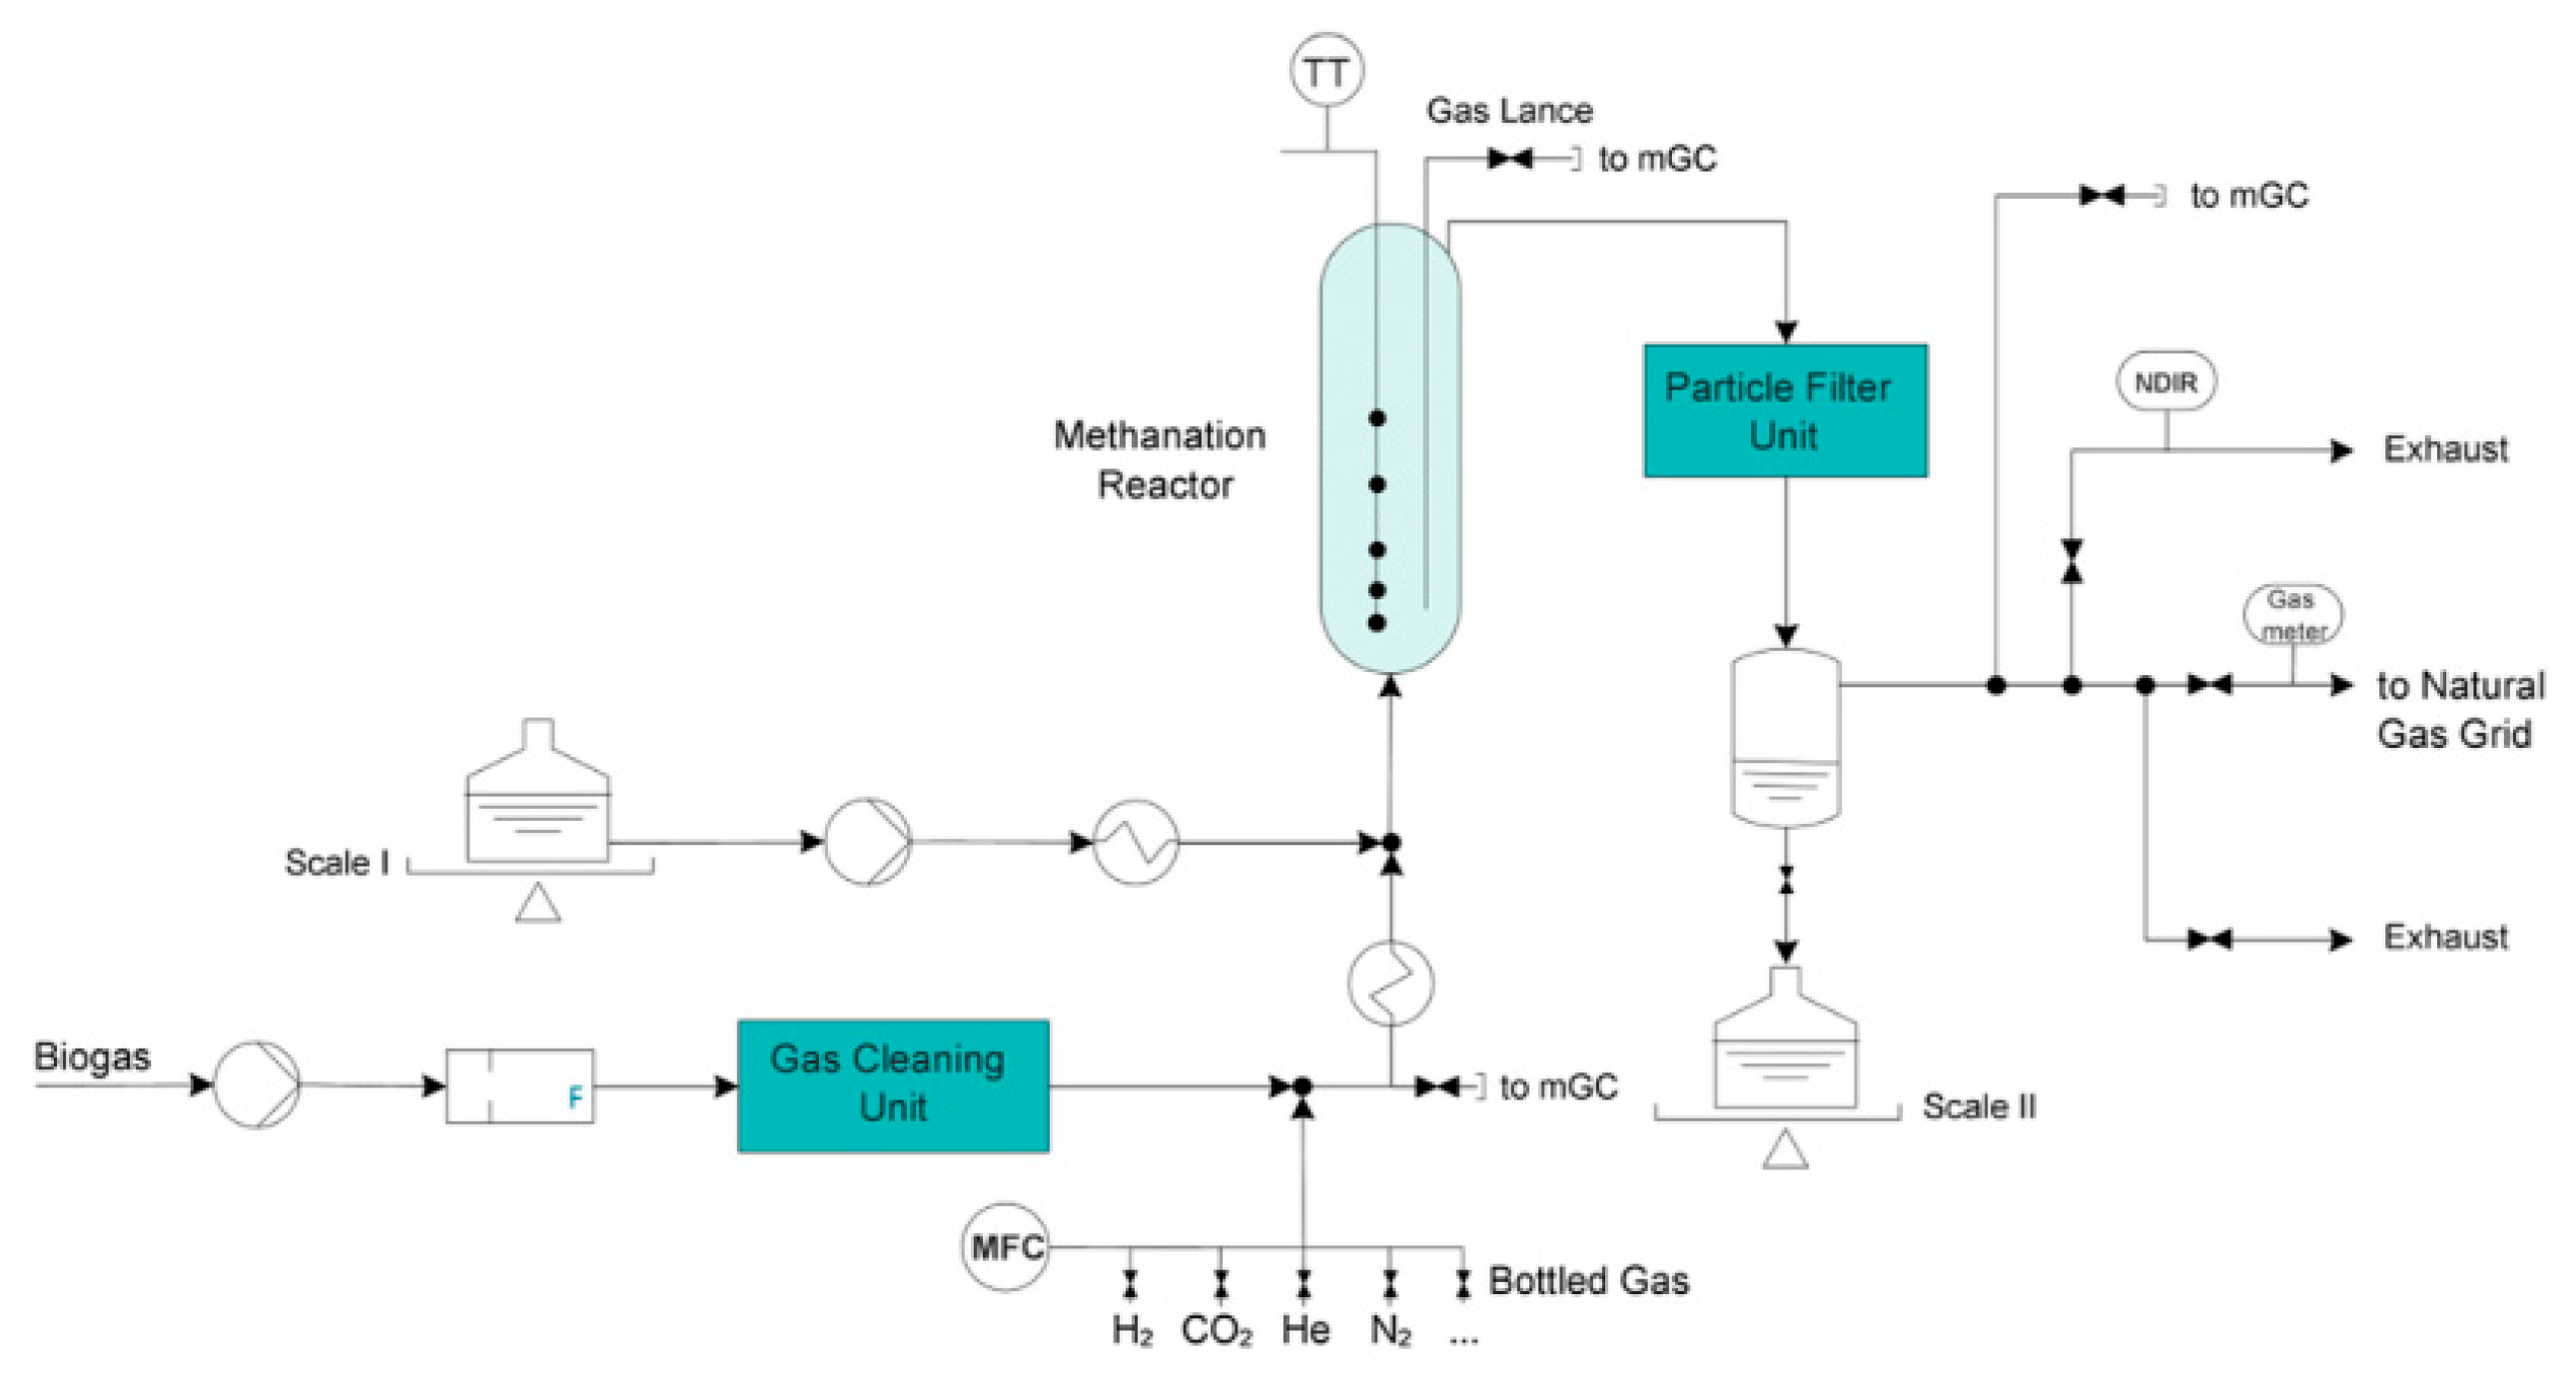
The overall operation relied on a multi-step process of gas pre-heating, methanation, and water condensation. The heat exchangers used for preheating are based on microchannel heat exchanger technology. A microreactor apparatus was also used for the reactor technology; the microstructure is said to enable superior temperature and reaction control [76]. The dual bed configuration consisted of cooling with water at pressure, with the second bed cooled with compressed air; electrical heating could also be applied in multiple zones along the bed. Figure 6 represents the layout of the multi-feed options, including biogas membrane separation and partial upgrade streams [76]. As a process evaluation set-up, this process enabled the study of different feed composition trials and the testing of different reactor apparatus. This project is indicative of a technology demonstration hub.
J. Guilera et al. [76] conducted over 600 h of experimentation where start-up was conducted with commercial CO2 and optimised for high methane yield. Over 150 h of experimentation under these conditions were performed with an e-methane producer gas composition of CH4 > 95%, H2 < 3%, and CO2 < 2% [76]. After the initial optimisation runs with commercial gas, the reaction was switched to real gas and tested with various feed streams. The membrane permeate stream achieved greater than 95% methane concentration [76]. Testing of the biogas and partially upgraded biogas feed gas also resulted in satisfactory product gas compositions. It was noted that the two reactors were always necessary for achieving the high methane yield, with the first reactor output dependent on feed gas carbon ratio; in contrast, the second reactor was independent of carbon ratio [76]. Important information is provided here in relation to reaction stability over time and the necessity for multi pass reactor systems.

4.3. C. Dannesboe et al. Pilot Plant Design and Set-Up

C. Dannesboe et al. [77] have documented pilot-scale studies relating to biogas methanation; the experimental component consisted of feed throughput of 10 Nm3 h−1 of biogas [77]. A dual-tube reactor set-up was employed with a packed bed height of 2.3 m, with a pressurised water-cooled jacket used to maintain the reaction temperature; reaction pressure was set at 20 bar [77]. The researchers provide data on reaction set-up and experimental results for a 1000 h methanation run. The results highlight the need for efficient cooling to avoid catalyst deactivation because of thermal sintering due to reactor bed hot spots. Dannesboe et al. [77] focus on the temperature control aspect of the methanation reaction.
The researchers demonstrate that the reaction can be run for extended periods of time (1000 h) with multiple startups and shutdowns. The data presented in the manuscript published by Dannesboe et al. [77] show a significant exotherm at the top of the first reactor reaching a temperature of 670 °C before the temperature is controlled further along the bed to a more manageable reaction temperature of 280 °C. The reaction was restarted numerous times at 100 h, 350 h, 650 h, 850 h, and 950 h with the same exotherm temperature profile evident at the top of the reactor and maintained for the duration of the experiment. It was possible to achieve reaction start up from a hot standby temperature of 280 °C.

4.4. J. Witte et al. Pilot Plant Design and Set-Up

J. Witte et al. [78] report on a bubbling fluidised bed biogas methanation pilot plant located in Zurich, Switzerland [78]. The upgraded biogas achieved methane concentrations of >96% for a reaction duration of 1100 h, with the synthesised e-methane fed into the grid. Work was conducted on a container-based pilot-scale methanation plant with a capacity of 10–20 kW chemical output [78]. Figure 7 represents a schematic of the pilot plant set-up. Data are provided regarding plant arrangement and process observations. The set-up could be run on real biogas or simulated biogas at a volumetric delivery rate of 1.4–2.3 Nm3/h−1. The feed stream of real biogas was compressed to the system operating pressure before being passed over a sulphur trap.
During the experimental phase, the operating programme was divided into three stages. The first stage consisted of optimisation, where parameters were varied to find the optimum operating conditions. During the second phase, the methanation reactor was held at optimal operating conditions, therefore achieving steady-state conditions for a duration. The third phase consisted of a stress test sequence and was conducted by reducing the de coking water delivery rate step wise to assess the coking effect on the catalyst and the resultant deactivation.
During the first phase of the reaction (429 h), parameters were modified to assess optimal operating conditions [78]. Pressure was set to 5.7 bar for the duration, and the biogas concentration was also kept constant; the water/CO2 ratio of 0.5 was also maintained. Variable parameters included flow rate, H2/biogas ratio, and reactor temperature. During the second phase (605 h), the optimal operating conditions defined by the first phase were applied successfully, although detailed analysis of catalyst stability and reaction trends are beyond the scope of this review.

4.5. F. Kirchbacher et al. Pilot Plant Design and Set-Up

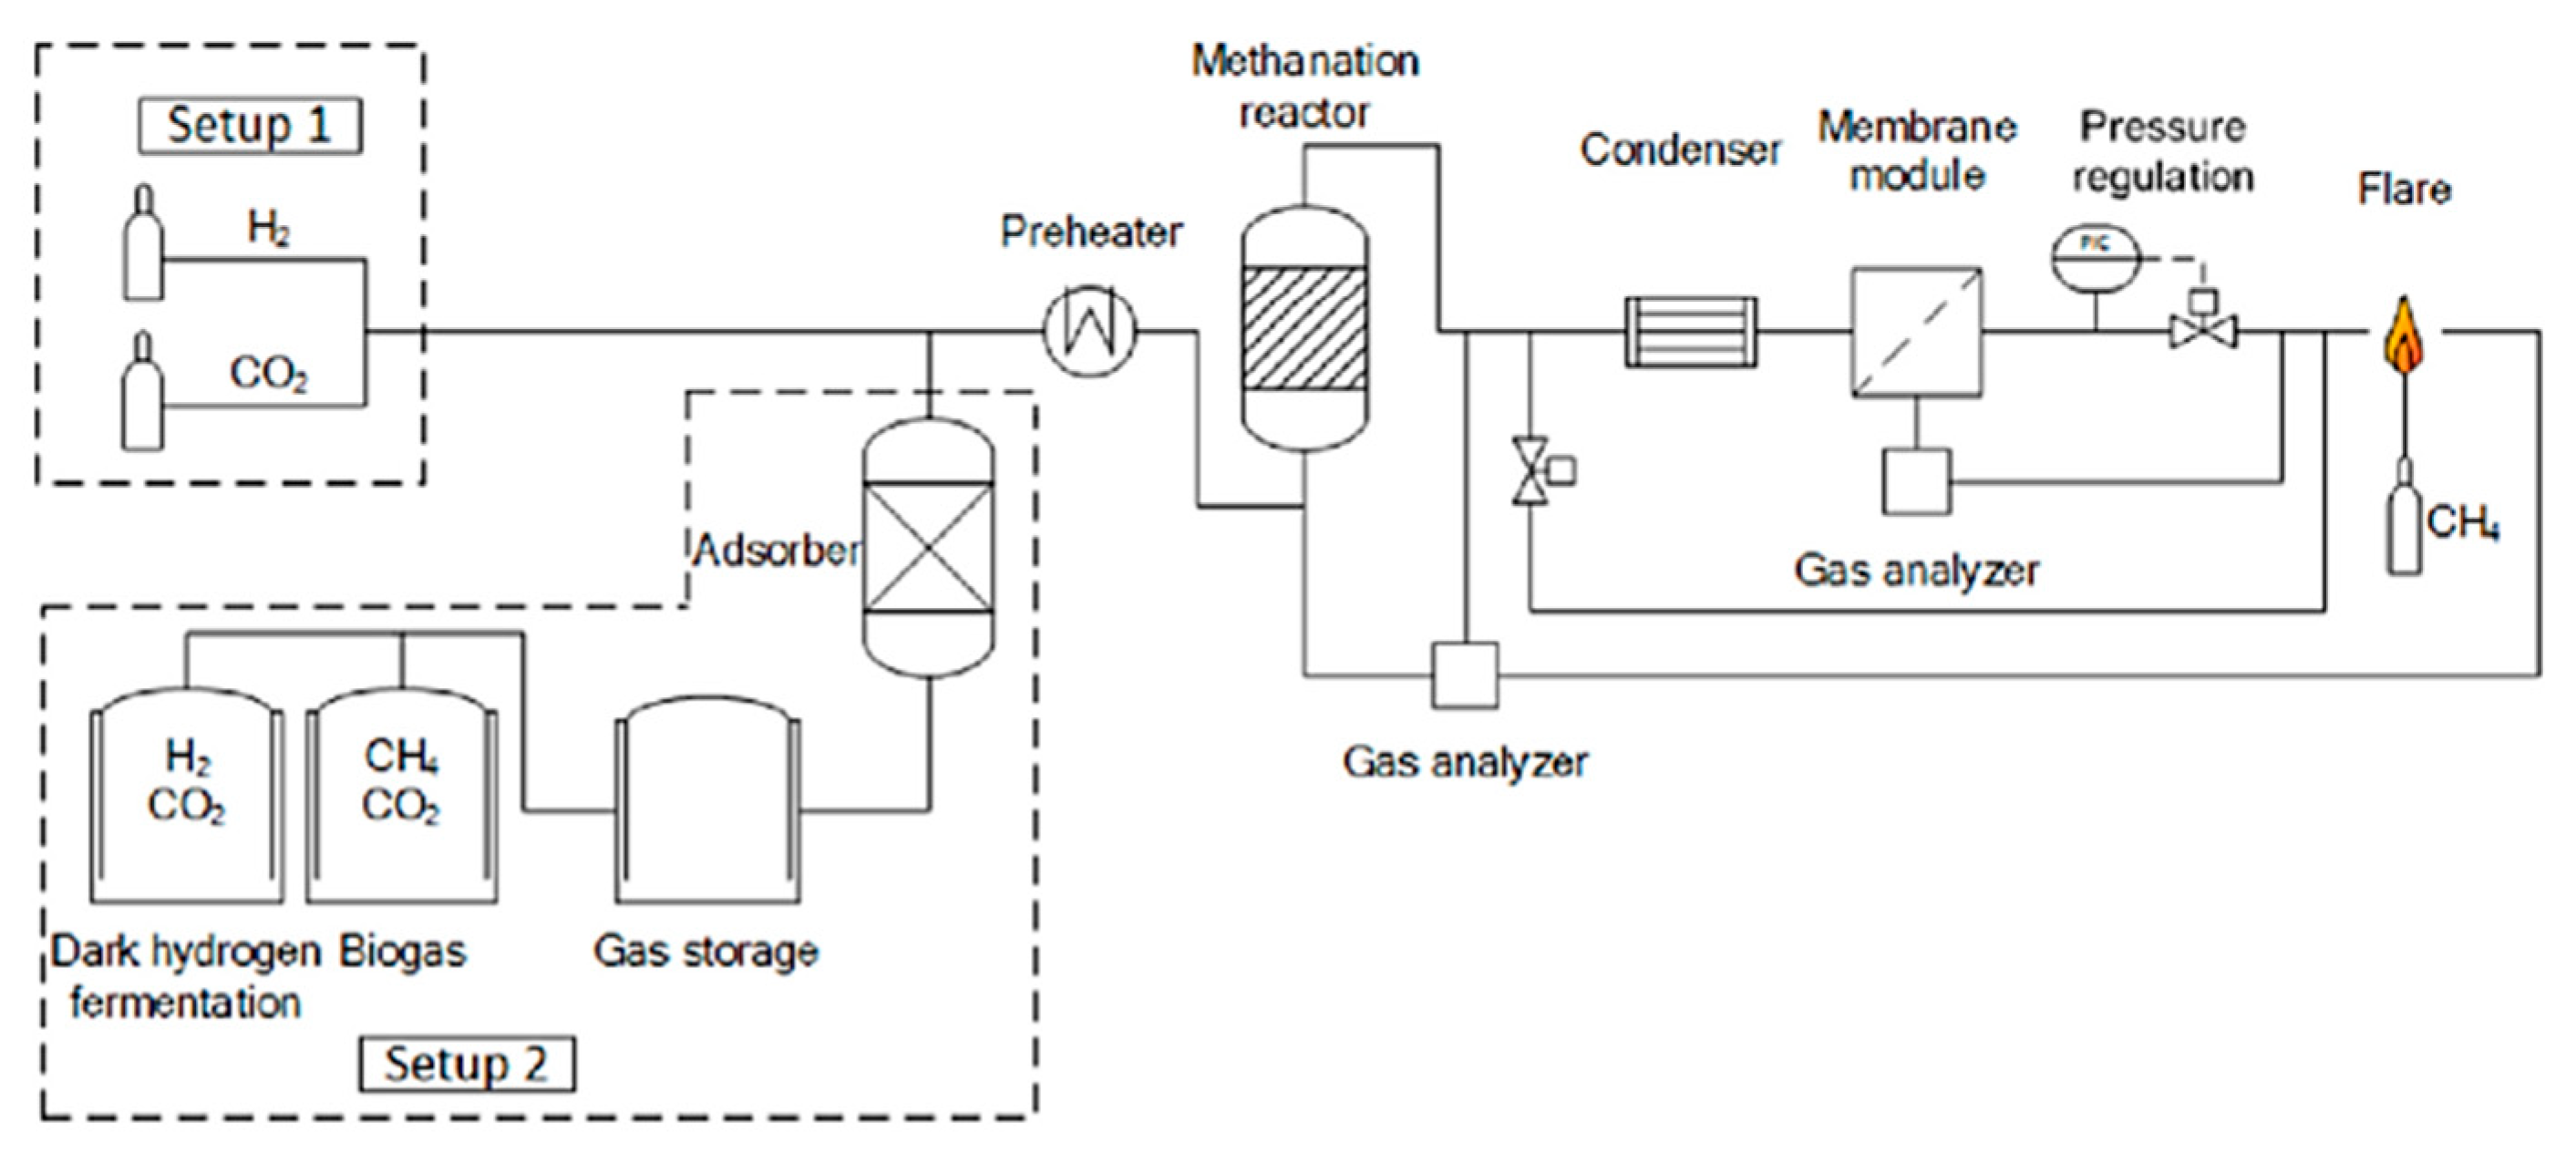
F. Kirchbacher et al. [79] discuss an e-methane pilot project based in Austria. Their methanation reactor consisted of three reactors at 2.2 L each, which could be used in series or parallel [79]. The system included the provision for real and simulated biogas and included a downstream membrane treatment to further upgrade the e-methane product [79]. This work provides insight into industrial biogas upgrading and methanation, detailing technical aspects of plant set-up from digester to final upgraded product. Limited general reactor design information was provided, although it was stated that the methanation reactor system consisted of a single reactor capable of reaction flows in the range of 3000 h−1 to 6000 h−1 GHSVs (no other units provided); Figure 8 represents the process. Noted is the dark fermentation process used for H2 synthesis.
The results presented here are based on a simple single-pass methanation reactor and single-pass membrane set-up. The process demonstrates that concentrations of >96% CH4 yield are possible [79]. In the current project, carbon monoxide content needs to be addressed via suitable reactivity during the methanation step and cannot be removed from the CH4 product gas stream with membrane set-up [79].

4.6. R. Gaikwad Pilot Plant Design and Set-Up

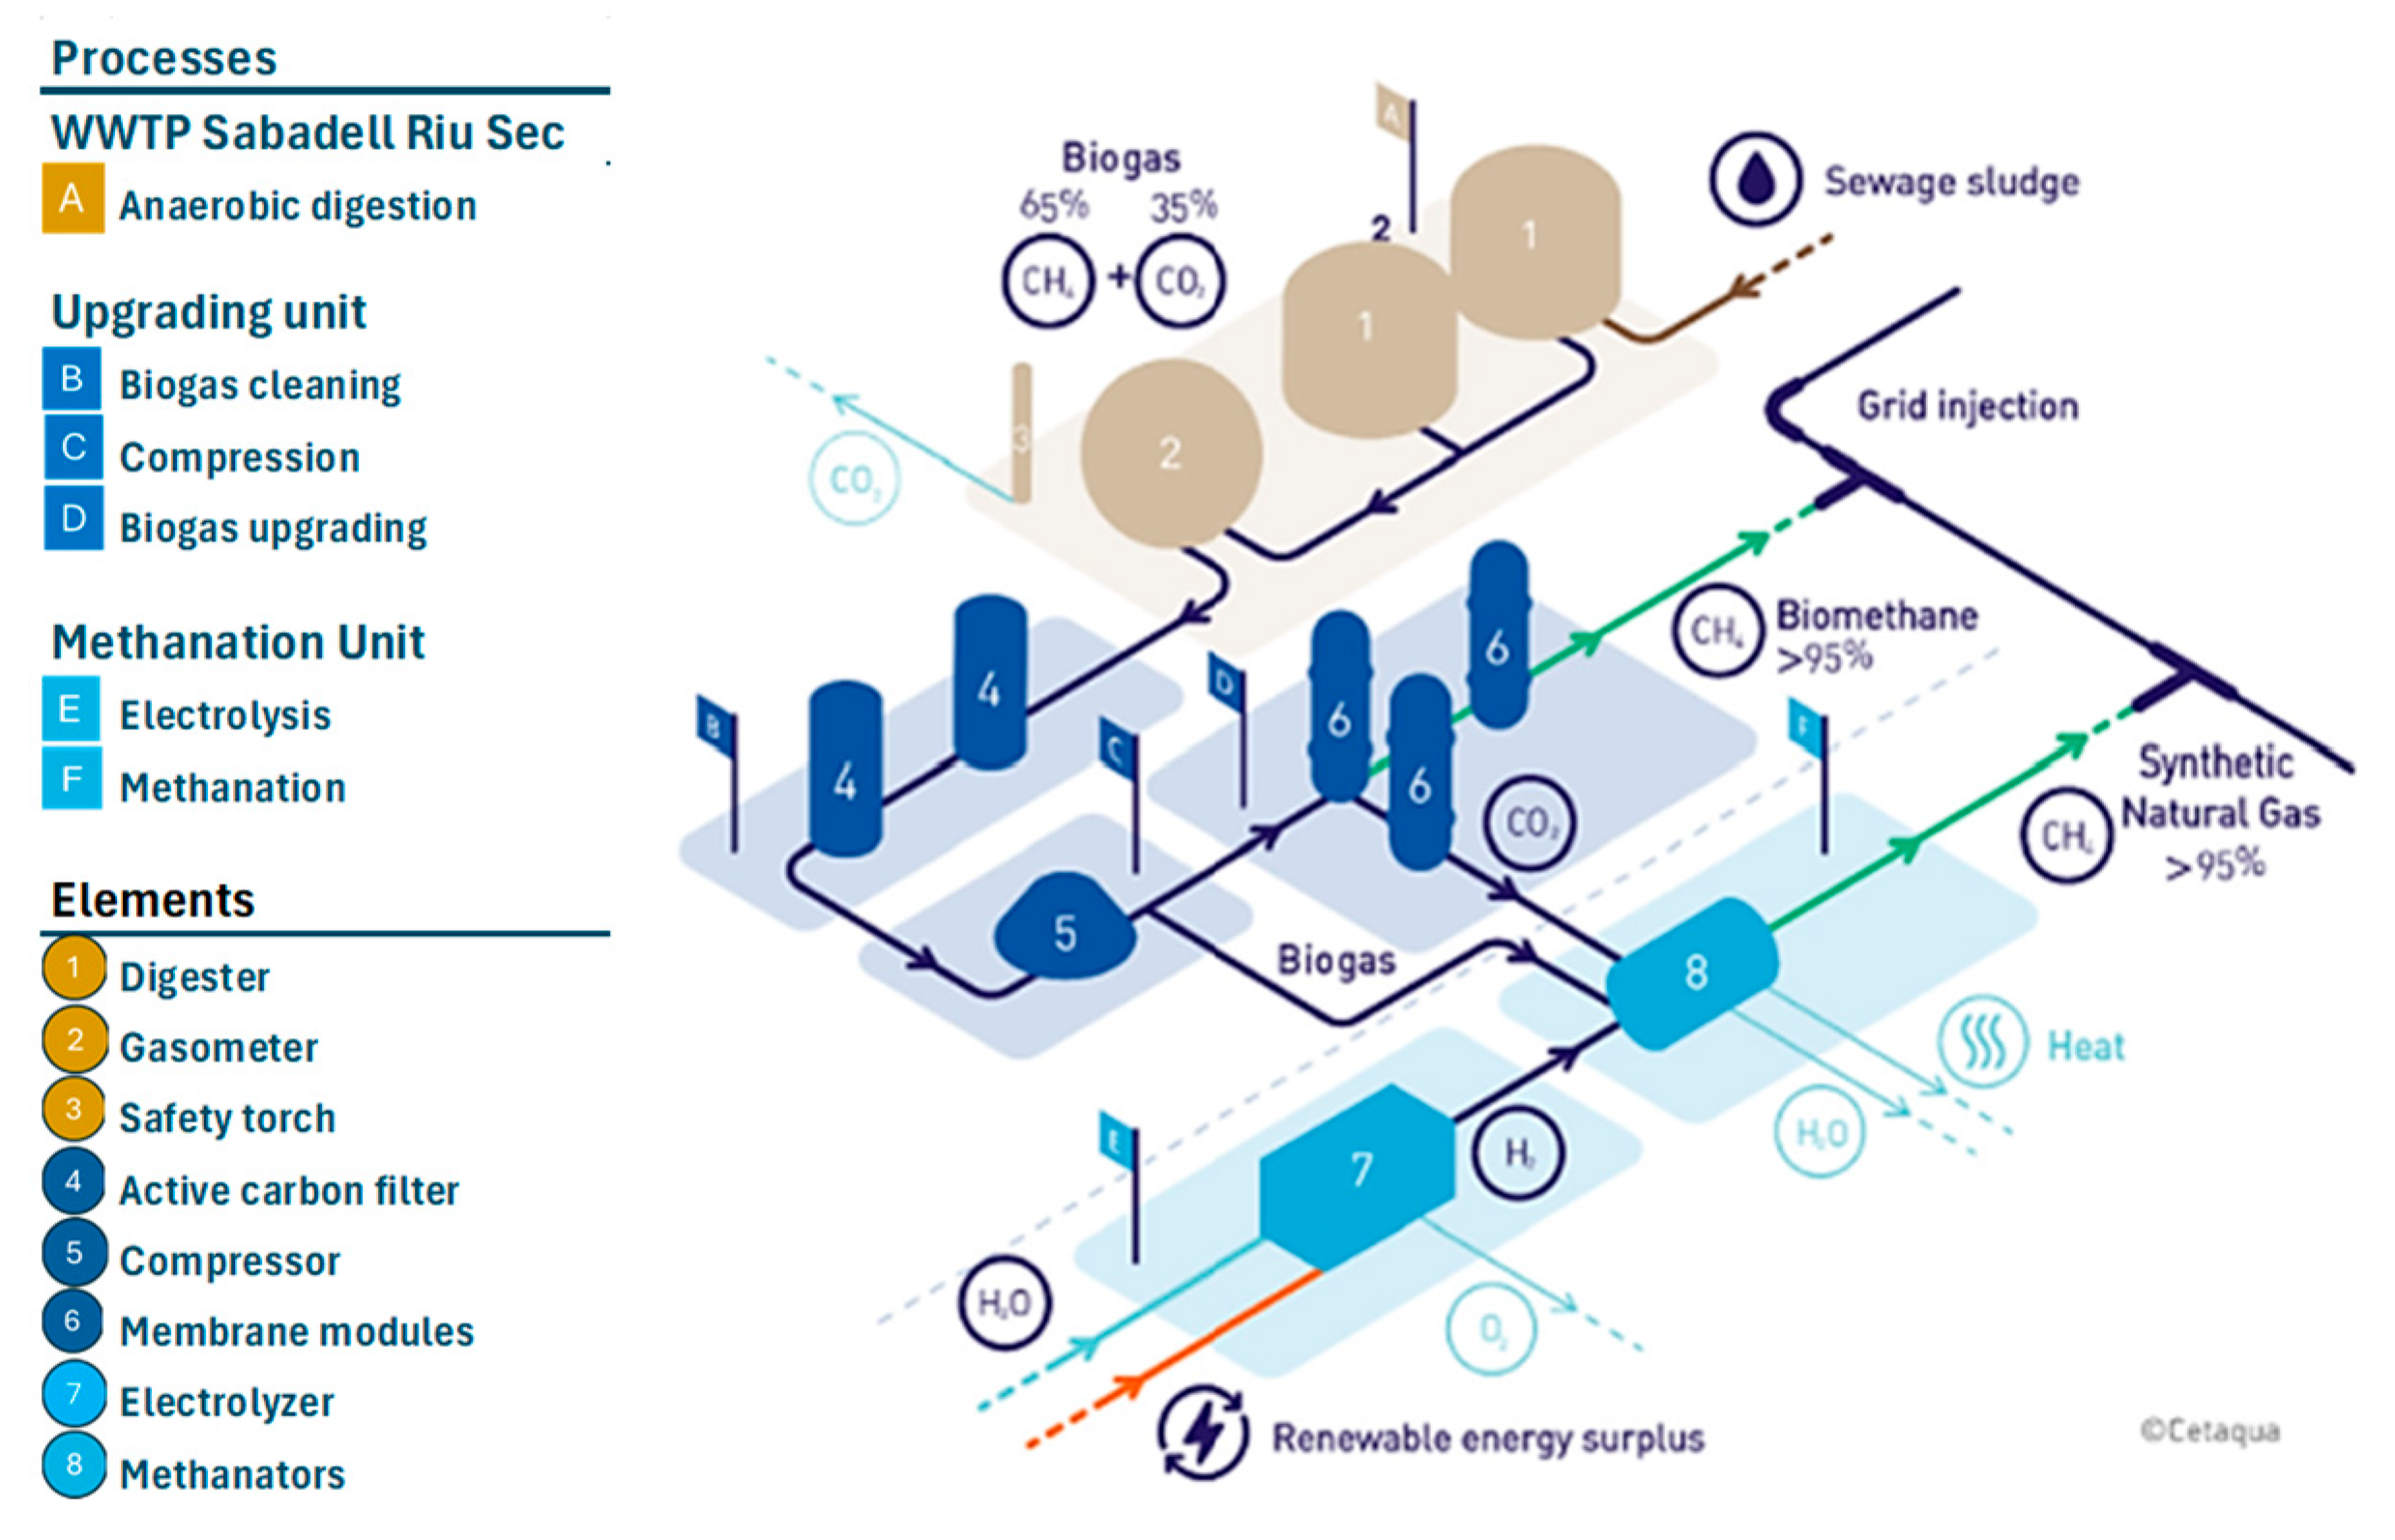
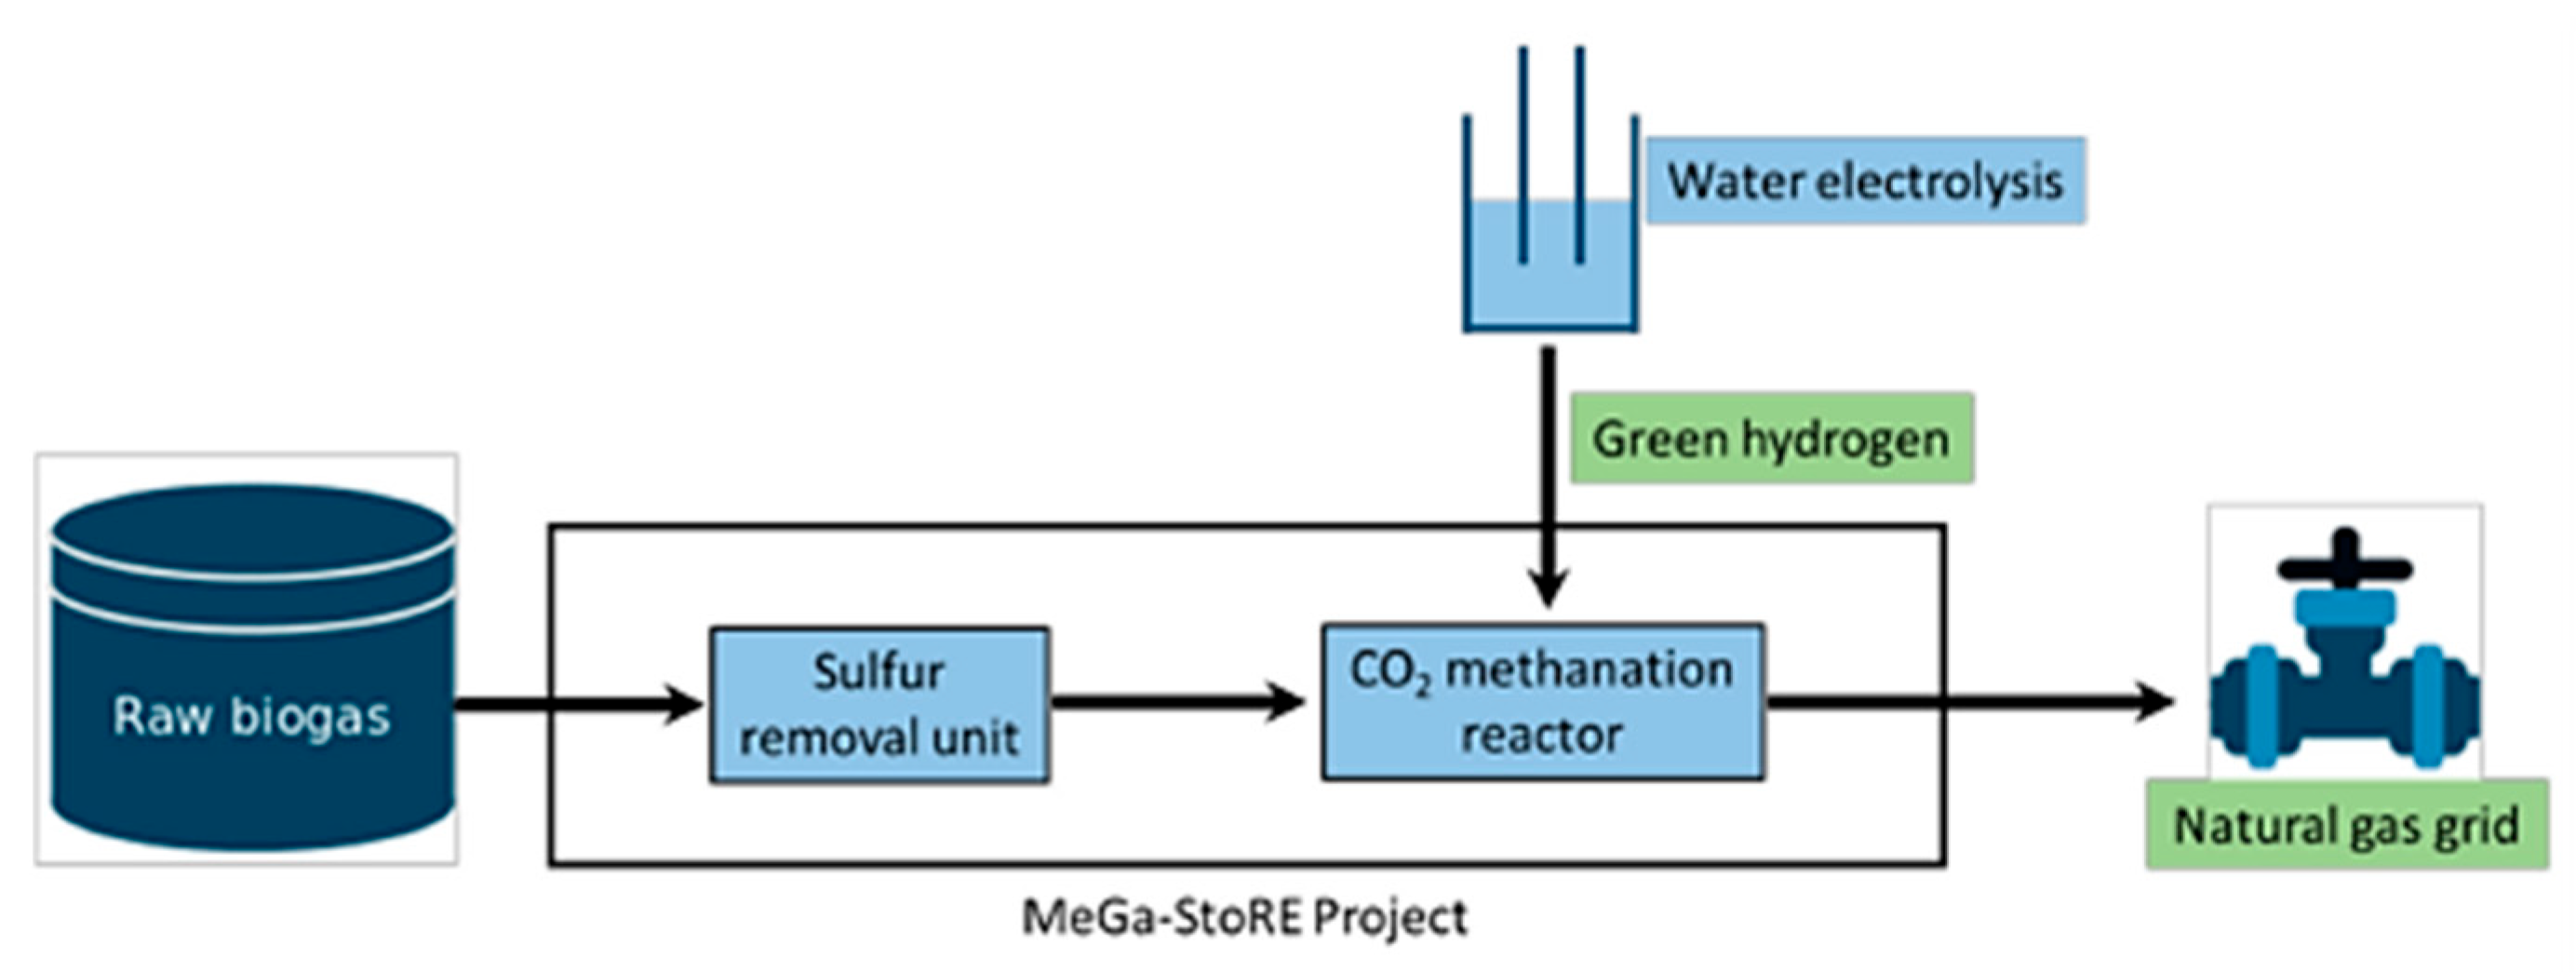
A demonstration project based on a containerised thermal biogas upgrading process with a biogas conversion capacity of 10 Nm3/h is reported [80]. This project was called the Methane Gas for Storage of Renewable Energy (MeGa-StoRE) demonstration project and was located at the NGF Nature Energy biogas plant in Midtfyn, Denmark. The demonstration project utilised AD biogas operating at 8 Nm3/h [80]. The methanation set-up consisted of four reactors placed in series. A coiled tube heat exchanger was employed to either heat or cool the reactant or product gases, respectively [80]. The heat transfer medium was oil with an operating temperature of 370 °C. MeGa-StoRE schematic can be seen in Figure 9.
Hydrogen flow and the thermal control medium were modulated to respond to fluctuations in biogas flow rates, although the H2 to CO2 ratio was kept constant [80]. Process simulation was used to determine the amount of feed biogas required for each reactor as well as the amount of hydrogen required. The feed gas and hydrogen were preheated to 200 °C, and reactor bed temperatures ranged from 300 to 550 °C. The tests demonstrated that stable operation of a few hours could be achieved with >90% conversion of CO2. Some contaminants, such as H2, CO2, and CO, remained in the product gas that would need to be removed before injecting it into the gas grid. Catalyst stability was assessed by post-reaction analysis of the Ni catalyst material. Here, it was observed that Ni was transformed in some instances to Ni2S3, reducing the surface area of the catalyst, although it was reported that the catalyst did not exhibit deactivation during the test period, nor did it display carbon deposits [80].

4.7. Australia Pilot Plant Design and Set-Up

In the Australian context there has been little work conducted to utilise biogas through e-methane activities described in the earlier sections. In 2021, the use of membrane upgrading was employed to separate CH4 out of the biogas for pipeline injection by the Jemena–Sydney Water e-methane grid injection pilot facility at Malabar in New South Wales [35,37,38]. The methane recovery for membrane systems can exceed 96%; however, high-purity gas products require multiple stages [43]. The amount of energy used during membrane upgrading of biogas is 0.25–0.43 kWh/Nm3 of e-methane, with an efficiency of between 82.4 and 98.0% [42]. However, the capital costs of membrane upgrading tend to be high, H2S and moisture removal are required, and the membrane can react with unidentified components in the gas [10,42].

4.8. Summary of Pilot Plant Studies

Pilot-scale studies of biogas methanation processes provide useful insight into methodologies, operating parameters, and challenges. Operating at scale presents complexity and a range of potential difficulties that are not encountered when operating experimentally at bench scale or for short durations. Within this section dedicated to e-methane pilot plant studies, the researchers [67,75,76,77,78,79,80] outline challenges and success outcomes. Table 6 provides operating parameter data relating to pilot scale studies discussed within this section. Some of the challenges associated with biogas methanation include reaction temperature control, catalyst deactivation, product gas purity, yield, as well as process control. Feed gas variability and run time intermittency are also some other challenges encountered. The work presented here provides useful insights into operating parameters and pilot study outcomes.
Strategies used to manage reaction temperature included several approaches. Jacketed reactors were employed in some instances to manage reactor temperature, and most had some sort of cooling and heating mechanism. One pilot facility relied on the boiling point of the temperature control medium at a specific pressure to satisfy the process temperature management requirements [77]. Process control was used in another example with the reactor temperature coordinated with the feed gas composition [80]. This example of temperature management would be crucial in handling feed variability issues. In another instance, a part of the catalyst bed was sacrificed to accommodate an exotherm for the duration of the experiment, acting as a quasi-sacrificial reactor zone [77]. Bubbling fluidised bed was also employed, which is known to demonstrate greater temperature control properties [78]. Product recycling is known to manage the distribution of reactive species across the reactor bed and therefore also enables temperature control [75].
Catalyst deactivation relied on several mitigation strategies. Researchers applied the technique of adding steam to the feed stream to inhibit the production of carbon species on the catalyst surface [75,78]. The removal of contaminated species was required in all instances, with varying success demonstrated [67,75,76,77,78,79,80]. Sulphur removal was targeted with many methods of removal; usually catalyst and adsorbent-type materials were used. The removal of other contaminants encountered was achieved with the use of activated carbon. Methanation catalyst selection with properties associated with contaminant tolerance was also used in some instances, endeavouring to evade catalyst deactivation.
Product gas composition was an important criterion, mainly due to the necessity to meet municipal gas infrastructure specifications. Residual hydrogen was of concern in earlier days; however, its presence can now be an advantage with more community acceptance for H2 pipeline injection where low volumes of H2 are accepted. Carbon dioxide should be constrained; recycling the unconsumed CO2 back to the feed stream is often adopted. Carbon monoxide, on the other hand, presents a problem, as there are difficulties separating CO via membrane separation [79].
Other requirements for producing at scale in P2G environments are managing the intermittency of renewable power and its impact on startup and shutdown. This was addressed in one example by the provision of a H2 buffer tank enabling the continuous operation even whilst the renewable power driving the electrolysers was potentially not available [75].
Other researchers investigated the reaction response to change in load and start-up and shut-down with a focus on catalyst stability and time to steady-state operating conditions [75,77]. Generally, reactors in standby mode had to be maintained at temperature and under reduced conditions to be effectively restarted [75]. Biogas methanation plants must integrate into existing infrastructure and have access to feedstocks such as biogas and renewable H2. The plant must be located close to the power grid and gas transmission or distribution networks for injection of e-methane into the gas grid. Alternatively, e-methane plants are an ideal fit for the concept of an energy island, where off-grid renewable energy and locally sourced biogas could be used to synthesis e-methane for freighted distribution or export in the absence of proximity to the gas grid.
Pilot plant studies are an important step in the development of technology readiness and are used to address mid-level technology readiness level (TRL). When developing complex industrial applications, such as biogas methanation, the development of processes that go beyond simulated laboratory-scale tests are critical in developing an understanding of industrial integrated systems readiness.

5. TEA Status for Biogas Methanation

Techno-economic analysis (TEA) provides an understanding of the probable costs, profitability, energy consumption, and material flows of a project prior to commencement. This capability can also be used to assess the continued feasibility of a project already in operation. One of the most powerful utilities of TEA is the ability to consider fluctuations in cost variables and material availability, which allows for sensitivity considerations relative to different parts of a system and how significant the impact may be.

5.1. TEA Status for Biogas Catalytic Methanation

Although biogas methanation is not a new area of research on its own, studies at scale with detailed techno-economic assessment in comparison to other e-methane production technologies are limited. A systematic search of Scopus revealed only 9 articles and one review that were aligned to TEA studies of biogas methanation. Commonly, within these articles, the methanation of biogas required either multiple methanation steps or an upgrading step before e-methane export [81,82,83,84,85,86,87,88]. While it is expected that Concentrated CO2 Methanation (CCM) systems (Figure 5), like those shown by Ghafoori et al. [23], Kirchbacher et al. [83], and Walker et al. [87], would be capable of reducing the concentration of CO2, enabling the final product gas stream to meet local gas pipeline standards in order to be injected into the pipeline. Australia’s gas pipelines have a set tolerance of 7% maximum for the impurity gas CO2 [49]. This means post-methanation processes may be needed to further purify the product gas before injection, which will lead to added costs.
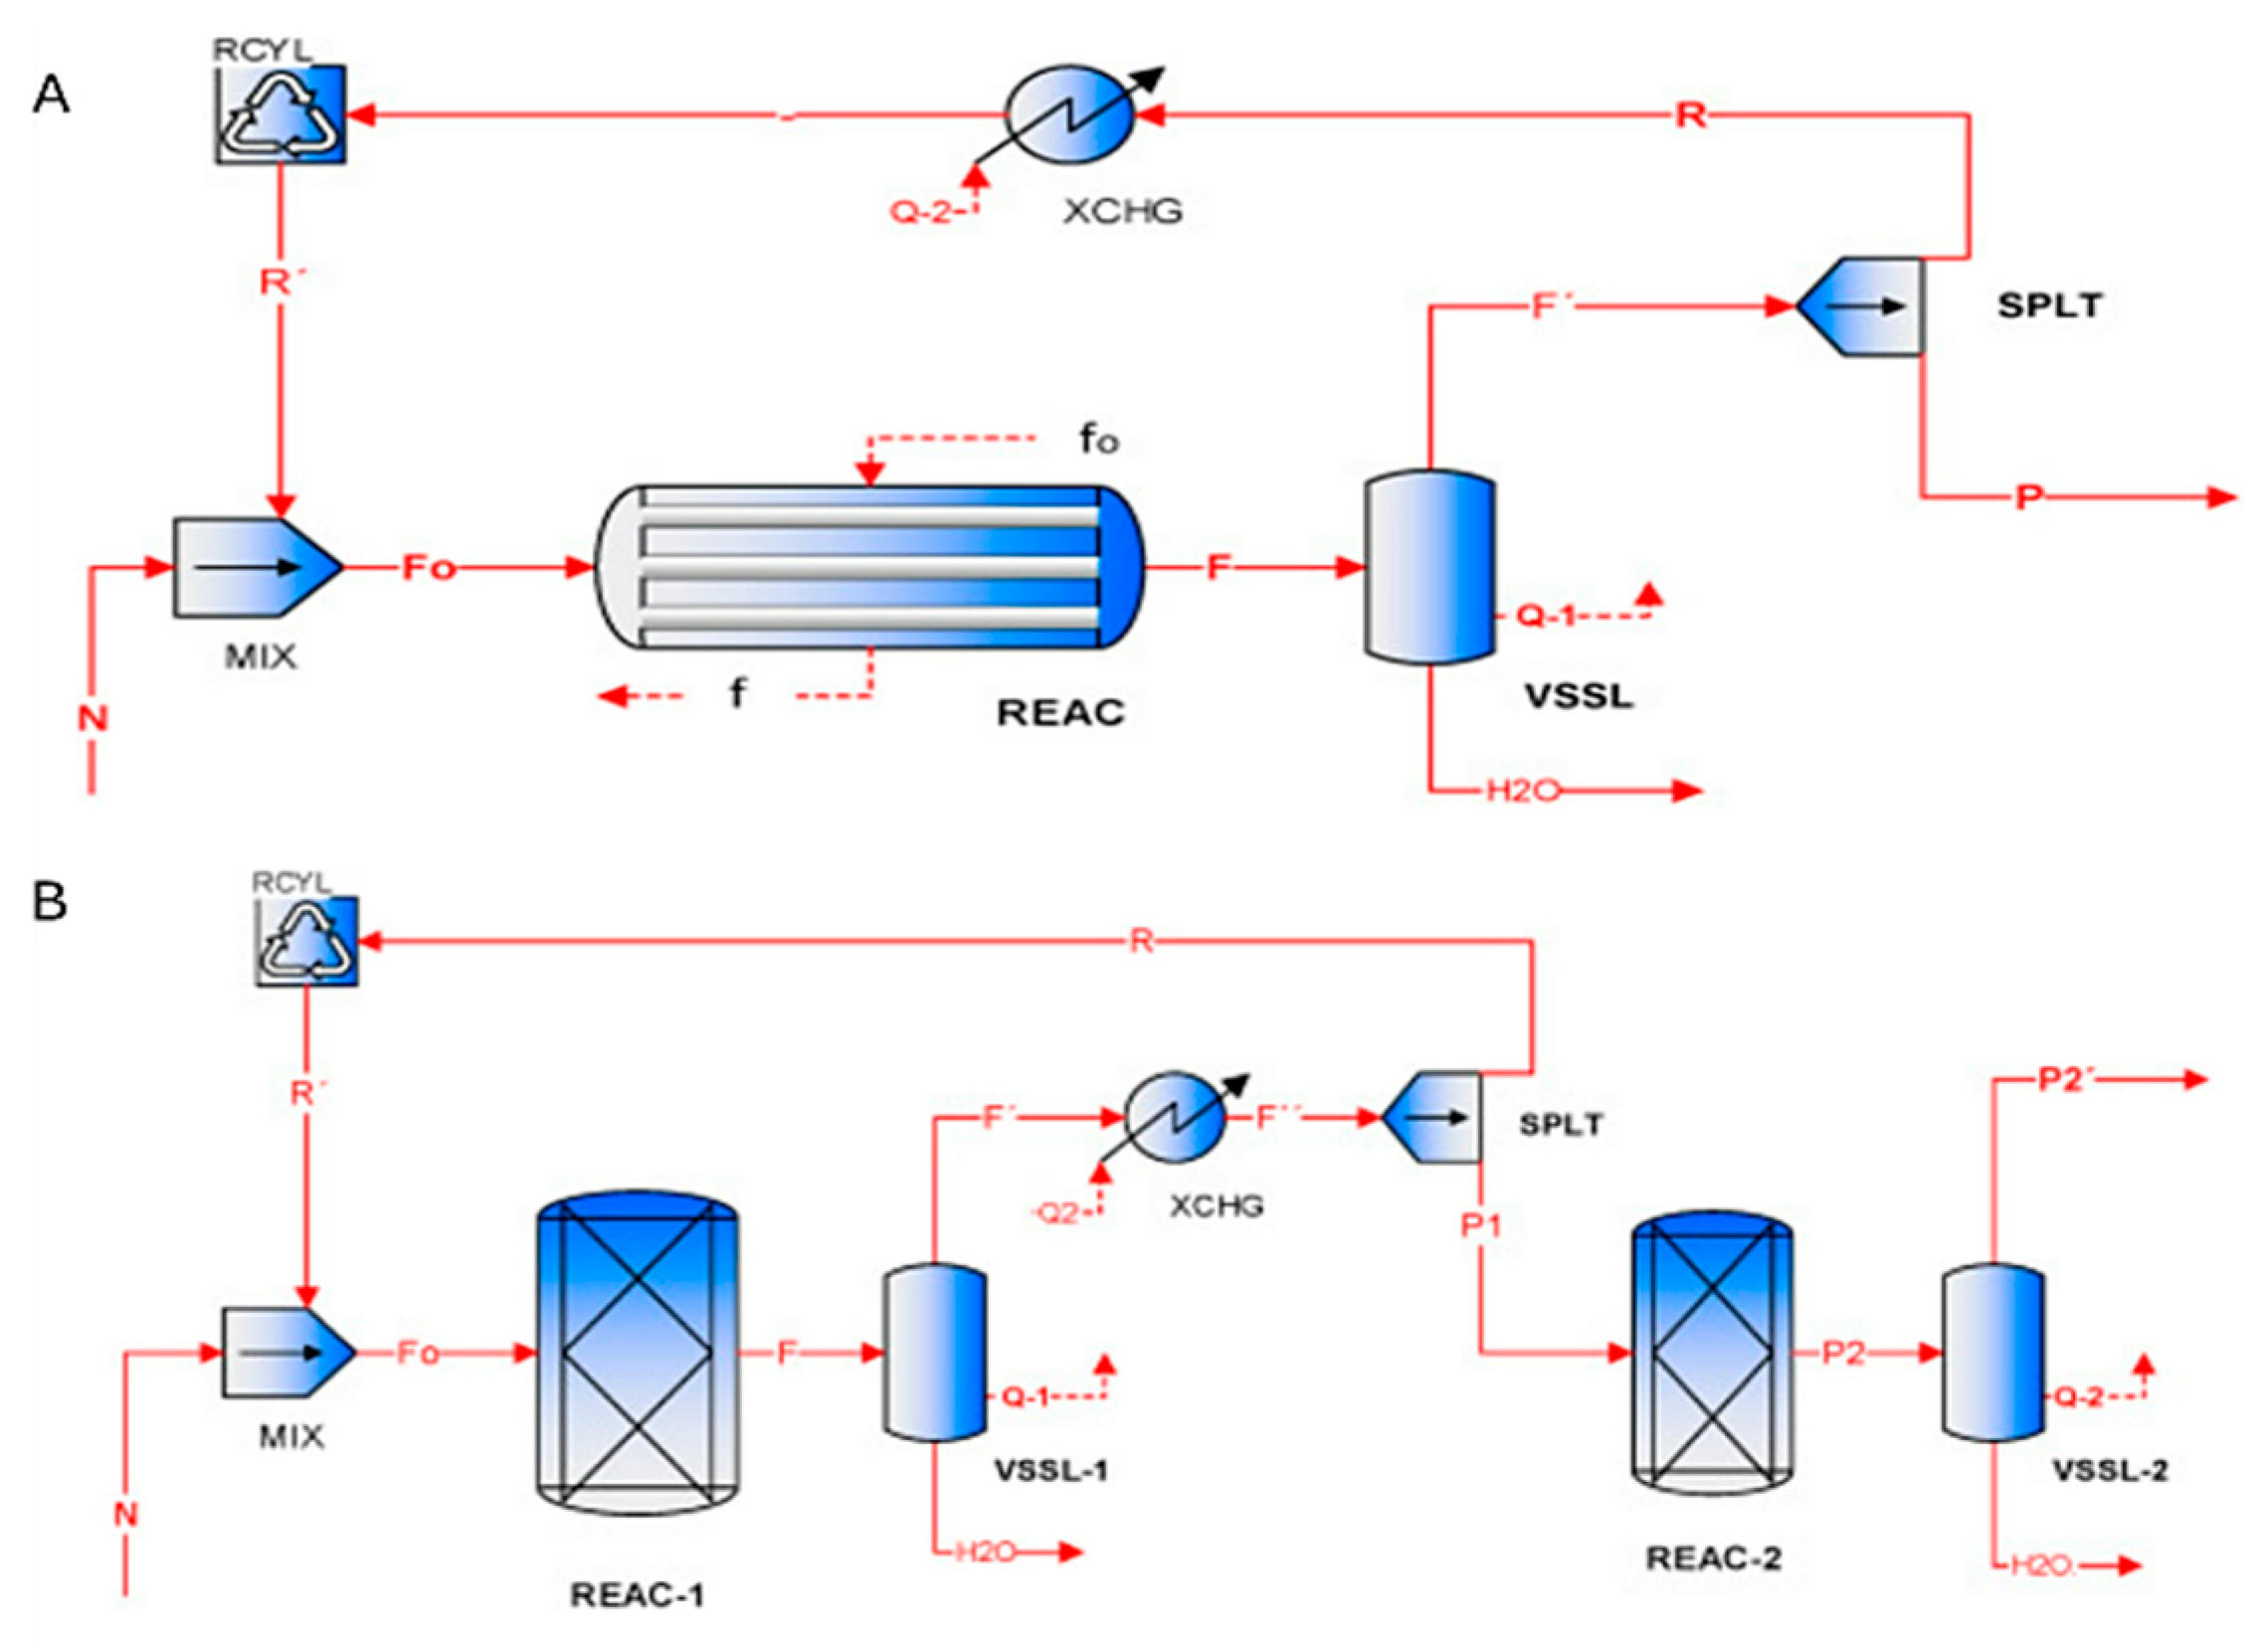
Gutiérrez-Martín et al. [82] compared the potential of direct biogas methanation with gas recycling for a tubular methanation reactor and a two-phase adiabatic bed methanation system. Both systems were analysed assuming ideal biogas compositions of only CH4 and CO2. The production cost for e-methane from the tubular methanation system (Figure 10A) was EUR 13.72/GJ, and for the two-stage adiabatic methanation system (Figure 10B) it was EUR 14.74/GJ. Based on the findings, both systems were stated to have the potential to theoretically produce 90% CH4.
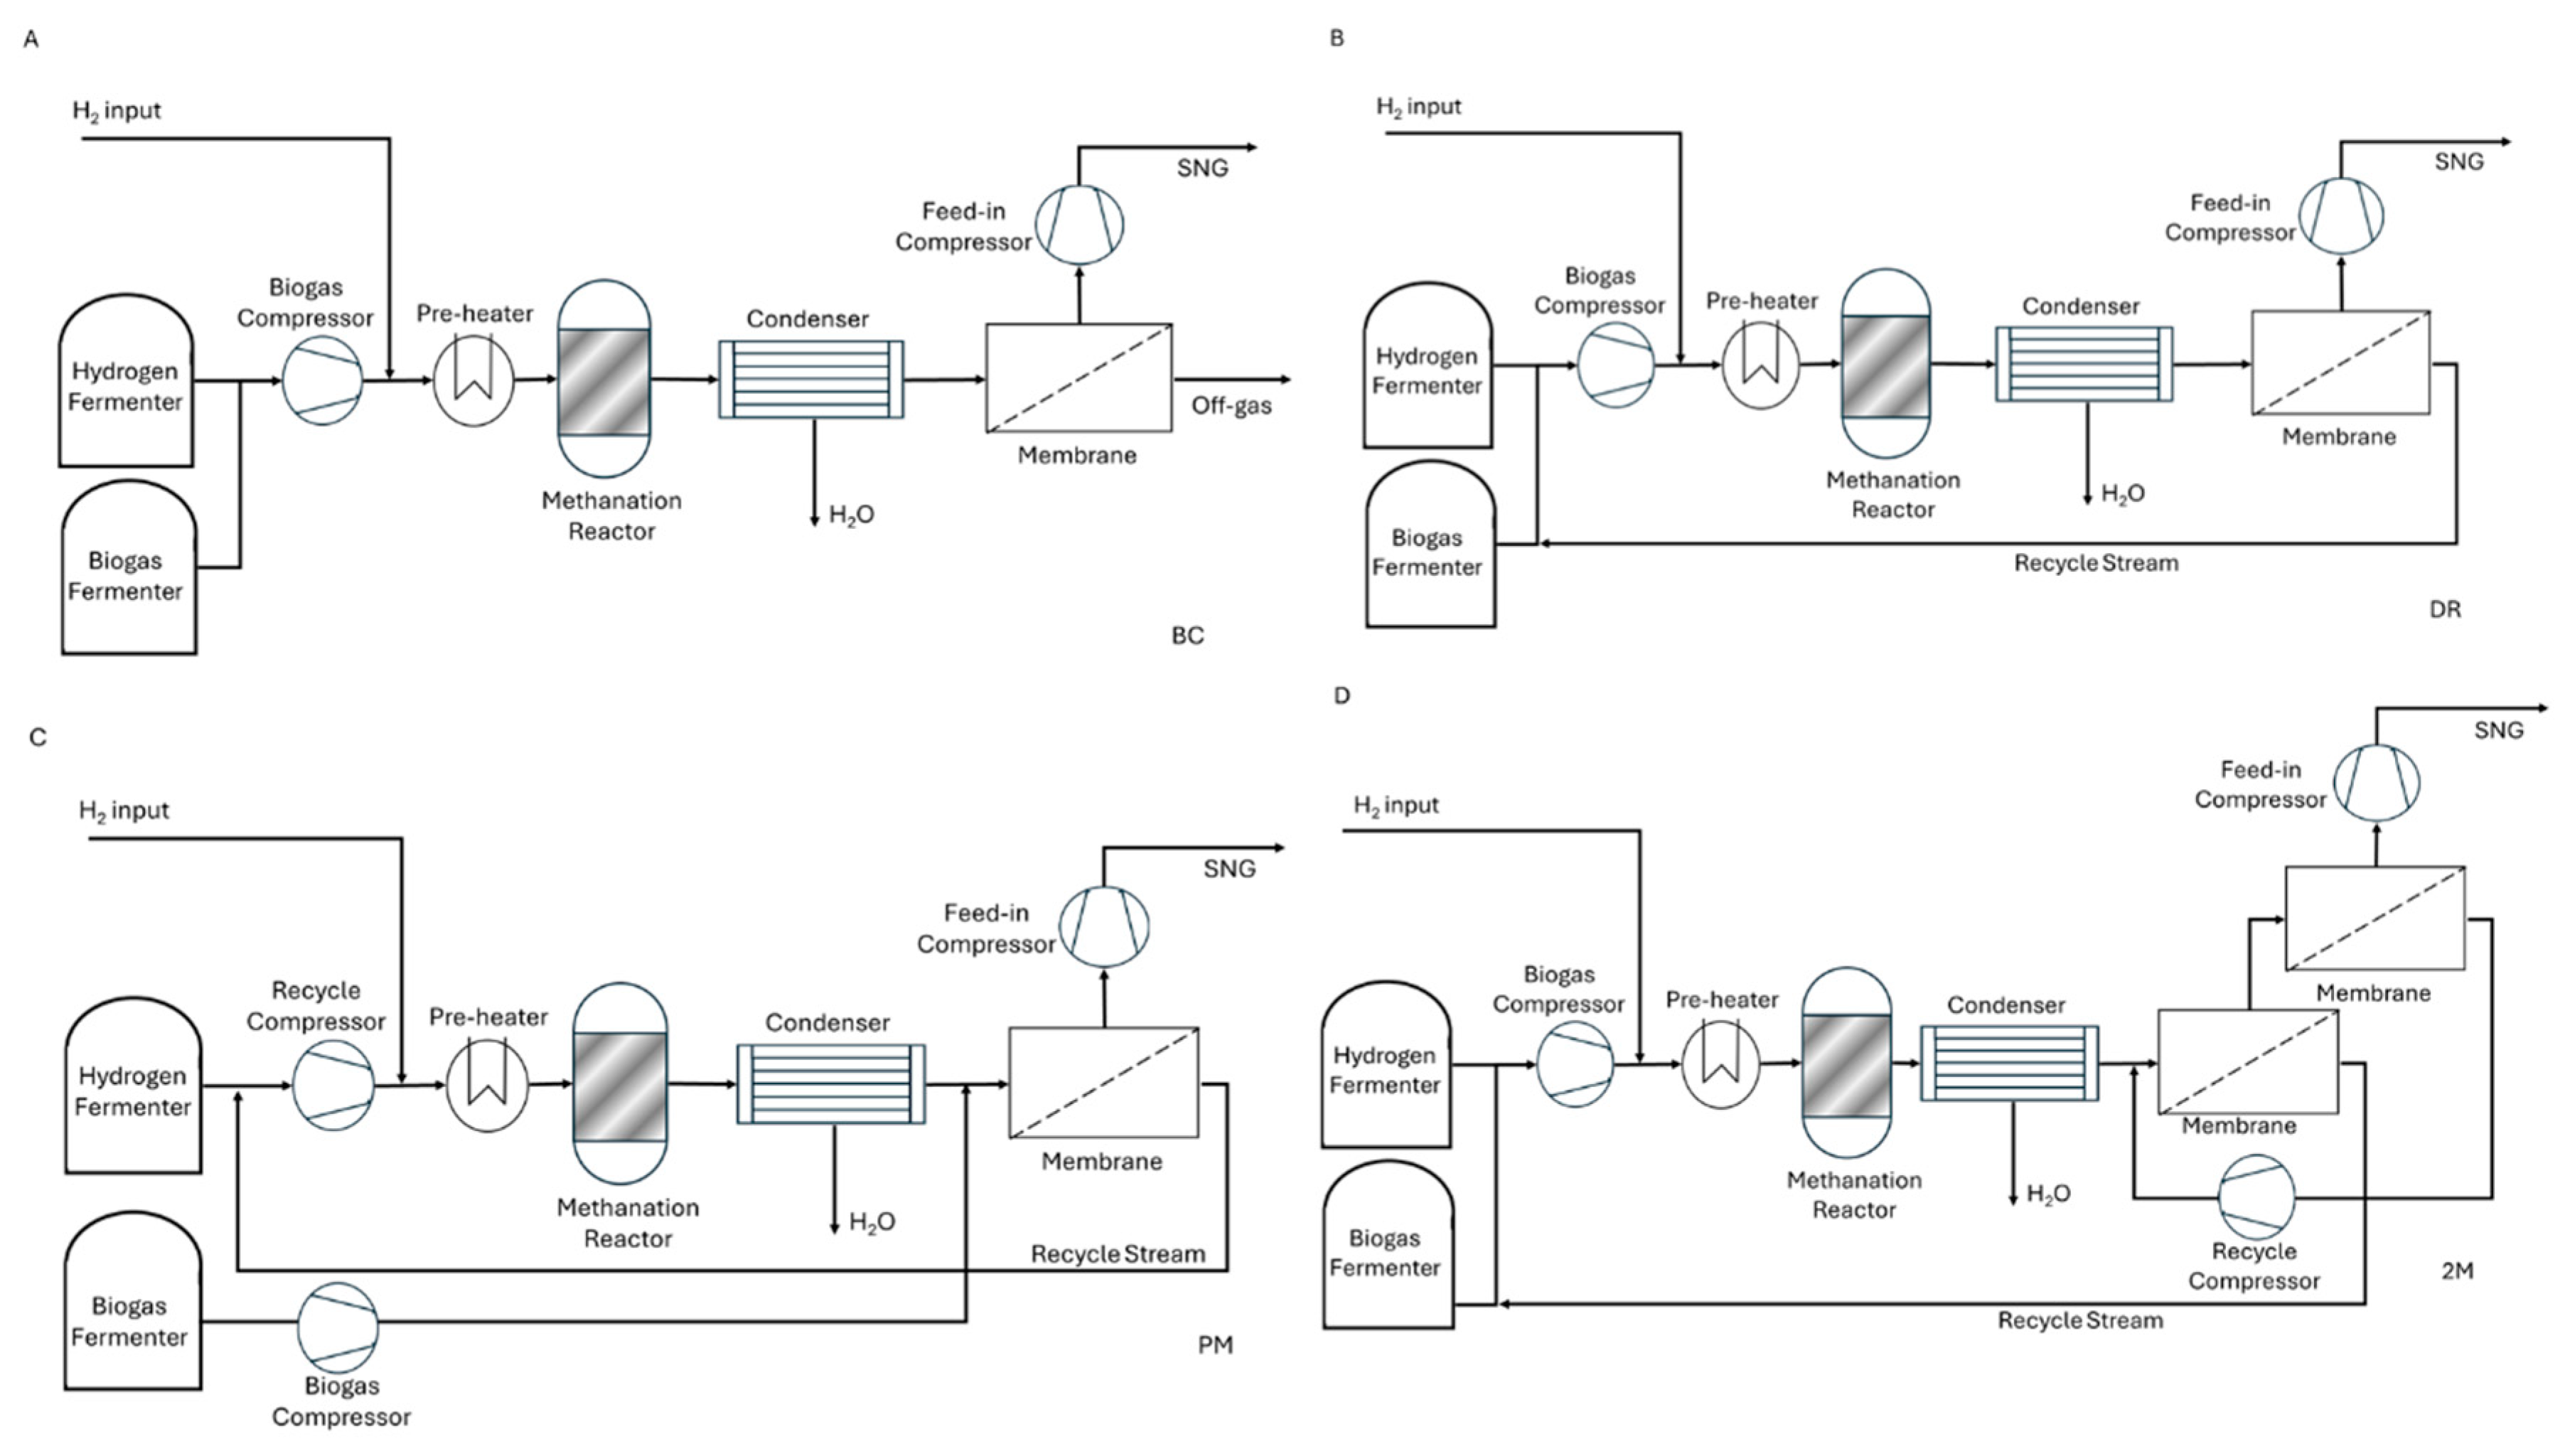
Kirchbacher et al. [83] compared four simulated systems for biogas methanation and upgrading, with hydrogen supplied from dark fermentation. Dark fermentation is used to produce hydrogen from carbohydrate-rich materials in the absence of light and oxygen [89]. In the work, three systems are compared. The base system (Figure 11A) was the direct methanation of biogas and hydrogen (produced by fermentation) with post-methanation upgrading. The second (Figure 11B) and third (Figure 11C) systems included gas recycling to increase the CO2 conversion, while they had a different design for where the biogas entered the system. The fourth system utilised a post-methanation two-stage membrane upgrading step and recycling system to further increase the methane concentration in the final product (Figure 11D).
While the economic benefits of two-stage fermentation were presented with potential savings for both e-methane (3–5%) and biohydrogen (21%), the biohydrogen saving potential was significantly higher. The location of the system turned out to have a significant impact on the cost required as well. In this work, the base case demonstrated in Sweden was the most cost prohibitive. The cost of production with the optimised systems for each location was between EUR 31.54 and 37.55/GJ. Special note was made that increased flow rate of gases through the methanation unit led to increased methanation costs.
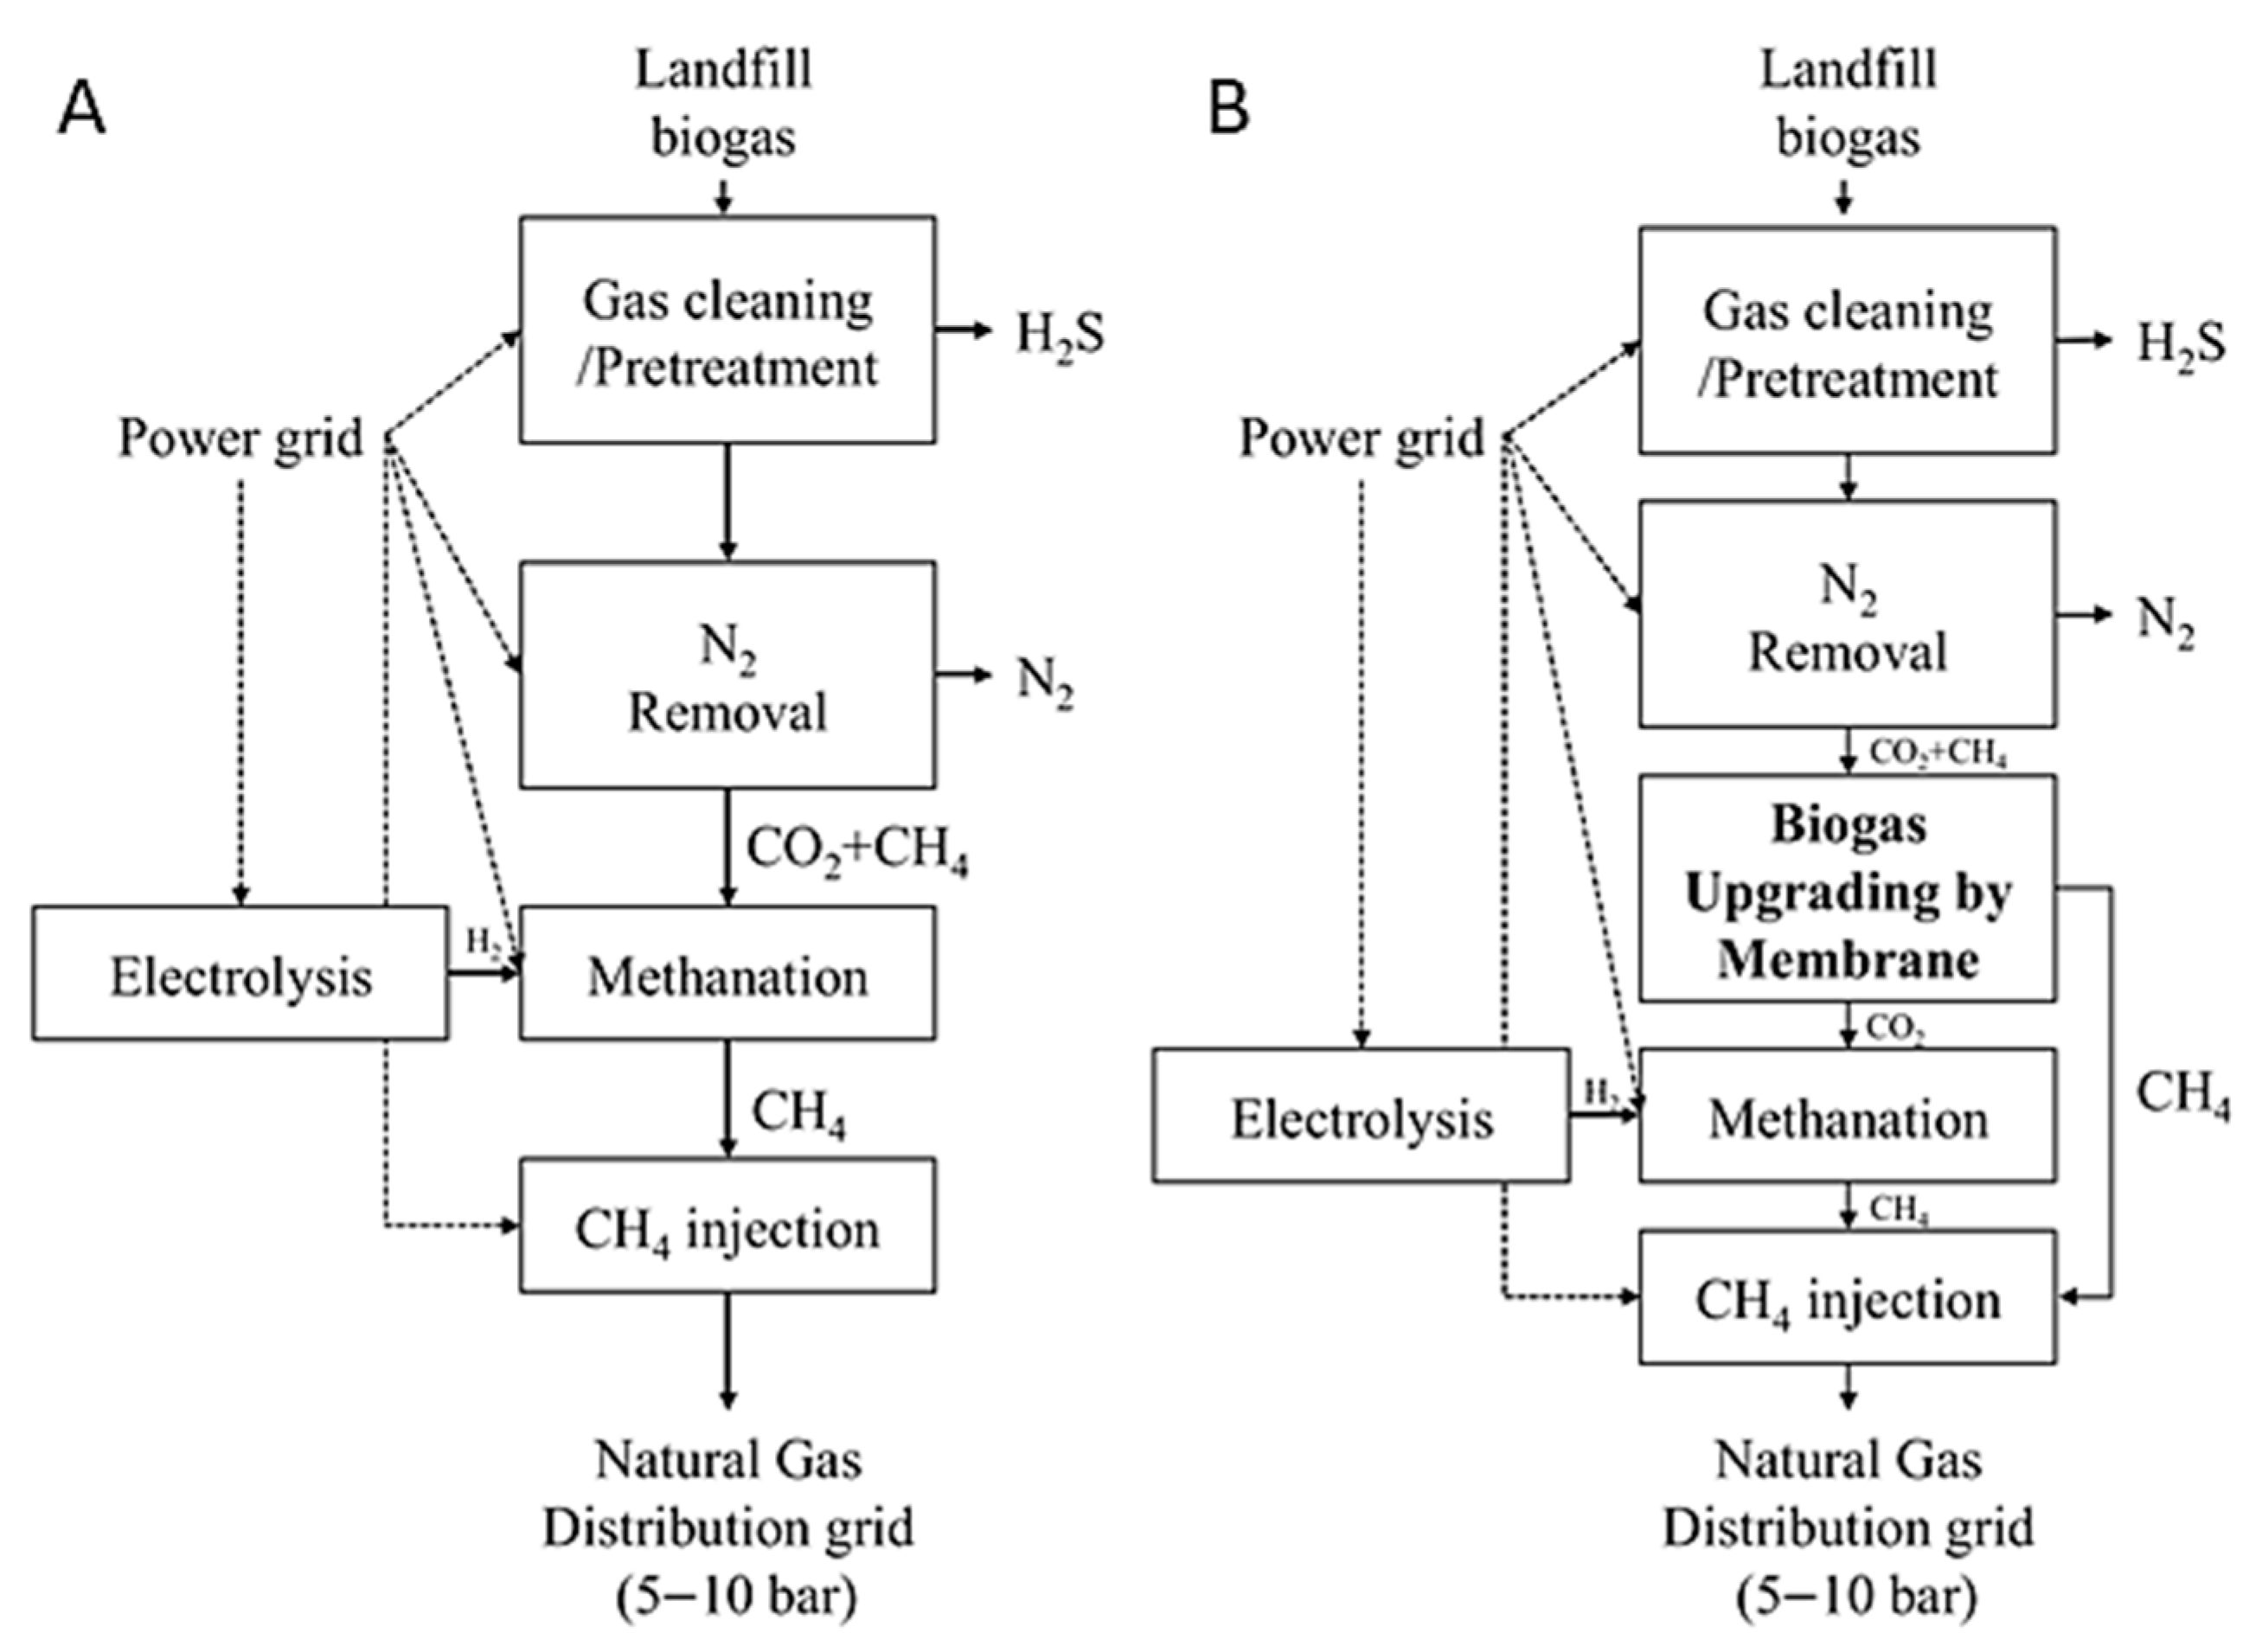
Ghafoori et al. [23] compared scenarios relating to direct methanation and methanation (Figure 12A) combined with prior membrane upgrading (Figure 12B) to separate the methane first from the landfill biogas. The 500 Nm3/h biogas underwent sulphur and particulate removal using activated carbon (AC) and then PSA for N2 removal. The estimated composition of the raw biogas was 20% N2, 45% CH4, and 35% CO2. Once the N2 was removed, the methanation and upgrading processes were modelled. The direct methanation process was stated to produce 92.4 TJ of CH4 annually, while the membrane separation and methanation had a production capacity of 115.5 TJ of CH4 annually. The methanation systems were expected to have higher expenses than revenue with the given conditions of the study. The cost of production increases significantly with the price of electricity. When the electricity price was increased from 60 to 120 EUR/MWh, the production price of the e-methane from direct methanation increased from 21.67 to 36.39 EUR/GJ, and for CCM the price increased from 25.56 to 41.67 EUR/GJ.
The sensitivity of the e-methane production price was largely attributable to the electrolysis system. The electrolyser contributed more than 75% of the cost of methane production in the biogas methanation process, which provides a huge capacity for the price to come down as the sensitivity of electrolysis is highly reliant on the price of the electricity, which may vary by region, by country, and by the technology maturity as well.
Skorek-Osikowska et al. [86] modelled a biogas methanation system. The biogas was produced in a manure anaerobic digester, the hydrogen was produced from wind-powered electrolysis, and the methanation unit was designed to be like a commercially available system with three adiabatic reactors set at a temperature of 200 °C and 10 bar of pressure. The capital expenditure (CAPEX) for the biogas methanation system was EUR 3,382,710, and the operating expenditure (OPEX) was EUR 690,279 annually. The production price of the CH4 was USD 32.48 EUR/GJ.
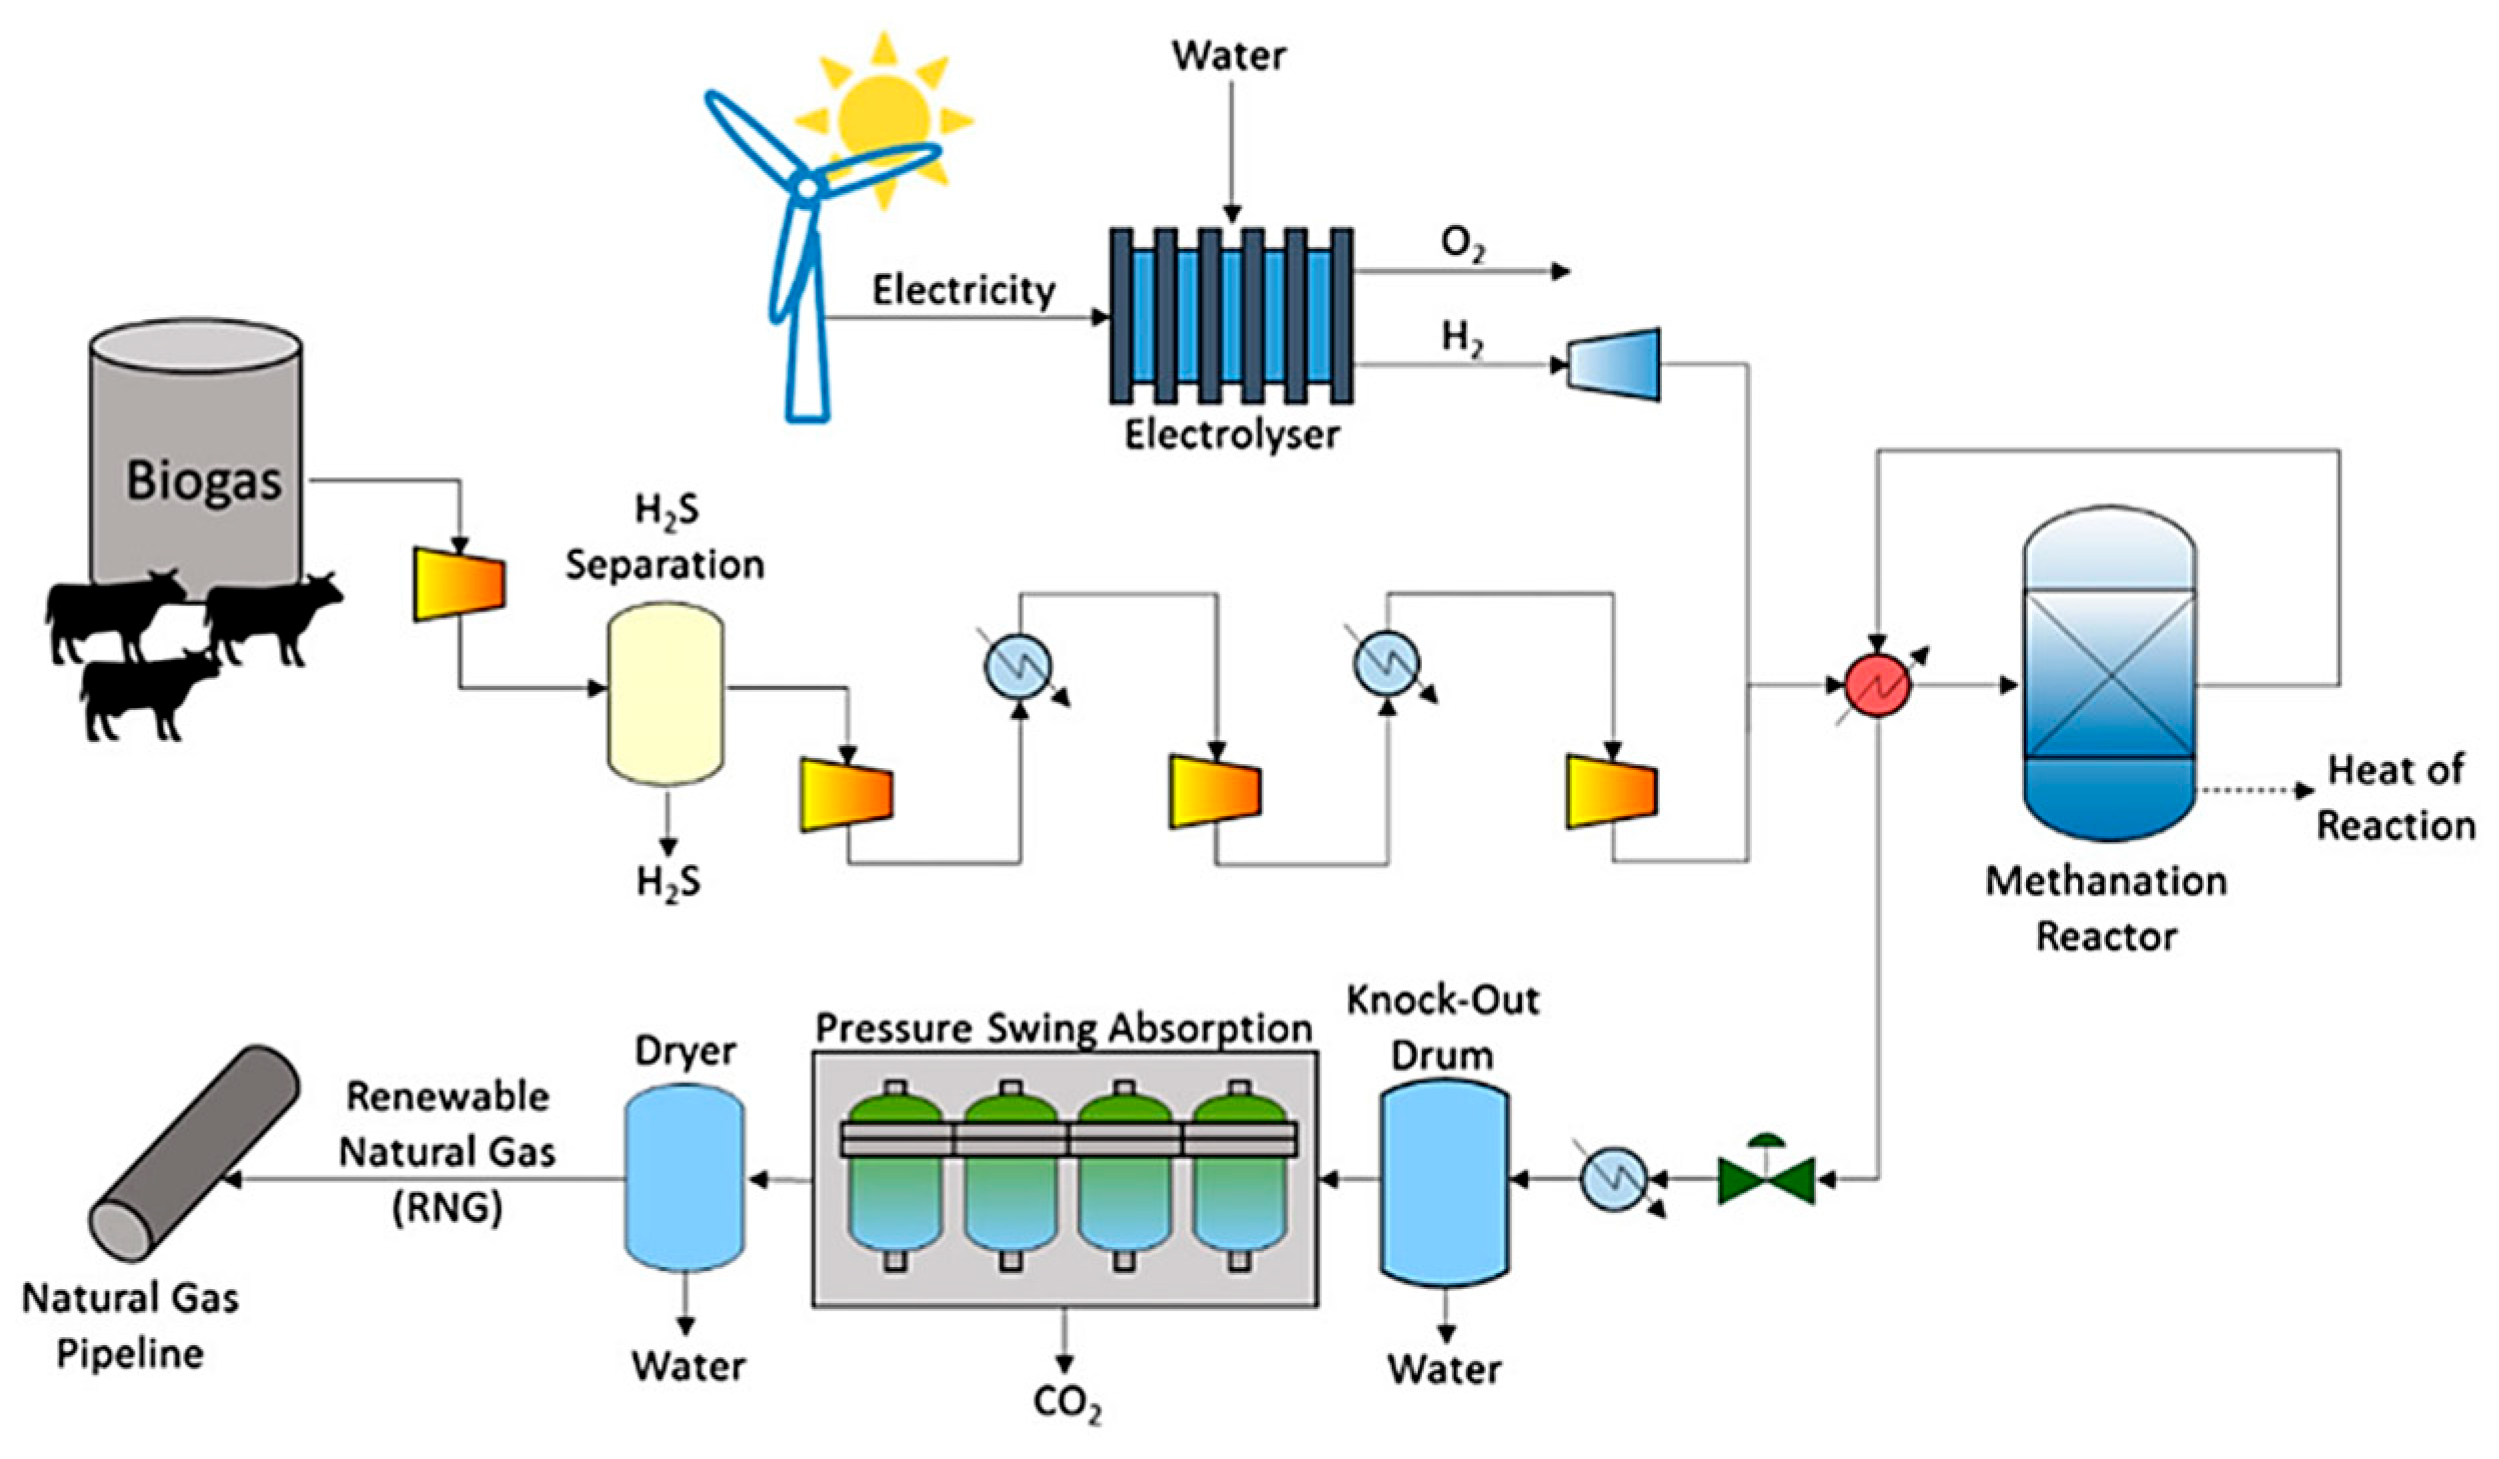
Walker et al. [87] performed a case study TEA of a manure biogas methanation system. The study assumed that each of the 2000 dairy cows would produce 50 kg of manure daily, for approximately 2300 Nm3 of biogas per day. The biogas methanation system (Figure 13) utilised renewable hydrogen from electrolysis, biogas after desulphurisation and compression, and then catalytic methanation at 350 °C and 20 bar. PSA was employed to upgrade the product gas to achieve grid quality CH4.
The subsidised sale price of the CH4 given by Walker et al. was 40 USD/GJ. The biogas methanation system had a reported CAPEX of USD 5,190,000 and an OPEX of USD 693,377 USD annually. The payback period of the system was estimated to be approximately 4.5 years.
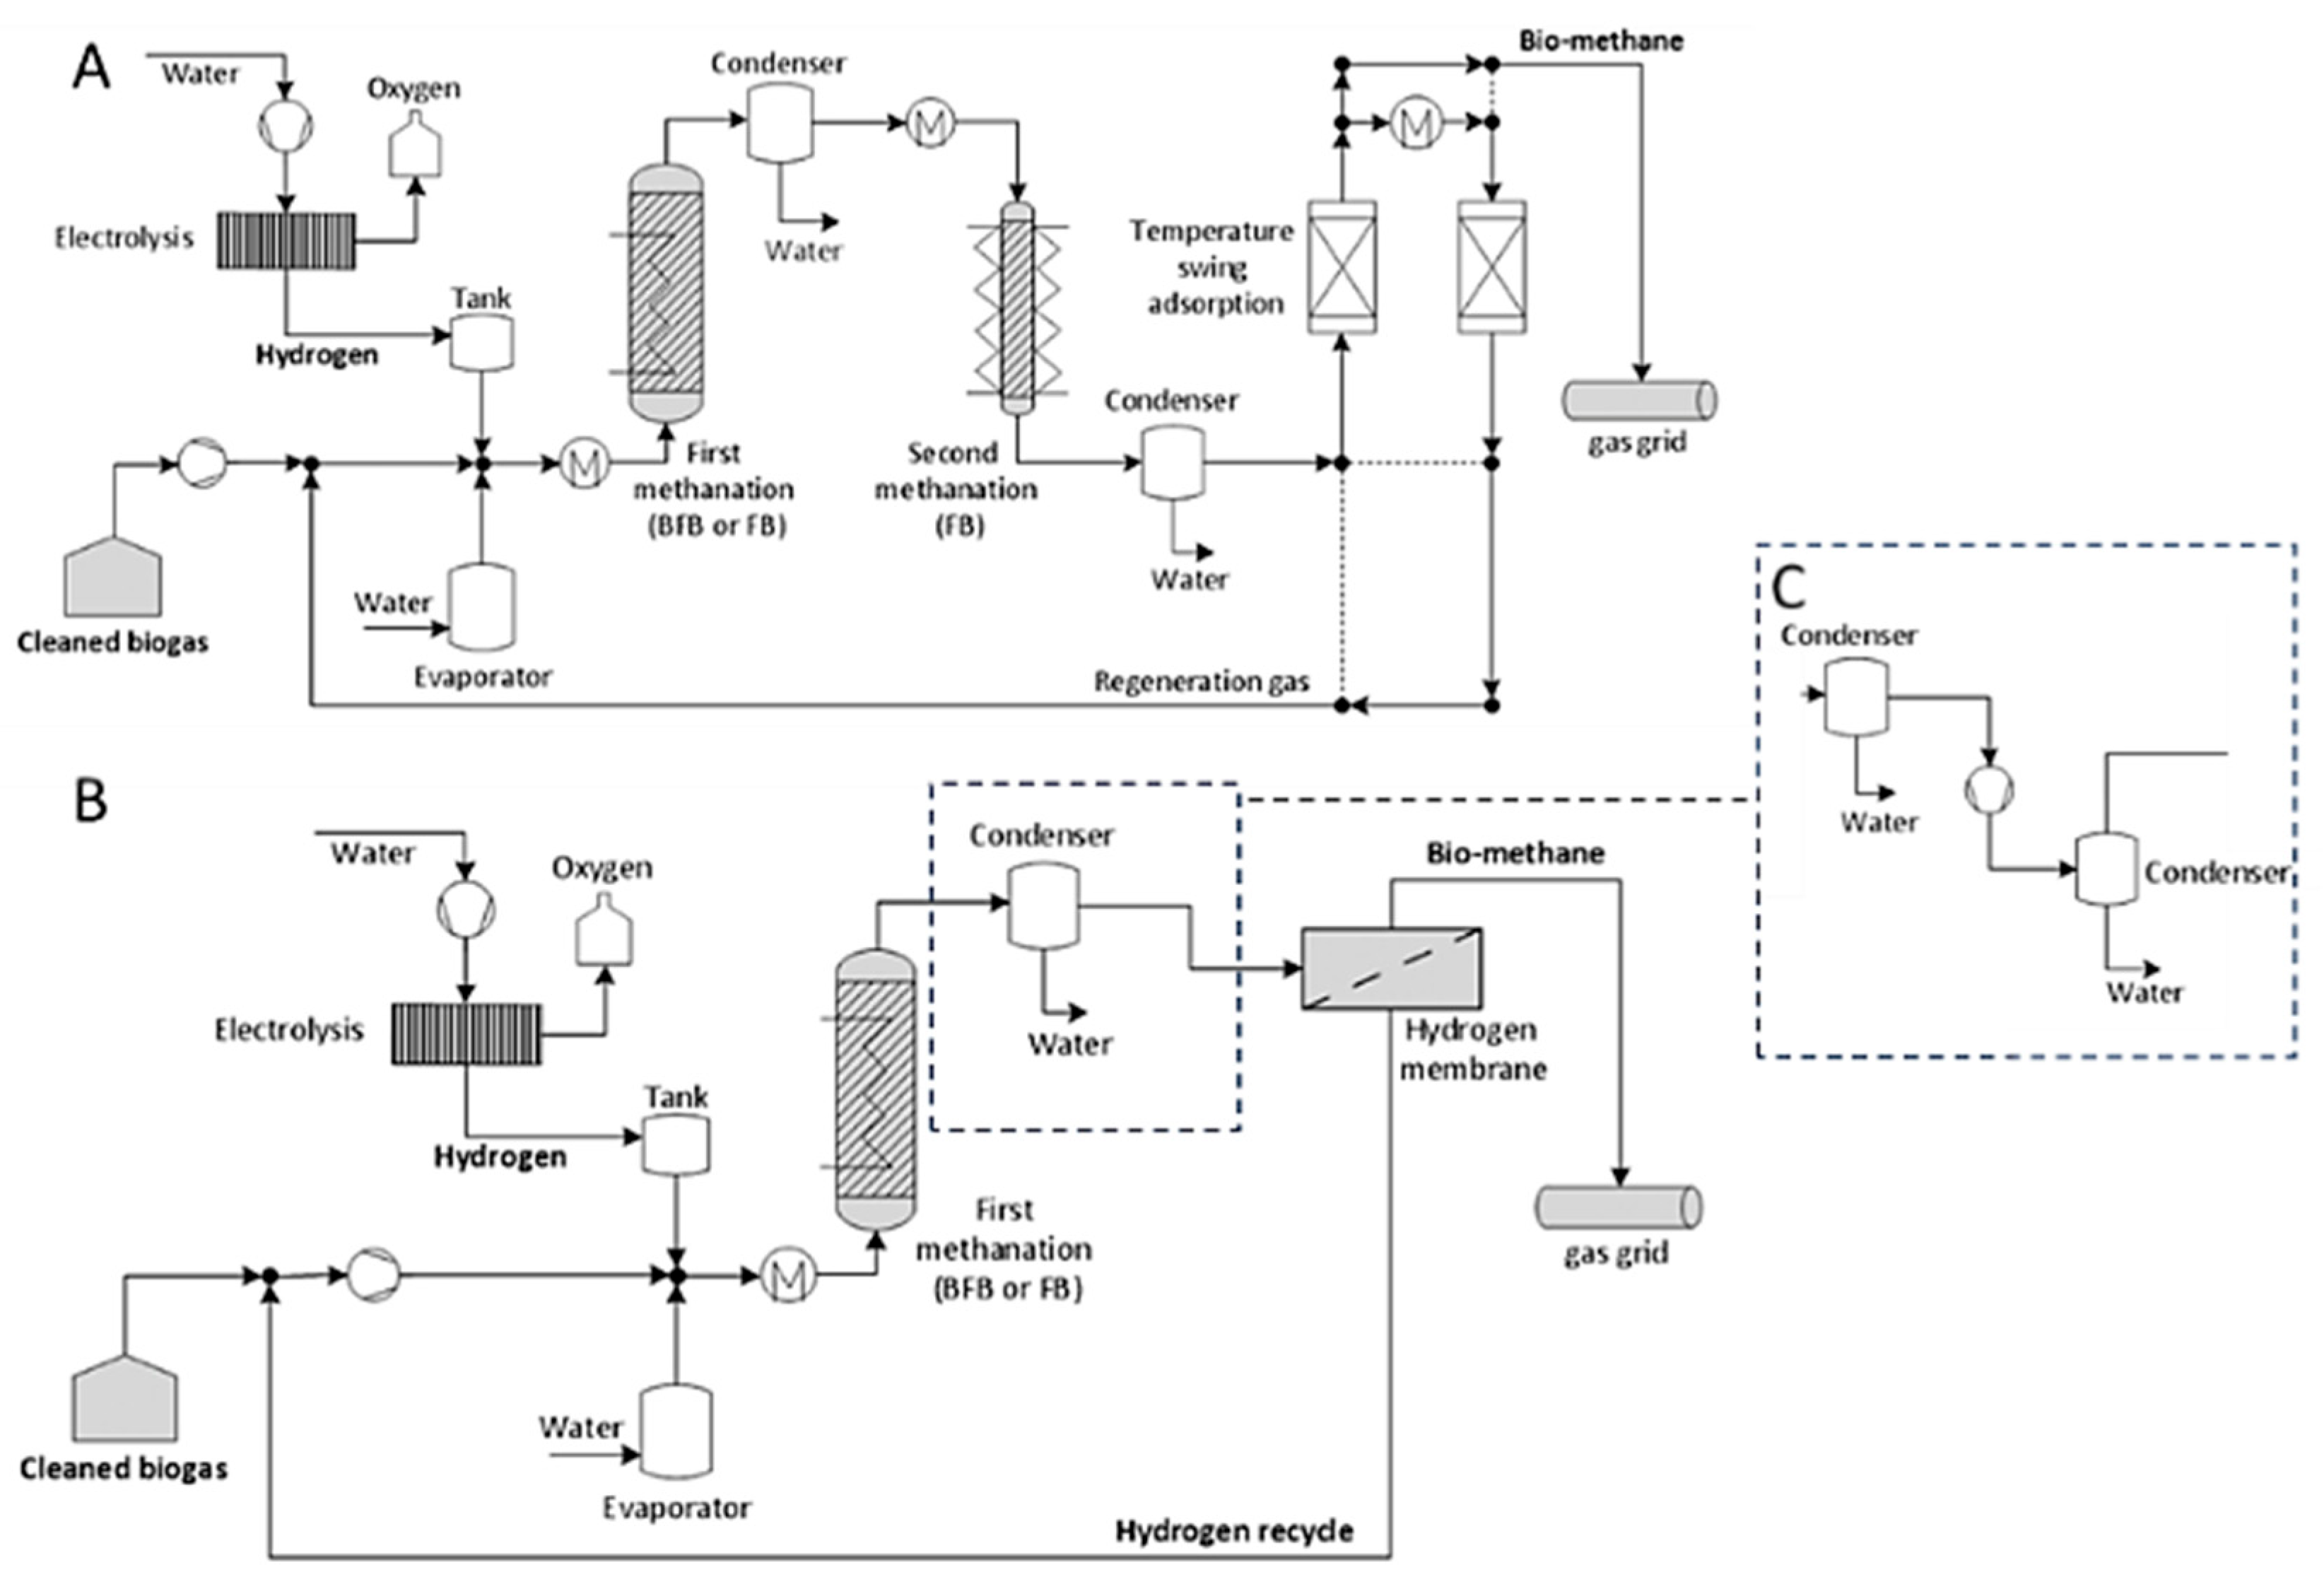
Witte et al. [88] performed a series of comparative TEAs for biogas methanation, utilising fixed bed (FB) and bubbling fluidised bed (BFB) methanation reactors. The methanation systems had three generalised designs: double methanation reactors (Figure 14A), one methanation column with one stage drying and post-reaction membrane upgrading (Figure 14B), and one methanation column with two-stage post-reaction condensers (Figure 14C) and post-reaction membrane upgrading. The types of membranes explored were poly (p-phenylene oxide) (PPO), a commercially available membrane called Matrimid, and a hypothetical combination of the two referred to as Matr-PPO.
The simulated biogas had initial conditions of 200 NM3/h, 55%vol CH4, and 45%vol CO2. The above processes were able to produce grid-quality gas without further intervention. All methanation systems delivered a concentrated CH4 gas stream, exceeding 96%vol, with the BFB-FB methanation system having the highest CH4 (97.86%vol) concentration and the BFB-theoretical membrane having the lowest (96.41%vol). The cheapest methanation and membrane systems to operate were the BFB methanation systems, with a production cost approximately half of the FB methanation system. This cost benefit comes at the expense of higher operating pressures. The production price of the CH4 varied based on the method of production. The double methanation column system had a production price of between 28.33 and 29.72 EUR/GJ, while the membrane upgrading technology incorporated process produced CH4 price between 26.49 and 60.56 EUR/GJ. The lowest cost was based on BFB methanation, between 11 and 14 bar, while the higher cost was FB methanation.
The production cost of e-methane via methanation, from European TEA R&D work, has remained consistent since 2017, as shown in Table 7. The TEA estimated cost of e-methane production from biogas methanation has generally remained between 26.49 and 60.65 EUR/GJ.

5.2. TEA Methodologies for Catalytic Biogas Methanation

Techno-economic analysis can provide estimates on production costs, revenue, and profit potentials of a given system. The results of TEAs can be significantly impacted by the quality and quantity of data used for TEA modelling and simulations. Generally, the more data that can be input into the model, the higher the quality of the output data. However, this level of detail is not always available and is either assumed using a factor, like the Lang factor, or omitted entirely from the model. A major impact from the construction costs is the location factor and chemical engineering plant index (CEPCI), which provides costs associated with equipment, construction, and labour [88].
There are several TEA programmes that can be utilised, although the ease of processing the input data to achieve the desired output can vary depending on the type of programme and the level of training required. The cost of the programmes can also be prohibitive for some of the more specialised programmes. Some of the programmes that are used for TEAs include Excel, SuperPro Designer, and ChemCad. Many papers have also been published using ASPEN Plus and ASPEN HYSYS for performing TEAs [23,86,87]. The cost considerations for TEAs can fall into several categories. The three major categories listed in Table 8 are capital costs, operational costs, and financial feasibility considerations. The capital costs as listed contain construction and capital investment, which are not always clearly stated in many TEAs. The operational costs include staffing, maintenance and operations, utilities, and finance and taxation. Most TEAs use fixed cost of staffing as an assumption, but do not detail the process of the staffing costs, which several of the considerations are listed within Table 8 The financial feasibility considerations include several parts that could be used in other sections of the TEA; however, the purpose of the financial feasibility considerations section is to enable both cost optimisation and minimisation as well as price determination. While Table 8 may not be an exhaustive list of cost contributions for all plant designs, it includes many of the potential considerations within each section that could be required for a comprehensive techno-economic analysis of catalytic biogas methanation.
There are largely three levels of TEA: simplified TEA, study-level TEA, and definitive-level TEA [90]. Each of these has benefits and detriments that range from quick results and low accuracy to slow and complex results with high accuracy. Simplified TEAs are generally depicted with block diagrams and have low accuracy for cost estimation (accuracy of −30% to +50%) [90] but provide vital evidence in proof-of-concept work and as pre-optimisation steps. This type of TEA tends to neglect significant portions of the potential costs of manufacturing by only focusing on the major components. As an example, in the case of biogas methanation with a simplified model, only components such as H2, CH4, CO2, and energy.
Study TEAs are some of the most common type of assessments performed, where the system is modelled with a process flow diagram (PFD) and moderate cost accuracy (accuracy of −15% to +30%) [90]. Some of the commonly used considerations include equipment sizing and flow rate, land acquisition and location factors, loan repayments and revenue factors, major and key minor components, and staffing. This allows for various output types, including annualised cost methods, sensitivity analyses, and feasibility analyses, to be performed with reliable results, opening pathways for robust comparative system modelling and simulations.
Definitive TEAs are simultaneously the most complicated and most accurate (accuracy of −5% to +15%) that can be performed [90]. This is due to the use of factoring for as many variables as possible in the design of the TEA. Factors like equipment sizing, location, taxation, royalties and licences, on-site (plant) and off-site costs (site offices and staff amenities), and many of the other considerations listed in Table 5. When combined, all these aspects show a comprehensive financial and technological map of a plant design. This design would allow for plant cost and production optimisation, allowing for most processes to be brought down to the minimum levels possible while accounting for expected variability in costs. This holistic view of a production plant also allows for considerations like improvement changes in technology to be input into the models when the information becomes available.
Some of the considerations and related outputs of TEAs include the capital costs, operating costs, and quantification of profitability. Capital costs and operational costs are used to help define the quantification of profitability. The capital costs, or capital expenditure (CAPEX), tend to cover the fixed equipment and the working capital, which is utilised for, among other uses, acquiring the feedstock and equipment needed for the plant’s initial operation. Operational costs or operational expenditure (OPEX), consists of the financial considerations needed to have the plant in operation, which include, for example, feedstock, utilities, staffing, and taxation.

6. Future Perspectives and Challenges

It is apparent that there are opportunities to develop new technologies that can synthesise value added materials that are both compatible with existing infrastructure and appliances, as well as being carbon neutral. An obvious choice here is e-methane, which fits this criterion due to its circular economy attributes. Upgrading biogas via chemical conversion processes to provide an energy source that is readily applicable to existing energy infrastructure makes sense in a carbon constrained economy.
On one hand, biogas is a renewable energy source itself that can be upgraded to biomethane. On the other hand, e-methane can also be a carrier of another renewable resource, green hydrogen, generated from electricity produced from a renewable source. Furthermore, converting biogas together with green H2 into e-methane and injecting it into gas pipelines also offers a pathway to decarbonise gas infrastructure, as green methane is more compatible than H2 for pipeline injection and is a more readily available commodity that can be stored and transported with existing gas infrastructure and LNG facilities.
However, there are challenges associated with biogas utilisation. Firstly, biogas sources are often distributed and need to be at scale to be utilised economically. Local or centralised hubs may need to be established to serve as collection points to allow gas capacity at scale.
There are also other significant challenges associated with the thermal catalytic conversion processes, for example, biogas fluctuations in composition and flowrates due to seasonal change and different locations. Thermal catalytic conversion processes need to be designed robust enough to be able to handle these process variables, which will increase the cost of production. There are some other process issues, such as catalyst deactivation, poisoning, and run-time intermittency problems, although all can possibly be overcome with more work in this area.
Cost of production is the key to determining the final adaptation of the technology by the market. Alkaline electrolysers are commonly used in pilot projects (e.g., Guilera et al., Werlte plant). They are a mature and reliable technology and have been commercially available for integration with biogas methanation. Sometimes, hydrogen buffer tanks (e.g., the Werlte plant) are used to store H2 at 10 bar, allowing continued operation during renewable power outages. So, electrolyser often implies significant investment. The reactor technology needs further innovation for energy efficiency and forms part of the capital investment for the production. Membrane upgrading systems, while effective (CH4 recovery > 96%), are noted to have high capital costs. Contaminant removal (e.g., H2S, moisture) adds to operational complexity and cost, especially when membranes react with unidentified gas components. All these factors will need to be assessed and considered thoroughly in a particular techno-economic assessment case.
Although the techno-economic assessment results suggest a relatively high cost compared to market-available natural gas, one factor should not be overlooked, which is the price of electricity that is directly associated with the H2 price. The H2 price consequently plays a key influencing factor for the cost of production. It is foreseen that the H2 price will drop significantly in the future; therefore, production cost of e-methane in a low H2 production cost environment will be very attractive.
Last but not least, it is apparent that more efficient processing technologies are needed that will offer lower temperature solutions with quicker start-up reaction parameters and better reactor bed temperature control. Some of these solutions may be achieved by applying plasma to enhance the biogas methanation process, as plasma reactions can be initiated instantaneously without the need for thermal standby conditions [91]. Plasma technology is a good match with the intermittent nature of the renewable energy. Most importantly, chemical conversion is potentially a very energy intensive process as the energy penalty associated with thermal chemical conversion is often derived from fossil fuel energy input. The plasma-enhanced biogas methanation process does not use thermal energy but electricity, directly converting electricity to chemical energy via the plasma process. Therefore, it offers a potential pathway to electrify the biogas conversion process to produce green methane as an energy carrier for H2. In this regard, a CSIRO team in Australia has been working on plasma-enhanced biogas methanation at ambient conditions, the results of which will be released in a publication soon.
Apparently, scaling up modular systems for direct biogas methanation in rural or off-grid areas of Australia presents a mix of technical, economic, and logistical challenges. While the technology offers a promising route for converting local organic waste into renewable methane, several barriers hinder its commercial viability. Key issues include the treatment of biogas impurities (like hydrogen sulphide and siloxanes), which can damage catalysts and reduce system efficiency. Additionally, reactor design and process integration remain complex, especially when adapting modular systems to variable feedstock quality and scattered, relatively small volumes typical of rural settings, which do not suit scale directly. Infrastructure gaps—such as limited access to reliable electricity for electrolysis and hydrogen production—further complicate the deployment. Moreover, high capital costs, lack of skilled labour, and regulatory uncertainty around biomethane injection into existing gas grids add to the mix of the challenges.
Despite these hurdles, Australia’s vast agricultural sector and growing policy support for bioenergy make it an ideal candidate for biogas methanation systems. The government together with the bioenergy association, is endeavouring their efforts to overcome the key hurdles to scale up the process through a combination of technological innovation, establishing central hubs to group farms or facilities to share digesters and purification units to increase scale, reducing costs and improving feedstock consistency, and building mobile modular units to allow flexibility and trial deployment before permanent installation. Meanwhile, foster public-private partnerships to promote collaboration between local councils, energy providers, and agricultural businesses to unlock funding and infrastructure support.

Author Contributions

P.H. drafted the section “4.0 Biogas methanation pilot studies” of the manuscript and finalised the formatting and managed the copyright clearance. R.S. drafted the sections “2.0 Biogas Resources”, “3.1 Biogas cleaning and upgrading technologies” 3.2 Biogas upgrading technologies by absorption and adsorption” and section “5.0 TEA Status for biogas methanation” C.L. supervised the writing on TEA work. J.Z. drafted the “3.3 Biogas upgrading technologies by thermal chemical methanation section”. Y.Y., project leader and received funding for the work, conceptualised and supervised the writing and project work. All authors have read and agreed to the published version of the manuscript.

Funding

This research received no external funding.

Acknowledgments

The authors would like to thank The Commonwealth Scientific and Industrial Research Organisation (CSIRO) and Beyond H2 Pty Ltd. for funding support for some of the work. R.S. would like to acknowledge the Australian Government Research Training Programme (RTP) Scholarship, and the CSIRO Top-up Scholarship.

Conflicts of Interest

All copyrights are obtained for the work and no conflict of interests for this work.

Abbreviations

Common abbreviations found in this document.
AcronymExpanded Text
ADAnerobic digestion
CAPEXCapital expenditure
CCSCarbon capture and storage
CHPCombined heat and power
GJGiga joule
KwKilowatt
LCOHLevelized cost of hydrogen
MtMillion tons
OPEXOperating expenditure
P2GPower to gas
PJPeta joule
PSAPressure swing absorption
SNGSynthetic natural gas
STPStandard temperature and pressure
TEATechno economic assessment
TWhTerawatt hour

References

  1. DISR. Future Gas Strategy-Analytical Report; Department of Industry Science and Resources: Canberra, Australia, 2024. [Google Scholar]
  2. Kundevski, M.; Truong, T.; Carlu, E. Biogas Opportunities for Australia; Enea Consulting: Bioenergy, Australia, 2019. [Google Scholar]
  3. Bruce, S.; Temminghoff, M.; Hayward, J.; Schmidt, E.; Munnings, C.; Palfreyman, D.; Hartley, P. National Hydrogen Roadmap; CSIRO: Clayton South, Australia, 2018. [Google Scholar]
  4. Lehtomaki, A.; Huttunen, S.; Rintala, J.A. Laboratory investigations on co-digestion of energy crops and crop residues with cow manure for methane production: Effect of crop to manure ratio. Resour. Conserv. Recycl. 2007, 51, 591–609. [Google Scholar] [CrossRef]
  5. Koonaphapdeelert, S.; Aggarangsi, P.; Moran, J. Biogas Cleaning and Pretreatment. In Biomethane: Production and Applications; Springer Singapore: Singapore, 2020; pp. 17–45. [Google Scholar]
  6. Deng, L.; Liu, Y.; Wang, W. Biogas Cleaning and Upgrading. In Biogas Technology; Deng, L., Liu, Y., Wang, W., Eds.; Springer Singapore: Singapore, 2020; pp. 201–243. [Google Scholar]
  7. Atelge, M.R.; Senol, H.; Djaafri, M.; Hansu, T.A.; Krisa, D.; Atabani, A.; Eskicioglu, C.; Muratcobanoglu, H.; Unalan, S.; Kalloum, S.; et al. A Critical Overview of the State-of-the-Art Methods for Biogas Purification and Utilization Processes. Sustainability 2021, 13, 11515. [Google Scholar] [CrossRef]
  8. Chen, X.Y.; Vinh-Thang, H.; Ramirez, A.A.; Rodrigue, D.; Kaliaguine, S. Membrane gas separation technologies for biogas upgrading. RSC Adv. 2015, 5, 24399–24448. [Google Scholar] [CrossRef]
  9. Persson, M.; Jonsson, O.; Wellinger, A. Biogas Upgrading to Vehicle Fuel Standards and Grid Injection; IEA: Paris, France, 2006. [Google Scholar]
  10. Werkneh, A.A. Biogas impurities: Environmental and health implications, removal technologies and future perspectives. Heliyon 2022, 8, e10929. [Google Scholar] [CrossRef] [PubMed]
  11. Wang, H.; Larson, R.A.; Runge, T. Impacts to hydrogen sulfide concentrations in biogas when poplar wood chips, steam treated wood chips, and biochar are added to manure-based anaerobic digestion systems. Bioresour. Technol. Rep. 2019, 7, 100232. [Google Scholar] [CrossRef]
  12. Nieß, S.; Armbruster, U.; Dietrich, S.; Klemm, M. Recent Advances in Catalysis for Methanation of CO2 from Biogas. Catalysts 2022, 12, 374. [Google Scholar] [CrossRef]
  13. Petersson, A. Biogas cleaning. In Biogas Handbook: Science, Production and Applications; Woodhead Publishing: New Delhi, India, 2013; pp. 329–341. [Google Scholar]
  14. Inaba, M.; Zhang, Z.G.; Matsuoka, K.; Soneda, Y. Effect of coexistence of siloxane on production of hydrogen and nanocarbon by methane decomposition using Fe catalyst. Int. J. Hydrogen Energy 2021, 46, 11556–11563. [Google Scholar] [CrossRef]
  15. IRENA. Off-Grid Renewable Energy Statistics 2022; International Renewable Energy Agency: Abu Dahbi, United Arab Emirates, 2022; p. 50. [Google Scholar]
  16. IEA. Gas Market Report Q1-2023; International Energy Agency: Paris, France, 2023; pp. 1–70. [Google Scholar]
  17. IEA. Renewables 2023/Analysis and forecast to 2028. In Renewables; International Energy Agency: Paris, France, 2024. [Google Scholar]
  18. Tercinier, P.; Degonfreville, A.; Guyot, T.; Bouvet, C. 6th European Biomethane Benchmark. In European Biomethane Benchmark; Sia Partners: Paris, France, 2022; Available online: https://www.sia-partners.com/en/insights/publications/6th-european-biomethane-benchmark (accessed on 23 October 2023).
  19. Giwa, A.S.; Ali, N.; Ahmad, I.; Asif, M.; Guo, R.B.; Li, F.L.; Lu, M. Prospects of China’s biogas: Fundamentals, challenges and considerations. Energy Rep. 2020, 6, 2973–2987. [Google Scholar] [CrossRef]
  20. Wang, Y.B.; Zhi, B.Y.; Xiang, S.M.; Ren, G.X.; Feng, Y.Z.; Yang, G.H.; Wang, X.J. China’s Biogas Industry’s Sustainable Transition to a Low-Carbon Plan-A Socio-Technical Perspective. Sustainability 2023, 15, 5299. [Google Scholar] [CrossRef]
  21. AirLiquide. Air Liquide Launches Its Biomethane Activity in China. 2022. Available online: https://www.airliquide.com/group/press-releases-news/2022-07-12/air-liquide-launches-its-biomethane-activity-china (accessed on 23 October 2023).
  22. Brémond, U.; Bertrandias, A.; Steyer, J.P.; Bernet, N.; Carrere, H. A vision of European biogas sector development towards 2030: Trends and challenges. J. Clean. Prod. 2021, 287, 125065. [Google Scholar] [CrossRef]
  23. Ghafoori, M.S.; Loubar, K.; Marin-Gallego, M.; Tazerout, M. Techno-economic and sensitivity analysis of Biomethane production via landfill biogas upgrading and power-to-gas technology. Energy 2022, 239, 122086. [Google Scholar] [CrossRef]
  24. Philip Hazewinkel, J.Z.; Yang, Y. Final Report for KS Green Methane Production from Biogas and Renewable H2—Feasibility Study; Bu, E., Ed.; CSIRO: Clayton South, Australia, 2022. [Google Scholar]
  25. Tercinier, P.; Menu, T.; Hoetmer, J. 7th European Biomethane Benchmark. In European Biomethane Benchmark; Sia Partners: Paris, France, 2023. [Google Scholar]
  26. GIE; EBA. European Biomethane Map 2021; Gas Infrastructure Europe: Bruxelles, Belgium; European Biogas Association: Brussels, Belgium, 2022. [Google Scholar]
  27. GIE; EBA. European Biomethane Map 2024; Gas Infrastructure Europe: Bruxelles, Belgium; European Biogas Association: Brussels, Belgium, 2024. [Google Scholar]
  28. EBA. EBA Statistical Report 2022; European Biogas Association: Brussels, Belgium, 2022. [Google Scholar]
  29. U.S. Department of Energy. Renewable Natural Gas Production. 2023. Available online: https://afdc.energy.gov/fuels/natural_gas_renewable.html (accessed on 21 June 2023).
  30. O’Malley, J.; Pavlenko, N.; Kim, Y.H. 2030 California Renewable Natural Gas Outlook: Resource Assessment, Market Opportunities, and Environmental Performance; International Council on Clean Transportation: Washington, DC, USA, 2023; p. 35. [Google Scholar]
  31. US EPA. Landfill Gas Energy Project Data. In United States Environmental Protection Agency: Landfill Methane Outreach Program (LMOP); United States Environmental Protection Agency: Washington, DC, USA, 2023. [Google Scholar]
  32. IEA. Outlook for biogas and biomethane. In Outlook for Biogas and Biomethane: Prospects for Organic Growth; International Energy Agency: Paris, France, 2020. [Google Scholar]
  33. US EPA. AgSTAR Data and Trends. 2022. Available online: https://www.epa.gov/agstar/agstar-data-and-trends#biogasfacts (accessed on 14 June 2023).
  34. Ellis, D. Global Biomethane Production Hits Record 7bcm in 2022. Available online: https://www.gasworld.com/story/global-biomethane-production-hits-record-7bcm-in-2022/#:~:text=The%20US%20remains%20by%20far,30%25%20of%20global%20biomethane%20output (accessed on 28 June 2023).
  35. Kaparaju, P.; Conde, E.; Nghiem, L.; Trianni, A.; Cantley–Smith, R.; Leak, J.; Katic, M.; Nguyen, L.; Jacobs, B.; Cunningham, R. B5: Opportunity Assessment Anaerobic digestion for electricity, transport and gas Final Report. In Race to 2023; AusIndustry Cooperative Research Centres Program; Australian Government/Departmentt of Industry, Science, Energy and Resources: Canberra, Australia, 2023; p. 192. [Google Scholar]
  36. AREMI. National Map/Biogas Facilities. 2023. Available online: https://www.nationalmap.gov.au/renewables (accessed on 17 August 2023).
  37. Jemana. Malabar Biomethane Injection Plant. 2023. Available online: https://jemena.com.au/about/innovation/renewable-gas/key-projects/malabar-biomethane-project (accessed on 14 June 2023).
  38. Lima, D.; Appleby, G.; Li, L. A Scoping Review of Options for Increasing Biogas Production from Sewage Sludge: Challenges and Opportunities for Enhancing Energy Self-Sufficiency in Wastewater Treatment Plants. Energies 2023, 16, 2369. [Google Scholar] [CrossRef]
  39. ORG. Katunga Biogas/Biomethane Project. 2023. Available online: https://optimalrenewablegas.com.au/project/katunga-biogas-biomethane-project/ (accessed on 23 October 2023).
  40. ORG. Westbury Bio Hub Project. 2023. Available online: https://optimalrenewablegas.com.au/project/westbury-bio-hub-project/ (accessed on 23 October 2023).
  41. HyResource. Hazer Commercial Demonstration Plant. 2023. Available online: https://research.csiro.au/hyresource/hazer-commercial-demonstration-plant/ (accessed on 23 October 2023).
  42. Sun, Q.; Li, H.; Yan, J.; Liu, L.; Yu, Z.; Yu, X. Selection of appropriate biogas upgrading technology-a review of biogas cleaning, upgrading and utilisation. Renew. Sustain. Energy Rev. 2015, 51, 521–532. [Google Scholar] [CrossRef]
  43. Fajrina, N.; Yusof, N.; Ismail, A.F.; Aziz, F.; Bilad, M.R.; Alkahtani, M. A crucial review on the challenges and recent gas membrane development for biogas upgrading. J. Environ. Chem. Eng. 2023, 11, 110235. [Google Scholar] [CrossRef]
  44. Sahota, S.; Shah, G.; Ghosh, P.; Kapoor, R.; Sengupta, S.; Singh, P.; Vijay, V.; Sahay, A.; Vijay, V.K.; Thakur, I.S. Review of trends in biogas upgradation technologies and future perspectives. Bioresour. Technol. Rep. 2018, 1, 79–88. [Google Scholar] [CrossRef]
  45. Kaparaju, P.; Rasi, S.; Rintala, J. Biogas upgrading and compression. In Bioenergy Production by Anaerobic Digestion; Korres, N., O’Kiely, P., Benzie, J.A.H., West, J.S., Eds.; Routledge: London, UK, 2013; pp. 152–182. [Google Scholar]
  46. Muñoz, R.; Meier, L.; Diaz, I.; Jeison, D. A review on the state-of-the-art of physical/chemical and biological technologies for biogas upgrading. Rev. Environ. Sci. Bio Technol. 2015, 14, 727–759. [Google Scholar] [CrossRef]
  47. TUV. Biogas to Biomethane Technology Review; Vienna University of Technology: Vienna, Austria; Intelligent Energy Europe: Pikermi, Greece, 2012; pp. 1–15. [Google Scholar]
  48. Rodero, M.R.; Ángeles, R.; Marín, D.; Díaz, I.; Colzi, A.; Posadas, E.; Lebrero, R.; Muñoz, R. Biogas Purification and Upgrading Technologies. In Biogas: Fundamentals, Process, and Operation; Tabatabaei, M., Ghanavati, H., Eds.; Springer International Publishing: Cham, Switzerland, 2018; pp. 239–276. [Google Scholar]
  49. AEMO. Gas Quality Guidelines; Australian Energy Market Operator: Melbourne, Australia, 2017; p. 38. [Google Scholar]
  50. Angelidaki, I.; Treu, L.; Tsapekos, P.; Luo, G.; Campanaro, S.; Wenzel, H.; Kougias, P.G. Biogas upgrading and utilization: Current status and perspectives. Biotechnol. Adv. 2018, 36, 452–466. [Google Scholar] [CrossRef]
  51. Khan, M.U.; Lee, J.T.E.; Bashir, M.A.; Dissanayake, P.D.; Ok, Y.S.; Tong, Y.W.; Shariati, M.A.; Wu, S.; Ahring, B.K. Current status of biogas upgrading for direct Biomethane use: A review. Renew. Sustain. Energy Rev. 2021, 149, 111343. [Google Scholar] [CrossRef]
  52. Galloni, M.; Di Marcoberardino, G. Biogas Upgrading Technology: Conventional Processes and Emerging Solutions Analysis. Energies 2024, 17, 2907. [Google Scholar] [CrossRef]
  53. Adnan, A.I.; Ong, M.Y.; Nomanbhay, S.; Chew, K.W.; Show, P.L. Technologies for Biogas Upgrading to Biomethane: A Review. Bioengineering 2019, 6, 92. [Google Scholar] [CrossRef] [PubMed]
  54. Gkotsis, P.; Kougias, P.; Mitrakas, M.; Zouboulis, A. Biogas upgrading technologies—Recent advances in membrane-based processes. Int. J. Hydrogen Energy 2023, 48, 3965–3993. [Google Scholar] [CrossRef]
  55. Roozitalab, A.; Hamidavi, F.; Kargari, A. A review of membrane material for biogas and natural gas upgrading. Gas Sci. Eng. 2023, 114, 204969. [Google Scholar] [CrossRef]
  56. Tomczak, W.; Gryta, M.; Daniluk, M.; Żak, S. Biogas Upgrading Using a Single-Membrane System: A Review. Membranes 2024, 14, 80. [Google Scholar] [CrossRef] [PubMed]
  57. Rotunno, P.; Lanzini, A.; Leone, P. Energy and economic analysis of a water scrubbing based biogas upgrading process for Biomethane injection into the gas grid or use as transportation fuel. Renew. Energy 2017, 102, 417–432. [Google Scholar] [CrossRef]
  58. Ryckebosch, E.; Drouillon, M.; Vervaeren, H. Techniques for transformation of biogas to Biomethane. Biomass Bioenergy 2011, 35, 1633–1645. [Google Scholar] [CrossRef]
  59. Chen, Y.; Xie, C.; Li, Y.; Song, C.; Bolin, T.B. Sulfur poisoning mechanism of steam reforming catalysts: An X-ray absorption near edge structure (XANES) spectroscopic study. Phys. Chem. Chem. Phys. 2010, 12, 5707–5711. [Google Scholar] [CrossRef]
  60. Gao, J.; Wang, Y.; Ping, Y.; Hu, D.; Xu, G.; Gu, F.; Su, F. A thermodynamic analysis of methanation reactions of carbon oxides for the production of synthetic natural gas. RSC Adv. 2012, 2, 2358–2368. [Google Scholar] [CrossRef]
  61. Méndez-Mateos, D.; Barrio, V.L.; Requies, J.M.; Cambra, J.F. A study of deactivation by H2S and regeneration of a Ni catalyst supported on Al2O3, during methanation of CO2. Effect of the promoters Co, Cr, Fe and Mo. RSC Advances. RSC Adv. 2020, 10, 16551–16564. [Google Scholar] [CrossRef] [PubMed]
  62. Bartholomew, C.H.; Weatherbee, G.D.; Jarvi, G.A. Sulfur poisoning of nickel methanation catalysts: I. in situ deactivation by H2S of nickel and nickel bimetallics. J. Catal. 1979, 60, 257–269. [Google Scholar] [CrossRef]
  63. Neuberg, S.; Pennemann, H.; Shanmugam, V.; Thiermann, R.; Zapf, R.; Gac, W.; Greluk, M.; Zawadzki, W.; Kolb, G. CO2 Methanation in Microstructured Reactors—Catalyst Development and Process Design. Chem. Eng. Technol. 2019, 42, 2076–2084. [Google Scholar] [CrossRef]
  64. Gac, W.; Zawadzki, W.; Rotko, M.; Słowik, G.; Greluk, M. CO2 Methanation in the Presence of Ce-Promoted Alumina Supported Nickel Catalysts: H2S Deactivation Studies. Top. Catal. 2019, 62, 524–534. [Google Scholar] [CrossRef]
  65. Alarcón, A.; Guilera, J.; Soto, R.; Andreu, T. Higher tolerance to sulfur poisoning in CO2 methanation by the presence of CeO2. Appl. Catal. B Environ. 2020, 263, 118346. [Google Scholar] [CrossRef]
  66. Rodriguez, J.A.; Hrbek, J. Interaction of Sulfur with Well-Defined Metal and Oxide Surfaces:  Unraveling the Mysteries behind Catalyst Poisoning and Desulfurization. Acc. Chem. Res. 1999, 32, 719–728. [Google Scholar] [CrossRef]
  67. Dannesboe, C.; Hansen, J.B.; Johannsen, I. Removal of sulfur contaminants from biogas to enable direct catalytic methanation. Biomass Convers. Biorefinery 2021, 11, 1823–1834. [Google Scholar] [CrossRef]
  68. Argyle, M.D.; Bartholomew, C.H. Heterogeneous Catalyst Deactivation and Regeneration: A Review. Catalysts 2015, 5, 145–269. [Google Scholar] [CrossRef]
  69. Stangeland, K.; Kalai, D.Y.; Li, H.; Yu, Z. Active and stable Ni based catalysts and processes for biogas upgrading: The effect of temperature and initial methane concentration on CO2 methanation. Appl. Energy 2018, 227, 206–212. [Google Scholar] [CrossRef]
  70. Han, D.; Kim, Y.; Byun, H.; Cho, W.; Baek, Y. CO2 Methanation of Biogas over 20 wt% Ni-Mg-Al Catalyst: On the Effect of N2, CH4, and O2 on CO2 Conversion Rate. Catalysts 2020, 10, 1201. [Google Scholar] [CrossRef]
  71. Gac, W.; Zawadzki, W.; Rotko, M.; Greluk, M.; Słowik, G.; Pennemann, H.; Neuberg, S.; Zapf, R.; Kolb, G. Direct Conversion of Carbon Dioxide to Methane over Ceria- and Alumina-Supported Nickel Catalysts for Biogas Valorization. ChemPlusChem 2021, 86, 889–903. [Google Scholar] [CrossRef]
  72. Pastor-Pérez, L.; Patel, V.; Le Saché, E.; Reina, T. CO2 methanation in the presence of methane: Catalysts design and effect of methane concentration in the reaction mixture. J. Energy Inst. 2020, 93, 415–424. [Google Scholar] [CrossRef]
  73. Mhadmhan, S.; Ngamcharussrivichai, C.; Hinchiranan, N.; Kuchonthara, P.; Li, Y.; Wang, S.; Reubroycharoen, P. Direct biogas upgrading via CO2 methanation to high-quality Biomethane over NiMg/CNT-SiO2 fiber catalysts. Fuel 2022, 310, 122289. [Google Scholar] [CrossRef]
  74. Zhuang, Y.; Simakov, D.S.A. Single-Pass Conversion of CO2/CH4 Mixtures over the Low-Loading Ru/γ-Al2O3 for Direct Biogas Upgrading into Renewable Natural Gas. Energy Fuels 2021, 35, 10062–10074. [Google Scholar] [CrossRef]
  75. Specht, M.; Hansen, J.B.; Johannsen, I. The Power to Gas Process: Storage of Renewable Energy in the Natural Gas Grid via Fixed Bed Methanation of CO2/H2. In Synthetic Natural Gas from Coal, Dry Biomass, and Power-to-Gas Applications; Wiley: Hoboken, NJ, USA, 2016; pp. 191–220. [Google Scholar]
  76. Guilera, J.; Andreu, T.; Basset, N.; Boeltken, T.; Timm, F.; Mallol, I.; Morante, J.R. Synthetic natural gas production from biogas in a waste water treatment plant. Renew. Energy 2020, 146, 1301–1308. [Google Scholar] [CrossRef]
  77. Dannesboe, C.; Hansen, J.B.; Johannsen, I. Catalytic methanation of CO in biogas: Experimental results from a reactor at full scale. React. Chem. Eng. 2020, 5, 183–189. [Google Scholar] [CrossRef]
  78. Witte, J.; Calbry-Muzyka, A.; Wieseler, T.; Hottinger, P.; Biollaz, S.M.; Schildhauer, T.J. Demonstrating direct methanation of real biogas in a fluidised bed reactor. Appl. Energy 2019, 240, 359–371. [Google Scholar] [CrossRef]
  79. Kirchbacher, F.; Biegger, P.; Miltner, M.; Lehner, M.; Harasek, M. A new methanation and membrane based power-to-gas process for the direct integration of raw biogas–Feasability and comparison. Energy 2018, 146, 34–46. [Google Scholar] [CrossRef]
  80. Gaikwad, R.; Villadsen, S.N.B.; Rasmussen, J.P.; Grumsen, F.B.; Nielsen, L.P.; Gildert, G.; Møller, P.; Fosbøl, P.L. Container-Sized CO to Methane: Design, Construction and Catalytic Tests Using Raw Biogas to Biomethane. Catalysts 2020, 10, 1428. [Google Scholar] [CrossRef]
  81. Calise, F.; Cappiello, F.L.; Cimmino, L.; Dentice d’Accadia, M.; Vicidomini, M. Dynamic simulation and thermoeconomic analysis of a power to gas system. Renew. Sustain. Energy Rev. 2023, 187, 113759. [Google Scholar] [CrossRef]
  82. Gutiérrez-Martín, F.; Rodríguez-Antón, L.M.; Legrand, M. Renewable power-to-gas by direct catalytic methanation of biogas. Renew. Energy 2020, 162, 948–959. [Google Scholar] [CrossRef]
  83. Kirchbacher, F.; Miltner, M.; Wukovits, W.; Harasek, M. Economic assessment of membrane-based power-to-gas processes for the European biogas market. Renew. Sustain. Energy Rev. 2019, 112, 338–352. [Google Scholar] [CrossRef]
  84. Leonzio, G. Design and feasibility analysis of a Power-to-Gas plant in Germany. J. Clean. Prod. 2017, 162, 609–623. [Google Scholar] [CrossRef]
  85. Peters, R.; Baltruweit, M.; Grube, T.; Samsun, R.C.; Stolten, D. A techno economic analysis of the power to gas route. J. CO2 Util. 2019, 34, 616–634. [Google Scholar] [CrossRef]
  86. Skorek-Osikowska, A.; Martín-Gamboa, M.; Dufour, J. Thermodynamic, economic and environmental assessment of renewable natural gas production systems. Energy Convers. Manag. X 2020, 7, 100046. [Google Scholar] [CrossRef]
  87. Walker, S.B.; Sun, D.; Kidon, D.; Siddiqui, A.; Kuner, A.; Fowler, M.; Simakov, D.S. Upgrading biogas produced at dairy farms into renewable natural gas by methanation. Int. J. Energy Res. 2018, 42, 1714–1728. [Google Scholar] [CrossRef]
  88. Witte, J.; Kunz, A.; Biollaz, S.M.; Schildhauer, T.J. Direct catalytic methanation of biogas—Part II: Techno-economic process assessment and feasibility reflections. Energy Convers. Manag. 2018, 178, 26–43. [Google Scholar] [CrossRef]
  89. Qu, X.; Zeng, H.; Gao, Y.; Mo, T.; Li, Y. Bio-hydrogen production by dark anaerobic fermentation of organic wastewater. Front. Chem. 2022, 10, 978907. [Google Scholar] [CrossRef] [PubMed]
  90. Mao, K. Engineering Economy: Overview and Application in Process Engineering Industry. 10.490 ICE. Microsoft PowerPoint—Engineering Economics Lecture.ppt. 2006. Available online: https://ocw.mit.edu/courses/10-490-integrated-chemical-engineering-i-fall-2006/98288885a32c8a4054460082cb87a426_eng_econ_lecture.pdf (accessed on 17 November 2023).
  91. Ullah, S.; Gao, Y.; Dou, L.; Liu, Y.; Shao, T.; Yang, Y.; Murphy, A.B. Recent Trends in Plasma-Assisted CO2 Methanation: A Critical Review of Recent Studies. Plasma Chem. Plasma Process. 2023, 43, 1335–1383. [Google Scholar] [CrossRef]
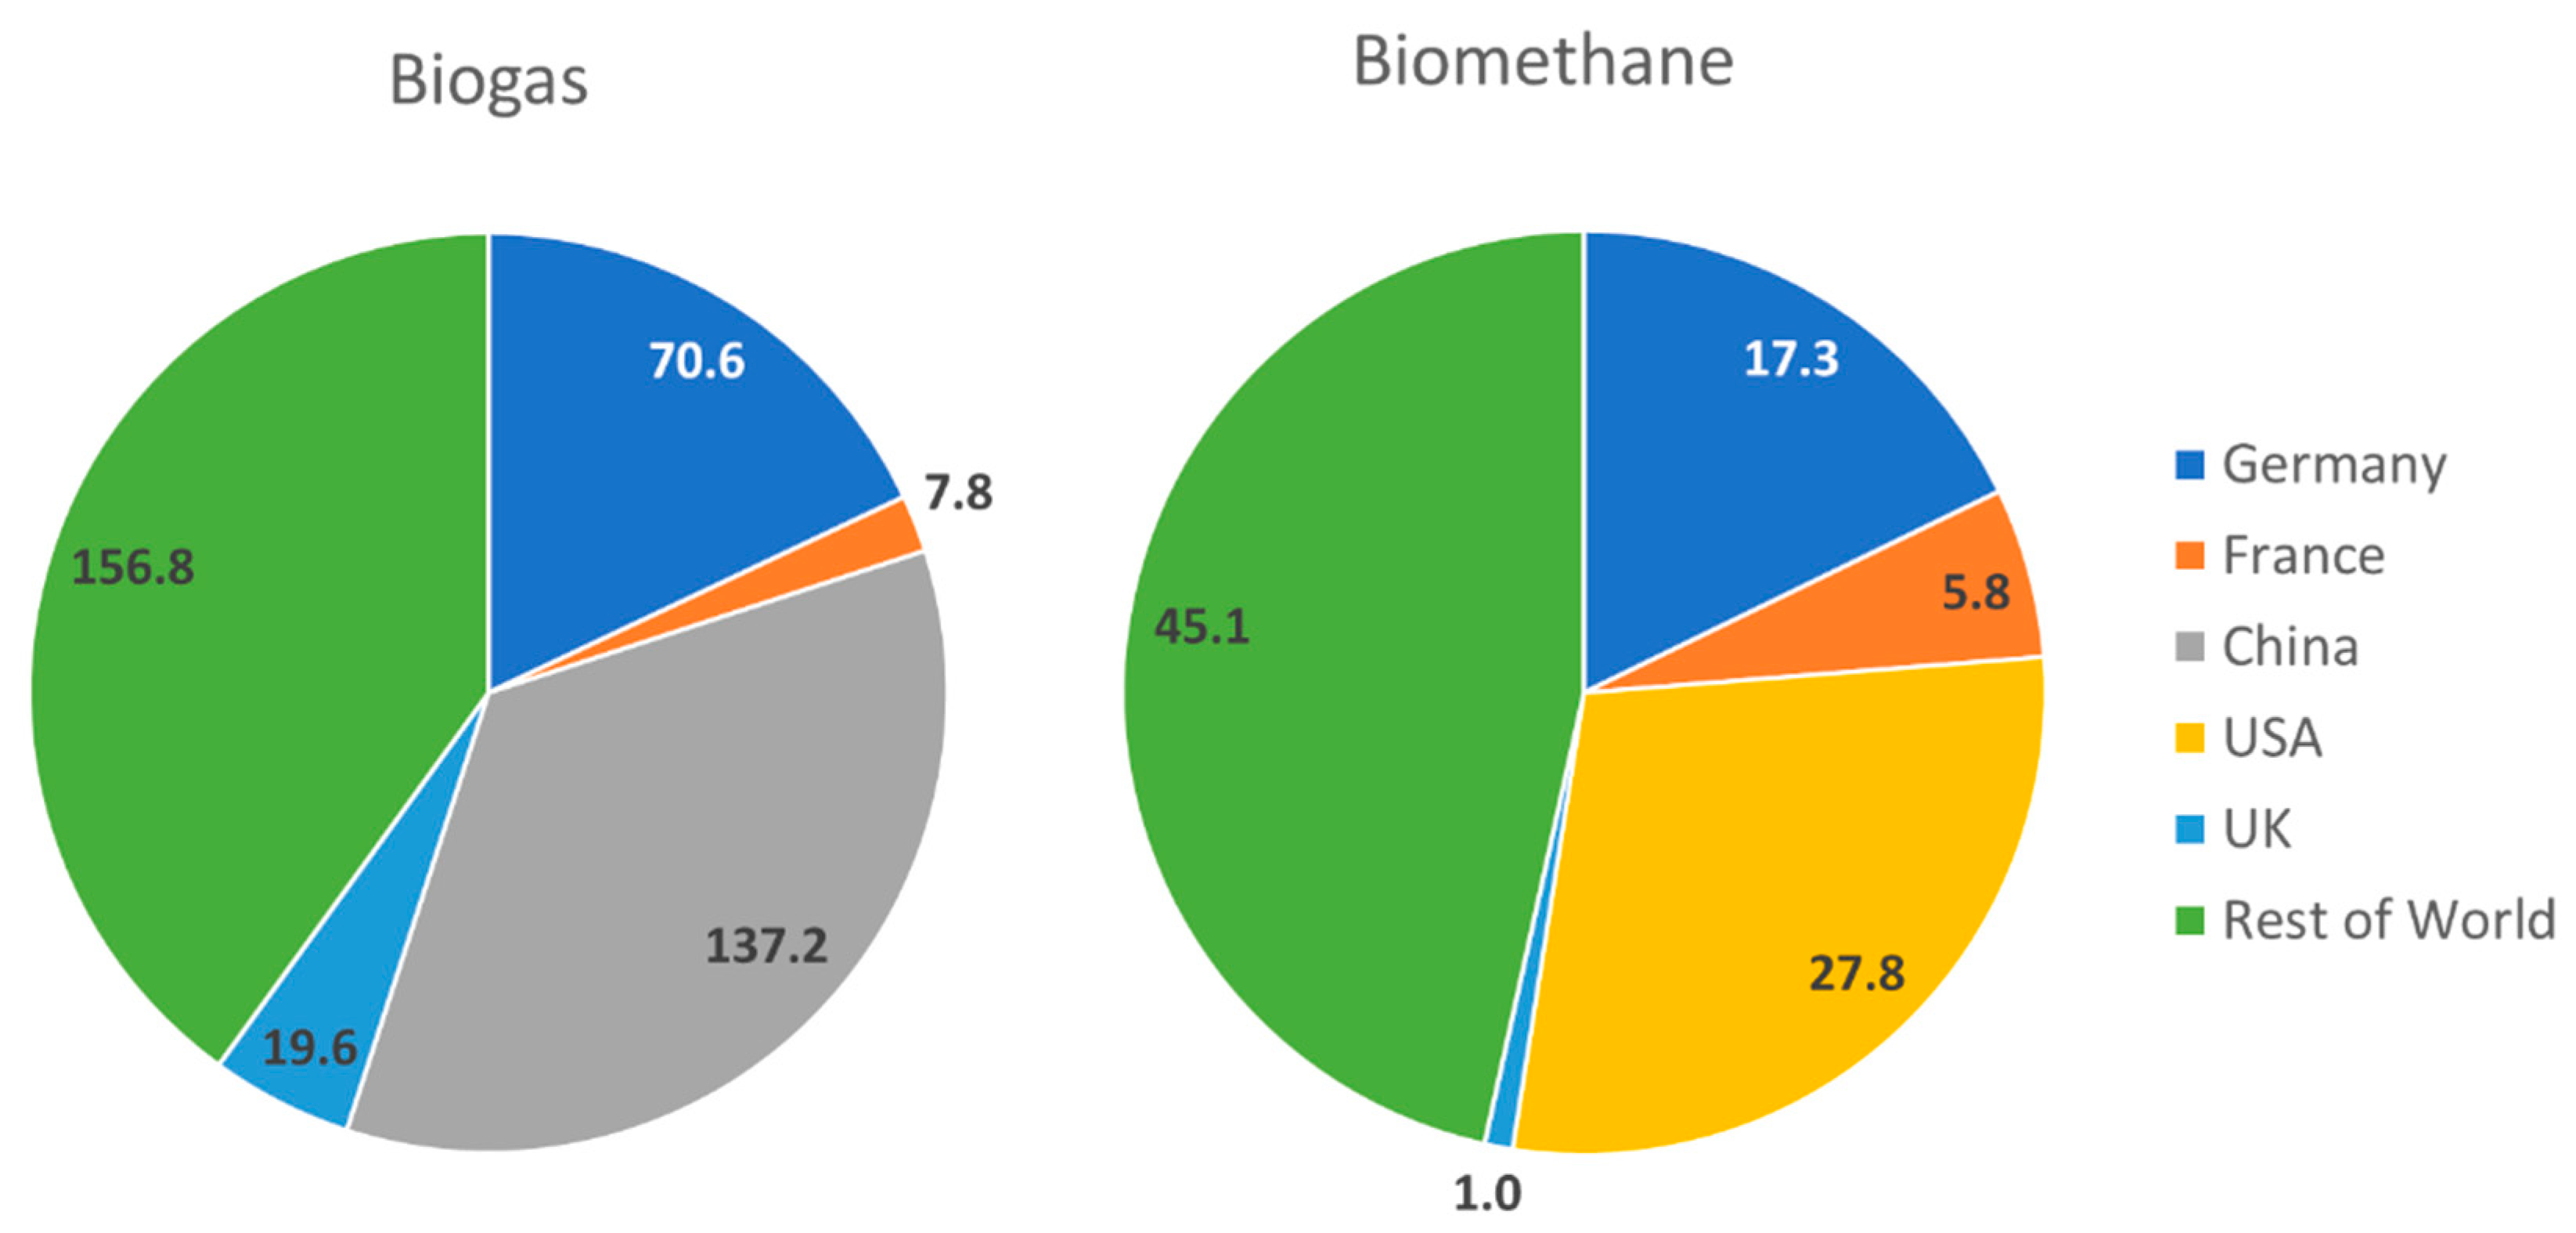
Figure 1. Global biogas production, TWh, with selection of significant countries [15,16,17,18]. USA is included in rest of world for biogas.
Energies 18 04657 g001
Figure 2. Biogas and green methane production by country in Europe in 2021 [17,18].
Energies 18 04657 g002
Figure 3. The four countries with the most biogas upgrading facility in the European region compared to the rest of the region [26,27].
Energies 18 04657 g003
Figure 4. Operational biogas facilities. Image adapted from the Australian interactive National Map 2023 [36].
Energies 18 04657 g004
Figure 6. Schematic of J. Guilera et al. e-methane pilot plant. Modified from [76].
Energies 18 04657 g006
Figure 7. J. Witte et al.’s methanation process flow diagram. Reprinted from [78].
Energies 18 04657 g007
Figure 8. Kirchbacker et al. simplified process flow diagram. Reprinted from [79].
Energies 18 04657 g008
Figure 9. MeGa-StoRE schematic of set-up. Reprinted from [80].
Energies 18 04657 g009
Figure 10. Biogas methanation systems from Gutiérrez-Martín et al. [64]. (A) Tubular direct biogas methanation reactor with gas recycling. (B) Double adiabatic biogas methanation system. Reprinted from [64].
Energies 18 04657 g010
Figure 11. Biogas methanation and upgrading systems from Kirchbacher, et al. [83]. (A) Methanation and membrane upgrading, BC = Base case. (B) Methanation and upgrading with off gas recycling, DR = Direct recycle. (C) Methanation of recycled off gas with direct biogas upgrading, PM = Previous methane removal and recycling. (D) Biogas methanation with double membrane upgrading and off gas recycling, 2M = 2-stage membrane separation and recycle. Reprinted from [83].
Energies 18 04657 g011
Figure 12. Methanation landfill gas methanation systems from Ghafoori et al. [23]. (A) Direct methanation of cleaned landfill biogas. (B) Methanation of membrane separation cleaned landfill biogas CO2. Reprinted from [23].
Energies 18 04657 g012
Figure 13. Process flow diagram of cattle manure biogas methanation system with pressure PSA upgrading for gas grid injection. Reprinted from [87].
Energies 18 04657 g013
Figure 14. Methanation of cleaned biogas. (A) Double methanation system with temperature swing absorption unit. (B) Single methanation system with membrane upgrading. (C) Alternate to system B for bio-CH4 drying before membrane separation. Image modified from [88].
Energies 18 04657 g014
Table 2. Annual Australian biogas feedstock estimated collection potential [35].
FeedstockBiomass Production,
(106 Tonnes of
Feedstock Solids)
Collection Rates, (%)
LowMediumHigh
Agricultural crop residues43.13314560
Livestock manure2.987080100
Agro-industry waste6.92507590
Food processing waste0.73757989
Biowaste7.91304560
Sewage sludge0.37100100100
Total62.03365166
Table 3. Comparison for all available biogas upgrading technologies operational parameters. Adapted from [8,10,42,43,44,45,46,47].
PSAMembrane SeparationWater ScrubbingOrganic Physical ScrubbingChemical ScrubbingAmine ScrubbingCryogenic SeparationRefs.
Methane
(vol%)
95–9990–9993–9993–9997–99.5>9991–98[7,8,10,42,43,44,45,46,47]
Methane loss (%)2–50.5–101–52–13<10<1<1[7,8,42,43,44,45,47]
Pressure
(bar)
Operation: 4–10
Regeneration: 0.5
Operation: 6–20
Pressure driven dense membranes: 20–36
Absorption: 6–10
Flash: 2–4
Regeneration: 1
4–81–21–200[8,10,42,43,45,46,47]
Temperature, (°C)50–602040AmbientOperation: 20
Regeneration: 100–150
−25 to −125[8,42,43,46,47]
Table 5. Catalysts for biogas methanation adapted from [69,70,71,72,73,74].
CatalystsActive Metal
Loading,
wt%
Pressure
Bar
Temp.
°C
CH4/CO2XCO2
%
SCH4
%
STY (molCH4·gcat−1·h−1)Time on Stream
(no H2S in Feed)
Ref.
Ni/Al2O32013500/10071.599.70.2544324 h [69]
50/5070.899.50.25144
67/3370.699.40.25047
NiRu/Al2O320% Ni + 0.5% Ru13500/100851000.3030214 h[69]
67/3381>99
NiMg/Al2O320% Ni + 3% Mg14000/10076960.194200 h[70]
40/6067970.154
50/5064970.139
65/3554970.102
Ni/Al2O32023500/10088.51000.18220 h[71]
50/5082790.134
Ni/Al2O34023500/10091.41000.18820 h[71]
50/5081790.132
Ni/Al2O32012.535050/5093.71000.19370 h[71]
Ni/Al2O34012.535050/5095.71000.19770 h[71]
Ni/CeO22023500/10091.71000.18920 h[71]
50/5081750.125[71]
Ni/CeO22012.535050/5094.61000.19570 h[71]
NiCo/CeO2-ZrO215% Ni + 3% Co13500/10071980.075-[72]
21/7972970.071-
36/6474980.070-
47/5378990.07038 h
Ni/CNT-silica101035060/3786.3970.067<14 h[73]
NiMg/CNT-silica10% Ni + 2% Mg1035060/3795980.0744 h[73]
Ru/γ-Al2O30.5345050/50~80~100~0.53560–70 h[74]
Table 6. Data representative of pilot plant operating parameters are provided here.
StudyReactor TypeFeedstockOperating Temp (°C)Pressure (bar)CatalystCO2 Conversion (%) Scale, Nm3/h/
Capacity
RuntimeRefs.
Specht et al. (2016)Fixed-bed CO2/H2 and CH4/CO2/H2~300–4005–10Ni ~100 -/25 kW, 250 kW[75]
Guilera et al. (2020)Fixed-bedBiogas (CO2 from upgrading) + H2~35012Ni ~80–9050/37 kW >600 h [76]
Dannesboe et al. (2020)Packed Bed (cooled)Raw biogas~300–350AtmosphericNi 10/- 1000 h [77]
Witte et al. (2019)Bubbling fluidised bedReal/simulated biogas~350–4001–5Ni ~951.4–2.3/10–20 kW,1100 h [78]
Kirchbacher et al. (2018)Fixed-bed + membraneReal/simulated biogas~300–400Variable (optimised for GHSV)Ni ~85–95 0.5/- [79]
Gaikwad et al. (2020)4 reactors in seriesRaw biogas350–400AtmosphericNi >90 10/- [80]
Australia (Jemena–Sydney Water)Membrane SeparationBiogasAmbient1100/-[37]
Table 7. Production prices of CH4 from biogas methanation. Adapted from [23,82,83,84,85,86,87,88].
UnitsYearProcesses Modelled
21.67–41.67EUR/GJ2022Membrane separation and methanation
13.72–14.74EUR/GJ2020Single and double bed methanation
32.48EUR/GJ2020Amine scrubbing and methanation
35.34EUR/GJ2019Amine scrubbing and methanation
31.54–37.55EUR/GJ2019Membrane separation, methanation, and gas recycling
40USD/GJ2018PSA and methanation
26.49–60.56EUR/GJ2018Methanation and hydrogen membrane gas recycling
36.91EUR/GJ2017Biogas cleaning and multistage methanation
Table 8. Considerations for CAPEX, OPEX, and financial feasibility for catalytic biogas methanation.
Capital CostsOperational CostsFinancial Feasibility Considerations
ConstructionFinance and taxationIncome/Offsets
Anaerobic digesterCarbon pricingFeed-in tariffs
Cooling unitCorporate/business tax ratePrimary product sale
CompressorLoan repayment rateDiscount rate
Condenser unitLoan lifetimeSecondary product sales
Desiccator unitInterest rateTax offsets
Desulphurisation unitInsuranceExpenditure
Feedstock storageMaintenance and operationCapital costs
Gas holding/export equipmentCatalyst materialInsurance
Gas pipingComputers and equipmentLoans
Gas quality monitoring equipmentFeedstockOperational costs
Gas recycling unitGas piping repairTaxation
Gas separation unitLiquid piping repairSize, capacities, and efficiencies
Gas turbineMaintenance consumablesAnnual operational hours
Heat exchangerReagents and inoculumCompression pressure
Heating unitSpecialised software/licencesCorrosion protection
Liquid and solid separation unitWaste disposalEfficiency of renewable energy source
Liquid pipingStaffEnergy efficiency
Liquid pumpBonus ratesExport capacity
Liquid waste holdingNumber of staffGas canister dimensions
Methanation reactorStaff hoursGas canister material
Solar panelsStaff payGas canister pressure
Solid waste holdingStaff holidaysHeat transfer efficiency
Utility installationSick leaveLifetime of equipment
Wind turbineUtilitiesPipe dimensions
Investment costsElectricityPipe gauge
Specialised softwareGas supplyPipe material
Computers and equipmentHeating oilPipe pressure
Initial feedstockWaterPlant capacity
Initial reagents and inoculum Production efficiency
Land acquisition Renewable energy averages
Non-plant construction Storage capacity
Site offices
Staff facilities
Utility installation
Disclaimer/Publisher’s Note: The statements, opinions and data contained in all publications are solely those of the individual author(s) and contributor(s) and not of MDPI and/or the editor(s). MDPI and/or the editor(s) disclaim responsibility for any injury to people or property resulting from any ideas, methods, instructions or products referred to in the content.