Article

Wavelet Analysis of the Similarity in the Inflation Index (HICP) Dynamics for Electricity, Gas, and Other Fuels in Poland and Selected European Countries

by
Tadeusz Kufel
1,* and
Grzegorz Rządkowski
2
1
Faculty of Economic Sciences and Management, Nicolaus Copernicus University, ul. Gagarina 13a, 87-100 Toruń, Poland
2
Department of Finance and Risk Management, Warsaw University of Technology, Narbutta 85, 02-524 Warsaw, Poland
*
Author to whom correspondence should be addressed.
Energies 2025, 18(17), 4610; https://doi.org/10.3390/en18174610 (registering DOI)
Submission received: 28 July 2025 / Revised: 26 August 2025 / Accepted: 28 August 2025 / Published: 30 August 2025
(This article belongs to the Special Issue Economic and Political Determinants of Energy: 3rd Edition)

Abstract

Inflation is an indicator that signals emerging crises. The period of 2001–2024 witnessed numerous crises. Energy crises affect countries to varying degrees, making it important to identify those most sensitive to inflationary changes in energy prices. This study aims to assess the similarity in the dynamics of the annual inflation rates for the electricity, gas, and other fuels category (HICP—COICOP group 04.5) across Europe. In particular, we identify sub-periods and countries in which inflation indicators either led price changes in Poland or followed the inflation dynamics observed in Poland. This assessment of leading and lagging inflation dynamics is conducted using wavelet analysis, specifically analysis of the wavelet coherence with a phase difference, for Poland and 27 European countries. The analysis addresses two main questions. First, was there statistically significant coherence (correlation in the frequency domain over specific sub-periods) in energy price inflation processes between Poland and other countries? Second, which countries exhibited energy price inflation dynamics that led or lagged behind the pattern in Poland? For many countries, coherence with Poland was not significant in regard to short-term fluctuations (2–6 months) but became significant over longer time scales. Furthermore, at longer periodicities, Poland’s energy inflation dynamics were synchronous with those of many European countries, especially during the period of Russian aggression against Ukraine. This analysis identifies statistically significant coherence between Poland and the chosen European countries. Germany and Lithuania frequently led Polish energy price inflation, whereas other countries, such as Bulgaria and Spain, often lagged behind. These results reveal dynamic patterns in the time–frequency co-movements of energy inflation across Europe.

1. Introduction

Inflation dynamics depend largely on raw material price dynamics. The consumer price index for the electricity, gas, and other fuels group is driven by the energy commodity prices, which in turn are strongly influenced by the methods of electricity production. Emerging crises are typically associated with high volatility in oil and gas prices, as well as fluctuations in exchange rates, which have the greatest impact on the group of goods and services related to electricity, gas, and other fuels.
Since 1996, Eurostat has produced the Harmonised Index of Consumer Prices (HICP) (https://ec.europa.eu/eurostat/web/hicp/information-data, accessed on 1 July 2025), which provides comparable measures of inflation across EU countries. The HICP is an economic indicator measuring changes over time in the prices of goods and services purchased by households. It serves as the official indicator of consumer price inflation in the Euro Area for monetary policy and inflation convergence assessment, in line with the Maastricht criteria for joining the Euro Area. Data have been published monthly since 1997 in the Eurostat database. In addition to the main HICP, more than 400 sub-indices are available, categorised according to their COICOP classification, covering various goods and services, as well as over 30 special aggregates (including the HICP for administered prices, the HICP-AP).
The crisis of 2020–2024 (the COVID-19 pandemic and Russian aggression against Ukraine) was marked by sharp increases in energy commodity prices (oil, gas, and coal), which in turn led to significant increases in consumer price indices. These increases varied by the country and commodity group. An analysis of European countries and the commodity group of electricity, gas, and other fuels—with particular reference to Poland’s price index—led us to the following research objective.
While numerous studies analyse energy price dynamics, gaps remain. Few studies examine the co-movement of inflation indices across European countries from long-term and medium-term perspectives. Additionally, limited research addresses the combined effect of market-based and regulated energy prices. Our study applies wavelet analysis to detect time–frequency similarities, filling these gaps.
The aim of this study is to assess the similarity in the dynamics of the annual inflation rates for the electricity, gas, and other fuels group (HICP—COICOP 04.5), focusing on identifying European countries whose inflation indices lead the dynamics observed in Poland, as well as those that follow Poland’s inflation pattern. The assessment of leading and lagging inflation dynamics relationships is carried out using wavelet analysis, specifically through the application of the wavelet coherence with a phase difference.
This study addresses two main research questions: (i) Is there statistically significant coherence (co-movement) in energy price inflation between Poland and other European countries? (ii) Which countries exhibit leading or lagging dynamics relative to Poland?

2. Literature Review

Wavelet analysis, i.e., analysis in the time and frequency domains, has many practical applications. This analysis uses advanced mathematical methods to capture the dynamic relationships between economic variables. The results achieved so far have been very broad, and in the areas of inflation and energy, they are as follows.
Paper [1] provides a comprehensive overview of the current global economic situation in the context of a “polycrisis” and discusses the effectiveness of economic policy in the political economy of natural resources. The impact of the EU on this polycrisis—considering the refugee crisis, the COVID-19 pandemic, the Russian invasion of Ukraine, and the debt crisis—is examined in paper [2].
Paper [3] explains how EU energy policy changed during and after the Ukrainian crisis. It outlines new threats and challenges facing the energy sector and presents the role of the banking sector in shaping the new EU energy architecture. The Russian invasion of Ukraine fundamentally altered the geopolitical situation, approaches to ensuring energy security, the EU’s energy independence, and the implementation of previously outlined climate policies (including the planned gradual phase-out of fossil fuels).
In the current crisis, the assessment of energy security in European countries in the context of the raw material and economic conditions has become a primary goal for individual countries and EU policy. Therefore, national analyses provide valuable guidelines for further research [4,5]. Some studies relate to inflation expectations, which show a strong link with changes in gasoline and gas prices, as pointed out by the authors of papers [6] and [7].
In paper [8], a bibliometric analysis of research on the economic effects of COVID-19 is presented, indicating its impact on various sectors including agriculture, the oil trade, industrial production, energy, education, finance, healthcare, pharmaceuticals, hospitality, tourism, aviation, and real estate. Important socio-economic effects of the pandemic are described in paper [9]. The processes involved in the global energy transition are considered to have been among the most significant determinants of socio-economic and technological change over the past thirty years. Papers [10,11,12] discuss how these transitions have shaped long-term trends. Furthermore, papers [13,14] indicate that changes in the prices of raw materials, particularly energy-related ones, are the main factor determining consumer price inflation.
Attaining energy security involves ensuring a stable energy supply for each economy while limiting the use of polluting (“dirty”) energy and systematically increasing the use of renewable energy resources. This also demonstrates the importance of green finance in facilitating the energy transition. Papers [15,16] illustrate the need to balance the use of “dirty” and clean energy sources from a time–frequency perspective, and reference [17] highlights the role of green finance in promoting renewable energy technologies.
Paper [18] presents a comprehensive review of the influential literature on inflation from 1906 to 2022. Through thematic and keyword analysis, it highlights directions in inflation research; notably, quantitative methods are widely used, but spectral methods and wavelet analyses of inflation dynamics are lacking. Paper [19] examines the relationship between stock returns and inflation rates in the UK over a long period (February 1790 to February 2017) at different frequencies using wavelet analysis. The results for the UK are compared with those for the US, India, and South Africa, indicating that the stock return–inflation relationship varies across frequencies and periods.
Wavelet analysis has been used to assess inflation as a long-term process (over century-long periods) in papers [19,20,21,22,23], as well as over shorter periods using monthly data [24] and in regard to energy processes [25,26].
It has also been applied specifically to energy processes. Numerous studies use wavelet analysis to examine the co-movements between various economic indicators (often without implying causality)—for example, see references [27,28,29,30,31,32,33,34]. Wavelet analysis enables clearer and more accurate detection of irregularities and uncertainties in co-movements, often visualised as heat maps.
Wavelet analysis has also been combined with Granger causality tests in papers [35,36,37] and used to detect “lead–lag” dependencies (see ref. [38]).
Some studies focus on relatively short periods but use high-frequency (daily) data, especially to analyse the impact of the COVID-19 pandemic on the economy. The COVID-19 pandemic seriously affected the global economy and energy markets. The U.S. Federal Reserve attempted to mitigate the shock, stabilise financial markets, and promote economic recovery. Paper [39] examined the WTI crude oil and coal prices from 1 January 2018 to 7 May 2021. It found that due to pandemic-related supply and demand disruptions, the energy market’s efficiency sharply decreased in the first quarter of 2020, then improved significantly in the second half of 2020. However, under an excessively expansionary monetary policy, the market efficiency decreased again in the first half of 2021. These results suggest that while monetary policy had some mitigating effects on the pandemic’s impact on energy markets, this improvement was not sustained in the long run, and inflationary pressures persisted. Paper [40] indicates that fluctuations in energy prices affect production costs and inflation, causing complex structural changes due to energy demand and supply shocks. Paper [41] examined the time- and frequency-domain relationships between the electricity, coal, and clean energy markets and oil price demand and supply shocks.
Papers [42,43] apply quantitative methods to assess the impact of commodity prices on inflation. Extensive literature reviews on the relationship between oil prices and inflation are provided by references [44,45]. Meanwhile, analyses of various economic variables in the time–frequency domain are presented in papers [46,47,48].
Wavelet analysis has also been used to forecast time series levels, predict turning points, and detect leading indicators for business cycles (see references [49,50]). In particular, paper [51] demonstrates the use of wavelet analysis to study the stability of leading and lagging indicators in the time–frequency space. Wavelet analysis allows researchers to assess the time-varying relationship between leading indicators and a reference cycle and to evaluate the stability of leading and lagging indicators at specific frequencies.

3. Methods and Data

Wavelet analysis is widely used to assess frequency-based dependencies and to determine which series lead or lag a reference series. This study had a descriptive character and focused on the identification of time–frequency co-movement. Forecasting across frequency bands is methodologically challenging and not implemented here; future research may address this aspect.
In this study, the research procedure consisted of data preparation, testing the data properties, and conducting a wavelet coherence analysis. For wavelet analysis, it is necessary to work with series that are stationary in terms of both their mean and variance.
The data used in this analysis came from Eurostat’s PRC_HICP_MANR database. We examined the monthly annual inflation rates for the COICOP group 04.5 (electricity, gas, and other fuels) for 27 EU countries, as well as two aggregate series covering the entire European Union (EU) and the Euro Area (EA). Additionally, we included a series for the administered energy prices in Poland (denoted as PL_ADM). The dataset spanned 288 monthly observations made from January 2001 to December 2024. Data retrieval and analysis were facilitated by GRETL [52] and MATLAB [53], which provided direct access to the DB.nomics repository of economic data. The series were obtained via DB.nomics from the Eurostat PRC_HICP_MANR dataset (accessible at https://db.nomics.world/Eurostat/PRC_HICP_MANR, accessed on 1 April 2025). Countries for the analysis were selected based on the availability of complete and comparable annual HICP energy data. This data-driven selection ensured methodological consistency but limited the generalizability of the findings to countries outside the sample.
The annual inflation rate series analysed here are essentially ratio processes, derived from a transformation of the form x t = x ( t ) / x ( t 12 ) . This year-on-year ratio transformation eliminates trends and seasonality. However, it does not guarantee stationarity, which is a prerequisite for reliable wavelet analysis.
We tested for stationarity using several unit root tests: the Augmented Dickey–Fuller (ADF) test with a constant only [54], the ADF test with a constant and trend, the ADF-GLS test, and the KPSS test [55]. The results of these four tests are summarised in Table 1. In Table 1, for each country we report the p-values for the ADF tests (with a constant only, and with a constant and trend) and the ADF-GLS, as well as the outcome of the KPSS test. A significance level of 0.05 is typically used to determine stationarity (for ADF-type tests, a p-value below 0.05 suggests rejection of the unit root hypothesis, i.e., stationarity; for the KPSS test, a result of p > 0.10 indicates a failure to reject stationarity).
We conducted four unit root tests (ADF with only a constant, ADF with a trend, ADF-GLS, and KPSS) on annual inflation rates. The results indicate that, after applying a year-on-year transformation, the series were stationary or nearly stationary. The ADF tests allowed us to reject the hypothesis of non-stationarity at the 5% significance level for the majority of the countries. In contrast, the KPSS test did not reject stationarity at the 10% significance level. We remained cautious in a few marginal cases (with p-values in the range of 0.05 to 0.10), but overall, we considered the data suitable for wave analysis. Most series were stationary or quasi-stationary within the considered frequency bands, with the cone of influence covering frequencies of up to 96-month periods, making them appropriate for wavelet coherence analysis.
Having prepared the data, we then conducted the continuous wavelet transform (CWT) and wavelet coherence analysis. We used the Morlet wavelet, which is essentially a complex sinusoid modulated by a Gaussian envelope. The Morlet wavelet provides a good balance between time and frequency localization, offers phase information, and is smooth and oscillatory, making it ideal for coherence analysis (where we study the joint oscillations of two signals over time). We followed standard practice in wavelet analysis: the CWT was computed for each series and cross-wavelet transforms were computed for each pair of Poland’s series and another country’s series to measure their co-movement. The wavelet coherence was then derived, and a smoothing operator was applied to both the time and scale to obtain the wavelet coherency (the smoothed coherence measure). The phase difference between the two series was also calculated at each time–frequency point.

3.1. Wavelets, Cross-Wavelet Transform, and Wavelet Coherence

We will briefly present basic information on the theory of wavelet transforms.
A (mother) wavelet ([56], p. 24) is an integrable function, ψ L 1 R , generally complex-valued, which satisfies the following admissibility condition:
C ψ = 2 π ξ 1 ψ ^ ξ 2 d ξ <
where ψ ^ ξ is the Fourier transform of ψ :
ψ ^ ξ = 1 2 π ψ x e i ξ x d x
Since ψ L 1 R ,   ψ ^ ξ is a continuous function. Therefore, for the integral (1) to be finite, the condition ψ ^ 0 = 0 is necessary, and then
ψ x d x = 0
Moreover, we assume that ψ is square-integrable, with the norm
ψ = ψ L 2 = ψ x 2 d x 1 2
By dilating and translating the mother wavelet, one obtains a family of wavelets:
ψ a , b x = 1 a ψ x b a
where a , b R , a > 0 and, because of the normalising factor, ψ a , b = ψ . Usually one uses normalised wavelets, so ψ = 1 . The continuous wavelet transform (CWT) at a point, a , b , W f a , b , of a function, f L 2 R , is the inner product of the function f and the wavelet ψ a , b :
W f a , b = f , ψ a , b = f x ψ * a , b x d x
where a   a n d   b are parameters of the wavelet family and ψ * a , b is the complex conjugate of ψ a , b . For a fixed parameter, a > 0 , the integral (3) is the convolution of the function f and the wavelet ψ * a , b .
There are several types of wavelet mother functions available with different characteristics, such as Morlet, Mexican hat, Haar, Gaussian, and Daubechies wavelets [56,57], logistic wavelets [58,59], and Gompertz wavelets [60]. A wavelet commonly used in practice, especially for calculating the wavelet coherency, is the Morlet wavelet, which was first introduced by [61]. The mother function of the Morlet wavelet has the form
ψ η t = π 1 4 e i η t e η 2 2 e t 2 2
where η is a parameter. The term e η 2 2 ensures that condition (2) is satisfied, and thus the admissibility condition (1) is as well. However, since in practical applications of the Morlet wavelet the parameter η = 6 , this term is so small that it can be neglected. The Morlet wavelet is essentially a complex sinusoid modulated by a Gaussian envelope. This means that it captures oscillatory behaviour well, and the Gaussian localization ensures minimal leakages in terms of both time and frequency. Thus, we used the Morlet wavelet because it provides good time–frequency localization and phase information and is smooth and oscillatory, making it ideal for coherence analysis, where two signals’ joint oscillations are studied over time.
If one is dealing with a time series, x = x n , n = 0,1 , , N 1 , of N observations with a uniform time step, δ t , the integral in (3) is discretized, and the CWT becomes the following Riemann sum (see [57,62]):
W m x a = δ t a n = 0 N 1 x n ψ * n m δ t a , m = 0,1 , 2 , , N 1
The cross-wavelet transform of two time series, x = x n and y = y n , is defined as
W m x y = W m x W m y *
and the cross-wavelet power is given by | W m x y | .
The wavelet coherence between two time series, x = x n and y = y n , is defined by
R m a = S a 1 W m x y a ( S a 1 W m x a 2 ) 1 / 2 ( S a 1 W m y a 2 ) 1 / 2
where S denotes a smoothing operator for both the time and scale. Smoothing is necessary, because without this step, the coherence is identically 1 at all scales and times [57,62]. The smoothing is achieved by a convolution in the time and scale.
The phase difference is defined as
ϕ x , y = t a n 1 I W m x y a R W m x y a , ϕ x , y π , π
Phase arrows are plotted only where the coherence exceeds the critical threshold (α = 0.05), ensuring interpretation is based on statistically significant synchronisation [57,63].

3.2. Interpretation of Wavelet Coherence Plots

In the context of our study (comparing energy price inflation in Poland with that in other countries), the wavelet coherence with a phase difference was our primary tool. We interpreted the wavelet coherence plots as follows:
  • Wavelet coherence magnitude: In the coherence plots, the colour indicates the strength of the relationship between the two series (as per the scale labelled “Magnitude-Squared Coherence”). Yellow-orange areas denote high coherence (values close to 1), meaning strong synchronisation between Poland and the given country at those frequencies and times. Blue areas denote low coherence, suggesting a weak relationship or no relationship at those frequencies/times.
  • Time and period axes: The vertical axis shows the period (in months) corresponding to the oscillations, allowing us to distinguish short-term cycles (approximately 2–6 months), medium-term cycles (6–24 months), and long-term cycles (24 months or more). The horizontal axis shows the time, covering January 2001 to December 2024.
  • Phase arrows: The arrows on the coherence plots indicate the phase difference between the two series (Poland = series X, the other country = series Y). The direction of the arrows conveys the leading–lagging relationship and whether the movements are in phase or anti-phase. Specifically, they mean the following:
    Rightward arrow (→): X and Y are in phase (move together).
    Leftward arrow (←): X and Y are in anti-phase (when one increases, the other decreases).
    Arrow pointing up or down (↑ or ↓): A 90° phase difference, meaning that one series leads the other by a quarter cycle (↑ means that Y leads X by 90°; ↓ means that X leads Y by 90°).
    Arrow pointing northeast (↗): Y leads X, and the changes are in the same direction (i.e., Y is ahead of X, with both trending similarly).
    Arrow pointing southeast (↘): X leads Y, with changes in the same direction.
    Arrow pointing northwest (↖): Y leads X, with changes in opposite directions.
    Arrow pointing southwest (↙): X leads Y, with changes in opposite directions.
Figure 1 provides an illustration of the full range of possible phase differences and their appearance in a wavelet coherence plot. Areas outside the cone of influence (beyond the white contour line in the plots) indicate regions where edge effects make the results less reliable; we focused our interpretation on the regions within the cone of influence (i.e., where the analysis was robust).
Using these methods and interpretations, we analysed the coherence between Poland’s energy price inflation series and those of each of the 27 other EU countries (plus the EU and Euro Area aggregates). We aimed to answer the following research questions (RQs):
RQ1:
When—during which sub-periods and at which periodicities (short-, medium-, or long-term)—did strong relationships exist between Poland’s energy inflation and another country’s energy inflation? In other words, we identified the time intervals and frequency ranges where the wavelet coherence was high.
RQ2:
What was the temporal ordering of movements between Poland and the other country—did one lead or lag the other, and if so, which one? This pertained to the phase difference: if significant coherence was found, we determined whether Poland’s series was leading or lagging.
We addressed these questions by examining the wavelet coherence graphs for each country pair and summarising our findings in the Results Section. The observed lead–lag relationships reflect time–frequency co-movement and similarity, not causality. Consequently, our results identify dynamic patterns but do not allow for strict causal inference.

4. Results

Based on the wavelet coherence analysis with phase differences (examining Figure A1, Figure A2, Figure A3, Figure A4, Figure A5 and Figure A6), we can draw detailed conclusions about the similarity and interdependence of energy price inflation processes between Poland and other European countries (as well as the EU and Euro Area aggregates) over the period of 2001:01–2024:12 (n = 288 months).

4.1. Significant Wavelet Coherence

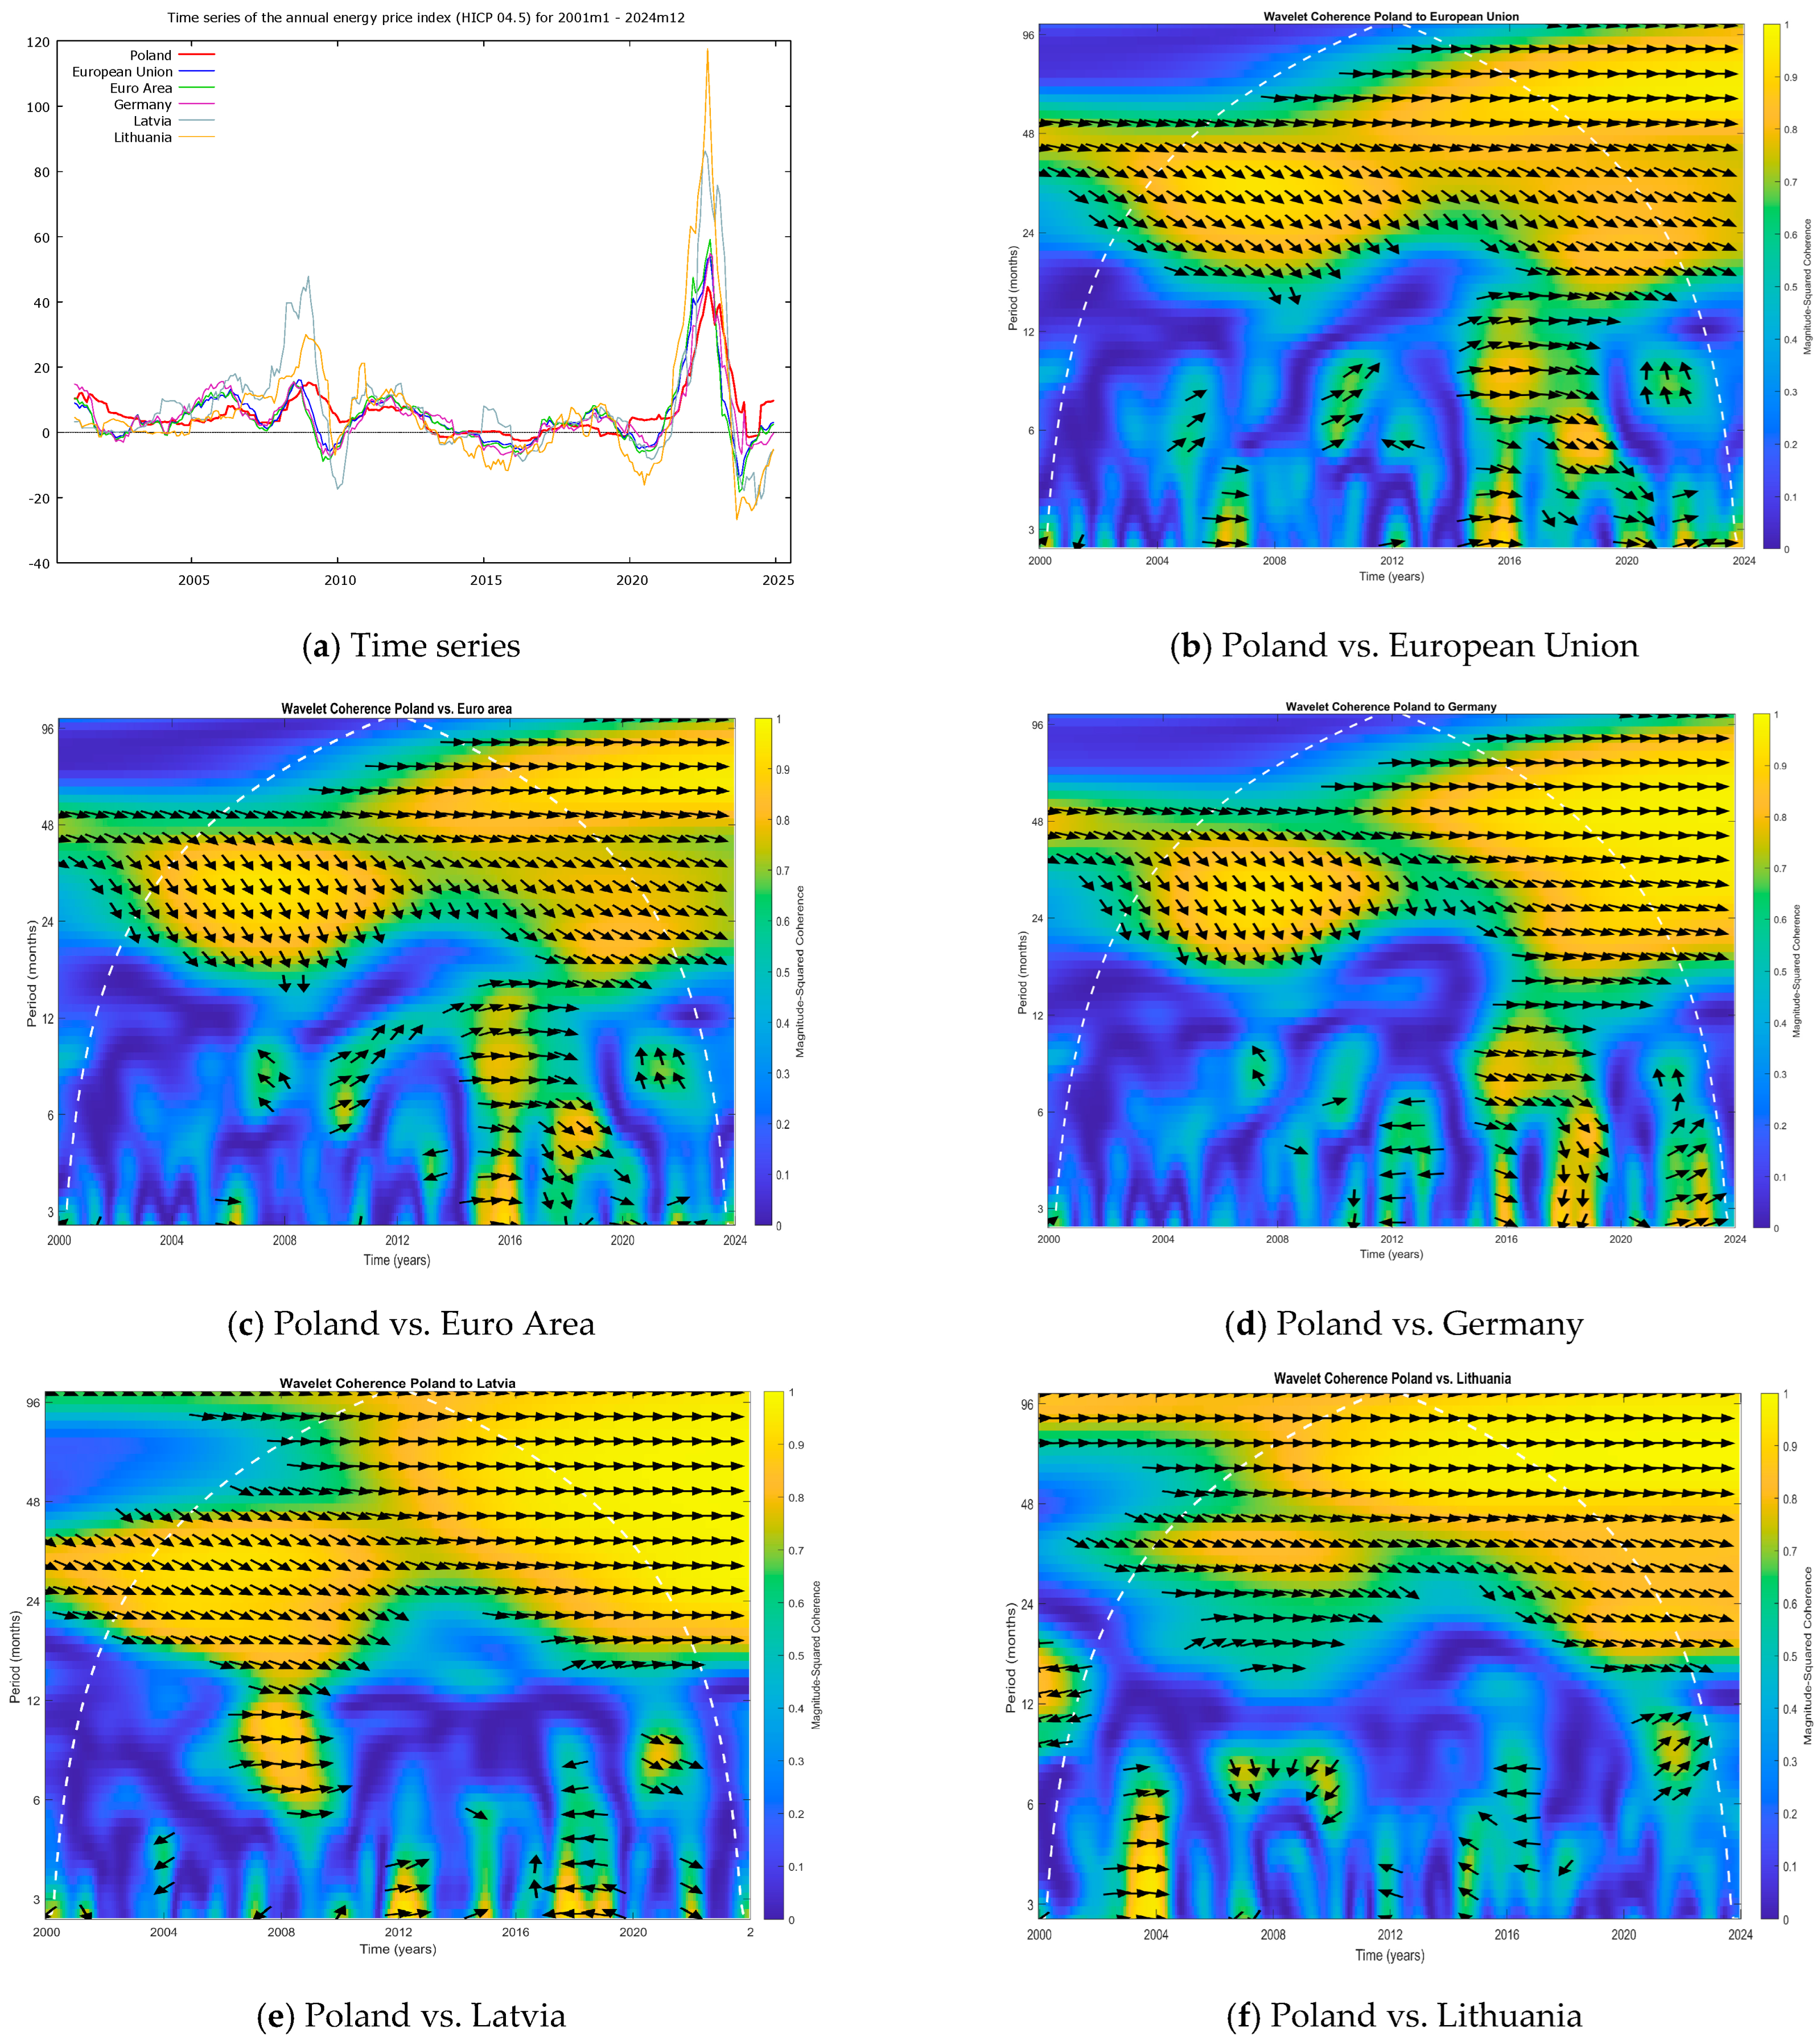
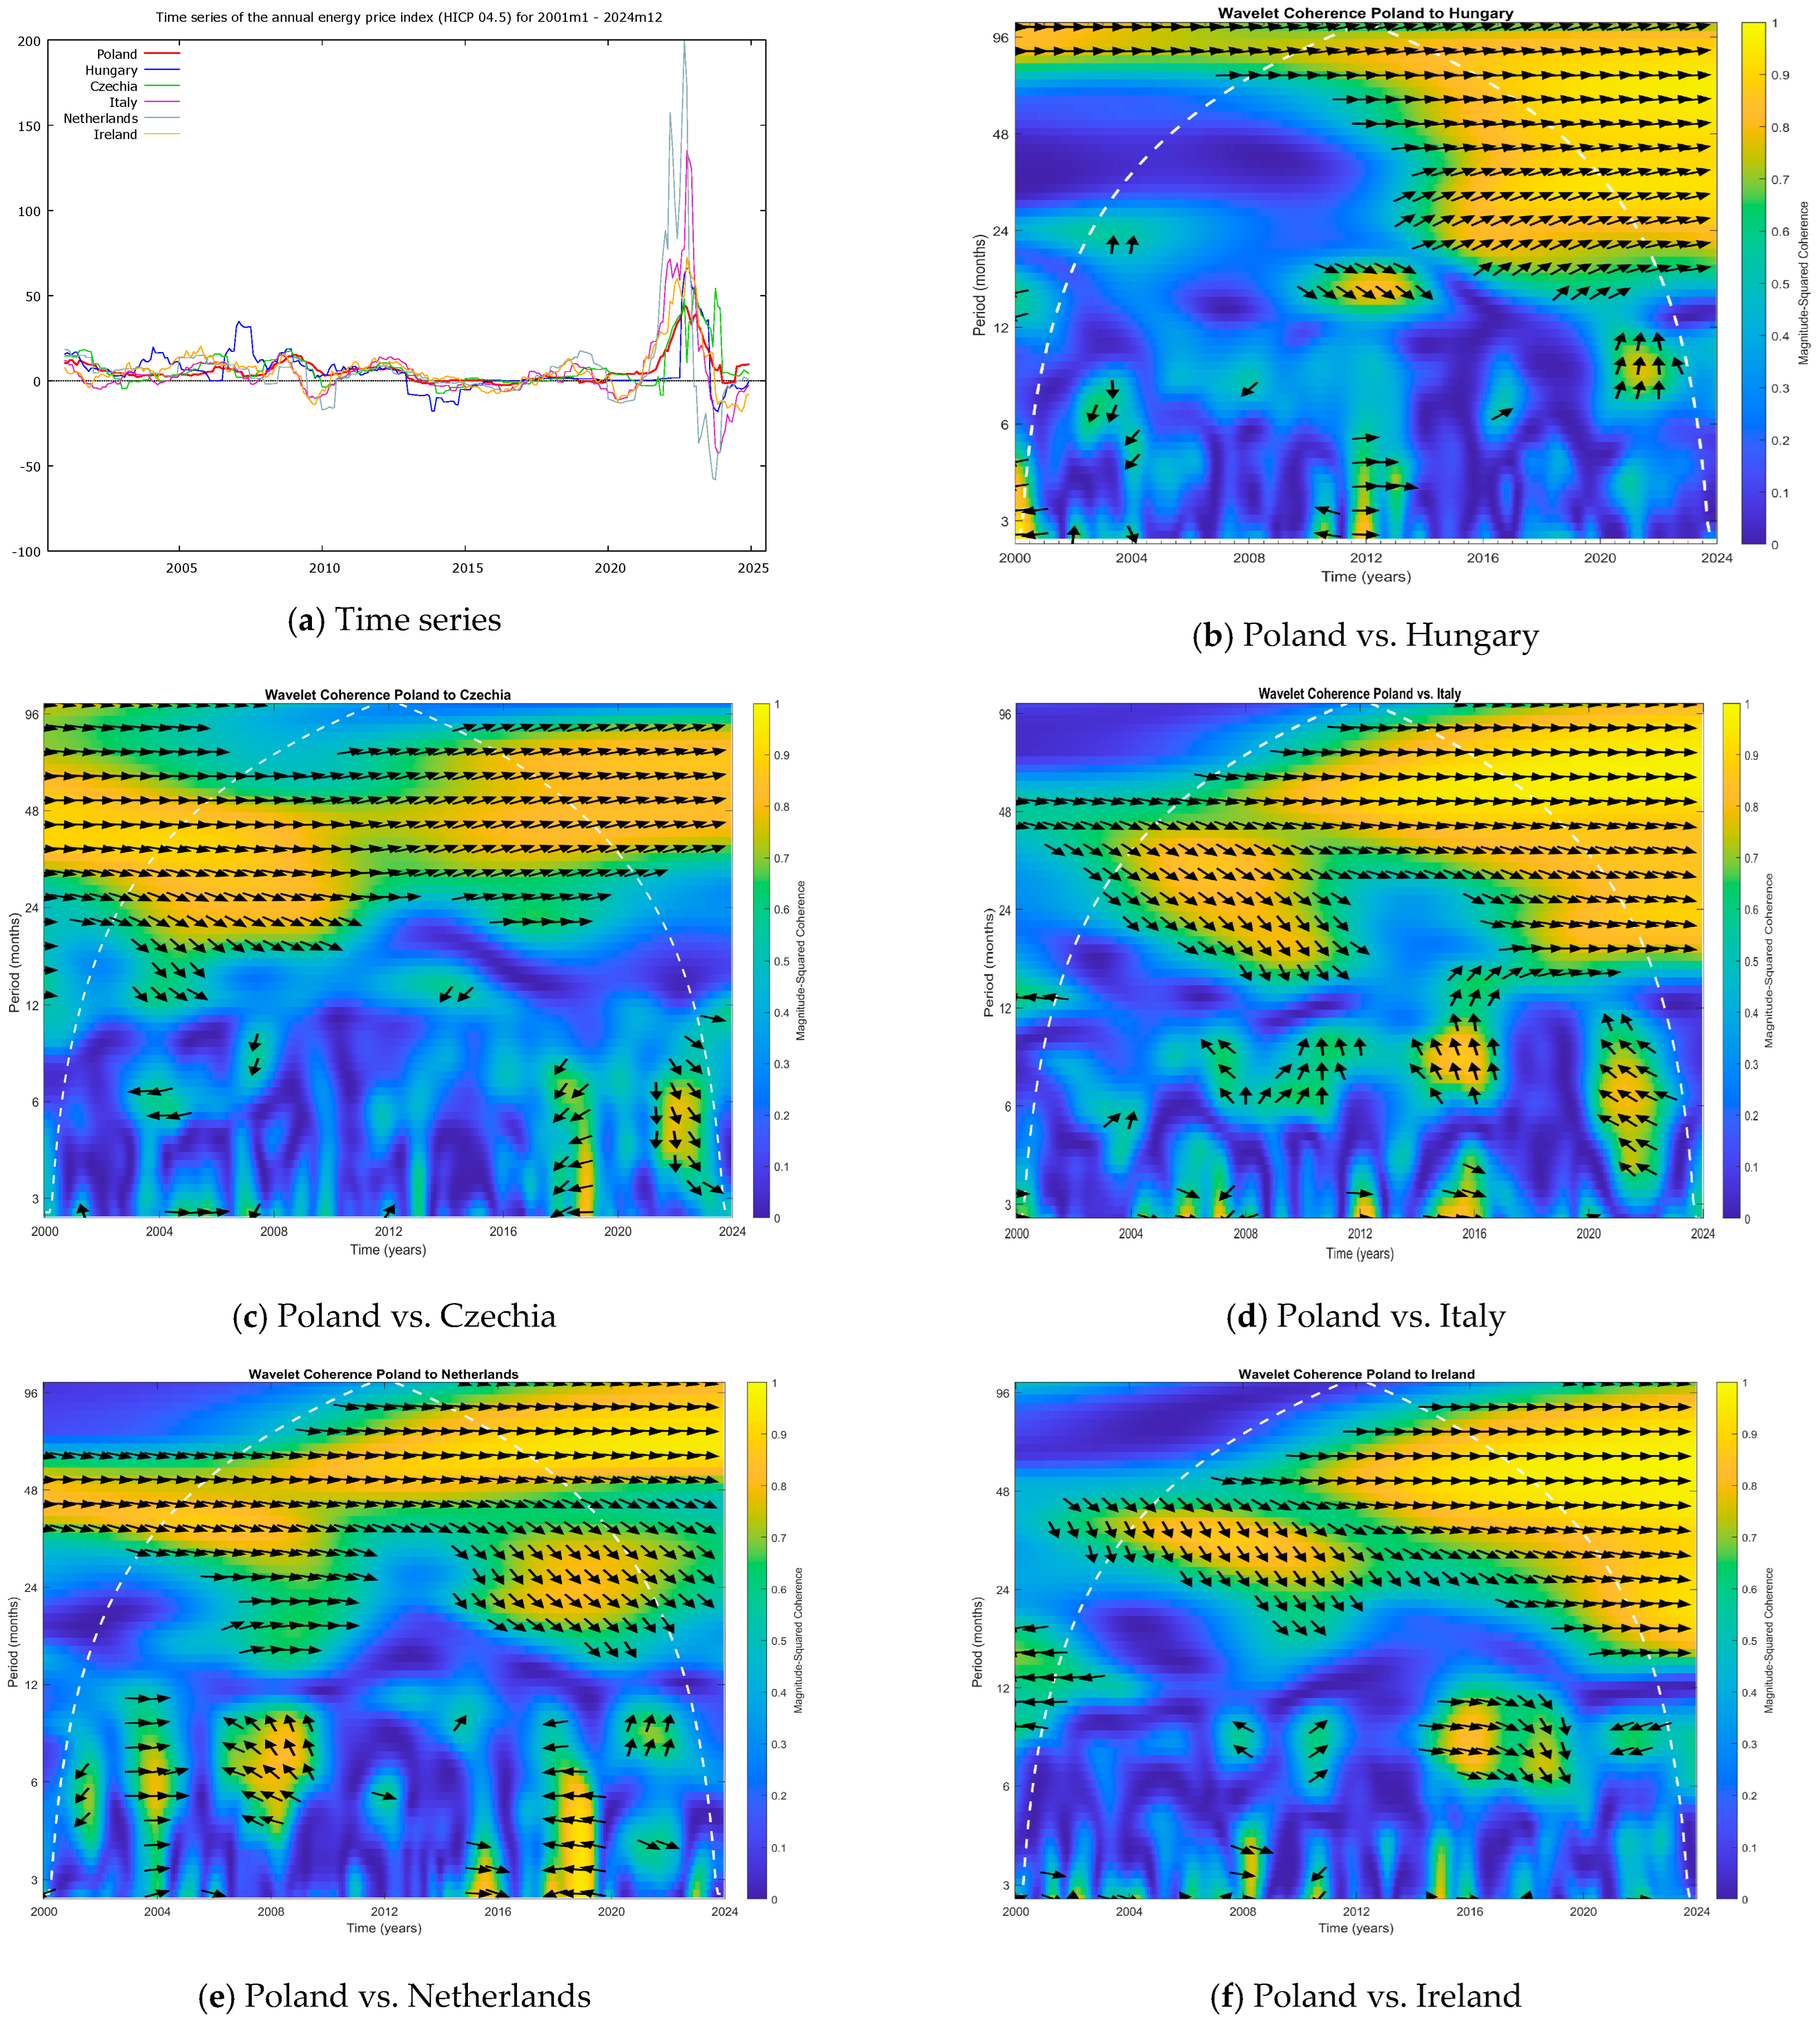
In the vast majority of the analysed countries, significant wavelet coherence with Poland was observed, particularly during crisis periods (e.g., 2008–2012, 2020–2021, and 2022–2024). This indicates that energy prices experienced common, synchronised shocks across much of Europe during these times. The strongest coherence (indicated by yellow-orange colours on the coherence plots) was found for several countries, notably Germany (Figure A1d), Latvia (Figure A1e), Lithuania (Figure A1f), Hungary (Figure A2b), Czechia (Figure A2c), and Italy (Figure A2d), as well as the European Union aggregate (Figure A1b) and the Euro Area aggregate (Figure A1c).
These high-coherence instances often coincided with major events impacting the energy prices. For example, during the 2022–2024 period (associated with the war in Ukraine and the ensuing energy crisis), Poland’s energy inflation was strongly coherent with that of Germany, Czechia, and several other countries, reflecting a pan-European shock in energy prices.

4.1.1. Countries Leading Energy Inflation in Poland (Potential Barometers)

Phase angle (phase difference) analysis revealed that Poland’s inflation dynamics lagged behind those of certain countries—i.e., prices tended to rise earlier in those countries than in Poland. These countries could serve as early-warning indicators (leading indicators) for changes in energy prices in Poland. Specifically, the countries which Poland lagged behind and the time–frequency ranges in which it did so were as follows:
  • 2–6-month periodicity: Lithuania (Figure A1f, leading in 2002–2005), Germany (Figure A1d, leading in 2022–2024), and Hungary (Figure A2b, leading in 2011–2014).
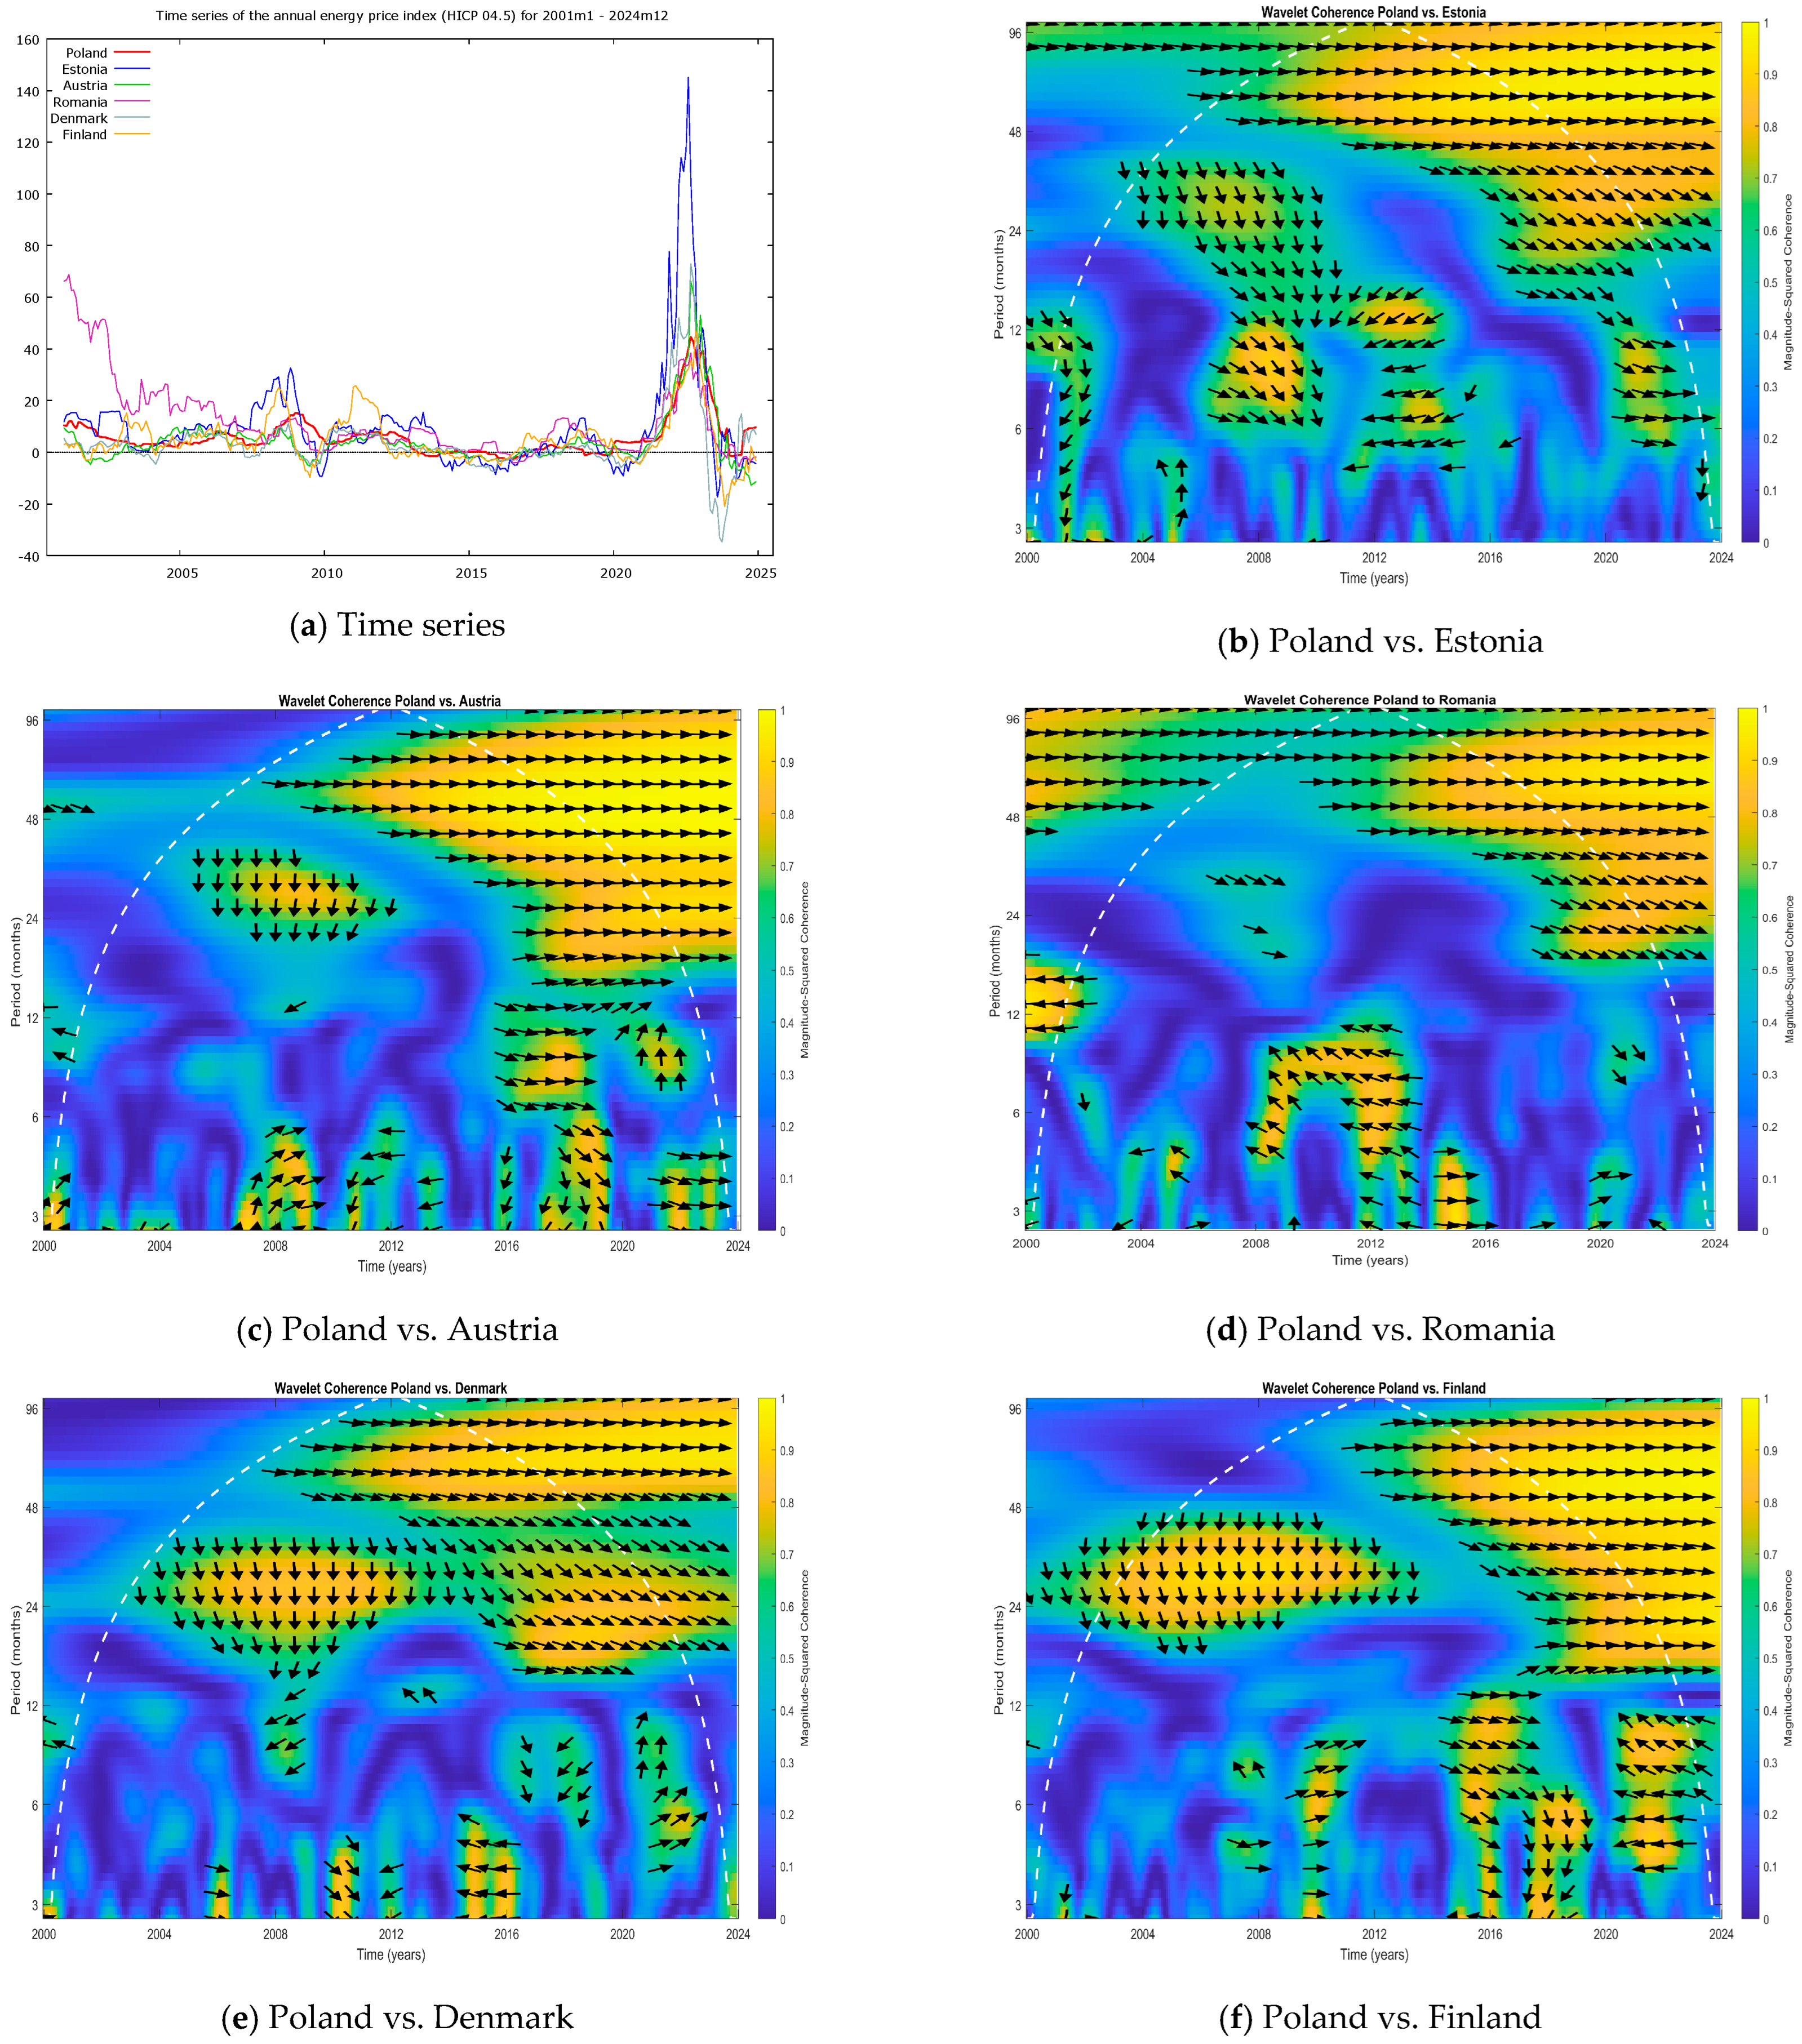
  • 6–24-month periodicity: Germany (Figure A1d, leading consistently in 2013–2024), the Netherlands (Figure A2e, 2006–2024), the EU aggregate (Figure A1b, 2014–2024), and Austria (Figure A3c, 2016–2024).
  • 24+-month periodicity: Germany (Figure A1d, shown to be leading in 2001–2024), Lithuania (Figure A1f, 2004–2024), Latvia (Figure A1e, 2008–2024), the EU aggregate (Figure A1b, 2008–2024), and the Euro Area aggregate (Figure A1c, 2008–2024).
These findings suggest that Germany and Lithuania, in particular, often experience energy price inflation changes ahead of Poland across various time scales. Along with countries like Latvia, the Netherlands, and Austria and the broader EU/Euro Area indices, they may act as barometers for upcoming inflationary trends in Poland’s energy prices.
The observed relationships differed across the short-term (2–6 months), medium-term (6–24 months), and long-term (24+ months) horizons, allowing us to distinguish countries that responded rapidly from those showing delayed adjustments.

4.1.2. Countries Lagging Behind Poland in Regard to Energy Inflation (Reactive Countries)

Conversely, the analysis indicated that several countries showed changes in their energy prices only after similar changes had occurred in Poland, suggesting that these countries may be reactive to Poland’s inflation dynamics (i.e., Poland leads and they lag). The countries and periodicities for which this pattern was observed include the following:
In these cases, Poland’s energy inflation could be seen as a leading indicator for subsequent changes in the listed countries. For example, Bulgaria and Croatia exhibited short-term lags, meaning that Poland’s price spikes were followed by theirs within a few months. Southern European countries like Spain, Portugal, and Greece, as well as Ireland and Cyprus, tended to follow Poland over longer cycles, possibly reflecting structural differences or delayed transmission of energy price shocks.

4.2. Crisis Sub-Periods and Price Dynamics Analysis

An analysis of the price dynamics across Europe revealed that the 2001–2024 period could be divided into three key crisis sub-periods with different causes and characteristics. These were (1) the 2008–2012 global financial crisis, (2) the 2020–2021 COVID-19 pandemic period, and (3) the 2022–2024 energy crisis associated with Russian aggression against Ukraine. For each sub-period, we identified countries with energy price dynamics similar to those of Poland:
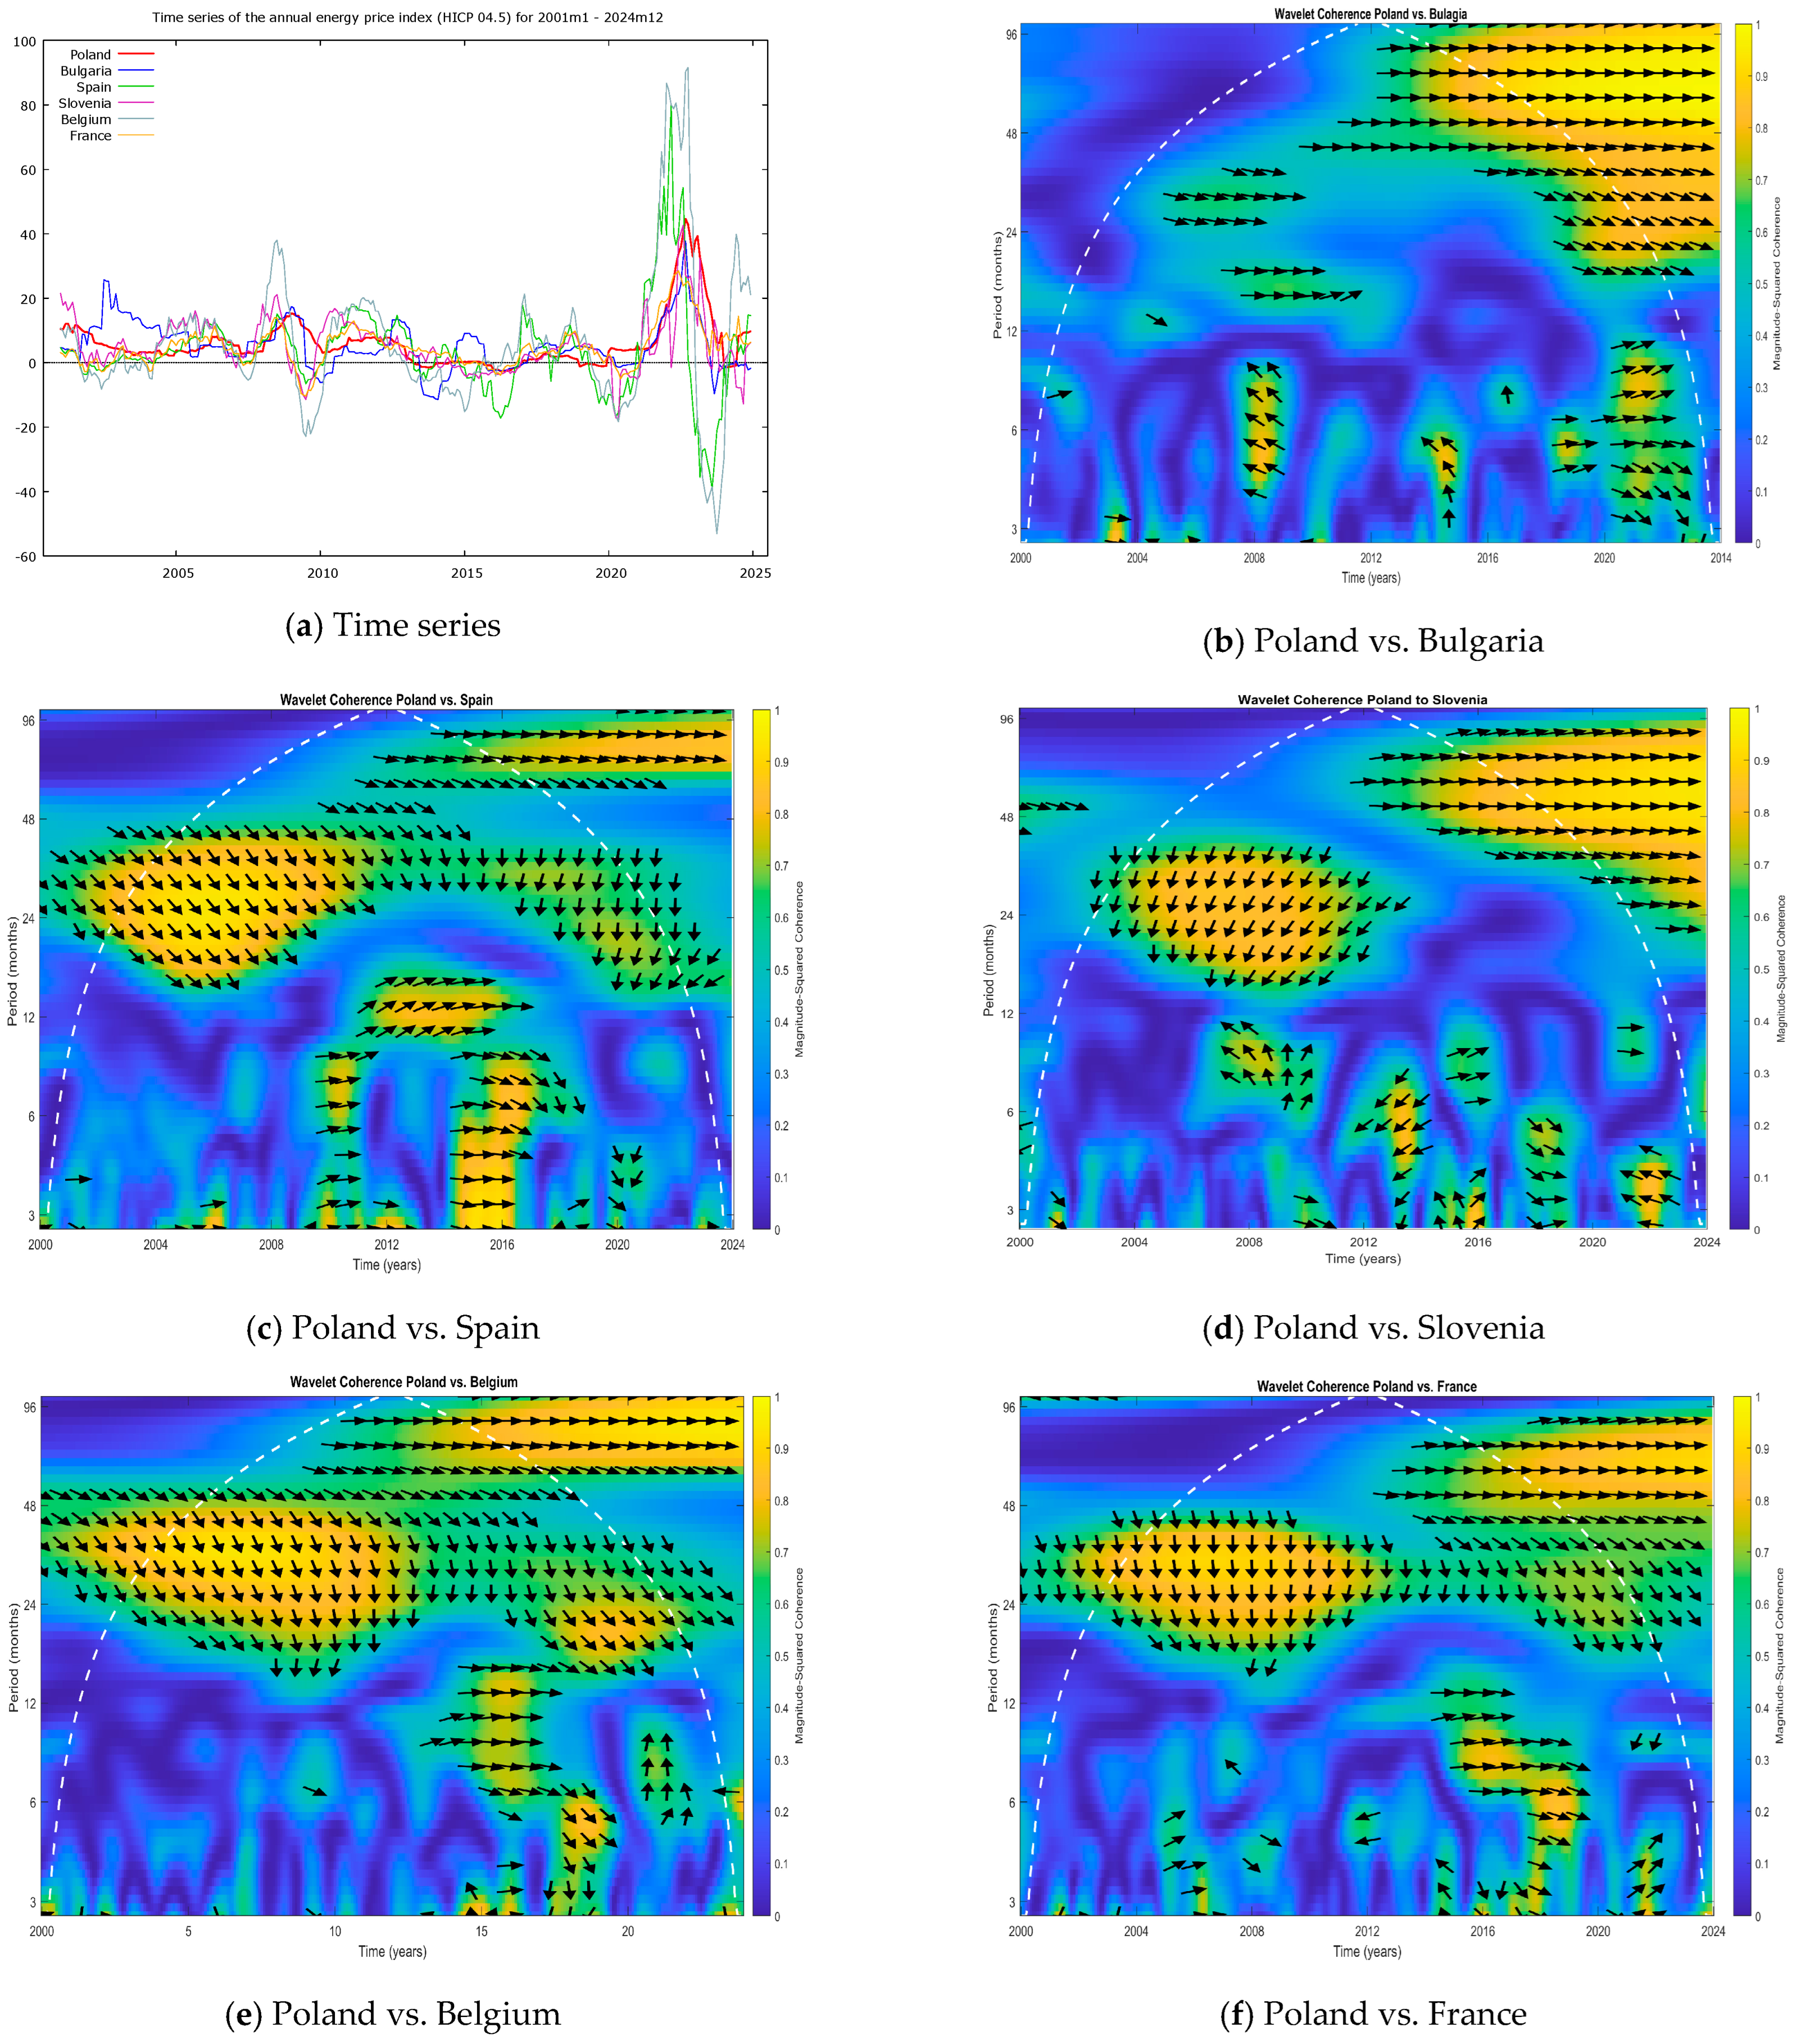
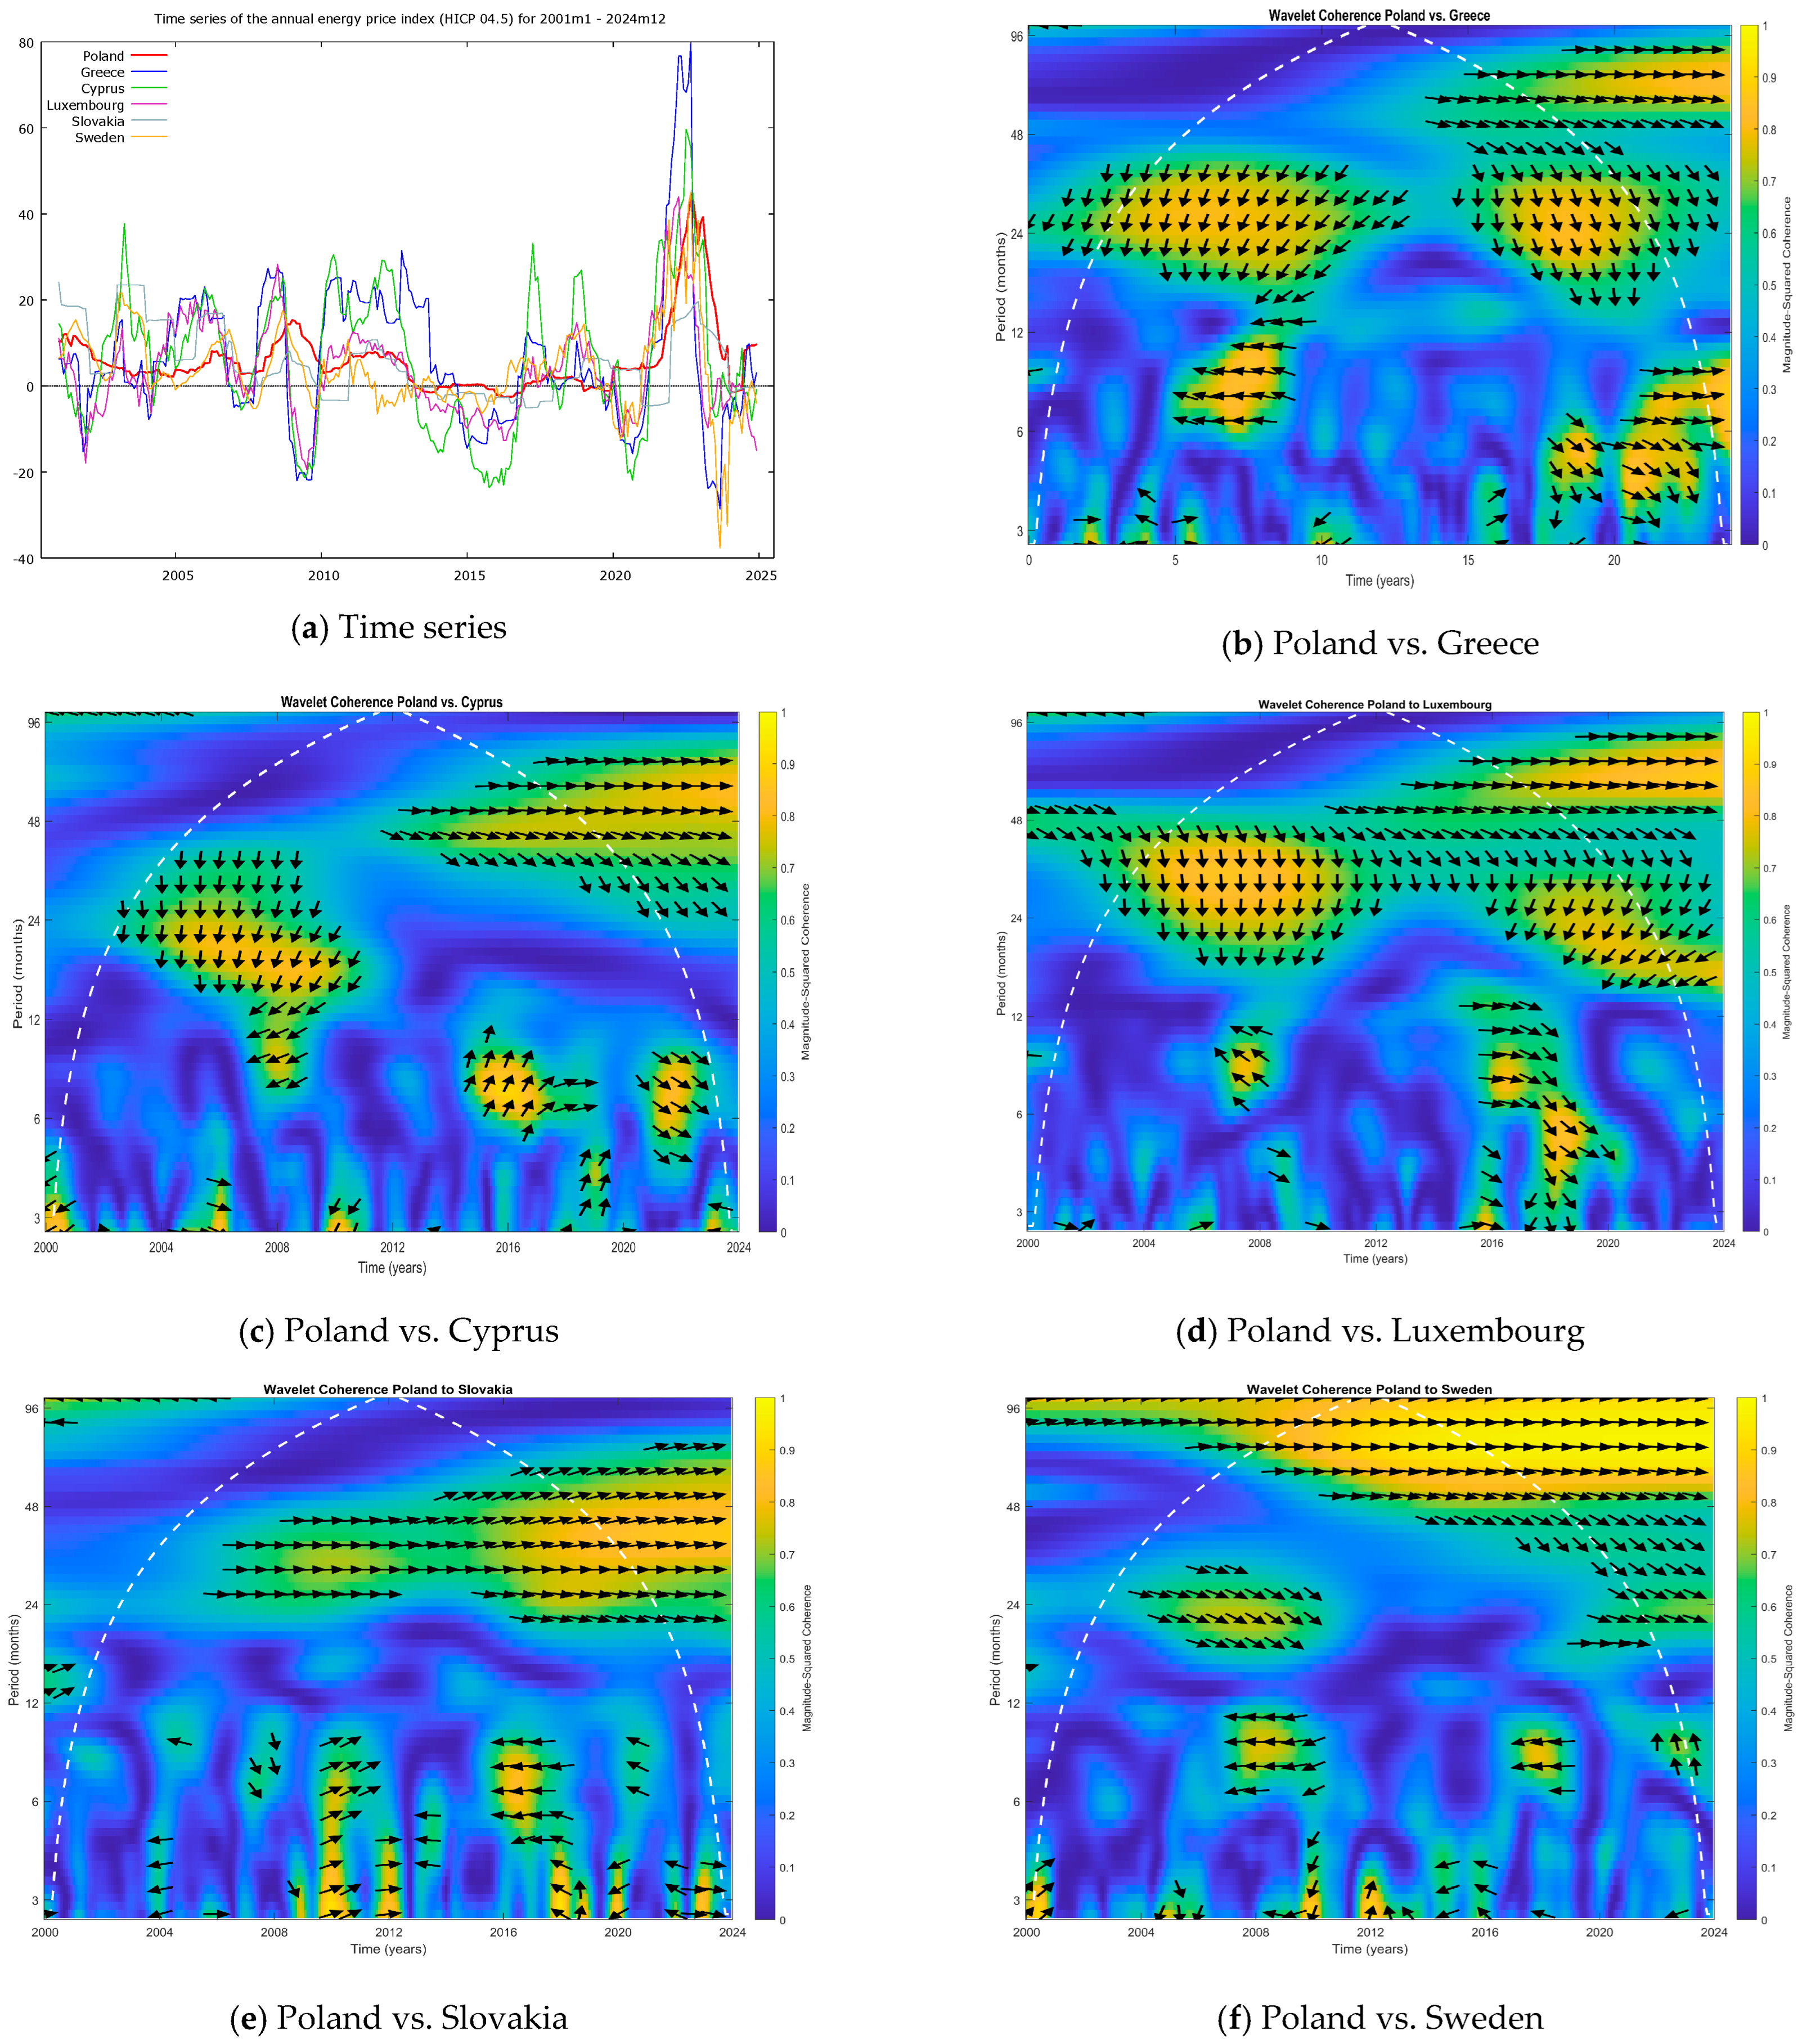
  • Financial crisis (2008–2012): During this period, Poland’s energy inflation dynamics showed the strongest similarities with Central and Eastern European (CEE) countries such as Czechia (Figure A2c), Slovakia (Figure A4d), and Hungary (Figure A2b). Notably, there was also strong coherence with Germany (Figure A1d) and Lithuania (Figure A1f) in this sub-period. This suggests that the financial crisis triggered a regionally synchronised response in energy prices, linking Poland with its regional neighbours in particular and major EU economies like Germany.
  • COVID-19 pandemic (2020–2021): In this sub-period, Poland’s energy inflation showed convergence in its dynamics with countries like Germany (Figure A1d), the Netherlands (Figure A2e), and France (Figure A4f). In contrast, some southern European countries, specifically Spain (Figure A4c) and Greece (Figure A5b), experienced much lower energy inflation dynamics. In other words, Poland’s pattern was more closely aligned with that of the core EU countries, whereas parts of southern Europe were somewhat insulated from or experiencing a delay in this particular shock, possibly due to different energy mixes or policy responses during the pandemic.
  • Energy crisis (2022–2024): This period, encompassing the fallout from the war in Ukraine and the resulting energy shortages and price spikes, saw very high synchronisation across nearly the entire EU (Figure A1b). Poland’s energy inflation was especially strongly coherent with that of Germany (Figure A1d), Czechia (Figure A2c), Estonia (Figure A3b), and Slovakia (Figure A4d) during this time. Essentially, the shock was Europe-wide, and Poland’s experience was closely mirrored in both neighbouring countries and some more distant ones.
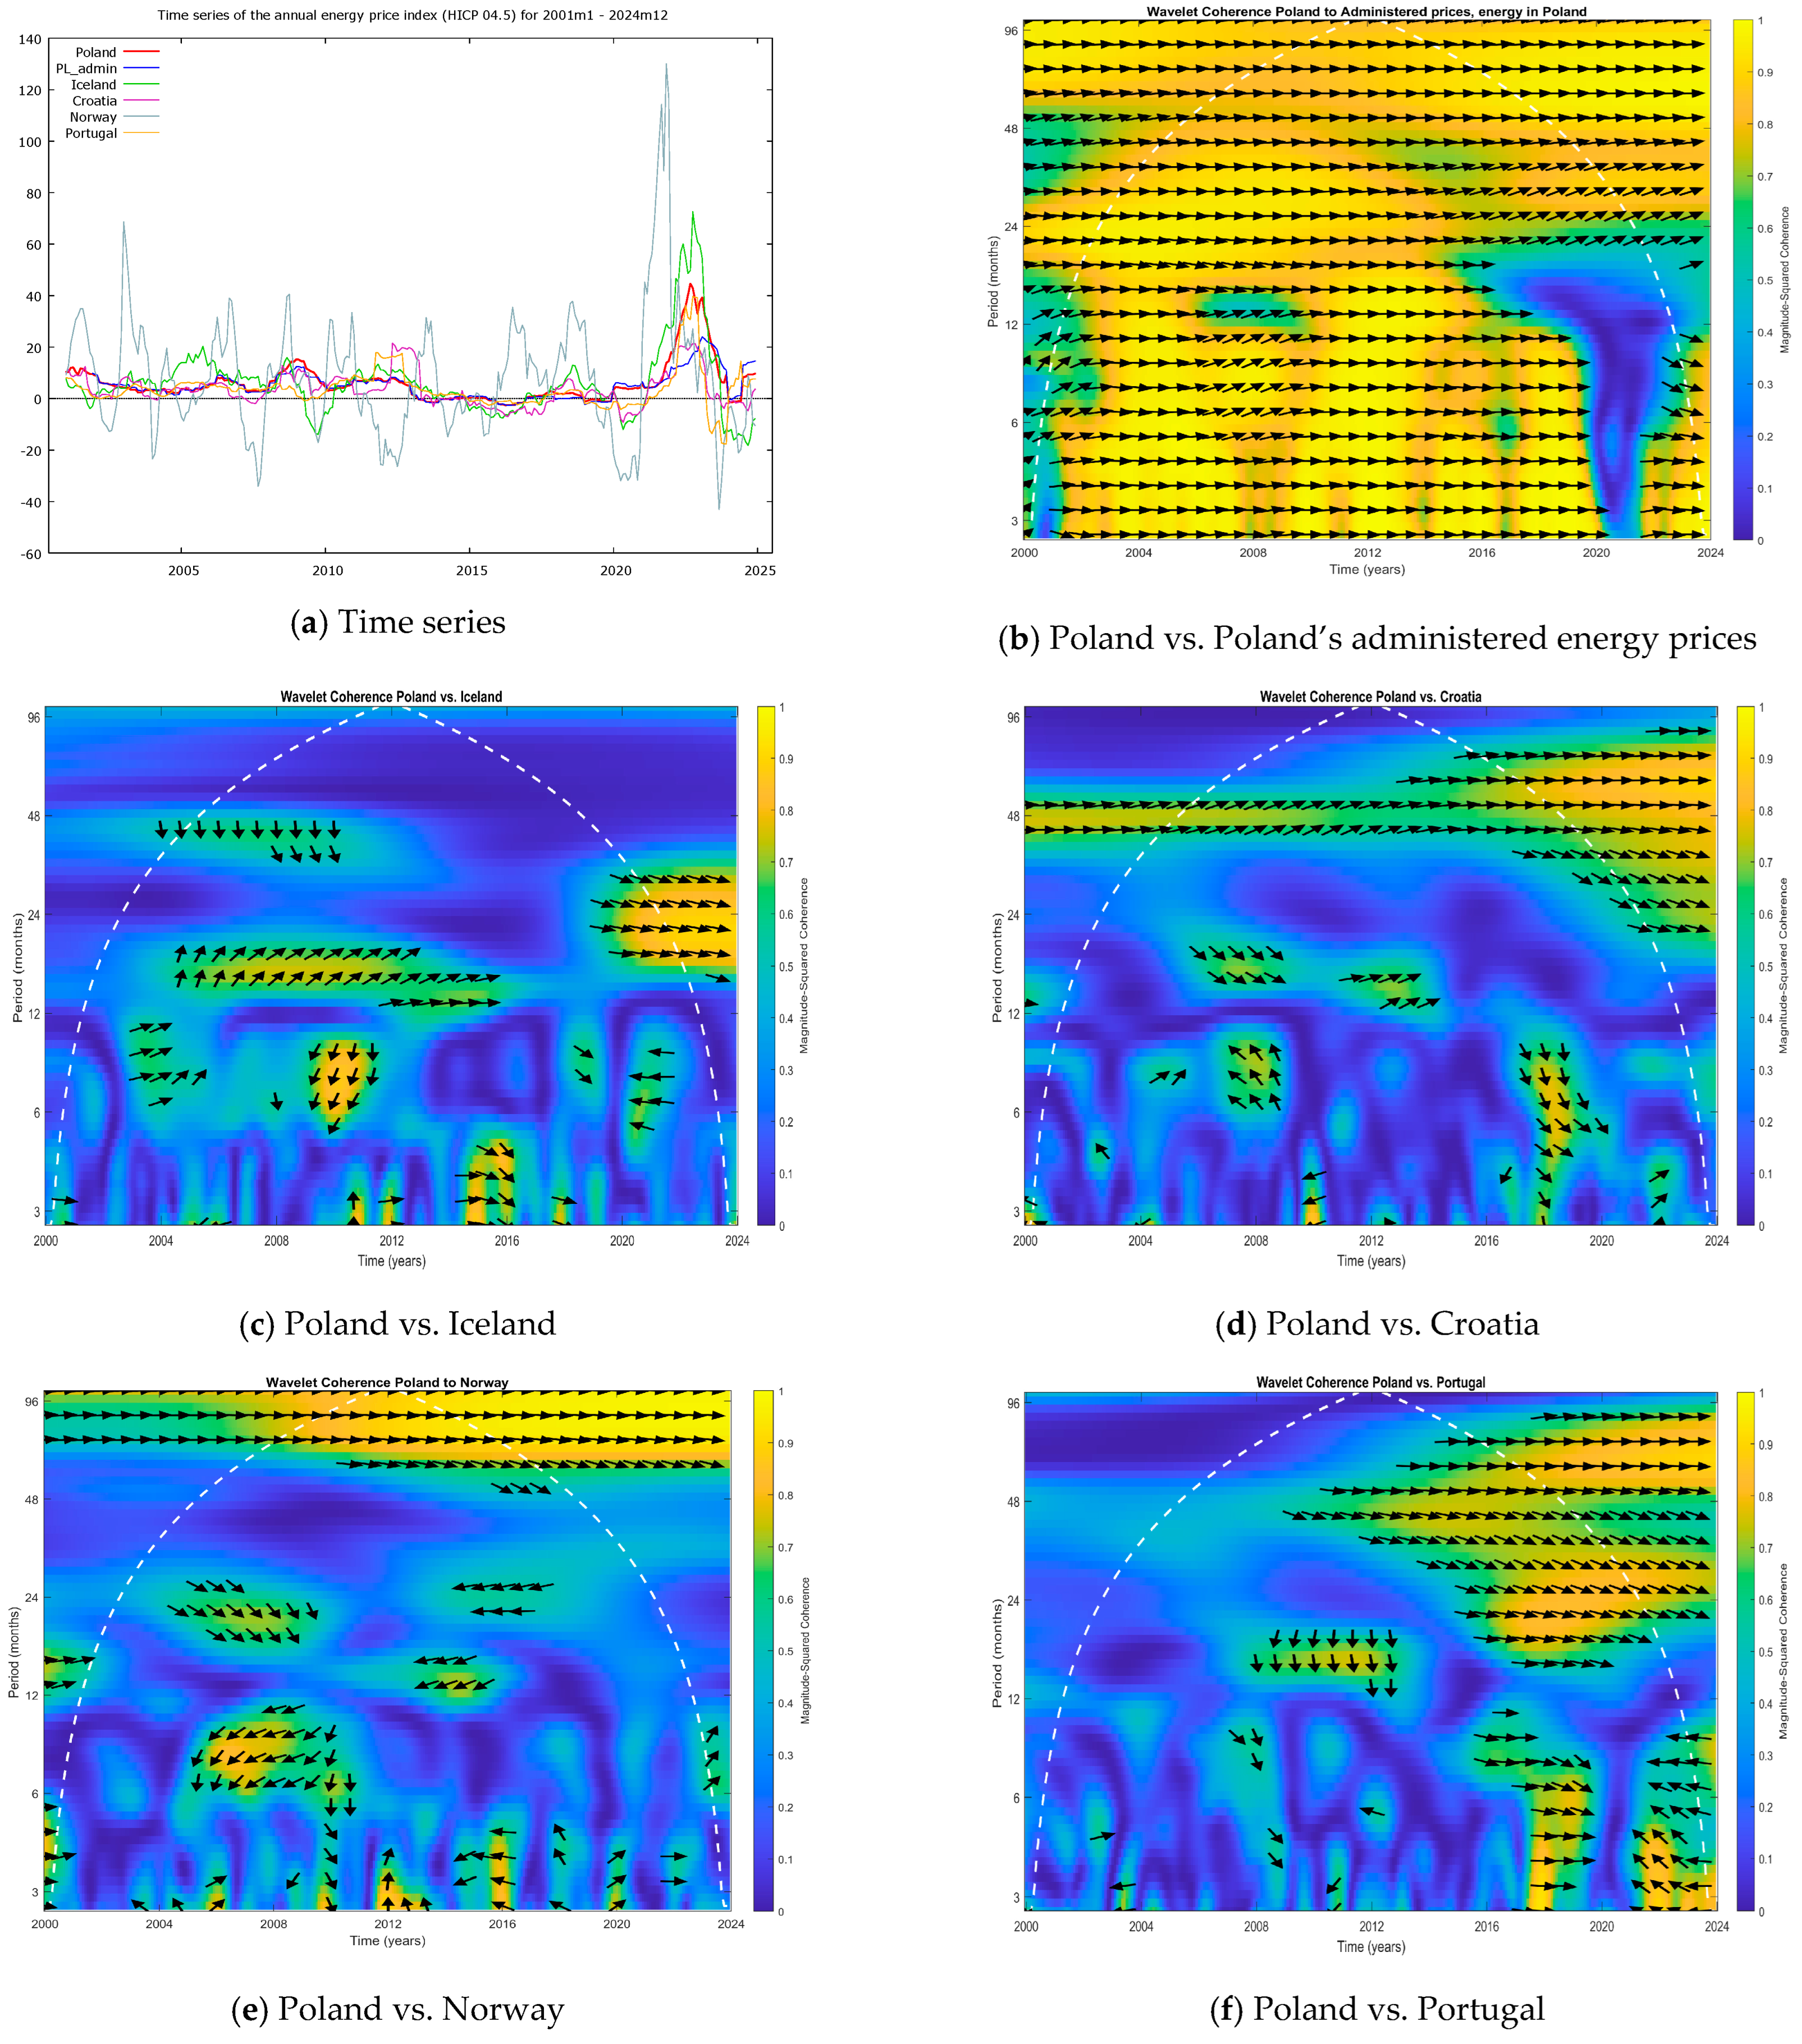
It should be noted that the above sub-period characterisation does not perfectly fit the Scandinavian countries (Sweden, Finland, Norway), which displayed more heterogeneous price dynamics. For instance, Sweden (Figure A5f), Finland (Figure A3f), and Norway (Figure A6e) did not conform neatly to the three phases identified, likely due to their unique energy mixes (e.g., Norway’s heavy reliance on hydropower, Sweden’s nuclear and hydro mix, etc.) and specific national policies. These countries exhibited a different timing or magnitude in their inflation responses compared to Poland.

4.3. Country Groupings and Links to Energy Mix

Considering the measures of coherence, phase differences, and price dynamics during the key sub-periods, we can classify the countries into four similarity groups with respect to Poland’s energy inflation dynamics. Each group shares certain characteristics in terms of their relationship to Poland and their energy mix:
Group A—Leading countries with high coherence: This group includes Germany, Czechia, Lithuania, Hungary, and Romania. These countries are highly correlated with Poland’s energy price index and often lead Poland (as identified in Section 4.1.1). Energy mix characteristics: They have a high dependence on natural gas and similar supply conditions (many are Central and Eastern European countries with comparable energy infrastructure and dependencies).
Group B—Lagging countries with medium coherence: This group consists of Bulgaria, Croatia, Spain, and Portugal. They show a moderate degree of coherence with Poland but generally lag behind Poland’s changes (as described in Section 4.1.2). Energy mix characteristics: These countries have a higher share of renewable energy sources (RESs) and lower dependence on Russian gas supplies, which might have buffered or delayed the transmission of shocks that strongly hit Poland.
Group C—Synchronous during crises, but have a low long-term correlation: This group includes Greece, Ireland, Cyprus, and Norway. They tend to align with Poland during major crises (showing coherence spikes during those periods) but have a lower correlation with Poland in the long run. Energy mix characteristics: They rely heavily on either renewable or domestic energy resources. For example, Norway’s energy prices are dominated by hydropower (and it is not in the EU), which gives it a distinct profile, and Ireland and Cyprus also have unique energy supply situations (island nations with specific energy policies).
Group D—Stabilising countries with varied responses: This includes France, Austria, and Finland. These countries have somewhat varied responses that do not always move in sync with those of Poland and sometimes act to stabilise the regional price dynamics. Energy mix characteristics: They have a high share of nuclear power (especially France and to some extent Finland) and/or significant regulated (administered) pricing in their energy markets. These factors tend to dampen price volatility and can decouple their inflation dynamics from market-driven shocks that affect Poland.

4.4. Poland’s Energy Prices and Administered Price Controls

A special case in our analysis was the comparison between Poland’s standard energy price index and its administered energy price index (the PL_ADM series). Figure A6b indicates a very strong relationship between Poland’s market-indexed energy prices and the administered (government-regulated) energy prices across all the frequency ranges (short-, medium-, and long-term) and over the entire analysis period, except for a notable disruption during the 2020–2024 energy crisis. This strong linkage is attributed to substantial government subsidies for coal production, which underpins electricity and heat generation in Poland, effectively tying the administered prices to the market conditions most of the time.
The charts also reveal characteristic delays in Poland’s energy price inflation responses, which result from several factors:
Administrative price setting: Regulated tariffs set by the Energy Regulatory Office (URE) can delay the pass-through of market price changes to consumers.
Subsidisation of energy costs during crises: For instance, in 2022–2023 the government intervened heavily (subsidies, tax reductions, price caps) to shield consumers from the full brunt of the energy crisis.
Energy mix dependency: Poland’s heavy reliance on coal in its energy mix means that domestic production can buffer short-term shocks, but also that adjustments (when they come) may be abrupt if coal prices or policy subsidies change.
In the administered price index plot (Poland vs. Poland’s administered prices, Figure A6b), one can clearly observe a “flattening” of the inflation curve at moments when other European markets reacted sharply (for example, at the start of the war in Ukraine in early 2022, when energy prices spiked internationally). During these moments, Poland’s administered price index remained comparatively flat due to government measures that kept consumer prices artificially low. This created a divergence in the short term, though eventually the pressures did affect Poland (as seen when the coherence was disrupted during 2020–2024). Once the extraordinary measures were lifted or adjusted, the administered prices in Poland caught up, realigning with the market-based index, hence the overall long-term coherence between the two series.

5. Discussion

In 2019, the European Commission introduced the “Clean Energy for All Europeans” package. This initiative outlined strategic directions for energy policy aimed at accelerating the transition from fossil fuels to cleaner energy sources while fulfilling the objectives of the broader Fit for 55 agenda [65]. The Fit for 55 package encompasses a wide range of policy areas—including energy, the climate, transport, and taxation—and sets out pathways to achieve the updated 2030 climate and energy targets.
The successful implementation of these EU-wide objectives is expected to reduce the divergence in household energy price indices across member states. In practical terms, this means we would anticipate not only convergence in long-term energy price trends, but also increasing alignment in short-term price dynamics. In other words, as countries adopt more similar energy mixes (e.g., more renewables, less reliance on a single supplier such as Russia for gas) and implement shared policies (like EU-wide carbon pricing), energy price index trajectories should become more harmonised across Europe. In such a scenario, the cost of CO2 emission certificates or other common inputs would affect countries more uniformly, and no single country’s inflation would be as sharply different from another’s. Thus, a shock (or a policy measure) would be transmitted in a more synchronised manner, potentially making individual countries less of outliers.
Applying wavelet analysis to study the convergence of energy price processes over a 24-year span has proven to be an appropriate methodology. It has allowed us to capture both short-run and long-run dynamics and how they evolve.
Wavelet analysis is particularly appropriate as it captures time-varying co-movement and phase differences in the short-, medium-, and long-term frequency bands. In addition to identifying the overall coherence, our analysis explicitly separated the short-term, medium-term, and long-term dynamics, supplementing our basic descriptive analysis with a structured frequency-based perspective. This provides deeper insights into the temporal mechanisms of inflation synchronisation. Alternative methods, including cross-correlation, VAR, or Fourier spectral analysis, cannot capture temporal variations or do not provide phase information.
As even longer time series become available (e.g., in the coming decade, which will include post-2024 data and the effects of Fit for 55 measures), it will be possible to evaluate more robustly the impact of EU policies on the stability and synchronisation of energy price indices across Europe. For instance, we could examine whether the high coherence observed during crises persists in more stable times and whether the lead–lag patterns we have identified (with some countries consistently ahead or behind) diminish as markets integrate.
The scientific novelty of the obtained results lies in the application of the wavelet coherence with a phase difference to the analysis of energy price inflation indices across European countries. This approach allowed us not only to assess the strength of co-movements but also to identify time-varying lead–lag relationships, which were largely overlooked in earlier studies. Our findings demonstrate that changes in Poland’s inflation dynamics are frequently preceded by changes in countries such as Germany and Lithuania, while other countries (e.g., Bulgaria or Spain) tend to follow the Polish pattern. By highlighting these systematic differences, this study closes a gap in the literature, which has so far concentrated mainly on static correlations or VAR-based analyses, without considering the frequency–time dimension. Moreover, the inclusion of both market-based and administered energy prices in Poland provides new insights into the role of regulatory interventions in shaping inflation dynamics. In this way, our paper contributes original empirical evidence to the discussion on inflation convergence, energy policy, and the synchronisation of economic processes within the European Union.
In sum, this discussion underscores that policy initiatives aimed at unifying energy markets and energy transitions (like the EU’s climate packages) may lead to greater price coherence among countries. If Poland’s energy inflation has often been out of phase with, say, that in France or Spain due to different energy policies or mixes, a more unified policy could bring those patterns closer together. However, we should also note that natural experiments (like crises) show both the value of integration and the risks of interdependence—while coherence means shared stability in good times, it can also mean shared vulnerability in bad times. The challenge for policymakers is to ensure that greater synchronisation comes from resilience (e.g., broad adoption of renewables and storage) rather than just shared exposure to volatile fossil fuel markets, exchange rate fluctuations, or national price interventions. Such studies should form the basis for future expanded analyses that include structural modelling along with forecasts. Future studies could apply time–frequency forecasting methods to decomposed components of energy price inflation to evaluate the predictive utility of the observed lead–lag relationships.

6. Conclusions

Wavelet analysis has proven to be effective in identifying dynamic co-movements in energy price inflation across countries. In this study, we found that Poland’s energy inflation dynamics have distinct relationships with those of other European countries. Poland belongs to a group of countries that have the following characteristics:
  • They are reactive but temporally aligned with the CEE region: Poland often lags behind certain Central and Eastern European (CEE) countries in regard to energy inflation, yet moves broadly in sync with regional trends;
  • They are highly dependent on administered price policies: Domestic regulations (such as price controls and subsidies) play a significant role in Poland’s inflation dynamics, sometimes delaying or dampening the effect of global price shocks;
  • They show significant coherence during crises with key countries (notably Germany, Czechia, Slovakia, and Hungary): During major energy crises, Poland’s inflation rates moved closely with these countries, reflecting shared shocks and, possibly, coordinated responses.
This research highlights the usefulness of wavelet coherence analysis in uncovering nuanced lead–lag relationships that vary over time and frequency. For policymakers, our findings suggest that Poland could look to certain countries (like Germany or Lithuania) as early indicators of inflationary trends and be mindful that others might be affected after Poland (like Bulgaria or Spain).
Our results provide practical implications for policymakers. Countries identified as leading energy inflation can serve as early indicators for Polish energy prices, enabling preemptive measures. Countries lagging behind may benefit from monitoring Polish dynamics. These insights support regional coordination of energy policies and the mitigation of price shocks. However, greater synchronisation implies shared exposure to risks, which should be considered in policy planning.
Further research is recommended to deepen our understanding of the drivers behind these relationships. In particular, examining the structure of the energy mix (e.g., the share of renewables vs. fossil fuels, import dependencies) and tariff regulations in each country could shed light on why some countries lead and others lag. These factors are likely key moderators of energy inflation dynamics. As the energy landscape evolves—especially with the ongoing transition to renewable energy and the implementation of EU-wide policies like Fit for 55—updating this analysis in the future will be valuable to see if the patterns observed persist or change.

Author Contributions

Conceptualization, T.K.; Methodology, G.R.; Software, G.R.; Formal analysis, T.K.; Data curation, T.K.; Writing—original draft, T.K. and G.R.; Visualization, G.R. All authors have read and agreed to the published version of the manuscript.

Funding

This research received no external funding.

Data Availability Statement

The original contributions presented in the study are included in the article, further inquiries can be directed to the corresponding author.

Conflicts of Interest

The authors declare no conflict of interest.

Appendix A

Wavelet coherence figures for Poland vs. selected countries and groups. Each figure set (Figure A1, Figure A2, Figure A3, Figure A4, Figure A5 and Figure A6) contains (a) the time series of the annual energy price index (HICP 04.5) for Poland and five comparison series and (b–f) the wavelet coherence plots for Poland vs. each of those series.
Figure A1. (a) Time series of annual energy price index (HICP 04.5) for Poland, European Union, Euro Area, Germany, Lativia, and Lithuania. (bf) Wavelet coherence between Poland vs. (b) European Union, (c) Euro Area, (d) Germany, (e) Lativia, and (f) Lithuania. Phase arrows are drawn only where wavelet coherence exceeds critical threshold (significant at α = 0.05). Source: Data from Eurostat (database: PRC_HICP_MANR). Calculations performed in Matlab R2024b.
Energies 18 04610 g0a1
Figure A2. (a) Time series of annual energy price index (HICP 04.5) for Poland, Hungary, Czechia, Italy, Netherlands, and Ireland. (bf) Wavelet coherence between Poland vs. (b) Hungary, (c) Czechia, (d) Italy, (e) Netherlands, and (f) Ireland. Phase arrows are drawn only where wavelet coherence exceeds critical threshold (significant at α = 0.05). Source: Data from Eurostat (database: PRC_HICP_MANR). Calculations performed in Matlab R2024b.
Energies 18 04610 g0a2
Figure A3. (a) Time series of annual energy price index (HICP 04.5) for Poland, Estonia, Austria, Romania, Denmark, and Finland. (bf) Wavelet coherence between Poland vs. (b) Estonia, (c) Austria, (d) Romania, (e) Denmark, and (f) Finland. Phase arrows are drawn only where wavelet coherence exceeds critical threshold (significant at α = 0.05). Source: Data from Eurostat (database: PRC_HICP_MANR). Calculations performed in Matlab R2024b.
Energies 18 04610 g0a3
Figure A4. (a) Time series of annual energy price index (HICP 04.5) for Poland, Bulgaria, Spain, Slovenia, Belgium, and France. (bf) Wavelet coherence between Poland vs. (b) Bulgaria, (c) Spain, (d) Slovenia, (e) Belgium, and (f) France. Phase arrows are drawn only where wavelet coherence exceeds critical threshold (significant at α = 0.05). Source: Data from Eurostat (database: PRC_HICP_MANR). Calculations performed in Matlab R2024b.
Energies 18 04610 g0a4
Figure A5. (a) Time series of annual energy price index (HICP 04.5) for Poland, Greece, Cyprus, Luxembourg, Slovakia, and Sweden. (bf) Wavelet coherence between Poland vs. (b) Greece, (c) Cyprus, (d) Luxembourg, (e) Slovakia, and (f) Sweden. Phase arrows are drawn only where wavelet coherence exceeds critical threshold (significant at α = 0.05). Source: Data from Eurostat (database: PRC_HICP_MANR). Calculations performed in Matlab R2024b.
Energies 18 04610 g0a5
Figure A6. (a) Time series of annual energy price index (HICP 04.5) for Poland, Poland’s administered energy prices, Iceland, Croatia, Norway, and Portugal. (bf) Wavelet coherence between Poland vs. (b) Poland’s administered energy prices, (c) Iceland, (d) Croatia, (e) Norway, and (f) Portugal. Phase arrows are drawn only where wavelet coherence exceeds critical threshold (significant at α = 0.05). Source: Data from Eurostat (database: PRC_HICP_MANR). Calculations performed in Matlab R2024b.
Energies 18 04610 g0a6

References

  1. Raczkowski, K.; Komorowski, P. International Economic Policy for the Polycrisis; Routledge: London, UK, 2024. [Google Scholar] [CrossRef]
  2. Bátora, J.; Fossum, J.E. Differentiation and Dominance in Europe’s Poly-Crises; Routledge: London, UK, 2024. [Google Scholar] [CrossRef]
  3. Korzeb, Z.; Niedziółka, P.; Liuhto, K.; Bryc, A.; Niedziółka, D.; Mróz, M. Fossil Fuels in the European Union; Springer: Cham, Switzerland, 2024; Volume 99. [Google Scholar] [CrossRef]
  4. Jonek-Kowalska, I. Assessing the energy security of European countries in the resource and economic context. Oeconomia Copernic. 2022, 13, 301–334. [Google Scholar] [CrossRef]
  5. Pereira, F.; Aguiar-Conraria, L. Eurozone Inflation Convergence: Deceptive Appearances. Struct. Change Econ. Dyn. 2025, 74, 343–352. [Google Scholar] [CrossRef]
  6. Binder, C.C. Inflation expectations and the price at the pump. J. Macroecon 2018, 58, 1–18. [Google Scholar] [CrossRef]
  7. Kilian, L.; Zhou, X. Oil prices, gasoline prices, and inflation expectations. J. Appl. Econom. 2022, 37, 867–881. [Google Scholar] [CrossRef]
  8. Liu, N.; Xu, Z.; Skare, M. The research on COVID-19 and economy from 2019 to 2020: Analysis from the perspective of bibliometrics. Oeconomia Copernic. 2021, 12, 217–268. [Google Scholar] [CrossRef]
  9. Nicola, M.; Alsafi, Z.; Sohrabi, C.; Kerwan, A.; Al-Jabir, A.; Iosifidis, C.; Agha, M.; Agha, R. The socio-economic implications of the coronavirus pandemic (COVID-19): A review. Int. J. Surg. 2020, 78, 185–193. [Google Scholar] [CrossRef] [PubMed]
  10. Tiwari, A.K. Oil prices and the macroeconomy reconsideration for Germany: Using continuous wavelet. Econ. Model 2013, 30, 636–642. [Google Scholar] [CrossRef]
  11. Pietrzak, M.B.; Olczyk, M.; Kuc-Czarnecka, M.E. Assessment of the Feasibility of Energy Transformation Processes in European Union Member States. Energies 2022, 15, 661. [Google Scholar] [CrossRef]
  12. Pietrzak, M.; Igliński, B.; Kujawski, W.; Iwański, P. Energy Transition in Poland—Assessment of the Renewable Energy Sector. Energies 2021, 14, 2046. [Google Scholar] [CrossRef]
  13. Marín-Rodríguez, N.J.; González-Ruiz, J.D.; Botero, S.B. Dynamic Co-Movements among Oil Prices and Financial Assets: A Scientometric Analysis. Sustainability 2022, 14, 12796. [Google Scholar] [CrossRef]
  14. Jędruchniewicz, A. Fulfillment of the Inflation Target in Poland. Oeconomia Copernic. 2013, 4, 5–21. [Google Scholar] [CrossRef]
  15. Farid, S.; Karim, S.; Naeem, M.A.; Nepal, R.; Jamasb, T. Co-movement between dirty and clean energy: A time-frequency perspective. Energy Econ. 2023, 119, 106565. [Google Scholar] [CrossRef]
  16. Ainou, F.Z.; Ali, M.; Sadiq, M. Green energy security assessment in Morocco: Green finance as a step toward sustainable energy transition. Environ. Sci. Pollut. Res. 2022, 30, 61411–61429. [Google Scholar] [CrossRef]
  17. Zheng, M.; Feng, G.-F.; Chang, C.-P. Is green finance capable of promoting renewable energy technology? Empirical investigation for 64 economies worldwide. Oeconomia Copernic. 2023, 14, 483–510. [Google Scholar] [CrossRef]
  18. Wang, X.; Xu, Z.; Wang, X.; Skare, M. A review of inflation from 1906 to 2022: A comprehensive analysis of inflation studies from a global perspective. Oeconomia Copernic. 2022, 13, 595–631. [Google Scholar] [CrossRef]
  19. Tiwari, A.K.; Cunado, J.; Gupta, R.; Wohar, M.E. Are stock returns an inflation hedge for the UK? Evidence from a wavelet analysis using over three centuries of data. Stud. Nonlinear Dyn. Econom. 2019, 23, 20170049. [Google Scholar] [CrossRef]
  20. Tiwari, A.K.; Cunado, J.; Hatemi-J, A.; Gupta, R. Oil price-inflation pass-through in the United States over 1871 to 2018: A wavelet coherency analysis. Struct. Change Econ. Dyn. 2019, 50, 51–55. [Google Scholar] [CrossRef]
  21. Wang, Y. Defense Budget Growth and Inflation: A Wavelet-Based Study of the U.S. and Britain. Political Stud. Rev. 2023, 21, 260–284. [Google Scholar] [CrossRef]
  22. Zaremba, A.; Umar, Z.; Mikutowski, M. Inflation hedging with commodities: A wavelet analysis of seven centuries worth of data. Econ. Lett. 2019, 181, 90–94. [Google Scholar] [CrossRef]
  23. Kim, S.; In, F. The relationship between stock returns and inflation: New evidence from wavelet analysis. J. Empir. Financ. 2005, 12, 435–444. [Google Scholar] [CrossRef]
  24. da Conceição, G.F.D. The impact of energy prices on inflation and economic growth in Mozambique: A wavelet approach and OLS estimator. South Afr. J. Econ. 2024, 92, 354–385. [Google Scholar] [CrossRef]
  25. Tarkun, S. Dynamic relationships between inflation, industrial production, and freight rates in the EU: A wavelet coherence and causality analysis. Mar Policy 2025, 172, 106534. [Google Scholar] [CrossRef]
  26. Magazzino, C.; Giolli, L. Analyzing the relationship between oil prices and renewable energy sources in Italy during the first COVID-19 wave through quantile and wavelet analyses. Renew. Energy Focus 2024, 48, 100544. [Google Scholar] [CrossRef]
  27. Rua, A.; Nunes, L.C. International comovement of stock market returns: A wavelet analysis. J. Empir. Financ. 2009, 16, 632–639. [Google Scholar] [CrossRef]
  28. Lin, C.H. The comovement between exchange rates and stock prices in the Asian emerging markets. Int. Rev. Econ. Financ. 2012, 22, 161–172. [Google Scholar] [CrossRef]
  29. Adebayo, T.S. Dynamic Relationship between Oil Price and Inflation in Oil Exporting Economy: Empirical Evidence from Wavelet Coherence Technique. Energy Econ. Lett. 2020, 7, 12–22. [Google Scholar] [CrossRef]
  30. Tiwari, A.K.; Abakah, E.J.A.; Gil-Alana, L.A.; Abakah, M.K. Inflation Co-Movement Dynamics: A Cross-Country Investigation Using a Continuous Wavelet Approach. J. Risk Financ. Manag. 2021, 14, 613. [Google Scholar] [CrossRef]
  31. Ryczkowski, M. Money and inflation in inflation-targeting regimes—New evidence from time–frequency analysis. J. Appl. Econ. 2021, 24, 17–44. [Google Scholar] [CrossRef]
  32. Mutascu, M.; Strango, C.; Sokic, A. Demand for electric cars and oil prices: A wavelet approach. Int. J. Green Energy 2024, 21, 3498–3520. [Google Scholar] [CrossRef]
  33. Aladwani, J. Wavelet Coherence and Continuous Wavelet Transform—Implementation and Application to the Relationship between Exchange Rate and Oil Price for Importing and Exporting Countries. Int. J. Energy Econ. Policy 2023, 13, 531–541. [Google Scholar] [CrossRef]
  34. Hoong, L.Z.; Tsen, W.H.; Pinjaman, S.B.; Mansur, K. Co-Movement of COVID-19, The S&P 500 and Stock Markets in ASEAN: A Wavelet Coherence Analysis. 2022. Available online: http://www.ijem.upm.edu.my (accessed on 1 July 2025).
  35. Wijesekara, C.; Tittagalla, C.; Jayathilaka, A.; Ilukpotha, U.; Jayathilaka, R.; Jayasinghe, P. Tourism and economic growth: A global study on Granger causality and wavelet coherence. PLoS ONE 2022, 17, e0274386. [Google Scholar] [CrossRef] [PubMed]
  36. Tiwari, A.K.; Dar, A.B.; Bhanja, N. Oil price and exchange rates: A wavelet based analysis for India. Econ. Model 2013, 31, 414–422. [Google Scholar] [CrossRef]
  37. Razi, U.; Cheong, C.W.H.; Shams, S.; Sarker, T.; Sharif, A.; Afshan, S. Assessing the turbulence: Wavelet coherence and causality analysis of energy price volatility and exchange rate instability. Energy 2025, 331, 136948. [Google Scholar] [CrossRef]
  38. Wu, T.-P.; Wu, H.-C.; Wang, C.-M.; Wu, Y.-Y. Causality between tourism and housing prices: A wavelet-based approach. J. Policy Res. Tour. Leis. Events 2023, 15, 465–485. [Google Scholar] [CrossRef]
  39. Wang, Q.; Li, S.; Jiang, F. Uncovering the impact of the COVID-19 pandemic on energy consumption: New insight from difference between pandemic-free scenario and actual electricity consumption in China. J. Clean Prod. 2021, 313, 127897. [Google Scholar] [CrossRef]
  40. Batten, J.A.; Mo, D.; Pourkhanali, A. Can inflation predict energy price volatility? Energy Econ. 2024, 129, 107158. [Google Scholar] [CrossRef]
  41. Naeem, M.A.; Peng, Z.; Suleman, M.T.; Nepal, R.; Shahzad, S.J.H. Time and frequency connectedness among oil shocks, electricity and clean energy markets. Energy Econ. 2020, 91, 104914. [Google Scholar] [CrossRef]
  42. Ali, S. The impact of oil price on economic growth: Test of Granger causality, the case of OECD countries. Int. J. Soc. Sci. Econ. Res. 2016, 1, 1333–1349. [Google Scholar]
  43. Kpagih, L.L. Energy Price Fluctuation and Inflation in Nigeria: A Granger Causality Analysis. J. Econ. Financ. Manag. Stud. 2022, 5, 449–454. [Google Scholar] [CrossRef]
  44. Syzdykova, A.; Abubakirova, A.; Kudabayeva, L.; Zhantayeva, A.; Omarova, A. Asymmetric Causality Relationship between Oil Prices and İnflation in BRIC Countries. Int. J. Energy Econ. Policy 2022, 12, 184–191. [Google Scholar] [CrossRef]
  45. El-Gamal, M. Inflation Is Still A Monetary Phenomenon: A Wavelet Analysis of Inflation, Oil Prices and Money Supply. Appl. Econ. Lett. 2024, 31, 164–169. [Google Scholar] [CrossRef]
  46. Naeem, M.A.; Karim, S.; Hasan, M.; Lucey, B.M.; Kang, S.H. Nexus between oil shocks and agriculture commodities: Evidence from time and frequency domain. Energy Econ. 2022, 112, 106148. [Google Scholar] [CrossRef]
  47. Ferrer, R.; Shahzad, S.J.H.; López, R.; Jareño, F. Time and frequency dynamics of connectedness between renewable energy stocks and crude oil prices. Energy Econ. 2018, 76, 1–20. [Google Scholar] [CrossRef]
  48. Ghoshal, I. Cost-Push and Demand-Pull Inflation in India—A Frequency Domain Analysis. In Proceedings of the 16th Economics & Finance Conference, Prague, Czech, 13–15 June 2022; International Institute of Social and Economic Sciences: Prague, Czech, 2022. [Google Scholar] [CrossRef]
  49. Khodavaisi, H. Output, Money and Interest Rate in the United States: New Evidence Based on Wavelet Analysis. Comput. Econ. 2024, 66, 1571–1601. [Google Scholar] [CrossRef]
  50. Bai, L.; Yan, S.; Zheng, X.; Chen, B.M. Market turning points forecasting using wavelet analysis. Phys. A Stat. Mech. Appl. 2015, 437, 184–197. [Google Scholar] [CrossRef]
  51. Krüger, J.J. A Wavelet Evaluation of Some Leading Business Cycle Indicators for the German Economy. J. Bus. Cycle Res. 2021, 17, 293–319. [Google Scholar] [CrossRef]
  52. Cottrell, A.; Lucchetti, R. GNU Regression, Econometrics and Time-Series Library (GRETL). 2025. Available online: https://gretl.sourceforge.net/gretl-help/gretl-guide.pdf (accessed on 22 July 2025).
  53. MATLAB, version:24.2 (R2024b); MathWorks: Natick, MA, USA, 2024. Available online: https://www.mathworks.com (accessed on 22 July 2025).
  54. Perron, P.; Qu, Z. A simple modification to improve the finite sample properties of Ng and Perron’s unit root tests. Econ. Lett. 2007, 94, 12–19. [Google Scholar] [CrossRef]
  55. Kwiatkowski, D.; Phillips, P.C.B.; Schmidt, P.; Shin, Y. Testing the null hypothesis of stationarity against the alternative of a unit root. J. Econom. 1992, 54, 159–178. [Google Scholar] [CrossRef]
  56. Daubechies, I. Ten Lectures on Wavelets; Society for Industrial and Applied Mathematics: Philadelphia, PA, USA, 1992. [Google Scholar] [CrossRef]
  57. Torrence, C.; Compo, G.P. A Practical Guide to Wavelet Analysis. Bull. Am. Meteorol. Soc. 1998, 79, 61–78. [Google Scholar] [CrossRef]
  58. Rza̧dkowski, G.; Figlia, G. Logistic Wavelets and Their Application to Model the Spread of COVID-19 Pandemic. Appl. Sci. 2021, 11, 8147. [Google Scholar] [CrossRef]
  59. Ivanova, I.; Rzadkowski, G. Triple Helix synergy and patent dynamics. cross country comparison. Qual. Quant. 2025, 59, 2891–2923. [Google Scholar] [CrossRef]
  60. Rządkowski, G. Normalized Gompertz wavelets and their applications. Int. J. Wavelets Multiresolut. Inf. Process 2025, 23, 2450040. [Google Scholar] [CrossRef]
  61. Goupillaud, P.; Grossmann, A.; Morlet, J. Cycle-octave and related transforms in seismic signal analysis. Geoexploration 1984, 23, 85–102. [Google Scholar] [CrossRef]
  62. Aguiar-Conraria, L.; Azevedo, N.; Soares, M.J. Using wavelets to decompose the time-frequency effects of monetary policy. Phys. A Stat. Mech. Appl. 2008, 387, 2863–2878. [Google Scholar] [CrossRef]
  63. Grinsted, A.; Moore, J.C.; Jevrejeva, S. Application of the cross wavelet transform and wavelet coherence to geophysical time series. Nonlinear Process. Geophys. 2004, 11, 561–566. [Google Scholar] [CrossRef]
  64. Rösch, A.; Schmidbauer, H. WaveletComp 1.1: A guided tour through the R package. 2018. Available online: http://www.hs-stat.com/projects/WaveletComp/WaveletComp_guided_tour.pdf (accessed on 22 July 2025).
  65. European Parliament and of the Council. Directive (EU) 2018/844. Official Journal of the European Union, 19.6 2018, L156/75; Official Journal of the European Union: Luxembourg, 2018. [Google Scholar]
Figure 1. Appearance of phase differences of the X and Y series in a cross-wavelet power graph. Own work based on [64], p. 7.
Energies 18 04610 g001
Table 1. Results of unit root tests for the analysed series (annual inflation rates, electricity/gas/other fuels, 2001–2024).
CountryADF (Constant Only)ADF (Constant and Trend)ADF-GLSKPSS
Austria (AT)0.01000.04510.002p > 0.10
Belgium (BE)0.00300.01590.000p > 0.10
Bulgaria (BG)0.02340.06770.001p > 0.10
Cyprus (CY)0.05390.18690.012p > 0.10
Czechia (CZ)0.01230.02480.006p > 0.10
Germany (DE)0.02640.09960.044p > 0.10
Denmark (DK)0.00380.02010.000p > 0.10
Euro Area (EA)0.05190.18720.020p > 0.10
Estonia (EE)0.04320.15520.003p > 0.10
Spain (ES)0.00130.00800.000p > 0.10
European Union (EU)0.09170.28860.021p > 0.10
Finland (FI)0.04970.18800.005p > 0.10
France (FR)0.06650.14880.009p > 0.10
Croatia (HR)0.06330.20460.084p > 0.10
Hungary (HU)0.10690.27770.100p > 0.10
Ireland (IE)0.01580.07340.001p > 0.10
Iceland (IS)0.53690.82840.253p > 0.10
Italy (IT)0.00330.01510.000p > 0.10
Lithuania (LT)0.04720.16980.004p > 0.10
Luxembourg (LU)0.06190.21080.036p > 0.10
Latvia (LV)0.01700.08300.002p > 0.10
Netherlands (NL)0.00080.00460.001p > 0.10
Norway (NO)0.00580.03090.000p > 0.10
Poland (PL)0.33710.52600.098p > 0.10
Portugal (PT)0.17610.43270.105p > 0.10
Romania (RO)0.00360.03090.830p < 0.01
Sweden (SE)0.02000.06990.003p > 0.10
Slovenia (SI)0.04590.16200.338p > 0.10
Slovakia (SK)0.07690.18800.521p < 0.01
Poland_Admin (PL_ADM)0.45540.70690.192p > 0.10
Iceland (d_IS)0.00000.00000.000p > 0.10
Poland (d_PL)0.00000.00000.000p > 0.10
Portugal (d_PT)0.00000.00000.000p > 0.10
Romania (d_RO)0.00000.00000.000p > 0.10
Slovakia (d_SK)0.00000.00000.280p > 0.10
Poland_Adm (d_PL_ADM)0.00000.00000.000p > 0.10
Explanations: Bold font indicates that process X is of type I(1), while for d_X processes, the type is I(0) (remaining countries not shown here for brevity).
Disclaimer/Publisher’s Note: The statements, opinions and data contained in all publications are solely those of the individual author(s) and contributor(s) and not of MDPI and/or the editor(s). MDPI and/or the editor(s) disclaim responsibility for any injury to people or property resulting from any ideas, methods, instructions or products referred to in the content.