Article

First Tests on the Performance and Reliability of an Experimental Bio-Based UTTO Lubricant Used in an Agricultural Tractor

Consiglio per la Ricerca in Agricoltura e L’analisi Dell’economia Agraria (CREA), Centro di Ricerca Ingegneria e Trasformazioni Agroalimentari (Research Centre for Engineering and Agro-Food Processing), Via della Pascolare 16, 00015 Monterotondo, RM, Italy
*
Author to whom correspondence should be addressed.
Energies 2025, 18(17), 4612; https://doi.org/10.3390/en18174612 (registering DOI)
Submission received: 19 June 2025 / Revised: 4 August 2025 / Accepted: 15 August 2025 / Published: 30 August 2025

Abstract

Inside the transmission group of an agricultural tractor, the efficiency of power transfer to moving parts, their lubrication, and protection from wear are guaranteed by UTTO (Universal Tractor Transmission Oil) fluids, which are also used to operate the hydraulic system. These fluids, with mineral or synthetic origin, are characterized by excellent lubricating properties, high toxicity, and low biodegradability, which makes it important to replace them with more eco-sustainable fluids, such as those based on vegetable oils that are highly biodegradable and have low toxicity. It is also important to consider EU policies on the use of such fluids in sensitive environmental applications. To this end, several experimental bio-UTTO formulations were tested at CREA to evaluate—compared to conventional fluids—their suitability for use as lubricants for transmissions and hydraulic systems through endurance tests carried out in a Fluid Test Rig (FTR) specifically developed by CREA to apply controlled and repeatable work cycles to small volumes of oil, which are characterized by high thermal and mechanical stresses. The technical performance and the main physical–chemical parameters of the fluids were continuously monitored during the work cycles. Based on these experiences, this study describes the first application of a methodological approach aimed at testing an experimental biobased UTTO on a tractor used in normal farm activity. The method was based on a former test at the FTR in which the performance of the bio-UTTO was compared to that of the conventional UTTO recommended by the tractor manufacturer. Given the good results of the FTR test, bio-UTTO was introduced in a 20-year-old medium-power tractor, replacing the mineral fluid originally supplied, for the first reliability tests during its normal use on the CREA farm. After almost 600 h of work, the technical performance and the trend of chemical–physical parameters of bio-UTTO did not undergo significant changes. No damage to the tractor materials or oil leaks was observed. The test is still ongoing, but according to the results, in line with the indications provided by the FTR test, the experimental bio-UTTO seems suitable for replacing the conventional fluid in the tractor used in this study.

1. Introduction

Power transmission efficiency in an agricultural tractor is ensured by a specific lubricant (UTTO—Universal Tractor Transmission Oil), which prolongs the lifespan of the gearbox components and protects the contacting surfaces from excessive friction and wear. The same fluid commonly enables the transmission of energy in the tractor’s hydraulic system [1,2,3]. UTTOs are tractor multipurpose oils and are formulated for use in transmissions, final drives, wet brakes and clutches, and hydraulic systems of tractors employing a single oil reservoir. Most conventional formulations are still based on mineral oil characterized by high-lubricant properties, but also by high toxicity and low biodegradability [4], which make them a significant source of pollution for terrestrial and marine environments due to uncontrolled losses via oil pipes, leakages, and breaches in transmission systems and, especially, improper disposal after usage [5,6,7]. It has been reported that only 10–50% of used lubricants are recycled, and almost 50% of all the sold oils end up in the environment as a residue during their utilization. Such a picture makes it crucial to introduce vegetable-based oils, an ecologically accepted alternative for mineral oil-based lubricants [8,9,10,11,12]. The performance of such renewable lubricants is often comparable to that of conventional products lacking environmental friendliness [13,14,15,16,17], and in the selection of base fluids as well as in the overall formulation of the finished lubricant, biodegradability has become the most important design parameter [18,19,20,21]. Furthermore, agricultural tractors, compared to other possible applications, such as automotives [22,23], represent an optimal choice for using renewable lubricants due to their direct application in environments where conventional lubricants can clearly come in contact with plants, soil, and water [24,25]. The often extreme working conditions of tractors, characterized by high or low temperatures, different slopes and positions, presence of dust, and, above all, heavy-duty work for many hours, can favor the occurrence of lubricant losses and fuel consumption [26,27]. These severe conditions require high-quality lubricants capable of bearing greater thermal stress to avoid wear of components and to fulfill the requirements of the specifications and standards of the producers of technical systems [28,29,30,31]. If the lubricant does not meet these requirements, abnormal wear and malfunction can occur [32]. Despite their environmental safety, vegetable-based oils have several disadvantages, such as their limited thermal and oxidative stability [33,34]. Environmentally friendly possibilities to overcome these negative effects could consist of expensive chemical modifications of the base oils [35,36,37,38,39] or the formulation of the final fluid with non-toxic additives [40,41].
Bio-based UTTO formulations, currently still in the experimental stage for preventing or minimizing damage to expensive machinery, including agricultural machinery, have shown good tribological properties in laboratory tests. Those indicated as the most promising biolubricants are based on oils with a high oleic acid content [13,42]. Pochi et al. [43] tested an experimental bio-based UTTO by comparing the performance of an agricultural tractor, in which the transmission–hydraulic system group was powered, alternatively, by a conventional fluid and by a bio-based fluid. After a 30 h work cycle, the tractor’s engine and transmission performance with the two fluids was comparable. Normally, bio-based lubricants are mainly evaluated based on physical–chemical properties and thermo-oxidative stability [44], while their performance is enhanced by high kinematic viscosity, capable of maintaining high fluid thickness and flow under very high pressure and temperature conditions [45]. Other tribological properties, such as low-temperature behavior or a high flash point, are also important for evaluating biolubricants. These fluids are currently still underutilized in agricultural machinery despite their low environmental impact and good operational and physicochemical properties due to a presumed lack of performance and reliability. At CREA, several experimental UTTO formulations were rigorously tested to assess their efficacy as hydraulic fluids and transmission lubricants, in direct comparison with conventional fluids [46]. These evaluations were conducted through durability tests utilizing a Fluid Test Rig (FTR) [47]. The FTR is engineered to subject small volumes of oil to controlled and reproducible work cycles, characterized by elevated thermal and mechanical stresses. This methodology significantly accelerates the aging process of the fluid, enabling comprehensive monitoring of its hydraulic and mechanical performance (including operating pressure and temperature, flow rate, and transmitted hydraulic and mechanical power), as well as its physicochemical properties (such as kinematic viscosity, acidity, presence of contaminants and additive elements, and content of wear metal particles). The inherent repeatability of these test conditions facilitated a direct comparative analysis between bio-based and conventional fluids. The findings demonstrated that several bio-based UTTO fluids exhibited performance levels similar to those of the conventional fluids they are designed to supersede. Furthermore, and critically, these bio-based formulations sustained their lubricating properties over prolonged periods of severe operational cycles. Consequently, a selection of promising formulations was identified for preliminary field trials on agricultural machinery under authentic working conditions. Among these, one specific UTTO biofluid was subsequently deployed in a medium-power agricultural tractor owned by CREA and utilized for both routine farm operations and diverse experimental research initiatives. This paper delineates the comprehensive results pertaining to the selected biofluid. It commences with an analysis of its performance during the FTR work cycle, where its physical–chemical properties and operational performance were benchmarked against the conventional fluid originally employed in the tractor. The paper then proceeds to detail the fluid’s application within the tractor itself, wherein its properties were meticulously monitored throughout standard agricultural operations conducted at CREA’s experimental farm.

2. Materials and Methods

The experimental activity entailed a comparative analysis at multiple levels between a selected bio-based UTTO and two conventional UTTOs, both originally utilized in a medium-power tractor owned by CREA. The three fluids under investigation were as follows:
(1)
Agrolube Vela B: A mineral UTTO produced by Argo Tractors S.p.A. (Fabbrico, Italy), also the tractor’s manufacturer. This fluid was in use within the tractor prior to its replacement with the bio-based UTTO. At the point of replacement, the fluid had accrued approximately 1400 operating hours and was deemed exhausted. Hereafter, this fluid is designated as CF1 (Conventional Fluid 1).
(2)
Matrol-Bi FUM 01A: A biofluid manufactured by Novamont S.p.A. (Novara, Italy). It is formulated with an ester base synthesized from non-food high-oleic vegetable oils and a proprietary additive package. Its selection for the tractor test was based on its favorable performance results from the Fluid Test Rig (FTR). It will be referred to as BF (Bio-Fluid).
(3)
Agrolube Vela C+: A mineral UTTO from Argo Tractors S.p.A. (Fabbrico, Italy). This fluid superseded Agrolube Vela B commercially and is the manufacturer’s recommended fluid for the tractor in this study. It was tested on the FTR for a direct performance comparison with the BF. This fluid is designated as CF2 (Conventional Fluid 2).
The aforementioned three fluids were subjected to the tests schematically outlined in Table 1.
The subsequent subsections describe the fluids, equipment, machinery, and instruments used in the test scheme of Table 1, detailing the methods for testing and data analysis.

2.1. UTTO Fluids Involved in the Tests

The main characteristics of the three fluids are summarized in Table 2. The two conventional UTTOs, CF1 and CF2, are mineral oil-based fluids produced by the same manufacturer as the tractor used in Test 3 (T3), for which they are recommended. The BF was an experimental fluid developed by Novamont S.p.A., an Italian company specializing in green chemistry. It was formulated from a blend of highly refined, oxidation-stable high-oleic vegetable oils and saturated renewable synthetic esters. The formulation was completed with Novamont’s proprietary ashless additive package, which is free of zinc and other environmentally critical components. The BF is also biodegradable, in compliance with the OECD 301B standard [48].

2.2. Machinery and Equipment Involved in the Tests

2.2.1. Fluid Test Rig (FTR)

To monitor the chemical–physical properties and evaluate the technical performance of lubricants under controlled operating conditions [56,57], the CREA Agricultural Machinery Testing Center in Monterotondo, Rome, designed and built a Fluid Test Rig (FTR). This rig enables a comparative evaluation of conventional and bio-based formulations to determine their suitability for use as lubricants or hydraulic fluids. Utilizing a specifically developed test methodology [47], the FTR simulates heavy-duty work cycles that expose the fluid to stresses representative of its typical use in agricultural tractor transmissions and hydraulic systems. By applying controlled hydraulic and mechanical workloads to a small fluid volume, the rig induces significant mechanical and thermal stress, resulting in accelerated aging.
The FTR (Figure 1) consists of the following three circuits:
(1) Main circuit. This circuit features a 30 dm3 oil tank, a low-pressure circulation pump, a digital pressure gauge, a 25 μm main filter, an oval gear flow meter, and an oil–water heat exchanger. This section circulates the fluid, supplying it to other circuits, recovering it, cooling it, and returning it to the tank.
(2) Hydraulic circuit. This circuit applies a hydraulic workload to the fluid using a high-pressure radial piston pump (max. pressure 50 MPa; max. power: 5 kW; max speed: 1800 min−1). A distributor block with four solenoid valves, each connected to a preloaded overpressure valve (10, 20, 30, and 40 MPa), allows for the application of controlled pressure to simulate fluid mechanical stress. A control system continuously monitors operating pressure, oil flow rate, real-time hydraulic power, and fluid temperature at the overpressure valve outlets. To intensify thermal stress—a key factor in oil degradation—the oil path is extended between the high-pressure pump and the 40 MPa overpressure valve. A manifold divides the flow into five parallel spiral pipes immersed in a heated water/ethylene glycol solution within an insulated 60 dm3 tank. Here, three resistors maintain a solution temperature of 105 °C, preventing molecular cracking. The oil is then collected and routed to the overpressure valves, where lamination induces further thermal and mechanical stress [58].
(3) Transmission circuit. This circuit simulates the conditions inside a tractor’s gearbox and Power Take-Off (PTO), where the lubricant dissipates thermal energy from gear friction while undergoing direct mechanical stress. The core component is a speed multiplier gearbox with helical gears in an oil bath (transmission ratio: 1/2.44; η: 0.94), with a capacity of 2.6 dm3. It receives fluid from the main circuit at 12 dm3 h−1, with the outflow returning to the main circuit for cooling. The multiplier is driven by a 37 kW asynchronous electric motor and connected to a dynamometric brake [59] to apply a resistive load. The brake’s load and the motor’s speed (controlled by an inverter) are adjustable, allowing for the precise measurement of mechanical work and thermal energy dissipation over time. A second heating system was installed in the fluid line entering the multiplier to increase the thermal leap experienced by the fluid. In preliminary tests, this leap was normally around 10 °C, with temperatures at the gearbox inlet and outlet of 60 and 70 °C, respectively. This system consists of an oil-to-water heat exchanger. On one side, a pump circulates the aforementioned heated water–ethylene glycol solution, while on the other side, oil from the reservoir is circulated and heated in a counter-current before entering the multiplier. The ability to control the brake rotation speed and the resistant torque—and thus the power delivered—allows for the measurement of the mechanical work performed and the thermal energy dissipated by the oil over a given period.
The FTR’s design allows the hydraulic and transmission circuits to operate either in combination (for UTTO fluid tests) or independently (for hydraulic or lubricating fluid tests) by controlling valves on the main circuit. The oil from both circuits returns to the main circuit and passes through the primary heat exchanger. A network of thermocouples and pressure gauges monitors oil conditions throughout the FTR. The rig also includes multiple sampling points for laboratory analysis of the fluid’s chemical and physical properties. An electronic control module connected to a PC monitors, adjusts, records, and processes all FTR functions and test parameters. Prior to each test, the FTR is thoroughly cleaned twice to remove any residual oil. The reservoir is then filled with the new UTTO oil, and a new main filter is installed [60].
Oil samples were collected every 30 h from both the FTR and the tractor’s transmission tank. These samples, obtained using specific Novamont oil change protocols to prevent contamination, were chemically and physically analyzed. This process was used to monitor the evolution of the bio-based fluid’s lubricating properties and provide data to help prevent damage to the FTR [61].
Table 3 summarizes the test conditions for BF and CF2, enabling a direct comparison of their performance and physical–chemical properties.
The intensity of the fluid’s work cycles in these tests was measured by the total specific energy (kWh dm−3), which accounts for both the hydraulic–mechanical work performed and the thermal energy dissipated per unit volume. This criterion was applied to both FTR test conditions (Table 3) and actual tractor operations to compare the specific energy conveyed by the fluid in both scenarios.
For example, evaluating a lubricant for a medium-power tractor used in various farm activities would typically involve an oil volume of 80–100 dm3 (the reservoir capacity) over a duration of at least 1000 h. This lifespan, equivalent to the interval between two oil changes, often represents more than a year of intensive use for a contractor. In contrast, the FTR work cycle uses only 20–25 dm3 of oil. In terms of duration, a 150-h FTR test is estimated to deliver a specific energy equivalent to 700–800 h of tractor use [47]. This estimate accounts for a range of variables, including average activity duration, hydraulic and mechanical power demands, operating temperatures, and the efficiency of the systems involved [62,63]. This method, with its reduced testing time, controlled conditions, and repeatable work cycles, greatly simplifies the comparative evaluation of different fluids. This evaluation covers both their technical performance (e.g., operating pressure, temperatures, flow rate, transmitted power, and work completed) and their lubricating properties (e.g., kinematic viscosity, acidity, contaminants, additive elements, and wear metal particles).

2.2.2. Tractor Used in Farm Operations

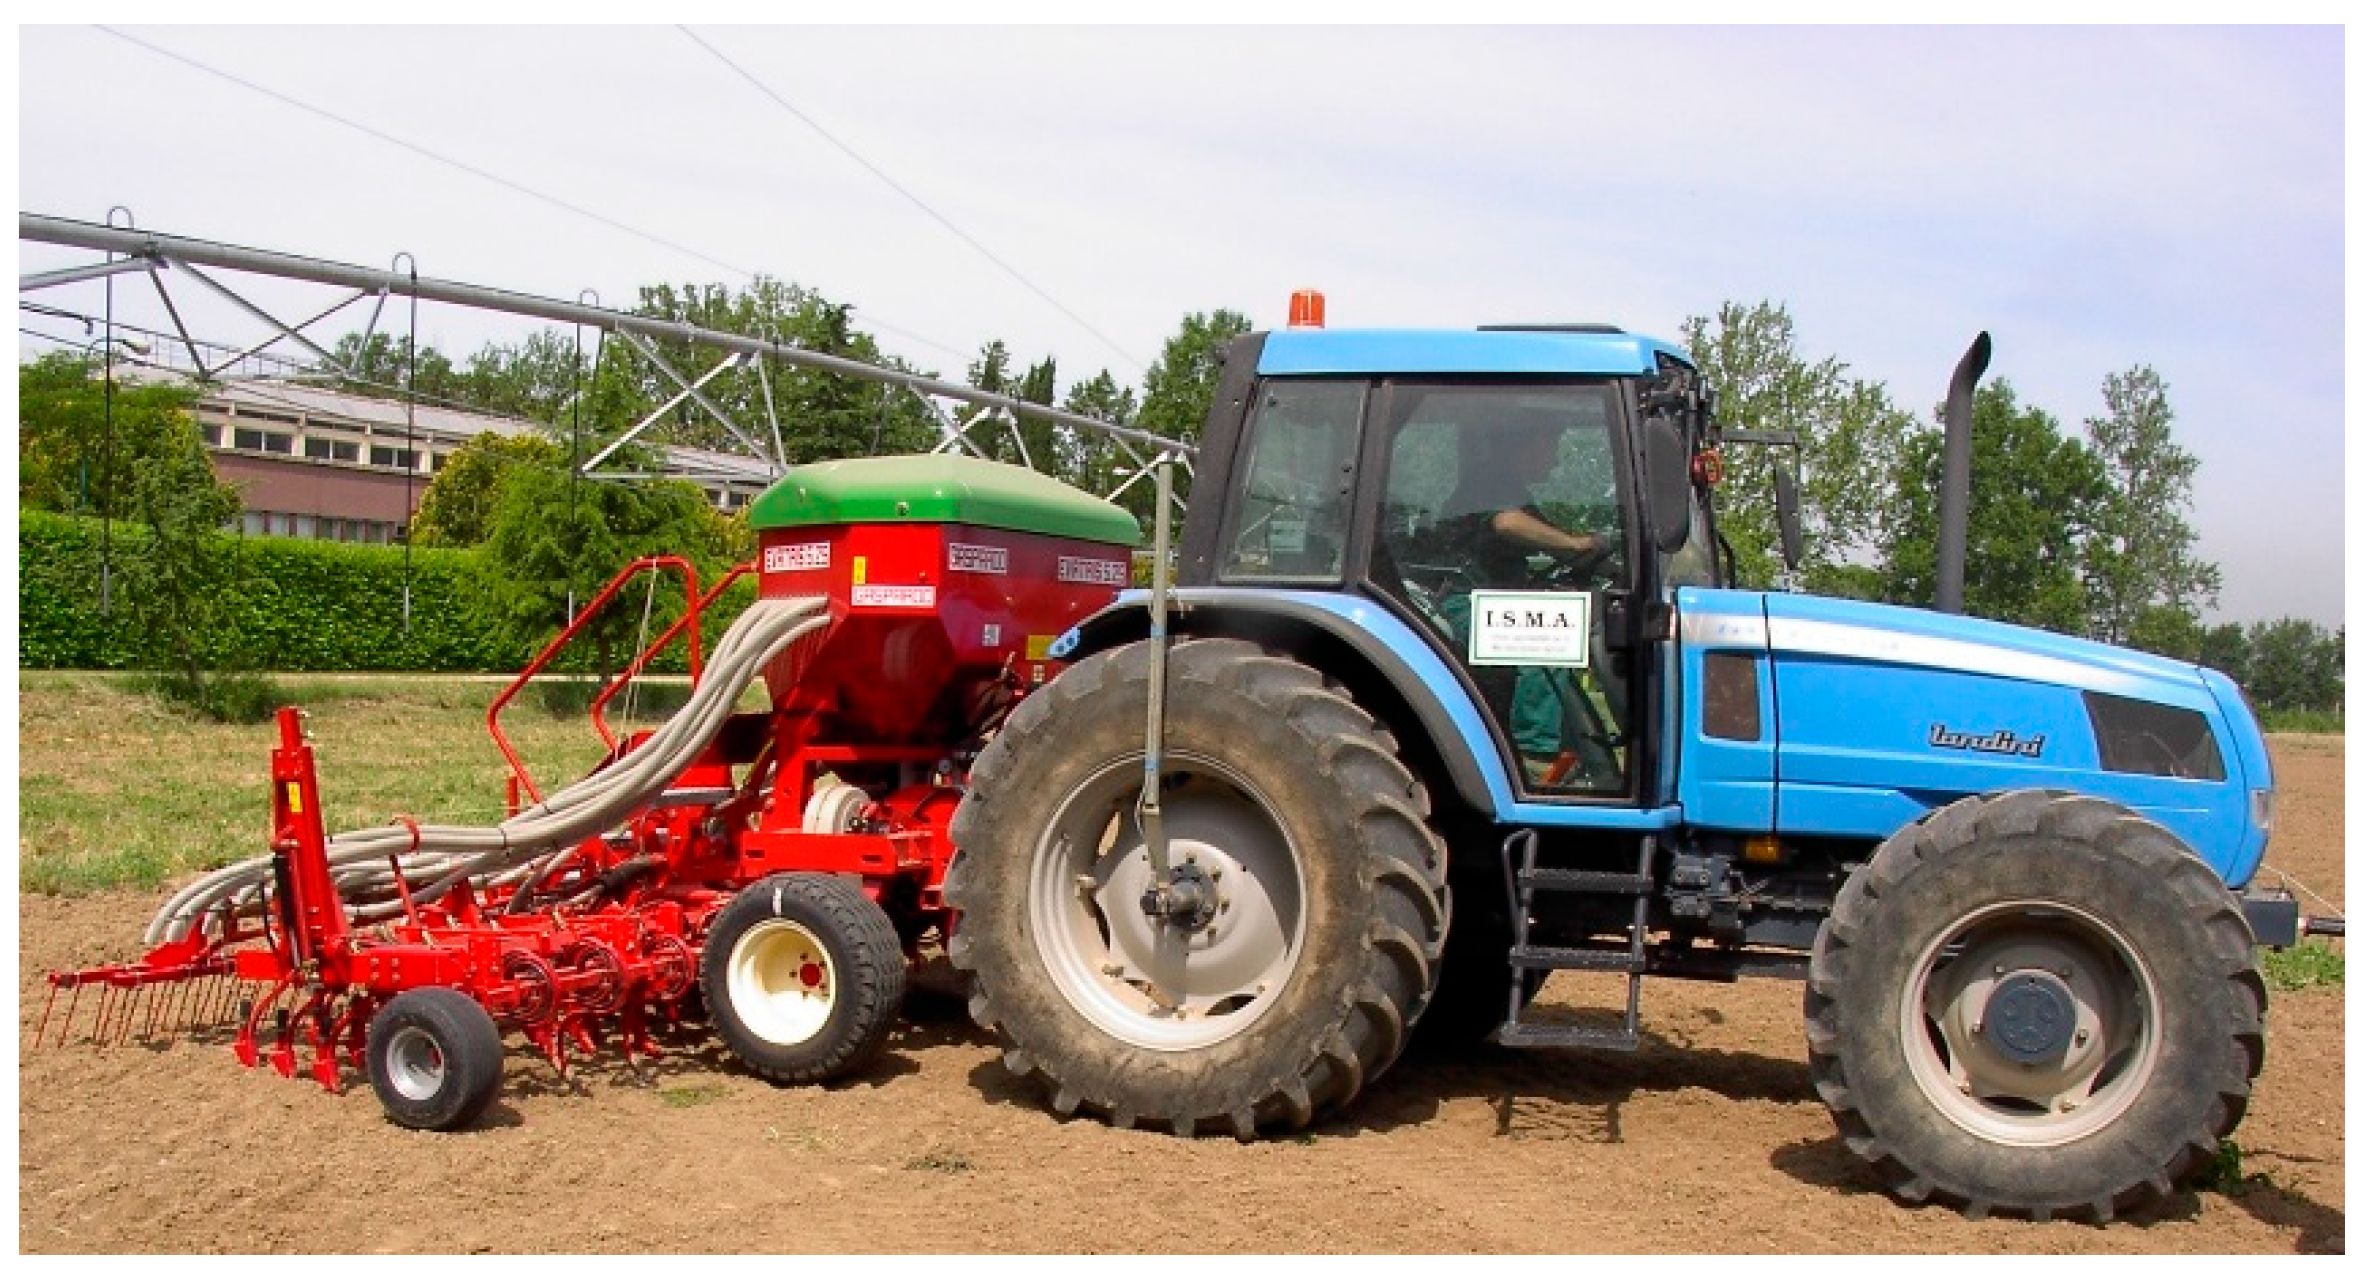
The UTTO BF was tested using a 20-year-old Landini Legend 145 agricultural tractor (Fabbrico, Italy). This 4WD model, which has a nominal power of 101.5 kW at 2100 min−1 and a total mass of 6420 kg (Figure 2), is still in good condition. The tractor is regularly used for agricultural work, including soil tillage and sowing, at the CREA experimental farm in Monterotondo (Rome, Central Italy; 42°5′51.26″ N; 12°37′3.52″ E; 24 m a.s.l.) [64,65,66,67].
This tractor is equipped with a category-3 three-point hitch (ISO standard), along with 480/65 R 28 front tires and 600/65 R38 rear tires. It is powered by a 6000 cm3 turbocharged Perkins 1006M engine (Perkins Engines Company Ltd., Peterborough, UK). The power is transmitted through a mechanical gearbox, a super-reducer, and a hydraulic reverser, which together offer 36 forward and 36 reverse gears. The independent rear Power Take-Off (PTO) is electro-hydraulically engaged, with a rotation speed proportional to both engine and forward speed. The clutch and both front and rear brakes are of the wet multidisc type. The hydraulic system features two separate circuits, each with its own independent pump. The first circuit has a flow rate of 35 dm3 min−1 and manages the power steering, the power shift’s hydraulic couplings, the front drive wheels, the PTO, and the forced lubrication of the transmission. The second circuit provides a higher flow rate of 62 dm3 min−1 to power the four additional distributors and the hydraulic lift. For oil replacement, we followed specific Novamont protocols. First, the conventional mineral oil (CF1) was drained from the transmission tank while it was hot. The system was then flushed with the bio-based UTTO fluid (BF) using a volume equal to approximately 40% of the tank’s capacity, running the tractor until the fluid reached its operating temperature. After draining the flushing fluid, the tank was refilled to the correct level with 87 kg of BF. The three oil filters in the hydraulic system were replaced after both the initial draining and the flushing procedure.

2.2.3. Dynamometric Brake

Before commencing agricultural operations, the selected tractor was subjected to preliminary tests to verify its general efficiency. This was achieved by comparing the engine’s characteristic curves when running with the original CF1 fluid (at the end of its lifespan) and, after the oil replacement, with the new BF. For this purpose, the tractor was connected to an electromagnetic dynamometric brake (Borghi & Saveri, FE 600 S), manufactured by Borghi & Saveri S.r.l. (Bologna, Italy), as shown in Figure 1. This brake is capable of testing engine powers up to 300 kW and is suitable for evaluating the performance of agricultural and forestry tractors according to OECD Code 2 [68]. As explained in Section 2.2.1, when the transmission circuit of the FTR is involved in fluid tests, such as the UTTO test in this study, the dynamometric brake becomes an integral component of the test rig.

2.3. Tests

Referring to Table 1, CF1, CF2, and BF were subjected to three tests (T1, T2, and T3).
T1. The durability tests at the FTR compared the performance and key physico-chemical parameters of BF, an experimental formulation, with those of CF2, its current benchmark. The tests were conducted under the operating conditions listed in Table 3. Technical performance data were monitored in real-time at a frequency of 10 Hz, with averages recorded at 20-s intervals over an 8-h period each day. The initial 30-min fluid heating phase was excluded from data processing, and the analysis provided daily averages for all parameters only from the period under “normal test conditions”.
To quickly visualize the evolution and comparison between the fluids, the most important parameters were presented in diagrams as daily averages over the entire test duration. Statistical descriptors were also provided in tables. For the physico-chemical parameters, periodic fluid samples were collected and analyzed, with results referenced to the sampling time in hours from the start of the test. The overall test duration was primarily determined by the fluid level in the reservoir, which had to remain sufficient for the FTR’s correct operation after each sampling.
T2. The tests with the tractor Power Take-Off (PTO) connected to the dynamometric brake aimed to verify the tractor’s overall condition with CF1 at the end of its service life and after its replacement with the new BF. Because of the PTO connection, these tests specifically stressed the transmission circuit linking the crankshaft to the PTO, which is lubricated by the UTTO in use. The comparison involved the engine’s characteristic curves for torque and power, obtained with both fluids according to OECD Code 2. To facilitate comparison, the data were normalized using the following formula:
P 0 = P p 0 p   T T 0
where P (kW) is the power measured at air temperature T (°K) and atmospheric pressure p (mbar). P0 (kW) is the power corrected to the reference conditions of air temperature (T0 = 288 °K) and atmospheric pressure (p0 = 1013 mbar). During the PTO tests, tractor noise emissions with both fluids were measured point-by-point while acquiring the engine curves. The sound level in the cabin was measured at the driver’s ear, in accordance with the ISO 1999: 2013 standard [69]. The following equipment was used for the measurements: an eight-channel “Soundbook” data acquirer/processor (Spectra srl, Vimercate, Italy) with Samurai™ software, version 2.6; a ½” B&K microphone capsule, model 4189, positioned 0.1 m from the driver’s ear (Brüel & Kjær, Nærum, Denmark); and a B&K microphone calibrator, model 4231. The results from T2 are presented in diagrams.
T3. The field operation tests focused on monitoring the BF’s physico-chemical properties and the tractor’s efficiency while it was used in the field. The tractor was used for both normal agricultural activities and specific research tasks with high power demands. Care was taken to avoid using hydraulically operated implements to prevent the contamination of the tractor’s fluid with residues from unknown fluids in the implement’s hydraulic circuit. Periodically, samples of the BF were collected and analyzed. The results were then compared with the FTR test results for BF to assess the evolution of the fluid’s properties and the relative severity of the two test conditions (FTR vs. in-field). Table 4 provides an overview of the parameters measured in T1, T2, and T3; the methods used; and the laboratories involved. Each laboratory analysis was conducted three times. Contact surfaces were not inspected before the tests, as the fluids were continuously monitored for wear through the periodic analysis of samples.

3. Results and Discussion

3.1. Tests at the Fluid Test Rig (T1)

The tests started with BF and subsequently continued with CF2. In both cases, the test was concluded when the fluid volume, due to sample withdrawals, decreased to 10 dm3, the minimum level required for the test rig’s functionality. During the CF2 test, however, an oil leak from a defective high-pressure hose caused a further volume reduction, necessitating the test’s termination at 350 h, compared to 420 h for the BF test. The performance of BF and CF2 at the FTR is shown in Figure 3, Figure 4 and Figure 5. The diagrams illustrate the trend of the daily mean values for the main parameters against working time in hours, from the start to the end of each test. The statistical descriptors for all parameters for both fluids are provided in Table 5. Figure 3 describes the hydraulic performance of both fluids through the curves for pressure, flow rate, and power, which show very minor differences between BF and CF2, with the parameters remaining remarkably constant throughout the tests.
Regarding performance within the transmission circuit, the curves for torque, rotation speed, power, and fluid temperatures illustrate the operational conditions under which the fluids performed their lubricating and cooling functions. In the initial phase of the BF test, power (Figure 4c) increased from approximately 20 kW to 25 kW. This was a consequence of the rising rotation speed of the multiplier shaft (Figure 4b), while the applied torque remained nearly constant (Figure 4a). The increase in rotation speed aimed to heighten the mechanical stress on the fluid, which was achieved during the test by improving the cooling efficiency of the electric motor used to operate the transmission. The final power and speed settings were reached after about 50 h of operation. Subsequently, these settings were maintained until the end of the BF test and throughout the entire duration of the CF2 test. With the exception of the initial 50-h adjustment phase, the curves for both fluids show almost identical trends. The mean daily temperatures of the two fluids at the outlet of the 40 Mpa overpressure valve are shown in Figure 5a. Here, it is evident that the temperature of CF2 is distinctly lower than that of BF, as confirmed in Table 5, which reports mean temperatures of 97.8 °C and 94.3 °C for BF and CF2, respectively. The 3.5 °C difference was caused by the failure of one of the fluid heater resistors, as described in Section 2.2.1. Since BF was the fluid under primary investigation, we decided to continue testing CF2, albeit at a lower level of thermal stress. As the fluid preheating before it enters the transmission box is performed by the same water–glycol solution from the main heater, the heater resistor failure also affected the temperatures of the CF2 inside the multiplier (Figure 5b), which were lower than those of BF, resulting in reduced thermal stress in this section as well.
Table 5 summarizes the statistical descriptors of the parameters discussed earlier, including the fluid temperature in the reservoir. The low values for standard deviation, CV, and standard error (SE) confirm that test conditions remained stable from start to finish. As expected, the highest values for these descriptors were found in the BF fluid’s multiplier shaft rotational speed. As shown in Figure 4, this speed was deliberately increased from 1650 min−1 to about 1900 min−1. This rise in speed led to a corresponding increase in the CV for the power at the transmission shaft. Despite these issues, the average values of the main parameters for the two fluids are very similar. This similarity validates the findings of previous studies that demonstrated the repeatability of the FTR work cycle for comparative tests [47,58].
Using the average hydraulic and mechanical power values from Table 5, we estimated the total energy (kWh) and specific energy (kWh dm−3) conveyed by the two fluids. This calculation used an average fluid volume of 17.5 dm3 (derived from the initial 25 dm3 and final 10 dm3 volumes) and the test duration. The results are presented in Table 6, broken down by section and as a total. Power losses were also used to calculate the thermal energy (kWh) and specific thermal energy (kWh dm−3) based on the efficiency of the FTR’s hydraulic pump and transmission. The longer test duration for BF meant it endured greater overall stress than CF2 in both total work energy (711.5 kWh dm−3 vs. 606.7 kWh dm−3) and dissipated heat (58.9 kWh dm−3 vs. 50.0 kWh dm−3).
Table 6 also presents the mean thermal leaps, ΔT (°C), that the fluids experienced during each pass through the FTR’s hydraulic and transmission circuits. In the hydraulic circuit, the expected thermal leap caused only by pressure increase and fluid lamination would be approximately 20 °C (the difference between 80 °C at the 40 Mpa valve outlet and 60 °C in the main circuit). The higher thermal leap values reported in Table 6 (Mean ΔT) are a result of the additional thermal stress from the fluid pre-heater located between the high-pressure pump and the overpressure valve. This means the additional thermal leaps in the hydraulic circuit were 17.7 °C for BF and 14.3 °C for CF2, calculated as the difference between the ΔT values with the pre-heater (Table 6) and the value without it (80 °C). Similarly, in the transmission circuit, the fluid temperature at the gearbox outlet would be 70 °C without the pre-heater. With the pre-heater, however, the temperatures reached the values shown in Table 6, resulting in additional thermal leaps of 14.2 °C for BF and 12.3 °C for CF2. Based on the average flow rates from Table 5 and a reservoir capacity of 25 dm3, the BF fluid completed 16.8 passes per hour in the hydraulic circuit, for a total of 7039 passes over the 420-h test. For CF2, the total number of passes was 5866 after 350 h. Similar calculations can be made for the transmission circuit: with a gearbox volume of 2.6 dm3 and a fluid flow rate of 12 dm3 h−1, the fluid’s residence time inside the transmission per pass was 0.21 h (or 12.6 min). The total number of passes for the 25 dm3 of fluid through the transmission was 202 for BF and 168 for CF2.
The additional thermal energy generated by the fluid heaters and transported by the fluids was calculated based on flow rates, additional thermal leaps, and the number of fluid passes through the two FTR circuits. We assumed a specific heat capacity of 2.89 J g−1 °C−1 for new synthetic lubricants at 80 °C [75]. The mass of the fluid involved in each pass was calculated as follows:
(1) Hydraulic circuit: the mass of fluid in this section was 1587 g for BF and 1489 g for CF2. These values were obtained by multiplying the circuit’s total internal volume (1700 cm3) by the fluids’ respective densities: 940 kg m−3 for BF and 882 kg m−3 for CF2 (Table 2).
(2) Transmission circuit: The fluid mass within the speed multiplier was 2244 g for BF and 2293 g for CF2. This was calculated by multiplying the internal volume (2600 cm3) by the respective densities from Table 2.
Based on this data, Table 7 presents the results of the additional thermal energy and specific thermal energy assessment for both fluids in the FTR. The additional thermal specific energy values are 6.57 kWh dm−3 for BF and 4.16 kWh dm−3 for CF2. These values should be added to the total thermal leaps reported in Table 6 to provide a complete picture of the total energy conveyed by the fluids during the FTR tests.
The above values might appear low at first glance. However, it is crucial to consider that the fluid heaters significantly increase the operating temperatures, which makes the molecular structures of both the base stock and additives more susceptible to mechanical stress from the gears and fluid lamination. This point is strongly supported by the data in Table 8, which show how the manufacturer-recommended oil replacement intervals for the FTR speed multiplier decrease as the operating temperatures increase [76]. This highlights that even what seems like low energy values can have a significant impact on fluid degradation when combined with high temperatures.
The intervals of time reported in Table 8 are quite long and can often span the entire lifetime of the equipment (the default lubrication system was based on a static fluid in the gearbox). However, these intervals decrease significantly as temperatures rise.
For example, the lifetime of the synthetic oil recommended by the manufacturer, Shell Omala S4 WE 220 (Shell Lubricants, Houston, Texas, USA), would be 18,000 h at 70 °C (the operating temperature within the multiplier without a heater). In contrast, at 87 °C (the temperature with a heater), its life would be reduced to 12,500 h. Although this study’s lubrication system relies on the circulation and periodic replacement of lubricants with lower viscosity and density, we assume that the effect of increased operating temperatures on the lubricant’s life is similar to the example provided.
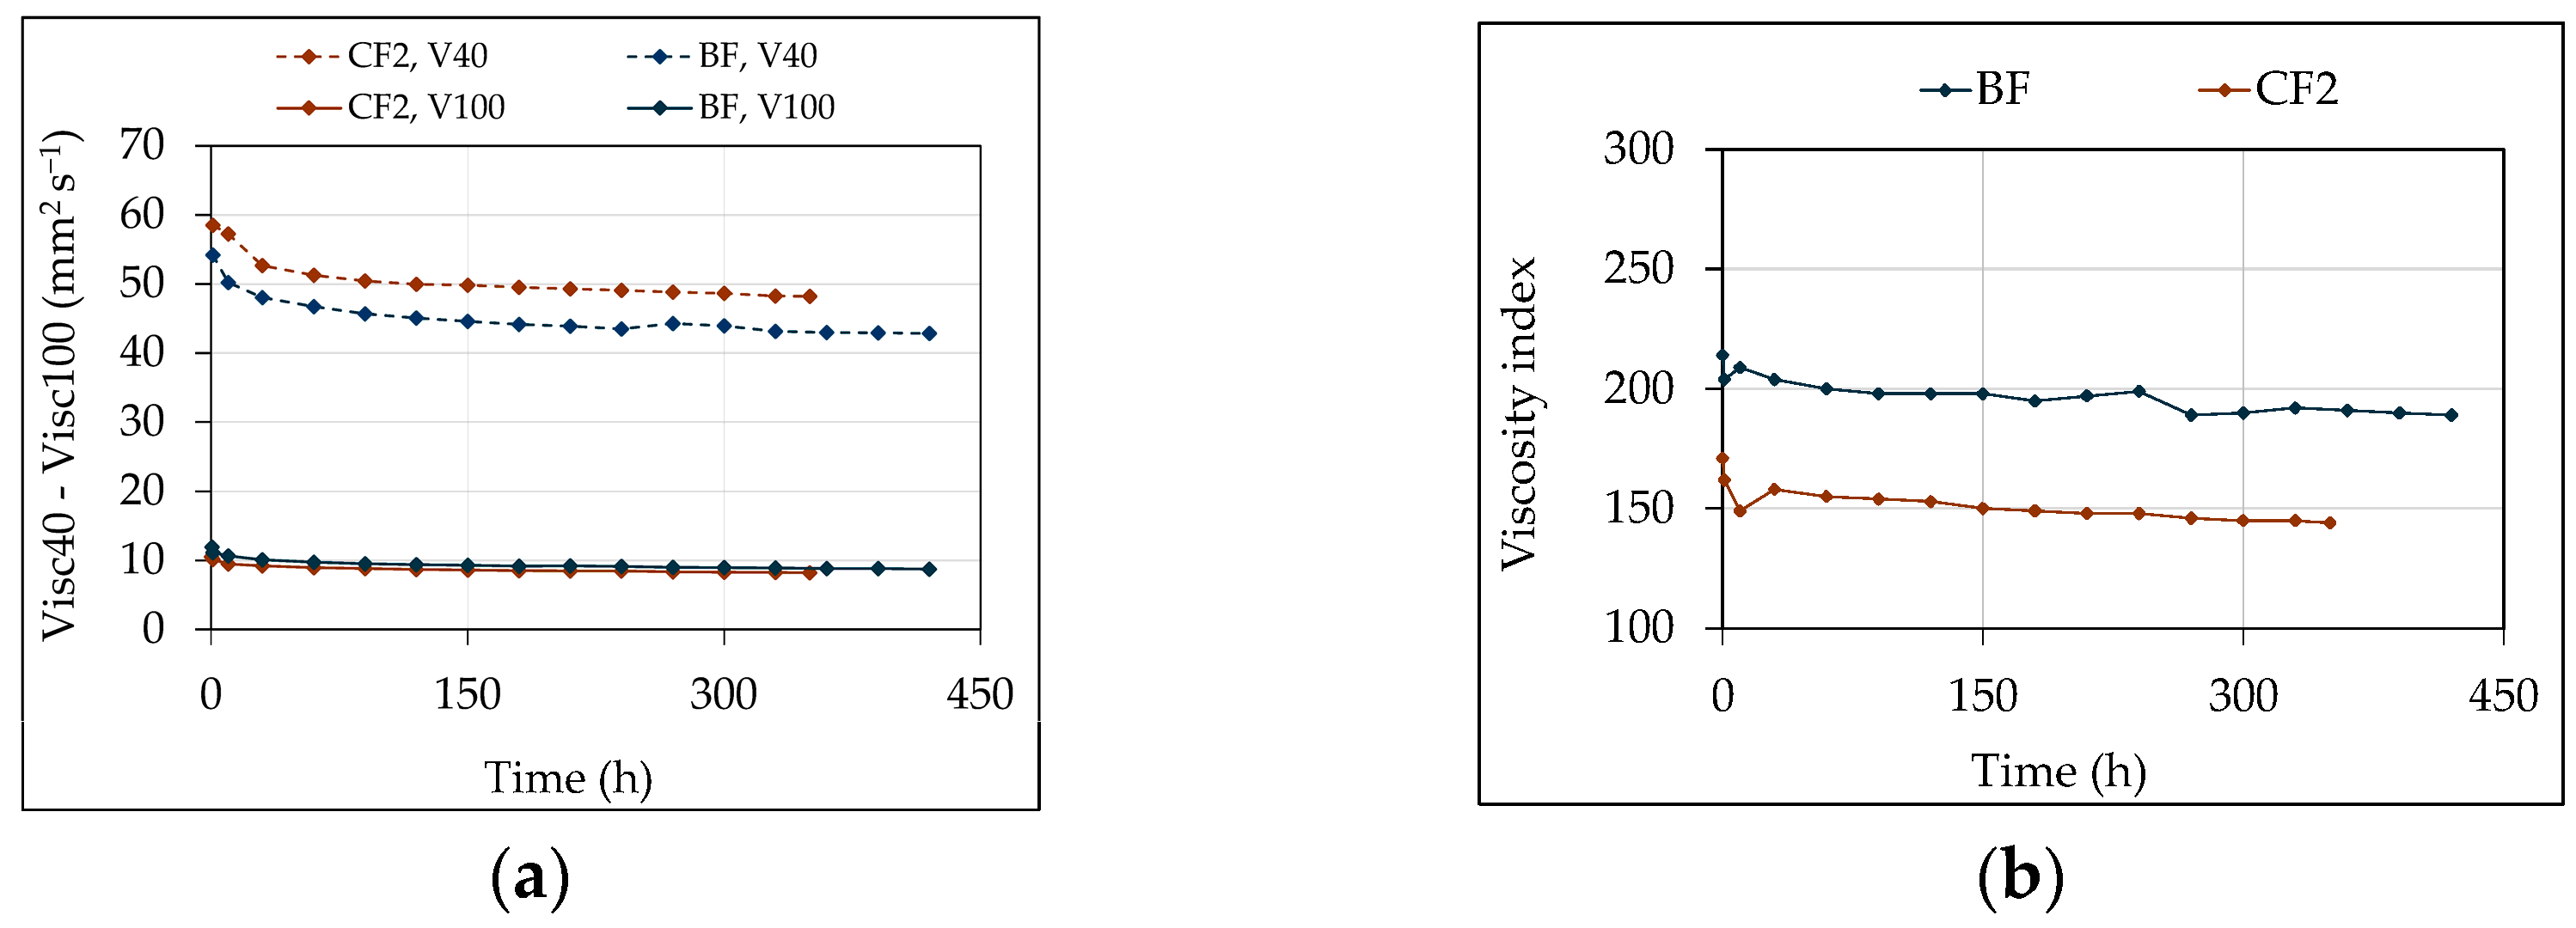
The comparison between BF and CF2 also included tracking the evolution of key parameters during the FTR test. These parameters serve as indicators of their suitability as lubricants and hydraulic fluids, as well as their overall efficiency. Figure 6 shows the trends for kinematic viscosity at 40 °C (V40) and 100 °C (V100), Viscosity Index (VI), and the change in viscosity at 40 °C (Δvisc). Fluid samples were collected at the start of the tests (0, 1, and 10 h) and then at 30-h intervals until the tests concluded. This meant a total duration of 420 h for BF and 350 h for CF2.
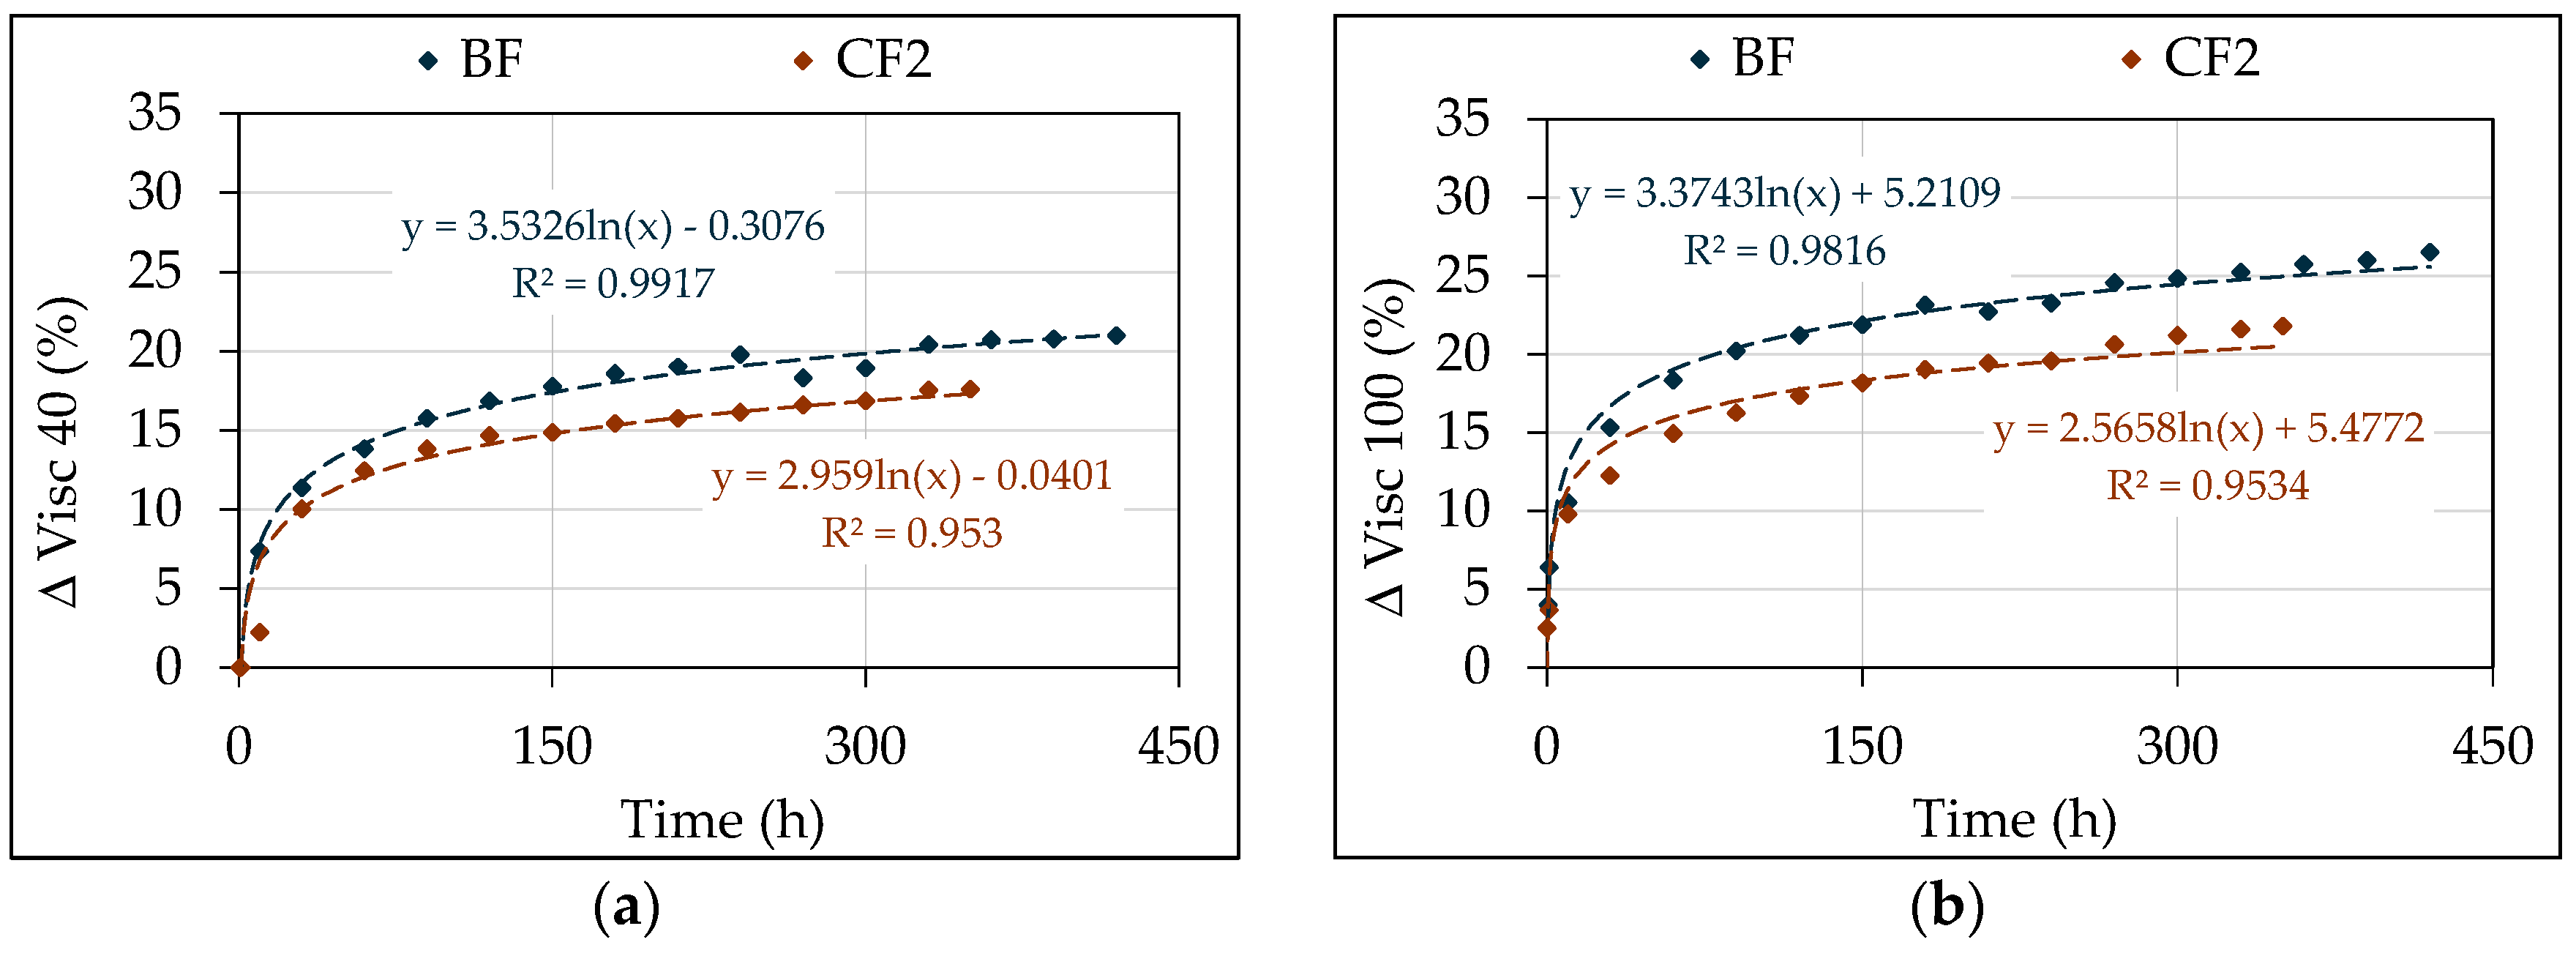
The kinematic viscosity curves for the two fluids follow a nearly parallel path throughout the test (Figure 6a). A mean difference of 4.9 mm2 s−1 between the initial viscosity values remains consistent throughout the test. A similar pattern is observed for V100, though the curves are closer together. For both fluids, viscosity drops sharply in the early stages. After 40 h, the decline becomes less pronounced, and for BF, it stabilizes entirely after 360 h until the test’s conclusion. Figure 6b illustrates the Viscosity Index (V.I.) trend. While the V.I. of BF is higher than that of CF2, both fluids show negative peaks in the first 10 h. Their values then recover and begin a more consistent decrease, similar to the viscosity trends, maintaining a stable difference between the two fluids. Figure 7 shows the percentage change in V40 and V100. Again, the trends were similar. Although the viscosity change (Δvisc) was larger for BF (partially because of its lower starting value), this did not affect its Viscosity Index, which remained significantly higher than CF2’s, as confirmed in Figure 6b. A comparison of the V40, V100, V.I., ΔV40, and ΔV100 values for both fluids using the Pearson’s test confirmed that the two fluids behave in a similar manner under the same test conditions. The results are presented in Table 9.
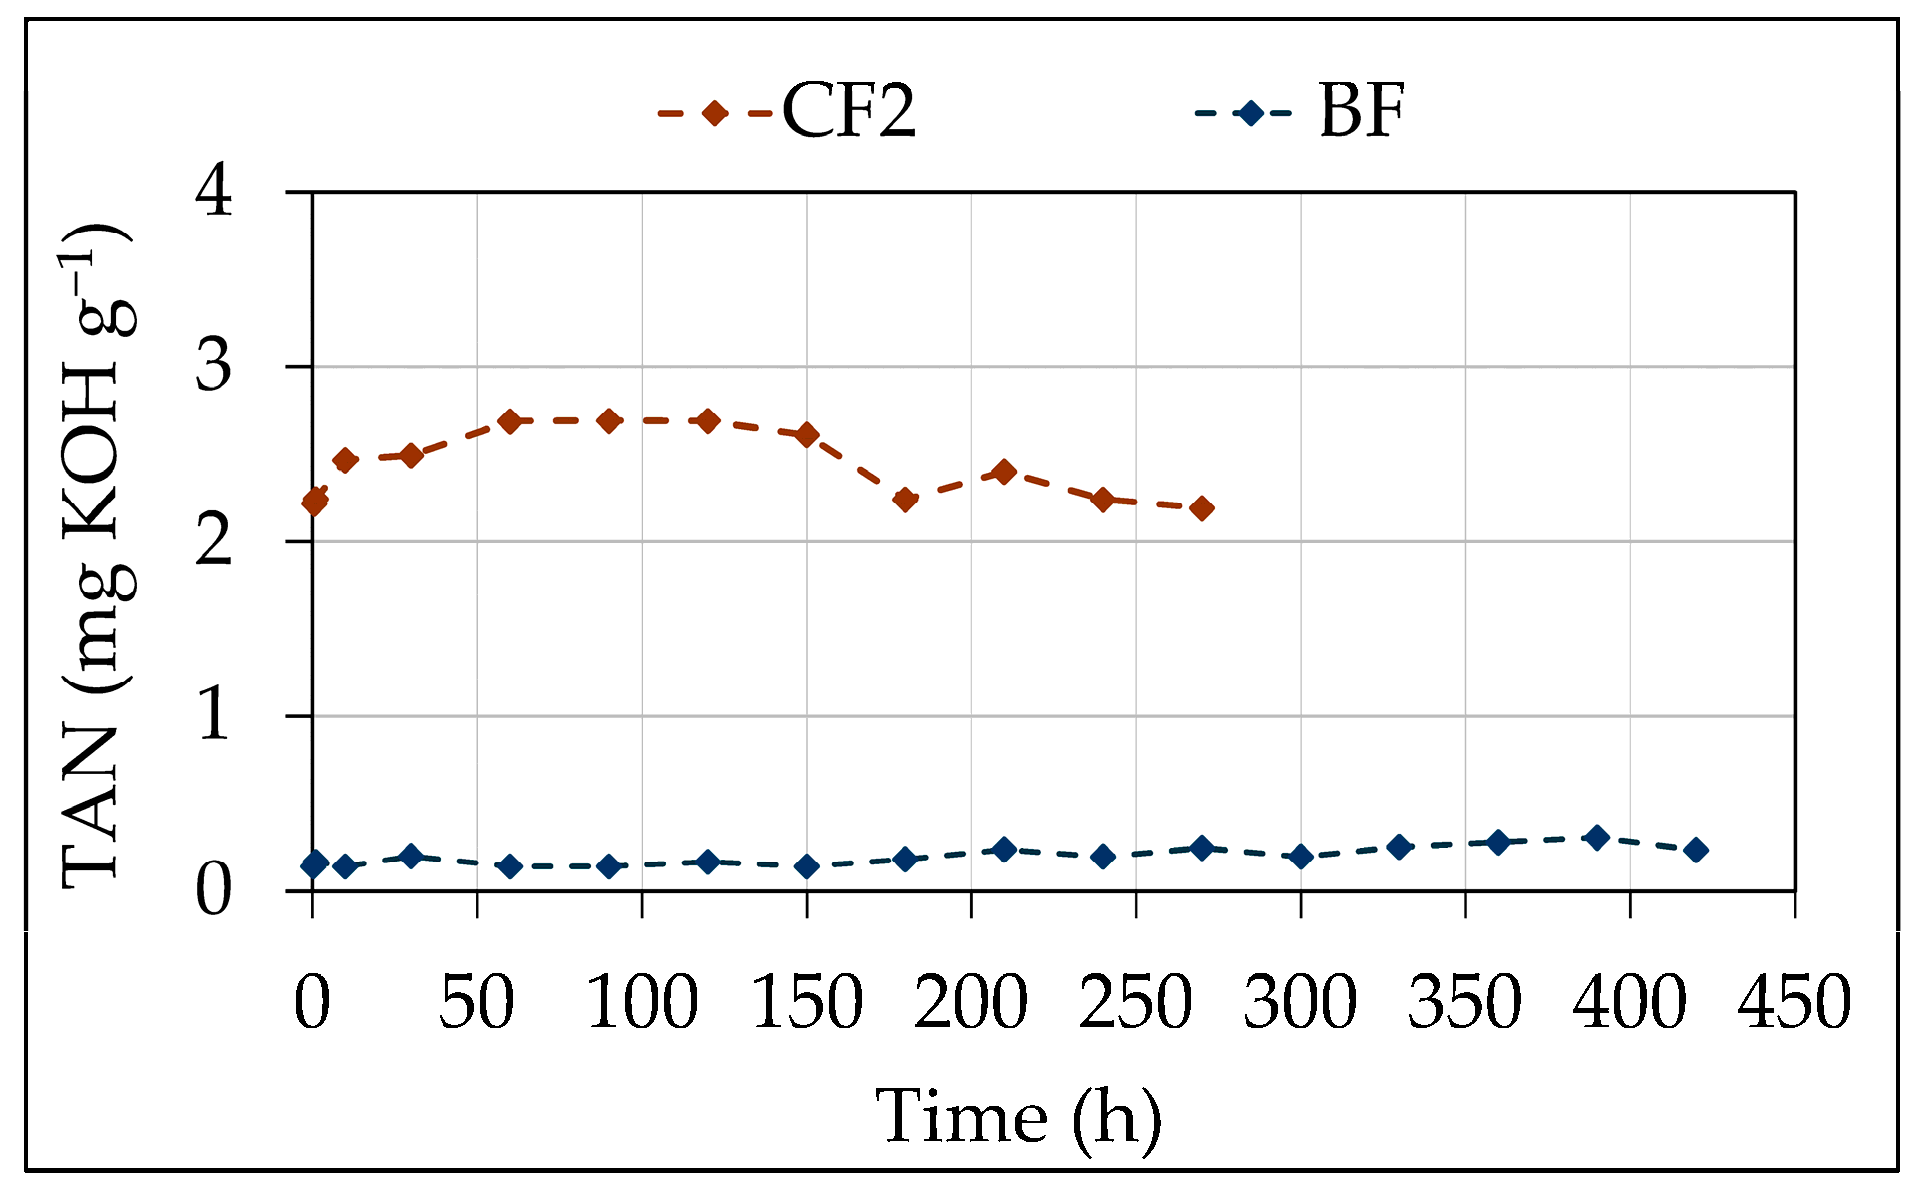
Figure 8 illustrates the trend of the total acid number (TAN) for samples of both fluids [77]. At the beginning of the tests, the fluids had different TAN levels: BF had a very low value of 0.14 mg KOH g−1 (which was lower than the datasheet value in Table 2), while in CF2, it was significantly higher (2.22 mg KOH g−1). The diagrams show that the TAN remained generally stable for both fluids throughout the tests. This stability was more pronounced for BF until the end of its test. CF2 showed some irregularities, which were likely caused by interference from the oil’s additives during analysis. Due to these challenges, the TAN determination for CF2 was stopped after 270 h.
In addition to kinematic viscosity and TAN, samples of BF were also analyzed to detect elements from wear and contamination, as well as the presence of additives and suspended particles. The results are summarized in Table 10, alongside those for all other tested fluids, reporting the values observed at the beginning and end of their respective tests. The elemental analysis on BF-FTR showed no significant changes in concentrations between the start and end of the test. Interestingly, the presence of contaminant particles decreased during the test, as shown by the three classification codes in Table 10. This was likely due to a high initial concentration of particles in the new oil, possibly from a contaminated container. These particles were then effectively removed by the FTR’s filtering system.

3.2. Tests of the Tractor at the Dynamometric Brake (T2)—Comparison Between Matrol Bi (BF) and Vela B (CF1)

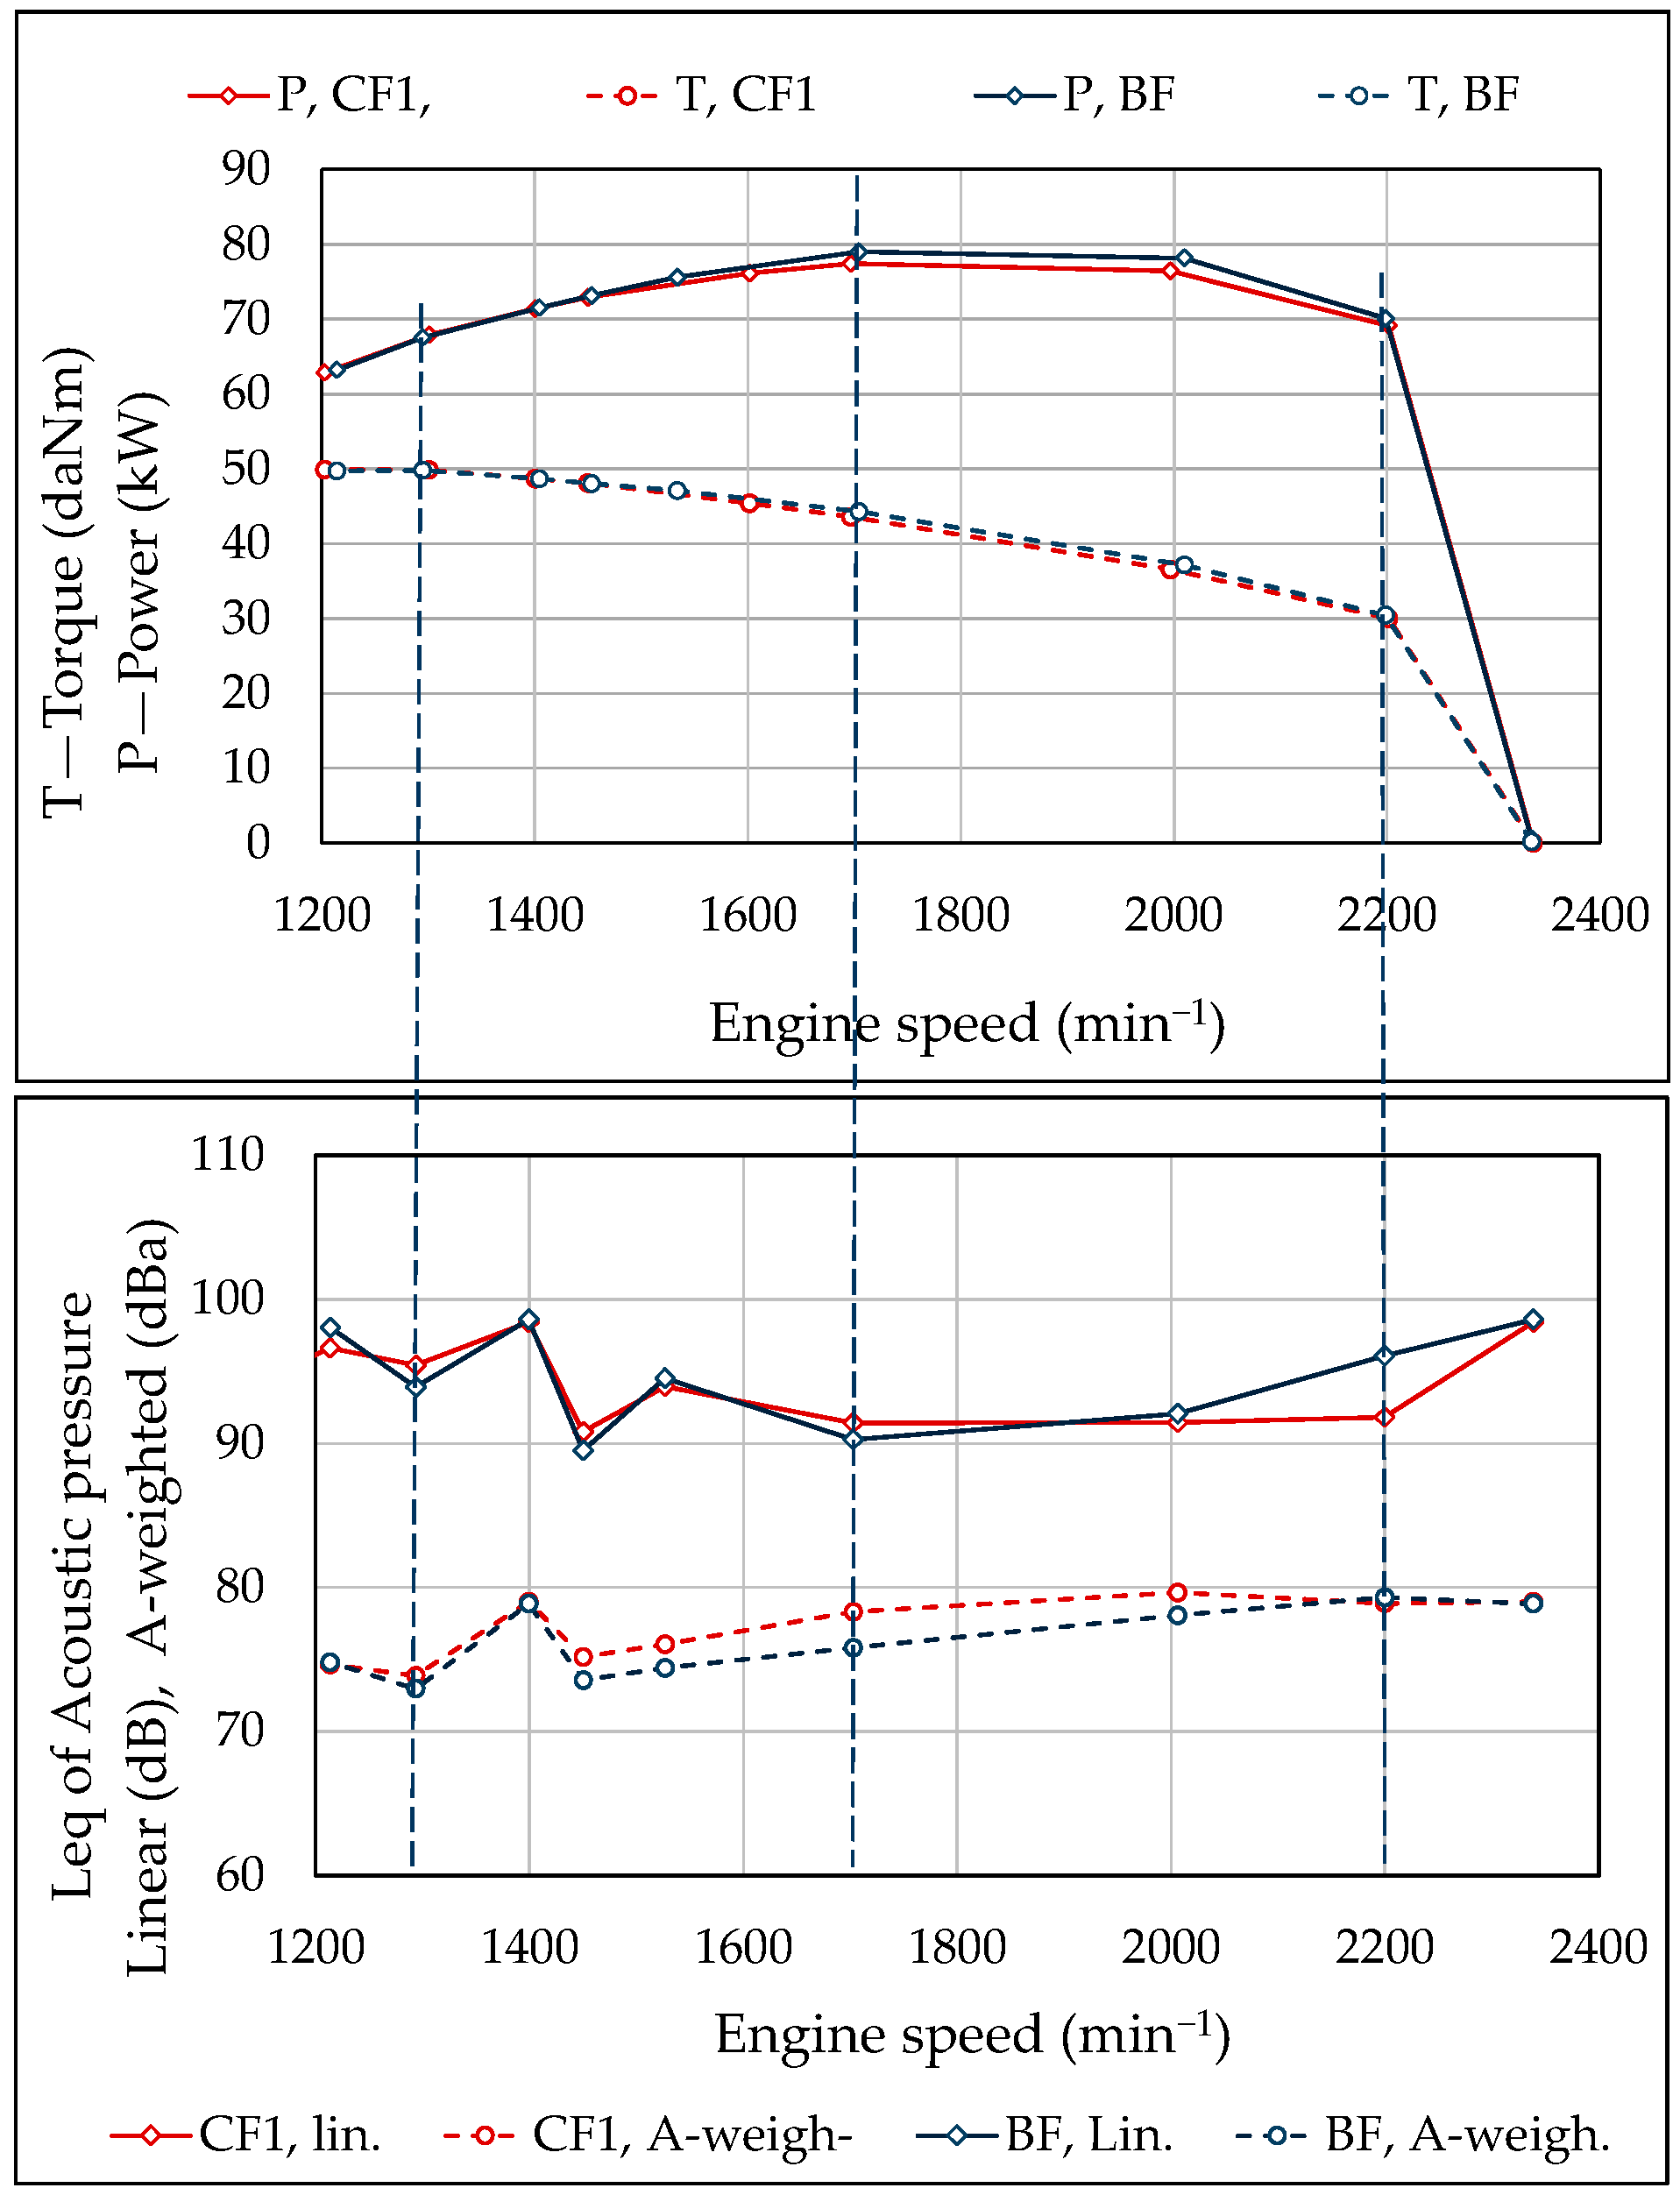
The objective of test T2 was to verify the tractor’s efficiency before starting the in-field test with BF. To achieve this, the tractor was first tested on a dynamometric brake using the original UTTO, CF1, at the end of its service life. Subsequently, the CF1 was removed via a rigorous procedure involving several flushes with BF and oil filter replacements to eliminate as many residues as possible. Finally, the tractor was refilled with fresh BF, new oil filters were installed, and it was tested again on the dynamometric brake. As described in Section 2.3, these tests produced engine characteristic curves for torque and power for each fluid. These curves were plotted with engine speed on the x-axis and the measured torque and power values on the y-axis. Additionally, the acoustic pressure level at the driver’s ear in the cabin was measured at each data point, resulting in noise curves across the tractor’s working range. The results of these measurements are shown in the diagrams in Figure 9. The power and torque curves for BF show a higher trend than those for CF1. The maximum power values were 79.02 kW for BF and 77.43 kW for CF1. This 2% difference suggests an increase in efficiency in the transmission of motion from the crankshaft to the PTO. This improvement is likely due to the replacement of the exhausted CF1 (which had run for 1400 h, exceeding the recommended 1000 h) with the new BF. The BF fluid’s 40 °C viscosity was significantly lower than the 68.63 mm2 s−1 of the exhausted CF1, despite the 20.66% drop in the exhausted CF1’s viscosity compared to the new CF1, as shown in Table 10. Comparing new and exhausted CF1, the data in Table 10 show a significant reduction in kinematic viscosity, which paradoxically led to a slight increase in the Viscosity Index (V.I.). The elemental analysis of exhausted CF1 revealed the presence of Fe, Al, Pb, and Cu, indicating the onset of a wear process. Furthermore, an increased presence of suspended particles pointed to the poor efficiency of the filters in handling contaminants typical of field work, which enter the oil, especially through the exchange of fluids in hydraulic connections between the tractor and implements. In contrast, the BF fluid did not undergo significant changes after the dynamometric brake tests and 586 h of use in the tractor, with only traces of Fe, Cu, and Pb detected in the elemental analyses. The RPVOT test results indicated a residual oxidation resistance of 185 min, or 59.1% of the 313 min observed in the new oil.
Figure 9 illustrates how acoustic pressure changed with the engine’s working conditions. The linear acoustic pressure curve for BF is higher than for CF1 at engine speeds above 2000 min−1. However, it is lower between 2000 and 1550 min−1, an interval that includes the maximum power point at 1700 min−1. Below 1550 min−1, the acoustic pressures for both fluids have very similar highs and lows. On the other hand, the A-weighted acoustic pressure curve for BF is consistently about 2.5 dB(A) lower than for CF1 in the 2.200–1.450 min−1 range and is very similar in other intervals. Given that the A-weighting filter emphasizes high frequencies (>400 Hz) that are particularly dangerous to human hearing, the difference in behavior between the linear and A-weighted curves suggests that BF reduces noise emissions in the high-frequency range. This conclusion was confirmed by the frequency analysis of the noise measurements. As examples, Figure 10 shows the frequency analysis diagrams for three specific engine conditions, marked by dotted blue lines in Figure 9: (1) engine speed: 2.200 min−1, power: 70 kW; (2) engine speed: 1.703 min−1, maximum power; (3) engine speed: 1.295 min−1, maximum torque.
Figure 10b shows the results of the frequency analysis for the maximum power conditions. It can be observed that the A-weighted pressure with BF (dotted blue curve) has a more regular trend at frequencies higher than 200 Hz. It also has fewer peaks (e.g., at 250, 1250, and 3150 Hz) and is generally lower than with CF1 (red dotted curve). This explains the lower equivalent A-weighted acoustic pressure level observed in Figure 9 in the 2200–1450 min−1 interval. This behavior likely indicates smoother operation of the transmission, resulting from better lubrication provided by BF compared to the now deteriorated CF1.

3.3. Test of BF on the Tractor in Operative Conditions

Subsequent to the replacement of the CF1 with the BF and the T2 test session, the tractor performed various agricultural and research activities until the time of this paper’s submission, accumulating a total of 586 operating hours. The use of the tractor is detailed in Table 11, which also quantifies the energy (work and heat) transferred by the BF to the transmission and hydraulic system during each activity. This energy was evaluated based on the total operational time and the average power draw. The sum of the total working times reported in Table 11 exceeds 586 h, because the majority of operations involved the simultaneous engagement of two or three functions.
Following the methodology of Test 1 (T1), the total work and thermal energy values derived for each function were normalized by dividing by the fluid volume in the tractor’s reservoir (87 dm3). This process yielded the following specific energy metrics: (1) total specific work: 120.4 kWh/dm3, with 67.7% attributed to the drive train, 23.8% to the PTO, and 8.5% to the hydraulic system. (2) Total specific thermal energy: 16.7 kWh/dm3, with 38.9% in the drive train, 8.9% in the PTO, and 52.1% in the hydraulic system.
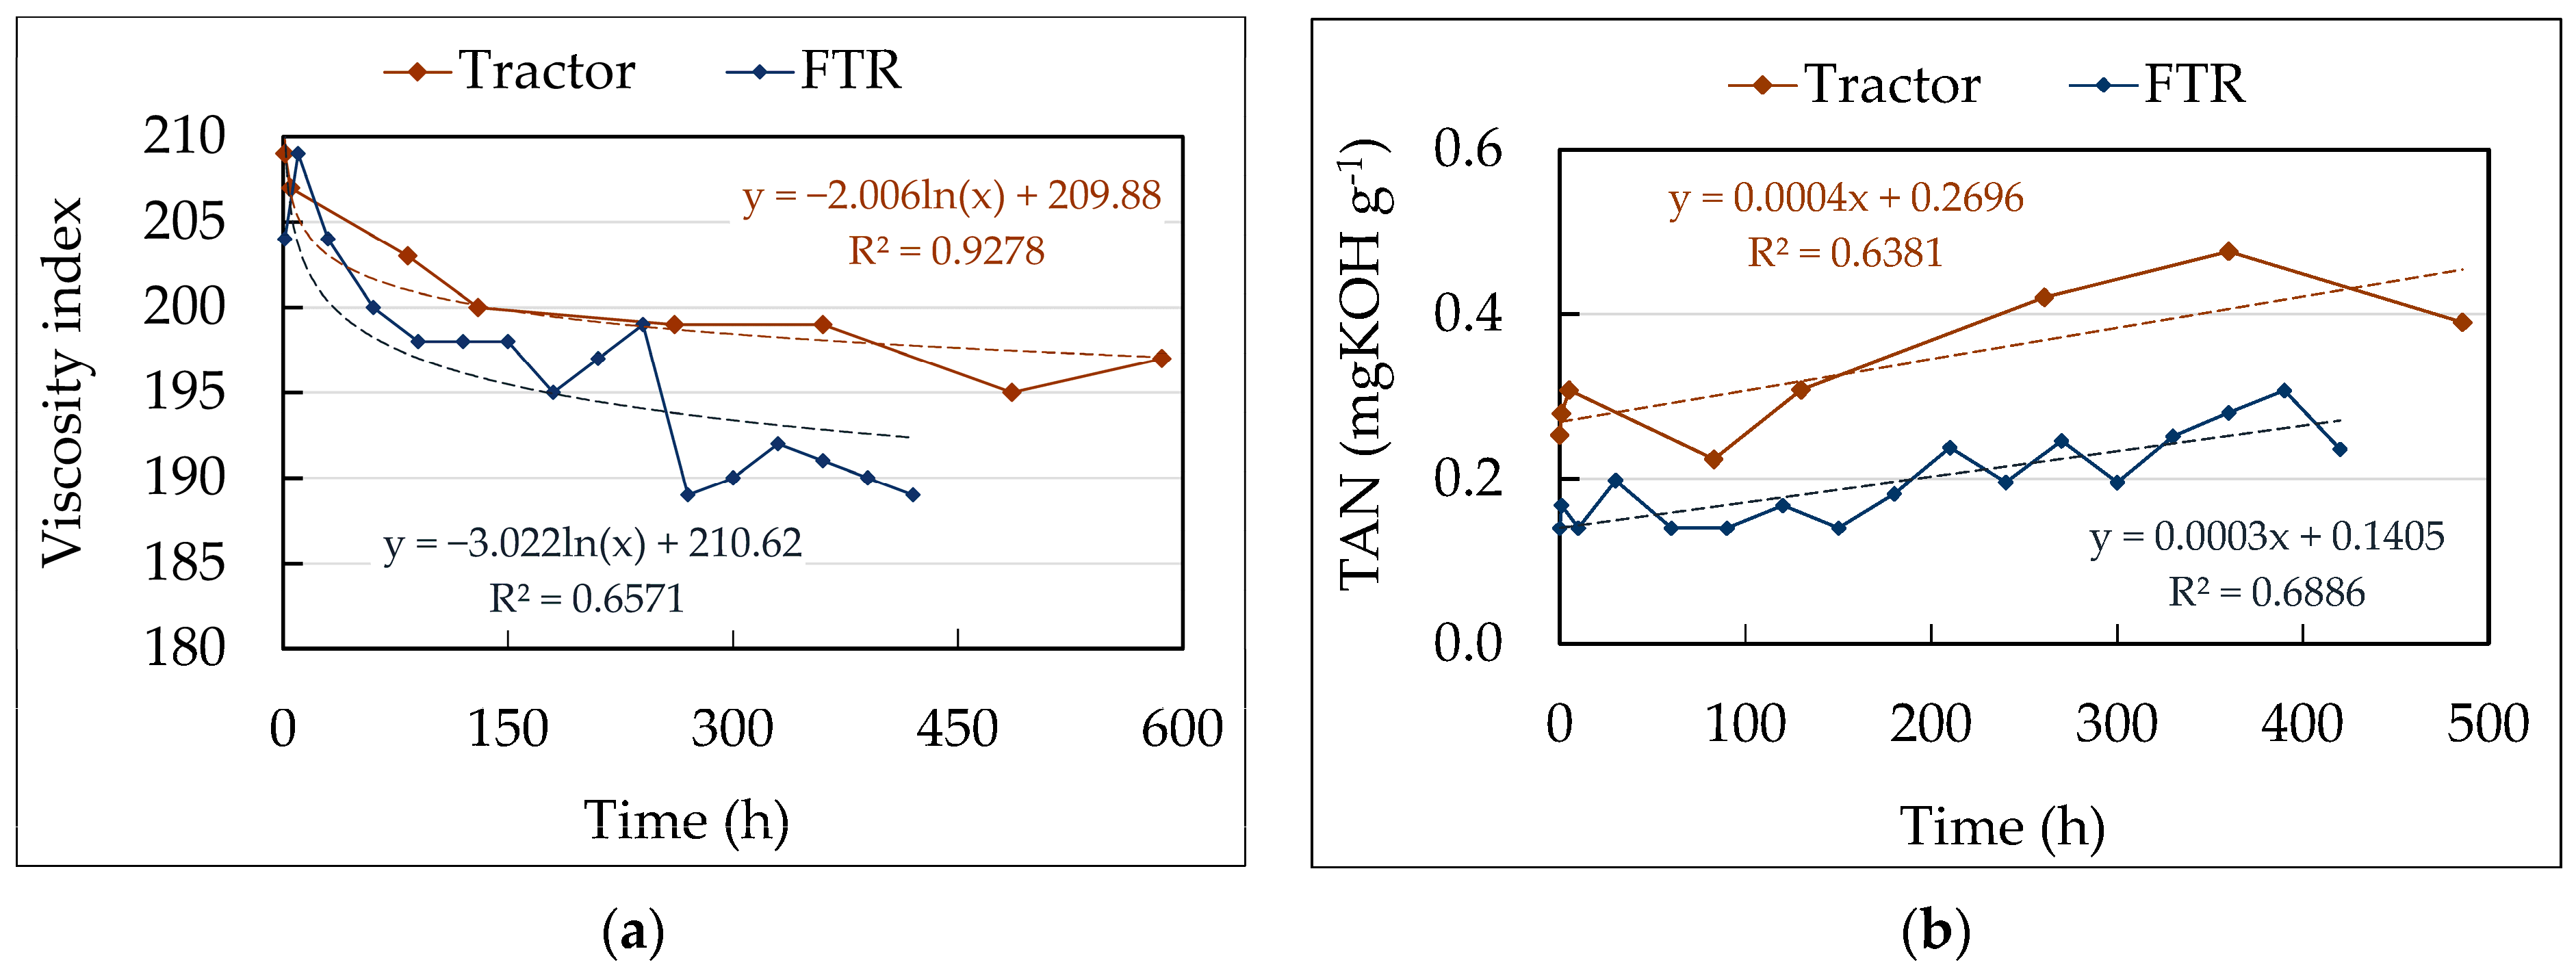
A comparison of these values (Table 11) with the results from T1 (Table 6) permits an evaluation of the workload intensity applied to the BF within both the FTR and the tractor. The mechanical specific work for the entire tractor transmission (the sum of the drive train and PTO) was 110.2 kWh/dm3 in T3, whereas it was 591.7 kWh/dm3 in the FTR T1 session. Similarly, hydraulic-specific work was 10.2 kWh/dm3 in T3 and 119.8 kWh/dm3 in T1. These data demonstrate that the 420-h FTR work cycle represented a significantly more severe test for the BF than the 586 h of standard tractor usage. In light of these considerations, the results of the BF monitoring in the tractor during T3 gain significance. Figure 11a,b present a comparison of the trends for kinematic viscosity at 40 °C (V40) and 100 °C (V100) observed in T3 against those from the FTR test (T1). The two diagrams reveal clear distinctions in behavior. During T3, the viscosity experienced an initial, physiological drop [78] within the first 10 h of operation, after which the decrease proceeded at a very slow and constant rate. By the conclusion of the test, the percentage decreases were 8.3% for V40 and 12.6% for V100, while the Viscosity Index remained high at 198, which is a value still considerably greater than the Vis of both CF1 and CF2 (Table 10). Conversely, the V40 and V100 curves in T1 exhibited a significant reduction during the Initial 50 h, followed by a gradual and constant decline. These behaviors are reflected in the trend of the absolute percentage variation of viscosity (ΔV) relative to the initial value. For instance, Figure 11c illustrates the time-dependent diagram of ΔV40. In the T3 test, ΔV increased progressively from the second data point (time > 10 h) to a final value of 12.5% after 586 h. In contrast, the FTR test showed a very rapid change within the first 50–60 h, followed by a gradual increase to approximately 23.7%.
The differences between T3 and T1 results can likely be attributed to the higher shear stress endured by the BF during the FTR work cycle. This more demanding workload also had a differential impact on the Viscosity Index (V.I.), resulting in a substantially steeper decreasing trend during the FTR test compared to the tractor usage (Figure 12a). At the conclusion of T3, the V.I. was approximately 197.5, while at the end of T1, it was about 189. Notably, both final V.I. values remained significantly higher than those of both BF1 and BF2.
Notwithstanding the aforementioned observations, the analyses of the BF samples from T1 yielded encouraging results regarding the oil’s overall condition. The evolution of the total acid number (TAN) for both T1 and T3 is presented in Figure 12b. Despite differing initial TAN values (which were very low in both instances) and some minor value oscillations (due to the previously mentioned additive interference with analytical precision), the two curves followed similar trajectories, exhibiting only slight increases and maintaining low final values of 0.39 mg KOH/g in T3 and 0.24 mg KOH/g in T1 (Table 10). The slightly steeper linear regression curve for the “Tractor” data suggests a potential for greater sensitivity of the BF to oxidation, most likely stemming from the higher levels of contamination characteristic of tractor operation. Nevertheless, the substantial absence of significant oxidative phenomena indicates that the shear stress primarily impacted the molecular structure of the viscosifier additives—which was the cause of the initial viscosity drop—rather than the BF’s base stock. In addition, analyses of the BF samples from T3 and T1 did not reveal any significant wear phenomena. The elemental analysis results at the beginning and end of T1 were highly consistent. Conversely, at the end of T3, small quantities of Fe and Cu were detected. The MECOIL Lab analysis certificate classified these as “physiological,” and they may have been caused, at least in part, by the contamination of BF with residual CF1 (which had high Fe and Cu values) that persisted after the oil change despite the flushing procedure.
The energetic performance and parameter evolution of the BF in the tractor test (T3), when compared to those observed in the FTR test (T1), provide evidence of the biofluid’s excellent behavior in normal farm activities. A quantitative comparison of specific energy transport further illustrates this difference in workload intensity: (1) the work energy carried by the BF in the FTR was 5.9 times higher than that in the tractor, with specific work values of 711.5 kWh/dm3 (T1) and 120.4 kWh/dm3 (T3), respectively; (2) similarly, the ratio between the specific overall thermal energy dissipated by the BF in the FTR (58.9 kWh/dm3) and in the tractor (8.7 kWh/dm3) was 6.8, not including the additional thermal energy detailed in Table 7. Furthermore, Figure 11 and Figure 12 show that the final values for V40, V100, ΔV40, and V.I. observed after 586 h in T3 correspond to values reached after only a few hours in T1. The high R2 regression values confirm that these functions accurately describe the experimental data. Based on these findings, the theoretical lifespan of the BF in the tractor could be several thousand hours. For instance, using the ratio of 5.9 for specific work energy, the BF would need 3457 h (5.9 × 586 h) to sustain the same workload as the 420-h FTR test. Similarly, the regression function in Figure 11c predicts that it would take 3670 h for the ΔV40 to reach 20%.
However, these theoretical lifespans contrast with the common manufacturer recommendation of 1000-h oil change intervals. This precautionary interval accounts for real-world factors that shorten oil life, such as high levels of contamination from dust and residual fluids, as well as extreme environmental conditions and power demands.
Despite this, the comparative evaluation of the T1 and T3 results remains overwhelmingly positive for the BF’s performance. A more practical metric for estimating residual oil life after the 586-h test is the Rotating Pressure Vessel Oxidation Test (RPVOT) results. The RPVOT values were 313 min for new oil and 185 min after 586 h (Table 10). This indicates that the fluid’s residual oxidation stability after 586 h was 59.1% of its initial stability, corresponding to an additional 843 h of work, for a total lifespan of 1429 h. This total is perfectly in line with the recommended 1000-h interval.
In summary, this study highlights several key findings:
The substantial equivalence of BF and CF2 during the FTR tests in terms of technical performance and the evolution of their main properties.
A slight improvement in tractor performance and a minor reduction in noise emissions under high engine load after replacing the exhausted CF1 with BF.
The FTR tests represent significantly more severe working conditions for the fluid compared to typical field usage, confirming the FTR’s suitability for reliable and rapid fluid evaluation.
The BF showed overall excellent performance over 586 h of field use, with no reported problems. Visual inspections and sample analyses confirmed the absence of leaks, material damage, or wear elements. The final sample showed no signs of turbidity, sediments, or acidic odors, and the tractor driver reported no malfunctions or difficulties.
The ongoing test of the BF in the tractor is expected to provide more precise information regarding its duration through future oil monitoring. However, the current results suggest that the BF appears suitable for use in agricultural tractors, at least in less complex machines similar to the one utilized in this study. Conversely, the introduction of bio-UTTOs such as BF into modern tractors—which are frequently equipped with sophisticated hydraulic transmissions, high-power hydraulic systems, wet multi-disc brakes, and clutches—will be contingent upon the results of specific, dedicated studies. These studies must be designed to meticulously evaluate the response of each of these advanced systems to the new fluid formulation.

4. Conclusions

An experimental UTTO fluid formulated from a blend of highly refined, oxidation-stable high-oleic vegetable oils and saturated renewable synthetic esters was first tested in a Fluid Test Rig (FTR). The goal was to evaluate its technical performance and physicochemical properties against a conventional mineral fluid. Subsequently, it was used in an agricultural tractor, replacing the same mineral UTTO, to assess its reliability as a transmission lubricant and for the tractor’s hydraulic system. The FTR tests demonstrated that after a 420-h work cycle, the bio-UTTO maintained its technical performance and physico-chemical properties, behaving similarly to the conventional mineral fluid during its 350-h test. The primary change for both fluids was a decrease in kinematic viscosity, mostly concentrated within the first 40–60 h. For instance, at 60 h, the conventional UTTO’s viscosity had dropped by approximately 12.5% at 40 °C and 14.9% at 100 °C. The bio-UTTO’s viscosity drop was higher, at 16.8% and 18.3%, respectively, because it referred to a lower initial viscosity. However, the bio-UTTO maintained a much higher Viscosity Index (VI > 190) than the conventional fluid (VI < 150).
During the tractor dynamometer tests (T2), the introduction of the bio-UTTO resulted in a 1.59% increase in PTO power, with maximum power values of 79.02 kW for the bio-UTTO and 77.43 kW for the exhausted mineral UTTO. This improvement was likely due to higher transmission efficiency from the lower viscosity of the bio-UTTO and the poor condition of the exhausted mineral fluid. This behavior could be further explored in future comparative FTR tests on transmission efficiency using new biofluids and conventional fluids with different viscosities. The lower viscosity of the bio-UTTO and the poor condition of the conventional UTTO likely also resulted in smoother transmission operation, which explains the approximately 4% lower weighted sound pressure levels in the tractor cab. This reduction was particularly noticeable in the most critical operating range, between the engine’s maximum power and maximum torque points. After 586 h of tractor use in normal farm activities, the bio-UTTO’s physico-chemical parameters did not change significantly. The viscosity decrease of 8.3% at 40 °C and 13.1% at 100 °C is considered physiological and did not compromise the efficiency of lubrication or the hydraulic system. Furthermore, the Rotating Pressure Vessel Oxidation Test (RPVOT) indicated that the bio-UTTO still retains 59% of its antioxidant capacity, suggesting a theoretical residual life of 843 h before the onset of oxidative phenomena. No signs of wear or contamination were observed in the oil, nor was there any damage to tractor materials or oil leaks. Finally, the driver reported no significant operational differences or cold-starting difficulties with the bio-UTTO. The bio-UTTO tractor test is still in progress and will provide further information on its overall lifespan. However, based on the current results, the bio-UTTO appears ready for use in tractors with characteristics similar to those in this study. Its application in more modern and sophisticated tractors needs to be evaluated in specific studies concerning the performance of various components (e.g., continuously variable hydraulic transmissions, high-power hydraulic systems, and multi-disc wet brakes). Finally, a comparison of the bio-UTTO’s performance in the FTR test (T1) and the tractor test (T3) highlighted that the FTR work cycles are more severe than typical farm activities. This is evidenced by the higher mechanical specific work values: 591.7 kWh/dm3 after 420 h in the FTR versus 110.2 kWh/dm3 after 586 h in the tractor. Similarly, the hydraulic specific work was 119.8 kWh/dm3 and 10.2 kWh/dm3, respectively. The specific thermal energy dissipated by the fluid in both tests showed a similar pattern. Consequently, the initial viscosity drop observed in the FTR in the very first hours of the test is much more gradual in the tractor test. After 586 h in the tractor, the viscosity decrease is 13.1%, a value reached in the FTR after only approximately 20 h. Therefore, the FTR appears to be a suitable instrument for the preliminary evaluation of new formulations as potential biolubricants and for selecting the most promising candidates for testing under real work operating conditions.

Author Contributions

Conceptualization, R.F. and D.P.; data curation, R.F. and D.P.; formal analysis, R.G. and L.F.; funding acquisition, D.P.; investigation, D.P.; methodology, R.F. and D.P.; project administration, S.B.; resources, S.B.; software, D.P.; supervision, S.B.; validation, R.F. and D.P.; visualization, R.G. and L.F.; writing—original draft, R.F.; writing—review and editing, D.P. All authors have read and agreed to the published version of the manuscript.

Funding

Ministero per le Politiche Agricole Alimentari e forestali: AGROENER project (D.D. n. 26329, 1 April 2016). https://agroener.crea.gov.it/ (accessed on 10 December 2024).

Data Availability Statement

The data presented in this study are available upon request from the corresponding author. The data are not publicly available due to privacy restrictions.

Conflicts of Interest

The authors declare no conflicts of interest.

Abbreviations

The following abbreviations are used in this manuscript:
UTTOUniversal Tractor Transmission Oil.
FTRFluid Test Rig.
CREAConsiglio per la ricerca in agricoltura e l’analisi dell’economia agraria.
OECDOrganisation for Economic Co-operation and Development.
ASTMAmerican Society for Testing and Materials.
SAESociety of Automotive Engineers.
PTOPower Take-Off.
ISOInternational Organisation for Standardisation.
VIViscosity Index.
RPVOTRotating Pressure Vessel Oxidation Test.
TANTotal Acid Number.

References

  1. Michaelis, K.; Höhn, B.R.; Doleschel, A. Lubricant influence on gear efficiency. In Proceedings of the International Design Engineering Technical Conferences and Computers and Information in Engineering Conference (ASME 2009), San Diego, CA, USA, 30 August–2 September 2009. [Google Scholar]
  2. Ales, Z. Tribological properties of transmission oils. In Proceedings of the 4th International Conference on Trends in Agricultural Engineering (TAE 2010), Prague, Czech Republik, 7–10 September 2010. [Google Scholar]
  3. Tulík, J.; Hujo, L.; Stančík, B.; Ševčik, P. Research of new ecological synthetic oil-based fluid. J. Cent. Eur. Agric. 2013, 14, 1401–1410. [Google Scholar] [CrossRef]
  4. Mercurio, P.; Burns, K.A.; Negri, A. Testing the ecotoxicology of vegetable versus mineral based lubricating oils: 1. Degradation rates using tropical marine microbes. Environ. Pollut. 2004, 129, 165–173. [Google Scholar] [CrossRef] [PubMed]
  5. Cecutti, C.; Agius, D. Ecotoxicity and biodegradability in soil and aqueous media of lubricants used in forestry applications. Biores. Technol. 2008, 99, 8492–8496. [Google Scholar] [CrossRef]
  6. Harika, E.; Jarny, S.; Monnet, P.; Bouyer, J.; Fillo, M. Effect of water pollution on rheological properties of lubricating oil. Appl. Rheol. 2011, 21, 12613. [Google Scholar] [CrossRef]
  7. Syahrullail, S.; Kamitani, S.; Shakirin, A. Tribological evaluation of mineral oil and vegetable oil as a lubricant. J. Teknol. Sci. Eng. 2014, 66, 37–44. [Google Scholar] [CrossRef]
  8. Kunz, A. Development of a universal tractor transmission oil (UTTO) based on renewable raw materials. Materialwiss. Werkstofftech. 2006, 37, 191–201. [Google Scholar] [CrossRef]
  9. Panchal, T.M.; Pate, A.; Chauhan, D.D.; Thomas, M.; Patel, J.V. A methodological review on bio-lubricants from vegetable oil based resources. Renew. Sust. Energ. Rev. 2017, 70, 65–70. [Google Scholar] [CrossRef]
  10. Lee, C.T.; Lee, M.B.; Mong, G.R.; Fong Chong, W.W. A bibliometric analysis on the tribological and physicochemical properties of vegetable oil–based bio-lubricants (2010–2021). Environ. Sci. Pollut. Res. 2022, 29, 56215–56248. [Google Scholar] [CrossRef]
  11. Uppar, R.; Dinesha, P.; Kumar, S. A critical review on vegetable oil-based bio-lubricants: Preparation, characterization, and challenges. Environ. Dev. Sustain. 2023, 25, 9011–9046. [Google Scholar] [CrossRef]
  12. Khadem, M.; Kang, W.-B.; Kim, D.-E. Green tribology: A review of biodegradable lubricants-properties, current status, and future improvement trends. Int. J. Precis. Eng. Manuf. Green Technol. 2024, 11, 565–583. [Google Scholar] [CrossRef]
  13. Majdan, R.; Kosiba, J.; Tulík, J.; Kročková, D.; Šinský, V. The comparison of biodegradable hydraulic fluid with mineral oil on the basis of selected parameters. Res. Agric. Eng. 2011, 57, 43–49. [Google Scholar] [CrossRef]
  14. Kardjilova, K.; Vozárová, V.; Valah, M. Influence of Temperature on Energetic and Rheological Characteristics of PLANTOHYD Bio Lubricants—A Study in the Laboratory. Eng. Technol. Appl. Sci. Res. 2013, 3, 424–428. [Google Scholar] [CrossRef]
  15. Birkavs, A.; Smigins, R. Experimental research on compatibility of mineral and biobased hydraulic fluid. Agron. Res. 2018, 16, 968–976. [Google Scholar] [CrossRef]
  16. Csillag, J.; Petrović, A.; Vozárová, V.; Bilčík, M.; Božiková, M.; Holota, T. Comparison of rheological properties of new and used biolubricants. In Proceedings of the 7th International Conference on Trends In Agricultural Engineering (TAE 2019), Prague, Czech Republic, 17–20 September 2019. [Google Scholar]
  17. Csillag, J.; Petrović, A.; Vozárová, V.; Kosiba, J.; Majdan, R. Some rheological properties of new and used mineral lubricant and biolubricant for tractors. Agron. Res. 2019, 17, 2233–2241. [Google Scholar] [CrossRef]
  18. Krzan, B.; Vizintin, J. Tribological properties of an environmentally adopted universal tractor transmission oil based on vegetable oil. Tribol. Int. 2003, 36, 827–833. [Google Scholar] [CrossRef]
  19. Peric, S.R.; Bucko, M.; Stolijkovic, M.; Nedic, B.; Trifkovic, D.R. Experimental research of the biodegradable universal tractor oil based on the vegetable oils. J. Balk. Tribol. Assoc. 2017, 23, 209–226. [Google Scholar]
  20. Tulik, J.; Hujo, L.; Kosiba, J.; Jablonicky, J.; Janosova, M. Evaluation of new biodegradable fluid on the basis of accelerated durability test, FTIR and ICP spectroscopy. Res. Agric. Eng. 2017, 63, 1–9. [Google Scholar] [CrossRef]
  21. Ashish, U.; Galhe, D.S. Review on vegetable oil as bio lubricant. Int. J. Scientif. Res. Dev. 2017, 5, 587–589. [Google Scholar]
  22. Mobarak, H.M.; Niza, M.E.; Masjuki, H.H.; Kalam, M.A.; Al Mahmud, K.A.H.; Habibullah, M.; Ashraful, A.M. The prospects of biolubricants as alternative in automotive applications. Renew. Sust. Energ. Rev. 2014, 33, 34–43. [Google Scholar] [CrossRef]
  23. Akhil, U.V.; Radhika, N.; Ravichandran, M. The modification and adoption of biolubricants as alternatives in the automotive industry. Environ. Sci. Pollut. Res. 2025, 32, 1043–1072. [Google Scholar] [CrossRef]
  24. Ales, Z. Field experience with transmission oil EP Gear Synth 150. Res. Agric. Eng. 2009, 55, 18–23. [Google Scholar] [CrossRef]
  25. Paredes, X.; Lineira del Rio, M.; Goncalves, D.E.P.; Guimarey, J.G.; Comunas, M.J.P.; Seabra, J.H.O.; Fernandez, J. Thermophysical and tribological properties of highly viscous biolubricants. Ind. Eng. Chem. Res. 2022, 61, 8346–8356. [Google Scholar] [CrossRef]
  26. Calcante, A.; Brambilla, M.; Bisaglia, C.; Oberti, R. Estimating the total lubricant oil consumption rate in agricultural tractors. Trans. ASABE 2019, 62, 197–204. [Google Scholar] [CrossRef]
  27. Cutini, M.; Brambilla, M.; Pochi, D.; Fanigliulo, R.; Bisaglia, C. A simplified approach to the evaluation of the influences on key factors on agricultural tractor fuel consumption during heavy drawbar tasks under field conditions. Agronomy 2022, 12, 1017. [Google Scholar] [CrossRef]
  28. Majdan, R.; Tkač, Z.; Stančik, B.; Abraham, R.; Štulajter, I.; Ševčik, P.; Rašo, M. Elimination of ecological fluids contamination in agricultural tractors. Res. Agric. Eng. 2014, 60, 9–15. [Google Scholar] [CrossRef]
  29. Prolic, T.C.; Feija, M.; Grahovac, R.P.; Lepušić, A. Impact of modifiers on formulation of universal gear tractor oil (UTTO) SAE 10W-30. Goriza I Maz. 2015, 54, 257–270. [Google Scholar]
  30. Kučera, M.; Aleš, Z.; Pexa, M. Detection and characterization of wear particles on universal tractor oil using a particle size analyzer. Agron. Res. 2016, 14, 1351–1360. [Google Scholar]
  31. Goncalves, D.E.P.; Lineira del Rio, J.M.; Comunas, M.J.P.; Fernandez, J.; Seabra, J.H.O. High pressure characterization of the viscous and volumetric behaviour of three transmission oils. Ind. Eng. Chem. Res. 2019, 58, 1732–1742. [Google Scholar] [CrossRef]
  32. Toth, F.; Rusnak, J.; Kadnar, M.; Čavojsky, P. Effect of selected ecological lubricants on the wear of defined sliding bearing. Acta Technol. Agric. 2014, 17, 13–16. [Google Scholar] [CrossRef]
  33. Attia, N.K.; El-Mekkawi, S.A.; Elardy, O.A.; Abdelkader, E.A. Chemical and rheological assessment of produced biolubricants from different vegetable oils. Fuel 2020, 271, 117578. [Google Scholar] [CrossRef]
  34. Murru, C.; Badia-Laino, R.; Diaz-Garcia, M.E. Oxidative stability of vegetal oil-based lubricants. ACS Sustain. Chem. Eng. 2021, 9, 1459–1476. [Google Scholar] [CrossRef] [PubMed]
  35. Schneider, M. Plant-oil-based lubricants and hydraulic fluids. J. Sci. Food. Agric. 2006, 86, 1769–1780. [Google Scholar] [CrossRef]
  36. Campanella, A.; Rustoy, E.; Baldessari, A.; Baltanás, M.A. Lubricants from chemically modified vegetable oils. Bioresour. Technol. 2010, 101, 245–254. [Google Scholar] [CrossRef]
  37. McNutt, J.; He, Q. Development of biolubricants from vegetable oils via chemical modification. J. Ind. Eng. Chem. 2016, 36, 1–12. [Google Scholar] [CrossRef]
  38. Marques, J.P.C.; Rios, I.C.; Parente, E.J.S.; Quintella, S.A.; Luna, F.M.T.; Cavalcante, C.L. Synthesis and characterization of potential bio-based lubricant basestocks via epoxidation process. J. Am. Oil Chem. Soc. 2019, 97, 437–446. [Google Scholar] [CrossRef]
  39. Joshi, J.R.; Bhanderi, K.K.; Patel, J.V. A review on bio-lubricants from non-edible oils-recent advances, chemical modifications and applications. J. Indian Chem. Soc. 2023, 100, 100849. [Google Scholar] [CrossRef]
  40. Ugolini, L.; Matteo, R.; Lazzeri, L.; Malaguti, L.; Folegatti, L.; Bondioli, P.; Pochi, D.; Grilli, R.; Fornaciari, L.; Benigni, S.; et al. Technical Performance and Chemical-Physical Property Assessment of Safflower Oil Tested in an Experimental Hydraulic Test Rig. Lubricants 2023, 11, 39. [Google Scholar] [CrossRef]
  41. Prasad, N.; Siddaramaiah, B.; Banu, M. Effect of antioxidant tertiary butyl hydroquinone on the thermal and oxidative stability of sesame oil (Sesamum indicum) by ultrasonic studies. J. Food Sci. Technol. 2015, 52, 2238–2246. [Google Scholar] [CrossRef]
  42. Stojilković, M.; Kolb, M. Tribological Properties of Biodegradable Universal Tractor Transmission Oil. Tribol. Ind. 2016, 38, 229–234. [Google Scholar]
  43. Pochi, D.; Fanigliulo, R.; Bisaglia, C.; Cutini, M.; Grilli, R.; Betto, M.; Fornaciari, L. Vegetable-based Oil as UTTO Fluid for Agricultural Tractors Application. Appl. Eng. Agric. 2020, 36, 79–88. [Google Scholar] [CrossRef]
  44. Shah, R.; Woydt, M.; Zhang, S. The economic and environmental significance of sustainable lubricants. Lubricants 2021, 9, 21. [Google Scholar] [CrossRef]
  45. Zulkifli, N.W.M.; Azman, S.S.N.; Kalam, M.A.; Masjuki, H.H.; Yunus, R.; Gulzar, M. Lubricity of bio-based lubricant derives from different chemically modified fatty acid methyl ester. Tribol. Int. 2016, 93 Pt B, 555–562. [Google Scholar] [CrossRef]
  46. Kučera, M.; Drmla, J.; Aleš, Z. Comparative experimental investigation of environmentally non-hazardous rapeseed oils using technical reliability indicators. Acta Technol. Agric. 2025, 28, 71–79. [Google Scholar] [CrossRef]
  47. Pochi, D.; Fanigliulo, R.; Bisaglia, C.; Cutini, M.; Grilli, R.; Fornaciari, L.; Betto, M.; Pari, L.; Gallucci, F.; Capuzzi, L.; et al. Test rig and method for comparative evaluation of conventional and bio-based hydraulic fluids and lubricants for agricultural transmissions. Sustainability 2020, 12, 8564. [Google Scholar] [CrossRef]
  48. OECD. Test No. 301: Ready Biodegradability. In OECD Guidelines for the Testing of Chemicals, Section 3; OECD: Paris, France, 1992. [Google Scholar] [CrossRef]
  49. ASTM D4052-18; Standard Test Method for Density, Relative Density, and API Gravity of Liquids by Digital Density Meter. ASTM International: West Conshohocken, PA, USA, 2018.
  50. ASTM D445-06; Standard Test Method for Kinematic Viscosity of Transparent and Opaque Liquids (and Calculation of Dynamic Viscosity). ASTM International: West Conshohocken, PA, USA, 2006.
  51. ASTM D2270-10e1; Standard Practice for Calculating Viscosity Index from Kinematic Viscosity at 40 °C and 100 °C. ASTM International: West Conshohocken, PA, USA, 2016.
  52. J300_202104; Engine Oil Viscosity Classification. Issuing Committee: Fuels and Lubricants TC 1 Engine Lubrication. SAE International: Troy, MI, USA, 2021. [CrossRef]
  53. ASTM D664-18e2; Standard Test Method for Acid Number of Petroleum Products by Potentiometric Titration. ASTM International: West Conshohocken, PA, USA, 2018.
  54. ASTM D97-17b; Standard Test Method for Pour Point of Petroleum Products. ASTM International: West Conshohocken, PA, USA, 2022.
  55. ASTM D92-24; Standard Test Method for Flash and Fire Points by Cleveland Open Cup Tester. ASTM International: West Conshohocken, PA, USA, 2024.
  56. Wan Nik, W.B.; Zulkifli, F.; Ahmad, M.F.; Sulaiman, O.; Rahman, M.M. Performance evaluation of hydraulic field test rig. Procedia Eng. 2013, 68, 613–618. [Google Scholar] [CrossRef]
  57. Kosiba, J.; Čorňak, S.; Glos, J.; Jablonický, J.; Vozýrový, V.; Petrović, A.; Csilllag, J. Monitoring oil degradation during operating test. Agron. Res. 2016, 14, 1626–1634. [Google Scholar]
  58. Pochi, D.; Fanigliulo, R.; Grilli, R.; Fornaciari, L.; Bisaglia, C.; Cutini, M.; Brambilla, M.; Sagliano, A.; Capuzzi, L.; Palmieri, F.; et al. Design and assessment of a test rig for hydrodynamic tests on hydraulic fluids. In Innovative Biosystems Engineering for Sustainable Agriculture, Forestry and Food Production; Lecture Notes in Civil Engineering; Coppola, A., Di Renzo, G.C., Altieri, G., D’Antonio, P., Eds.; Springer Nature: Cham, Switzerland, 2020; Volume 67, pp. 419–429. [Google Scholar] [CrossRef]
  59. Pochi, D.; Fanigliulo, R.; Pagano, M.; Grilli, R.; Fedrizzi, M.; Fornaciari, L. Dynamic-energetic balance of agricultural tractors: Active system for the measurement of the power requirements in static test and under field conditions. J. Agric. Eng. 2013, 44, 415–420. [Google Scholar] [CrossRef]
  60. Majdan, R.; Tkač, Z.; Abraham, R.; Szabo, M.; Halenar, M.; Raso, M.; Ševčik, P. Proposal for filtration system for biodegradable lubricants in agricultural tractors. Agron. Res. 2016, 14, 1395–1405. [Google Scholar]
  61. Majdan, R.; Abraham, R.; Uhrinová, D.; Nosian, J. Contamination of transmission and hydraulic oils in agricultural tractors and proposal of by-pass filtration system. Agron. Res. 2019, 17, 1107–1122. [Google Scholar] [CrossRef]
  62. Osinenko, P. Optimal Slip Control for Tractors with Feedback of Drive Torque. Ph.D. Thesis, Faculty of Mechanical Science and Engineering, Technische Universität Dresden, Dresden, Germany, 2014. [Google Scholar]
  63. Renius, K.T. Tractors. Technology and Its Application, 1st ed.; BLV Publishing Society: Munich, Germany, 1985. [Google Scholar]
  64. Pochi, D.; Biocca, M.; Fanigliulo, R.; Gallo, P.; Pulcini, P. Sowing of seed dressed with thiacloprid using a pneumatic drill modified for reducing abrasion dust emissions. Bull. Insectology 2015, 68, 273–279. [Google Scholar]
  65. Biocca, M.; Fanigliulo, R.; Gallo, P.; Pulcini, P.; Pochi, D. The assessment of dust drift from pneumatic drills using static tests and in-field validation. Crop Prot. 2015, 71, 109–115. [Google Scholar] [CrossRef]
  66. Fanigliulo, R.; Biocca, M.; Pochi, D. Effects of six primary tillage implements on energy inputs and residue cover in Central Italy. J. Agric. Eng. 2016, 47, 177–180. [Google Scholar] [CrossRef]
  67. Biocca, M.; Pochi, D.; Fanigliulo, R.; Gallo, P.; Pulcini, P.; Marcovecchio, F.; Perrino, C. Evaluating a filtering and recirculating system to reduce dust drift in simulated sowing of dressed seed and abraded dust particle characteristics. Pest Manag. Sci. 2017, 73, 1134–1142. [Google Scholar] [CrossRef]
  68. OECD. Standard Code for the Official Testing of Agricultural and Forestry Tractor Performance. Code 2; Organization for Economic Cooperation and Development: Paris, France, 2025; Available online: https://www.oecd.org/content/dam/oecd/en/topics/policy-sub-issues/tractors/02-Code2-EN-February-2025-final.pdf (accessed on 12 February 2025).
  69. ISO 1999:2013; Acoustics—Estimation of Noise-Induced Hearing Loss. International Organisation for Standardisation: Geneva, Switzerland, 2013.
  70. ASTM D2272-14; Standard Test Method for Oxidation Stability of Steam Turbine Oils by Rotating Pressure Vessel. ASTM International: West Conshohocken, PA, USA, 2022.
  71. ISO 4406:2021; Hydraulic Fluid Power. Fluids. Method for Coding the Level of Contamination by Solid Particles. ISO: Geneva, Switzerland, 2021.
  72. NAS 1638; Cleanliness Requirements of Parts Used in Hydraulic Systems. Aerospace Industries of America: Washington, DC, USA, 2001.
  73. SAE AS 4059-G; Contamination Classification for Hydraulic Fluids. SAE: Warrendale, PA, USA, 2022.
  74. ASTM D6595-17; Standard Test Method for Determination of Wear Metals and Contaminants in Used Lubricating Oils or Used Hydraulic Fluids by Rotating Disc Electrode Atomic Emission Spectrometry. ASTM International: West Conshohocken, PA, USA, 2022.
  75. Santos Oliveira, J.C.; Gouveia Souza, A. Specific heat capacity of some mineral, synthetic and semi-synthetic automotive lubricant oils after thermal degradation. Chem. Technol. Indian J. 2006, 1, 8–13. [Google Scholar]
  76. Rossi Motoriduttori. Available online: https://www.vansteenbv.nl/wp-content/uploads/2017/05/Rossi-Parallel-right-angle-shaft-gear-reducers-and-gearmotors-G05.pdf (accessed on 28 February 2024).
  77. Wolak, A. Changes in lubricant properties of used synthetic oils based on the total acid number. Meas. Control 2018, 51, 65–72. [Google Scholar] [CrossRef]
  78. Yan, S.; Ma, B.; Wang, X.; Chen, J.; Zheng, C. Maintenance policy for oil-lubricated systems with oil analysis data. Eksploat. I Niezawodn. Maint. Reliab. 2020, 22, 455–464. [Google Scholar] [CrossRef]
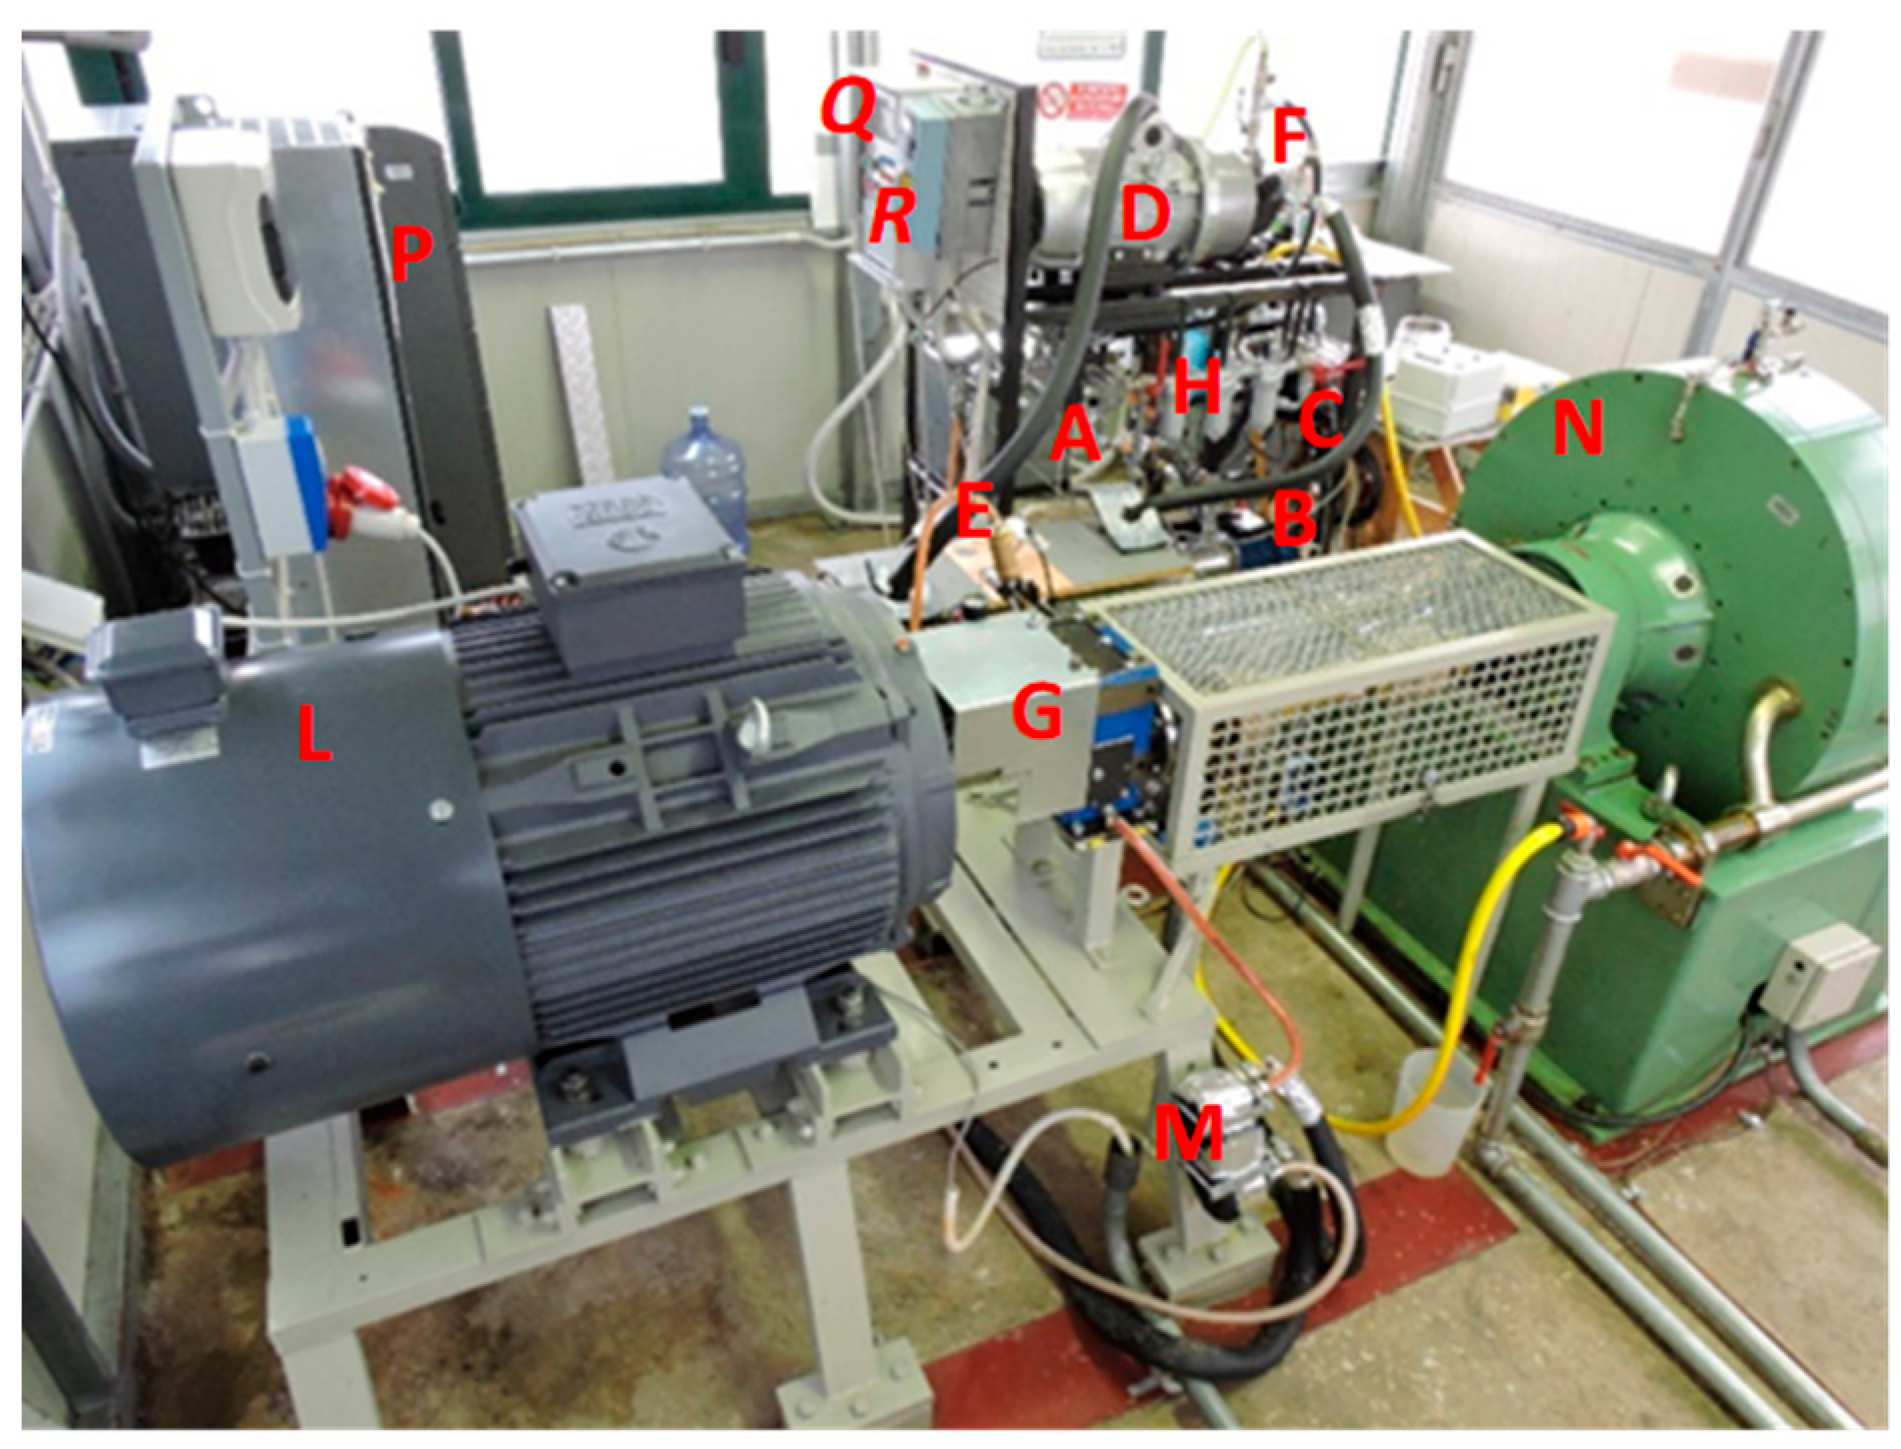
Figure 1. FTR integrated in the CREA tractor test plant. (A) Fluid reservoir; (B) low-pressure circulation pump; (C) main filter; (D) high-pressure piston pump; (E) hydraulic circuit fluid heater; (F) distributor block with 4 solenoid valves and 4 pressure valves (10, 20, 30, and 40 MPa); (G) speed multiplier simulating the tractor gearbox; (H) heat exchanger; (L) 37 kW electric engine; (M) transmission circuit fluid heater; (N) dynamometric brake; (P) digital inverter controlling the electric engine; (Q) FTR electronic control and command module; (R) inverter operating the high-pressure pump.
Energies 18 04612 g001
Figure 2. The tractor (Landini Legend 145) during an agricultural operation.
Energies 18 04612 g002
Figure 3. Performance of the two fluids in the hydraulic high-pressure section of the FTR: (a) pressure; (b) flow rate; (c) power.
Energies 18 04612 g003
Figure 4. Performance of the two fluids in lubricating the multiplier connected at the dynamometric brake: (a) torque; (b) rotational speed; (c) power.
Energies 18 04612 g004
Figure 5. Temperature of the fluids during the tests at FTR: (a) temperature at 40 MPa valve outlet; (b) temperature at multiplier outlet.
Energies 18 04612 g005
Figure 6. Comparison between the two fluids tested at the FTR: (a) trend of kinematic viscosity at 40 and 100 °C; (b) trend of the Viscosity Index.
Energies 18 04612 g006
Figure 7. Comparison between the two fluids tested at the FTR: (a) trend of the variation of kinematic viscosity at 40 °C; (b) trend of the variation of the kinematic viscosity at 100 °C.
Energies 18 04612 g007
Figure 8. Trend of the variation of total acid number (TAN).
Energies 18 04612 g008
Figure 9. Comparison between the tractor noise emissions observed using the exhausted CF1 oil (before its replacement after 1400 h of use) and the BF after approximately 586 h of farm operations. Since noise measurements were carried out during data collection to plot the characteristic curves at the PTO, at maximum fuel delivery, setting the same engine speed and torque conditions at each point for both oils, the diagrams provide a characterisation of the noise emissions throughout the engine operating range. The dotted blue lines intercept three conditions, for which the frequency analysis is shown in Figure 10.
Energies 18 04612 g009
Figure 10. Frequency analysis of the noise levels in the tractor cab in the three engine working conditions indicated by the dotted blue lines in Figure 9: (a) engine speed: 2200 min−1, power: 70 kW; (b) engine speed: 1703 min−1, maximum power; (c) engine speed: 1295 min−1, maximum torque. The diagrams show the linear and A-weighted values of acoustic pressure in the interval of 20–20,000 Hz with the exhausted CF1 and the BF after approximately 586 h of work.
Energies 18 04612 g010
Figure 11. Comparison between BF test results at the FTR and on the tractor: (a) trend of kinematic viscosity at 40 °C (V40); (b): trend of kinematic viscosity at 100 °C (V100); (c) diagram of the time as a function of ΔV40, i.e., the percent decrease (in absolute value) of V40 referred to the initial value. The regression curves (dotted lines) and relative functions are also reported.
Energies 18 04612 g011
Figure 12. Comparison between BF test results at the FTR (T1) and on the tractor (T3): (a) variation in the viscosity index; (b) variation of the total acid number (TAN). The regression curves (dotted lines) and relative functions are also reported.
Energies 18 04612 g012
Table 1. Scheme of the tests carried out and the fluids used in each test. Tests performed are marked with X.
TestsEquipmentCF1 1BFCF2Type of Test
T1Fluid Test Rig (FTR)-XXDurability test
T2Tractor at dynamometric brakeXX-Engine characteristic curves
T3Tractor under operative conditions-X-Normal farm operations
1 Exhausted oil originally adopted on the tractor, replaced by the BF after 1400 h of work.
Table 2. Main characteristics of the UTTO fluids involved in the tests.
PropertiesUnitsCF1 1BF 2CF2 1Method
Physical state at 20 °C-LiquidLiquidLiquidVisual
Appearance and color-YellowYellowYellowVisual
Density at 15 °Ckg m−3883940882ASTM D4052 [49]
Kinematic viscosity at 40 °Cmm2 s−188.057.556.0ASTM D445 [50]
Kinematic viscosity at 100 °Cmm2 s−111.912.19.3ASTM D445 [50]
Viscosity index-109215145ASTM D2270 [51]
Viscosity grade-20W-305W-3010W-30SAE J300 [52]
Total acid numbermg KOH g−1n.a.0.70n.a.ASTM D664 [53]
Pour point°C−27−36−40ASTM D97 [54]
Flash point°C220>280232ASTM D92 [55]
1 Data from “Agrolube Vela” product sheets. 2 Data from “Matrol-Bi FUM 01 A” data sheet.
Table 3. Work conditions applied during the tests of UTTO fluids at the FTR.
FTR’s CircuitMain Parameters UnitWorking Conditions
Main circuit (low-pressure section)Tested volume fluiddm320
Operating pressureMPa<0.15
Fluid temperature 1°C<60
HydraulicFluid temperature 2°C≈100
Flow ratedm3 min−15.7
Operating pressureMPa40
High-pressure pump maximum speedmin−11800
Maximum hydraulic powerkW3.8
Transmission (speed multiplier)Fluid volume in the multiplierdm32.6
Fluid temperature 3°C60
Fluid temperature 4°C≈87
Flow rate 5dm3 min−10.2
Electric engine max. speedmin−1660
Dynamometric brake shaft max. speedmin−11900
Torque applied at the dynamometric brake daNm12.5
Mechanical power kW24.5
1 In the low pressure circuit; 2 after the 40 MPa overpressure valve; 3 at multiplier inlet; 4 at multiplier outlet; 5 in the multiplier gearbox.
Table 4. Parameters monitored in T1, T2, and T3.
TestParameters MonitoredUnitLaboratoriesRef. Standard
T1HC 1Flow ratedm3 h−1CREACREA methodology [47]
PressureMPa
Hydraulic powerkW
Fluid T° at HP 3 inlet°C
Fluid T° at HP 3 outlet°C
TC 2TorquedaNmCREACREA methodology [47]
Rotational speed min−1
Mechanical powerkW
Fluid T° at SM 4 inlet°C
Fluid T° at SM 4 outlet°C
AnalysesKin. visc. at 40 and 100 °Cmm2 s−1CREAASTM D445 [50]
Viscosity Index-CREAASTM D2270 [51]
Total acid number (TAN)Mg KOH g−1 NovamontASTM D664 [53]
RPVOT 5minNovamontASTM D2272 [70]
Contamination particlesCode No.MECOIL 6ISO 4406, NAS 1638, SAE AS 4059 [71,72,73]
Wear elementsppmMECOIL 6ASTM D6595-17 [74]
Additive elementsppm
Contamination elementsppm
T2-Engine speedmin−1CREACode 2 OECD [68]
TorquedaNm
PowerkW
Sound pressuredBISO 1999 [69]
T3AnalysesKin. visc. at 40 and 100 °Cmm2 s−1CREAASTM D445 [50]
Viscosity Index-CREAASTM D2270 [51]
Total acid number (TAN)Mg KOH g−1 NovamontASTM D664 [53]
RPVOT 5minNovamontASTM D2272 [70]
Contamination particlesCode No.MECOIL 6ISO 4406, NAS 1638, SAE AS 4059 [71,72,73]
Wear elementsppmMECOIL 6ASTM D6595-17 [74]
Additive elementsppm
Contamination elementsppm
1 HC: hydraulic circuit of FTR. 2 TC: transmission circuit of FTR. 3 HP: high-pressure section, i.e., high-pressure pump and over pressure valves. 4 SM: speed multiplier of FTR. 5 RVPOT: Rotating Pressure Vessel Oxidation Test, an index of the oxidation stability of the fluid. 6 MECOIL: Laboratorio Diagnosi Meccaniche, Florence, Italy.
Table 5. Statistical descriptors of the operative parameters recorded during the BF and CF2 fluid tests in the FTR.
UTTO FluidsStatistical Descript.Hydraulic CircuitTransmission CircuitFluid Temperature
PressureFlow RatePowerSpeed 1Torque 1PowerTa 2Tb 3Tc 4
MPadm3 h−1kWmin−1daNmkW°C°C°C
BFAverage40.40378.014.99188512.4924.6662.3597.7784.23
Max40.76394.975.21192112.7625.4863.5799.4486.26
Min40.17368.624.85163511.3719.5960.9695.7580.23
St. Dev.0.127.160.0974.780.201.270.640.911.44
C.V.0.291.891.873.971.615.161.020.931.72
St. Err.0.020.950.019.900.030.170.080.120.19
CF2Average40.50379.115.02190012.7225.3161.1094.2782.31
Max41.37387.515.20190612.9325.7363.1796.7784.93
Min39.96360.034.78189611.9023.6657.7690.2873.02
St. Dev.0.305.830.081.980.150.311.501.612.58
C.V.0.751.541.630.101.201.212.451.703.14
St. Err.0.050.880.010.300.020.050.230.240.18
1 At the dynamometric brake; 2 reservoir; 3 high-pressure valve outlet; 4 transmission outlet.
Table 6. Assessment of the energy and specific energy transported by BF and CF2 in the FTR test based on the mean values of power reported in Table 5.
FluidFTR
Circuit
PowerTime of WorkWork EnergySpec. Work EnergyEff.Thermal EnergySpecific Therm. En.T° Oper.T° Reserv.Mean ΔT
kWhkWhkWh dm−3ηkWkWh dm−3°C°C°C
BFHydr.4.994202096119.80.8537021.1497.7762.3535.42
Transm.24.6610,355591.70.9466137.7784.2321.88
Total--12,451711.5-103158.91---
CF2Hydr.5.023501756100.40.8531017.7394.2761.1033.17
Transm.25.318860506.30.9456632.3182.3121.21
Total--10,616606.7-87650.04---
Table 7. Assessment of the thermal energy and specific thermal energy added to BF and CF2 by means of the fluid heaters installed in the hydraulic and transmission circuits.
FluidFTR
Circuit
MassPassesAdd. Ther. LeapThermal EnergyTher. Sp. Energy
gNo.°CkWhkWh dm−3
BFHydraulic 1587703917.71596.348
Transmission244420214.260.225
Total---1656.573
CF2Hydraulic 1489586614.31004.011
Transmission229316812.340.152
Total---1044.163
Table 8. Variation of time interval for fluid replacement as a function of the operative temperature.
Fluid Operative Temperature (°C)Time Interval (h)
Mineral FluidsSynthetic Fluids
≤65800025,000
65–80400018,000
85–90200012,500
95–110-9000
Table 9. Results of the test of Pearson for the correlation between the serie of values of kinematic viscosity at 40 and 100 °C, V.I., ΔV40, and ΔV100 of BF and CF2.
Pearson Coeff.p (Uncorr)
V400.9757.5528 × 10−6
V1000.9966.2194 × 10−11
I.V.0.8162.0865 × 10−4
ΔV400.9844.2421 × 10−7
ΔV1000.9932.0590 × 10−13
Table 10. Analysis of the samples of the three fluids compared to Table 1. The values at the beginning and at the end of the test are reported. The elemental analysis of CF2 is not available (n.a.).
Oil ConditionsCF1 Tractor (T2)BF-FTR (T1)CF2 FTR (T1)BF Tractor (T3)
0 h1400 h0 h420 h0 h350 h0 h586 h
Visc. At 40 °C (mm2 s−1)86.50 ± 0.0468.63 ± 0.0456.13 ± 0.0842.84 ± 0.0458.55 ± 0.0248.23 ± 0.0258.31 ± 0.0853.45 ± 0.02
Visc. At 100 °C (mm2 s−1)11.07 ± 0.009.49 ± 0.0011.89 ± 0.018.74 ± 0.0039.38 ± 0.018.21 ± 0.0012.33 ± 0.0010.78 ± 0.00
Viscosity Index115117214189142144215198
TAN (mg KOH g−1)n.a.n.a.0.14 ± 0.010.24 ± 0.002.22 ± 0.022.19 ± 0.050.25 ± 0.010.39 ± 0.02
RPVOT (min)121141n.a.n.a.n.a.n.a.313185
Wear elements
Fe<16022n.a.n.a.214
Cr<1<1<1<1n.a.n.a.<1<1
Ni<1<1<1<1n.a.n.a.<1<1
Mn<11<1<1n.a.n.a.<1<1
Al<23<2<2n.a.n.a.<2<2
Pb<227<2<2n.a.n.a.<26
Cu<171<15n.a.n.a.<126
St<3<3<39n.a.n.a.<3<3
Ag<1<1<1<1n.a.n.a.<1<1
Ti<2<2<2<2n.a.n.a.<2<2
Contamination elements
Si1417124n.a.n.a.126
Na<151<1n.a.n.a.12
K<1242n.a.n.a.42
Va<1<1<1<1n.a.n.a.<1<1
Additive elements
Ca554135214411152n.a.n.a.14411363
Mg216116n.a.n.a.119
F715698307338n.a.n.a.307402
Zn15681216<528n.a.n.a.<5222
Ba<5<5<5<5n.a.n.a.<5<5
Bo8744<1<1n.a.n.a.<111
Mo<2<2<2<2n.a.n.a.<2<2
S (Total)00n.a.n.a.n.a.n.a.n.a.n.a.
Contaminating Particles
ISO 4406:2021 [71]17/15/1121/18/1423/21/1715/14/10n.a.n.a.23/21/1720/17/14
NAS 1638 [72]710126n.a.n.a.1210
SAE AS 4059 [73]811>126n.a.n.a.>1210
Table 11. Usage of tractor with BF in T3 and assessment of the work and thermal energy conveyed by the three main functions involved in each operation.
OperationsTransmissionHydraulic
Drive TrainPTO
Power (kW)Time (h)Power (kW)Time (h)Power (kW)Time (h)
Primary tillage45.154415.82312.521
Secondary tillage8.51368.4285.519
Sowing, planting hoeing, spraying, hay making, other 10.53246.32125.575
Manuring, fertilizing, other8.4355.5353.518
Transport10.5284.5183.513
Stationary power source--615--
Traction tests of agricultural tires 1268----
Stationary PTO experimental tests--5.2536--
Total-535-367-146
Weighted average13.3-6.8-6.1-
Work (kWh)
Total
7099.0-2486.7---
-9585.7--888.0-
Thermal energy (kWh)
Total
567.9-124.3---
692.3--754.8-
Specific work (kWh dm−3)
Total
81.6-28.6---
-110.2--10.2-
Specific thermal energy (kWh dm−3)
Total
6.5-1.5---
-8.0--8.7-
Disclaimer/Publisher’s Note: The statements, opinions and data contained in all publications are solely those of the individual author(s) and contributor(s) and not of MDPI and/or the editor(s). MDPI and/or the editor(s) disclaim responsibility for any injury to people or property resulting from any ideas, methods, instructions or products referred to in the content.