1. Introduction
Compared to conventional gas reservoirs, the development history of tight gas reservoirs is relatively short, and practical experience is limited. In low-permeability reservoirs, the production process of formation water is more complex due to the influence of wettability changes, capillary forces, and non-Darcy effects. During the early stage of reservoir formation, the gas–water two-phase system is in a dynamic equilibrium, and a certain amount of bound water is often retained in the reservoir pores [
1]. Although some gas reservoirs do not have obvious edge and bottom water, water production still occurs during the extraction process [
2], indicating that the conversion and mobilization mechanisms of bound water in the microscopic structure urgently need further study to guide rational exploitation.
Current research on the production mechanism of formation water is mainly divided into two categories: theoretical models and experimental analysis. In terms of theoretical analysis, Cao et al. [
3] and Zhou et al. [
4] revealed that an increase in water saturation enhances stress sensitivity, leading to a decrease in gas production. Zhu et al. [
5] used the water film theory to explain the conversion mechanism of bound water. However, these models are limited by theoretical assumptions and are difficult to directly apply to actual reservoirs. To study the formation water retention state and production laws, two-dimensional visualized physical model experiments are often widely used. In the 1980s, microfluidic technology was introduced into the research of oil and gas seepage. Compared to core displacement experiments, microfluidic chips have advantages such as low reagent consumption, low cost, and the ability for mass production. At the same time, microfluidic chips have good transparency, allowing for visual observation of gas–water flow processes [
6]. Currently, the mathematical models used to study gas–water two-phase flow simulations mainly include capillary bundle models, statistical models [
7], etc., which often require conditional assumptions and, therefore, cannot objectively describe the gas–water seepage laws. Thus, by constructing microscopic models that match the reservoir physical property parameters and combining microscopic observation, the water retention state can be intuitively analyzed [
8].
The material commonly used now is polydimethylsiloxane (PDMS), which is optically transparent, inert, non-toxic, and non-flammable. PDMS is a viscoelastic silicon-based organic polymer that is hydrophobic in its natural state. The only drawback of this material is that its hydrophobicity changes over time [
9]. Common model construction methods include core slice interlayer models and glass models based on CT scanning or thin-section image etching [
10]. The latter is preferred due to its good reproducibility and strong visibility. However, as research advances to the nanoscale, the difficulty of model construction increases significantly. Gaol et al. [
11] proposed a technique for constructing real pore throat structure models based on digital cores, which effectively improved the authenticity and adaptability of the models. Karadimitriou et al. [
8] used homogeneous porous media microfluidic models for microscopic simulations, but this method cannot address the bubble diversion mechanism in heterogeneous systems. Ma et al. [
12] utilized PDMS-based micro-nanofluidic chips containing two different permeability spliced models to study the different flow characteristics of gas–water flow in high- and low-permeability intervals. Conn et al. [
13] proposed a microfluidic device with layered permeability for studying foam flow in porous media. Kelly et al. [
14] used the geometric structure of carbon fibers as a template to fabricate a randomly connected, one-dimensional, restricted (only in the channel depth at the nanoscale) chip nanomesh, simulating the topological structure of shale pore networks, and achieved real-time optical microscope observation of gas–water displacement phenomena at a 10
2-nanometer scale. Zhong et al. [
15] referred to the actual porosity and permeability of shale core samples, constructed a two-dimensional restricted (both channel depth and width at the nanoscale) chip nanomesh starting from pore parameters, and initially realized quantitative characterization of gas–oil displacement at a 10
1-nanometer scale. Overall, current research on the gas–liquid two-phase microscopic displacement characteristics in nano-pores is generally limited to single micron-sized pores, and there is little experimental research on the visualization of gas–liquid displacement laws in multi-scale coupled models. Therefore, further exploration is needed regarding the study of gas–liquid two-phase displacement characteristics in nano-pores and how multi-scale coupled structures affect the gas–liquid displacement process.
To investigate the occurrence state and production behavior of formation water in high-water-cut tight gas reservoirs,
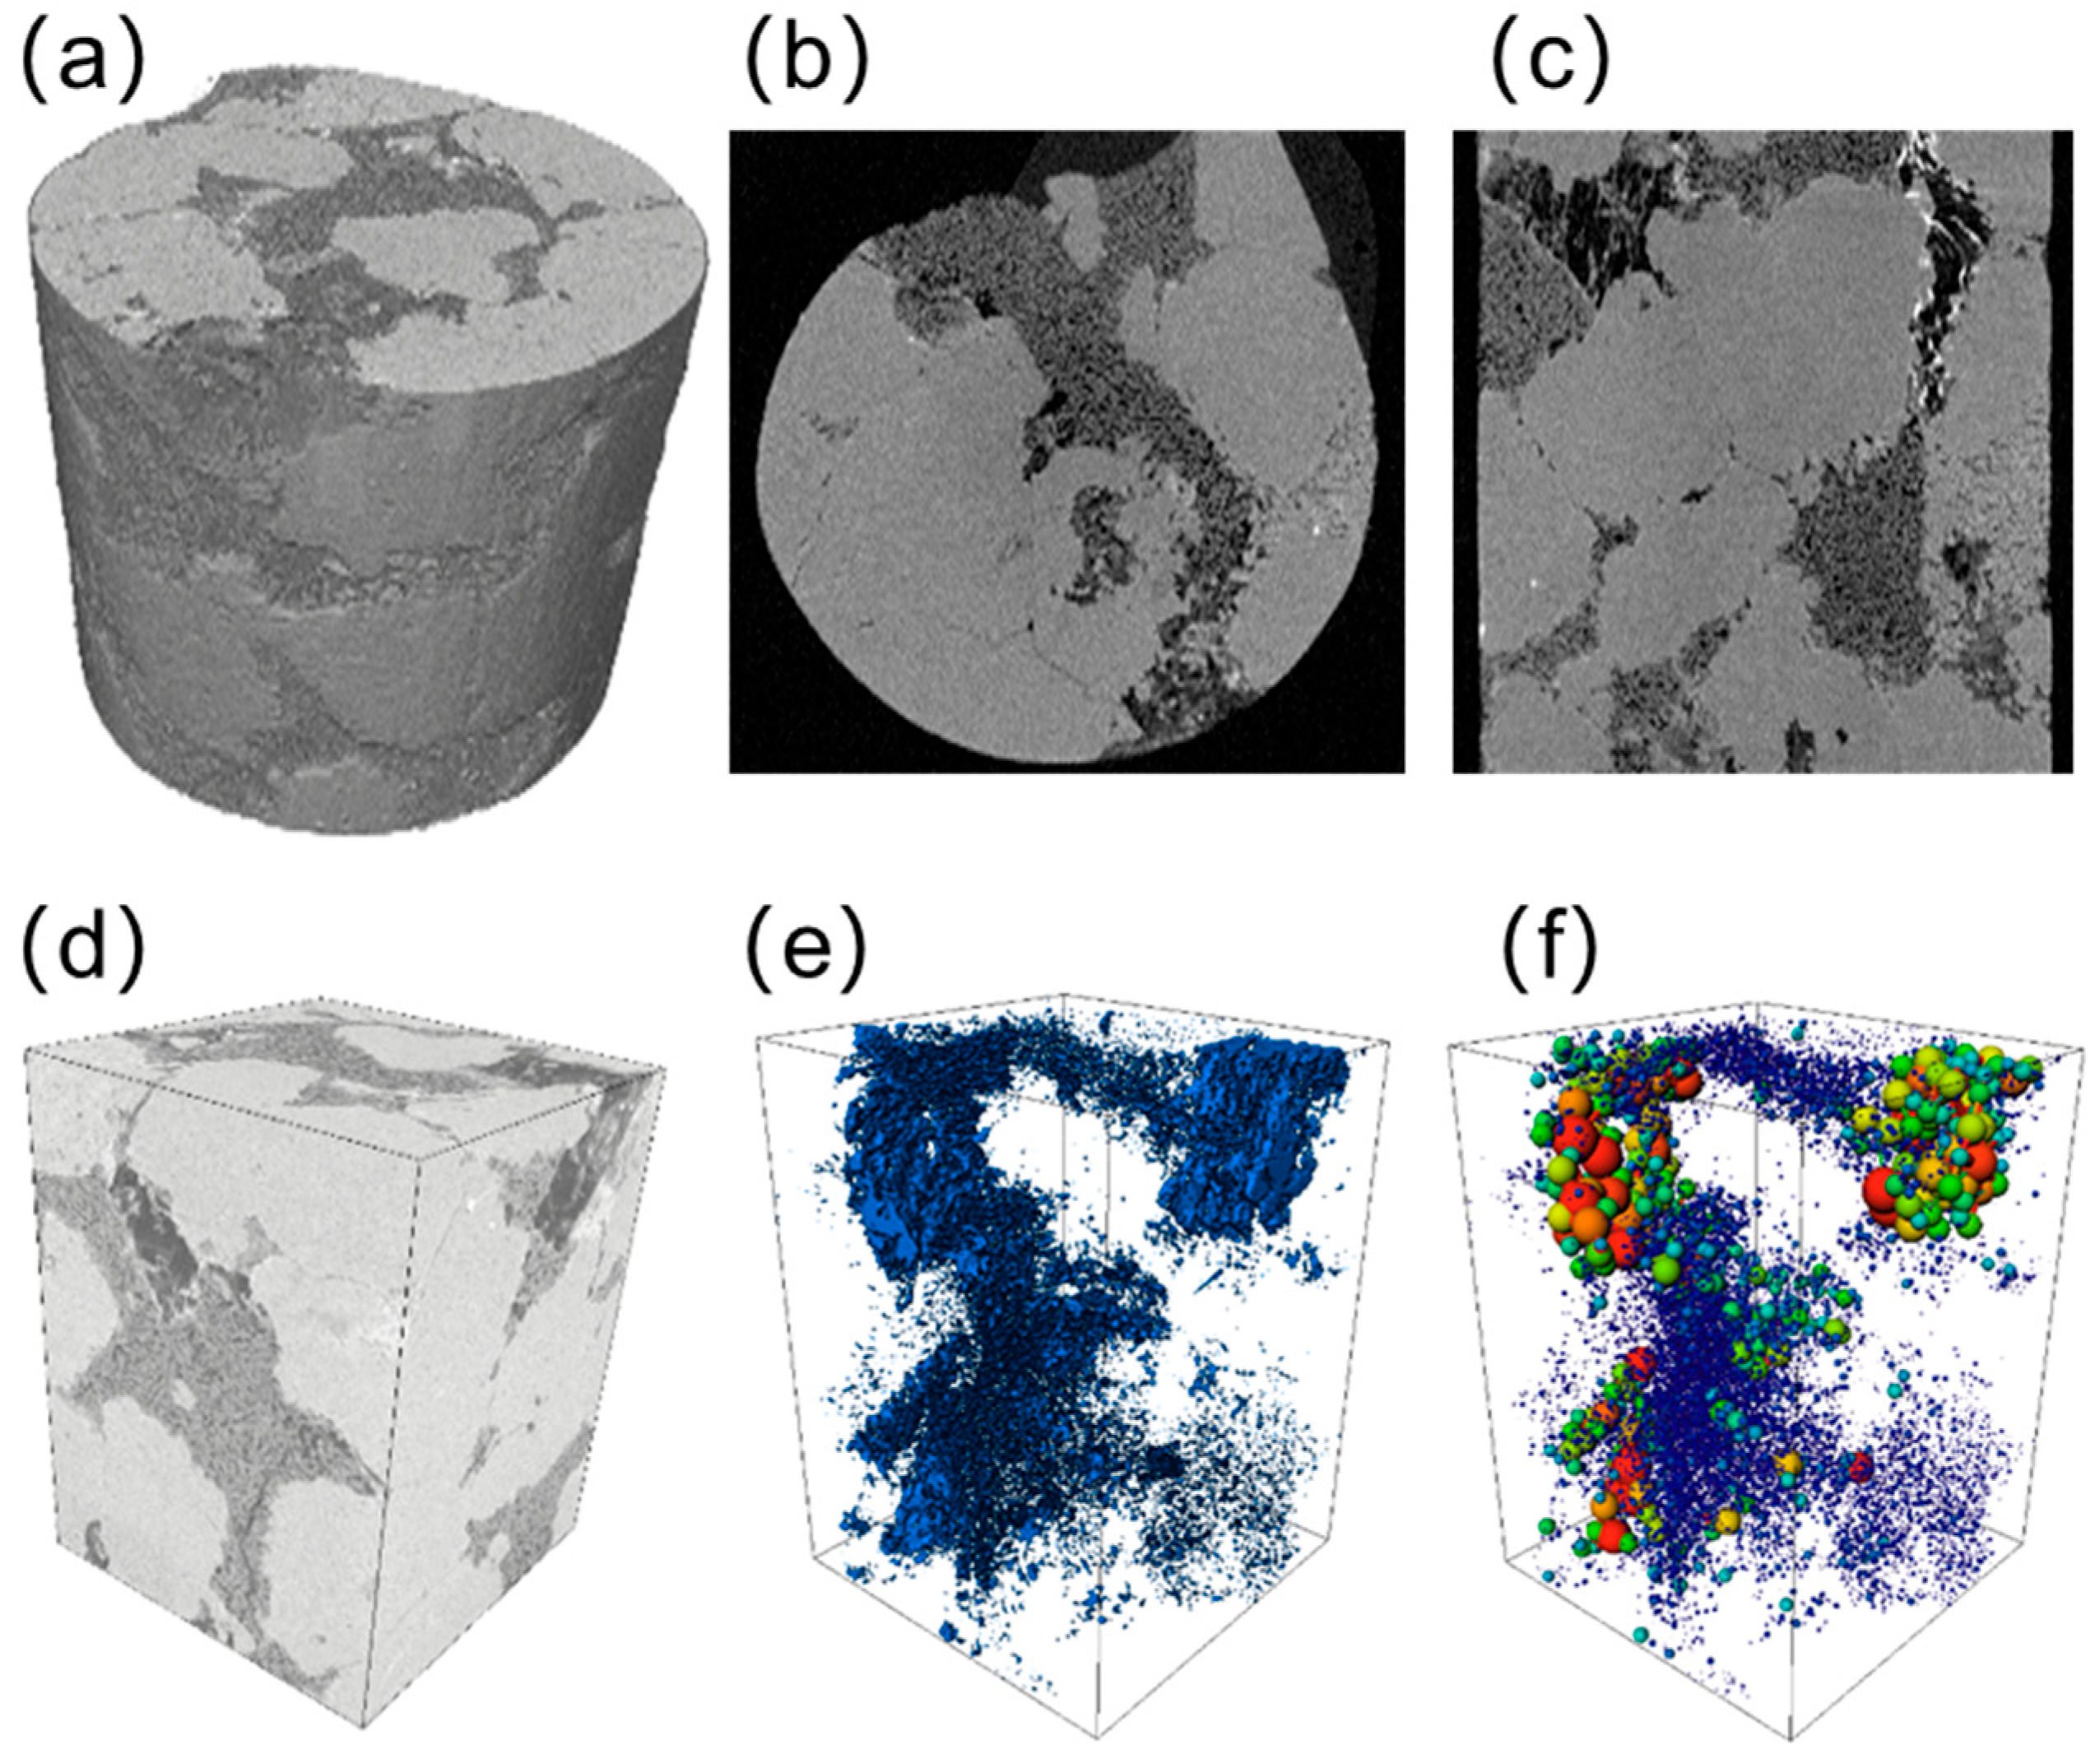
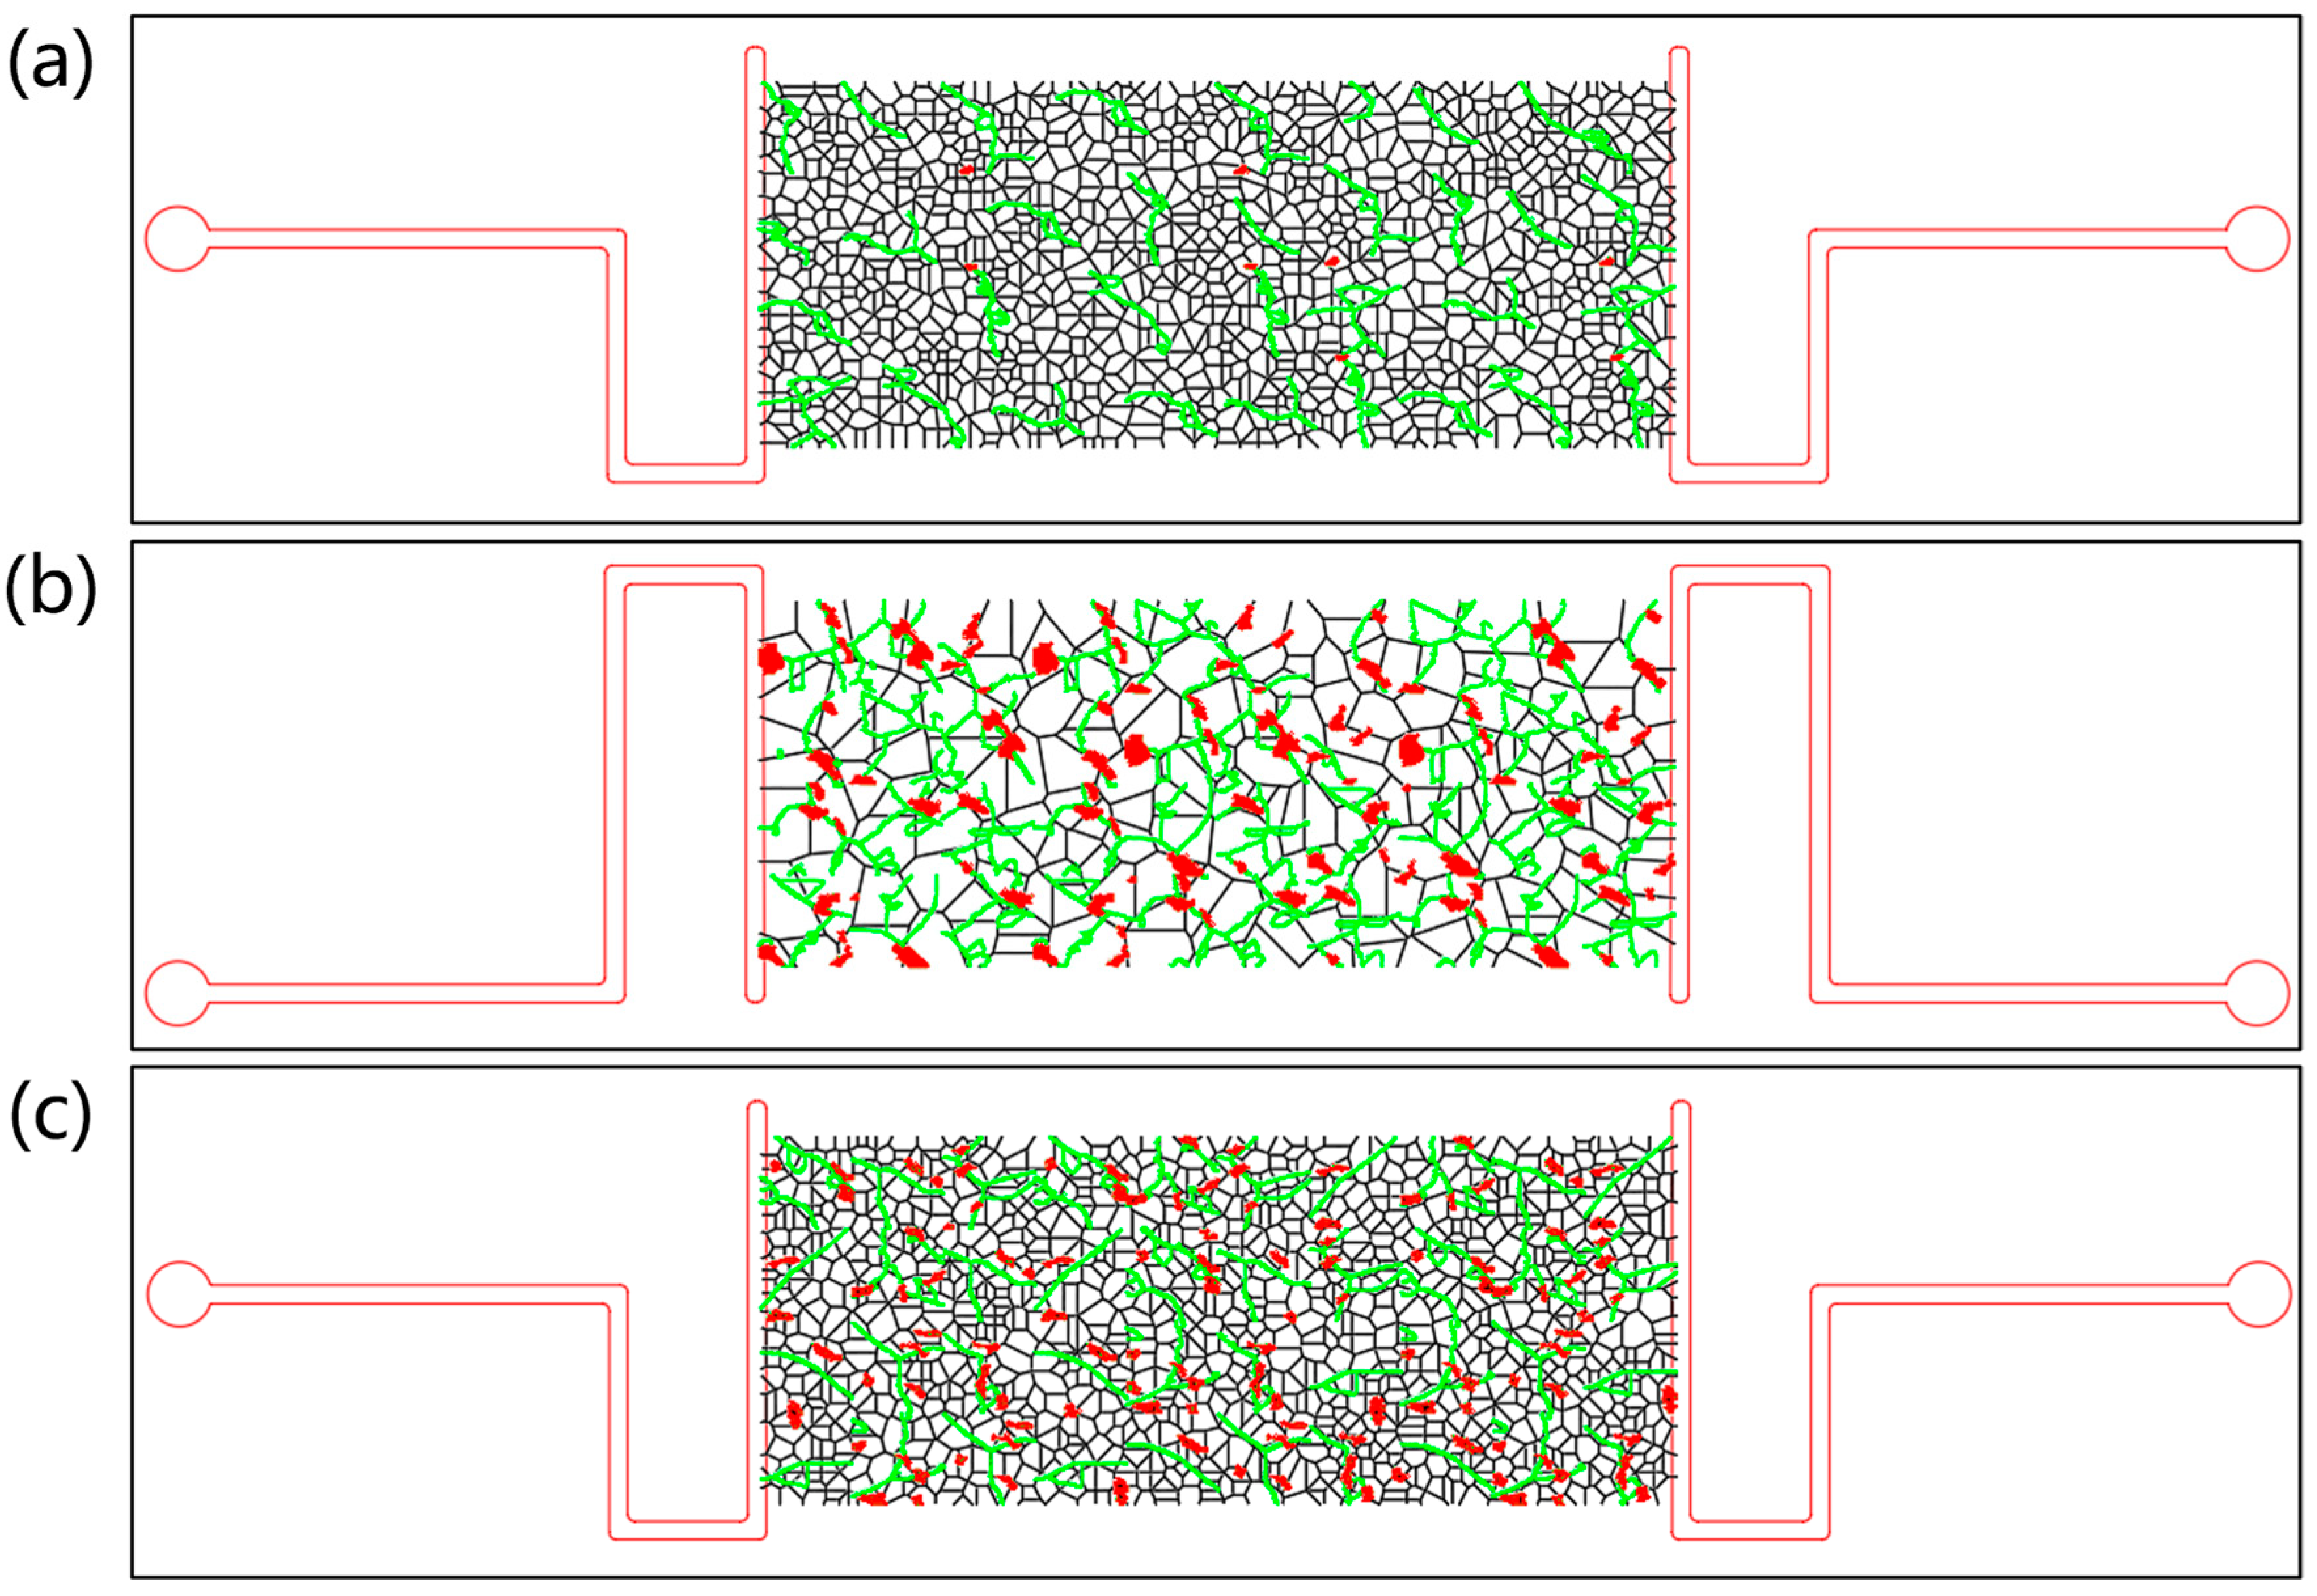
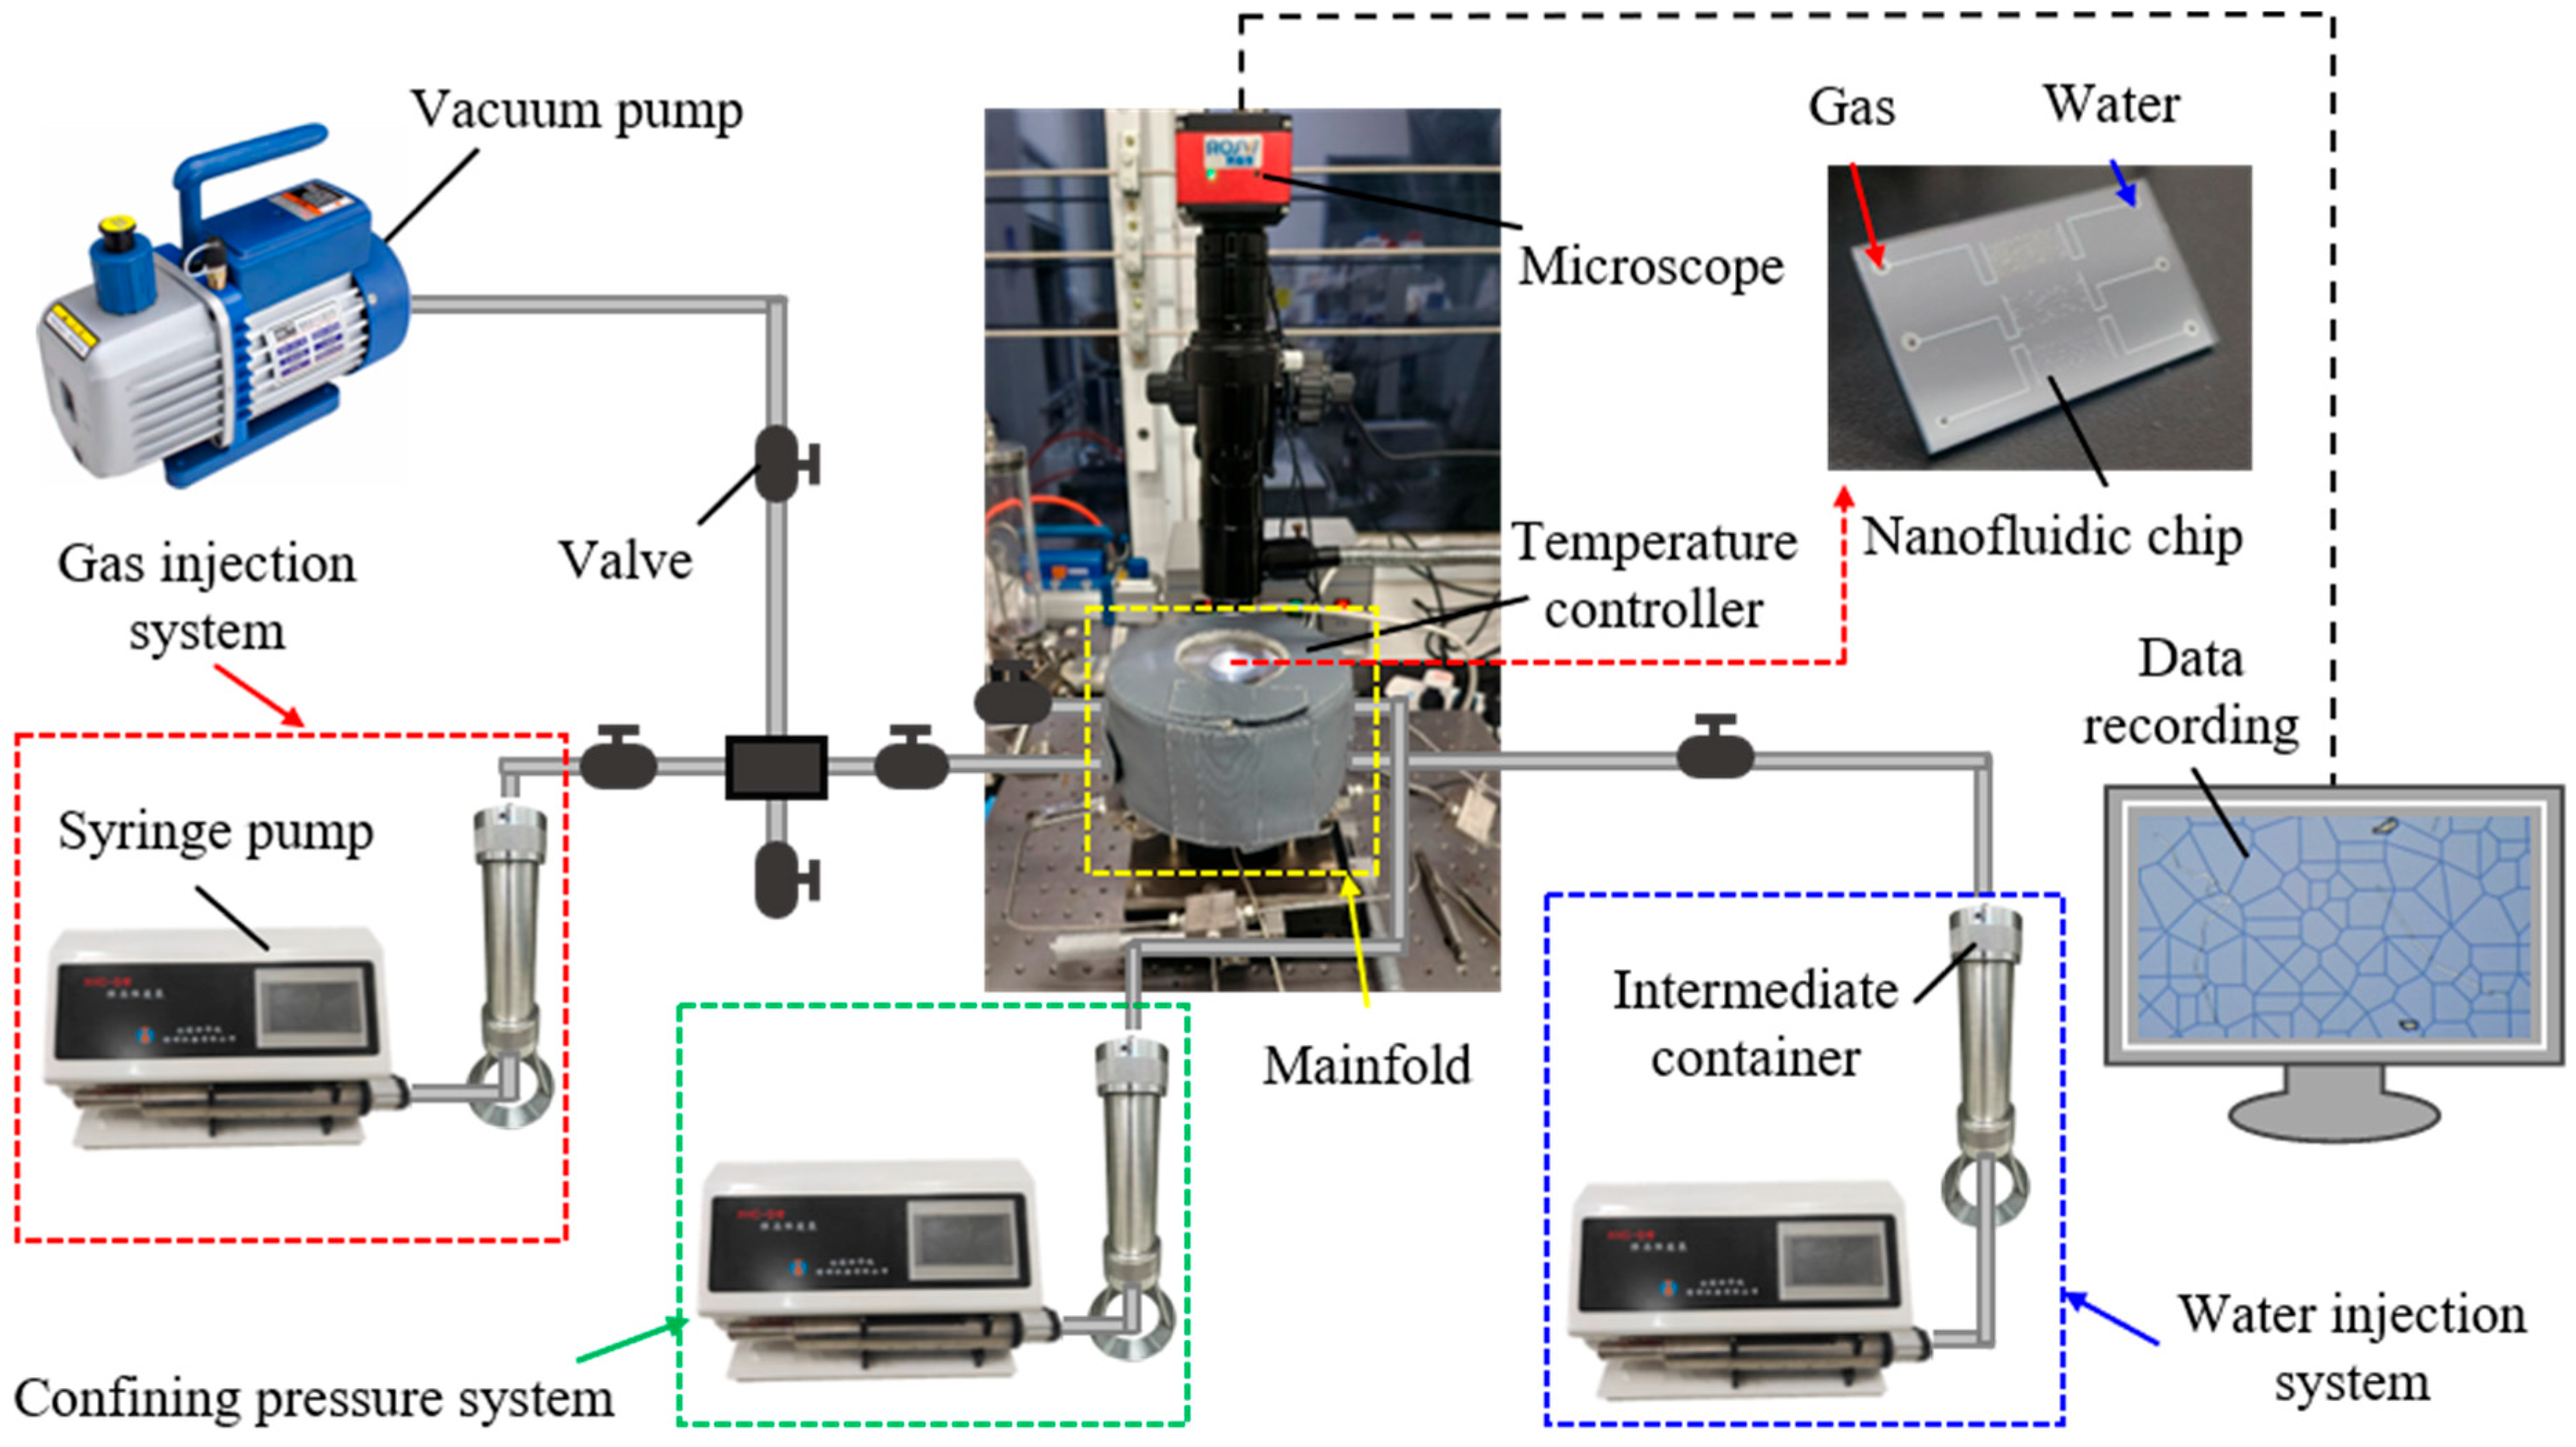
Figure 1 summarizes the micro-model design and microfluidic experiment flowchart involved in this study. This study proposes a statistical algorithm for reducing 3D digital cores obtained from CT scans to 2D visual models, based on the pore size distribution patterns of cores derived from high-pressure mercury intrusion. Combined with microfluidic experiments, we conducted research on the gas-bearing characteristics of the Jin 30 well block in the Dongsheng Gas Field. Furthermore, according to different gas–water flow patterns, the main water production types for microfluidic chips with different permeability levels were identified. The variation in gas–water ratio over time for different types of formation water production was also quantified.
4. Results and Discussion
The experimental validation of converting three-dimensional cores into two-dimensional pore structures can be referenced in the
Supplementary Materials, where key features of the microfluidic experiments under nondimensional conditions, such as breakthrough water volume and curvature inflection points, show a certain consistency with the core experiments. The flow states of gas–water two-phase flow under different pressure differential conditions were observed for three types of micro-models. Among them, for pore models with permeability between 0.1 and 0.5 mD, the produced water is primarily capillary water; for pore models with permeability between 0.5 and 1.0 mD, the produced water consists of both free water and capillary water; and for pore models with permeability greater than 1.0 mD, the produced water is predominantly free water. The variation of the gas–water ratio with time for different types of produced water was quantified, resulting in the corresponding relationship between the three types of produced water and the gas–water ratio.
- (1)
Pore models with permeability between 0.1 and 0.5 mD
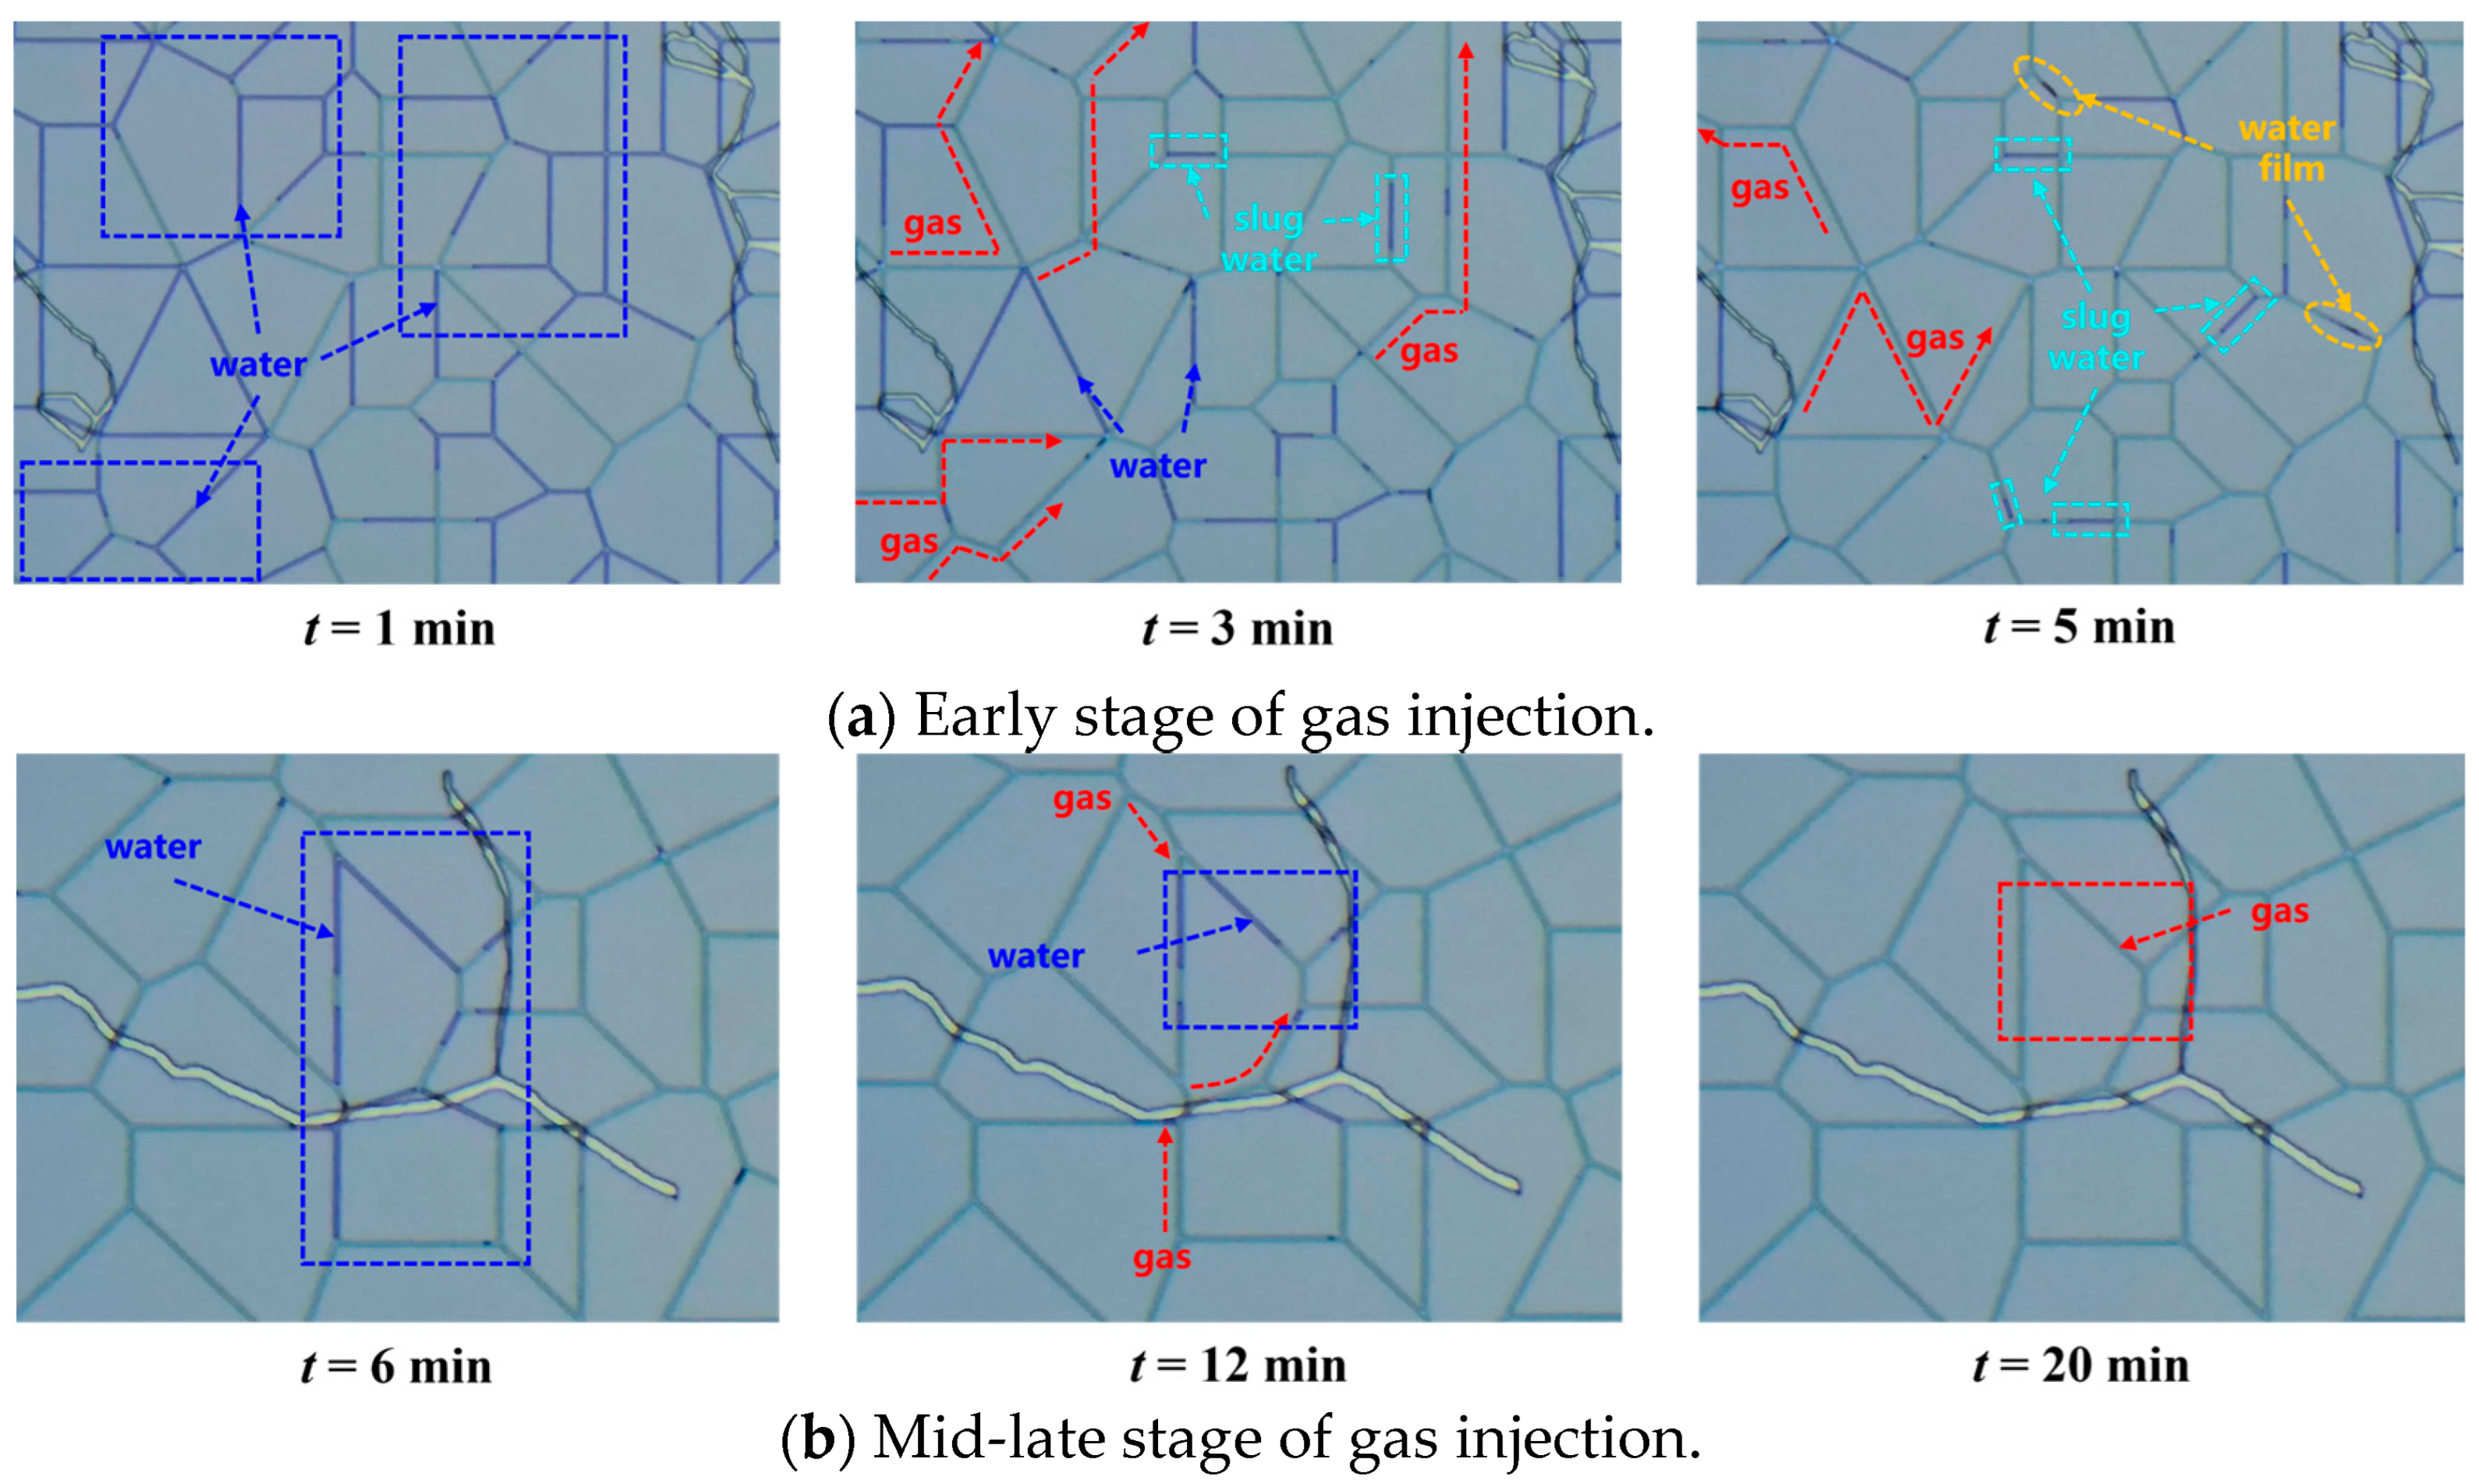
As shown in
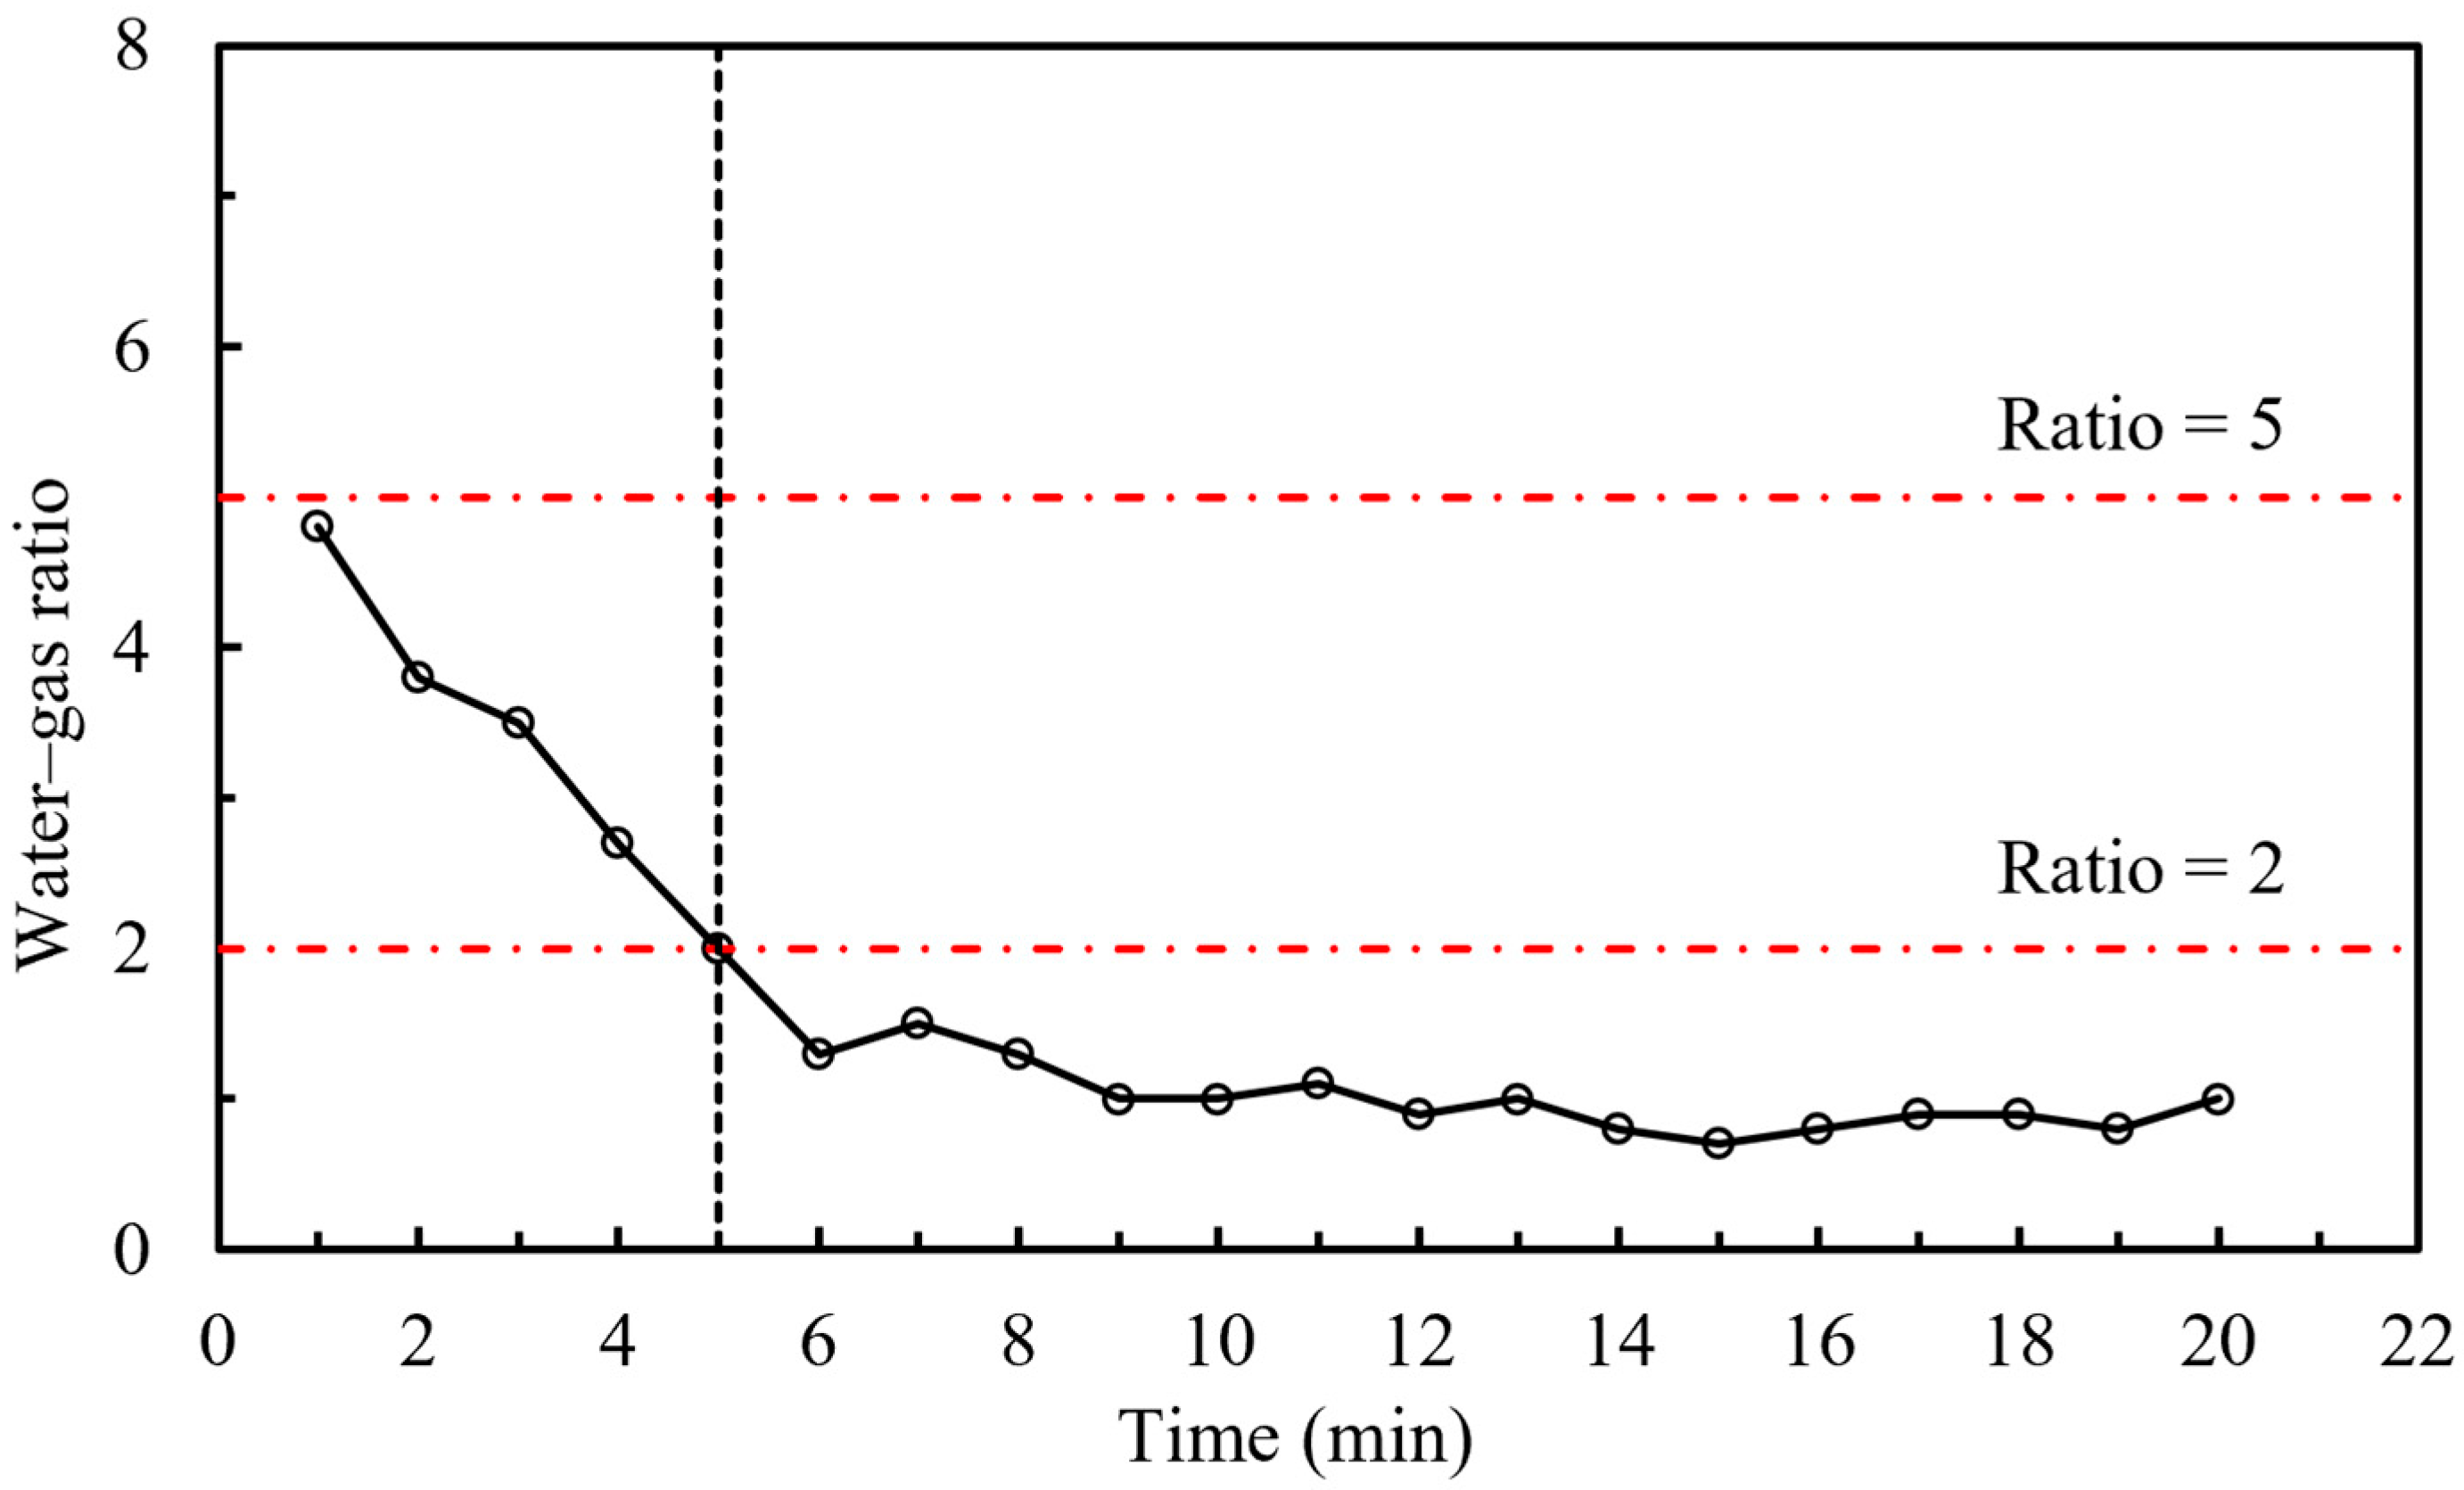
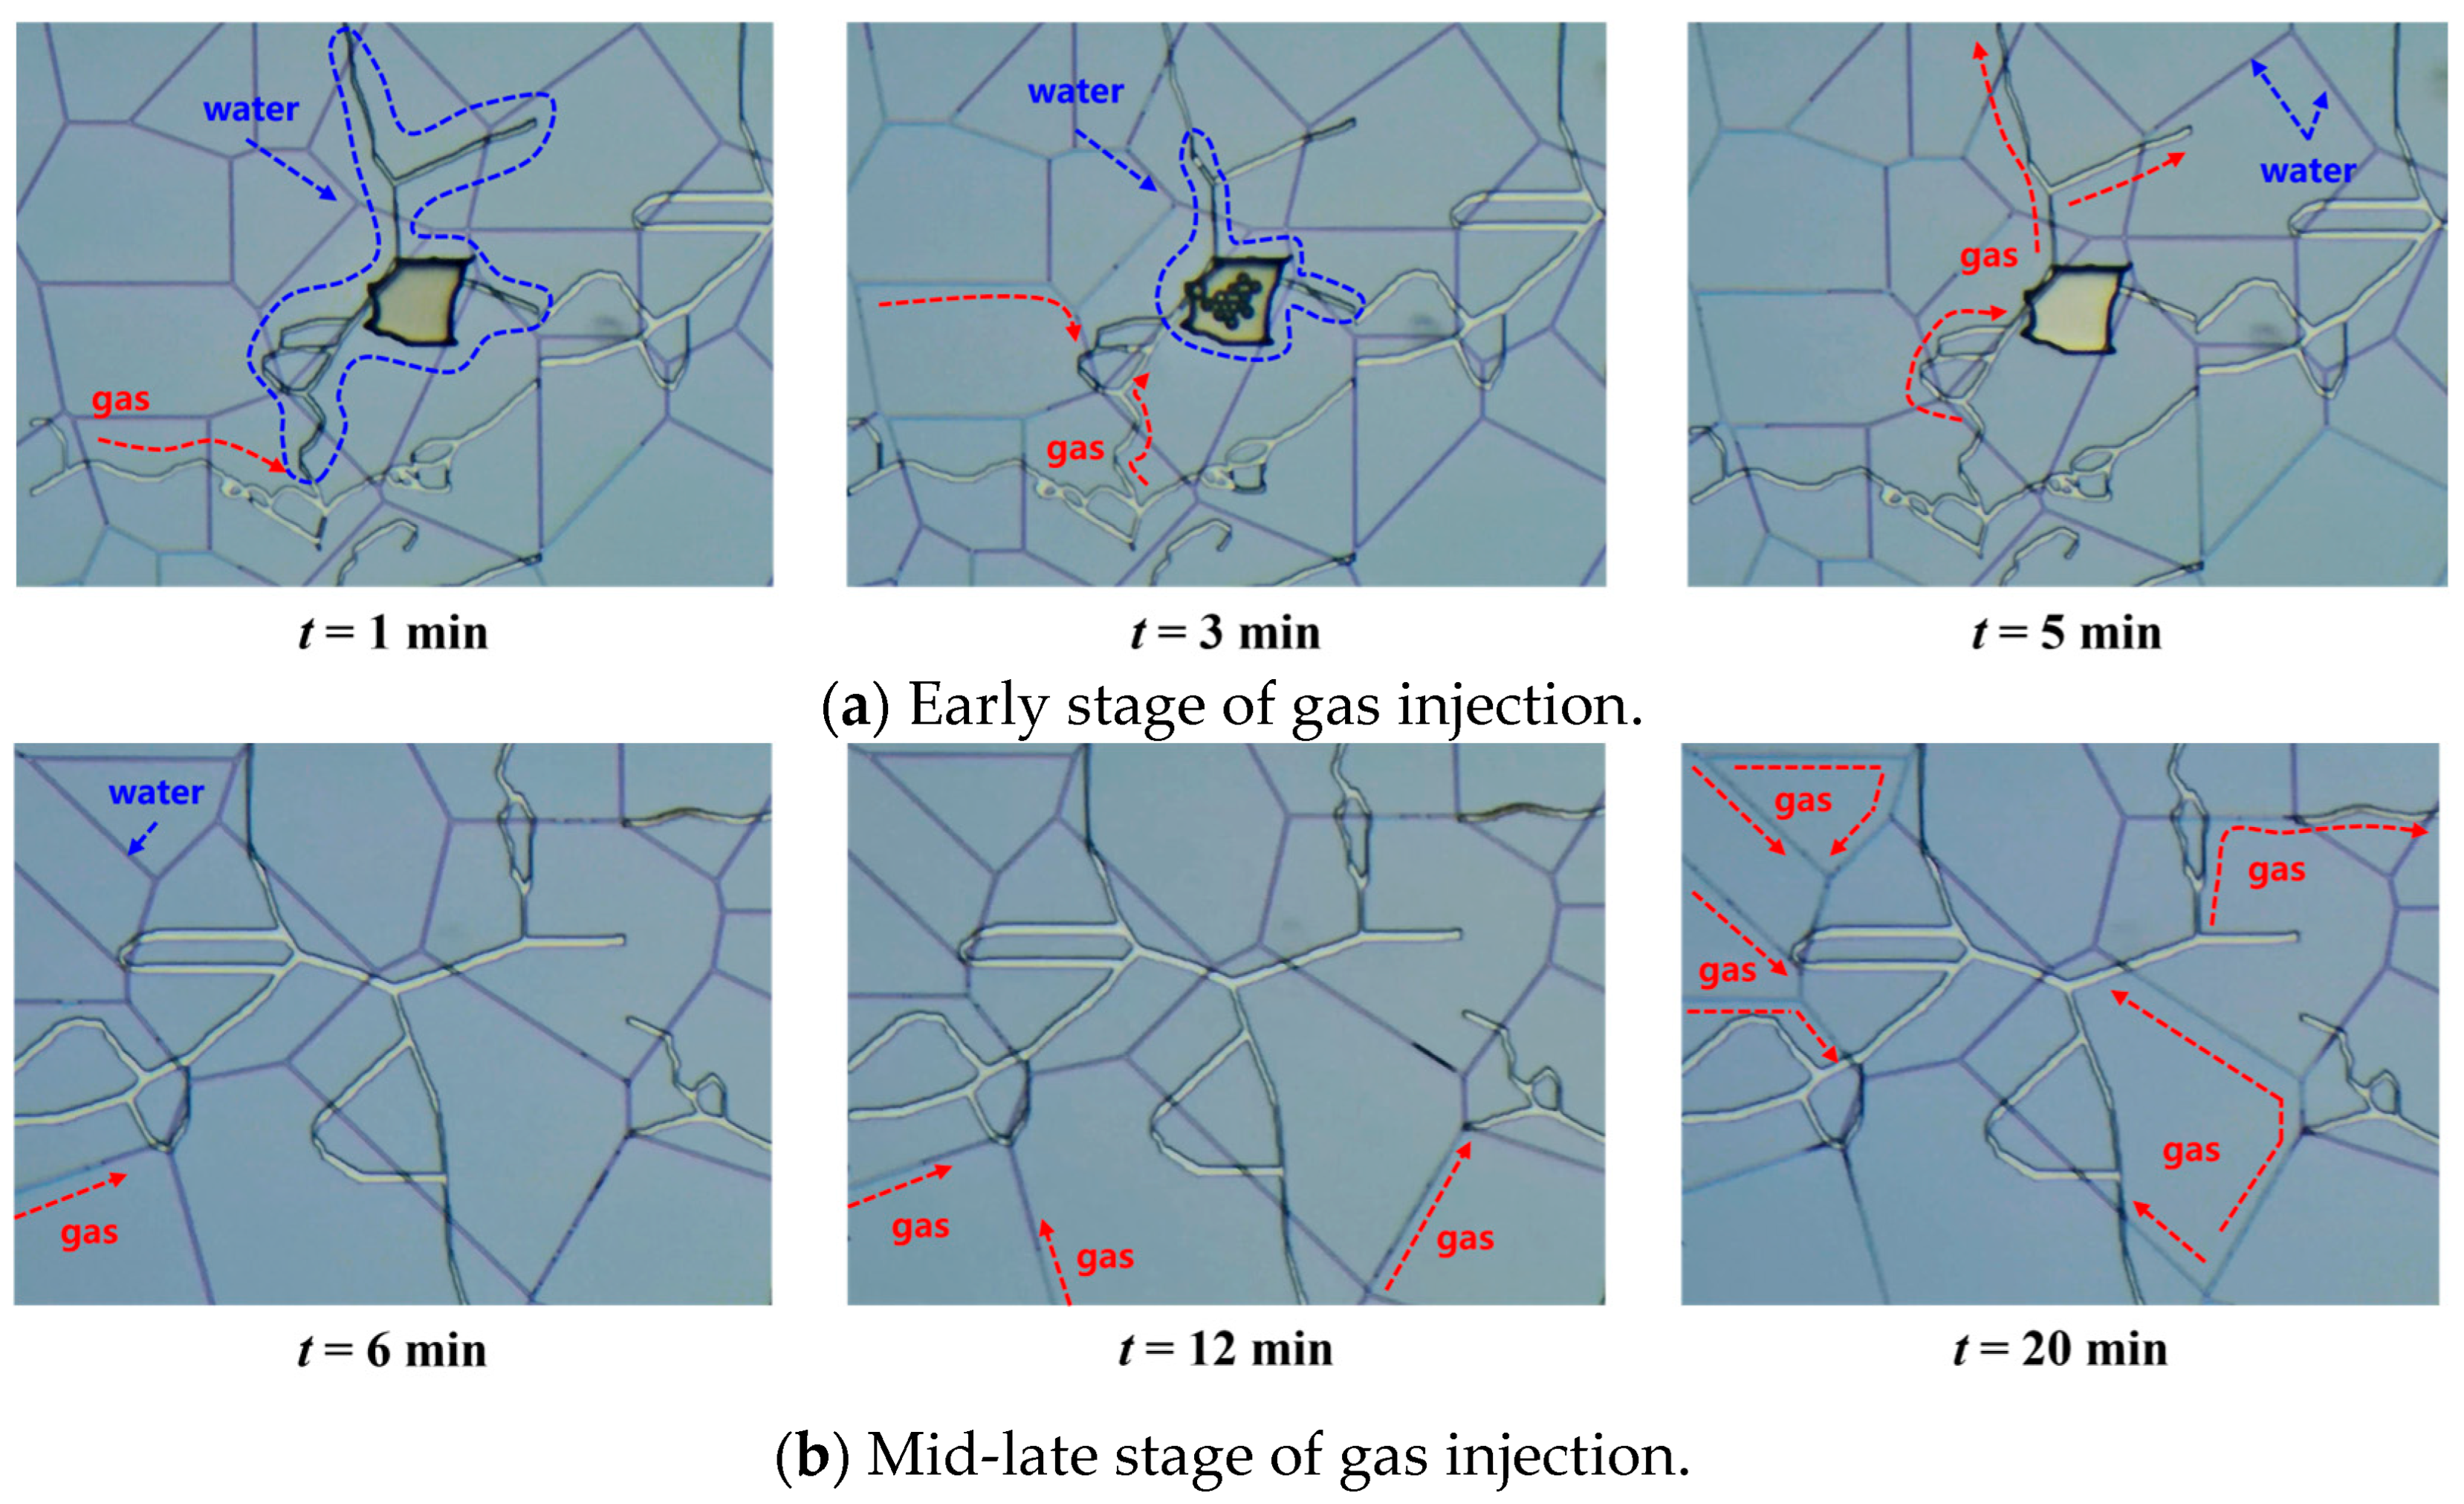
Figure 9, the model has a permeability of 0.205 mD and a porosity of 7.38%. The model exhibits a low degree of development of micro-fractures and micron-sized pores. During the entire gas injection phase, the injected gas primarily flows along the matrix pores, and the produced water is mainly capillary water. In the early stage of gas injection (0–5 min), the gas–water micro-distribution in some homogeneous nano-pores (i.e., areas far from micro-fractures) is controlled by relatively weak capillary forces [
21]. At low pressure, some weak capillary water can be displaced by the gas, resulting in a gas–water mixture with a low gas content. The gas–water ratio decreases with increasing displacement time (as shown in
Figure 10), and its value ranges from 2 to 5. Combined with the multi-scale visualization results, it can be seen that the capillary pressure is high at this stage, and it is difficult for the gas phase to enter the nano-pores with smaller pore size, so only weak capillary water can be used. In the later stage of gas injection (5–20 min), during high-pressure displacement, the water phase in the heterogeneous areas around the micro-fractures, controlled by strong capillary forces, is gradually displaced, increasing the gas content. However, due to the limitation of pore throat radius, some slug water and water film water are still stranded, so it is difficult to be effectively displaced, and then a higher residual water saturation is formed, which shows that pore structure has a significant control effect on displacement effect. The gas–water ratio slows down and stabilizes over time, dropping below 2, and the produced water type shifts to strong capillary water.
- (2)
Pore models with permeability between 0.5 and 1.0 mD
A model with a permeability of 0.509 mD and a porosity of 8.49%, as shown in
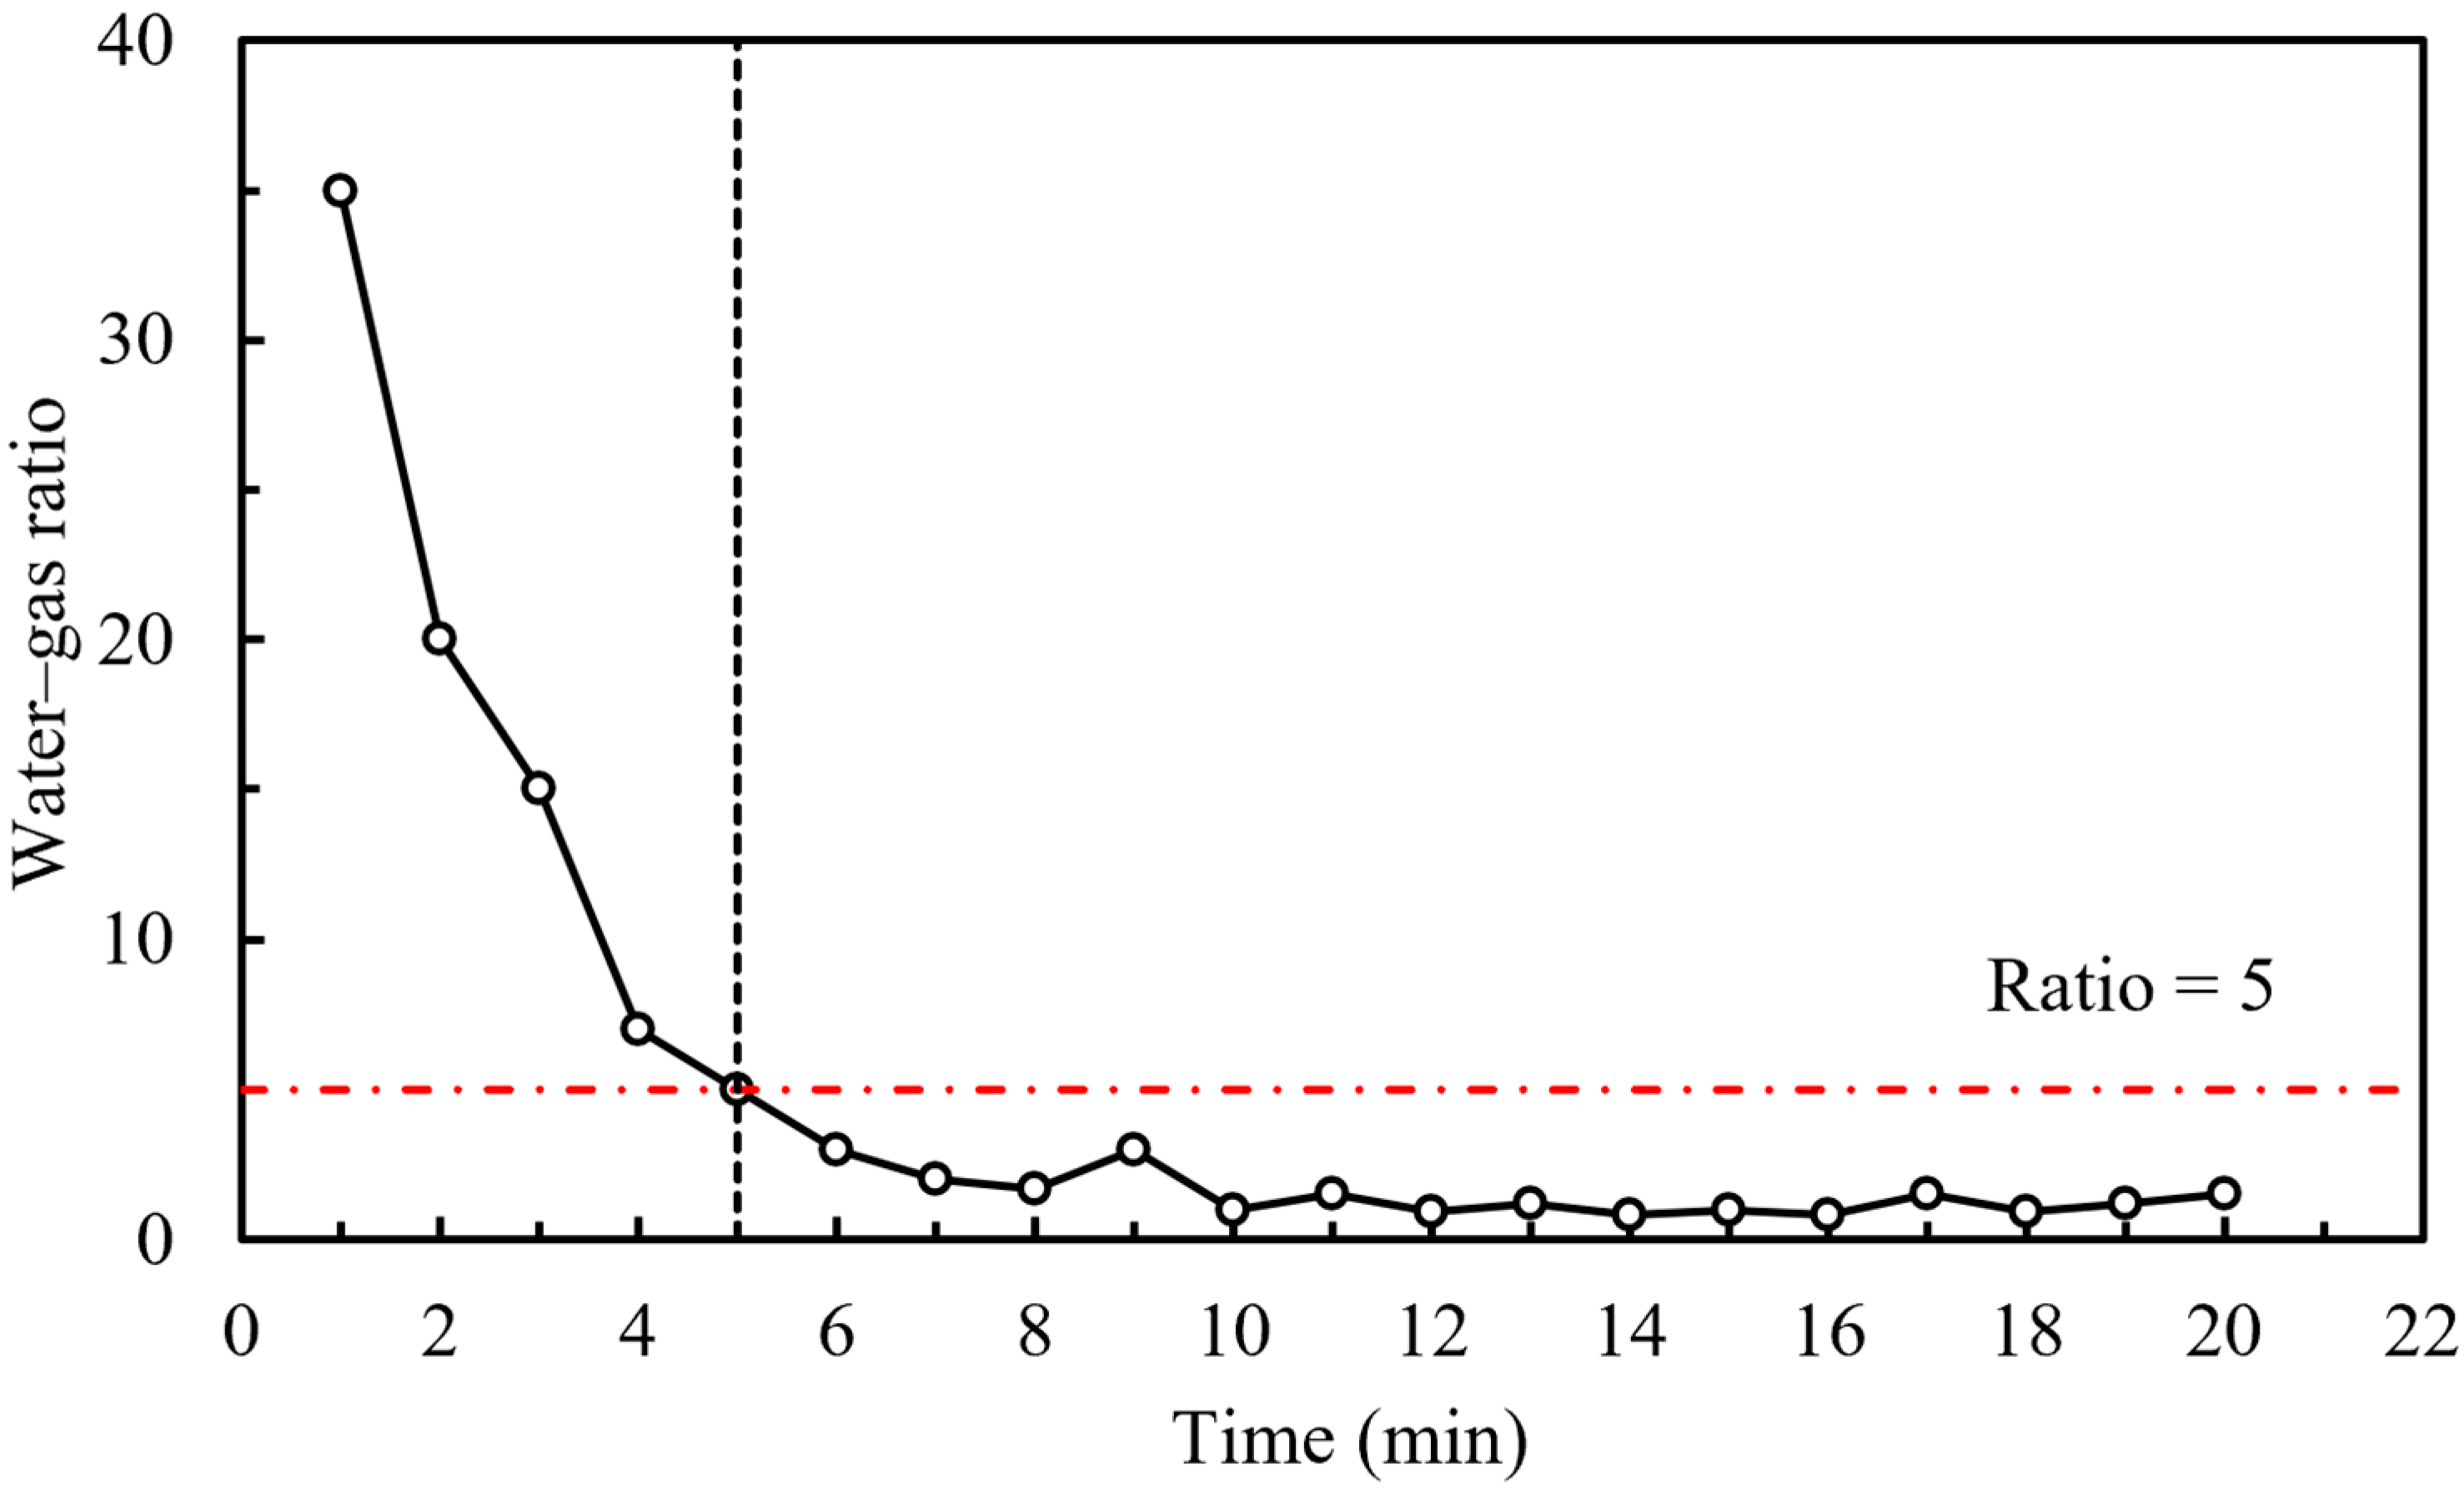
Figure 11, was used. This model has poor matrix connectivity and a significant degree of development in micro-fractures and micron-sized pores. During the entire gas injection process, the early stage produces free water, while the later stage transitions to capillary water. In the early stage of gas injection (0–5 min), at low pressure, the gas phase mainly flows through larger-scale micro-fractures and micron-sized pores due to the limited connectivity of the nano-matrix [
22] and is partially connected through the nano-matrix. The gas–water two-phase system is in a mixed state, with a higher gas content. The gas–water ratio decreases rapidly with increasing displacement time (as shown in
Figure 12), remaining above 5, and the produced water type is free water. Microscopic observation shows that there are independent bubbles in some micropores directly connected with nano-pores. Due to the influence of the Jamin effect, capillary water in these areas cannot be displaced by gas. In the later stage of gas injection (5–20 min), a small amount of water in the nano-pores, controlled by weaker capillary forces, begins to be displaced and is expelled through the micro-fractures. However, due to the lack of pore connectivity and the low utilization rate of strong capillary water, this is related to the development of micron-scale pores and fractures in the model but poor pore connectivity. The gas content is low, and the rate of change in the gas–water ratio decreases, gradually stabilizing and dropping below 5. The produced water type transitions to capillary water. In addition, the connectivity of nano-pores will directly affect the production efficiency of water in micron-sized fractures. As far as this model is concerned, the poor connectivity of nano-pores significantly inhibits the production of formation water in micron-sized fractures under the condition of low displacement pressure difference.
- (3)
Pore models with permeability greater than 1.0 mD
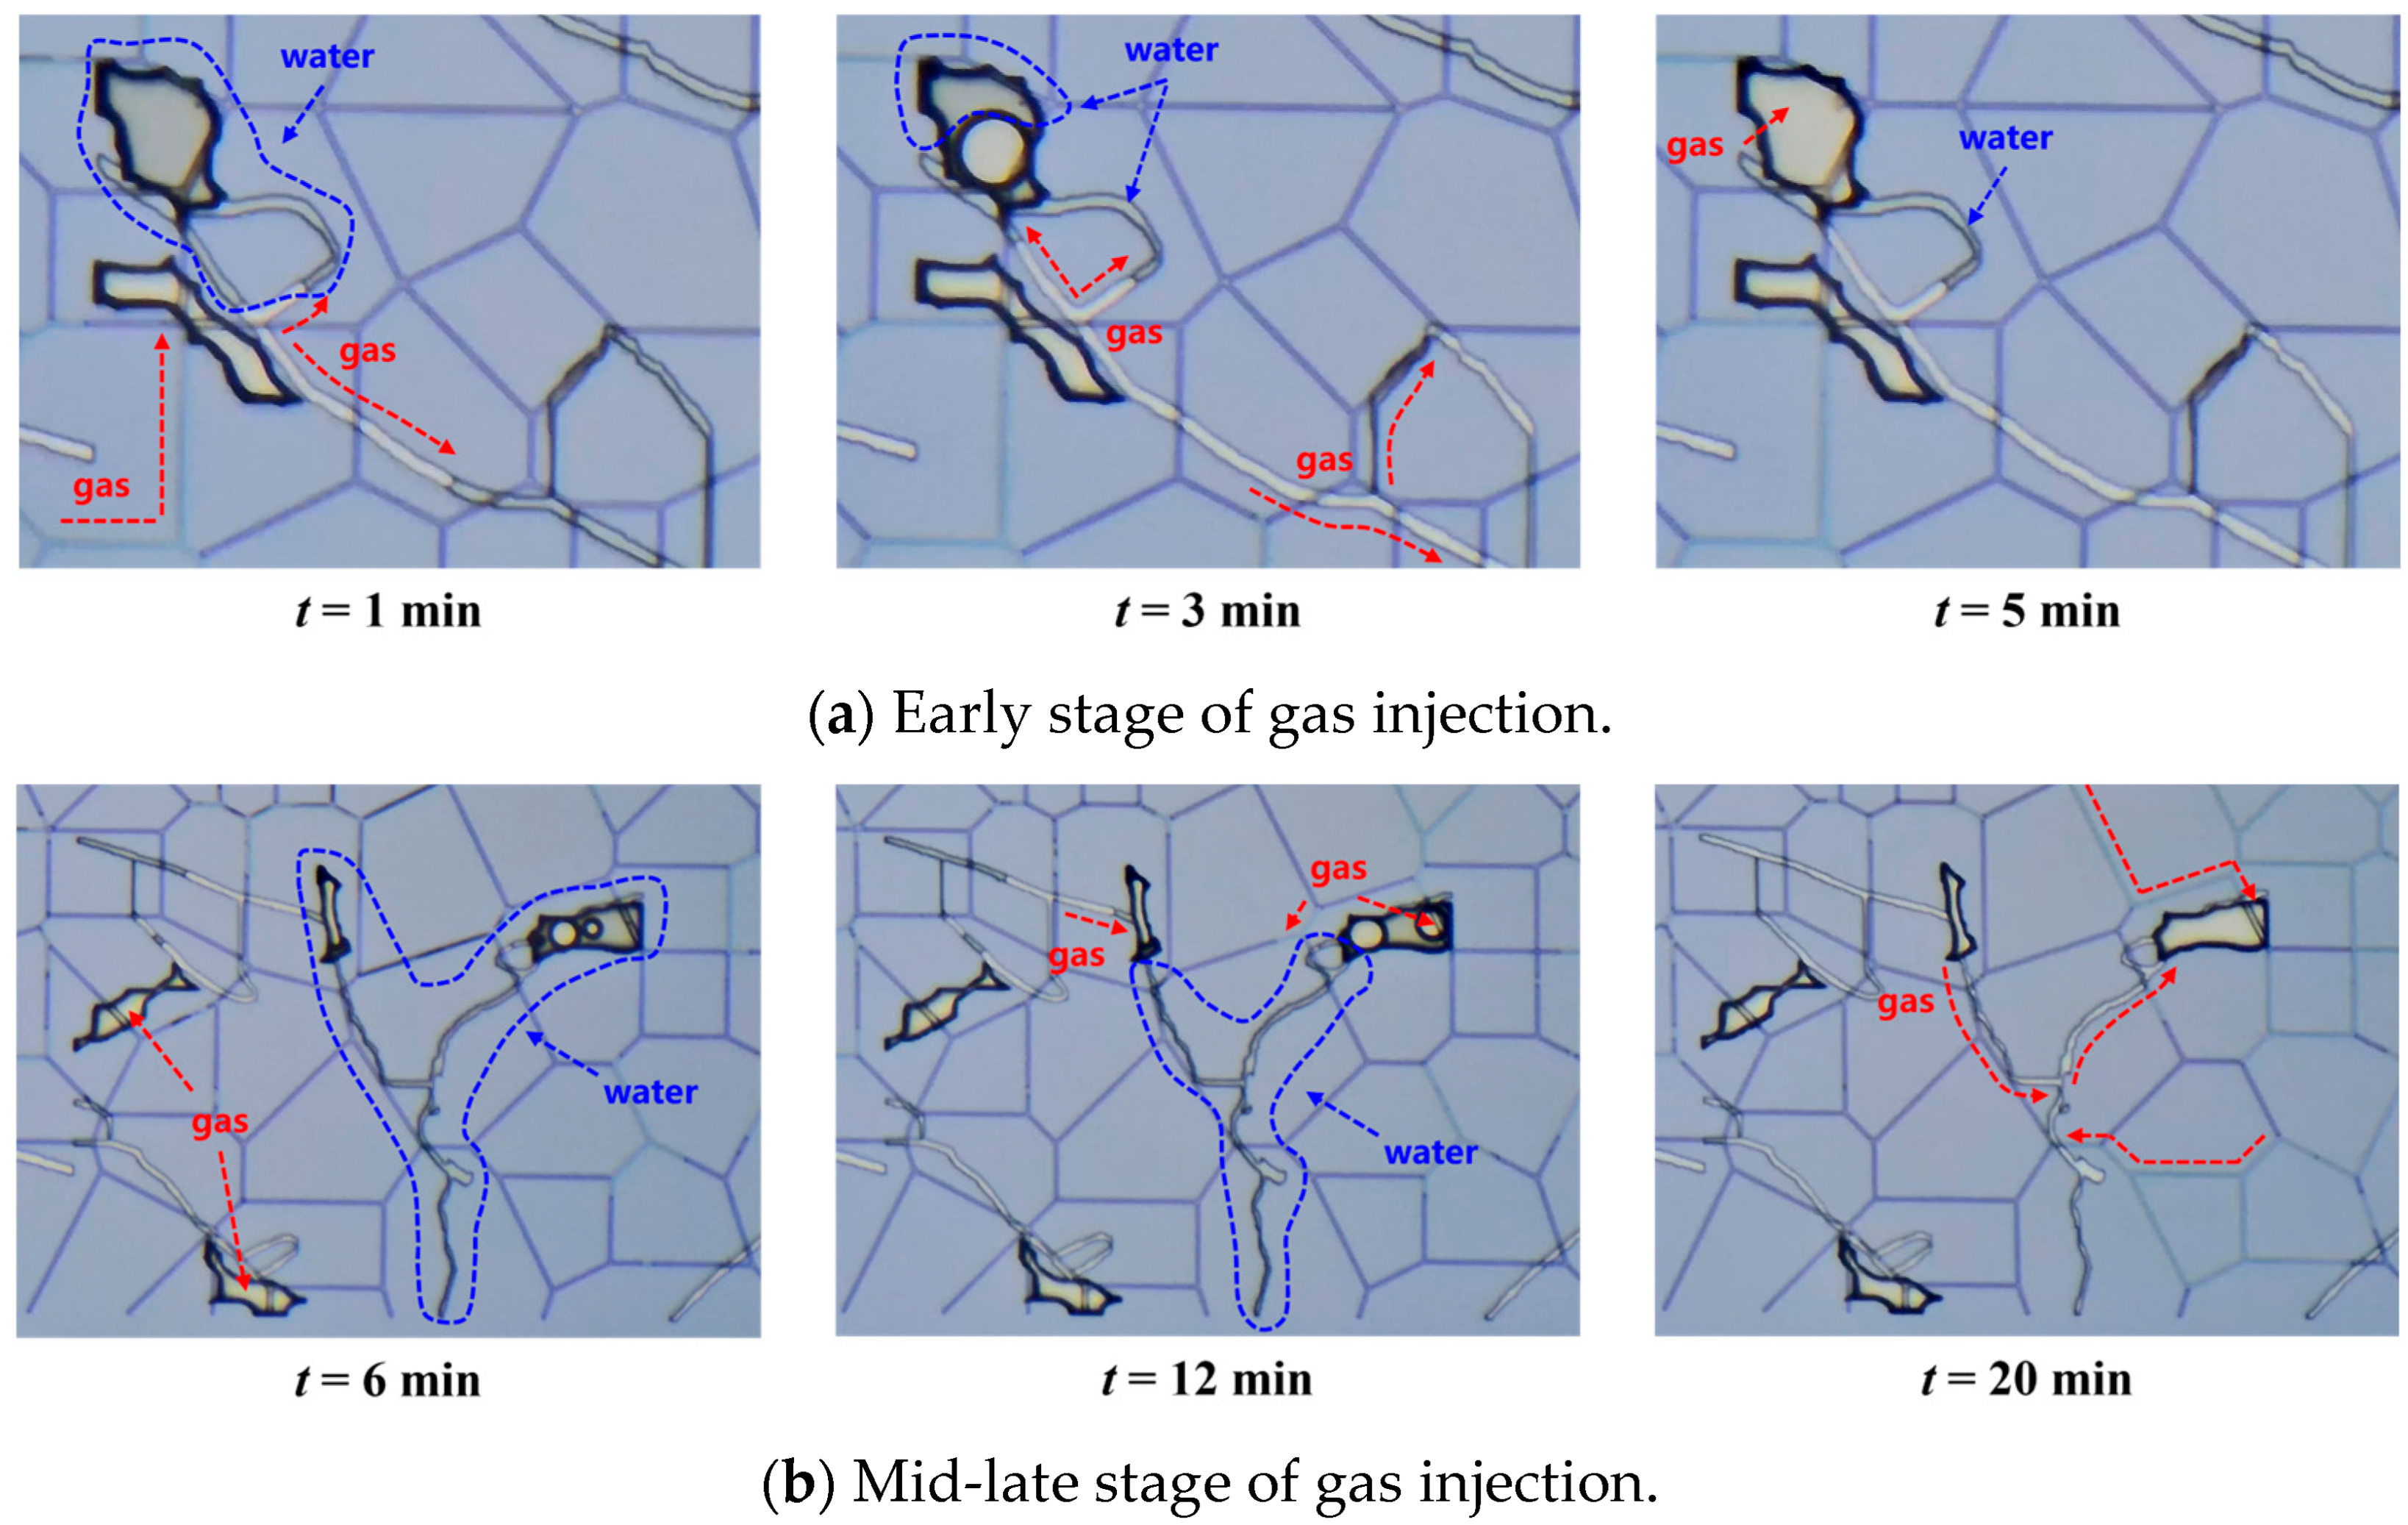
A pore model with a permeability of 2.634 mD and a porosity of 10.5%, as shown in
Figure 13, was used. This model has a high degree of development in micro-fractures and micron-sized pores and strong connectivity in the nano-matrix. Throughout the displacement process, the primary product is free water. In the early stage of gas injection (0–5 min), due to the good fluidity of the water phase in the micro-fractures and micron-sized pores in the middle of the model, at low pressure, the gas phase mainly flows along the micro-fractures and micron-sized pores, connected by some nano-matrix, almost completely displacing the water phase in the micro-fractures and micron-sized pores in the middle of the model. This results in a gas–water mixed state with higher gas content. The gas–water ratio decreases rapidly with increasing displacement time, as shown in
Figure 14. It shows that formation water is easier to be used passively, and the ratio of strong capillary water to bound water is relatively low under the conditions that micro-cracks and micro-holes are fully developed and pore connectivity is good. Combined with the microscopic results, it can be seen that high permeability and high connectivity reduce the overall capillary pressure, so that the gas phase can quickly form a stable flow channel under low drive and realize the rapid utilization of free water. It shows that the production behavior in nano-pores dominates the production characteristics of the total formation water at this time. As the injection time increases (5–20 min), higher injection pressure gradually displaces the free water in the blind-end micro-fractures of the system and further expels it through some nano-matrix. The gas–water ratio gradually stabilizes with time but remains above 5, and the produced water type remains free water. Because of the high connectivity of the pore structure of the model, the gas propulsion path during cross-scale displacement is more coherent, which effectively weakens the local capillary force and helps to improve the overall displacement efficiency.
Generally speaking, the development degree of micron-sized pores and fractures and the connectivity of pore structure are the key factors affecting water production in formation. The more micro-cracks and micro-holes are developed, the better the connectivity of pores, the easier it is for formation water to be used passively, and the less the final bound water content. In the low-permeability model, the high proportion of nano-pores and small pore throat radius lead to high capillary pressure, so it takes a large pressure difference to use capillary water, and the final proportion of residual bound water is high. Although the pore size of the medium-permeability model is large, the connectivity of nano-pores is poor and the Jamin effect is obvious, resulting in long-term retention of the local water phase. However, in the high-permeability model, micro-cracks and micro-holes are highly developed and have good connectivity. Low pressure can weaken capillary force and quickly use multi-scale water phase. The reason for this difference is that the connectivity of nano-pores has a direct impact on the production of formation water in micron-scale fractures, and poor pore connectivity will significantly increase the difficulty of capillary water production, thus changing the production mechanism of formation water in different scales.
5. Conclusions
(1) The average pore throat radius of the reservoir rock with primary permeability (0.1–1 mD) ranges from 0.1 to 0.9 μm. According to high-resolution CT scanning imaging, the micron-scale pore throat radius of all samples is distributed between 2 and 5 μm. Based on CT scanning and pore size distribution results, we propose a statistical algorithm to reduce the three-dimensional digital rock core to a two-dimensional microscopic visual physical model. By combining the pore–permeability relationship of real cores from the Dongsheng gas field, we obtained representative chip models within three typical permeability ranges, achieving an effective reproduction of the pore structure of real reservoir rocks.
(2) By observing the gas–water two-phase flow state under different micro-model constant pressure conditions, the change in the produced water–gas ratio over time can be quantified, and the corresponding relationship between three types of produced water and the water–gas ratio can be obtained. When the water–gas ratio is greater than 5, the produced water type is free water; when the water–gas ratio is between 2 and 5, the produced water type is weak capillary water; and when the water–gas ratio is less than 2, the produced water type is strong capillary water. Formation water production is controlled by the development degree of micron-sized pores and fractures as well as pore connectivity. In the low-permeability model, the high proportion of nano-pores and small pore throats result in high capillary pressure, requiring a large pressure difference to mobilize capillary water, leading to a high bound water content. In the medium-permeability model, although the pores are larger, the poor connectivity of nano-pores and the capillary blockage effect cause local water phase retention. In the high-permeability model, the high development and good connectivity of micro-fractures and micropores allow for rapid mobilization of multi-scale water phases under low pressure. The difference in nano-pore connectivity is the core reason for the significant variations in the water mobilization mechanism and bound water content in formations with different permeabilities.
(3) This study employs a 2D microvisualization physical model to classify and quantify different types of formation water under varying gas–water ratios. Although the 2D micro-model was constructed using CT scanning and statistical algorithms, real reservoirs exhibit 3D structures with complex pore–fracture networks. The 2D model may not fully replicate 3D fluid flow behavior. Future work could integrate digital rock technology (e.g., FIB-SEM) with 3D-printed microfluidic chips to construct a 3D pore–fracture network model for investigating gas–water two-phase flow mechanisms in three-dimensional space.


