Article

Real-Time Gas Emission Modeling for the Heading Face of Roadway in Single and Medium-Thickness Coal Seam

1
China Coal Energy Research Institute Co., Ltd., Xi’an 710054, China
2
College of Safety Science and Engineering, Xi’an University of Science and Technology, Xi’an 710054, China
3
Key Laboratory of West Mine and Hazard Prevention, Ministry of Education, Xi’an University of Science and Technology, Xi’an 710054, China
*
Author to whom correspondence should be addressed.
Energies 2025, 18(17), 4592; https://doi.org/10.3390/en18174592
Submission received: 2 July 2025 / Revised: 11 August 2025 / Accepted: 27 August 2025 / Published: 29 August 2025
(This article belongs to the Topic Advances in Coal Mine Disaster Prevention Technology)

Abstract

The behavior of gas emissions at the heading face of the coal mine is a key indicator of potentially harmful gas disaster risk, necessitating in-depth study via analytical and statistical methods. However, conventional prediction and evaluation methods depend on long-interval statistical data, which are too coarse for and lack the immediacy required for real-time applications. Based on the physical laws of gas storage and flow, a refined computational model has been developed to compute dynamic gas emission rates that vary with geology and excavating process. Furthermore, by comparing the computed outputs with actual monitoring data, it becomes possible to assess whether abnormal gas emissions are occurring. Methodologically, this model first applies the finite difference method to compute the dynamic gas flux and the dynamic residual gas content. It then determines the exposure duration of each segment of the roadway wall at any given moment, as well as the mass of newly dislodged coal. The total gas emission rate at a specific sensor location is obtained by aggregating the contributions from all of the exposed wall and the freshly dislodged coal. Owing to some simplifications, the model’s applicability is currently restricted to single, medium-thick coal seams. The model was preliminarily implemented in Python (3.13.2) and validated against a case study of an active heading face. The results demonstrate a strong concordance between model predictions and field measurements. The model notably captures the significant variance in emission rates resulting from different mining activities, the characteristic emission surges from dislodged coal and newly exposed coal walls, and the influence of sensor placement on monitoring outcomes.

1. Introduction

The gas emission characteristics at the heading face of a coal seam roadway in a coal mine can largely reflect the potential risk of gas-related disasters. The “Detailed Rules for the Prevention and Control of Coal and Gas Outbursts”, which is a mandatory guideline in China for preventing and controlling coal and gas outburst disasters in coal mines, mandate that a thorough analysis must be performed for any abnormal gas emission events [1]. Implementation involves a multi-faceted approach, including the following: on-site observation, geophysical surveys and drilling, data analysis of the safety monitoring system, and surveillance video review.
Abnormal gas emission events are typically identified via gas concentration data from the safety monitoring system. The emission patterns vary significantly across different excavation operations; for example, the gas emission rate during coal cutting is noticeably higher than during other procedures. Crucially, these sudden gas surges are predominantly attributable to excavation procedures rather than abnormal gas reservoir conditions. Therefore, without detailed analysis and attribution of abnormal gas emissions based on the type of excavation activity, it becomes difficult to identify the risk factors that are more likely to lead to coal and gas outburst disasters.
Currently, the commonly used method for predicting the gas emission rate at the heading face of a coal roadway in China is documented in Appendix B of “The Prediction Method of Mine Gas Emission Rate” (AQ 1018–2006) [2]. According to this standard, the gas emission rate of the coal wall and dislodged coal in a roadway heading face can be estimated by Equations (1) and (2), respectively:
q 3 = D v q 0 ( 2 L v 1 )
where q3 is the gas emission rate from coal walls (units: m3/min). D is the exposed coal perimeter in the roadway cross-section (units: m). v is the average roadway driving speed (units: m/d). L is the roadway length (units: m). q0 is the gas emission intensity of coal walls (units: m3/(m2·min)).
q 4 = S v r ( W 0 W C )
Here, q4 is the gas emission rate from dislodged coal during roadway driving (units: m3/min). S is the cross-sectional area of the driving roadway (units: m2). v is the average roadway driving speed (units: m/d). γ is coal density (units: t/m3). W0 is the original gas content of the coal seam (units: m3/t). Wc is the residual gas content of coal after mine transportation (units: m3/t).
However, these equations yield constant values for gas emission rate, failing to capture real-time variation patterns of gas emission, and thus preventing the refinement of gas predictions at heading faces.
In recent years, theoretical research on gas occurrence and migration in coal seams has advanced to a level that can support the modeling and computation of gas emission in coal seam roadways. The main challenge in calculating gas emission lies in how to apply these theories to numerical modeling and computation—particularly in representing complex geometries, geological conditions, and excavation processes without excessive simplifications. Chinese scientists, represented by Shining ZHOU, have conducted fundamental research on gas flow mechanisms in coal seams. Extensive studies have been performed on methane seepage behavior in coal masses, permeability calculation methods, and the mechanical response characteristics of gas-bearing coal under stress-seepage coupling conditions [3,4,5,6,7,8,9,10,11,12]. Mathematical modeling and application validation have been systematically developed for gas flow patterns in mining faces, borehole gas extraction dynamics, and gas emission prediction models [13,14,15,16,17,18,19,20,21,22,23,24,25,26,27,28,29]. Globally, coal wall gas emission rates remain an active research focus. PETROSYAN A.E. pioneered critical investigations into coal mine methane emissions [30], while BARRER R.M. established foundational theories on gas diffusion mechanisms [31]. Booth P. et al. further advanced quantification models and monitoring methodologies for gas emission assessment [32,33].
Building upon these foundations, this study develops distinct calculation methods for gas emission rates from freshly exposed coal walls and dislodged coal by incorporating excavation procedures, gas seepage theory, integral equations, and mathematical modeling. A real-time gas emission mathematical model for coal roadway excavation faces was constructed and validated through field measurements at mining sites, providing technical references for gas control and early warning of outbursts in similar mines.

2. Fundamentals of Gas Emission Prediction Models for Excavation Faces

2.1. Influencing Factors of Gas Emission at Excavation Faces

During roadway development, gas emissions are influenced not only by fundamental gas parameters (including gas content, gas pressure, seepage velocity, and diffusion rate) but also by development techniques, geological structures, and stratigraphic distribution of coal seams [34,35,36,37,38,39,40].

2.1.1. Gas Content, Pressure, Seepage Velocity, and Diffusion Rate in Coal Seams

Gas content and pressure in coal seams constitute fundamental factors affecting gas emission at excavation faces. The gas content directly determines the maximum potential gas emission; a higher adsorbed gas content leads to greater gas emissions during coal cutting and breaking operations.
Gas pressure primarily governs the velocity of gas seepage. At equal exposure times, higher gas pressure results in faster gas seepage velocities. Gas seepage velocity is a critical factor affecting gas emission in excavation faces. Driven by pressure and concentration gradients, gas migrates slowly through interconnected pores and fractures within the coal–rock matrix. This process follows fluid transport laws in porous media and is comprehensively influenced by coal permeability, gas viscosity, in situ stress, and temperature. Under identical exposure durations, higher gas seepage velocities accelerate gas release from coal, resulting in greater gas emission volumes. Meanwhile, gas seepage velocity exhibits exponential decay as coal wall exposure time increases. Field observations indicate that elevated seepage velocities correlate with higher gas emissions from newly dislodged coal, whereas reduced velocities extend the effective emission length along the coal wall. At any given time, higher adsorption equilibrium pressures correspond to increased gas emission volumes and faster gas diffusion rates.

2.1.2. Geological Structures, Excavation Techniques, and Coal Seam Occurrence

Geological structures significantly modulate gas distribution, particularly through the sealing effects of enclosed structures that trap gas and create localized zones of high gas content. These often trigger abnormal gas emissions during excavation.
Excavation techniques primarily influence the following:
-
Degree of coal/rock fragmentation;
-
Volume of material dislodged.
Generally, increased fragmentation, higher volume of cut coal, and faster advance rates elevate gas emissions.
Additionally, the characteristics of coal seam occurrence—especially thickness and dip angle—directly affect gas emission patterns at excavation faces.

2.2. Prerequisites

Based on the preceding analysis, gas emission at excavation faces constitutes a complex process influenced by multiple factors under varying conditions. The following fundamental assumptions are established for the gas emission model, consistent with field application requirements:
(1)
The height of the excavation roadway is assumed to be equal to the coal seam thickness, the surface of the roadway’s face is entirely composed of coal for a thick seam, simplifying gas flow into the roadway to one-dimensional flow.
(2)
The test mine’s heading roadway has a rectangular profile, with the coal seam thickness equal to the roadway height. The seam exhibits stable conditions, and no roof or floor coal remains at the heading face.
(3)
The complete excavation cycle is defined as cutting completion →, auxiliary operations → cutting initiation, → cutting completion.
(4)
Within each cutting cycle, the advance rate remains uniform. Concurrently, cut coal produced during cutting is continuously loaded onto conveyors and transported out of the working face.

2.3. Foundation Model Construction

As the excavation roadway advances, the exposure time of coal walls emitting gas varies at different positions along the roadway. To facilitate computational and analytical processes, a gas emission calculation model for the excavation face was developed, as illustrated in Figure 1.
In the figure, points C and C′ denote sensor installation positions of the mine safety monitoring system. Points A and A′ represent initial gas emission recording positions, while B and B′ indicate positions of the excavation face. The distance between the recording points and the excavation face is denoted as l. Within the range l, the excavation process is divided into n complete cutting cycles, with each cycle represented by S. Three element sets characterize the complete excavation procedures within each cutting cycle, as expressed in Equation (3):
S i = ( l i , t h , i , t r , i )
where i denotes the cutting cycle index, sequentially numbered from monitoring points A/A′ to the heading face B/B′ (i = 1,2, …, n). li represents the total advance length per cycle (units: m). th,i indicates the halting duration of the excavation machine per cycle (units: s). tr,i signifies the operational duration of the excavation machine per cycle (units: s).
Consequently, the total excavation cycle parameter Sl is expressed by Equation (4):
S l = [ ( l 1 , t h , 1 , t r , 1 ) , ( l 2 , t h , 2 , t r , 2 ) ... , ( l i , t h , i , t r , i ) ... , ( l n , t h , n , t r , n ) ]
where i = n denotes the ongoing cutting cycle, distinguished from complete cycles in Equation (3) by a tuple set (l′n, t′h,n, t′r,n). If t r , n = 0, it indicates the current operational phase is the coal-cutting halt period. If t r , n > 0, it signifies the current operational phase is the active coal-cutting period.
The coal wall length and heading face position at the excavation face undergoes continuous changes as the excavation advances. Therefore, variable x is defined as an arbitrary distance from points A/A′ toward the excavation face direction, where x = 0 corresponds to positions A/A′. x = l corresponds to positions B/B′. xi denotes the position at the end of spatial segment Si.
This spatial relationship is expressed in Equation (5):
x1 = l1
x2 = l1 + l2
xi = l1 + l2 + ... + li
xn = l1 + l2 + ... + ln−1 + ln = l
Concurrently, variable t is defined as the total elapsed time from points A/A′ to position x. Correspondingly, ti denotes the total elapsed time upon completion of the i-th excavation cycle. This temporal relationship is expressed in Equation (6):
t1 = (th,1 + tr,1)
t2 = (th,1 + tr,1) + (th,2 + tr,2)
...
ti = (th,1 + tr,1) + (th,2 + tr,2) + ... + (th,i + tr,i)
tn = (th,1 + tr,1) + (th,2 + tr,2) + ... + (th,n + tr,n)
Concurrently, variable τ is defined as the exposure time of coal walls at position x along the roadway. Similarly, τ denotes the exposure time at the end position of spatial segment Si. This exposure time relationship is expressed in Equation (7):
τn−1 = (th,n + tr,n)
τn−2 = (th,n + tr,n) + (th,n−1 + tr,n−1)
...
τ1 = (th,n + tr,n) + (th,n−1 + tr,n−1) + ... + (th,2 + tr,2)
τ0 = (th,n + tr,n) + (th,n−1 + tr,n−1) + ... + (th,2 + tr,2) + (th,1 + tr,1)
As illustrated in the gas emission calculation model (Figure 1), positions closer to the excavation face exhibit larger values of x and t but conversely smaller values of τ. The variable t serves as the fundamental independent variable, representing the natural progression of time. For completed excavation phases, historical states can be retrospected by varying t. The relationships among these three variables are analyzed as follows:
(1)
τ is a dependent variable derived inversely from position x for a given excavation state (current or historical). Thus, for the current excavation state tn = τ0, where n denotes the ongoing cycle index, and 0 represents the excavation face position.
(2)
During excavation progression, any spatiotemporal position must be defined by (x,t), as expressed in Equation (8).
x ( t ) = x i 1 i f ( t t i 1 ) t h , i x i 1 + l i t r , i ( t t i 1 t h , i ) i f ( t t i 1 ) > t h , i
(3)
Assuming a constant advance rate, the exposure time τ(x) at different positions x under current excavation conditions is given by Equation (9).
τ ( x ) = τ i + ( x i x ) t r , i l i

3. Gas Emission Prediction Model for Excavation Faces

Based on the source-specific gas emission calculation methodology established earlier, gas emission at the excavation face primarily originates from two distinct sources: gas emission from exposed coal walls and gas emission from the heading face, as formulated in Equation (10):
Q = Q s + Q f
where Q is the real-time gas emission rate at monitoring positions A/A (units: m3/s). Qs denotes the real-time gas emission rate from coal walls along the roadway between positions A/A and the excavation face (units: m3/s). Qf represents the real-time gas emission rate from the heading face (units: m3/s).
The calculation methodologies for gas emission from exposed coal walls and the heading face are presented separately below.

3.1. Coal Wall Gas Emission Model

The total gas emission from both roadway sidewalls is obtained by integrating emissions along segments CB and C′B′. However, under actual conditions, the coal walls beyond recording points A/A′ exhibit excessively long exposure times with exponentially decaying gas seepage velocities. To enhance model alignment with practical scenarios, gas emission calculations are segmented into CA/C′A′ sections (beyond monitoring points) and AB/A′B′ sections (between monitoring points and excavation face).
Within AB/A′B′, the coal walls are subdivided into spatial segments S1, S2, , Sn−1, Sn corresponding to excavation cycles. Summation replaces integration for computational practicality, as formalized in Equation (11):
Q s = i = 1 n Q s , j + Q
where Qs,i is the gas emission rate from segment Si at the current time (units: m3/s). Q′ is the gas emission rate from segments CA and C′A′ at the current time (units: m3/s).
For segments with prolonged exposure times, the average value method is employed to calculate gas emission rates. First, the average exposure time of coal walls within such segments is expressed by Equation (12):
τ ¯ i = τ i 1 + τ i 2
The current gas emission rate from coal walls in segment Si is given by Equation (13):
Q s , j = 2 q i ( τ ¯ i ) l i h i
where qi is the gas emission intensity from exposed coal walls (units: m3/(s·m2)). h i represents the coal seam thickness in segment i (units: m).
Similarly, based on Equation (13), the current gas emission rate from coal walls in segments CA and C′A′ is expressed by Equation (14).
Q = 2 q i ( τ 0 ) l i h i

3.2. Heading Face Gas Emission Model

3.2.1. Fundamental Assumptions

Due to substantial gas emissions from dislodged coal and cutter-induced liberation during heading face operations—coupled with distinct correlations between gas emissions, excavation procedures, and time—a mathematical integration approach is adopted to model heading face gas emissions. The following assumptions are established and consistent with field applicability:
(1)
Per Figure 1, the heading face (region B/B′) exhibits irregular geometry during operation. While gas flows radially from this zone into the roadway, modeling radial flow would result in double counting of sidewall gas emissions, compromising accuracy. Thus, only unidirectional flow from the heading face zone (Segment Sf in Figure 1) is considered modeled via 1D flow theory.
(2)
At each cutting cycle initiation, the following apply:
-
Coal wall gas content ahead of the heading face equals undisturbed in situ gas content (unless modified by regional outburst elimination or pre-drainage).
-
This content remains constant until cutting begins.
-
The gas content in dislodged coal equals the residual content after gas desorption from the previous cutting cycle.
(3)
During halting periods between cycles, gas desorption reduces coal mass gas content. We assume the following:
-
Gas content variation is confined within the current cycle’s advance length.
-
Total gas emission cannot exceed the total gas content of dislodged coal during the cycle.
Based on these principles, the segmented calculation formula for heading face gas emission rate is given by Equation (15):
Q f = Q f , h i f ( t r , n = 0 ) Q f , r i f ( t r , n ' > 0 )
where Qf,h is the gas emission rate from newly exposed coal walls at the heading face during coal-cutting halt periods (units: m3/s). Qf,r is the gas emission rate from newly dislodged coal during cutting operations (units: m3/s).

3.2.2. Numerical Solution of Gas Seepage

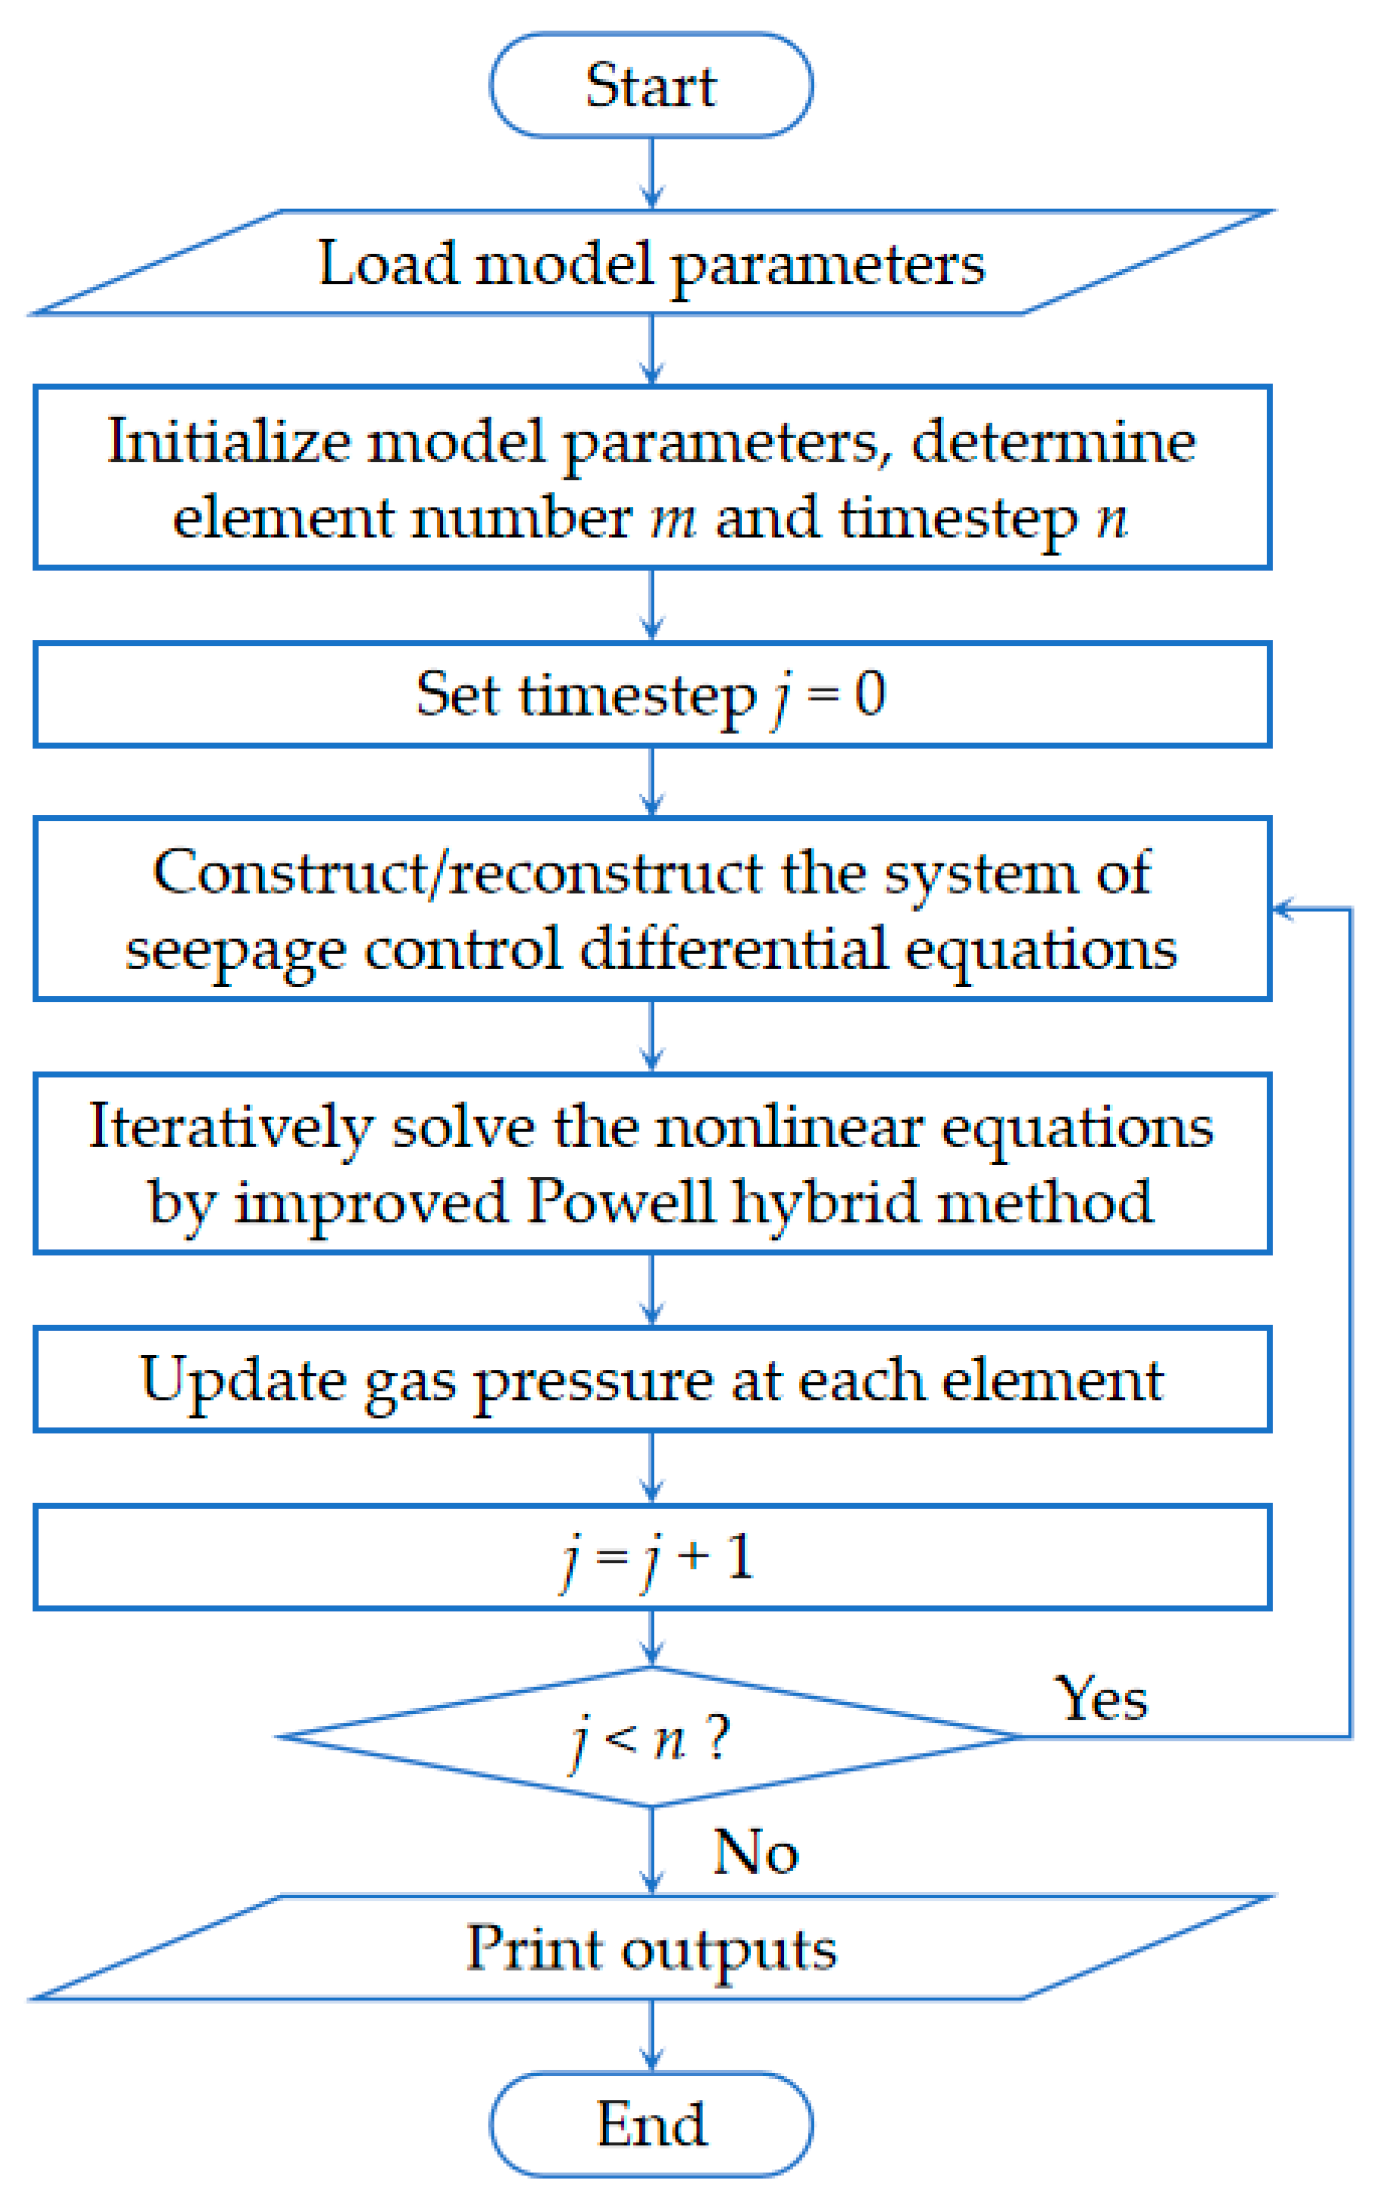
For the problem of unidirectional gas flow following sudden coal wall exposure, our team has achieved preliminary results in previous research [41]. In the process of drainage and natural emission of coal mine gas, Darcy seepage is the main pattern of gas transport in coal seam, and the presence of adsorption makes the seepage control equations more complicated; oversimplification had to be performed for these equations to solve them in the past. Based on seepage theory, the normalized form of governing equations of gas Darcy seepage in coal seams for various coordinate systems are derived. Aiming at the problem of unidirectional gas flow after sudden exposure of the coal wall, an unconditionally stable seepage governing the finite difference equation with second-order accuracy is derived by using Crank–Nicolson difference method without too much simplification. Using Python’s SciPy package and a variant of the Powell hybrid method for solving nonlinear equations, numerical solving of the constructed difference equations is implemented through programming. Solution results show that at different times, both gas content and pressure at different distances from the coal wall exhibit an arc-tangent function relationship with distance, and a comprehensive fitting equation for gas content calculation at any position and time is given. It is also concluded that the gas emission rate of the coal wall decreases as a power function over time. The solution procedure of the finite difference method is shown in Figure 2.
This study adopts the aforementioned resultant model, performing regression analysis on simulation results by re-inputting parameters.

3.2.3. Gas Emission During Cutting Halts

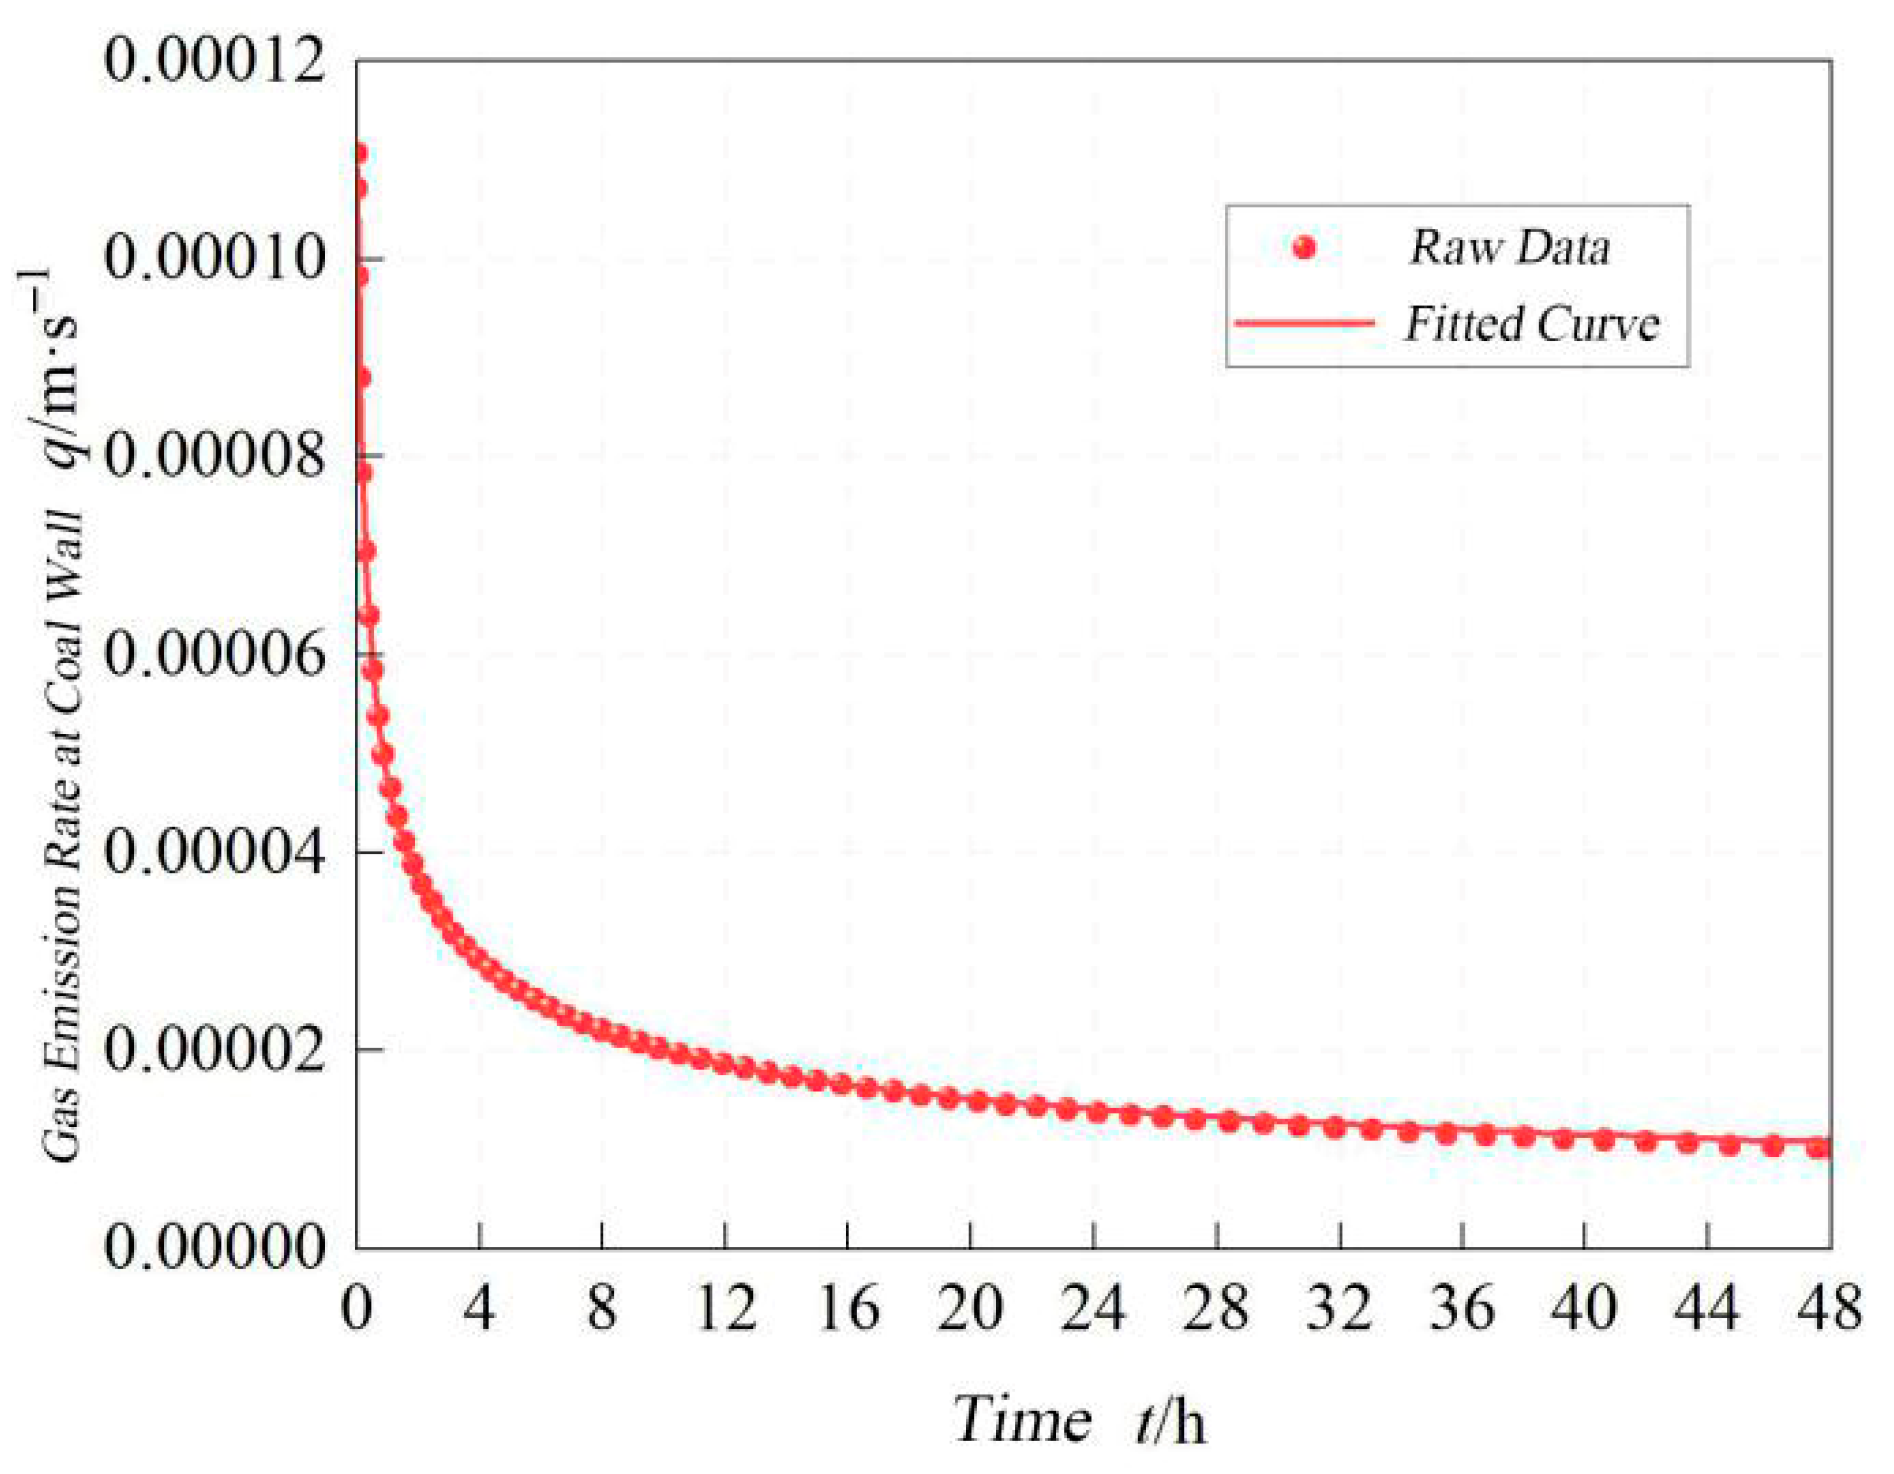
Using Python programming, we solved and analyzed a unidirectional flow model simulating sudden coal wall exposure. The relationship between gas emission rate and time at the exposed surface was fitted, with results presented in Figure 3 [41].
The fitted function follows a power function as given by Equation (16):
q ( t ) = m ( t + t 0 ) k
where q is the volumetric flux, which is the rate of volume flow across a unit area (units: m/s), and it is different from various capital Q variables, whereas the latter is the rate of volume flow across a specific area. m is a scaling coefficient that controls the overall magnitude of the function, with m > 0. t0 is a time-shift term, typically positive (t0 > 0) and relatively small in magnitude, introduced to prevent the flux from becoming infinite at the initial time. Exponent k determines the trend of the function over time, since the gas emission flux continuously decays, m3 > 0.
During coal-cutting halt periods, with coal wall exposure time τ = th,n, the gas emission rate is calculated using Equation (17):
Q f , h = q ( t h , n ) S = m ( t h , n + t 0 ) k S
where S is the exposed coal seam cross-sectional area (units: m2).

3.2.4. Gas Emission During Cutting Operations

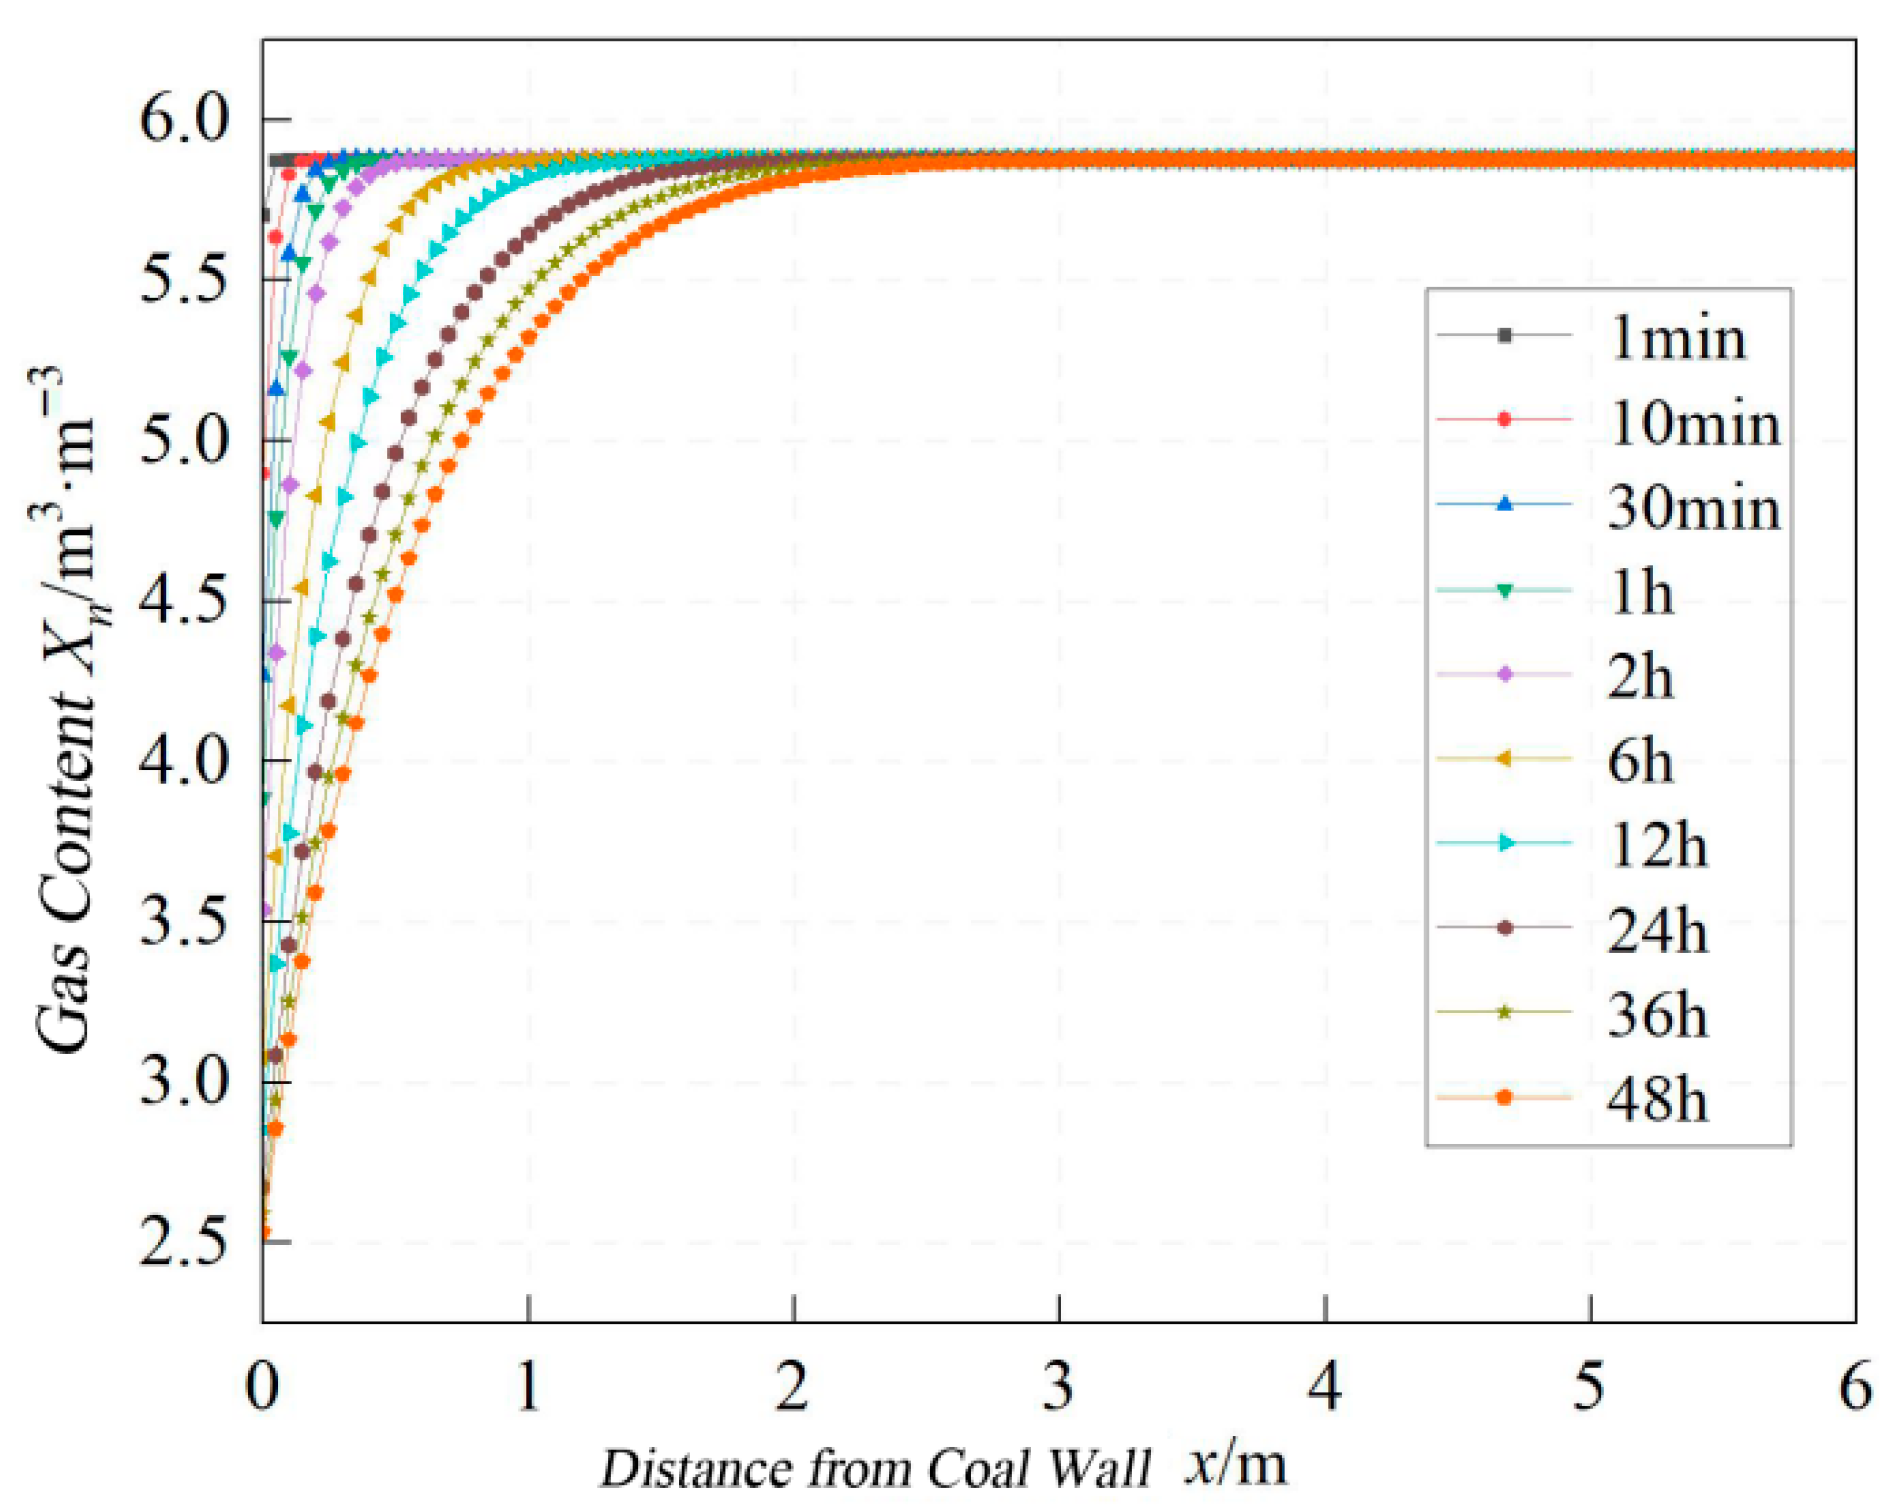
Similarly, using Python programming, we analyzed the variation patterns of gas content in terms of position and time. Based on numerical solutions, the fitted relationships between coal seam gas content and distance from the coal wall under different exposure times are presented in Figure 4 [41].
Based on the predicted curves in Figure 3 and assuming a constant advance rate at the working face during cutting operations, the average velocity is denoted as v ¯ . After time tr,n, the advance distance equals ln = tr,n ×  v ¯ . The gas content in newly dislodged coal at the current time is given by Equation (18) [41]:
X n ( t r , n ) = k 1 arctan ( k 2 v ¯ t r , n ) + k 3
where Xn represents the gas content of the coal seam at position tr,n v ¯ when excavation starts; its meaning is the volume of gas under standard conditions, contained in a unit volume of coal (units: m3/m3). k1 is the amplitude control coefficient, equal to the initial gas content of the coal (units: m3/m3). k2 is the acceleration factor, which determines the growth rate of the function. k3 is the offset term, controlling the value of the function at tr,n = 0 (units: m3/m3).
The volume of newly dislodged coal per unit time is given by Equation (19) [41]:
V ¯ r , n = v ¯ S
where V ¯ r , n is the average cutting volume per unit time during coal-cutting operations (units: m3/s).
To calculate the gas emission rate Qf,r during cutting, we employ a methodology based on two premises:
(1)
The gas content distribution profile ahead of the coal wall is known.
(2)
Gas is immediately released from coal upon fragmentation.
The variation pattern of gas content within the coal wall follows Equation (18) as previously defined.
Consequently, the gas emission rate during cutting operations is given by Equation (20) [41]:
Q f , r = [ X n ( t r , n ) X r ] V ¯ r , n = [ k 1 arctan ( k 2 v ¯ t r , n ) + k 3 X r ] v ¯ S
where Xr is the residual gas content; it represents the volume of gas under standard conditions, contained in a unit volume of coal (units: m3/m3).
Substituting Equations (17) and (20) into Equation (15) yields the heading face gas emission rate formula in Equation (21) [41]:
Q f = m ( t h , n + t 0 ) k S i f ( t r , n = 0 ) [ k 1 arctan ( k 2 v ¯ t r , n ) + k 3 X r ] v ¯ S i f ( t r , n > 0 )

4. Field Validation

4.1. Numerical Solution of Gas Emission Model

Experimental mine parameters:
-
Ventilation method: forced auxiliary ventilation;
-
Tunnel cross-section shape: rectangular;
-
Tunnel width: 6 m, tunnel height: 3.7 m, cross-sectional area: 22.2 m2;
-
Air velocity: 0.41 m/s;
-
Airflow rate: 9.1 m3/s;
-
v ¯ : 1.5 × 10⁻⁴ m/s;
-
Xr: 3.76 m3/m3;
-
Coal seam gas pressure = 0.32 MPa;
-
Constant atmospheric pressure at the exposed surface: 101,325 Pa;
-
Constant gas pressure at reservoir boundary: 0.32 MPa.
-
Coal adsorption constants:
-
a = 22.35 m3/t;
-
b = 0.78 × 10⁻⁶ Pa−1;
-
Porosity φ = 0.067;
-
Permeability K = 1.45 × 10⁻¹⁶ m2;
-
Apparent density Pc = 1270 kg/m−3.
The model length = 100 m with a spatial step size = 0.25 m, resulting in 400 grid elements. The simulation period spanned 180 days. To address computational intensity, a variable time step method was implemented with a power-law progression: initial time step = 60 s, and maximum time step = 800 s. This reduced total steps from 259,200 to 32,667, cutting computational time to approximately 4 h.
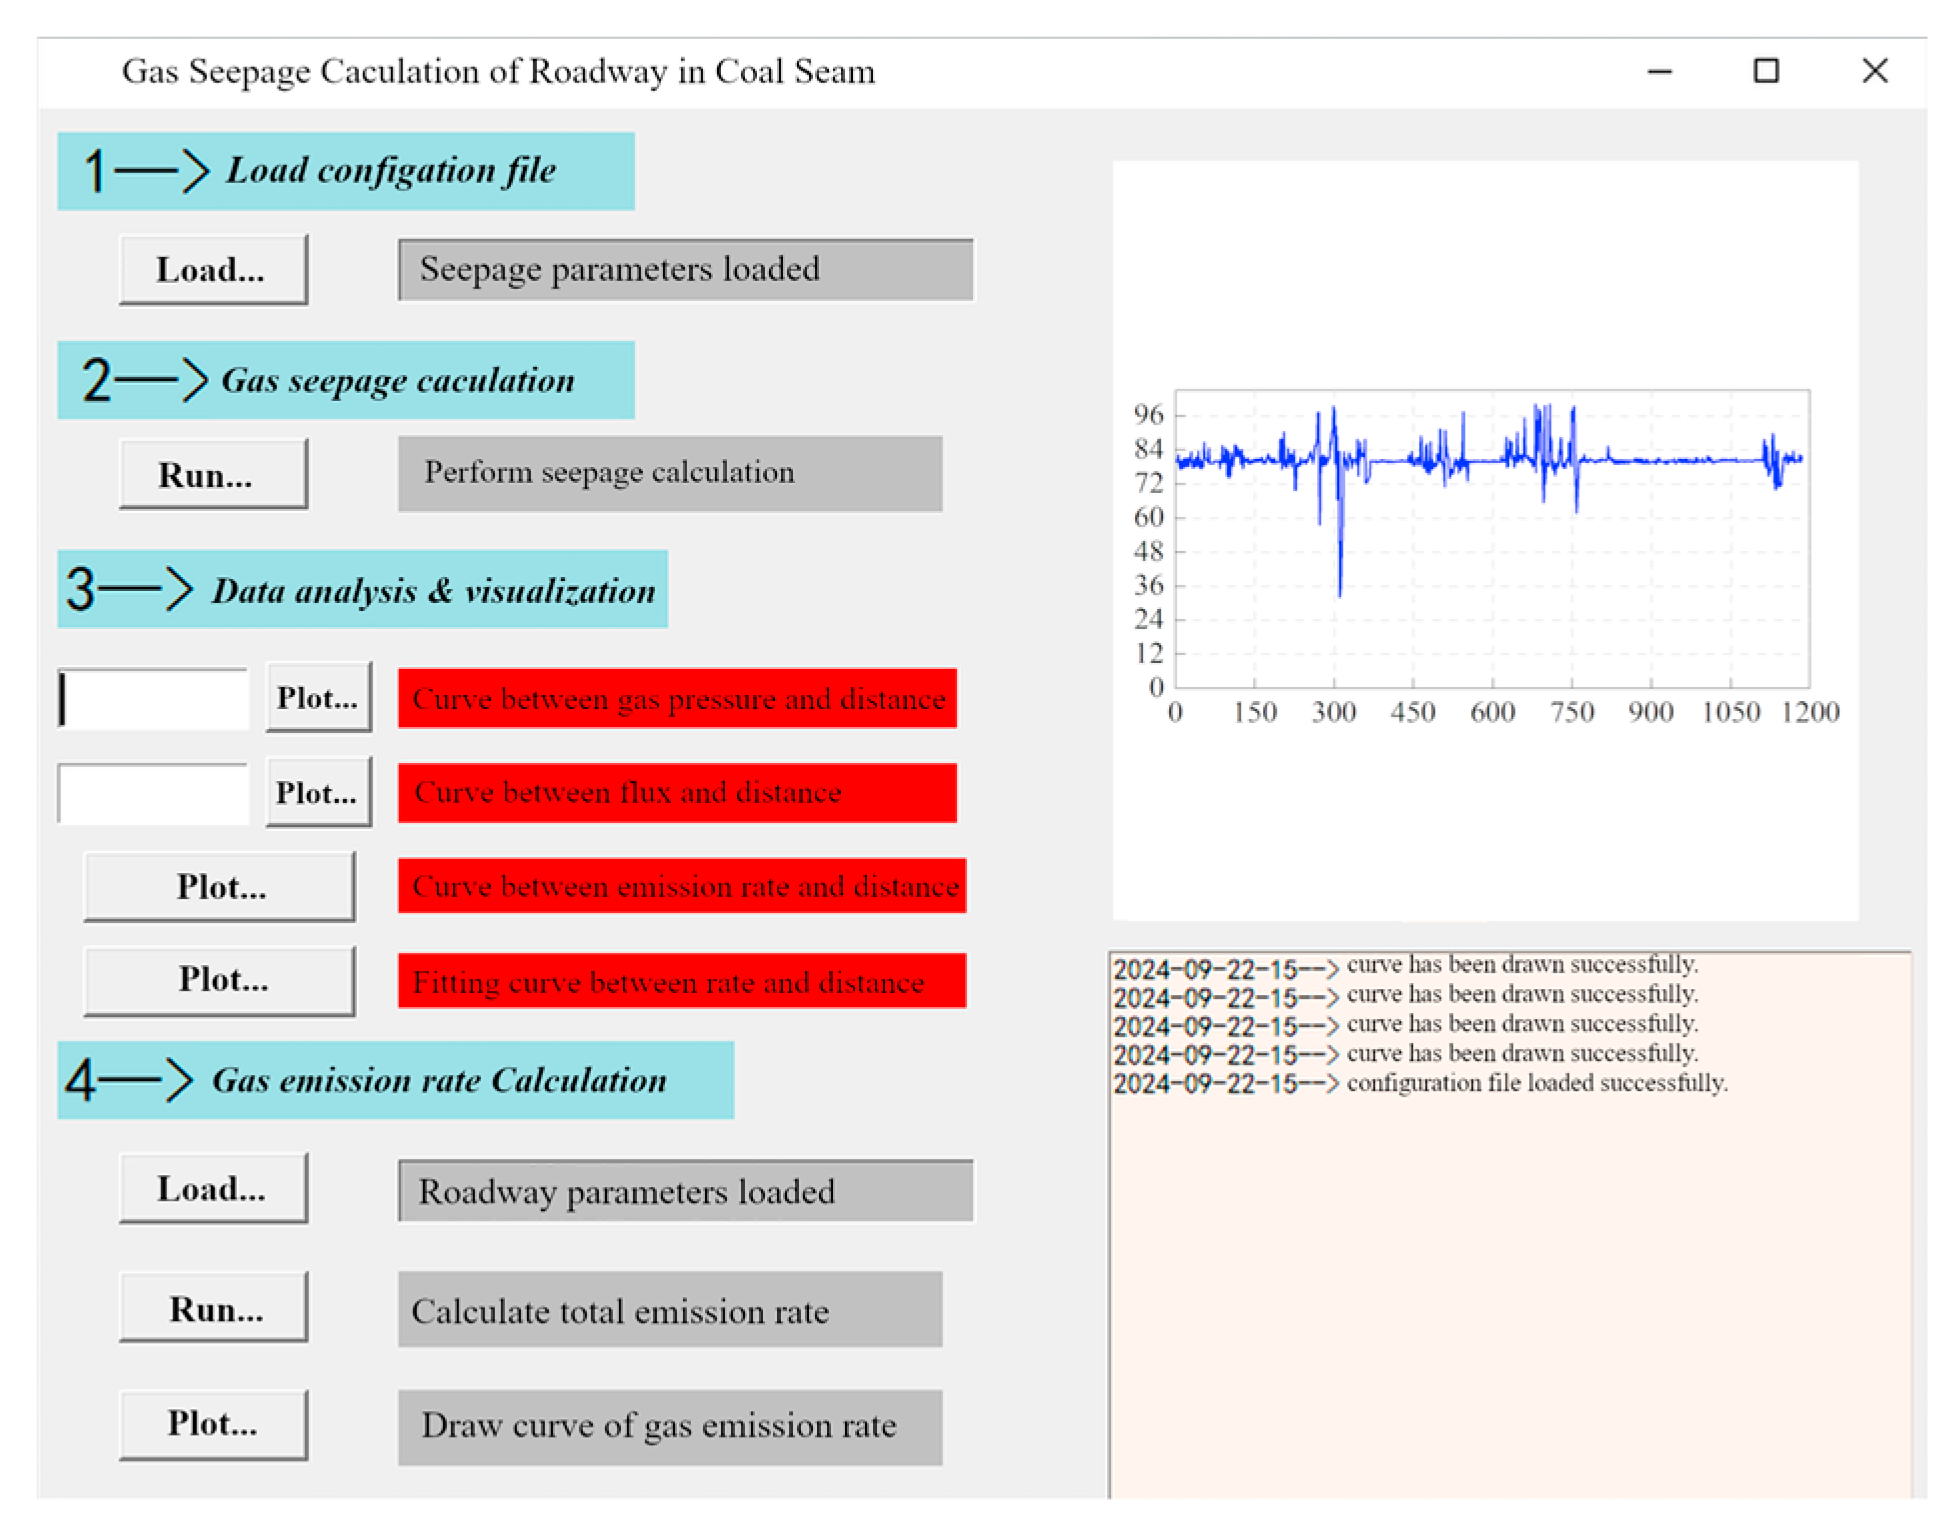
Based on collected excavation procedures and the developed real-time gas emission model, a Python solver program was implemented with a dedicated UI interface (Figure 5). This system simulates gas seepage and emission rates under various operational conditions by loading configuration files.
The gas content relationship under specified states is given by Equation (22):
Xn(x,t) = ((162.816 + t)/(t + 1213.637)0.924 − 0.167) × arctan((953.312 × t−0.459) × x) +
(183151.788 + t)0.224/(t + 300.639)0.166
The gas emission rate versus exposure time at the exposed surface was fitted, yielding the empirical Equation in Equation (23):
q(t) = 0.00127(t + 496.624)−0.395

4.2. Field Validation

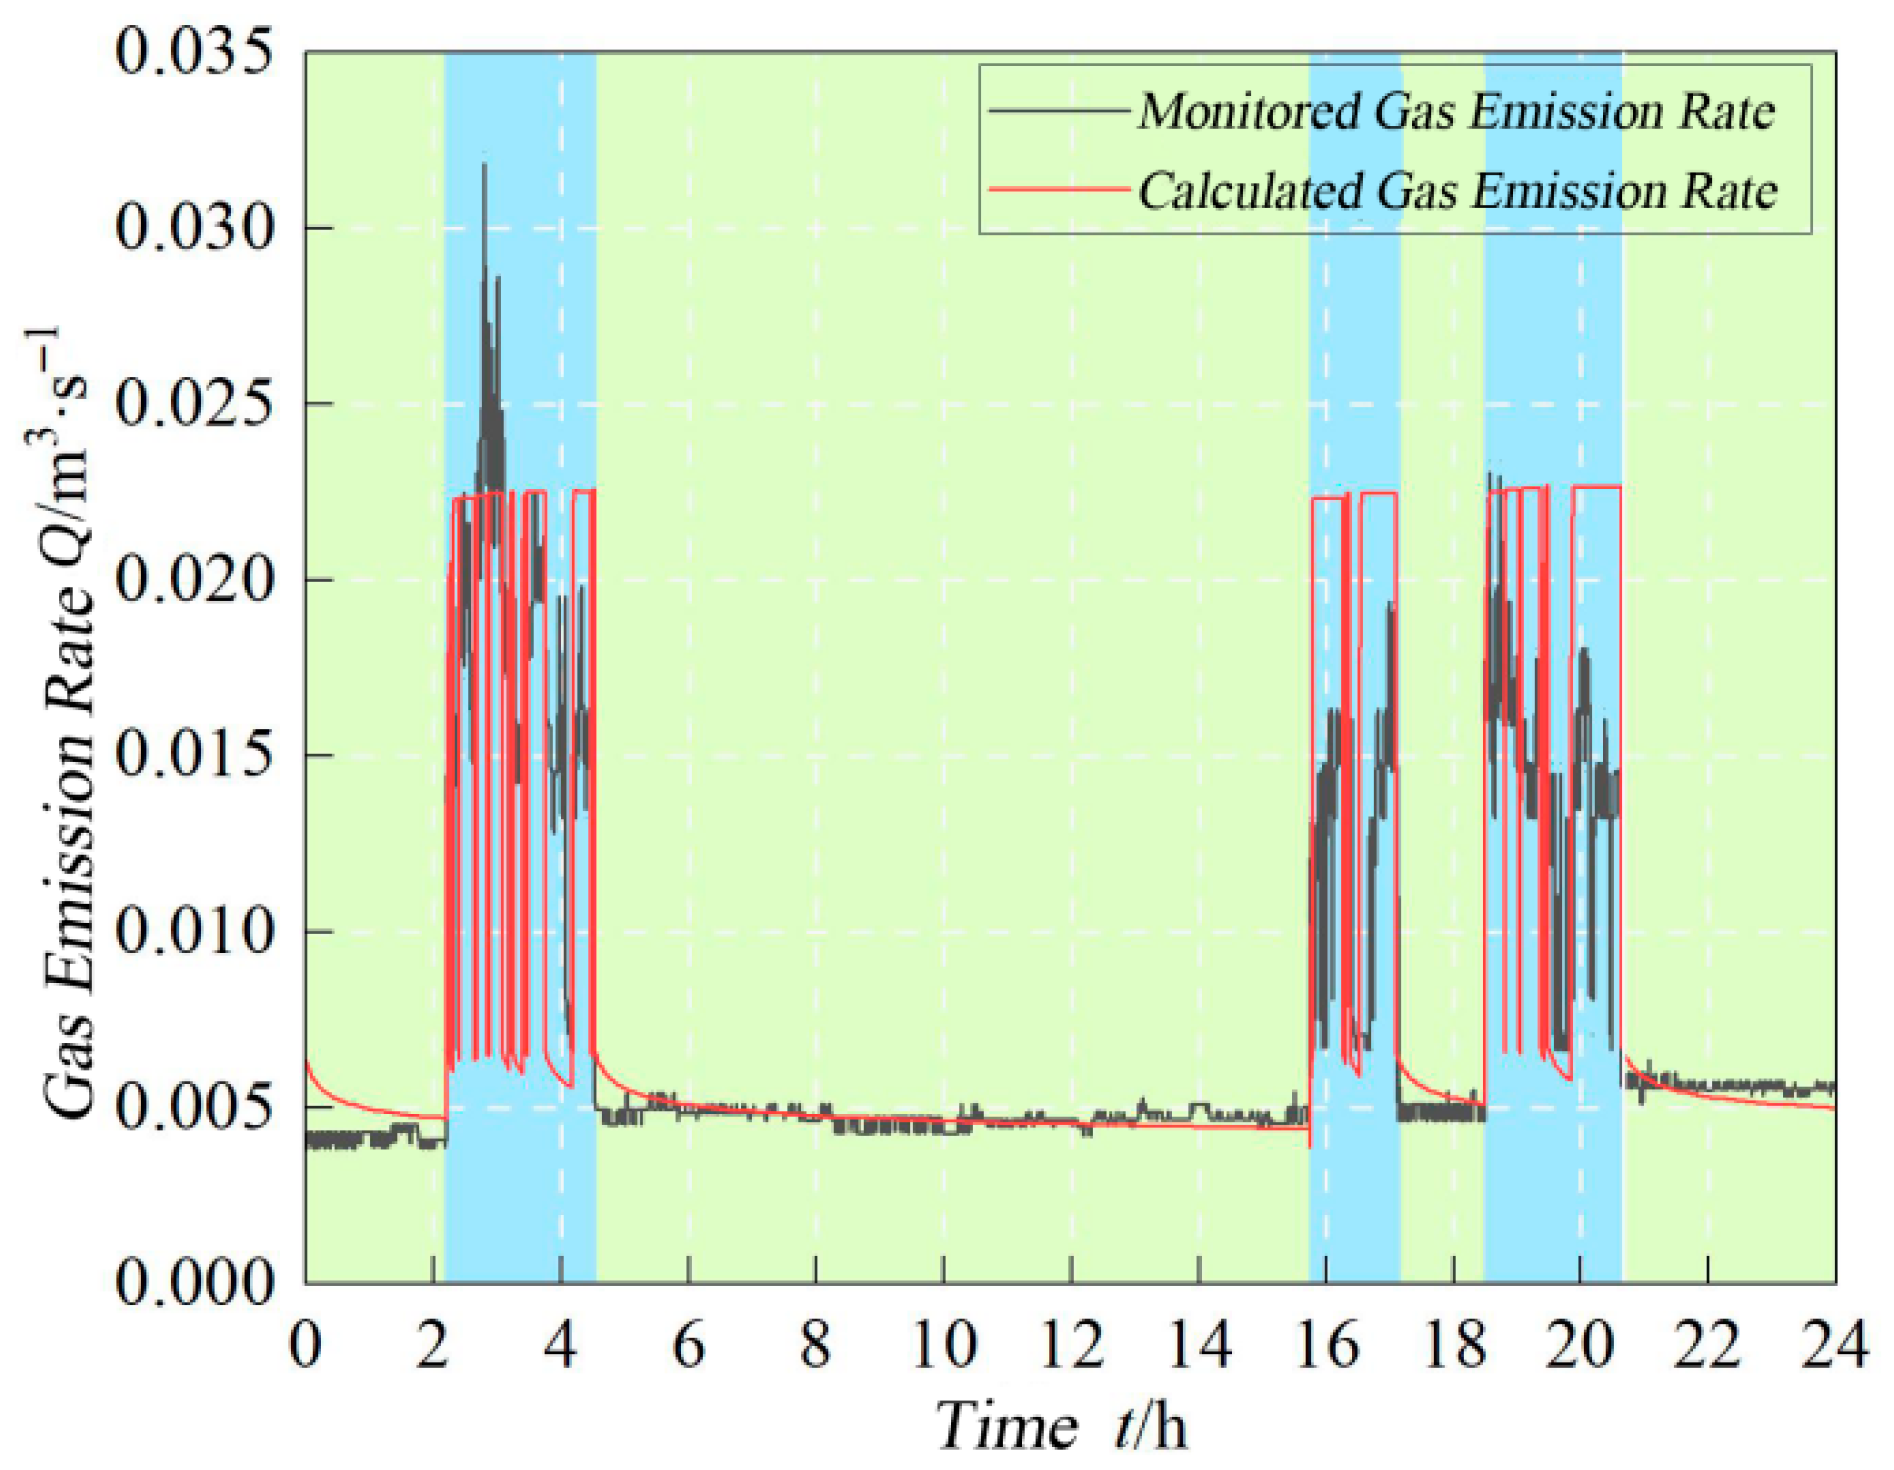
Validation Results: Calculated and monitored gas emission rates at the excavation face are compared in Figure 6.
The gas emission rate exhibits periodic fluctuations corresponding to excavation cycles. Key annotations are as follows:
-
Green zones: Roadway halting periods;
-
Blue zones: Active production periods;
-
Black curve: Field monitoring data;
-
Red curve: Model-predicted emission rate.
Figure 6 reveals that during halting periods, the following hold:
(1)
Emission rates decrease gradually yet remain relatively stable;
(2)
Model predictions align well with monitoring trends;
(3)
Field data shows greater volatility due to uneven gas release patterns and ventilation inhomogeneities.
The model successfully captures the gradual decline in gas emissions over time.
During active cutting operations (Figure 5 blue zones), the following apply:
-
Drastic emission surges occur due to massive fragmented coal generation and large-scale fresh coal wall exposure;
-
While model predictions match overall emission trends, localized deviations exist because:
(1)
The model assumes uniform advance rates, whereas actual cutting speeds vary;
(2)
Resulting fluctuations in coal fragmentation degrees;
(3)
Dynamic changes in the fresh wall exposure area.
These operational variabilities explain discrepancies between predicted (red) and monitored (black) rates, representing expected validation outcomes.

5. Conclusions

(1)
By comprehensively accounting for gas emission patterns and influencing factors at excavation faces, we developed a gas emission calculation model based on excavation procedures. This model establishes mathematical relationships for coal wall exposure times at different positions and implements distinct calculation methods for gas emission rates from both freshly exposed coal walls and newly dislodged coal.
(2)
Excavation procedures significantly alter the dynamics of roadway gas emissions. Specifically, the following conditions apply:
-
Coal fragmentation generates newly dislodged coal and fresh coal walls, representing the primary cause of emission rate surges.
-
During non-excavation periods, emission rates are governed predominantly by exposed coal seam thickness and exposed wall length.
During active excavation, emission rates correlate strongly with excavation duration and advance length, rapidly reverting to non-excavation emission levels upon cessation of operation.
(3)
Through numerical analysis of a unidirectional flow model simulating sudden coal wall exposure, we established that:
-
Gas content within coal exhibits an arctangent functional relationship with distance from the coal wall across varying exposure times.
-
A comprehensive fitted equation was derived for gas content calculation at arbitrary spatiotemporal positions (x,t).
-
The coal wall gas emission rate follows a power function decay over time.
(4)
For an actual excavation roadway in the experimental mine, we implemented the developed real-time gas emission mathematical model through Python programming, calculating theoretical emission rates. Field validation confirmed substantial agreement in trend prediction between monitoring system measurements and model-calculated emission rates. The Python-based implementation provides mines with a practical tool for dynamic outburst risk assessment during excavation cycles.

Author Contributions

P.Y.: Data curation, Writing—original draft, Writing—review and editing. X.G.: Project administration, Supervision, Validation. H.J.: Formal analysis, Writing—original draft, Writing—review and editing. X.M.: Formal analysis, Methodology, Validation. All authors have read and agreed to the published version of the manuscript.

Funding

This research was funded by the National Key Research and Development Program of China, grant number 2023YFF0615404.

Data Availability Statement

The data presented in this study are available on request from the corresponding author due to privacy and ethical restrictions.

Conflicts of Interest

Authors Peng Yang, Xuanping Gong and Xingying Ma were employed by the company China Coal Energy Research Institute Co., Ltd. Author Hongwei Jin was employed by the company Xi’an University of Science and Technology. The remaining authors declare that the research was conducted in the absence of any commercial or financial relationships that could be construed as a potential conflict of interest.

References

  1. National Coal Mine Safety Administration. Detailed Rules for the Prevention and Control of Coal and Gas Outbursts: Document No. 28 (2019) Issued by the Department of Technology and Equipment; National Coal Mine Safety Administration: Beijing, China, 2019; pp. 1–66. [Google Scholar]
  2. AQ 1018-2006; Methodology for Prediction of Gas Emission in Underground Mines. China Coal Industry Publishing House: Beijing, China, 2006.
  3. Zhou, S.; Sun, J. Theory of gas flow in coal seam and its application. J. China Coal Soc. 1965, 2, 24–37. [Google Scholar]
  4. Zhou, S. Mechanism of gas flow in coal seams. J. China Coal Soc. 1990, 15, 61–67. [Google Scholar]
  5. Liu, W.; Song, H.; Li, X. Dimensionless analysis on gas emission law around tunneling face. J. China Coal Soc. 2015, 40, 882–887. [Google Scholar]
  6. Wang, D.; Wei, J.; Fu, Q.; Liu, Y.; Xia, Y. Coalbed gas seepage law and permeability calculation method based on Klinkenberg effect. J. China Coal Soc. 2015, 22, 1973–1978. [Google Scholar]
  7. Zhang, L.; Guo, Y.; Wu, S.; Zhang, H.; Lin, J. Numerical value analysis of coal bed methane influentequation. Coal Sci. Technol. 2001, 29, 40–42. [Google Scholar]
  8. Li, D.; Hu, C.; Xiong, Z. Gas flowing model of mining face and solve it using COMSOL. J. China Coal Soc. 2012, 37, 967–971. [Google Scholar]
  9. Sun, P. Study of flow in gas flow fields of coal seams. J. China Coal Soc. 1987, 12, 74–82. [Google Scholar]
  10. Qin, Y.; Liu, J.; Gao, Y.; Duan, W. Error analysis of borehole gas flow model and its application. J. Min. Saf. Eng. 2021, 38, 1259–1268. [Google Scholar]
  11. Liu, Y. Numerical calculation and field application of gas emission from coal wall in dynamic mining face. Coal Sci. Technol. 2021, 49, 195–204. [Google Scholar]
  12. Wei, X. Equation of gas flow in seams with boreholes and its application. J. China Coal Soc. 1988, 13, 85–96. [Google Scholar]
  13. Wei, C.; Li, C.; Ye, Q.; Li, Z.; Hao, M.; Wei, S. Modeling of gas emission in coal mine excavation workface: A new insight into the prediction model. Environ. Sci. Pollut. Res. 2023, 30, 100137–100148. [Google Scholar] [CrossRef]
  14. Wei, C.; Hao, M.; Qiao, Z.; Guo, J. Model development and analysis of dynamic gas emission from tunneling face zone. Energy Sources Part A Recover. Util. Environ. Eff. 2022, 44, 10378–10394. [Google Scholar] [CrossRef]
  15. Hou, Y.; Cui, J.; Liu, R. Study on the Long-Distance Gas Pre-Drainage Technology in the Heading Face by Directional Long Borehole. Energies 2022, 15, 6304. [Google Scholar] [CrossRef]
  16. Qiu, L.; Peng, Y.; Song, D. Risk Prediction of Coal and Gas Outburst Based on Abnormal Gas Concentration in Blasting Driving Face. Geofluids 2022, 2022, 3917846. [Google Scholar] [CrossRef]
  17. Gao, L.; Kang, X.; Tang, M.; Hu, J. Study on Prediction of Outburst Risk of Excavation Face by Initial Gas Emission. Geofluids 2022, 2022, 4866805. [Google Scholar] [CrossRef]
  18. Zhang, H.; Cheng, Y.; Deng, C.; Shu, L.; Pan, Z.; Yuan, L.; Wang, L.; Liu, Q. A Novel In-Seam Borehole Discontinuous Hydraulic Flushing Technology in the Driving Face of Soft Coal Seams: Enhanced Gas Extraction Mechanism and Field Application. Rock Mech. Rock Eng. 2022, 55, 885–907. [Google Scholar] [CrossRef]
  19. Zhang, G.; Wang, E.; Li, Z.; Qin, B. Risk assessment of coal and gas outburst in driving face based on finite interval cloud model. Nat. Hazards 2021, 110, 1969–1995. [Google Scholar] [CrossRef]
  20. Li, C.; Zhao, Y.; He, Y. OpenFOAM solver of the methane behaviour near the coal mine tunnelling face and its application. J. Geophys. Eng. 2021, 18, 418–427. [Google Scholar] [CrossRef]
  21. Shu, C.; Fan, J.; Wang, H.; Liu, P.; Ye, X. Temperature variations of coal in the heading face measured using a thermo-hydro-mechanical model considering desorptional heat. Appl. Therm. Eng. 2020, 181, 115969. [Google Scholar] [CrossRef]
  22. Zhang, X.; Gao, J.; Ren, J.; Wang, C. Analysis of the Characteristics and Influencing Factors of Gas Explosion in Heading Face. Shock Vib. 2020, 2020, 8871865. [Google Scholar] [CrossRef]
  23. Wang, H.; Wang, E.; Li, Z. Study on Dynamic Prediction Model of Gas Emission in Tunneling Working Face. Combust. Sci. Technol. 2020, 194, 506–522. [Google Scholar] [CrossRef]
  24. Wang, Q.; Li, C.; Zhao, Y.; Ai, D. Study of gas emission law at the heading face in a coal-mine tunnel based on the Lattice Boltzmann method. Energy Sci. Eng. 2020, 8, 1705–1715. [Google Scholar] [CrossRef]
  25. Li, X.; Chen, D.; Li, Z.; Liu, S.; Zhai, M.; Li, Y.; Gong, B.; Sun, Z.; Wang, Y.; Wang, D. Roadway portal and self-moving hydraulic support for rockburst prevention in coal mine and its application. Phys. Fluids 2024, 36, 124136. [Google Scholar] [CrossRef]
  26. Liu, S.; Li, X.; Wang, D.; Zhang, D. Investigations on the mechanism of the microstructural evolution of different coal ranks under liquid nitrogen cold soaking. Energy Sources Part A Recover. Util. Environ. Eff. 2025, 47, 2596–2612. [Google Scholar] [CrossRef]
  27. Li, X.; Chen, D.; Liu, S.; Wang, D.; Sun, H.; Yin, D.; Zhang, Y.; Gong, B. Enhanced permeability mechanism in coal seams through liquid nitrogen immersion: Multi-scale pore structure analysis. J. Cent. South Univ. 2025, 32, 2732–2749. [Google Scholar] [CrossRef]
  28. Liu, S.; Sun, H.; Zhang, D.; Yang, K.; Li, X.; Wang, D.; Li, Y. Experimental study of effect of liquid nitrogen cold soaking on coal pore structure and fractal characteristics. Energy 2023, 275, 127470. [Google Scholar] [CrossRef]
  29. Li, H.; Li, X.; Fu, J.; Zhu, N.; Chen, D.; Wang, Y.; Ding, S. Experimental study on compressive behavior and failure characteristics of imitation steel fiber concrete under uniaxial load imitation steel ffber concrete under uniaxial load. Constr. Build. Mater. 2023, 399, 132599. [Google Scholar] [CrossRef]
  30. Petrosyan, A.E. Coal Mine Methane Emission; China Coal Industry Publishing House: Beijing, China, 1983. [Google Scholar]
  31. Barrer, R.M. Diffusion in and Through Solids; Cambridge University Press: Oxford, UK, 1951. [Google Scholar]
  32. Booth, P.; Brown, H.; Nemcik, J.; Ting, R. Spatial context in the calculation of gas emissions for underground coal mines. Int. J. Min. Sci. Technol. 2017, 27, 787–794. [Google Scholar] [CrossRef]
  33. Korpela, T.; Kumpulainen, P.; Majanne, Y.; Häyrinen, A. Model based NOx emission monitoring in natural gas fired hot water boilers. IFAC-PapersOnLine 2015, 48, 385–390. [Google Scholar] [CrossRef]
  34. Gao, J.; Hou, S. Dynamic distribution of gas pressure and emission around a diving roadway. J. China Coal Soc. 2007, 32, 1127–1131. [Google Scholar]
  35. Shu, L.; Ma, Y.; Liu, Z.; Li, H. Study and application of a continuous inversion model of coal seam gas pressure in front area of heading face. Int. J. Coal Sci. Technol. 2023, 10, 80. [Google Scholar] [CrossRef]
  36. Chen, L.; Liu, Q. A Gas Pressure Prediction Model of the Excavation Face Based on Gas Emission. Int. J. Environ. Res. Public Health 2022, 19, 4891. [Google Scholar] [CrossRef] [PubMed]
  37. Shi, Y. Application of Directional Long Borehole Technology in Working Face of Thick Coal Seam Along Top Driving. IOP Conf. Ser. Earth Environ. Sci. 2020, 474, 042035. [Google Scholar] [CrossRef]
  38. Yan, Z.; Qin, Z.; Fan, J.; Huang, Y.; Wang, Y.; Zhang, J.; Zhang, L.; Cao, Y. Gas Outburst Warning Method in Driving Faces: Enhanced Methodology through Optuna Optimization, Adaptive Normalization, and Transformer Framework. Sensors 2024, 24, 3150. [Google Scholar] [CrossRef] [PubMed]
  39. Zhang, F.; Han, Y. Research on the law of gas diffusion from drill cuttings. J. China Coal Soc. 2013, 38, 1589–1596. [Google Scholar]
  40. Qin, Y.; An, F.; Su, W.; Jia, H.; Chen, X. Direct determination of the diffusion coefficient variation of coal based on Fick’s law and model establishment. Coal Sci. Technol. 2023, 51, 140–149. [Google Scholar]
  41. Yang, P.; Gong, X.; Wu, G. Solving of coal seam gas seepage based on Crank-Nicolson difference method. Min. Saf. Environ. Prot. 2024, 51, 28–35. [Google Scholar]
Figure 1. Gas Emission Calculation Model for Excavation Face.
Energies 18 04592 g001
Figure 2. Flowchart of Finite Difference Method Solution [41].
Energies 18 04592 g002
Figure 3. Variation diagram of gas emission rate [41].
Energies 18 04592 g003
Figure 4. Variation diagram of gas content ahead of excavation face [41].
Energies 18 04592 g004
Figure 5. Real-Time Gas Emission Modeling Software for Coal Roadway Driving Faces.
Energies 18 04592 g005
Figure 6. Numerical Solution Results of Gas Emission.
Energies 18 04592 g006
Disclaimer/Publisher’s Note: The statements, opinions and data contained in all publications are solely those of the individual author(s) and contributor(s) and not of MDPI and/or the editor(s). MDPI and/or the editor(s) disclaim responsibility for any injury to people or property resulting from any ideas, methods, instructions or products referred to in the content.