Abstract
Cross-Flow Turbines (CFTs) are widely recognized for their adaptability and cost-effectiveness in micro-hydropower (MHP) systems. However, their hydraulic efficiency remains highly sensitive to geometric configurations, particularly the Blade Entry Angle (BEA) and Water Admission Angle (WAA). This study presents a high-fidelity computational fluid dynamics (CFDs) investigation of CFT performance across a wide range of BEA (5–40°) and WAA (45–105°) combinations at runner speeds from 150 to 1200 rpm, under constant head and flow conditions. The simulations were performed using a steady-state Reynolds-Averaged Navier–Stokes (RANS) model coupled with the volume of fluid (VOF) method and the SST k–ω turbulence closure. Benchmarking against the widely used industrial standard configuration (BEA = 30°, WAA = 90°), which achieved 79.1% efficiency at 900 rpm, this study identifies an optimized setup at BEA = 15° and WAA = 60° delivering a peak efficiency of 84.91% and shaft power output of 225.5 W—representing an efficiency gain of approximately 5.8%. The standard configuration was found to suffer from flow misalignment, jet dispersion, and increased internal energy loss, particularly at off-design speeds. In contrast, optimized geometries ensured stable pressure gradients, coherent jet–blade interaction, and enhanced momentum transfer. The results provide a validated performance map and establish a robust design reference for enhancing CFT efficiency and reliability in decentralized renewable energy systems.
1. Introduction
Hydropower remains one of the most mature and reliable renewable energy technologies, supplying over 16% of the global electricity and more than 60% of the renewable generation capacity [1,2]. Its low greenhouse gas emissions, high conversion efficiency, and predictable output make it essential for decarbonization strategies. Within this sector, micro-hydropower systems provide an effective solution for rural and off-grid electrification due to their scalability, low environmental footprint, and potential for localized manufacturing [3]. Among the micro-hydropower turbines, the Cross-Flow Turbine (CFT)—also known as the Michell–Banki turbine, offers a combination of simplicity, robustness, and tolerance to flow variation [4]. Its two-stage energy extraction process allows the water jet to pass through the runner twice, enabling effective conversion with a relatively simple construction. While CFTs generally achieve hydraulic efficiencies of 70–85% lower than Francis, Pelton, or Kaplan turbines, they maintain stable performance under partial loads and operate over a wide range of heads and flow rates [5,6,7] (see Figure 1).
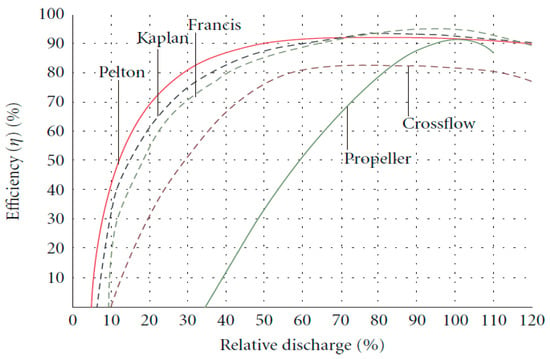
Figure 1.
Comparative performance characteristics of hydraulic turbines.
These features make them attractive for high-head micro-hydropower applications (H > 50 m), where compact design and reduced civil works are advantageous (see Figure 2c). In high-head conditions, the performance is highly sensitive to the Blade Entry Angle (BEA), the angle between the incoming jet and the blade leading edge, and the Water Admission Angle (WAA), the circumferential arc of the jet admission (Figure 2).
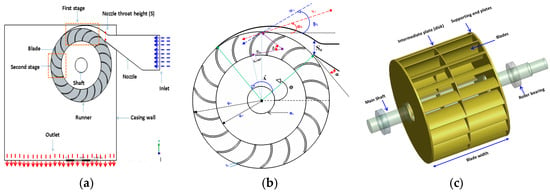
Figure 2.
Description of the CFT: (a) CFT components, (b) geometrical parameters, and (c) modular CFT configuration.
BEA affects the incidence, vortex formation, and separation, while WAA governs the load distribution and hydraulic losses. Poor selection of either parameter can cause non-uniform velocity profiles, turbulence, and shock losses. For high-head sites, where the inlet jet velocities are higher, the BEA–WAA combination becomes critical for maximizing the momentum transfer and minimizing the losses in both stages.
Experimental studies have largely focused on “standard” configurations (BEA ≈ 30°, WAA ≈ 90°), with efficiencies ranging from 50% to 91% (Table 1). Totally and Aziz [8] achieved 91% with standard geometry, whereas Nuet [9] reported only 57% under similar conditions. The results vary due to the manufacturing tolerances, inlet conditions, and test methods. The effects of WAA have been confirmed: Olgun [10] found 72% efficiency at WAA = 36°, whereas Kaniecki and Steller [11] reported 78% efficiency at WAA = 105°. However, few studies have explored low BEA values (<25°), despite their potential in high-head applications. Experimental methods capture real-world effects—turbulence, cavitation, and mechanical losses—but are resource-intensive and limited in parameter coverage.

Table 1.
Previous experimental Studies on BEA and WAA.
Numerical simulations using computational fluid dynamics (CFDs) have expanded the exploration range, predicting efficiencies from 52% to 97.8% (Table 2). Optimal configurations are often reported for BEA between 20 and 35° and WAA between 70 and 120°. For example, Ranjan [25] predicted 97.8% efficiency at BEA = 15° and WAA = 65°, indicating the potential of non-standard angles, although such predictions require experimental verification. CFD enables internal flow visualization and systematic parameter sweeps, but results depend heavily on mesh resolution, turbulence modeling, and boundary conditions. Overestimation can occur when mechanical and volumetric losses are ignored. Advanced approaches, such as CFD–FSI (fluid–solid interaction) coupling, can capture blade deformation and dynamic effects but remain underused for BEA–WAA optimization.

Table 2.
Previous numerical studies on BEA and WAA.
Based on both numerical and experimental reviews, several persistent research gaps become evident when examining the influence of the BEA and WAA on the CFT performance. Prior studies have seldom explored low BEA values below 25° in conjunction with variable WAA across a broad range of runner speeds, leaving a significant portion of the design space unexplored. Moreover, the literature reveals inconsistent and, at times, contradictory findings for similar operating conditions, particularly when comparing experimental measurements with numerical simulations, which complicates the establishment of universally valid performance trends. In addition, there remains a notable absence of detailed investigations into how the combined BEA–WAA configuration governs internal flow structures such as vortex formation, flow separation, and secondary currents, especially under high-head, off-design conditions where such effects are often magnified. This synthesis of the existing work underscores the necessity for a more systematic, high-fidelity study to reconcile these discrepancies and fill the observed gaps.
This study aims to bridge the identified research gaps by conducting a systematic CFD analysis on the combined effects of the BEA and WAA on the performance of high-head CFTs. The investigation considers BEA values ranging from 5° to 40° in 5° increments and WAA values from 45° to 100° in 15° increments. Numerical simulations were carried out in ANSYS CFX® 23.1 employing the SST k–ω turbulence model under constant operating conditions of a 50 m head, a discharge of 0.3 m3/s, and runner speeds varying from 150 to 1200 rpm in 150 rpm increments. The findings are expected to yield practical design recommendations for optimizing micro-hydropower systems in mountainous regions with abundant high-head water resources.
2. Flow Characteristics and Mathematical Model
The operation of the CFT begins at the nozzle inlet, where pressurized water is accelerated into a high-velocity jet. This jet is directed tangentially onto the runner, spanning a circumferential segment defined by the WAA (). Upon impact at the BEA (), the jet transfers momentum to the blades, producing torque during the first stage of energy extraction. The partially spent flow then traverses the interior of the runner, engaging the opposite blade row in a secondary stage before exiting to the tailrace. The WAA () (in degrees) is given as follows:
where the jet is arc length along the runner circumference and is the runner radius
The BEA () is inherently linked to the interaction between the incoming jet velocity and blade motion. Geometrically, it can be expressed as follows:
where is the blade leading-edge inclination and is the absolute flow angle at the inlet. More rigorously, from the inlet velocity triangle (Figure 3), as follows:
where is the absolute jet velocity, is the blade tangential velocity, and is the angle between the absolute velocity vector and the tangential direction. For optimal operation, the BEA is related to the jet angle of attack by the empirical relationship.
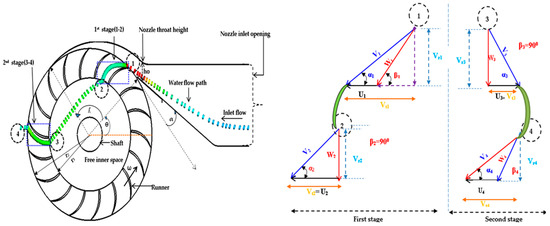
Figure 3.
Velocity triangles at the Blade Inlet of the CFT.
This ensures the incoming flow aligns favorably with the blade surface, minimizing incidence losses. The fundamental energy transfer mechanism follows the Euler Turbo-machinery Equation, which relates the change in angular momentum of the fluid to the mechanical power output as follows:
where is the fluid density, is the discharge, is the blade tangential velocity, and is the change in the tangential velocity component of the water between the inlet and outlet. Velocity triangles (Figure 3) illustrate the absolute velocity , blade velocity , and relative velocity vectors, along with flow angles and , providing a quantitative framework for predicting torque and power output under varying BEA and WAA configurations.
The hydraulic efficiency of the turbine is defined as follows:
where the torque on the runner is the shaft and is the angular velocity. The torque is obtained by integrating the pressure and shear stresses over the blade surface as follows:
The net head is computed from the difference in total pressures at the turbine inlet and outlet as follows:
The available hydraulic power is as follows:
Variations in and directly influence the velocity components at the runner interface, thereby affecting the hydraulic efficiency and overall turbine performance. By coupling velocity triangle analysis with the Euler equation, performance trends can be predicted for different blade–jet configurations, enabling optimized design for high-head CFT applications.
3. Methodology
3.1. Turbine Geometry and Parametric Configuration
A CFT model was developed based on a prototype installed at the Amentila MHP site near Mekelle, Ethiopia. The turbine operates under a net head of 53 m and a design flow rate of 0.3 m3/s. The parametric study focused on two geometric variables: BEA and WAA. BEA was varied from 5° to 40° in 5° increments, and WAA was varied from 45° to 105° in 15° increments. To assess the sensitivity of the performance to the operating conditions, the runner speeds were varied between 150 and 1200 rpm in 150 rpm intervals. Table 3 summarizes the baseline geometrical and operating parameters used in the simulation setup.

Table 3.
Baseline turbine design and operating parameters.
3.2. Governing Equation and Numerical Modeling
The numerical simulations were performed using ANSYS-CFX® 2023, solving the unsteady, incompressible Reynolds-Averaged Navier–Stokes (RANS) equations within a rotating frame of reference to accurately capture the transient and rotational characteristics of the CFT. The multiphase behavior of the air–water interface was resolved using the volume of fluid (VOF) method, which tracks the volume fraction of each phase within computational cells and is well-suited for simulating free surface flows and phase interaction within hydraulic machinery. To model turbulence, the shear stress transport (SST) k–ω model was adopted due to its robustness in capturing flow separation, adverse pressure gradients, and near-wall phenomena. This hybrid model blends the advantages of the k–ε and k–ω models, thereby offering improved accuracy for the highly curved and complex internal flows present in CFTs. The governing equations used in the simulation are as follows:
- ☞
- Continuity (conservation of mass):
- ☞
- Momentum equation (rotating Frame):
- ☞
- Turbulence Model Equations (SST model)
- Turbulent kinetic energy (k):
- Specific dissipation rate ():
The VOF model simultaneously solved a scalar transport equation for the water volume fraction in each cell to capture the multiphase interaction.
- ☞
- The volume fraction equation (VOF transport):
3.3. Computational Domain and Mesh Generation
To accurately capture the internal flow behavior and performance characteristics of the CFT, a detailed computational domain was developed, including the nozzle, casing, and rotating runner parts (see Figure 4). The geometry was constructed on the basis of precise turbine configurations derived from parametric design parameters, ensuring fidelity to practical CFT designs. Meshing was performed using unstructured tetrahedral elements, with 25 prism layers applied near all solid boundaries to adequately resolve the near-wall flow regions. This mesh refinement was designed to maintain a dimensionless wall distance +y+ below 1. The choice of y+ < 1 is essential in this study to accurately resolve the viscous sub-layer within the boundary layer, which plays a critical role in predicting the wall shear stresses and flow separation phenomena. Although the volume of fluid (VOF) method primarily tracks the interface between immiscible fluids, such as water and air, the near-wall flow dynamics significantly influence the velocity and pressure fields around the runner blades. Maintaining y+ < 1 ensures that the turbulence model (SST k−ω) accurately captures the near-wall turbulence behavior without relying on wall functions, which is crucial for simulations involving complex flow separation and recirculation zones typical in CFT. Therefore, enforcing y+ < 1 not only improves the fidelity of turbulence modeling but also enhances the accuracy of the VOF multiphase flow solution near solid boundaries, leading to reliable predictions of turbine hydraulic performance and internal flow characteristics.
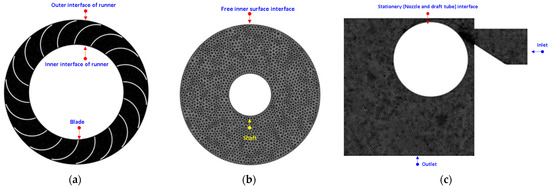
Figure 4.
Discretization of the computational domain: (a) runner, (b) free inner surface, and (c) casing and nozzle.
3.4. Mesh Independence Study
To ensure numerical reliability and minimize discretization-induced errors, the mesh independence study was conducted in two distinct stages. In the first stage, the computational domain was meshed with progressively refined unstructured grids, starting from a relatively coarse element size of 10 mm and reducing incrementally to 1 mm. Torque was selected as the primary performance indicator, and its variation was monitored to evaluate the convergence behavior. As the mesh was refined, the torque values progressively approached a steady state, indicating that further mesh refinement beyond the 1 mm element size produced negligible changes in the output (see Figure 5). This preliminary stage helped identify the element size range suitable for a more formal grid convergence analysis.
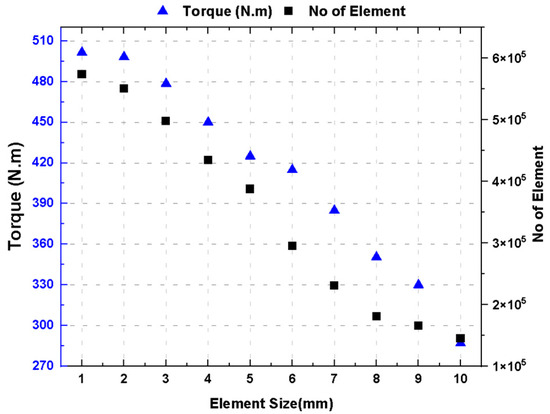
Figure 5.
Mesh independent study.
In the second stage, rigorous uncertainty (error) quantification was conducted using the Grid Convergence Index (GCI) method. Three systematically refined meshes were selected from the first stage: a coarse mesh (1 mm), a medium mesh (0.75 mm), and a fine mesh (0.50 mm). The refinement ratios between successive meshes were calculated as follows:
where , , and are the characteristic grid spacings of the fine, medium, and coarse meshes, respectively. The torque result across each grid level (coarse, medium, and fine) is detailed in Table 4.

Table 4.
Torque results across the grid levels.
The observed order of convergence () was determined using the Richardson extrapolation as follows:
The extrapolated (theoretical) torque was computed as follows:
Numerical uncertainty was further quantified using the Grid Convergence Index (GCI) method, with a safety factor :
The relative errors between successive mesh levels were calculated as follows:
The results (Table 5) indicate very low relative errors (, ) and GCI values well below 2% (, ), with an observed order of accuracy . These findings confirm the strong mesh convergence and low discretization uncertainty, ensuring reliable numerical predictions.

Table 5.
Grid convergence and numerical uncertainty metrics.
Consequently, the 1.00 mm mesh was adopted for all subsequent simulations. This resolution provides an optimal balance between computational efficiency and accuracy while adequately capturing critical flow phenomena, including separation, reattachment, and wake development within the turbine domain.
3.5. Boundary Conditions
The boundary conditions at the inlet, outlet, wall, and interface of the turbine were applied, as detailed in Table 6. This study used a standard homogeneous free-surface model for the two phases (air and water) over the entire turbine domain. This model assumes shared velocity, pressure, and turbulence fields for both air and water. This study established two interdependent interfaces between the rotating and stationary domains. The first interface between the nozzle, outer runner surface, and casing used a “fluid–fluid” type interface. The second interface, between the inner runner surface and the runner, also used a “fluid–fluid” type interface.

Table 6.
Boundary condition.
4. Results and Discussion
4.1. Internal Flow Dynamics and Pressure Characteristics
The internal flow dynamics from the nozzle entrance to the tailrace were analyzed to investigate the velocity and pressure profiles at different locations within the turbine. At the nozzle entrance, water enters at approximately 6 m/s, and as it passes through the nozzle, the flow accelerates to 33 m/s, accompanied by a significant pressure drop from 518 kPa to near atmospheric conditions. This behavior confirms the impulse turbine characteristics of the system, as shown in Figure 6.
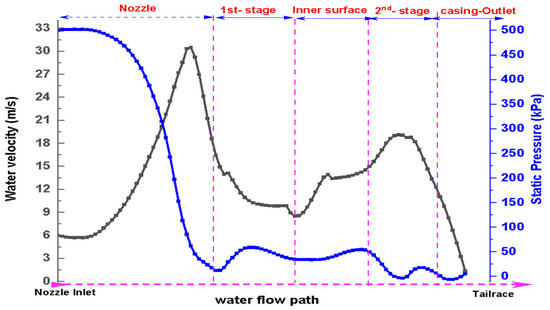
Figure 6.
Velocity and pressure distribution profile at different locations.
Within the runner, the water velocity decreased from 18 m/s to 8.5 m/s after passing through the first-stage blades, with a partial recovery in the static pressure to 20 kPa (see Figure 7a). Low-pressure regions developed near the blade suction surfaces, and the volume fraction analysis indicated that the air-free jet integrity was maintained before impacting the blades (see Figure 7b,c). The flow then accelerates to 15 m/s as it enters the second stage, driven by the pressure gradients and angular momentum conservation, with water exiting the turbine at velocities below 2 m/s, signaling effective energy transfer and minimal residual head.

Figure 7.
Internal flow profile: (a) water velocity, (b) static pressure, and (c) water fraction.
Figure 8a–d present the water velocity, pressure, and volume of the fluid distribution profile along the inner and outer periphery of the runner. The flow decelerates to approximately 9 m/s in the first stage, before re-accelerating to 15 m/s in the second stage. Upon exiting into the draft tube and subsequently to the tail race, the velocity drops below 2 m/s, confirming efficient energy extraction.
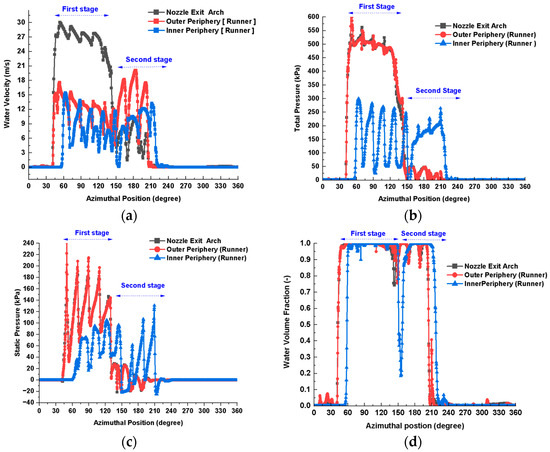
Figure 8.
Water velocity distribution profiles at the outer and inner periphery. (a) Water velocity [m/s], (b) total pressure [kPa], (c) static pressure [kPa], and (d) water volume fraction [-].
4.2. Effect of BEA on Flow Characteristics
The BEA exerts a decisive influence on the interaction between the water jet and the runner blades of the CFTs, particularly along the outer periphery where the primary energy conversion occurs. To investigate this interaction, a series of high-fidelity numerical simulations was conducted for BEA values ranging from 5° to 20° across runner speeds varying from 150 to 1200 rpm in 150 rpm increments. Representative flow field results corresponding to the optimal runner speed of 750 rpm, specifically water velocity, total pressure, static pressure, and water volume fraction distributions, are illustrated in Figure 9, while comprehensive performance data across all runner speeds are provided in Appendix A. At lower BEA values (e.g., 5°), the water jet enters nearly tangentially to the blade surface, thereby maximizing the circumferential velocity component and promoting effective momentum exchange, particularly at lower runner speeds (150–450 rpm). Under these conditions, the velocity contours exhibit well-defined tangential flow structures, while the pressure fields across the blade surfaces remain smoothly distributed, signifying stable jet impingement and relatively uniform torque generation. However, at higher rotational speeds (>600 rpm), the tangential alignment becomes suboptimal, leading to jet misalignment, partial flow detachment, and localized pressure irregularities near the blade tips.
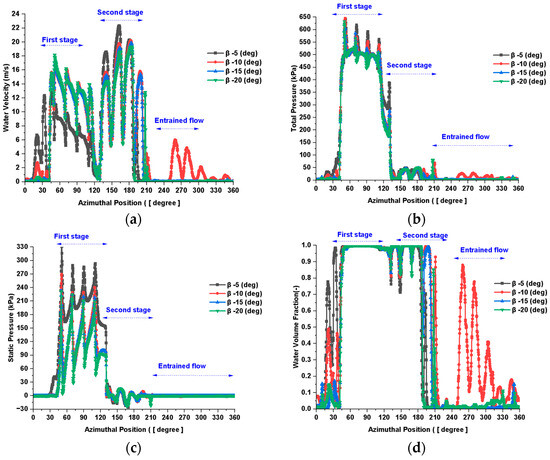
Figure 9.
Effect of Blade Entry Angle (BEA) on the flow field distribution at 750 rpm: (a) water velocity [m/s], (b) total pressure [kPa], (c) static pressure [kPa], and (d) water volume fraction [-].
With a moderate increase in BEA to 10–15°, the jet alignment relative to the blade curvature improved substantially, enhancing the incidence angle and promoting a more streamlined flow through the blade channels. This alignment is particularly favorable in the medium to high runner speed range (600–900 rpm), where the velocity profiles become more coherent and the pressure gradients across the blades are well-distributed, indicating improved hydraulic performance. Moreover, the water volume fraction maintained consistently high values with minimal spatial variation, reducing the risk of vapor formation and associated structural degradation. At a higher BEA of 20°, the inflow assumes a more radial trajectory, diminishing the tangential momentum transfer and weakening the fluid–blade interaction at lower runner speeds. This configuration tends to induce flow separation and non-uniformity in the pressure field. However, at elevated runner speeds (>1000 rpm), centrifugal forces assist in reorienting the jet along the blade passage, partially mitigating the flow separation. Despite this stabilization, the total and static pressure fields become increasingly concentrated near the blade leading edges, which may impose localized mechanical loads and intensify erosion or fatigue over extended operation.
4.3. Effect of WAA on Flow Characteristics
The WAA defines the angular extent over which the water jet impinges upon the runner blades in CFTs, thereby directly influencing the blade engagement duration, momentum transfer efficiency, and overall flow field uniformity. To investigate its effect, detailed numerical simulations were conducted for WAAs ranging from 45° to 105° across runner speeds from 450 to 1200 rpm in 150 rpm increments. Representative distributions of the water velocity and total pressure at the optimal operating speed of 750 rpm are presented in Figure 10, while the comprehensive performance trends across all speeds are detailed in Figure A1, Figure A2, Figure A3 and Figure A4.
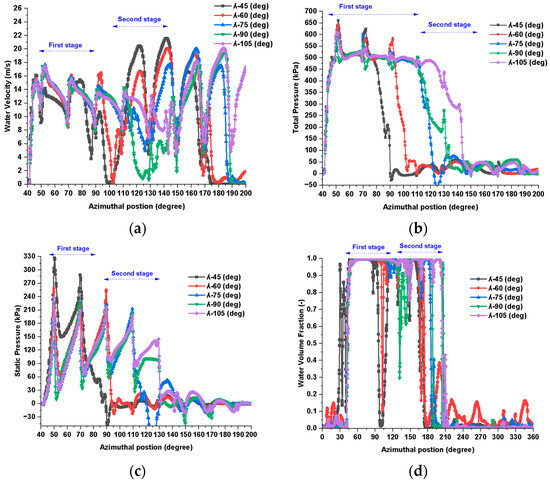
Figure 10.
Effect of the WAA on flow distribution at 750 rpm: (a) water velocity [m/s], (b) total pressure [kPa], (c) static pressure [kPa], and (d) water volume fraction [-].
At lower WAAs (e.g., 45°), the jet is confined to a narrow angular sector, limiting its interaction with the blade cascade and substantially reducing the effective residence time for energy extraction. This constraint becomes more pronounced at lower runner speeds (450–600 rpm), where the relative jet velocity is insufficient to ensure full blade coverage. Consequently, the velocity and pressure contours exhibit pronounced asymmetry, sharp gradients, and fragmented structures, all of which contribute to the elevated hydraulic losses and diminished power output. As the WAA increases to 60°, the jet expands to engage a broader segment of the runner, leading to more sustained and uniform blade interaction.
At intermediate runner speeds (750–900 rpm), this configuration results in well-structured tangential velocity profiles, with peak velocities in the range of 18–20 m/s, indicating efficient momentum coupling. Concurrently, the total pressure distribution becomes more centralized and stable across the blade passages, reflecting enhanced energy transfer and minimal flow detachment. Among the simulated configurations, WAA = 60° consistently exhibited the most favorable combination of flow coherence, pressure smoothness, and mechanical interaction. Further increases in the WAA to approximately 75° begin to introduce minor perturbations at the leading edge of the jet, particularly noticeable at runner speeds ≥ 1050 rpm. These perturbations are attributed to the onset of secondary flow structures and a slight misalignment between the jet and blade curvature, which locally disrupts the tangential velocity field and induces small-scale recirculation zones near the blade tips. At WAAs between 90° and 105°, the inflow becomes overly dispersed and misaligned with the blade orientation. This leads to degraded jet penetration, a decline in the peripheral velocity (falling below 13 m/s at 1200 rpm), and broader, less energetic velocity distributions. The pressure field in these scenarios is characterized by increasing non-uniformity and spatial distortion, which undermine the flow stability and increase the internal energy dissipation.
4.4. Effect of the BEA on Hydraulic Performance
The BEA fundamentally governs the interaction between the incoming water jet and the runner blades of the CFTs, particularly along the outer periphery, where the initial stage of energy extraction occurs. Its influence extends to the flow alignment, pressure distribution, jet incidence quality, and overall hydraulic efficiency. This section examines the effect of the BEA across a range of runner speeds (150–1200 rpm) and BEAs (5–40°), emphasizing the velocity fields, pressure behavior, hydraulic efficiency, shaft power, and pressure drop trends.
The influence of BEA on the hydraulic efficiency exhibits a distinct non-linear dependence on the runner speed. As shown in Figure 11, lower BEAs (e.g., 5°) perform well at low to medium speeds due to effective tangential flow capture, but efficiency deteriorates sharply at higher speeds due to misalignment and early jet separation. Mid-range BEAs (10–20°) facilitate optimal jet-to-blade incidence, enabling attached flow and reduced recirculation. BEA = 15° achieved the highest efficiency of 85.75% at 750 rpm and maintained stable performance across the 750–900 rpm range. BEA = 20° followed closely with an efficiency of 83.79%, confirming the advantage of moderate BEAs for sustained energy transfer.
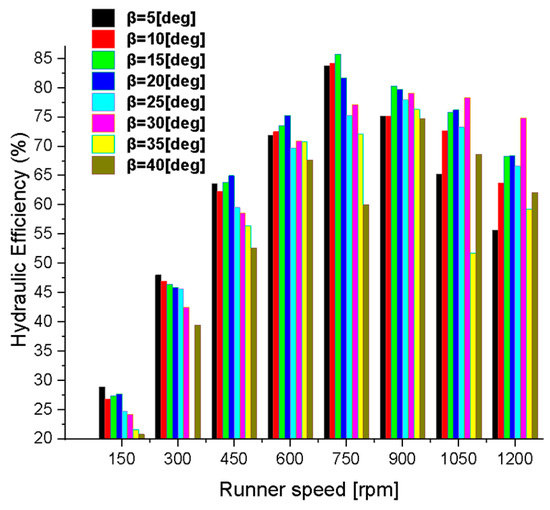
Figure 11.
Effect of BEA and runner speed on the hydraulic performance.
Conversely, BEAs ≥ 25° led to progressively radial flow paths, increased jet dispersion, and weaker blade loading. At BEA = 40°, the efficiency dropped to 62.11% at 1200 rpm due to pronounced flow separation and high internal energy loss. Additionally, across all BEAs, runner speeds below 300 rpm yielded underperformance due to limited momentum transfer and excessive shaft impingement.
4.4.1. Flow Dynamics and Internal Hydraulic Behavior
Numerical simulations conducted for various BEAs reveal that the flow structure and jet behavior within the runner are highly sensitive to the BEA–speed interaction. At lower BEAs (e.g., 5°), the jet enters nearly tangentially to the blade surface, maximizing the circumferential velocity component and ensuring smooth flow attachment at lower runner speeds (150–450 rpm). These configurations produce well-aligned velocity fields and moderate pressure gradients across the blade surfaces, promoting stable torque generation. However, at higher speeds (≥600 rpm), the tangential jet alignment becomes suboptimal, resulting in partial jet detachment, non-uniform blade loading, and localized pressure distortions (see Figure 12).


Figure 12.
Effect of runner speed on the water velocity profile.
With a moderate BEA of 10–15°, the incidence angle between the jet and blade curvature improved, yielding more coherent velocity distributions and smoother pressure profiles across a broad speed range (600–900 rpm). These conditions enhance the momentum exchange and minimize the turbulence-induced losses. The water volume fraction also remains stable and well-distributed, indicative of efficient flow use and reduced cavitation risk. In contrast, higher BEAs (≥30°) introduce a more radial inflow component, reducing the tangential momentum transfer and degrading the jet–blade interaction. At elevated speeds (≥900 rpm), although centrifugal forces partially reorient the jet path, the resulting pressure fields become increasingly asymmetric, with concentration near the blade leading edges, raising the potential for flow separation, surface erosion, and long-term mechanical fatigue.
4.4.2. Shaft Power Development
The shaft power trends mirrored the hydraulic efficiency behavior, reinforcing the critical role of the optimal BEA in maximizing the torque output. As presented in Figure 13, the highest shaft power (216.7 W) was recorded at BEA = 15° and 900 rpm, followed by 215.2 W at BEA = 20° and 750 rpm. These configurations provided superior momentum coupling and sustained blade loading. Although higher BEAs (30–40°) demonstrated minor improvements in flow uniformity at elevated speeds, their shaft power output either stagnated or declined due to deteriorated jet orientation and increased turbulence. Thus, for micro-hydropower systems requiring reliable power generation under variable flow and load conditions, BEAs between 10° and 20° are recommended for their consistent energy conversion performance and operational robustness.
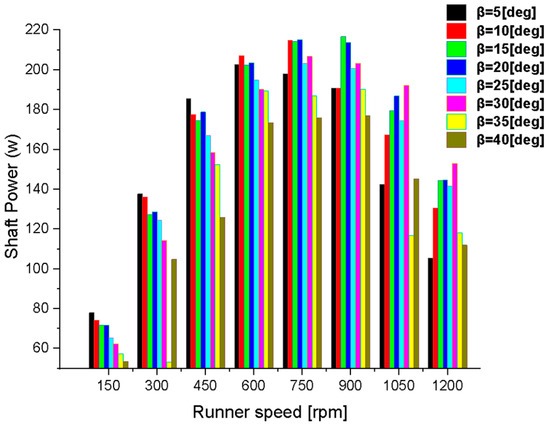
Figure 13.
Effect of runner speed and BEA variation on the shaft power.
4.4.3. Pressure Distribution and Pressure Drop Analysis
The exit pressure and total pressure drop (ΔP) are crucial indicators of flow use and internal energy extraction. Efficient operation is generally associated with a lower exit pressure and higher ΔP under the aligned flow conditions. At BEA = 20° and 750 rpm, the exit pressure was 28.2 kPa and ΔP reached 490.0 kPa, corresponding to an efficiency of 83.79% (Figure 14a). These values represent an ideal balance between the pressure recovery and the energy conversion.
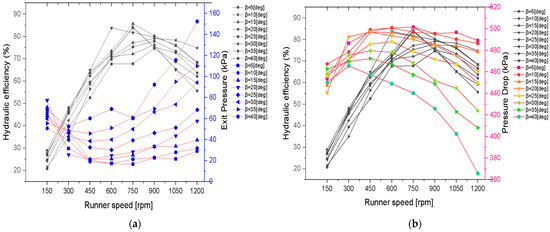
Figure 14.
Effect of exit pressure and pressure drop on hydraulic performance at different BEA nd runner speed (a), Exit pressure and (b), Pressure drop.
In contrast, BEA = 40° at 1200 rpm exhibited an elevated exit pressure of 152.5 kPa and a reduced ΔP of 365.7 kPa, indicating poor flow alignment, incomplete energy extraction, and increased residual kinetic energy. Such configurations exhibited pronounced internal losses and diminished hydraulic stability (Figure 14b). Notably, lower BEAs maintained favorable pressure gradients across the rotor, while higher BEAs generated adverse pressure buildup near the trailing edges, impairing the energy recovery efficiency.
4.4.4. Optimal Configuration and Performance Assessment
Synthesizing the findings from the flow field visualization, efficiency analysis, shaft power generation, and pressure behavior, the configuration with BEA = 15° at 900 rpm emerged as the most hydraulically efficient and mechanically balanced operating point. This setup achieved a peak efficiency of 85.75%, a maximum shaft power of 216.7 W, and a moderate exit pressure indicative of complete energy utilization (Figure 15 BEA = 5° yielded comparable performance at lower speeds (e.g., 83.81% at 750 rpm), it is less favorable for real-time implementation due to its sensitivity to operational variation and risk of cavitation.
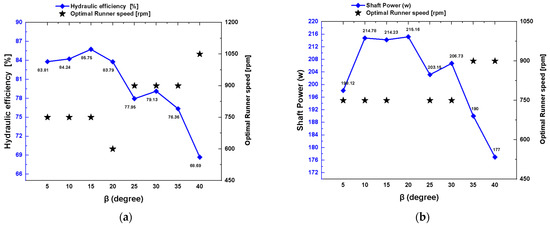
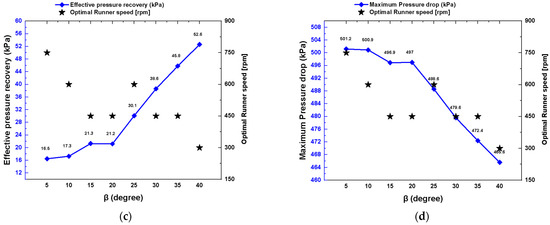
Figure 15.
Effect of performance metrics at optimal BEA and runner speed (a) peak hydraulic efficiency, (b) shaft power, (c) pressure recovery, and (d) Pressure drop.
On the other hand, BEA = 10° delivered 84.24% efficiency at 750 rpm and demonstrated excellent pressure recovery (exit pressure of 17.3 kPa at 600 rpm), establishing it as a viable alternative. As depicted in Figure 15a,c, the optimal BEAs (10–15°) consistently maintained high energy conversion rates and favorable pressure characteristics across a broad range of speeds. In contrast, BEA = 40° demonstrated the weakest performance, with the efficiency declining to 68.7% and the exit pressure rising to 52.6 kPa at 300 rpm—conditions driven by severe flow distortion, recirculation, and energy dissipation.
4.5. Effect of WAA on Hydraulic Performance
The WAA is a key geometric parameter in CFTs, defining the circumferential span over which the working fluid is introduced into the rotor. Its variation directly affects the jet-to-blade alignment, blade engagement duration, and the spatial distribution of blade loading, all of which critically influence the turbine’s hydraulic efficiency and energy conversion effectiveness.
4.5.1. Flow Characteristics and Hydraulic Efficiency Trends
The effect of the WAA on the flow field dynamics was examined through detailed CFD simulations across the WAA values ranging from 45° to 105° and runner speeds from 450 to 1200 rpm. At narrow admission angles (e.g., WAA = 45°), the jet interacts with a limited number of blades, significantly reducing the energy transfer potential, particularly at lower runner speeds (450–600 rpm). Under these conditions, the jet exhibits strong asymmetry, with incomplete blade coverage and abrupt velocity gradients, leading to elevated hydraulic losses and diminished shaft power. Although these configurations minimize the internal disturbance, they restrict the effective utilization of the available fluid energy due to the short blade residence time.
As the WAA increases to 60°, the jet engages a broader sector of the rotor periphery, enhancing the duration and spatial consistency of the jet–blade interaction. These results result in a well-structured tangential velocity profile, reduced flow detachment, and improved pressure distribution across both rotor stages. At a runner speed of 900 rpm, this configuration achieved the highest hydraulic efficiency of 84.91% and a corresponding shaft power output of 225.5 W (Figure 16a,b). The superior performance is attributed to the optimal synchronization between jet incidence and blade motion, facilitating effective kinetic-to-mechanical energy conversion.
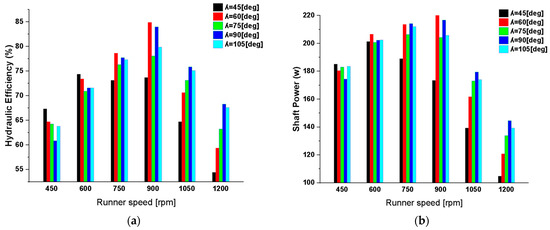
Figure 16.
Effect of hydraulic perfromance and shaft power at different runner speed and WAA (a) Hydraulic efficiency, and (b) Shaft power.
However, as the WAA exceeds 75°, the flow performance begins to deteriorate. At WAA = 90°, although moderate efficiency (84%) and power output (216.7 W) are retained at 900 rpm, partial jet misalignment with the blade curvature becomes obvious. This introduces premature vortex formation, elevated trailing-edge turbulence, and weakened flow coherence—especially in the second stage. At high runner speeds (≥1050 rpm), the centrifugal effects exacerbated the flow dispersion, reducing the jet’s directional stability and further degrading the performance. The degradation is most pronounced at WAA = 105°, where excessive jet spreading leads to substantial misalignment, increased internal recirculation, and ineffective momentum transfer. At 1200 rpm, WAA = 105° resulted in a drop in the hydraulic efficiency to 68.3%, a significant reduction in the shaft power to 139.5 W, and an increase in the exit pressure to 60.0 kPa, indicating residual kinetic energy and poor energy recovery (Figure 17).
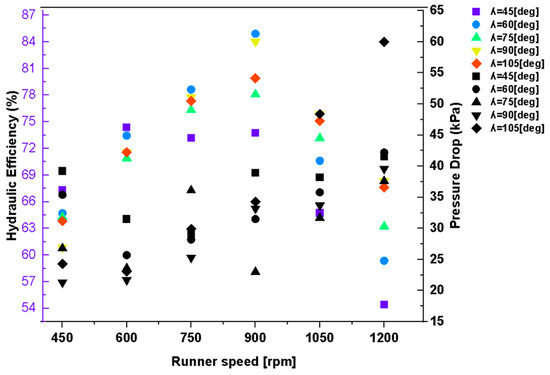
Figure 17.
Effect of the runner speed and WAA on the hydraulic performance and exit pressure.
4.5.2. Pressure Characteristics and Performance Insights
Despite the observed variations in efficiency and shaft power, the overall pressure drop (ΔP) across the turbine remained relatively stable across all WAA configurations, generally within 480–495 kPa (Figure 18). This suggests that the performance discrepancies are primarily governed by internal flow dynamics—namely, the quality of jet incidence, blade coverage, and flow residence time—rather than differences in boundary condition pressures at the inlet or outlet. At WAA = 60°, the favorable flow alignment results in low exit pressure and high ΔP, signifying efficient energy extraction. In contrast, WAAs of 90° and 105° exhibit increased exit pressure levels (39.6 kPa and 60.0 kPa, respectively), corresponding to inefficient jet guidance, trailing-edge separation, and residual energy loss in the outflow.
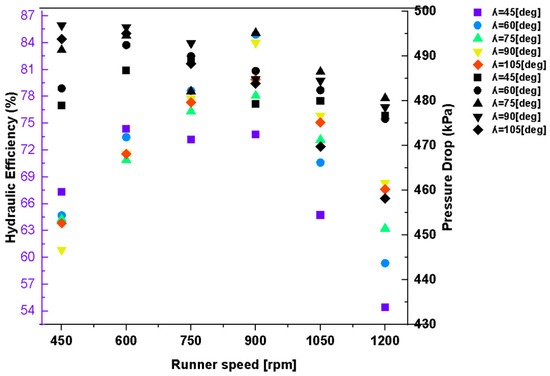
Figure 18.
Effect of runner speed and WAA on hydraulic performance and pressure drop.
4.5.3. Optimal WAA Range and Comparative Analysis
Integrating the efficiency, shaft power, and pressure data, WAA = 60° emerged as the most hydraulically favorable configuration, particularly at the design condition of 900 rpm. This setting delivered a balanced performance characterized by high energy conversion efficiency, robust power output, and favorable pressure recovery, confirming its suitability for practical micro-hydropower applications (Figure 19). WAAs within the 60–75° range consistently yielded optimal hydraulic performance, validating the classic recommendations of Mockmore and Merryfield [12], who identified the same range as ideal based on experimental investigations. This CFD-based study reinforces this conclusion, demonstrating that WAAs within this range provide the best compromise between effective blade coverage and coherent jet guidance. At moderate runner speeds (600–900 rpm), WAA = 60° maintained excellent flow alignment through the rotor stages, minimizing internal losses and promoting pressure uniformity. In contrast, wider WAAs (≥90°) introduced increased flow distortion and internal recirculation zones, resulting in progressively weakened flow structures and performance degradation (Figure 19a–d).
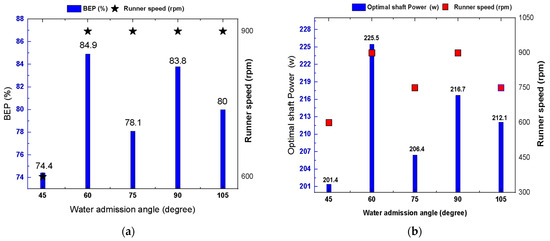
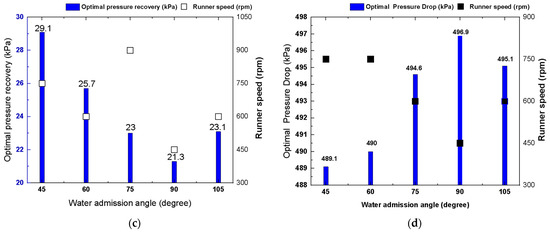
Figure 19.
Optimal hydraulic performance across each WAA (a) BEP, (b) optimal shaft power, (c) optimal pressure recovery, and (d) optimal pressure drop.
4.6. Synergistic Effect of BEA and WAA
While the WAA alone strongly influences the turbine performance, its combined effect with the BEA further determines the flow behavior, pressure distribution, and efficiency (see Figure 20). The coupling of BEA = 15° and WAA = 60° resulted in the highest recorded performance metrics across all tested configurations, namely 84.9% hydraulic efficiency, 225.5 W shaft power, and an exit pressure of 25.7 kPa at 900 rpm.
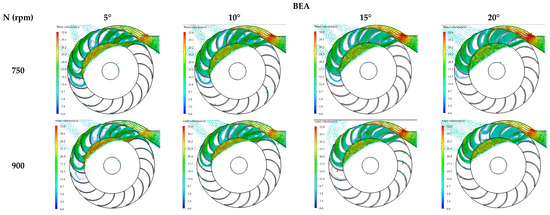
Figure 20.
Coupling of the turbine configuration at the optimal 60° WAA, runner speed, and BEA.
This configuration provided the most favorable flow incidence conditions, ensuring smooth and aligned jet–blade interaction with minimal turbulence and pressure loss. Conversely, mismatched settings such as BEA = 15° and WAA = 100° yielded an efficiency reduction to close to 80%, despite a similar pressure drop, due to increased flow unsteadiness and incomplete energy extraction (see Figure 21).
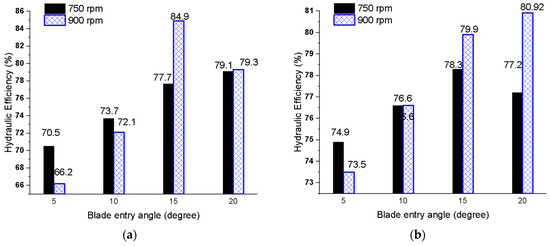
Figure 21.
Effect of BEA on hydraulic efficiency at optimal WAA and runner speed (a) WAA = 60° and (b) WAA = 105°.
Higher BEA–WAA pairings (e.g., BEA = 40°, WAA = 100°) demonstrated elevated pressure recovery (52.6 kPa), yet the efficiency declined below 71%, underscoring a divergence between pressure stabilization and effective torque generation. In addition, combinations involving high BEA with low WAA induced flow separation at the blade leading edges, whereas low BEA with high WAA increased the risk of axial flow misalignment and cavitation near the runner hub. These interactions highlight the necessity of jointly optimizing BEA and WAA, rather than treating them as independent parameters.
5. Conclusions
This study presents a detailed CFD-based parametric investigation into the coupled effects of the Blade Entry Angle (BEA) and Water Admission Angle (WAA) on the hydraulic performance of Cross-Flow Turbines (CFTs) over a wide range of runner rotational speeds. The principal conclusions are as follows:
- ☞
- The turbine’s hydraulic efficiency is highly sensitive to the combined variation in BEA and WAA, indicating that their interdependent optimization is essential for performance enhancement, rather than independent parameter adjustment.
- ☞
- The configuration of BEA = 15° and WAA = 60° demonstrated the highest hydraulic efficiency of 84.91% and an associated shaft power output of 225.5 W at 900 rpm. This configuration significantly outperforms the conventional design benchmark.
- ☞
- The widely implemented design with BEA = 30° and WAA = 90° achieved only 79.1% hydraulic efficiency at 900 rpm, representing a 10–12% deficit in both efficiency and power output relative to the optimized configuration.
- ☞
- The BEA values within 10–20° combined with the WAA values between 60° and 90° consistently yielded superior energy conversion efficiency, stable internal flow regimes characterized by minimized turbulence intensity, and reduced pressure losses at the turbine outlet.
- ☞
- The elevated BEA values (≥30°) induced increased radial flow components and misalignment of jet incidence on blades, escalating turbulence and energy dissipation. Similarly, excessive WAA values (≥90°) cause jet dispersion and suboptimal blade engagement, amplifying hydraulic losses and diminishing the net power output.
- ☞
- These results challenge the conventional geometric standards applied in the micro-hydropower CFT design, underscoring the necessity for revising the BEA and WAA specifications to achieve enhanced turbine efficiency and reliability.
The CFD-derived performance map developed herein provides a robust framework for the systematic selection and optimization of BEA and WAA parameters, facilitating tailored CFT designs adaptable to diverse operational conditions and advancing the engineering of efficient micro-hydropower systems.
6. Recommendation
- ☞
- It is recommended to replace the conventional BEA of 30° and WAA of 90° with BEA of 15° and WAA of 60° to enhance turbine efficiency, particularly at medium to high runner speeds (600–900 rpm)
- ☞
- It is recommended that industry-standard CFT configurations be revised in light of CFD evidence highlighting geometric sensitivity, and that optimized parameters be adopted in new turbine designs to ensure maximum performance
- ☞
- Future research should explore variable-geometry turbines that allow dynamic adjustment of BEA and WAA, enabling the turbine to adapt to fluctuating flow rates and seasonal variations.
Author Contributions
E.Y.A. performed the simulation and data analysis. A.H.T. supervised and revised the manuscript. All authors have read and agreed to the published version of the manuscript.
Funding
This research received no external funding.
Data Availability Statement
All important data are included in the manuscript.
Acknowledgments
The authors acknowledged the Norwegian University of Science and Technology (NTNU) and the Mekelle University Institute of Energy (MU-IOE) for their support and provision of computational resources.
Conflicts of Interest
The authors declare no conflicts of interest.
Appendix A

Table A1.
List of symbols used in the study.
Table A1.
List of symbols used in the study.
| Symbol | Description | Unit |
|---|---|---|
| Fluid density | kg/m3 | |
| Time | s | |
| Velocity vector (in inertial or rotating frame) | m/s | |
| Divergence operator | – | |
| Gradient operator | – | |
| Static pressure | Pa | |
| Shear stress tensor | Pa | |
| Gravitational acceleration vector | m/s2 | |
| Angular velocity vector of the rotating frame | rad/s | |
| Position vector | m | |
| Water volume fraction (VOF model) | – | |
| Turbulent kinetic energy | m2/s2 | |
| Specific dissipation rate | 1/s | |
| Dynamic viscosity | Pa·s | |
| Turbulent (eddy) viscosity | Pa·s | |
| Turbulent (eddy) kinematic viscosity | m2/s | |
| Turbulent Prandtl number for | – | |
| Turbulent Prandtl number for | – | |
| Model constant (SST model) | – | |
| Model constant in the -equation | – | |
| Model constant in the -equation | – | |
| Production term of turbulent kinetic energy | kg/(m·s3) | |
| Hydraulic efficiency | – | |
| Input hydraulic power | W) | |
| Output mechanical power | W | |
| Torque on the runner | N·m | |
| Angular velocity of the runner (also used for dissipation rate contextually) | rad/s | |
| Volumetric flow rate | m3/s | |
| Net head (height of water column) | m | |
| Pressure drop across the turbine | Pa | |
| Static or total pressure at the inlet | Pa | |
| Static pressure at the outlet | Pa | |
| Normal vector to surface (θ direction) | – | |
| Surface area of the runner blade | m2 | |
| Position vector from the axis of rotation | m |
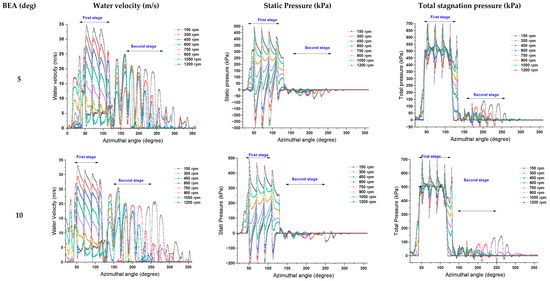
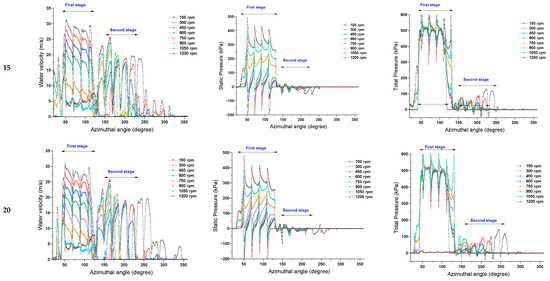
Figure A1.
Effect of BEA and runner speed on the profile of the outer runner periphery.
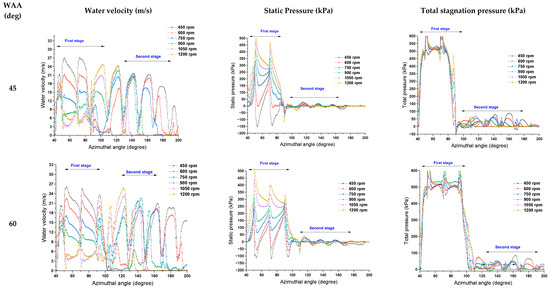
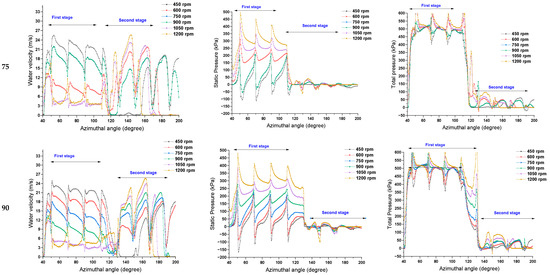

Figure A2.
Effect of WEE and runner speed on the profile of the outer runner periphery.
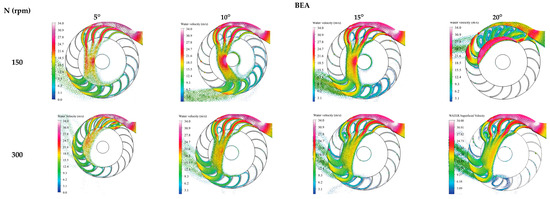
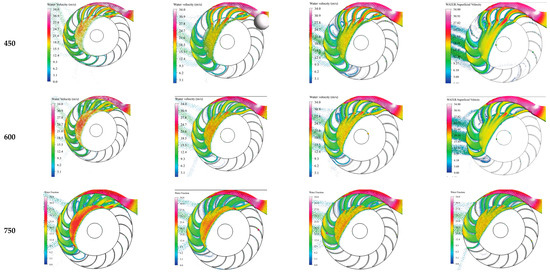
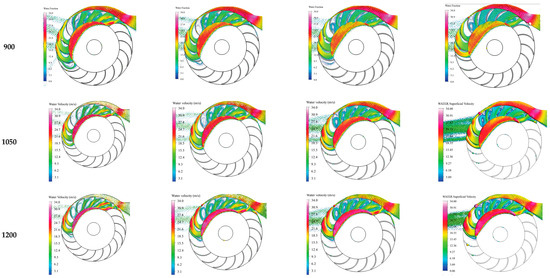
Figure A3.
Effect of runner speed and Blade Entry Angle on the water distribution profile at Water Admission Angle of 90°.
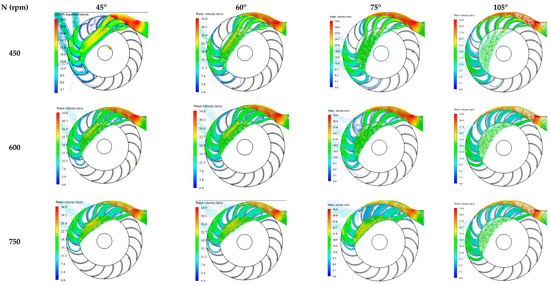
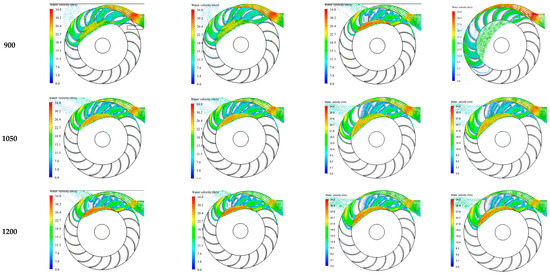
Figure A4.
Effect of runner speed and Water Admission Angle on the water distribution profile at Blade Entry Angle of 30°.
References
- Kaunda, C.S.; Kimambo, C.Z.; Nielsen, T.K. Potential of Small-Scale Hydropower for Electricity Generation in Sub-Saharan Africa. ISRN Renew. Energy 2012, 2012, 132606. [Google Scholar] [CrossRef]
- Elbatran, A.H.; Yaakob, O.B.; Ahmed, Y.M.; Shabara, H.M. Operation, performance and economic analysis of low head micro-hydropower turbines for rural and remote areas: A review. Renew. Sustain. Energy Rev. 2015, 43, 40–50. [Google Scholar] [CrossRef]
- Yassen, S.R. Optimization of the Performance of Micro Hydro-Turbines for Electricity Generation. Ph.D. Thesis, University of Hertfordshire, Hertfordshire, UK, 2014. [Google Scholar]
- Kaunda, C.S.; Kimambo, C.Z.; Nielsen, T.K. A numerical investigation of flow profile and performance of a low cost crossflow turbine. Int. J. Energy Environ. 2014, 5, 275–296. [Google Scholar]
- Cobb, B.R.; Sharp, K.V. Impulse (Turgo and Pelton) turbine performance characteristics and their impact on pico-hydro installations. Renew. Energy 2013, 50, 959–964. [Google Scholar] [CrossRef]
- Koirala, R.; Thapa, B.; Neopane, H.P.; Zhu, B. A review on flow and sediment erosion in guide vanes of Francis turbines. Renew. Sustain. Energy Rev. 2017, 75, 1054–1065. [Google Scholar] [CrossRef]
- Tobo, Y.M.; Ramayya, A.V.; Tibba, G.S. CFD Simulation and Optimization of Very Low Head Axial Flow Turbine Runner. Int. J. Renew. Energy Dev. 2015, 4, 181–188. [Google Scholar] [CrossRef]
- Totapally, H.G.S.; Aziz, N.M. Refinement of cross-flow turbine design parameters. J. Energy Eng. 1994, 120, 133–147. [Google Scholar] [CrossRef]
- Nuet, N.S.; Soe, M.M.; Htay, M.M. Experimental investigation of cross-flow turbine. Int. J. Mech. Prod. Eng. 2016, 4, 83–88. [Google Scholar]
- Olgun, H. Investigation of the performance of a cross flow turbine. Int. J. Energy Res. 1998, 22, 953–964. [Google Scholar] [CrossRef]
- Kaniecki, M.; Steller, J. Flow analysis through a reaction cross-flow turbine. In Proceedings of the Conference on Modelling Fluid Flow CMFF’03, Budapest, Hungary, 3–6 September 2003. [Google Scholar]
- Mockmore, C.A.; Merryfield, F. The Banki Water Turbine. Eng. Exp. Stn. Bull. Ser. 1949, 25. [Google Scholar]
- Tongco, A.F. Field Testing of a Cross Flow Water Turbine. Ph.D. Thesis, Oklahoma State University, Stillwater, OK, USA, 1988. [Google Scholar]
- Fiuzat, A.A.; Akerkar, B.P. Power outputs of two stages of cross-flow turbine. J. Energy Eng. 1991, 117, 57–70. [Google Scholar] [CrossRef]
- Desai, V.R.; Aziz, N.M. An experimental investigation of cross-flow turbine efficiency. J. Fluids Eng. Trans. ASME 1994, 116, 545–550. [Google Scholar] [CrossRef]
- Joshi, B.; Seshadri, V.; Singh, S.; Joshi, C.; Seshadri, V.; Singh, S. Parametric study on performance of Crossflow turbine. J. Energy Eng. 1995, 121, 28–45. [Google Scholar] [CrossRef]
- Reddy, H.; Seshadri, V.; Kothari, D.P. Effect of draft tube size on the performance of a cross-flow turbine. Energy Sources 1996, 18, 143–149. [Google Scholar] [CrossRef]
- Pereira, N.H.C.; Borges, J.E. Prediction of the cross-flow turbine efficiency with experimental verification. J. Hydraul. Eng. 2017, 143, 4016075. [Google Scholar] [CrossRef]
- Walseth, E.C. Investigation of the Flow Through the Runner of a Cross-Flow Turbine. Master’s Thesis, Norwegian University of Science and Technology, Trondheim, Norway, 2009. [Google Scholar]
- Haurissa, J.; Wahyud, S.; Irawan, Y.S.; Soenoko, R.; Wahyudi, S.; Irawan, Y.S.; Soenoko, R. The Cross flow turbine behavior towards the turbine rotation quality, efficiency, and generated power. J. Appl. Sci. Res. 2012, 8, 448–453. [Google Scholar]
- Kaunda, C.S.; Kimambo, C.Z.; Nielsen, T.K. Experimental study on a simplified crossflow turbine. Int. J. Energy Environ. 2014, 5, 155–182. [Google Scholar]
- Chen, Z.; Singh, P.M.; Choi, Y.-D. Performance Improvement of Very Low Head Cross Flow Turbine with Inlet Open Duct. J. Fluid Mach. 2014, 17, 30–39. [Google Scholar] [CrossRef]
- Rantererung, C.L.; Soeparman, S.; Soenoko, R.; Wahyudi, S. Dual nozzle cross flow turbine as an electrical power generation. ARPN J. Eng. Appl. Sci. 2016, 11, 15–19. [Google Scholar]
- Costa Pereira, N.H.; Borges, J.E. Study of the nozzle flow in a cross-flow turbine. Int. J. Mech. Sci. 1996, 38, 283–302. [Google Scholar] [CrossRef]
- Ranjan, R.K.; Alom, N.; Singh, J.; Sarkar, B.K. Performance investigations of cross flow hydro turbine with the variation of blade and nozzle entry arc angle. Energy Convers. Manag. 2019, 182, 41–50. [Google Scholar] [CrossRef]
- Aliman, I.; Kurniawati, I.; Wulandari, J.A.; Sutikno, P. Evaluation design and simulation of three-way nozzle and control flow vane nozzle on cross flow water turbine for various head. AIP Conf. Proc. 2018, 1984, 030010. [Google Scholar] [CrossRef]
- Choi, Y.-D.; Lim, J.-I.; Kim, Y.-T.; Lee, Y.-H. Effect of Blade Angle on the Performance of a Cross-Flow Hydro Turbine. J. Korean Soc. Mar. Eng. 2008, 32, 413–420. [Google Scholar] [CrossRef]
- De Andrade, J.; Curiel, C.; Kenyery, F.; Aguilln, O.; Vásquez, A.; Asuaje, M. Numerical investigation of the internal flow in a Banki turbine. Int. J. Rotating Mach. 2011, 2011, 841214. [Google Scholar] [CrossRef]
- Kokubu, K.; Kanemoto, T.; Son, S.-W.; Choi, Y.-D. Performance improvement of a micro eco cross-flow hydro turbine. J. Korean Soc. Mar. Eng. 2012, 36, 902–909. [Google Scholar] [CrossRef]
- Sammartano, V.; Arico, C.; Caravetta, A.; Fecarotta, O.; Carravetta, A.; Fecarotta, O.; Tucciarelli, T.; Aricò, C.; Carravetta, A.; Fecarotta, O.; et al. Banki-Michell Optimal Design by Computational Fluid Dynamics Testing and Hydrodynamic Analysis. Energies 2013, 6, 2362–2385. [Google Scholar] [CrossRef]
- Reihani, A.; Ojaghi, A.; Derakhshan, S.; Beigzadeh, B.; Belgzadeh, B.; Beigzadeh, B. Shaft fatigue life and efficiency improvement of a micro cross flow turbine. Eng. Solid Mech. 2014, 2, 1–14. [Google Scholar] [CrossRef][Green Version]
- Khan, M.A.; Badshah, S. Design and analysis of cross flow turbine for micro hydro power application using sewerage water. Res. J. Appl. Sci. Eng. Technol. 2014, 8, 821–828. [Google Scholar] [CrossRef]
- Acharya, N.; Bhapa, B.; Lee, Y.; Kim, C. Numerical analysis and performance enhancement of a cross-flow hydro turbine. Renew. Energy 2015, 80, 819–826. [Google Scholar] [CrossRef]
- Adhikari, R.A.C.; Vaz, J.R.P.; Wood, D. Cavitation inception in crossflow hydro turbines. Energies 2016, 9, 237. [Google Scholar] [CrossRef]
- Farooq, M.U.; Badshah, S.; Iman, M.; Rafai, A.; Masood, A. Design and analysis of cross flow impulse turbine for water stream near Trapi village KPK Pakistan. In Proceedings of the 4th International Conference on Energy, Environment and Sustainable Development, Jamshoro, Pakistan, 1–3 November 2016. [Google Scholar]
- Chattha, J.A.; Zaffar, A.; Ibrahim, B.; Asif, M.; Sarwar, M.A.; Chattha, J.A.; Asif, M. Optimisation of blade profiles of cross flow turbine. Int. J. Power Energy Convers. 2018, 9, 311. [Google Scholar] [CrossRef][Green Version]
- Adanta, D.; Budiarso; Warjito; Siswantara, A.I.; Prakoso, A.P. Performance comparison of NACA 6509 and 6712 on pico hydro type cross-flow turbine by numerical method. J. Adv. Res. Fluid Mech. Therm. Sci. 2018, 45, 116–127. [Google Scholar][Green Version]
- Leguizamón, S.; Avellan, F. Computational parametric analysis of the design of cross-flow turbines under constraints. Renew. Energy 2020, 159, 300–311. [Google Scholar] [CrossRef]
- Assefa, E.Y.; Tesfay, A.H. Effect of Blade Number on Internal Flow and Performance Characteristics in Low-Head Cross-Flow Turbines. Energies 2025, 18, 318. [Google Scholar] [CrossRef]
Disclaimer/Publisher’s Note: The statements, opinions and data contained in all publications are solely those of the individual author(s) and contributor(s) and not of MDPI and/or the editor(s). MDPI and/or the editor(s) disclaim responsibility for any injury to people or property resulting from any ideas, methods, instructions or products referred to in the content. |
© 2025 by the authors. Licensee MDPI, Basel, Switzerland. This article is an open access article distributed under the terms and conditions of the Creative Commons Attribution (CC BY) license (https://creativecommons.org/licenses/by/4.0/).