Systematic Review

A Review of Multi-Energy Systems from Resiliency and Equity Perspectives

by
Kathryn Hinkelman
1,*,
Juan Diego Flores Garcia
2,
Saranya Anbarasu
2 and
Wangda Zuo
2
1
Civil and Environmental Engineering, University of Vermont, Burlington, VT 05405, USA
2
Architectural Engineering, Pennsylvania State University, University Park, PA 16802, USA
*
Author to whom correspondence should be addressed.
Energies 2025, 18(17), 4536; https://doi.org/10.3390/en18174536 (registering DOI)
Submission received: 11 July 2025 / Revised: 6 August 2025 / Accepted: 20 August 2025 / Published: 27 August 2025
(This article belongs to the Topic Multi-Energy Systems, 2nd Edition)

Abstract

Multi-energy systems (MES), or energy hubs, offer a technologically viable solution for maintaining resilient energy infrastructure in the face of increasingly frequent disasters, which disproportionately affect low-income and disadvantaged communities; however, their adoption for these purposes remains poorly understood. Following PRISMA 2020, this paper systematically reviews the MES literature from both resiliency and equity perspectives to identify synergies, disparities, and gaps in the context of climate change and long-term decarbonization goals. From 2420 records identified from Scopus (1997–2023), we included 211 original MES research publications for detailed review, with studies excluded based on their scale, scope, or technology. Risk of bias was minimized through dual-stage screening and statistical analysis across 18 physical system and research approach categories. The results found that papers including equity are statically more likely to involve fully renewable energy systems, while middle income countries tend to adopt renewable systems with biofuels more than high income countries. Sector coupling with two energy types improved the resiliency index the most (73% difference between baseline and proposed MES), suggesting two-type systems are optimal. Statistically significant differences in modeling formulations also emerged, such as equity-focused MES studies adopting deterministic design models, while resilience-focused studies favored stochastic control formulations and load-shedding objectives. While preliminary studies indicate low operational costs and high resilience can synergistically be achieved, further MES case studies are needed with low-income communities and extreme climates. Broadly, this review novelly applies structured statistical analysis for the MES domain, revealing key trends in technology adoption, modeling approaches, and equity-resilience integration.

1. Introduction

Energy systems are under pressure globally to be clean, resilient, and equitably serve community needs. The Intergovernmental Panel on Climate Change (IPCC) stated that it is “unequivocal that human influence has warmed the atmosphere, ocean and land”, and there is “high confidence that human-induced climate change is the main driver” of hot extreme weather events (including heat waves) becoming more frequent and more intense and cold extreme events becoming less frequent and severe [1]. As such, climate-induced resilience and equity measures are major global concerns, which are reflected in the IPCC’s top two climate action opportunities for energy systems of “energy reliability (e.g., diversification, access, stability)” and “resilient power systems” [1]. Further, the increase in climate- and human-induced disasters strain critical infrastructure systems in the built environment, of which energy is central. This has led to the formation of several international programs on resiliency [2] and energy justice [3].
To meet climate action targets and provide reliable energy services for all, it is advantageous to recognize opportunities to interconnect multiple energy carriers through multi-energy systems (MES) with energy hubs (EH). Visualized in Figure 1, MES are integrated energy systems that simultaneously manage, convert, and distribute two or more energy carriers—such as electricity, heat, gas, or hydrogen—through interconnected networks and EH to improve efficiency, flexibility, and reliability. The scale, energy carriers, and equipment can vary significantly based on community needs. By integrating heterogeneous energy carriers, MES can achieve zero-carbon goals via deep renewable energy penetration and waste heat recovery [4]. Beyond decarbonization, MES can also provide financial and social benefits to communities by enabling pathways to integrate local resources, increase energy autonomy, and leverage economies of scale benefits through aggregation and resource sharing (e.g., higher systemic energy efficiencies through aggregation).
However, despite promising opportunities for MES to meet energy needs from both equity and resilience perspectives, they are seldomly implemented today for these purposes. In general, resilience remains an emerging topic for energy system engineering [2]. Meanwhile, most decarbonizing energy systems for low-income and developing communities to date have focused on lowest-cost electrification pathways [5,6]; however, “the primary technical hurdles for [renewable energy] integration include the... design for reliable and resilient operation with intermittent high-penetration renewable generation” [6]. By addressing this hurdle, among others, we aim to review the MES literature from both resilience and equity perspectives to understand the extent to which the previous literature has addressed these synergistic perspectives, what differences separate their approaches, and where technical gaps remain. In particular, this paper answers these questions through a lens of climate action and decarbonization for energy system engineering design and operation.

1.1. Resilience: Concept and Energy Applications

First introduced to the field of ecology in 1973, resilience is defined as “a measure of the ability of [ecological] systems to absorb changes of state variables, driving variables, and parameters, and still persist” [7]. In the context of sustainability, natural ecosystems must have sufficient flexibility to respond to disturbances—i.e., be resilient—to survive over long periods of time [8]. Since its ecological origin, the concept of resilience has been applied to a wide variety of fields, including safety and risk engineering [9], critical infrastructure systems [10], supply chains [11], and psychology [12], among others.
While the specific definitions and metrics for resilience vary across application domains [13], the fundamental concept can be explained through Figure 2. The three general classification stages of resilience include (1) Preparation, (2) Resistance and Response, and (3) Recovery. These three stages are consistent across numerous literature sources [13,14,15,16]; although, the exact terms can vary slightly, and the Resistance and Response stage is at times further divided into two. In the first stage, corresponding with normal operation, the system can prepare for a future disturbance event δ occurring at time t δ . This event can exhibit various levels of intensity, frequency, and predictability. Following the event, the time-varying system function f ( t ) is pushed outside of its normal operating range. To return to normal operation, the system wants to resist the disturbance (limit Δ f ), respond quickly (limit Δ t 1 ), and recover quickly (limit Δ t 2 ). Generally, the shaded area under the curve represents the impact of δ on f; this is referred to as the total stability [8] (e.g., ecological context) or simply the resilience [16] (e.g., power systems context).
Despite resiliency still being considered an emerging subject in many engineering fields [2], research in energy applications has made notable progress. With respect to MES and EHs, the literature has been reviewed from various perspectives, including climate change adaption [17], modeling [18], microgrids including multi-energy microgrids [19], cyber-physical systems [20], and energy-transportation systems [21]. To summarize, previous reviews consider a wide variety of subsystems (e.g., electric grid, gas, cold/heat networks, transportation, water), conversion technologies (e.g., power-to-gas, power-to-heat, power-traffic), typologies (e.g., centralized/distributed, consumers/prosumers), failure events (e.g., equipment failure, natural disaster, supply shortage, cyber attack), and stages (e.g., preparation, resistance/response, recovery). Best practice suggestions are provided for modeling methods [18], resilience response strategies [19], and an overall qualitative assessment approach [20]. While indicating that existing research overall is still inadequate [18,20], some of the identified future needs include resilience under extreme scenarios/high-impact low-probability events [17,18], higher fidelity models [19], dispatch strategies of coupling components [18], assessment indexes and metrics [20], and interdisciplinary approaches [19].
Unlike previous studies, this work aims to understand resilience for MES applications in relation to equity considerations. From a complex systems perspective, resilience involves socio-economic factors as well as technical ones [2]; for example, the City Resilience Index [22] includes “economy and society” as a core dimension of resilience. In turn, socio-economic impacts due to energy service disruptions can be significant [23,24]. However, literature reviews that address both resilience and equity perspectives for MES are lacking.

1.2. Equity: Concept and Energy Applications

Representing the quality of being fair or impartial for all, equity is inextricably linked with energy as a universal human right to adequate health and well-being. However, energy systems inequitably serve disadvantaged and marginalized communities with respect to fundamental access and reliability, health and pollution, infrastructure funding and usage cost, and more [25]. Contributing to social injustice and equity problems [6], this lack of energy access directly impacts peoples’ ability to obtain clean water, food, and good health. In 2021, 2.3 billion people still relied on dirty, inefficient cooking systems, while 675 million lived without electricity [26]. Lack of access to clean and reliable energy is primarily driven by affordability [6,27] with the greatest vulnerabilities occurring for people who live in extreme poverty or rural places [5].
To improve clean energy access to billions of disadvantaged people across the world, most efforts to date aim to serve low-income areas by 100% electrified energy solutions with photovoltaic (PV) panels to decrease greenhouse gas (GHG) emissions [5,6,28]. Typically featuring PV and electric generators fed from another energy source [6,28], these systems are classified as Hybrid Energy Systems (HES), which have multiple energy sources or harvesting systems with fully electric distribution systems and end uses [29]. As such, there is extensive literature on HES from energy equity perspectives [30,31,32,33,34,35,36,37]. For example, Olówósejéjé et al. [28] found that integrated hybrid solar system with fossil fuel generators and no energy storage are the best solution in terms of financial cost and GHG emissions based on a commercial building case study in Nigeria. For case studies in Nepal, Peru, and Kenya, Yadoo et al. [5] found that microgrids powered by biomass gasifiers or micro hydro plants are favored for their reliability, sustainability, and low cost in rural and low-income regions. While HES are common in-practice today, this work focuses on MES, which are distinguished by the presence of multiple energy carriers through the distribution system, as shown in Figure 1.
Although HES have been most commonly implemented to date for low-income and remote communities, several open research challenges remain. First, while renewable sources powered 30% of electricity in 2021, heating and transportation sectors have been more difficult and seen less progress [26]. Second, electricity generated from solar PV and wind is highly stochastic, which frequently induces a need for either costly storage (e.g., chemical batteries) or flexible fossil-based generators (typically diesel) [30], posing both financial and environmental concerns. Without fossil fuels, it can be difficult for low-income and disadvantaged communities to achieve a reliable and resilient energy supply [38]. It is known that MES can help address these challenges by, for example, enabling multi-energy vector approaches that match source/delivery energy quality with end use energy quality demands [39], or by mitigating intermediate renewable generation through sector coupling, reducing or eliminating the need for storage [40]. However, it is unclear if MES are economically and technically viable for low-income, rural, and disadvantaged communities.
To this end, some insights are available from the literature despite a general scarcity of MES research from an equity perspective. For high renewable energy systems, MES can have lower life cycle costs compared full electric systems with batteries, as Bartolini et al. [41] found when evaluating an MES with CHP and electric/hydrogen storages for a real residential community in Austin, TX, USA. While MES and district energy systems (DES) can be more affordable over their life cycle than other technologies, the shared infrastructure (e.g., DES piping networks) can be difficult to fund compared to individual building systems [42]. Also, MES can be more complex than single-energy network systems (e.g., HES), which poses technical as well as upfront financial challenges. This largely explains why MES have not been frequently implemented for energy equity to date. However with that said, more research is required to shed light on the economic and technical viability of MES for low-income and rural communities.

1.3. Challenges, Objectives, and Contributions

The body of literature indicates several challenges for MES from resilience and equity perspectives that merit further investigation. First, it is important to recognize that both MES and resilience for engineering applications are newly emerging concepts [2,43], while energy equity amidst the clean energy transition is a highly active and open research challenge [44,45]. Within these larger domains, equity perspectives of MES are particularly lacking, which is also true for HES [33]. Second, because MES are an emerging technology, both physical and computational engineering challenges remain when designing and operating MES for various cultures and climates. For example, multi-storage energy systems are a favorable approach for grid stabilization and reliability, but challenges remain on developing, sizing, and selecting storage technologies (e.g., batteries, pumped hydro, air, thermal) that balance resilience, cost, and other needs [46]. Further, developing dynamic modeling and analysis tools are needed for evaluating MES stability at large [47], and moreover, it is unclear how these tool needs change when designing and operating systems for low income, rural, and disadvantaged communities. To our knowledge, questions such as these at the intersection of resilience and equity remain unexplored for MES.
As such, this study aims to provide a frame of reference for identifying where and how equity and resilience dimensions are addressed currently in the MES literature. The goal is to understand the synergies, differences, technical challenges, and opportunities for resilient and equitable MES with respect to both physical systems present and analysis approaches adopted. In particular, our lens tends towards engineering solutions that meet decarbonization goals in the face of climate change. The main contributions are summarized as follows:
  • Overarching scope: This is the first known review to systematically examine MES through the combined lenses of resilience and equity, which are highly interdependent and urgent subjects for sustainable energy transitions. By systematically analyzing the MES literature through both lenses, this review uncovers how technical decisions (e.g., energy storages, modeling strategies) align with or diverge from broader societal goals, offering a more holistic understanding of MES performance and guiding future research toward inclusive and climate-resilient energy solutions.
  • Generalizable methodology: We introduce a structured classification and comprehensive statistical analysis framework that includes correlation analysis, categorical synthesis, and term clustering across 211 original MES studies. Very few review papers on MES, if any, employ a comprehensive statistical analysis framework like the one used herein. Previous reviews (e.g., [17,18,43,48,49,50,51], to name a few) focus on concepts, models, system typologies, and analysis methods, but do not apply structured statistics. Yet statistical analysis is essential for an unbiased review methodology by enabling objective identification of patterns, correlations, and gaps across a large body of the literature [52,53].
  • Specific findings: We identify novel insights across both physical systems and research approaches for MES, such as the statistically significant association between equity-focused MES and fully renewable energy systems; the optimal resilience gains achieved in two-network MES configurations; the uniformity in multi-objective optimization approaches across resilience and equity lenses; and the contrasting statistically significant divergences in objective function metrics. Furthermore, we highlight underexplored modeling approaches and geographic gaps, particularly in low-income and extreme climate contexts.
Together, these contributions provide a foundation for future research to develop integrated design frameworks and modeling strategies that embed resilience and equity into MES planning, design, and operation.
The rest of this paper is organized as follows. Section 2 presents the methodology undertaken for the technical literature review from document searching through detailed analysis and synthesis. The results in Section 3 are first presented at a high level for the contextual overview, before divulging specifications across physical systems and research approaches. Lastly, Section 4 and Section 5 present the discussion and final conclusions.

2. Materials and Methods

The technical review methodology adopted in this work can be divided into three steps: (1) document identification, (2) document screening, and (3) analysis and synthesis. These steps are presents in their respective sections below.

2.1. Document Identification

All initial documents were collected from the Scopus database following a keyword search using terms listed in Table 1. The search was applied across the article title, abstract, and keywords. We included only document types of Article or Conference paper written in English, without any other restrictions.
Overall, the objective of the search was to encompass a wide variety of literature without unexpected pre-filtering due to the exclusion of terminology variants. For example, “hybrid energy” at times is used to describe MES, but not always. To not miss publications that are within scope but adopt HES as the referenced system, we included this search term. After evaluating multiple term combinations, Table 1 produced the best results based on the intended scope of MES (system type) and resilience or equity (perspectives). In total, this search identified 2420 initial documents.

2.2. Document Screening

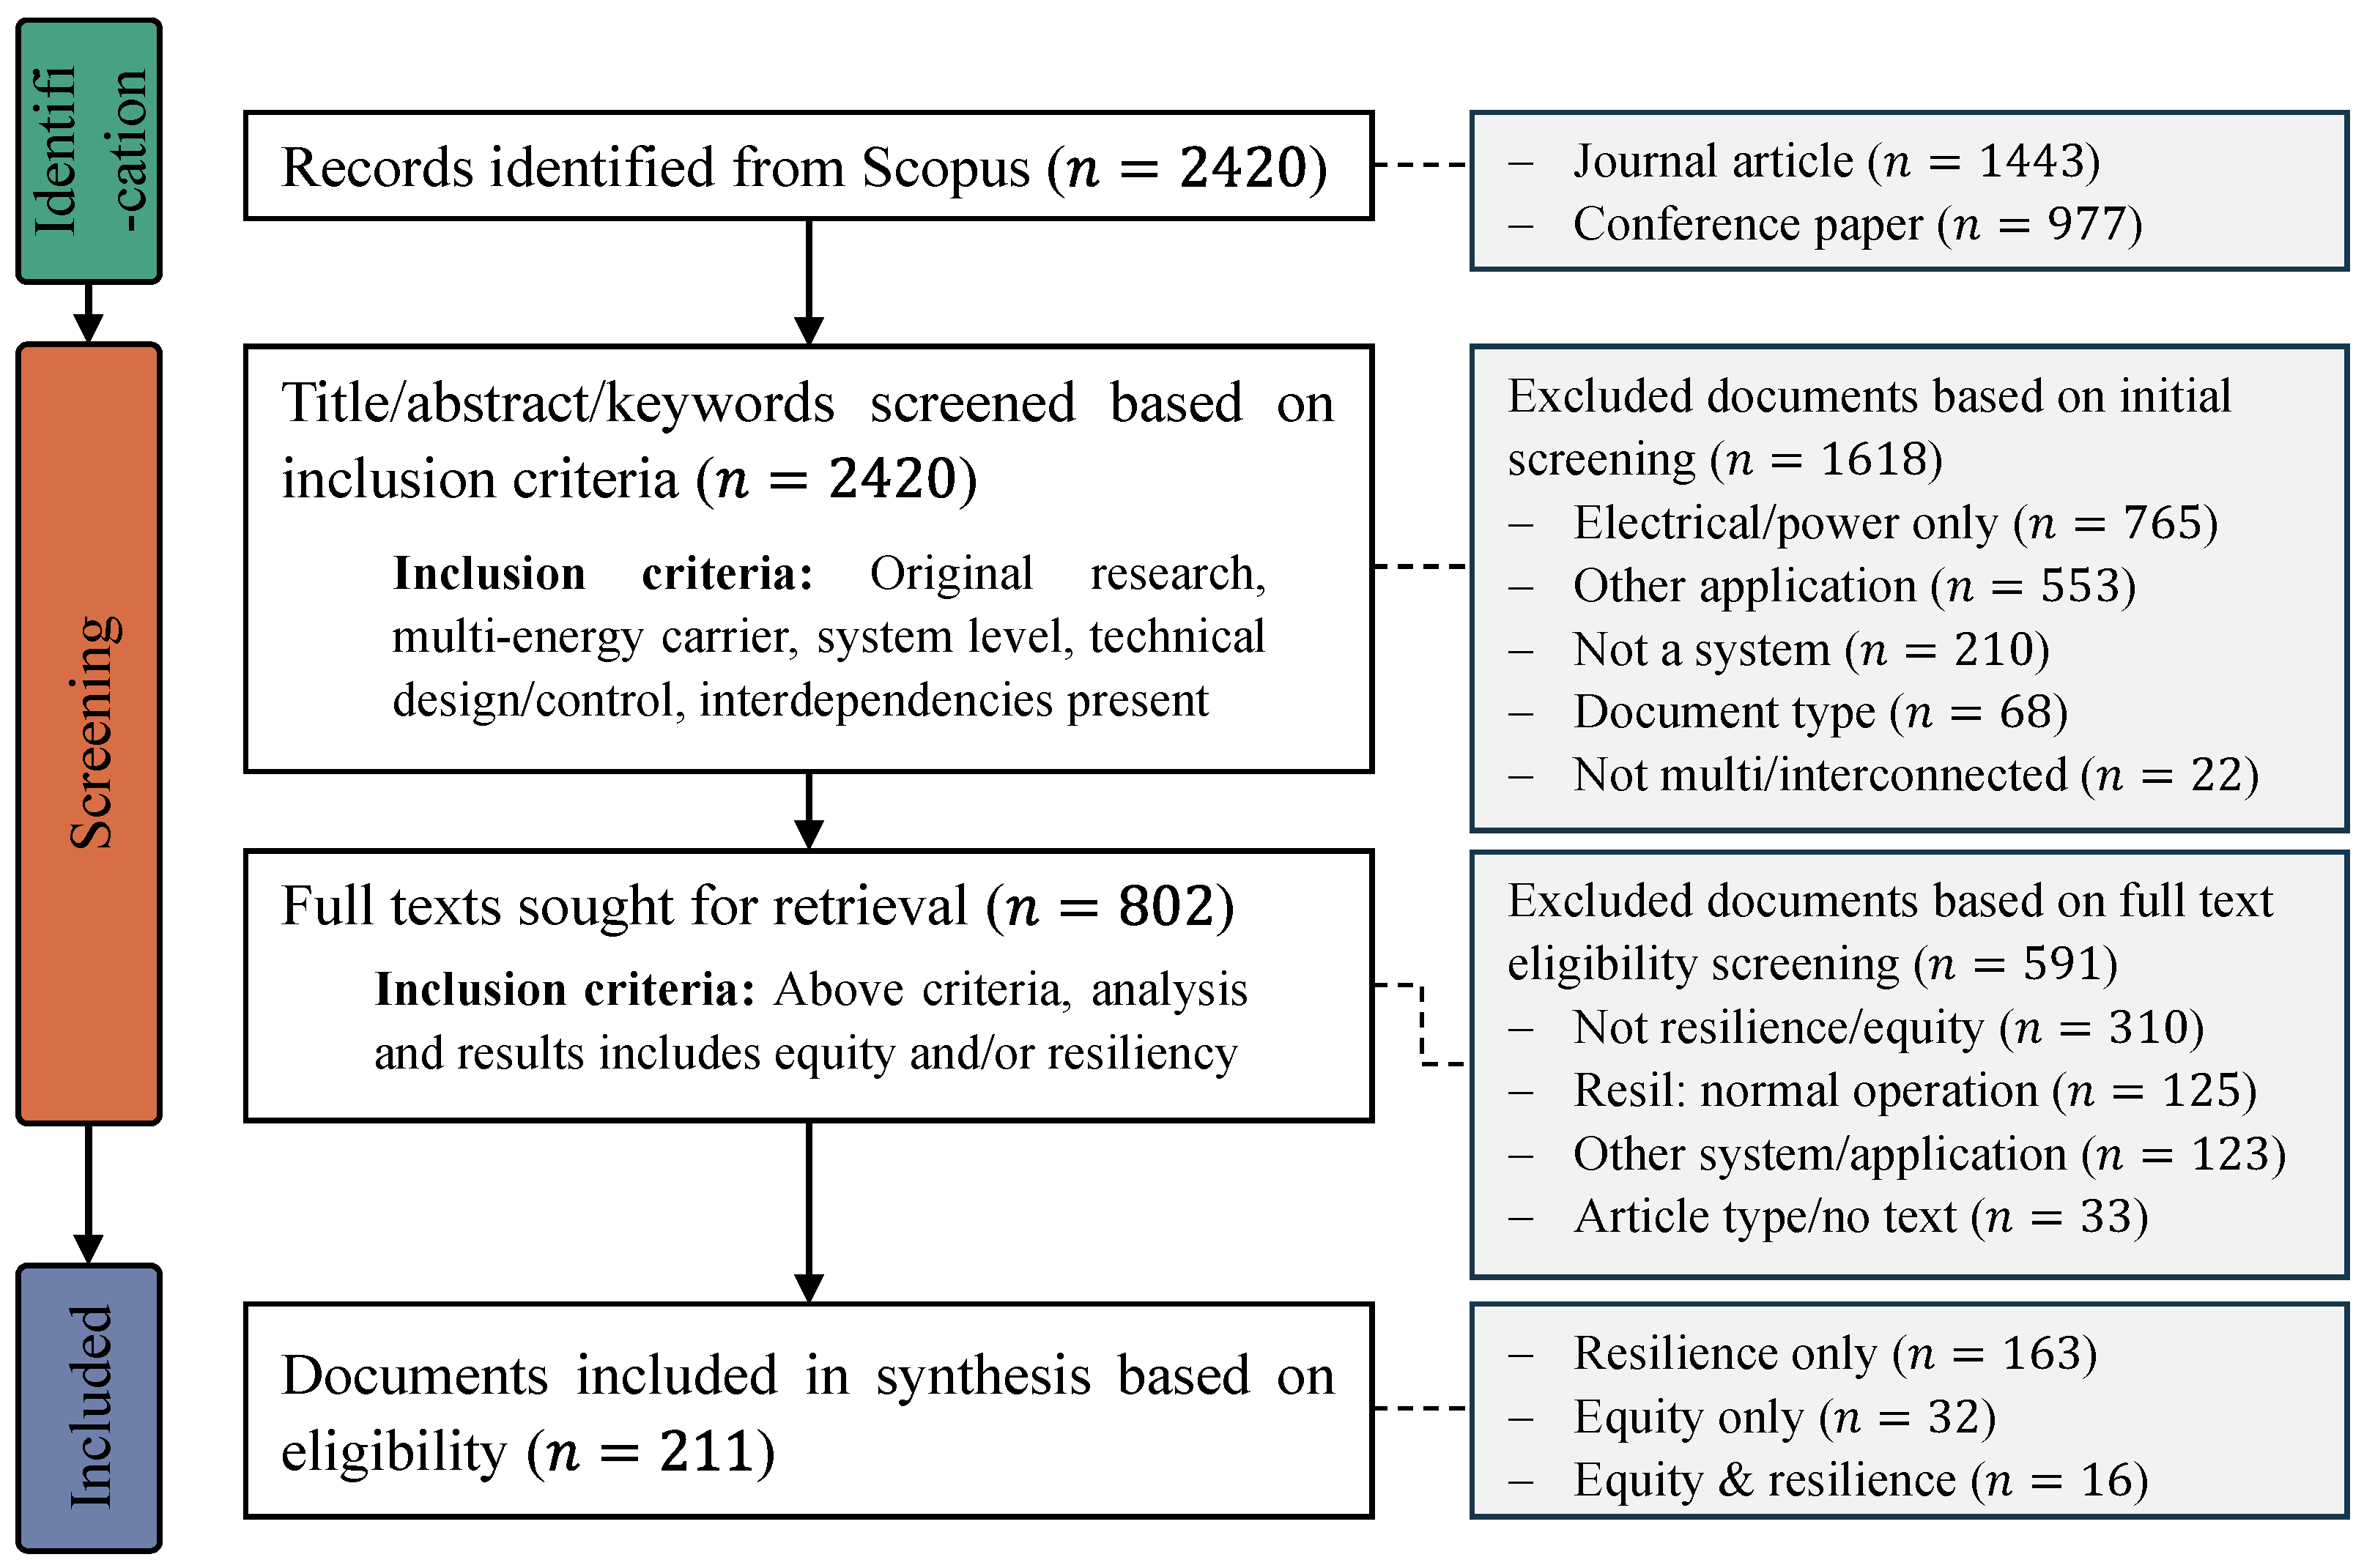
Following the database search, the documents were screened and selected for the detailed review following PRISMA 2020 [52]. Figure 3 shows the results of this process, and the major steps are as follows. After the document identification stage, the titles, abstracts, and keywords were first screened for the inclusion criteria. This first screening criteria required the document to present (1) original research and involve (2) multiple energy carriers (e.g., electric/heating, electric/gas, electric/heating/cooling); (3) the system level (e.g., not a material or one equipment only); (4) technical design (e.g., not policy); and (4) interdependencies (e.g., not separate, independent gas and electrical systems). Following the first screening, full texts for 802 documents were retrieved for secondary screening. In addition to the first screening criteria, the full text filtering also verified that the case study analysis and results included equity and/or resilience. Risk of bias was minimized through dual-stage screening and classification.
In the screening steps of Figure 3, several common topics arose that were out of the scope of this work. Most frequently, 765 documents involved electrical/power systems only; while these were excluded because they are not MES, the relatively high volume of electric-only HES reflects the general popularity of this approach (as discussed in Section 1). Similarly, 553 documents involved other applications (e.g., communication only, energy policy, X-ray technology), while 210 documents were not at the system level (e.g., storage equipment, battery control, energy harvester). Further, in the second screening stage, 310 documents were excluded because the title/abstract/keywords mentioned resilience/equity terms, but the analysis itself did not pursue these goals. Additionally, some papers included resilience as part of the methods, but resilience was only assessed during normal operation without any faults/failures ( n = 125 ), while other cyber resilience papers did not include information on the physical system infrastructure [54] and thus were excluded. Following the secondary screening, a final set of 211 documents remained for inclusion in the detailed review.

2.3. Analysis and Synthesis

The analysis and synthesis of results first involved a high-level contextual overview followed by detailed review of the full texts. For contextual analysis, we adopted the CorTexT Manager platform [55], an open digital platform for the analysis and visualization of textual data. To inform textual trends and correlations across the 211 documents, the corpus was first imported to CorTexT Manager, containing citation, bibliographic, abstract, and keyword information from Scopus. Then, a terms extraction algorithm identified the top 100 terms across fields of title, abstract, and keywords based on their specificity and frequency, excluding monograms. Specificity was computed as a chi-square ( χ 2 ) score with the standard formula
χ 2 = ( O i E i ) 2 E i ,
where O is the observed value and E is the expected value. Moore and McCabe [56] provides further information on this statistical method.
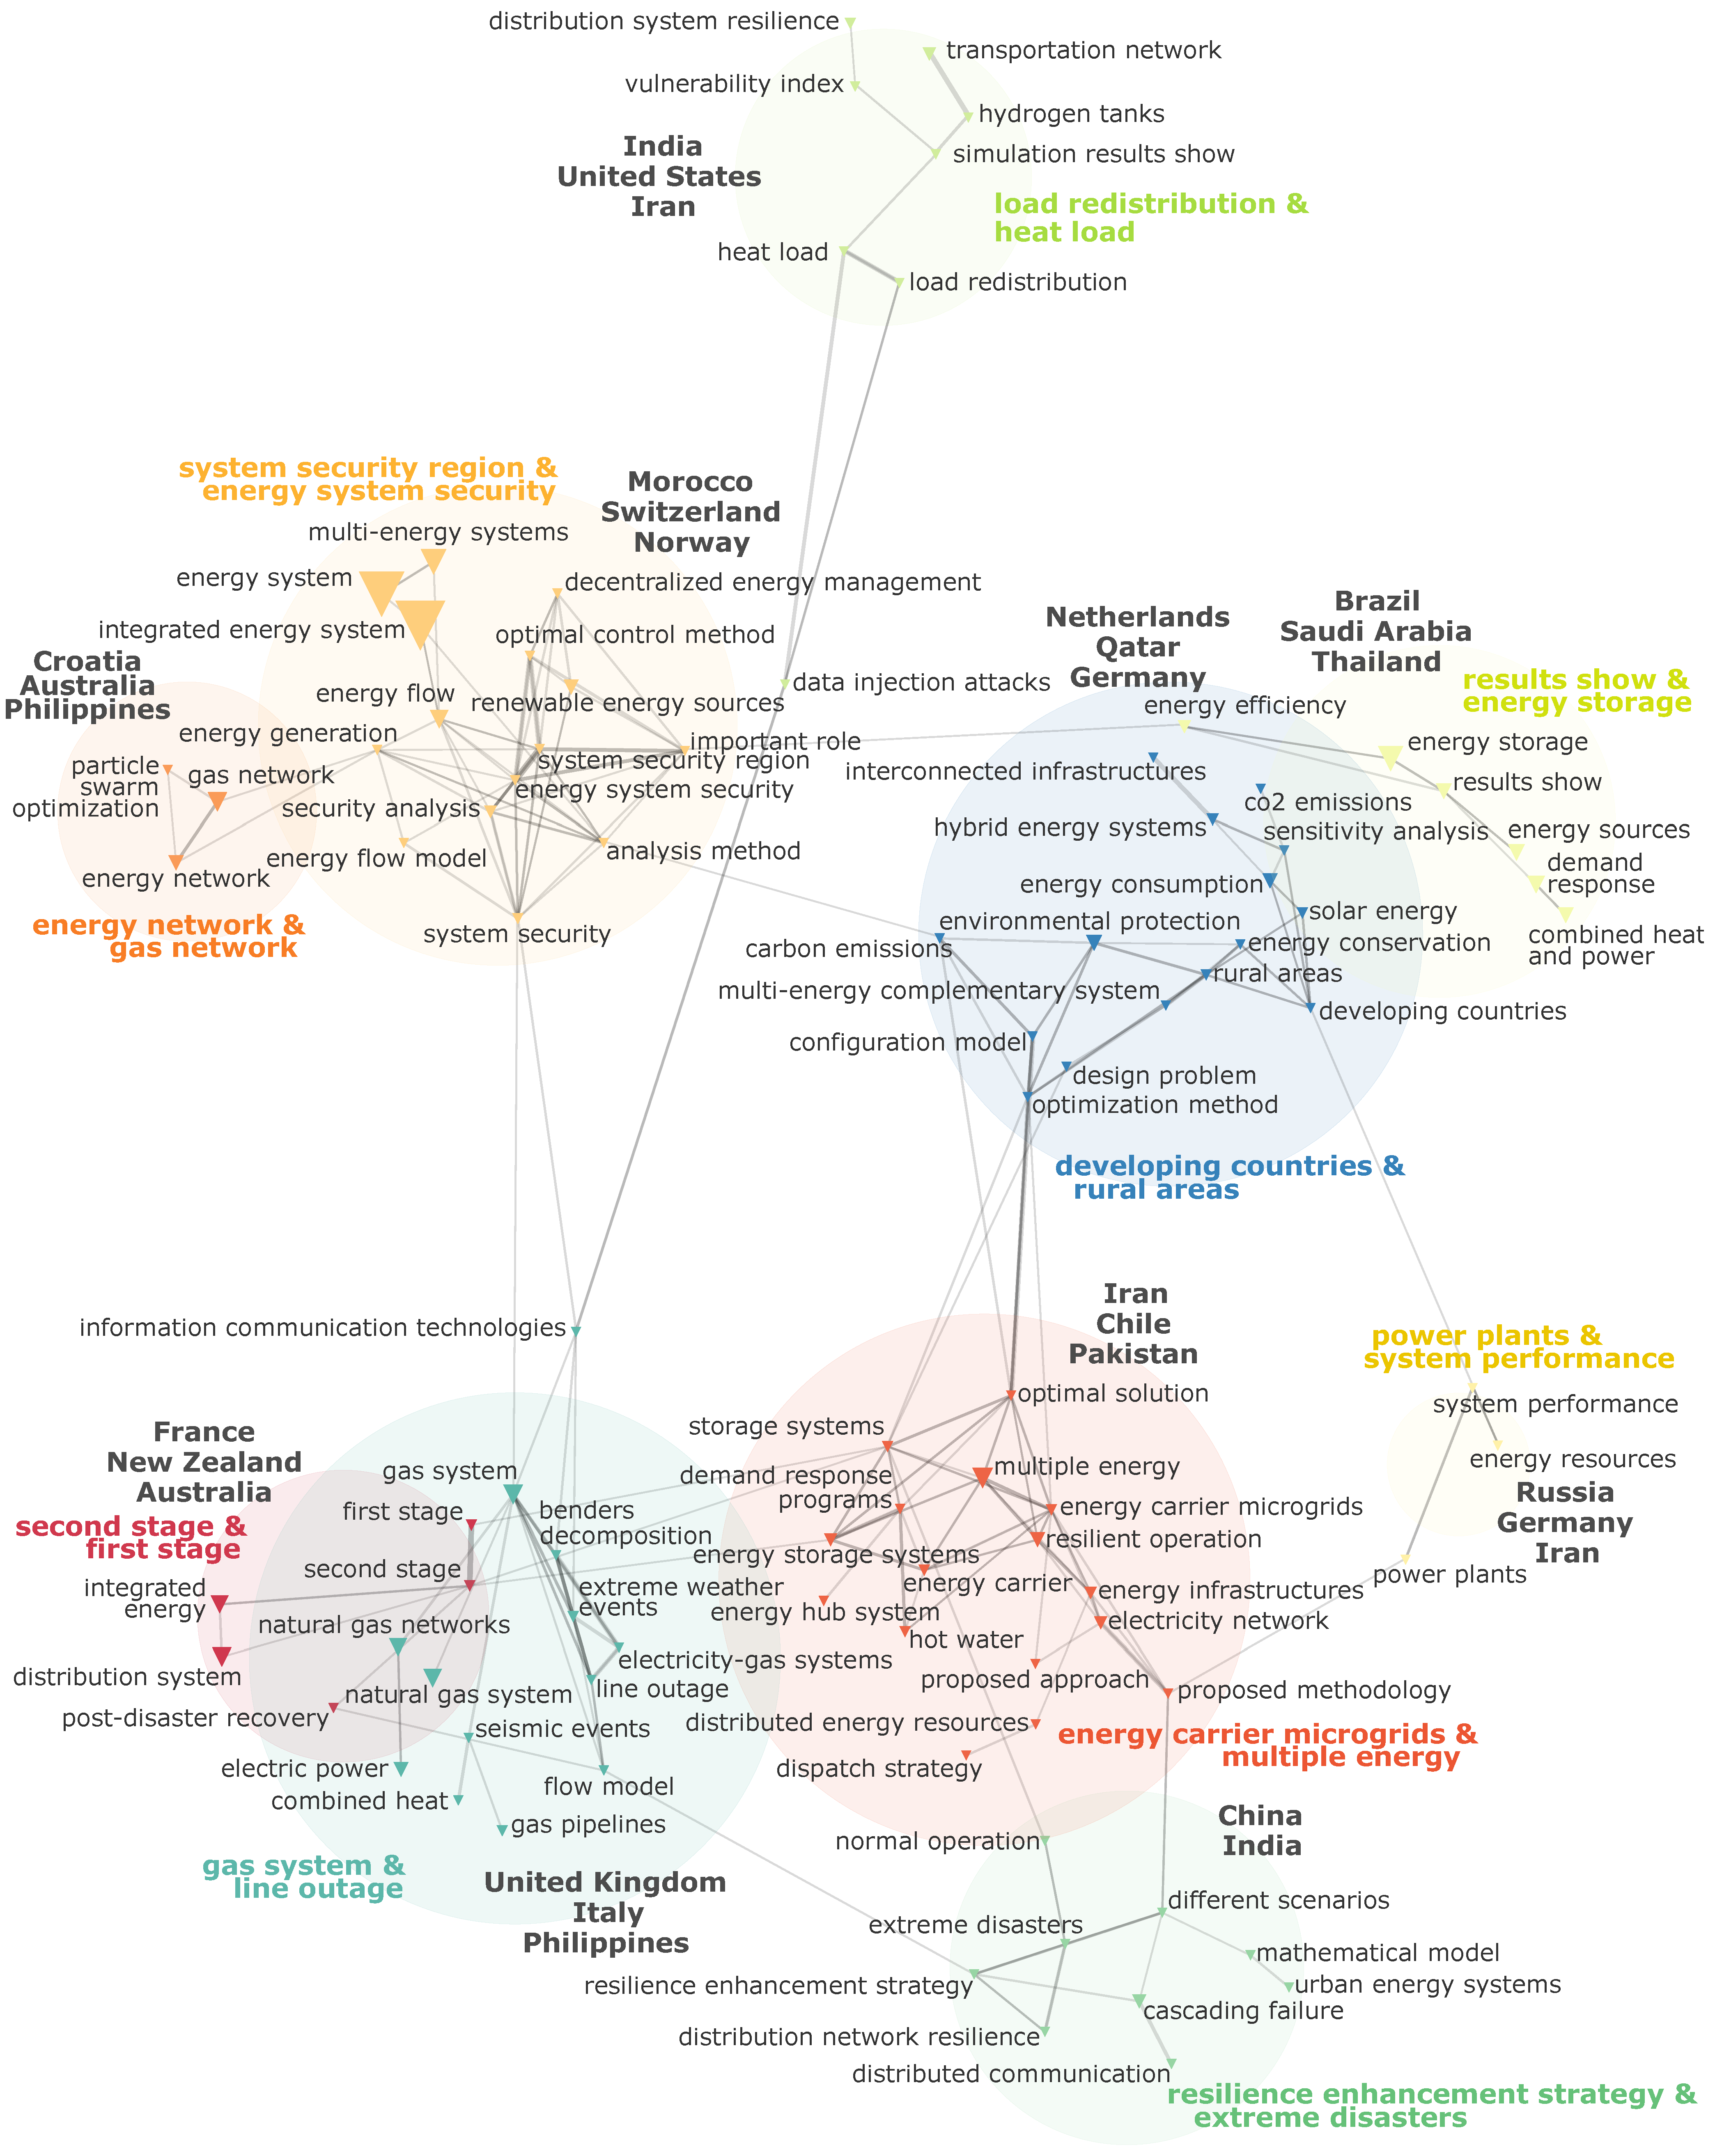
To identify textual correlations, a homogeneous network map based on the extracted 100 terms was created in CorTexT using the robust distributional proximity measure for edges. The network map involves nodes, clusters, edges, and country labels. Nodes represent commonly occurring terms with larger sizes indicating higher occurrence frequencies. Clusters represent thematic groupings based on the terms content with the size reflecting the number of terms. Edge lengths represent the regularity in which the terms co-occur. Lastly, the top three countries are presented for each cluster, where the country corresponds to first author affiliations.
For the in-depth analyses, classification categories were selected based on the study’s objectives and refined based on the contextual overview results. Table 2 summarizes the discrete categories selected for classifying each document, including physical systems and research approaches. Across physical systems, we included five categories. For energy class, the systems were classified as nonrenewable/carbon-producing if fossil fuels were included; renewable/carbon-producing if all source energies were renewable, but at least one produces GHG emissions directly through its use (e.g., burning biofuel for heat/electricity); and renewable/carbon-free if all source energies were renewable and none produce GHG emissions directly through their use (e.g., solar PV, wind turbine). Source energies that are not primary sources (e.g., grid, district heat) were not included when determining energy class because the these sources may include any combination of renewable and nonrenewable inputs.
Research approaches included 13 categories (Table 2). First, the scope was classified as equity only, resilience only, or both equity and resilience, where resilience papers included a fault, failure, or disruption beyond normal operation and equity papers address low-income, disadvantaged, rural, or island communities. For papers that included case studies involving real sites, we noted the geographical location of the case(s) as well as the scale, income, and climate classifications. The determination of “real” was set such that at least part of the system, loads, weather conditions, or failure scenarios involved location-specific information. The system scale varied across locations, from single buildings to districts and entire countries/regions, all of which MES can serve [48]. The World Bank’s public database on GNI per capita (most recent year) [57] provided country-level income classifications, while each climate classification reflected the Köppen-Geiger system [58]. Lastly, our analysis noted model formulations, simulation software tools, and key metrics employed across the literature.
To discern correlations between various discrete categories in Table 2, we analyzed the findings using standard statistical methods. These methods are critical to an unbiased review because they reduce reliance on subjective interpretation and enhance the transparency and reproducibility of the review process [53]. In this paper, Pearson’s χ 2 tests of independence [59] Equation (1) were performed to statistically state the presence or absence of differences between categories (e.g., correlations exist between scope and energy class) and determine which parameters account for the differences (e.g., equity papers are more likely to use renewable systems). To determine the applicability of the χ 2 test for each categorical pair and to minimize bias, minimum expected count frequencies followed the guidelines of Moore and McCabe [56] that 2 × 2 tables (i.e., degrees of freedom d f = 1 ) require “all four expected cell counts to be 5 or more”, while tables larger than 2 × 2 required “the average of the expected counts [to be] 5 or more and the smallest expected count [to be] 1 or more” ([56], p. 631). As an indicator for statistical significance (i.e., whether the observed differences are real or only due to chance), p-values were calculated based on χ 2 and d f . Alpha was set at 0.05 for all statistical analyses, with p 0.001 for highly significant differences, 0.001 < p 0.01 for significant differences, and 0.01 < p 0.05 for weakly significant differences. As an example, p 0.05 indicates that there is strong evidence that the observed differences are not due to chance (i.e., there is less than a 5% probability that the observed results are random).

3. Results

In total, 211 documents were included in the detailed technical review, published from 1997 to 2023. Spanning lower-middle to high income countries, the document authors were geographically dispersed across predominately Asia, Europe, and North America, spanning 26 countries with 56 publications involving multi-national author affiliations. Top publication sources included Applied Energy ( n = 22 ), Energy ( n = 13 ), Energies ( n = 10 ), and IEEE Transactions on Power Systems ( n = 10 ). The following sections present the overarching contextual results (Section 3.1), followed by detailed summaries with respect to physical systems (Section 3.2) and research approaches (Section 3.3).
Several categorical pairs produced statistically significant differences across the variables listed in Table 2. For example, equity papers were statistically more likely to have case studies in lower income countries than resilience papers (significant, p = 0.007 ), which follows expectations. For other categories, statistical correlations are presented in their relevant sections below. Detailed results across all categories involving at least one statistically significant correlation are summarized in Appendix A (Table A1, Table A2 and Table A3).

3.1. Contextual Overview

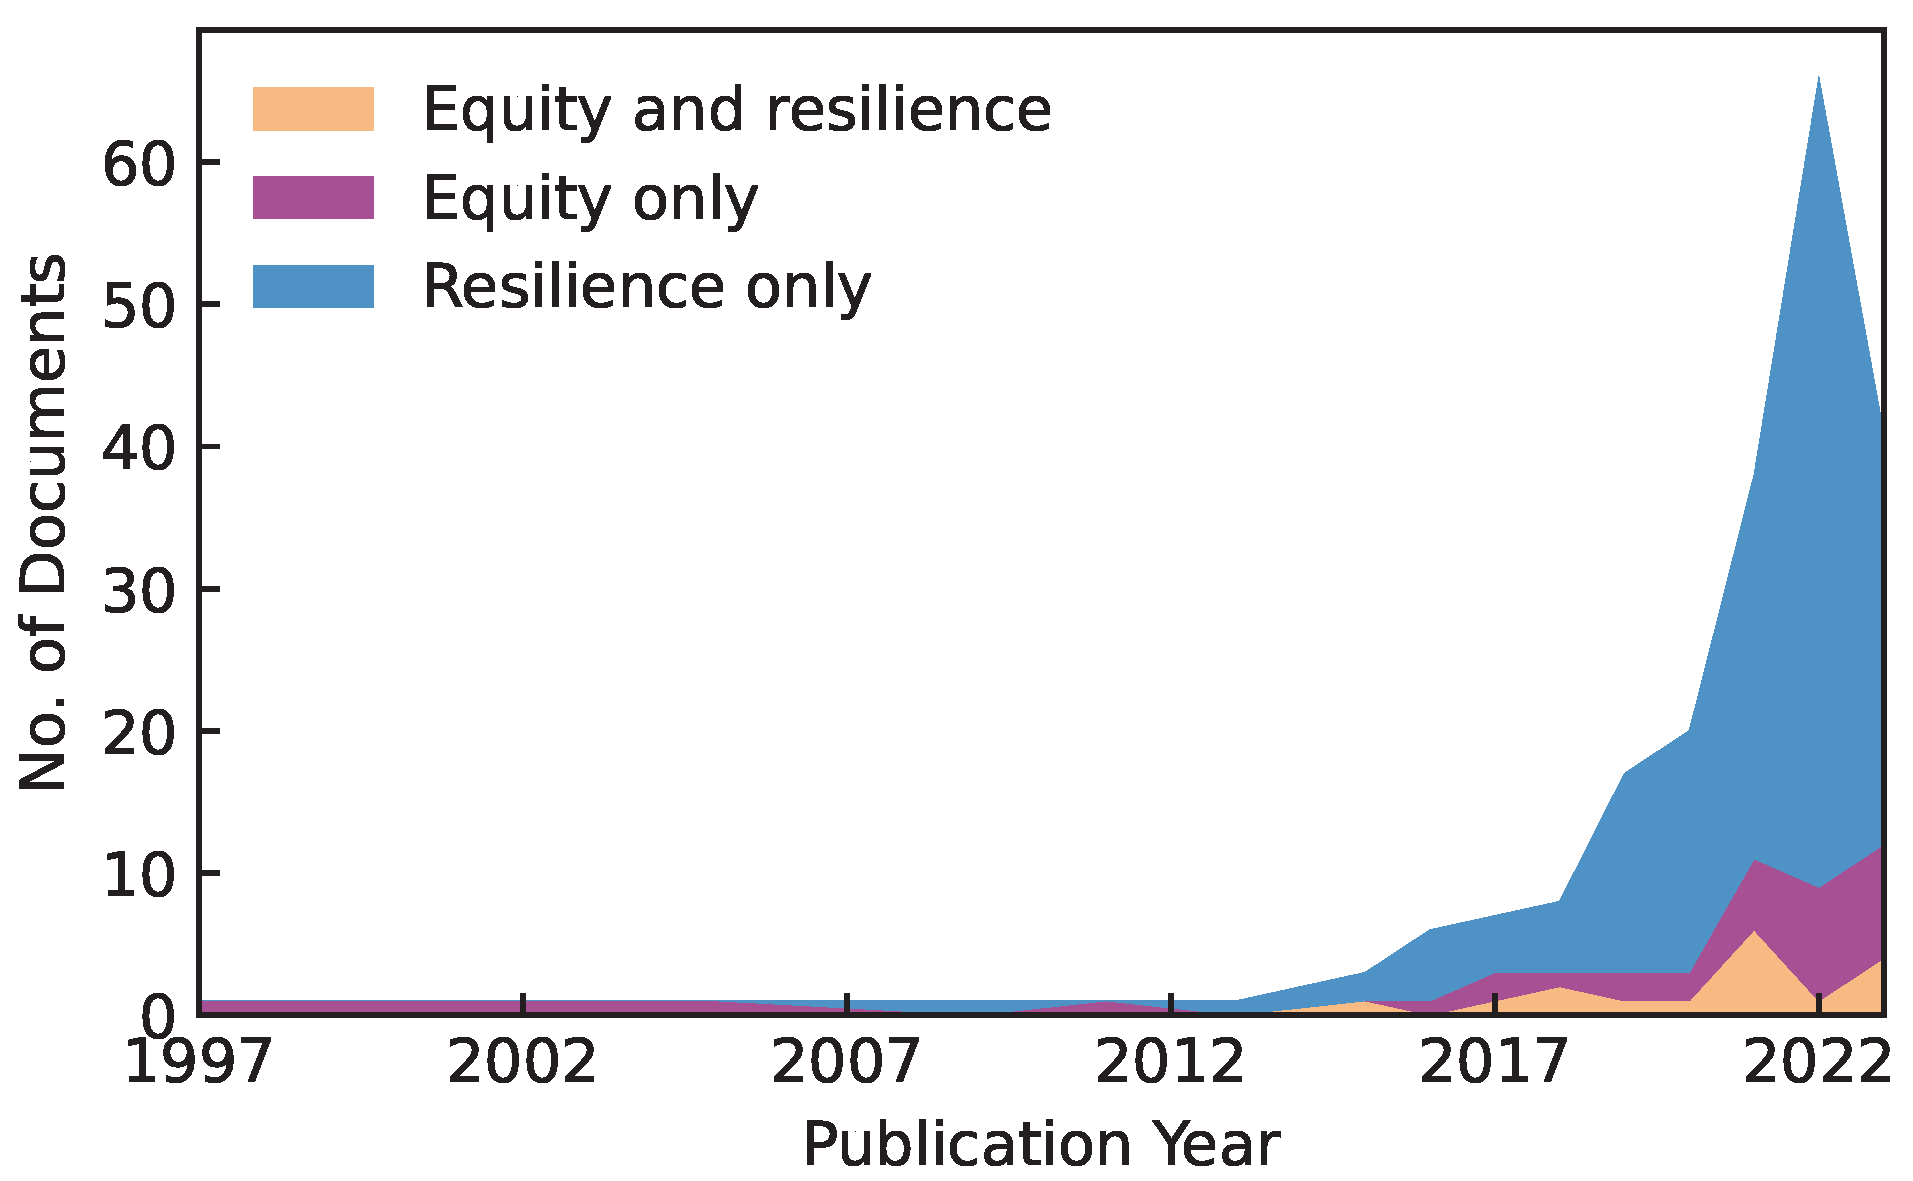
Of the 211 documents, 77% focused on resilience only, while 15% involved equity only and the remaining 8% covered both, with the overall number of publications increasing overtime (Figure 4). Resilience-only documents have seen considerable growth in publications per year since 2016. Meanwhile, equity only publications began to increase more recently (since 2021). The number of equity and resilience publications were greatest in 2021 but have yet to experience notable growth.
Table 3 presents the top ten most frequently occurring terms, beyond original search criteria (e.g., “energy system”, “multi-energy system”, “resilient operation”) and common single energy system terms (e.g., “gas network”, “energy sources”, “energy flow”). Across all terms, “energy storage” was the most frequently occurring ( n = 41 ). Common physical system references included CHP, “transportation network”, and “distributed energy resources”. These terms also reflect an interest in control actions (“demand response”); failure types (“cascading” and “extreme weather”); and environmental considerations (“renewable energy”, “environmental protection”, and “CO2 emissions”).
Further clustering the top 100 terms as a homogeneous network map, Figure 5 depicts ten thematic categories, their interrelationships, and common terms within and spanning each cluster. The three largest clusters by number of terms are “energy carrier microgrids & multiple energy” (16 terms), “system security region & energy system security” (15 terms), and “developing countries & rural areas” (15 terms). While the remaining analysis focuses on specific technical aspects, the bibliographic results here give a valuable picture of unbiased themes and common content across the full database.

3.2. Physical Systems

To understand the technical content in detail, the studies were first classified by the physical systems. Following the categorizations listed in Table 2, the review results are as follows.

3.2.1. Source Energies

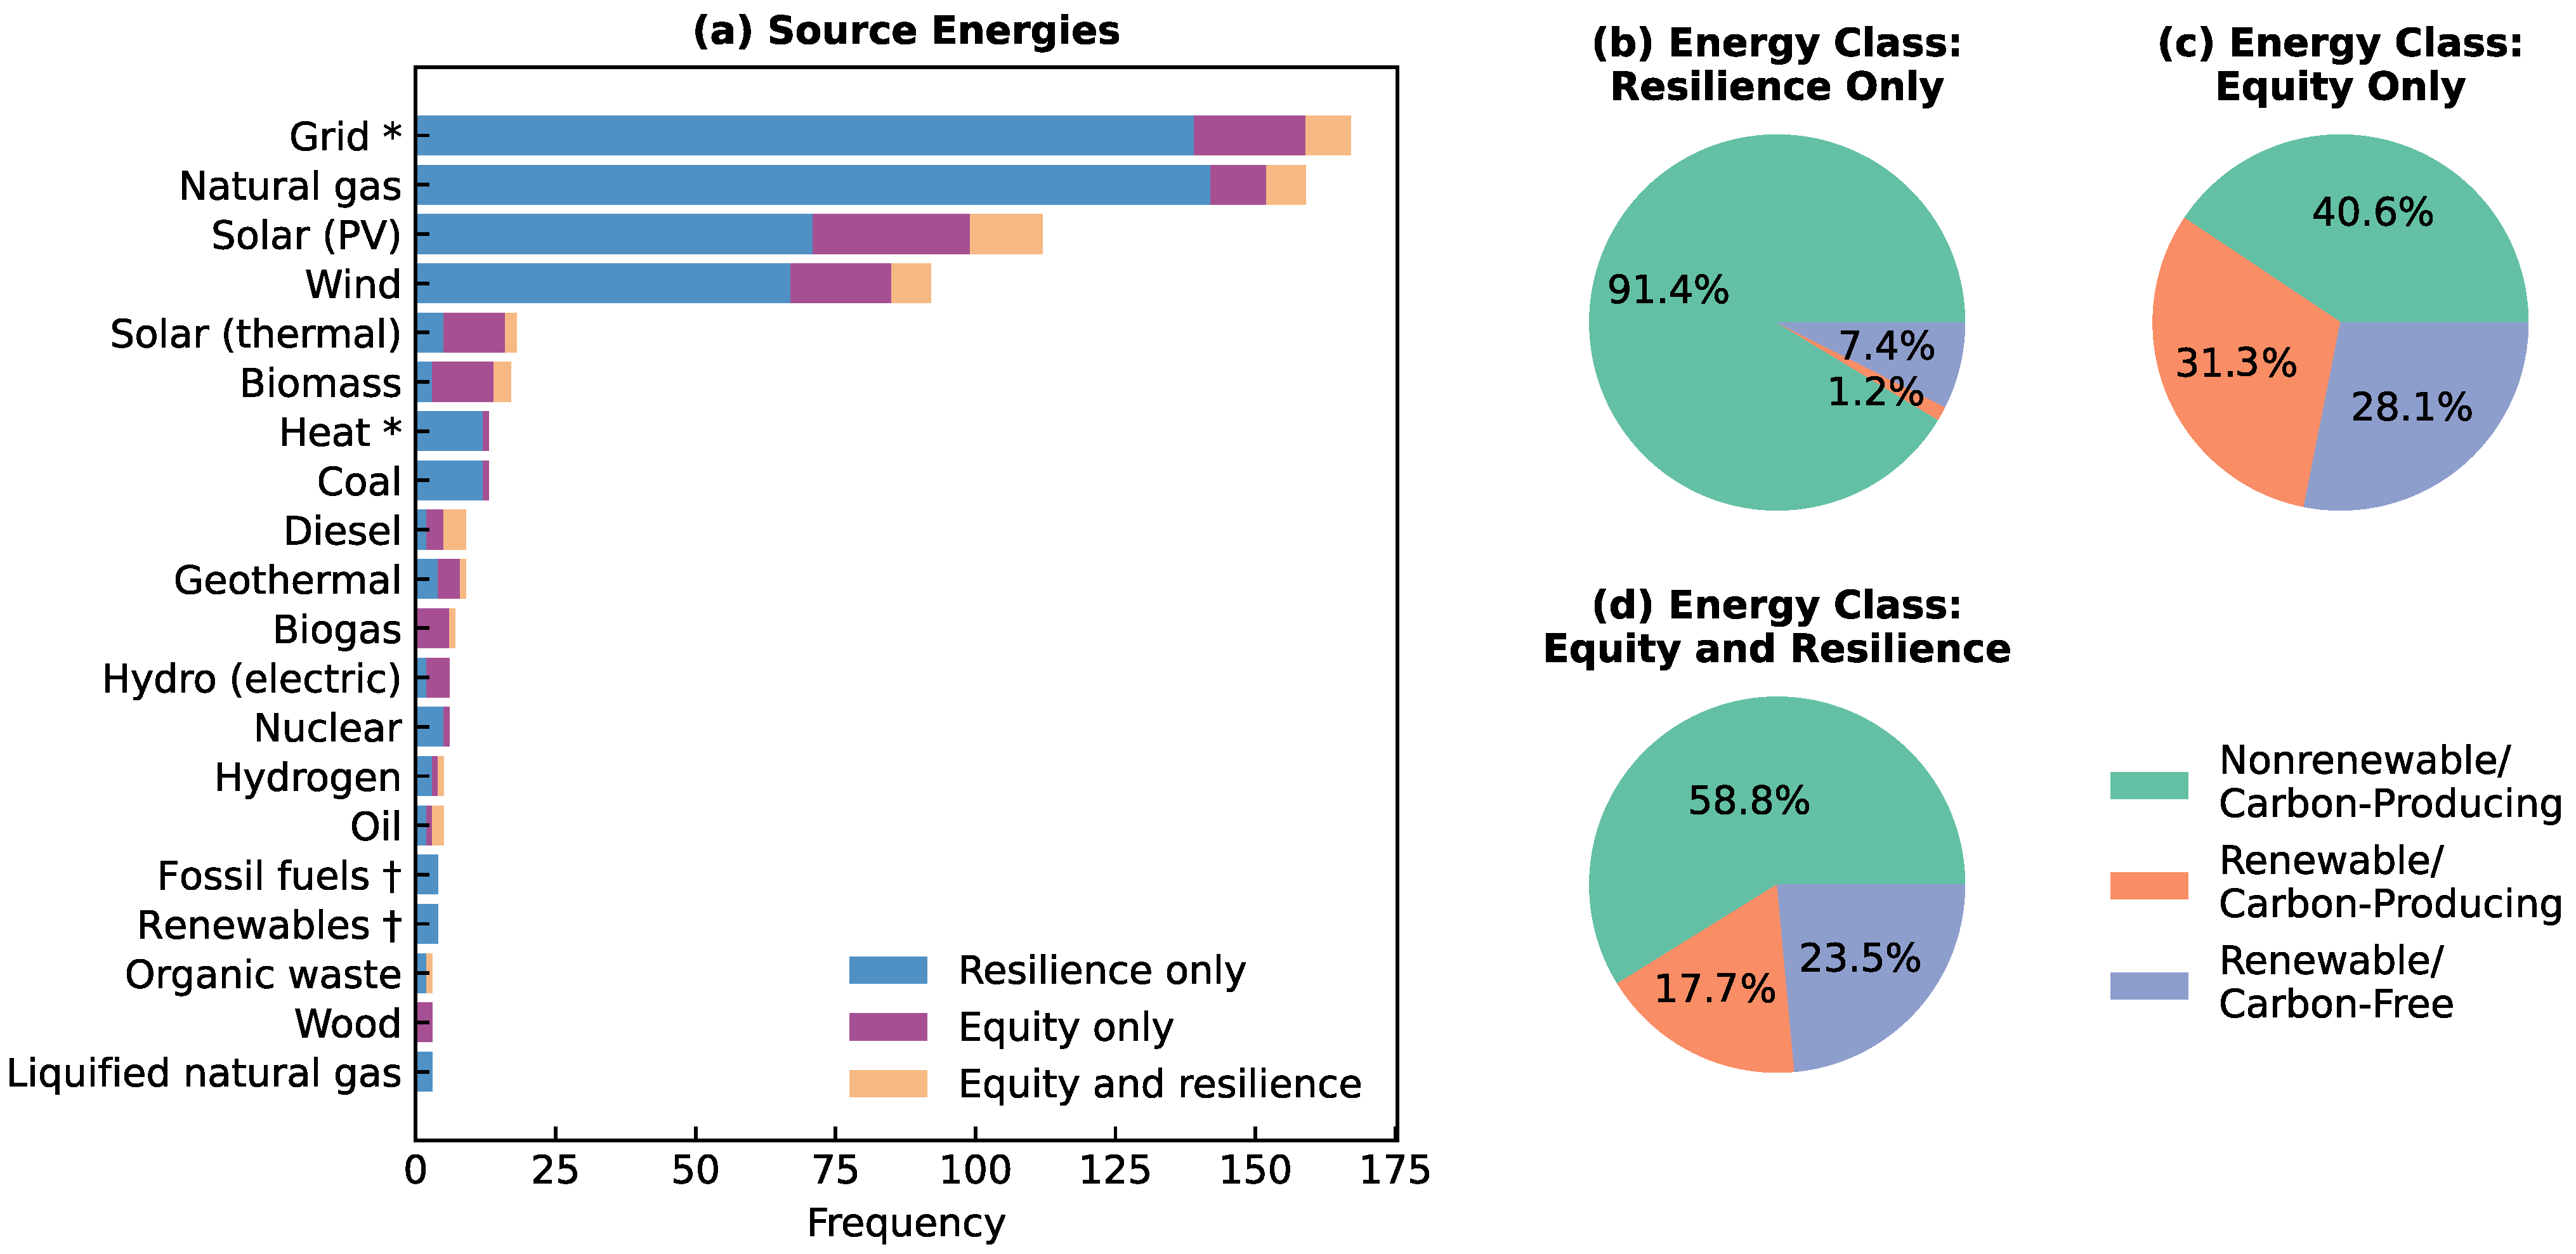
While 32 source energy types spanned all studies, natural gas, solar, and wind were the most dominant primary sources, in addition to indeterminate electric grid connections (Figure 6a). While a grid source input was listed (just as heat and hydrogen), the source energies for electricity, heat, and hydrogen generation were not always documented. As such, these inputs have the potential to be from renewable or nonrenewable sources. Among all studies, solar (PV) and wind (turbine) were the most common renewable sources. For equity only studies, solar (thermal) and biomass were also common.
Interestingly, Figure 6b–d further indicates statistically significant differences in system classes for decarbonization goals. Papers including equity were statically more likely to involve fully renewable energy systems (highly significant, p < 0.001 ). In particular, the majority of renewable/carbon-producing systems involved equity; the majority of nonrenewable/carbon-producing systems involved resilience; and renewable/carbon-free systems frequently involved equity and not resilience ( p < 0.001 ). Figure 6b,d shows these differences clearly, where 91% of case studies on resilience only involved nonrenewable/carbon-producing sources, while 59% of equity only studies were fully renewable (carbon-free and carbon-producing).
Further, energy class produced statistically weakly significant differences with respect to case study scale ( p = 0.025 ) and location income ( p = 0.011 ). Specifically, renewable/carbon-producing systems were more often considered for upper-middle and lower-middle income sites than high income sites. High income sites were statistically more likely to include either nonrenewable/carbon-producing or renewable/carbon-free systems.

3.2.2. Major Equipment

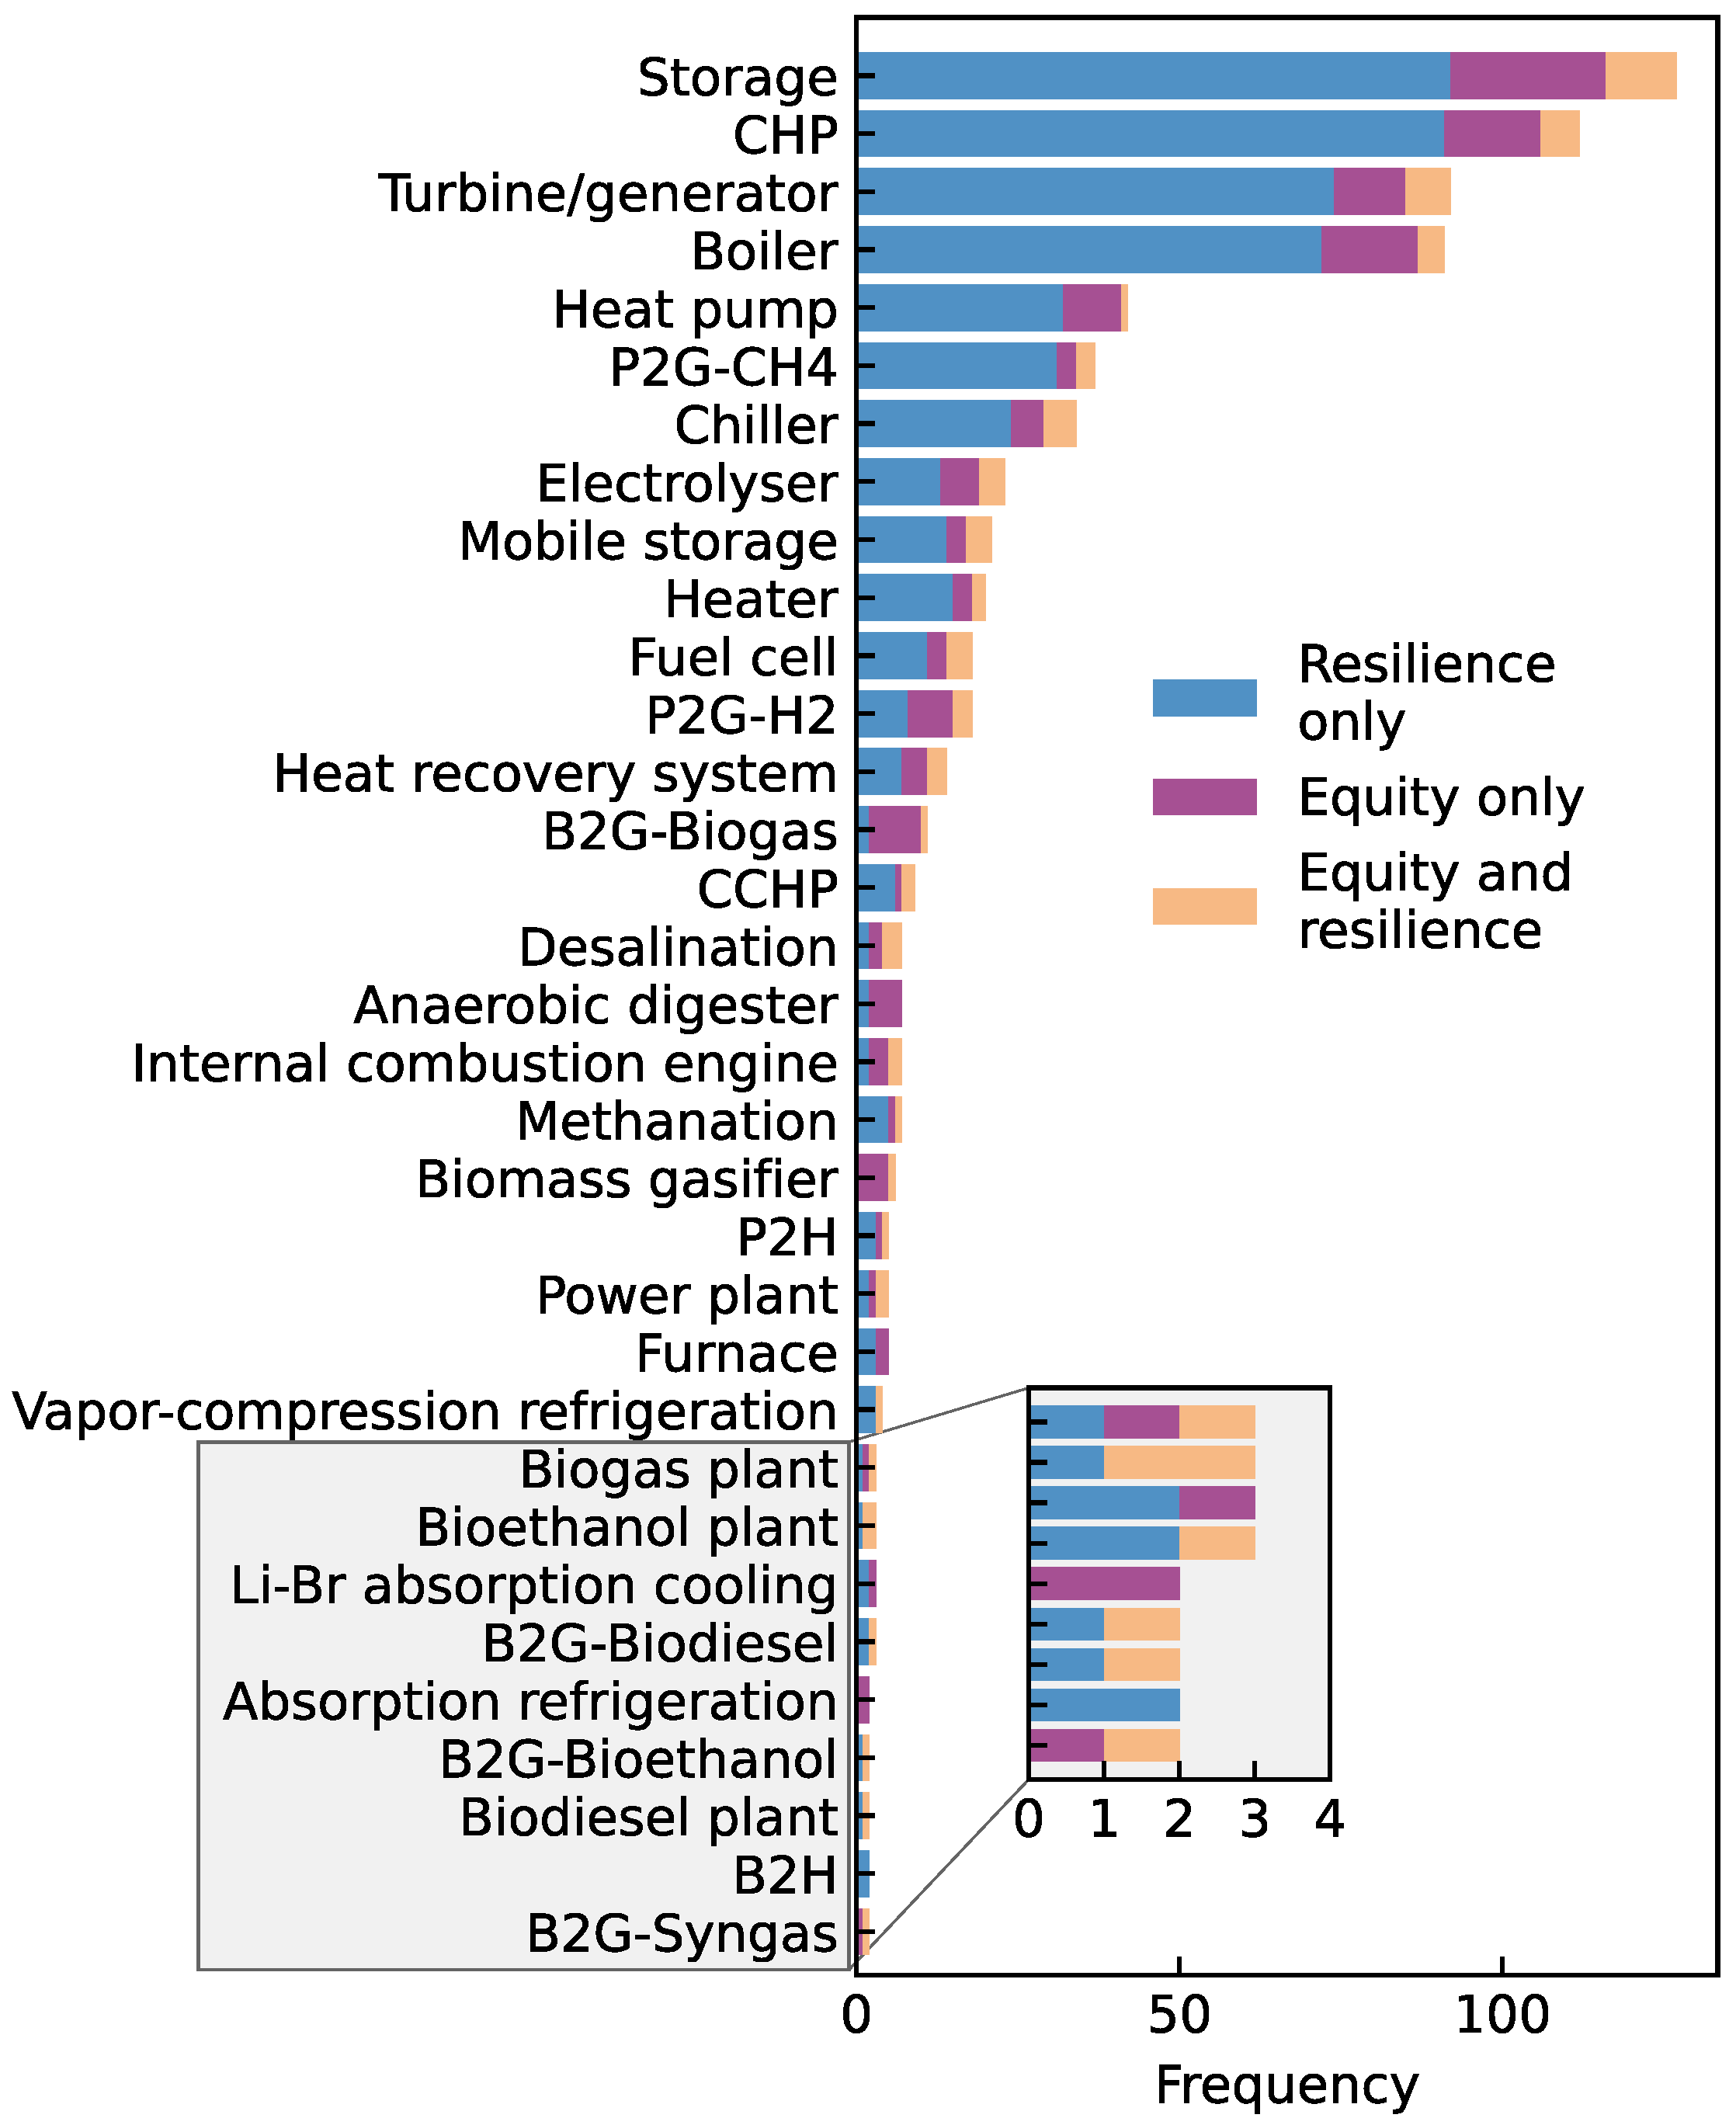
Researchers used a wide variety of multi-energy conversion and storage equipment that served gas, electric, heating, and cooling systems (Figure 7). Across all studies, 60% implemented at least one type of energy storage, and 53% involved CHP. More specifically, gas storage included natural gas/methane ( CH 4 ) [60,61,62], biogas [63,64,65], hydrogen ( H 2 ) [62,66,67,68], oxygen ( O 2 ) [69,70], carbon dioxide ( CO 2 ) [71], and gasoline [72]. Electric storage included chemical batteries [73,74,75] and fly wheels [76]). Heating storage included hot water [77,78,79], molten salt [80], and phase change materials [81]. Cooling storage included chilled water [82,83,84], ice [79,85,86], and molten salt [80]), while stratified thermal energy storage [87,88]) served both heating and cooling. Of all storage types, electric batteries ( n = 88 ), heating ( n = 68 ), natural gas/methane ( n = 36 ), cooling ( n = 30 ), and hydrogen ( n = 18 ) were most common. Regarding methane, some case studies included fossil-based natural gas while others were 100% renewable natural gas or a combination of the two.
Beyond static storage equipment, 21 papers leveraged mobile storage (e.g., trucks, buses, electric vehicles) to allow fewer resources to access more locations. Mobile storages were implemented independently of resilience and equity scopes. Of studies with mobile storage, electric vehicles were most common ( n = 13 ) [89,90,91], followed by plug-in hybrid electric vehicles ( n = 3 ) [77,92,93] and hydrogen gas trucks ( n = 3 ) [70,94,95]. Finally, two papers used more than one type of mobile energy storage. Sui et al. [86] implemented electric, ice, and water mobile storages in a post-disaster self-sustaining operational strategy for islands, while Tao et al. [96] evaluated the vulnerability of MES involving fuel cell vehicles and plug-in hybrid electric/hydrogen vehicles.
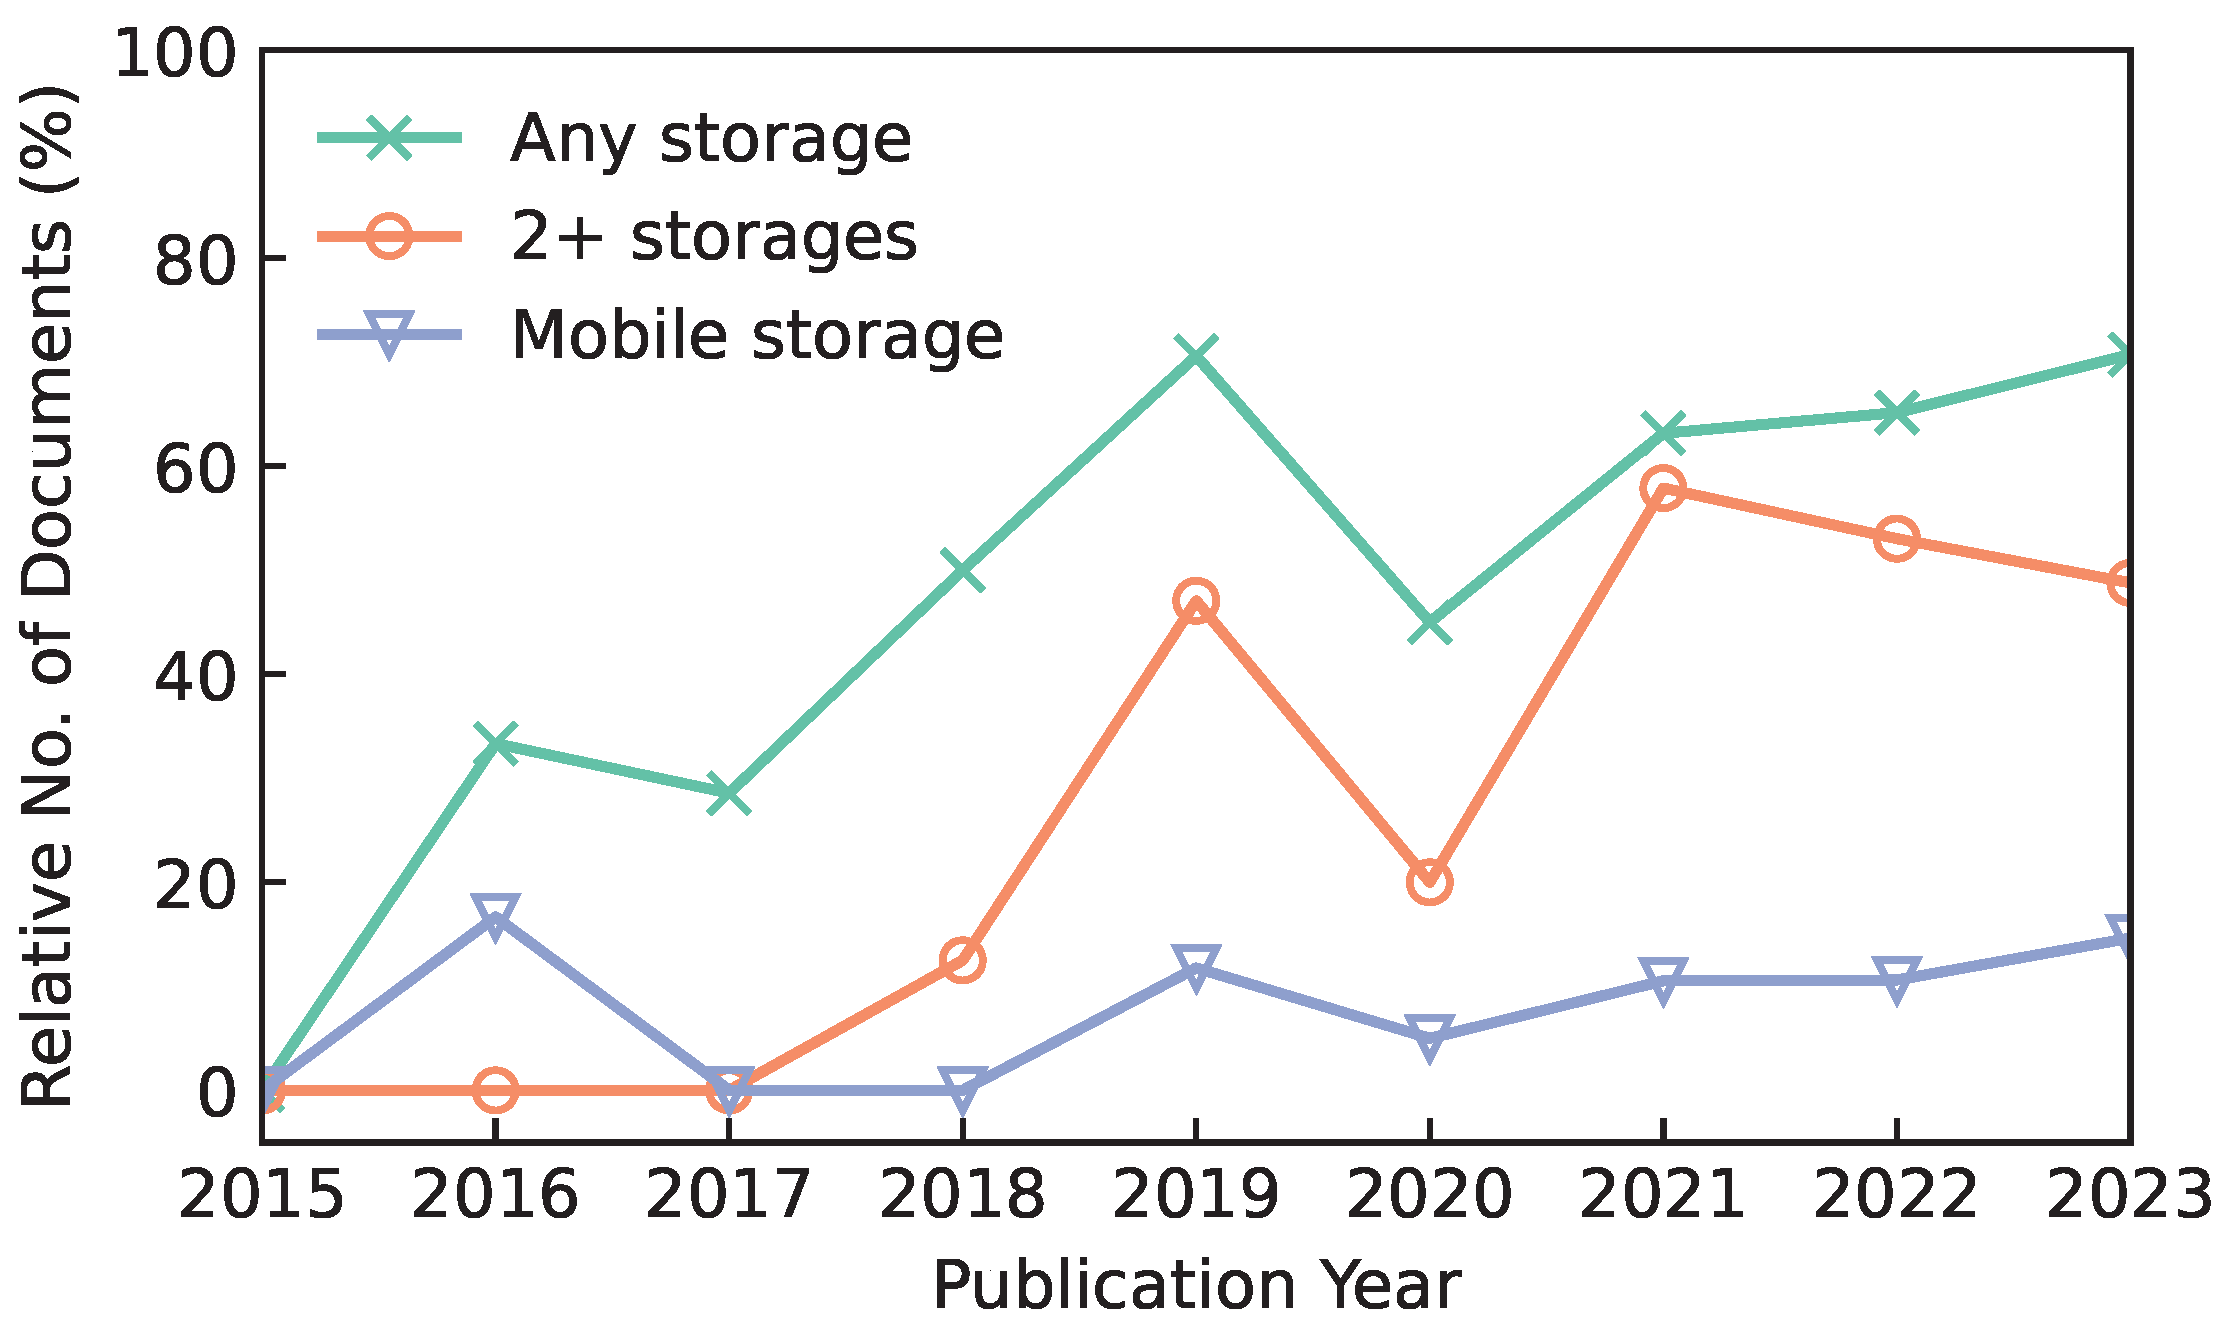
Further, the relative number of documents that include storage are increasing over time (Figure 8). Since the number of publications per year started increasing in 2015, the percentage of papers including either (1) any storage or (2) two or more storages has increased over time. For documents published in 2023 ( n = 41 ), 71% included storage, while 49% included two or more storage types. Prior to 2018, no documents included more than one storage type. Mobile storage has not seen significant growth to date and is included in 7.7% of the documents on average.
Spanning both equity and resilience perspectives, 31% of studies integrated sector coupling via power-to-X or biomass-to-X processes into the system design. Of all variants, power-to-gas with the gas as CH4/natural gas was most common ( n = 38 ), followed by power-to-gas producing H2 ( n = 18 ). Studies also captured heat through power-to-heat [67,97] and biomass-to-heat [98,99] processes, which may have been wasted otherwise. Across all biomass-to-gas studies ( n = 21 ), the “gas” included biogas [81,98,100], biodiesel [98,101], syngas [102,103], and others [98,99,101], such as bioethanol, biochar, glycerol, and methanol.
While further information regarding the various bio-fuels are available in [104,105], a brief description is as follows. A typical process to create CH 4 , the main component of natural gas, is to first produce H 2 from electricity via an electrolyser, and then convert H 2 to CH 4 via methanation. Anaerobic digestion produces biogas, which is mostly CH 4 and CO 2 . In contrast, syngas, produced via a biomass gasifier with wood chip [102] and straw [103] feedstocks, is mostly H 2 and carbon monoxide (CO), conventionally.

3.2.3. Networks and End Uses

Each paper included between two and seven network types (Figure 9), representing the complexity of the MES. While the networks and end uses represented a wide variety of energy types, the most dominant were electric ( n = 207 ), heating ( n = 138 ), and natural gas/methane ( n = 122 ), followed by cooling ( n = 42 ) and hydrogen ( n = 18 ). Across networks, the case studies included 24 different energy types overall. Providing fuel for building, industrial, and transportation applications, gas-based networks beyond natural gas included hydrogen [66,106,107], biogas/biodiesel/bioethanol [64,65,98,101], and oxygen [69,70]. Beyond energy, some integrated transportation [86,95,108] and information [109] networks for multi-infrastructure perspectives.

3.3. Research Approaches

After classifying physical systems, the studies were evaluated for their research approaches. The review scope included case study locations, modeling and optimization formulations, software tools, and key performance metrics, while emphasizing both resilience and equity perspectives. The results are as follows.

3.3.1. Case Study Locations

For the case study, 43% ( n = 90 ) of the papers studied real geographical locations, from a specific building to multi-country regions. Figure 10 depicts the geographical distribution of these 90 studies with respect to country-level income classification. One of the most notable findings was that the income level of the case study location and energy class (i.e., renewable/nonrenewable, carbon-free/producing) produced statically weakly significant results ( p = 0.011 ). Lower-middle and upper-middle income countries tended to adopt renewable/carbon-producing energy systems more frequently than high income countries. Renewable/carbon-free systems were statistically favored by high and lower-middle income counties. Meanwhile, nonrenewable/carbon-producing energy systems most frequently involved high income countries. None of the case studies involved low income countries.
Based on the Köppen-Geiger Classification [58], the case study locations spanned all major climate groups, with 61% involving moderate warm temperate climates (Table 4). In contrast, case studies in the extreme Climate Groups A (Tropical) and E (Polar) were generally lacking ( n = 7 ). Among these seven studies, all involved nonrenewable/carbon-producing energy systems except Iniyan and Jagadeesan [110], which considered renewable/carbon-producing systems. Equatorial case studies included Thailand [60], an isolated low-latitude island in the South China Sea [111], India [110], Vietnam [112], and Bali [113]. Polar case studies included several Arctic countries [76] and Patagonia, Chile [114].

3.3.2. Mathematical Models and Simulation Tools

A variety of mathematical models were solved across this review’s body of research, including both steady state and dynamic models, stochastic and deterministic formulations, and linear and nonlinear systems of equations. Most commonly, 45% ( n = 96 ) of all included studies described the mathematical problem as a variant of mixed integer programming (MIP), with mixed integer linear programming (MILP) being most dominant ( n = 67 ). To solve these models, researchers employed 24 different software environments and programming languages. Among commercial software, MATLAB ( n = 62 ), HOMER ( n = 4 ), PowerFactory ( n = 3 ), and Engineering Equation Solver ( n = 2 ) were most common. The most common open-source software included YALMIP ( n = 15 ), Python ( n = 9 ), and Julia ( n = 2 ). Additionally, the literature also implemented GAMS ( n = 39 ) and Modelica ( n = 3 ), which are generic programming languages with both commercial and open-source environments available.
The analysis revealed interesting similarities and differences in modeling and simulation approaches across resilience and equity perspectives. Among the similarities, the selected method to factor multiple optimization objectives had indistinguishable variance across most categories, including energy class, scope, scale, and location. Most multi-objective optimization research in this review used levels or stages procedurally or mathematically to account for different objectives within one or multiple operation modes (e.g., normal undisturbed, response, recovery).
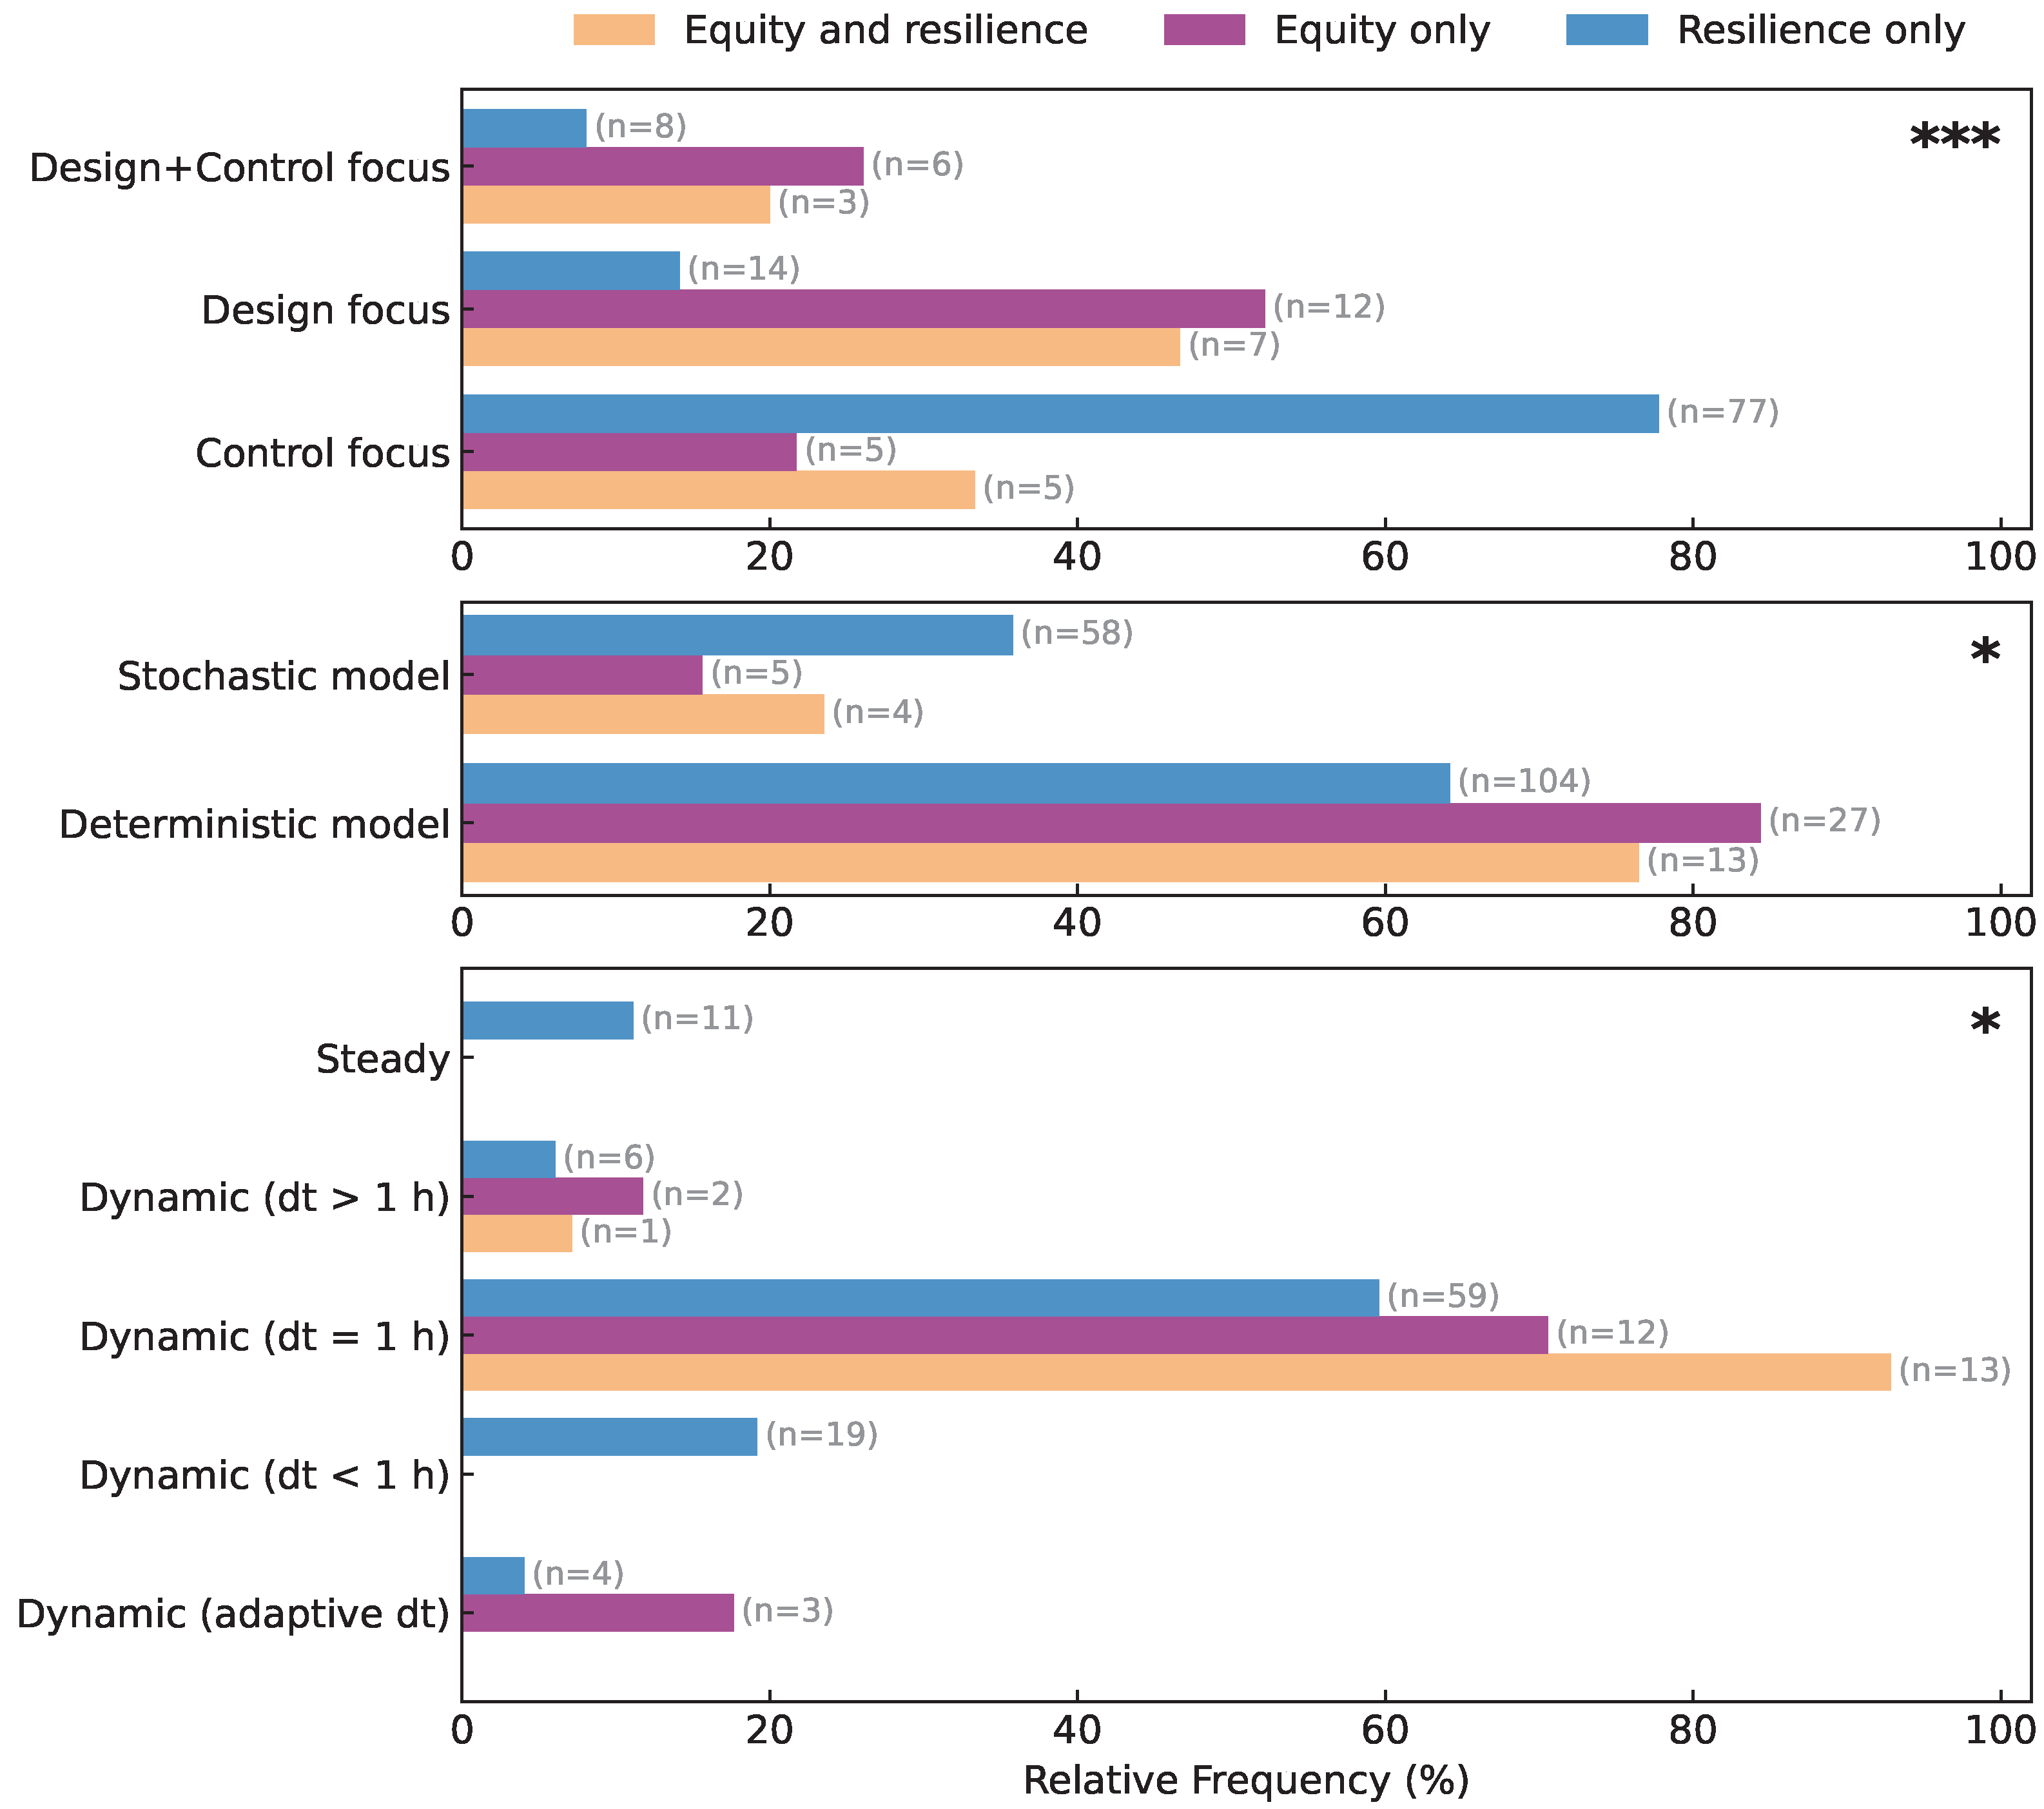
Among the differences, three modeling aspects diverged between equity and resilience lenses with statistical significance, as shown in Figure 11. Specifically, resilience only papers tended to focus on control actions, while equity only papers centered around design (highly significant, p < 0.001 ). Equity papers tended to be deterministic, while stochastic modeling was statistically more prevalent with resilience only papers (weakly significant, p = 0.029 ). Lastly, equity papers included dynamic models with adaptive time step solvers more frequently than expected, while a one-hour time step dominates the body of literature (weakly significant, p = 0.038 ). Uniquely, one work [61] implemented dynamic models discretized across state-space rather than time, obtained via Laplace transform, which enabled reasonable approximations of high frequency power system dynamics alongside low frequency gas dynamics. Similarly, the adaptive time-step solvers that a few works adopted [115,116,117] produces comparable computational benefits for stiff mathematical problems, such as common with MES.

3.3.3. Key Indicators and Metrics

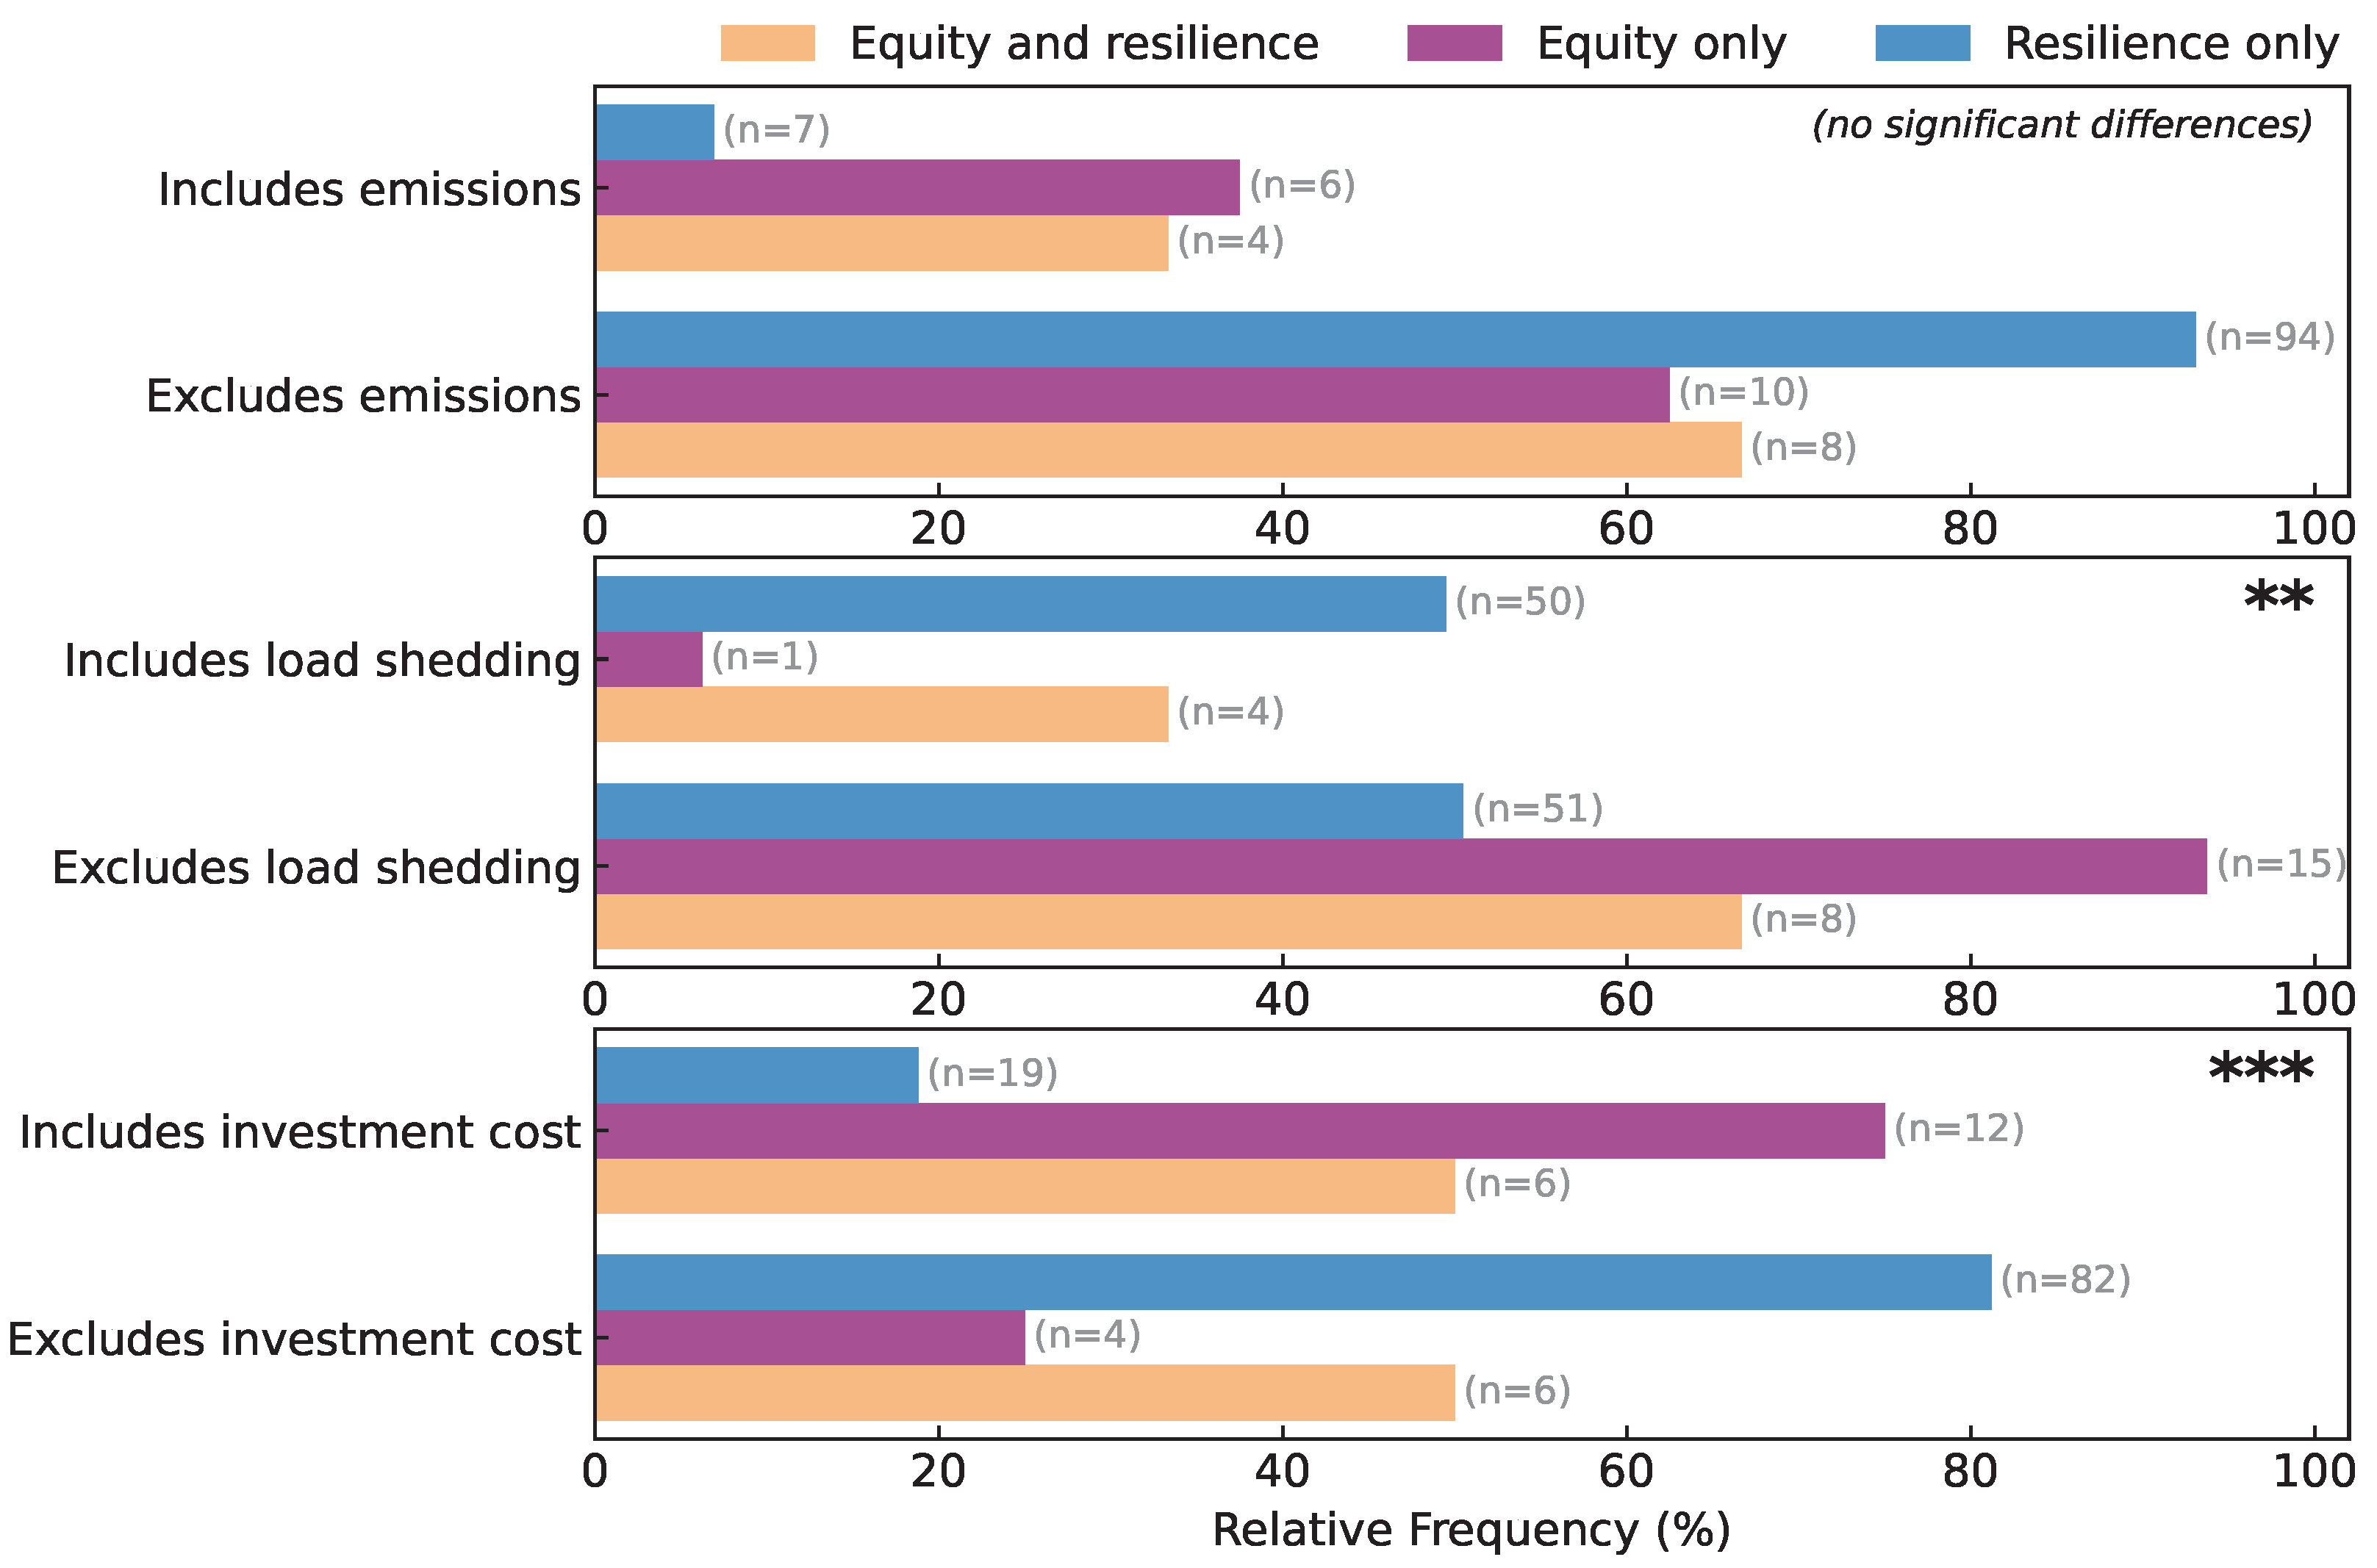
Among optimization objectives, important divergences arose, as shown in Figure 12. Specifically, equity rarely included load shedding, while it was common with resilience (weakly significant, p = 0.013 ). Investment costs were more commonly included as an optimization objective with equity than resilience (highly significant, p < 0.001 ). Beyond these key differences, the optimization objectives in general featured an unexpected high degree of uniformity across the body of literature. Among studies that included optimization, 66% ( n = 85 ) minimized a cost metric only; 19% ( n = 25 ) minimized/maximized a cost metric and something else; and the remainder ( n = 19 ) optimized a non-cost metric only. Common non-cost objectives included power (real, loss of power supply probability (LPSP), load shed, load restored), energy (renewable curtailment, expected not supplied/served, state of charge), and emissions (carbon, greenhouse gas). Unique objectives included Conditional Value-at-Risk (CVaR) [89], exergy efficiency [118], resilience index (R) [119], social welfare [120], and temperatures (deviations from setpoint [121], indoor air [16]).
Considering key performance indicators more generally, cost-based metrics dominated across the body of literature, particularly for equity-focused works. Financial metrics were calculated on several bases, including investment cost [14,122,123], operational cost [60,64,66,88,92,124,125,126], investment and operations [83,112,127,128,129], maintenance/repair [70,130,131], taxes [64,74,132], penalties [63,75,86,133,134,135,136], life cycle cost [137,138,139,140], net present value [67,74,138,141,142], levelized cost of energy [91,100], and payback period [138,143].
From a resilience perspective, several important metrics recurred across the literature. These include LPSP [67,103,144] and loss of load probability (LOLP) [145,146,147,148]; expected energy not supplied (EENS) [79,146,147] and expected energy unserved (EEU) [120,145]; System average interruption frequency index (SAIFI) [79,147,149] and system average interruption duration index (SAIDI) [79,147]; and CVaR [77,89,149,150]. While interested readers can find more information on the above metrics, their equations, and how to solve them in Billinton and Li [151], a brief description is as follows. First, LPSP gives the ratio of energy not supplied by a generation system over the total energy demand [127], LOLP is the probability that load demand will be higher than the capacity of a generation system [152]. Second, EENS (or EEU) represents the expected amount of energy that all the generating units (multi-energy or stand-alone) cannot provide for the end users during a period of time due to insufficient capacity (i.e., deficit) or unexpected power outages [153]. Third, SAIFI indicates how many interruptions a customer experiences during a period, while SAIDI quantifies the amount of time the interruption lasts in a period (usually a year) [154]. Lastly, CVaR quantifies the expected loss in system performance beyond a given threshold of extreme events (i.e., the tail risk events) [155] and is used for both renewable energy uncertainty and low-probability-high-impact events. In their implementations, these resiliency metrics are used as design indicators for reliability, as optimization constraints, and in optimization objective functions.
In addition to these resilience and reliability metrics, several researchers adopted a Resilience Index (R) as a high system-level performance metric. Typically, R is a normalized ratio that reflects the ability of a system to respond to and recover from a disturbance. The literature evaluates R on both power ( R P ) [119,156,157,158] and energy ( R E ) [15,78,131,159,160] bases, which can be represented as
R P = i w i P i , actual i w i P i , undisturbed and
R E = i t 0 t f P i , actual d t i t 0 t f P i , undisturbed d t ,
where i is a component index, P is the power at time t occurring over the time horizon t [ t 0 , t f ) , and w is a weighting factor for component i. The powers are summed over all components (e.g., consuming devices, generation units, storage devices) in the system. At times, equal weights are assumed across all components [156], eliminating the w terms. Quantitatively, R = 1 indicates ideal, uncompromised performance despite a disturbance event (i.e., high resiliency); R 0 as systems fail or under-perform (i.e., worsening resiliency); and R = 0 for complete failure.
Across all studies that calculated R, Figure 13 shows the distribution of results with respect to the number of network types and system version (i.e., a baseline vs. a proposed model with improvements). Across all network sizes, the mean R increased between baseline and proposed MES, with the largest improvements occurring in two-network (72.7% improvement) and three-network (38.2% improvement) MES. Across all studies, R increased 31.6% on average between baseline and proposed MES.
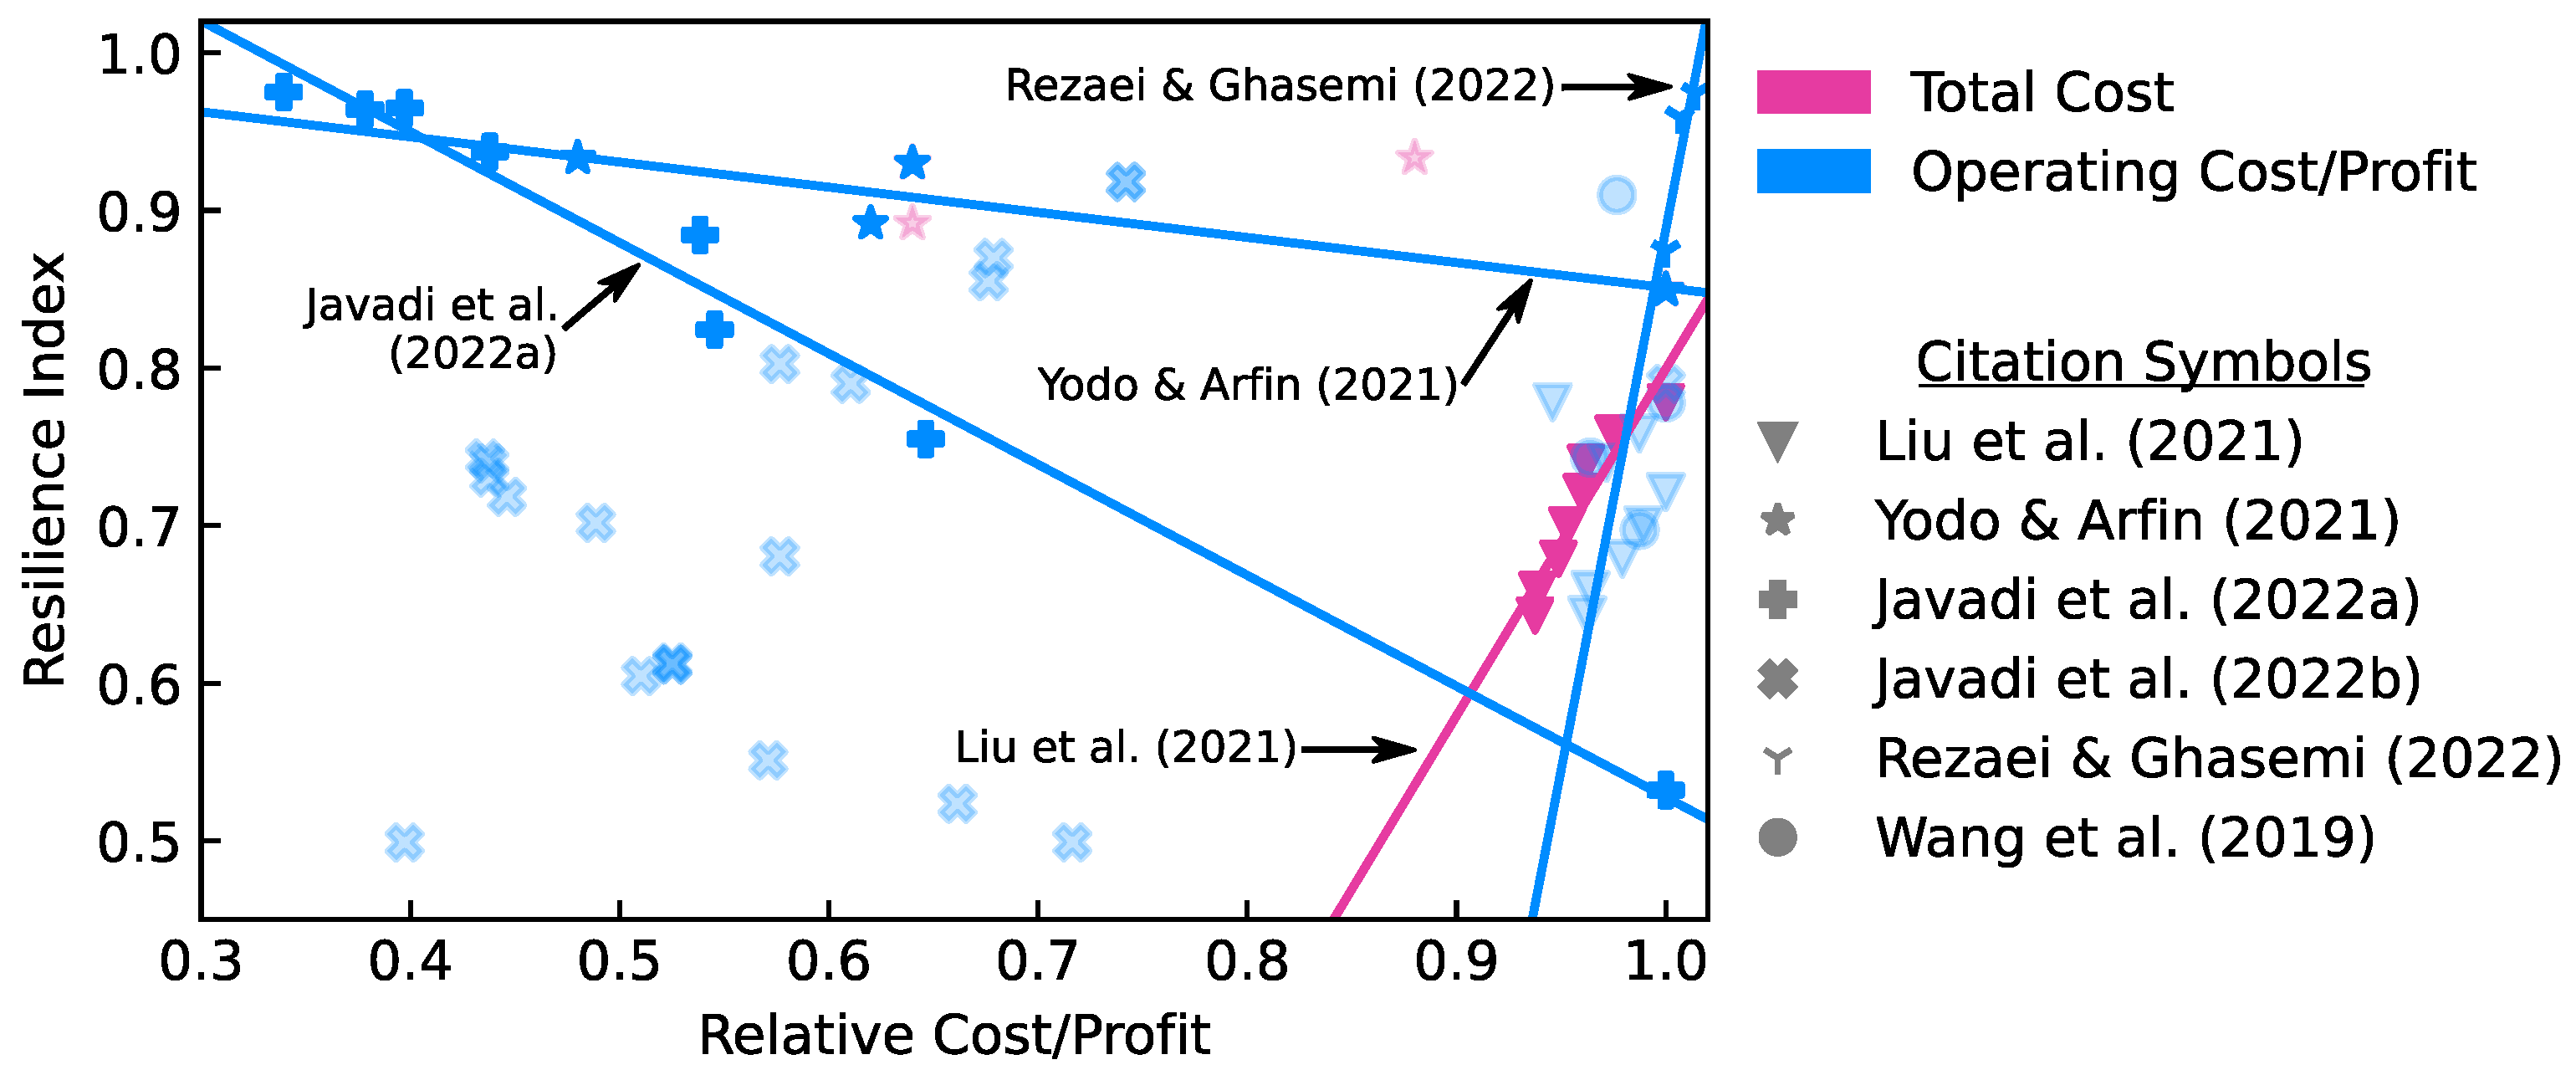
Further, some studies evaluated both R and financial performance. As shown in Figure 14, four studies found correlations between financial metrics (operating cost, profit, or total cost) and R. With increasing R (more resiliency), operating costs decreased and operating profits increased. In contrast, total cost—which included both initial investments and operating costs—tended to increase with respect to R. For studies that found mutual benefits between resilience and operational costs, Javadi et al. [157] optimized energy hub scheduling, while Yodo and Arfin added microgrids to the MES under cost constraints [131]. However with that said, a surprisingly small number of studies evaluated both R and a cost-based metric (or a different two independent metrics), which limits the potential for cross-study quantitative comparison.

4. Discussion

4.1. Contributions

This review provides a comprehensive synthesis of the current state of MES research with respect to resiliency and equity, which are increasingly critical perspectives in the context of climate change and sustainable energy transitions. While other review papers address various aspects of MES (e.g., concepts [48], resilience modeling [18], and climate change adaption [17]), this work is the first to identify synergies and divergences between resilience and equity perspectives, which proved valuable. Further, this review is one of the first among the MES literature to apply a systematic statistical analysis methodology, providing a generalizable approach for unbiased analysis of patterns and gaps. Among specific finding, a key contribution of this review is the identification of statistically significant differences in how MES are approached depending on whether the focus is on resilience, equity, or both. Research approaches diverged for case study locations (income level), model formulations (design/control focus, stochastic/deterministic, dynamics), and optimization objectives (investment costs, load shedding). Critically, studies incorporating equity considerations were found to significantly favor fully renewable energy systems (Figure 6), suggesting a strong alignment between equity goals and decarbonization efforts. In contrast, resilience-focused studies more frequently relied on nonrenewable or carbon-producing systems, potentially due to the perceived reliability and dispatchability of fossil-based energy sources.
This energy class divergence underscores a critical tension in energy system design: while equity-driven systems aim to reduce environmental burdens and improve access for disadvantaged communities, resilience-focused systems may prioritize robustness and reliability, sometimes at the expense of sustainability. At this intersection, HES (100% electrical delivery) have predominately occupied this gap to date and are well-established in research with in-practice demonstrations [33]. This is justly so, particularly as costs of renewable assets such as PV decrease and energy distribution infrastructure investments remain high [42]. However, while MES show promise for improving HES design by enabling a greater diversity of energy resources and multi-vector approaches [39], this review indicates a sparsity of research for MES serving low-income communities (Figure 10) and extreme climates (Table 4). To bridge this gap, this review identified favorable MES designs, such as two energy-type networks (Figure 9) and two storage-type systems (Figure 8), and less explored modeling approaches, such as control and load shedding objectives for equity-focused works (Figure 11). These contributions can help the research community progress innovative system configurations that can enhance energy resilience for all.

4.2. Literature Context

In the broader MES literature, the findings of this review align with and extend several key themes while providing new technological and methodological insights. Prior reviews (e.g., [43,48]) emphasized the technical potential of MES to enhance energy efficiency, flexibility, and decarbonization through sector coupling and distributed energy resources. However, these studies primarily focus on system optimization and control strategies, often overlooking socio-economic dimensions such as equity. In contrast, this review uniquely highlights the statistical correlation between equity-focused MES and the adoption of fully renewable, carbon-free energy sources.
Further, the findings herein complement earlier work by Bartolini et al. [41], who demonstrate that MES can reduce life cycle costs in high-renewable configurations, but do not explicitly link these outcomes to equity goals. Moreover, while resilience has been increasingly addressed in MES research—particularly in the context of extreme weather events and cyber-physical threats (e.g., [19,20])—few studies have evaluated resilience improvements in relation to system complexity. Our findings that two-network MES configurations yield the highest average resilience gains (72.7%) provides a novel insight into optimal system design, suggesting that moderate complexity may offer the best trade-off between performance and feasibility. Lastly, this review provides a structured statistical analysis framework that is new to the MES research domain, yet critical for unbiased evaluation, reflection, and synthesis across the body of literature.

4.3. Limitations

This review revealed several limitations in the MES literature today. First, concerning geography and climate, case studies are heavily concentrated in high- and middle-income countries with temperate climates. There is a notable absence of studies in low-income countries and extreme climates (tropical and polar), where energy access and climate vulnerability are most acute. Second, concerning equity, only 15% of reviewed studies focus solely on equity, and just 8% address both equity and resilience. This imbalance suggests that equity remains an underexplored dimension in MES research, despite its centrality to sustainable development goals. Third, concerning economic viability, while some studies demonstrate that MES can reduce operational costs and improve resilience, additional life cycle cost analyses are still merited, especially in low-income or rural contexts. The high upfront costs and complexity of MES infrastructure remain barriers to widespread adoption. Lastly, considering metric standardization, the diversity of resilience and equity metrics used across studies complicates cross-comparison and benchmarking, as found with Figure 5. Standardized frameworks for evaluating MES performance across technical, economic, and social dimensions are needed.
While this review offers a novel and structured synthesis of the MES literature from resilience and equity perspectives, several limitations should be acknowledged. First, the scope of the review was limited to documents indexed in the Scopus database, which may exclude relevant studies published in other repositories or languages. Second, although our statistical framework enables objective classification and correlation analysis, it does not include a formal assessment of study quality or risk of bias, which may influence the interpretation of trends. As this methodological practice is not standard among MES literature, nor even present to our knowledge, this is an area for improvement among the MES research community at large. Lastly, while the review identifies significant gaps and correlations, it does not propose new system configurations or operational strategies, which are needed to translate these insights into practice. Aiming to balance broad synthesis with targeted depth, this review distilled 211 original MES publications from an initial set of 2420, ultimately providing a structured framework for evaluating resilient and equitable MES. This is a necessary precursor to developing technical methods for future integration. Towards this end, we translate the findings herein into insights for future research as follows.

4.4. Research Trends and Future Work

This review highlights three encouraging trends in MES research. First, it is becoming increasingly common to integrate multiple storage types (e.g., electric, thermal, gas), exemplified by a notable increase in studies with two or more storage technologies since 2018 (Figure 8). This diversification enhances system flexibility and resilience, especially under variable renewable generation, end-use loads, and extreme weather conditions. Second, sector coupling strategies such as power-to-gas and biomass-to-heat are increasingly employed to improve energy efficiency and reduce storage needs. These approaches not only enhance technical performance but also offer pathways to reduce life cycle costs, particularly in high-renewable configurations. Third, the analysis reveals that MES with two energy networks (e.g., electricity and heating) yield the highest average improvements in resilience index (72.7%), outperforming both single-network and more complex multi-network systems (Figure 13). This finding suggests that moderate system complexity may offer an optimal balance between performance gains and implementation feasibility.
Several opportunities exist to advance future MES research. As previously stated, the need to expand equity-focused case studies is great, especially in low-income, rural, and climate-vulnerable regions. This will enable a better understanding of the socio-technical feasibility and design-delivery requirements for MES in underserved contexts. Correspondingly, further development of integrated design frameworks that explicitly balance resilience, equity, and decarbonization goals can support these critical energy transition goals, potentially through multi-objective optimization and multi-domain modeling and simulation approaches. Specifically, the review revealed three important avenues for innovation when modeling and simulating MES:
  • Objective Functions: First, cost-based objective functions dominate to date in both design and operation contexts. While financial costs are paramount to system success, researchers can explore other innovative metrics, including system-level factors such as R, exergy-based cycling index [162], or ecological fitness [163], which might capture higher-levels of network organization features that balance efficiency and resiliency goals.
  • Stiff Solvers: Second, dynamic modeling with adaptive time-step solvers is lacking in resilience-focused work, while equity-focused work is lacking at large. Yet, some papers in this review [114,164,165,166] discuss the inherent challenge of capturing both fast and slow dynamics when modeling and simulating MES (i.e., mathematical problems with stiff systems of equations). These findings underscore the need for integrated modeling frameworks that can accurately and quickly simulate large systems of equations with stiff dynamics, and thus capture the complex, multi-scale dynamics present in MES. State-of-the-art research directions towards this end include stiff time-discretized numerical solvers (e.g., CVODE [167]) and quantized state solvers [168].
  • Open Science: Lastly, while 39 papers leveraged open source software tools (i.e., Python, GAMS, Modelica, Julia), none of the papers made their code and data readily available, to our knowledge. At a minimum, papers listed data to be available upon request (e.g., [67,70,127]). To support knowledge transfer, foster research transparency and reproducibility, and enable accessible MES advancements, open code is critical [169]. Without it, physical principles need to be reconstructed with each new set of researchers, which greatly limits practical impacts. Future MES research should develop flexible simulation environments with readily-runnable open-source code to jointly advance resilience and equity for MES communities.

5. Conclusions

Amidst the growing urgency of anthropogenic climate change, MES—integrated energy networks that exchange and deliver two or more energy types via energy hubs—offer promising pathways toward sustainable, resilient, and equitable energy infrastructures. This comprehensive review made three key contributions:
  • For the overarching scope, this work is the first known review to systematically examine MES through the combined lenses of resilience and equity, two interdependent and urgent dimensions of sustainable energy transitions. By analyzing the MES literature from both perspectives, the review revealed how technical decisions—such as energy storage configurations and modeling strategies—align with or diverge from broader societal goals, offering a more holistic understanding of MES performance.
  • Providing a generalizable methodology, the review introduced a structured classification and statistical analysis framework, including correlation analysis, categorical synthesis, and term clustering across 211 original MES studies. Unlike prior MES reviews, this approach enables objective identification of patterns and gaps, exemplifying a a foundation for future methodological development and practical implementation when reviewing the MES literature.
  • Regarding the specific findings, the analysis uncovered novel insights across physical systems and research approaches, including the statistically significant association between equity-focused MES and fully renewable energy systems; the optimal resilience gains achieved in two-network configurations; and notable divergences in modeling approaches and optimization objectives between equity and resilience lenses. Additionally, the review identified critical research gaps, including the lack of case studies in low-income countries and extreme climates, and highlighted the need for innovation under such conditions.
Ultimately, this review serves as both a reference and a call to action, encouraging future MES research to integrate equity considerations and address the technical, economic, and social challenges of sustainable energy transitions.

Author Contributions

K.H.: Conceptualization, Methodology, Software, Formal Analysis, Data Curation, Writing—Original Draft, Visualization, Supervision. J.D.F.G.: Software, Formal Analysis, Data Curation, Writing—Original Draft. S.A.: Software, Data Curation, Writing—Review and Editing. W.Z.: Conceptualization, Writing—Review and Editing, Supervision. All authors have read and agreed to the published version of the manuscript.

Funding

This research was supported by the U.S. National Science Foundation under Grant CBET-2501735 and the University of Vermont’s faculty startup grant.

Data Availability Statement

The data that support the findings of this study are openly available at the following URL: https://doi.org/10.5281/zenodo.16929974, Version 2.0, dated 19 August 2025.

Acknowledgments

Any opinions, findings, and conclusions or recommendations expressed in this material are those of the authors and do not necessarily reflect the views of the National Science Foundation. During the preparation of this manuscript, the authors used Microsoft Copilot (GPT-4-turbo) to refine Section 4 and Section 5 after an initial written draft by the authors. The authors have reviewed and edited the output and take full responsibility for the content of this publication.

Conflicts of Interest

The authors declare no conflicts of interest. The funders had no role in the design of the study; in the collection, analyses, or interpretation of data; in the writing of the manuscript; or in the decision to publish the results.

Appendix A. Statistical Results

Table A1, Table A2 and Table A3 summarize the results of the statistical test results for all pair-wise combinations of categorical variables included in this study. See Table 2 for category definitions and examples. Across categories 1 and 2, “Obj.” is objective; MOO is multi-objective optimization; CapEx is capital or investment cost; and d t is the time step. Demand-side indicates the binary presence of demand-side management and/or demand responsive controls.
Table A1. Statistical results from chi-square tests of independence with first categories of scope, energy class, and scale.
Category 1Category 2n df χ 2 p
ScopeEnergy Class228244.122<0.001 ***
ScopeScale20826.8030.033 *
ScopeIncome Level10329.8360.007 **
ScopeIsland Location6612.4520.117
ScopeRural Location6612.8340.092
ScopeDemand-Side22810.4770.49
ScopeMobile Storage22810.7050.401
ScopeStochasticity22814.7490.029 *
ScopeDynamics/ d t 165511.7680.038 *
ScopeLoad Shed Obj.14118.2610.004 **
ScopeEmission Obj.1411
ScopeCapEx Obj.141118.819<0.001 ***
ScopeMOO via Weights22810.0970.755
ScopeMOO via Levels22810.0100.921
ScopeSingle Obj.22811.0000.317
ScopeDesign/Control228330.958<0.001 ***
Energy ClassScale193411.1220.025 *
Energy ClassIncome Level90413.0370.011 *
Energy ClassIsland Location4925.6880.058
Energy ClassRural Location4926.7520.034 *
Energy ClassDemand-Side21120.0490.976
Energy ClassMobile Storage21121.7150.424
Energy ClassStochasticity21126.2840.043 *
Energy ClassDynamics/ d t 15110
Energy ClassLoad Shed Obj.12926.1120.047 *
Energy ClassEmission Obj.129214.1660.001 ***
Energy ClassCapEx Obj.12928.4580.015 *
Energy ClassMOO via Weights21121.1230.570
Energy ClassMOO via Levels21120.1850.912000
Energy ClassSingle Obj.21122.1360.344
Energy ClassDesign/Control211623.6640.001 ***
ScaleIncome Level8846.0040.199
ScaleIsland Location4520.6820.711
ScaleRural Location4522.0900.352
ScaleDemand-Side19321.8170.403
ScaleMobile Storage19320.6890.709
ScaleStochasticity19323.1490.207
ScaleDynamics/ d t 13910
ScaleLoad Shed Obj.11824.9720.083
ScaleEmission Obj.11824.2170.121
ScaleCapEx Obj.11827.2810.026 *
ScaleMOO via Weights19321.2700.530
ScaleMOO via Levels19323.1290.209
ScaleSingle Obj.19322.0870.352
ScaleDesign/Control193628.299<0.001 ***
Asterisks indicate Statistical significance: *** is highly significant, ** is significant, and * is weakly significant. † Minimum required frequency not met.
Table A2. Statistical results from chi-square tests of independence (continued) with first categories of income and locations.
Category 1Category 2n df χ 2 p
Income LevelIsland Location3928.9190.012 *
Income LevelRural Location39211.6220.003 **
Income LevelStochasticity9021.0120.603
Income LevelDynamics/ d t 6610
Income LevelLoad Shed Obj.5120.2390.888
Income LevelEmission Obj.5127.3880.025 *
Income LevelCapEx Obj.5120.9230.630
Income LevelMOO via Weights9020.3030.859
Income LevelMOO via Levels9022.8590.239
Income LevelSingle Obj.9021.6250.444
Income LevelDesign/Control90610.3050.112
Island LocationRural Location49120.002000<0.001 ***
Island LocationStochasticity491
Island LocationDynamics/ d t 353
Island LocationEmission Obj.281
Island LocationCapEx Obj.281
Island LocationSingle Obj.491
Island LocationDesign/Control4935.9600.114
Rural LocationStochasticity491
Rural LocationDynamics/ d t 3530.6790.878
Rural LocationEmission Obj.2810.6220.430
Rural LocationCapEx Obj.2812.4890.115
Rural LocationSingle Obj.4910.3390.560
Rural LocationDesign/Control4931.6250.654
Asterisks indicate Statistical significance: *** is highly significant, ** is significant, and * is weakly significant. † Minimum required frequency not met.
Table A3. Statistical results from chi-square tests of independence (continued) with first categories of model types and approaches.
Category 1Category 2n df χ 2 p
StochasticityDynamics/ d t 15157.3830.194
StochasticityLoad Shed Obj.12913.8230.051
StochasticityEmission Obj.12912.4930.114
StochasticityCapEx Obj.12910.2260.634
StochasticitySingle Obj.21118.8620.003 **
StochasticityDesign/Control21135.1430.162
Dynamics/ d t Load Shed Obj.12858.2080.145
Dynamics/ d t Emission Obj.1285
Dynamics/ d t CapEx Obj.1285
Dynamics/ d t Single Obj.151518.3790.003 **
Dynamics/ d t Design/Control15115
Load Shed Obj.Emission Obj.12914.9990.025 *
Load Shed Obj.CapEx Obj.129111.9320.001 ***
Load Shed Obj.Single Obj.1291<0.0010.998
Load Shed Obj.Design/Control12938.8160.032 *
Emission Obj.CapEx Obj.1291
Emission Obj.Single Obj.12912.3830.123
Emission Obj.Design/Control12934.7070.195
CapEx Obj.Single Obj.12910.0370.847
CapEx Obj.Design/Control129330.668<0.001 ***
Demand-SideMobile Storage211112.488<0.001 ***
Asterisks indicate Statistical significance: *** is highly significant, ** is significant, and * is weakly significant. † Minimum required frequency not met.

References

  1. IPCC. Summary for Policymakers. In Climate Change 2021: The Physical Science Basis. Contribution of Working Group I to the Sixth Assessment Report of the Intergovernmental Panel on Climate Change; Masson-Delmotte, V., Zhai, P., Pirani, A., Connors, S.L., Péan, C., Berger, S., Caud, N., Chen, Y., Goldfarb, L., Gomis, M.I., et al., Eds.; Cambridge University Press: Cambridge, UK, 2021; pp. 3–32. [Google Scholar] [CrossRef]
  2. Wang, J.; Zuo, W.; Rhode-Barbarigos, L.; Lu, X.; Wang, J.; Lin, Y. Literature review on modeling and simulation of energy infrastructures from a resilience perspective. Reliab. Eng. Syst. Saf. 2019, 183, 360–373. [Google Scholar] [CrossRef]
  3. United Nations. Transforming Our World: The 2030 Agenda for Sustainable Development; Technical Report; General Assembly: New York, NY, USA, 2015.
  4. Zhu, X.; Zhou, M.; Xiang, Z.; Zhang, L.; Sun, Y.; Li, G. Research on optimal configuration of energy hub considering system flexibility. In Proceedings of the PURPLE MOUNTAIN FORUM 2019-International Forum on Smart Grid Protection and Control; Xue, Y., Zheng, Y., Rahman, S., Eds.; Springer Nature: Singapore, 2020; Volume 585, pp. 243–257. [Google Scholar] [CrossRef]
  5. Yadoo, A.; Cruickshank, H. The role for low carbon electrification technologies in poverty reduction and climate change strategies: A focus on renewable energy mini-grids with case studies in Nepal, Peru and Kenya. Energy Policy 2012, 42, 591–602. [Google Scholar] [CrossRef]
  6. Cañizares, C.; Nathwani, J.; Kammen, D. Electricity for All: Issues, Challenges, and Solutions for Energy-Disadvantaged Communities. Proc. IEEE 2019, 107, 1775–1779. [Google Scholar] [CrossRef]
  7. Holling, C.S. Resilience and Stability of Ecological Systems. Annu. Rev. Ecol. Syst. 1973, 4, 1–23. [Google Scholar] [CrossRef]
  8. Odum, E.P.; Barrett, G.W. Fundamentals of Ecology, 5th ed.; Thomson Brooks/Cole: Belmont, CA, USA, 2005. [Google Scholar] [CrossRef]
  9. Woods, D.D.; Hollnagel, E. Resilience Engineering: Concepts and Precepts; Taylor & Francis Group: Abingdon, UK, 2006. [Google Scholar]
  10. Mottahedi, A.; Sereshki, F.; Ataei, M.; Qarahasanlou, A.N.; Barabadi, A. The resilience of critical infrastructure systems: A systematic literature review. Energies 2021, 14, 1571. [Google Scholar] [CrossRef]
  11. Maharjan, R.; Kato, H. Resilient supply chain network design: A systematic literature review. Transp. Rev. 2022, 42, 739–761. [Google Scholar] [CrossRef]
  12. Fletcher, D.; Sarkar, M. Psychological resilience: A review and critique of definitions, concepts, and theory. Eur. Psychol. 2013, 18, 12–23. [Google Scholar] [CrossRef]
  13. Bhamra, R.; Dani, S.; Burnard, K. Resilience: The concept, a literature review and future directions. Int. J. Prod. Res. 2011, 49, 5375–5393. [Google Scholar] [CrossRef]
  14. Tian, H.; Huang, G.; Chen, Y.; Li, G.; Li, X.; Bie, Z. Resilience-Based Optimal Placement Method for Integrated Electricity and Gas Energy System. In Proceedings of the 4th International Conference on HVDC, Xi’an, China, 6–9 November 2020; pp. 1188–1194. [Google Scholar] [CrossRef]
  15. Gazijahani, F.S.; Salehi, J.; Shafie-Khah, M. Benefiting from Energy-Hub Flexibilities to Reinforce Distribution System Resilience: A Pre- and Post-Disaster Management Model. IEEE Syst. J. 2022, 16, 3381–3390. [Google Scholar] [CrossRef]
  16. Tao, R.; Zhao, D.; Xu, C.; Wang, H.; Xia, X. Resilience Enhancement of Integrated Electricity-Gas-Heat Urban Energy System with Data Centres Considering Waste Heat Reuse. IEEE Trans. Smart Grid 2023, 14, 183–198. [Google Scholar] [CrossRef]
  17. Zhou, Y. Climate change adaptation with energy resilience in energy districts—A state-of-the-art review. Energy Build. 2023, 279, 112649. [Google Scholar] [CrossRef]
  18. He, J.; Yuan, Z.; Yang, X.; Huang, W.; Tu, Y.; Li, Y. Reliability Modeling and Evaluation of Urban Multi-Energy Systems: A Review of the State of the Art and Future Challenges. IEEE Access 2020, 8, 98887–98909. [Google Scholar] [CrossRef]
  19. Hussain, A.; Bui, V.H.; Kim, H.M. Microgrids as a resilience resource and strategies used by microgrids for enhancing resilience. Appl. Energy 2019, 240, 56–72. [Google Scholar] [CrossRef]
  20. Yang, B.; Ge, S.; Liu, H.; Li, J.; Zhang, S. Resilience assessment methodologies and enhancement strategies of multi-energy cyber-physical systems of the distribution network. IET Energy Syst. Integr. 2022, 4, 171–191. [Google Scholar] [CrossRef]
  21. Mejia-Giraldo, D.; Villarreal-Marimon, J.; Gu, Y.; He, Y.; Duan, Z.; Wang, L. Sustainability and Resiliency Measures for Long-Term Investment Planning in Integrated Energy and Transportation Infrastructures. J. Energy Eng. 2012, 138, 87–94. [Google Scholar] [CrossRef]
  22. The Rockefeller Foundation. City Resilience Index: Understanding and Measuring City Resilience; ARUP International Development: Hong Kong, China, 2016; p. 47. [Google Scholar]
  23. Dore, M.; Etkin, D. The importance of measuring the social costs of natural disasters at a time of climate change. Aust. J. Emerg. Manag. 2000, 15, 46–51. [Google Scholar]
  24. Field, C.B.; Barros, V.; Stocker, T.F.; Dahe, Q.; Jon Dokken, D.; Ebi, K.L.; Mastrandrea, M.D.; Mach, K.J.; Plattner, G.K.; Allen, S.K.; et al. Managing the Risks of Extreme Events and Disasters to Advance Climate Change Adaptation: Special Report of the Intergovernmental Panel on Climate Change, 1st ed.; Cambridge University Press: New York, NY, USA, 2012. [Google Scholar] [CrossRef]
  25. Kime, S.; Jacome, V.; Pellow, D.; Deshmukh, R. Evaluating equity and justice in low-carbon energy transitions. Environ. Res. Lett. 2023, 18, 123003. [Google Scholar] [CrossRef]
  26. UN DESA. The Sustainable Development Goals Report 2023: Special Edition; Technical Report; United Nations: New York, NY, USA, 2023.
  27. Kaygusuz, K. Energy for sustainable development: A case of developing countries. Renew. Sustain. Energy Rev. 2012, 16, 1116–1126. [Google Scholar] [CrossRef]
  28. Olówósejéjé, S.; Leahy, P.; Morrison, A.P. A practical approach for increased electrification, lower emissions and lower energy costs in Africa. Sustain. Futur. 2020, 2, 100022. [Google Scholar] [CrossRef]
  29. Liu, H.; Fu, H.; Sun, L.; Lee, C.; Yeatman, E.M. Hybrid energy harvesting technology: From materials, structural design, system integration to applications. Renew. Sustain. Energy Rev. 2021, 137, 110473. [Google Scholar] [CrossRef]
  30. Soudagar, M.E.M.; Ramesh, S.; Yunus Khan, T.M.; Almakayeel, N.; Ramesh, R.; Nik Ghazali, N.N.; Cuce, E.; Shelare, S. An overview of the existing and future state of the art advancement of hybrid energy systems based on PV-solar and wind. Int. J. Low-Carbon Technol. 2024, 19, 207–216. [Google Scholar] [CrossRef]
  31. Pandyaswargo, A.H.; Wibowo, A.D.; Onoda, H. Socio-techno-economic assessment to design an appropriate renewable energy system for remote agricultural communities in developing countries. Sustain. Prod. Consum. 2022, 31, 492–511. [Google Scholar] [CrossRef]
  32. Mwakitalima, I.J.; Rizwan, M.; Kumar, N. Standalone Solar Photovoltaic Electricity Supply to Rural Household in Tanzania. IETE J. Res. 2023, 69, 3871–3886. [Google Scholar] [CrossRef]
  33. Natividad, L.E.; Benalcazar, P. Hybrid Renewable Energy Systems for Sustainable Rural Development: Perspectives and Challenges in Energy Systems Modeling. Energies 2023, 16, 1328. [Google Scholar] [CrossRef]
  34. Gaslac, L.; Willis, S.; Quispe, G.; Raymundo, C. A hybrid energy system based on renewable energy for the electrification of low-income rural communities. IOP Conf. Ser. Earth Environ. Sci. 2018, 168, 012005. [Google Scholar] [CrossRef]
  35. Kgopana, K.; Popoola, O. Improved utilization of hybrid energy for low-income houses based on energy consumption pattern. AIMS Energy 2023, 11, 79–109. [Google Scholar] [CrossRef]
  36. Faridah, L.; Purwadi, A.; Ibrahim, M.H.; Rizqiawan, A. Study and Design of Hybrid Off-Grid Power System for Communal and Administrative Load at 3 Regions in Maluku, Indonesia. In Proceedings of the 4th IEEE Conference on Power Engineering and Renewable Energy, Solo, Indonesia, 29–31 October 2018; pp. 1–5. [Google Scholar] [CrossRef]
  37. Sanjel, N.; Baral, B. Modelling and analysis of decentralized energy systems with photovoltaic, micro-hydro, battery and diesel technology for remote areas of Nepal. Clean Energy 2021, 5, 690–703. [Google Scholar] [CrossRef]
  38. Dodo, U.A.; Ashigwuike, E.C.; Emechebe, J.N. Optimization of Standalone Hybrid Power System Incorporating Waste-to-electricity Plant: A Case Study in Nigeria. In Proceedings of the IEEE Nigeria 4th International Conference on Disruptive Technologies for Sustainable Development, Lagos, Nigeria, 15–17 May 2022; pp. 1–5. [Google Scholar] [CrossRef]
  39. Jansen, S.; Fremouw, M.; Meggers, F.; Guo, H.; Schmidt, R.R.; Maguerite, C.; Martinac, I.; Kayo, G.; Wang, C.; Gudmundsson, O.; et al. LowEx Communities—Optimised Performance of Energy Supply Systems with Exergy Principles (Annex 64); Technical Report September; Fraunhofer Verlag: Stuttgart, Germany, 2019. [Google Scholar]
  40. Pilpola, S.; Arabzadeh, V.; Mikkola, J.; Lund, P.D. Analyzing national and local pathways to carbon-neutrality from technology, emissions, and resilience perspectives—Case of Finland. Energies 2019, 12, 949. [Google Scholar] [CrossRef]
  41. Bartolini, A.; Carducci, F.; Muñoz, C.B.; Comodi, G. Energy storage and multi energy systems in local energy communities with high renewable energy penetration. Renew. Energy 2020, 159, 595–609. [Google Scholar] [CrossRef]
  42. Gudmundsson, O.; Thorsen, J.E.; Zhang, L. Cost analysis of district heating compared to its competing technologies. WIT Trans. Ecol. Environ. 2013, 176, 107–118. [Google Scholar] [CrossRef]
  43. Eladl, A.A.; El-Afifi, M.I.; El-Saadawi, M.M.; Sedhom, B.E. A review on energy hubs: Models, methods, classification, applications, and future trends. Alex. Eng. J. 2023, 68, 315–342. [Google Scholar] [CrossRef]
  44. Johnson, O.W.; Han, J.Y.C.; Knight, A.L.; Mortensen, S.; Aung, M.T.; Boyland, M.; Resurrección, B.P. Intersectionality and energy transitions: A review of gender, social equity and low-carbon energy. Energy Res. Soc. Sci. 2020, 70, 101774. [Google Scholar] [CrossRef]
  45. Arent, D.J.; Green, P.; Abdullah, Z.; Barnes, T.; Bauer, S.; Bernstein, A.; Berry, D.; Berry, J.; Burrell, T.; Carpenter, B.; et al. Challenges and opportunities in decarbonizing the U.S. energy system. Renew. Sustain. Energy Rev. 2022, 169, 112939. [Google Scholar] [CrossRef]
  46. Jafarizadeh, H.; Yamini, E.; Zolfaghari, S.M.; Esmaeilion, F.; Assad, M.E.H.; Soltani, M. Navigating challenges in large-scale renewable energy storage: Barriers, solutions, and innovations. Energy Rep. 2024, 12, 2179–2192. [Google Scholar] [CrossRef]
  47. Geidl, M.; Koeppel, G.; Favre-Perrod, P.; Klöckl, B.; Andersson, G.; Fröhlich, K. Energy Hubs for the Future. IEEE Power Energy Mag. 2007, 5, 24–30. [Google Scholar] [CrossRef]
  48. Mancarella, P. MES (multi-energy systems): An overview of concepts and evaluation models. Energy 2014, 65, 1–17. [Google Scholar] [CrossRef]
  49. Lasemi, M.A.; Arabkoohsar, A.; Hajizadeh, A.; Mohammadi-ivatloo, B. A comprehensive review on optimization challenges of smart energy hubs under uncertainty factors. Renew. Sustain. Energy Rev. 2022, 160, 112320. [Google Scholar] [CrossRef]
  50. Yao, R.; Hu, Y.; Varga, L. Applications of Agent-Based Methods in Multi-Energy Systems—A Systematic Literature Review. Energies 2023, 16, 2456. [Google Scholar] [CrossRef]
  51. Papadimitriou, C.; Somma, M.D.; Charalambous, C.; Caliano, M.; Palladino, V.; Borray, A.F.C.; González-Garrido, A.; Ruiz, N.; Graditi, G. A Comprehensive Review of the Design and Operation Optimization of Energy Hubs and Their Interaction with the Markets and External Networks. Energies 2023, 16, 4018. [Google Scholar] [CrossRef]
  52. Page, M.J.; McKenzie, J.E.; Bossuyt, P.M.; Boutron, I.; Hoffmann, T.C.; Mulrow, C.D.; Shamseer, L.; Tetzlaff, J.M.; Akl, E.A.; Brennan, S.E.; et al. The PRISMA 2020 statement: An updated guideline for reporting systematic reviews. BMJ 2021, 372, n71. [Google Scholar] [CrossRef]
  53. Kolaski, K.; Logan, L.R.; Ioannidis, J.P. Guidance to best tools and practices for systematic reviews. Syst. Rev. 2023, 16, 241–273. [Google Scholar] [CrossRef]
  54. Zhang, G.; Zhu, S.; Bai, X. Federated Learning-Based Multi-Energy Load Forecasting Method Using CNN-Attention-LSTM Model. Sustainability 2022, 14, 12843. [Google Scholar] [CrossRef]
  55. IFRIS; INRAE. CorTexT Platform; INRAE: Noisy-le-Grand, France, 2024.
  56. Moore, D.S.; McCabe, G.P. Introduction to the Practice of Statistics, 3rd ed.; W.H. Freeman: New York, NY, USA, 1999. [Google Scholar]
  57. World Bank Group. GNI per Capita, Atlas Method (Current US$); The World Bank Group: Washington DC, USA, 2022. [Google Scholar]
  58. Kottek, M.; Grieser, J.; Beck, C.; Rudolf, B.; Rubel, F. World map of the Köppen-Geiger climate classification updated. Meteorol. Z. 2006, 15, 259–263. [Google Scholar] [CrossRef] [PubMed]
  59. Karl Pearson, F.R.S. X. On the criterion that a given system of deviations from the probable in the case of a correlated system of variables is such that it can be reasonably supposed to have arisen from random sampling. Lond. Edinb. Dublin Philos. Mag. J. Sci. 1900, 50, 157–175. [Google Scholar] [CrossRef]
  60. Nakawiro, W. A co-optimization model of natural gas supply and electric power systems. Eng. J. 2019, 23, 135–148. [Google Scholar] [CrossRef]
  61. Wei, T.; Chu, X.; Liu, Y. Security Assessment of Interdependent Electricity-Gas Networks. In Proceedings of the IEEE Sustainable Power and Energy Conference, Chengdu, China, 23–25 November 2020; pp. 1484–1490. [Google Scholar] [CrossRef]
  62. Li, B.; Li, X.; Su, Q. A system and game strategy for the isolated island electric-gas deeply coupled energy network. Appl. Energy 2022, 306, 118013. [Google Scholar] [CrossRef]
  63. Arun Kumar, V.; Sharma, S.; Verma, A. Optimal DER Sizing and Dispatch of CHP for a Remote Educational Microgrid. In Proceedings of the 9th IEEE Power India International Conference, Sonepat, India, 28 February–1 March 2020; pp. 1–6. [Google Scholar] [CrossRef]
  64. Chen, W.; Chen, J.; Cai, Q.; Li, Z.; Hu, P. Optimized Scheduling of Biogas-photovoltaic-wind Rural Integrated Energy System Based on Energy Hub. In Proceedings of the 2023 IEEE International Conference on Power Science and Technology (ICPST), Kunming, China, 5–7 May 2023; pp. 709–716. [Google Scholar] [CrossRef]
  65. Cai, Q.; Xiang, K.; Chen, W.; Li, Z.; Hu, P. Collaborative Optimal Configuration Model of RIES with Biogas, Photovoltaic, and Wind. In Proceedings of the 7th International Conference on Green Energy and Applications, Singapore, 10–12 March 2023; pp. 53–58. [Google Scholar] [CrossRef]
  66. Nastasi, B.; Mazzoni, S.; Groppi, D.; Romagnoli, A.; Astiaso Garcia, D. Solar power-to-gas application to an island energy system. Renew. Energy 2021, 164, 1005–1016. [Google Scholar] [CrossRef]
  67. Mohseni, S.; Brent, A.C.; Burmester, D. Off-Grid Multi-Carrier Microgrid Design Optimisation: The Case of Rakiura–Stewart Island, Aotearoa–New Zealand. Energies 2021, 14, 6522. [Google Scholar] [CrossRef]
  68. Karaca, A.E.; Dincer, I. Development and evaluation of a solar based integrated hydrogen energy system for mobile applications. Energy Convers. Manag. 2023, 280, 116808. [Google Scholar] [CrossRef]
  69. Zhang, M.; Chen, X.; Chen, Y.; Jiang, S.; Shen, B. Combined cooling, heating, power and oxygen for hospital buildings employing photovoltaic power and liquefied methane. In Proceedings of the 5th International Conference on Electrical Engineering and Green Energy, Berlin, Germany, 8–11 June 2022; pp. 815–821. [Google Scholar] [CrossRef]
  70. Boulmrharj, S.; Bakhouya, M.; Khaidar, M. Green hydrogen for public transportation fueling and street lighting electrification: Towards more sustainable Moroccan cities. Sustain. Prod. Consum. 2023, 36, 217–232. [Google Scholar] [CrossRef]
  71. Mehrjerdi, H.; Hemmati, R.; Mahdavi, S.; Shafie-Khah, M.; Catalao, J.P. Multicarrier Microgrid Operation Model Using Stochastic Mixed Integer Linear Programming. IEEE Trans. Ind. Inform. 2022, 18, 4674–4687. [Google Scholar] [CrossRef]
  72. Ghasemi, A.A.; Gitizadeh, M.; Kamwa, I.; Ghareghani, O. Resiliency constraint proactive scheduling against hurricane in multiple energy carrier microgrid. IET Gener. Transm. Distrib. 2022, 16, 4096–4114. [Google Scholar] [CrossRef]
  73. Masrur, H.; Shafie-khah, M.; Hossain, M.J.; Senjyu, T. Multi-energy Microgrids Incorporating EV Integration: Optimal Design and Resilient Operation. IEEE Trans. Smart Grid 2022, 13, 3508–3518. [Google Scholar] [CrossRef]
  74. Tan, C.; Yu, M.; Wang, J.; Geng, S.; Niu, D.; Tan, Z. Feasibility study on the construction of multi-energy complementary systems in rural areas—Eastern, central, and western parts of China are taken as examples. Energy 2022, 249, 123571. [Google Scholar] [CrossRef]
  75. Seyyedi, A.Z.G.; Armand, M.J.; Akbari, E.; Moosanezhad, J.; Khorasani, F.; Raeisinia, M. A non-linear resilient-oriented planning of the energy hub with integration of energy storage systems and flexible loads. J. Energy Storage 2022, 51, 104397. [Google Scholar] [CrossRef]
  76. Kolker, A.; Garber-Slaght, R.; Anderson, B.; Reber, T.; Zyatitsky, K.; Pauling, H. Geothermal Energy and Resilience in Arctic Countries; Technical Report NREL/TP-5700-80928; NREL: Golden, CO, USA, 2022. [Google Scholar]
  77. Raza, A.; Malik, T.N.; Khan, M.F.N.; Ali, S. Energy management in residential buildings using energy hub approach. Build. Simul. 2020, 13, 363–386. [Google Scholar] [CrossRef]
  78. Senkel, A.; Bode, C.; Schmitz, G. Quantification of the resilience of integrated energy systems using dynamic simation. Reliab. Eng. Syst. Saf. 2021, 209, 107447. [Google Scholar] [CrossRef]
  79. Zhao, J.; Xiong, J.; Yu, H.; Bu, Y.; Zhao, K.; Yan, J.; Li, P.; Wang, C. Reliability evaluation of community integrated energy systems based on fault incidence matrix. Sustain. Cities Soc. 2022, 80, 103769. [Google Scholar] [CrossRef]
  80. Temiz, M.; Dincer, I. Design and analysis of nuclear and solar-based energy, food, fuel, and water production system for an indigenous community. J. Clean. Prod. 2021, 314, 127890. [Google Scholar] [CrossRef]
  81. Ju, Y.; Jin, M.; Wang, J.; Yang, J.; Dong, M.; Li, D.; Shi, K.; Zhang, H. Research on optimal dispatching strategy for micro-energy-grid of protected agriculture. Appl. Sci. 2019, 9, 3929. [Google Scholar] [CrossRef]
  82. Lv, C.; Liang, R.; Jin, W.; Chai, Y.; Yang, T. Multi-stage resilience scheduling of electricity-gas integrated energy system with multi-level decentralized reserve. Appl. Energy 2022, 317, 119165. [Google Scholar] [CrossRef]
  83. Cai, A.; Sun, B.; Wang, R.; Wang, M.; Chi, Q.; Yang, L.; Wei, D. Double-Layer Cycle Capacity Optimization Model of Rural Biogas-Solar-Wind Integrated Energy System. In Proceedings of the 4th International Conference on Smart Power and Internet Energy Systems, Beijing, China, 9–12 December 2022; pp. 1648–1654. [Google Scholar] [CrossRef]
  84. Zheng, T.; Dai, Z.; Zhao, J.; Yao, J.; Wang, Y.; Zhang, K. Economic dispatch strategy of multi-energy system considering N-1 security constraints. In Proceedings of the 4th IEEE Conference on Energy Internet and Energy System Integration, Wuhan, China, 30 October–1 November 2020; pp. 1976–1980. [Google Scholar] [CrossRef]
  85. Ren, H.; Jiang, Z.; Wu, Q.; Li, Q.; Yang, Y. Integrated optimization of a regional integrated energy system with thermal energy storage considering both resilience and reliability. Energy 2022, 261, 125333. [Google Scholar] [CrossRef]
  86. Sui, Q.; Wei, F.; Wu, C.; Lin, X.; Li, Z. Self-Sustaining of Post-Disaster Pelagic Island Energy Systems with Mobile Multi-Energy Storages. IEEE Trans. Smart Grid 2023, 14, 2645–2655. [Google Scholar] [CrossRef]
  87. Chen, Y.; Zhang, Y.; Wang, J.; Lu, Z. Optimal operation for integrated electricity-heat system with improved heat pump and storage model to enhance local energy utilization. Energies 2020, 13, 6729. [Google Scholar] [CrossRef]
  88. Shao, Z.; Cao, X.; Zhai, Q.; Guan, X. Risk-constrained planning of rural-area hydrogen-based microgrid considering multiscale and multi-energy storage systems. Appl. Energy 2023, 334, 120682. [Google Scholar] [CrossRef]
  89. Guo, Z.; Li, G.; Zhou, M.; Feng, W. Resilient Configuration Approach of Integrated Community Energy System Considering Integrated Demand Response under Uncertainty. IEEE Access 2019, 7, 87513–87533. [Google Scholar] [CrossRef]
  90. Gabbar, H.A. Resiliency analysis of hybrid energy systems within interconnected infrastructures. Energies 2021, 14, 7499. [Google Scholar] [CrossRef]
  91. Herenčić, L.; Melnjak, M.; Capuder, T.; Andročec, I.; Rajšl, I. Techno-economic and environmental assessment of energy vectors in decarbonization of energy islands. Energy Convers. Manag. 2021, 236, 114064. [Google Scholar] [CrossRef]
  92. Yang, H.; Xiong, T.; Qiu, J.; Qiu, D.; Dong, Z.Y. Optimal operation of DES/CCHP based regional multi-energy prosumer with demand response. Appl. Energy 2016, 167, 353–365. [Google Scholar] [CrossRef]
  93. Zakernezhad, H.; Nazar, M.S.; Shafie-khah, M.; Catalão, J.P. Optimal resilient operation of multi-carrier energy systems in electricity markets considering distributed energy resource aggregators. Appl. Energy 2021, 299, 117271. [Google Scholar] [CrossRef]
  94. Li, B.; Li, J. Deploy Mobile Hydrogen Trucks to Improve Energy Supply System Resilience. In Proceedings of the 5th IEEE Conference on Energy Internet and Energy System Integration, Taiyuan, China, 22–25 October 2021; pp. 2258–2263. [Google Scholar] [CrossRef]
  95. Li, B.; Li, J.; Jian, B. Improve multi-energy supply microgrid resilience using mobile hydrogen trucks based on transportation network. eTransportation 2023, 18, 100265. [Google Scholar] [CrossRef]
  96. Tao, Y.; Qiu, J.; Lai, S.; Sun, X.; Zhao, J. Vulnerability Assessment of Coupled Transportation and Multi-Energy Networks Considering Electric and Hydrogen Vehicles. IEEE Trans. Intell. Transp. Syst. 2023, 24, 12614–12626. [Google Scholar] [CrossRef]
  97. Valipour, E.; Nourollahi, R.; Taghizad-Tavana, K.; Nojavan, S.; Alizadeh, A. Risk Assessment of Industrial Energy Hubs and Peer-to-Peer Heat and Power Transaction in the Presence of Electric Vehicles. Energies 2022, 15, 8920. [Google Scholar] [CrossRef]
  98. Benjamin, M.F.D.; Cayamanda, C.D.; Belmonte, B.A.; Tan, R.R.; Razon, L.F. A risk-based criticality analysis in bioenergy parks using P-graph method. Chem. Eng. Trans. 2016, 52, 1243–1248. [Google Scholar] [CrossRef]
  99. Benjamin, M.F.; Ubando, A.; Razon, L.; Tan, R.R. Analyzing the disruption resilience of microalgal multi-functional Bioenergy systems using dynamic inoperability input-output modeling. Chem. Eng. Trans. 2015, 45, 1579–1584. [Google Scholar] [CrossRef]
  100. Ji, L.; Liang, X.; Xie, Y.; Huang, G.; Wang, B. Optimal design and sensitivity analysis of the stand-alone hybrid energy system with PV and biomass-CHP for remote villages. Energy 2021, 225, 120323. [Google Scholar] [CrossRef]
  101. Benjamin, M.F.D.; Tan, R.R.; Razon, L.F. Probabilistic multi-disruption risk analysis in bioenergy parks via physical input-output modeling and analytic hierarchy process. Sustain. Prod. Consum. 2015, 1, 22–33. [Google Scholar] [CrossRef]
  102. Mansouri, M.; Madi, H.; Breuhaus, P. Establishment of a Baseline Integrated Energy System To Decarbonise Geographical Islands. In Proceedings of the ASME Turbomachinery Technical Conference and Exposition, Rotterdam, The Netherlands, 13–17 June 2022; pp. 1–10. [Google Scholar] [CrossRef]
  103. Ray, A.; Jana, K.; De, S. Polygeneration for an off-grid Indian village: Optimization by economic and reliability analysis. Appl. Therm. Eng. 2017, 116, 182–196. [Google Scholar] [CrossRef]
  104. Gupta, K.K.; Rehman, A.; Sarviya, R.M. Bio-fuels for the gas turbine: A review. Renew. Sustain. Energy Rev. 2010, 14, 2946–2955. [Google Scholar] [CrossRef]
  105. Neuling, U.; Kaltschmitt, M. Review of biofuel production - Feedstock, processes and markets. J. Oil Palm Res. 2017, 29, 137–167. [Google Scholar] [CrossRef]
  106. König, S.; Bchini, Q.; McKenna, R.; Köppel, W.; Bachseitz, M.; Michaelis, J. Spatially-resolved analysis of the challenges and opportunities of Power-to-Gas (PtG) in Baden-Württemberg until 2040. In Proceedings of the 11th International Renewable Energy Storage Conference, Düsseldorf, Germany, 14–16 March 2017; Volmue 135, pp. 434–444. [Google Scholar] [CrossRef]
  107. Zhao, P.; Gu, C.; Hu, Z.; Xie, D.; Hernando-Gil, I.; Shen, Y. Distributionally Robust Hydrogen Optimization with Ensured Security and Multi-Energy Couplings. IEEE Trans. Power Syst. 2021, 36, 504–513. [Google Scholar] [CrossRef]
  108. Qiu, D.; Wang, Y.; Zhang, T.; Sun, M.; Strbac, G. Hierarchical multi-agent reinforcement learning for repair crews dispatch control towards multi-energy microgrid resilience. Appl. Energy 2023, 336, 120826. [Google Scholar] [CrossRef]
  109. Gu, W.; Ding, S.; Lu, S.; Zhao, P.; Zou, D.; Qiu, Y.; Yu, R.; Sheng, L. Coordinated Heat and Power Cyber-Attacks with Time Window Matching Strategy. IEEE Trans. Smart Grid 2023, 14, 2747–2761. [Google Scholar] [CrossRef]
  110. Iniyan, S.; Jagadeesan, T.R. A comparative study of critical factors influencing the renewable energy systems use in the Indian context. Renew. Energy 1997, 11, 299–317. [Google Scholar] [CrossRef]
  111. Xu, L.; Wang, S.; Wang, Z.; Qi, X. Dual-layer self-healing strategy for standalone building energy systems: A case study of a tropical island. Energy Build. 2023, 283, 112827. [Google Scholar] [CrossRef]
  112. Attardo, G.; Longo, S.; Montana, F.; Sanseverino, E.R.; Tran, Q.T.T.; Zizzo, G. Urban energy hubs economic optimization and environmental comparison in Italy and Vietnam. In Proceedings of the IEEE 4th International Forum on Research and Technologies for Society and Industry (RTSI), Palermo, Italy, 10–13 September 2018; pp. 1–6. [Google Scholar] [CrossRef]
  113. Wu, J.; Gu, J.; Liu, S.; Jin, Z. Strategies for improving resilience of regional integrated energy systems in the prevention–resistance phase of integration. Prot. Control Mod. Power Syst. 2023, 8, 1–8. [Google Scholar] [CrossRef]
  114. Carvallo, C.; Jalil-Vega, F.; Moreno, R. A multi-energy multi-microgrid system planning model for decarbonisation and decontamination of isolated systems. Appl. Energy 2023, 343, 121143. [Google Scholar] [CrossRef]
  115. Lu, Y.; Yang, K. An accurate and efficient quasi-dynamic simulation method of electricity-heat multi-energy systems. Front. Energy Res. 2023, 11, 1229438. [Google Scholar] [CrossRef]
  116. Chen, Y.; Chen, Z.; Chen, Z.; Yuan, X. Dynamic modeling of solar-assisted ground source heat pump using Modelica. Appl. Therm. Eng. 2021, 196, 117324. [Google Scholar] [CrossRef]
  117. Wiegel, B.; Steffen, T.; Babazadeh, D.; Becker, C. Towards a more comprehensive open-source model for interdisciplinary smart integrated energy systems. In Proceedings of the 11th Workshop on Modelling and Simulation of Cyber-Physical Energy Systems (MSCPES), San Antonio, TX, USA, 9 May 2023; pp. 1–7. [Google Scholar] [CrossRef]
  118. Li, X.; Sun, B.; Ju, W.; Zhang, H.; Wang, R. Capacity Configuration Model of Biogas-based Integrated Energy System. In Proceedings of the 2021 IEEE 4th International Electrical and Energy Conference, CIEEC 2021, Wuhan, China, 28–30 May 2021. [Google Scholar] [CrossRef]
  119. Saravi, V.S.; Kalantar, M.; Anvari-Moghaddam, A. Resilience-constrained expansion planning of integrated power–gas–heat distribution networks. Appl. Energy 2022, 323, 119315. [Google Scholar] [CrossRef]
  120. Chen, H.; Meng, K.; Qiu, J.; Dong, Z.Y. Expansion Co-Planning of Integrated Electricity-Heat-Gas Networks in District Energy Systems. In Proceedings of the IEEE Power and Energy Society General Meeting, Portland, OR, USA, 5–10 August 2018; pp. 1–5. [Google Scholar] [CrossRef]
  121. Lu, S.; Li, Y.; Ding, S.; Gu, W.; Xu, Y.; Song, M. Combined Electrical and Heat Load Restoration Based on Bi-Objective Distributionally Robust Optimization. IEEE Trans. Ind. Inform. 2023, 19, 9239–9252. [Google Scholar] [CrossRef]
  122. Li, B.; Roche, R.; Miraoui, A. System resilience improvement using multiple energy supply systems under natural disasters. In Proceedings of the IECON Proceedings (Industrial Electronics Conference), Florence, Italy, 24–27 October 2016; pp. 3912–3917. [Google Scholar] [CrossRef]
  123. Zhao, P.; Gu, C.; Cao, Z.; Shen, Y.; Teng, F.; Chen, X.; Wu, C.; Huo, D.; Xu, X.; Li, S. Data-Driven Multi-Energy Investment and Management under Earthquakes. IEEE Trans. Ind. Inform. 2021, 17, 6939–6950. [Google Scholar] [CrossRef]
  124. Wang, Y.; Guo, L.; Ma, Y.; Han, X.; Xing, J.; Miao, W.Q.; Wang, H. Study on operation optimization of decentralized integrated energy system in northern rural areas based on multi-objective. Energy Rep. 2022, 8, 3063–3084. [Google Scholar] [CrossRef]
  125. Bai, L.; Li, F.; Jiang, T.; Jia, H. Robust Scheduling for Wind Integrated Energy Systems Considering Gas Pipeline and Power Transmission N-1 Contingencies. IEEE Trans. Power Syst. 2017, 32, 1582–1584. [Google Scholar] [CrossRef]
  126. Jiang, X.; Chen, J.; Chen, M.; Wei, Z. Multi-stage dynamic post-disaster recovery strategy for distribution networks considering integrated energy and transportation networks. CSEE J. Power Energy Syst. 2021, 7, 408–420. [Google Scholar] [CrossRef]
  127. Parvin, M.; Yousefi, H.; Noorollahi, Y. Techno-economic optimization of a renewable micro grid using multi-objective particle swarm optimization algorithm. Energy Convers. Manag. 2023, 277, 116639. [Google Scholar] [CrossRef]
  128. Feng, C.; Wang, W.; Wang, Z.; Li, C.; Yang, W.; Wei, S. Research on Capacity Allocation Method for Multi-scenario Rural Integrated Energy System. In Proceedings of the 2nd International Conference on New Energy and Power Engineering (ICNEPE 2022), Qingdao, China, 18–20 November 2022; Volume 2474, p. 012022. [Google Scholar] [CrossRef]
  129. Zhang, Y.; Hu, Y.; Ma, J.; Bie, Z. A mixed-integer linear programming approach to security-constrained co-optimization expansion planning of natural gas and electricity transmission systems. IEEE Trans. Power Syst. 2018, 33, 6368–6378. [Google Scholar] [CrossRef]
  130. Liu, Z.; Yu, H.; Liu, R.; Wang, M.; Li, C. Configuration optimization model for data-center-park-integrated energy systems under economic, reliability, and environmental considerations. Energies 2020, 13, 448. [Google Scholar] [CrossRef]
  131. Yodo, N.; Arfin, T. A resilience assessment of an interdependent multi-energy system with microgrids. Sustain. Resilient Infrastruct. 2021, 6, 42–55. [Google Scholar] [CrossRef]
  132. Liu, X.; Liu, F.; Li, N.; Mu, H.; Li, L. Hierarchical multi-objective design of regional integrated energy system under heterogeneous low-carbon policies. Sustain. Prod. Consum. 2022, 32, 357–377. [Google Scholar] [CrossRef]
  133. Gargari, M.Z.; Hagh, M.T.; Zadeh, S.G. Preventive maintenance scheduling of multi energy microgrid to enhance the resiliency of system. Energy 2021, 221, 119782. [Google Scholar] [CrossRef]
  134. Pazouki, S.; Naderi, E.; Asrari, A. A remedial action framework against cyberattacks targeting energy hubs integrated with distributed energy resources. Appl. Energy 2021, 304, 117895. [Google Scholar] [CrossRef]
  135. Li, Y.; Li, T.; Zhang, H.; Xie, X.; Sun, Q. Distributed Resilient Double-Gradient-Descent Based Energy Management Strategy for Multi-Energy System Under DoS Attacks. IEEE Trans. Netw. Sci. Eng. 2022, 9, 2301–2316. [Google Scholar] [CrossRef]
  136. Zhao, P.; Li, S.; Hu, P.J.H.; Cao, Z.; Gu, C.; Xie, D.; Zeng, D.D. Coordinated Cyber Security Enhancement for Grid-Transportation Systems with Social Engagement. IEEE Trans. Emerg. Top. Comput. Intell. 2022, 8, 3199–3213. [Google Scholar] [CrossRef]
  137. Masrur, H.; Gamil, M.M.; Islam, M.R.; Muttaqi, K.M.; Lipu, M.S.; Senjyu, T. An Optimized and Outage-Resilient Energy Management Framework for Multicarrier Energy Microgrids Integrating Demand Response. IEEE Trans. Ind. Appl. 2022, 58, 4171–4180. [Google Scholar] [CrossRef]
  138. Edwin, M.; Joseph Sekhar, S. Thermo-economic assessment of hybrid renewable energy based cooling system for food preservation in hilly terrain. Renew. Energy 2016, 87, 493–500. [Google Scholar] [CrossRef]
  139. Moslehi, S.; Reddy, T.A. A new quantitative life cycle sustainability assessment framework: Application to integrated energy systems. Appl. Energy 2019, 239, 482–493. [Google Scholar] [CrossRef]
  140. Elkadeem, M.R.; Abido, M.A. Optimal planning and operation of grid-connected PV/CHP/battery energy system considering demand response and electric vehicles for a multi-residential complex building. J. Energy Storage 2023, 72, 108198. [Google Scholar] [CrossRef]
  141. Ghezelbash, A.; Khaligh, V.; Anvari-Moghaddam, A. A cyber-secure model to decentralized co-expansion planning of gas and electricity networks. Int. J. Energy Res. 2021, 45, 13414–13428. [Google Scholar] [CrossRef]
  142. Guangtao, N.; Mingfan, C.; Linwei, L.; Jinhong, M.; Shuwei, M. Optimization of integrated energy supplying system in grid-connected island. In Proceedings of the IEEE Conference on Energy Internet and Energy System Integration (EI2), Beijing, China, 26–28 November 2017; pp. 1–5. [Google Scholar] [CrossRef]
  143. Postnikov, I.; Stennikov, V.; Penkovskii, A. Integrated energy supply schemes on basis of cogeneration plants and wind power plants. In Proceedings of the 10th International Conference on Applied Energy (ICAE2018), Hong Kong, China, 22–25 August 2019; Volume 158, pp. 154–159. [Google Scholar] [CrossRef]
  144. Kashanizadeh, B.; Shourkaei, H.M.; Fotuhi-Firuzabad, M. Short-term resilience-oriented enhancement in smart multiple residential energy system using local electrical storage system, demand side management and mobile generators. J. Energy Storage 2022, 52, 104825. [Google Scholar] [CrossRef]
  145. Chaudry, M.; Wu, J.; Jenkins, N. A sequential Monte Carlo model of the combined GB gas and electricity network. Energy Policy 2013, 62, 473–483. [Google Scholar] [CrossRef]
  146. Wang, S.; Shao, C.; Ding, Y.; Yan, J. Operational reliability of multi-energy customers considering service-based self-scheduling. Appl. Energy 2019, 254, 113531. [Google Scholar] [CrossRef]
  147. Kou, Y.; Bie, Z.; Li, G.; Liu, F.; Jiang, J. Reliability evaluation of multi-agent integrated energy systems with fully distributed communication. Energy 2021, 224, 120123. [Google Scholar] [CrossRef]
  148. Dou, Z.; Zhang, C.; Dai, R.; Wei, S.; Zhang, J.; Wang, L.; Jiang, C. Resilience enhancement strategy of multi-energy coupling distribution network considering movable energy storage equipment. J. Phys. Conf. Ser. 2023, 2418. [Google Scholar] [CrossRef]
  149. Maio, F.D.; Tonicello, P.; Zio, E. A Modeling and Analysis Framework for Integrated Energy Systems Exposed to Climate Change-Induced NaTech Accidental Scenarios. Sustainability 2022, 14, 786. [Google Scholar] [CrossRef]
  150. Li, B.; Chen, Y.; Wei, W.; Hou, Y.; Mei, S. Enhancing resilience of emergency heat and power supply via deployment of LNG tube trailers: A mean-risk optimization approach. Appl. Energy 2022, 318, 119204. [Google Scholar] [CrossRef]
  151. Billinton, R.; Li, W. Basic Concepts of Power System Reliability Evaluation. In Reliability Assessment of Electric Power Systems Using Monte Carlo Methods, 1st ed.; Springer: Berlin/Heidelberg, Germany, 1994; Chapter 2; pp. 9–31. [Google Scholar] [CrossRef]
  152. Boroujeni, H.F.; Eghtedari, M.; Bastaki, M.A.; Behzadipour, E.; Boroujeni, H.F.; Abdollahi, M. Calculation of generation system reliability index: Loss of Load Probability. Life Sci. J. 2012, 9, 4903–4908. [Google Scholar]
  153. Al-Shaalan, A.M. Reliability evaluation in generation expansion planning based on the expected energy not served. J. King Saud. Univ.-Eng. Sci. 2012, 24, 11–18. [Google Scholar] [CrossRef]
  154. Bichpuriya, Y.K.; Navalkar, P.V.; Soman, S.A. Benchmarking of reliability indices for electricity distribution utilities: Approach and discussion. In Proceedings of the IET Conference on Reliability of Transmission and Distribution Networks (RTDN 2011), London, UK, 22–24 November 2011; pp. 1–6. [Google Scholar] [CrossRef]
  155. Zhao, P.; Gu, C.; Cao, Z.; Xie, D.; Teng, F.; Li, J.; Chen, X.; Wu, C.; Yu, D.; Xu, X.; et al. A Cyber-Secured Operation for Water-Energy Nexus. IEEE Trans. Power Syst. 2021, 36, 3105–3117. [Google Scholar] [CrossRef]
  156. Wang, J.; Zheng, X.; Tai, N.; Yang, Z.; Wang, J.; Wei, W.; Li, L. Resilience-oriented multi-energy complementary microgrid robust optimal operation strategy considering the uncertainty. In Proceedings of the 8th Renewable Power Generation Conference (RPG 2019), Shanghai, China, 24–25 October 2019; pp. 1–7. [Google Scholar] [CrossRef]
  157. Alasvand Javadi, E.; Joorabian, M.; Barati, H. A bi-level optimization framework for resilience enhancement of electricity and natural gas networks with participation of energy hubs. Int. J. Electr. Power Energy Syst. 2022, 142, 108312. [Google Scholar] [CrossRef]
  158. Hosseini, S.E.; Ahmarinejad, A.; Tabrizian, M.; Bidgoli, M.A. Resilience enhancement of integrated electricity-gas-heating networks through automatic switching in the presence of energy storage systems. J. Energy Storage 2022, 47, 103662. [Google Scholar] [CrossRef]
  159. Ravadanegh, S.N.; Jamali, S.; Mohammadi Vaniar, A. Multi-infrastructure energy systems resiliency assessment in the presence of multi-hazards disasters. Sustain. Cities Soc. 2022, 79, 103687. [Google Scholar] [CrossRef]
  160. Rezaei, S.; Ghasemi, A. Stochastic scheduling of resilient interconnected energy hubs considering peer-to-peer energy trading and energy storages. J. Energy Storage 2022, 50, 104665. [Google Scholar] [CrossRef]
  161. Alasvand Javadi, E.; Joorabian, M.; Barati, H. A sustainable framework for resilience enhancement of integrated energy systems in the presence of energy storage systems and fast-acting flexible loads. J. Energy Storage. 2022, 49, 104099. [Google Scholar] [CrossRef]
  162. Hinkelman, K.; Anbarasu, S.; Zuo, W. Exergy-based ecological network analysis for building and community energy systems. Energy Build. 2024, 303, 113807. [Google Scholar] [CrossRef]
  163. Chatterjee, A.; Layton, A. Mimicking nature for resilient resource and infrastructure network design. Reliab. Eng. Syst. Saf. 2020, 204, 107142. [Google Scholar] [CrossRef]
  164. Maihemuti, S.; Wang, W.; Wang, H.; Wu, J.; Zhang, X. Dynamic Security and Stability Region under Different Renewable Energy Permeability in IENGS System. IEEE Access 2021, 9, 76531. [Google Scholar] [CrossRef]
  165. Huang, W.; Zhang, X.; Li, K.; Zhang, N.; Strbac, G.; Kang, C. Resilience Oriented Planning of Urban Multi-Energy Systems with Generalized Energy Storage Sources. IEEE Trans. Power Syst. 2022, 37, 2906–2918. [Google Scholar] [CrossRef]
  166. Bao, M.; Ding, Y.; Sang, M.; Li, D.; Shao, C.; Yan, J. Modeling and evaluating nodal resilience of multi-energy systems under windstorms. Appl. Energy 2020, 270, 115136. [Google Scholar] [CrossRef]
  167. Hindmarsh, A.C.; Serban, R.; Reynolds, D.R. User Documentation for CVODE v5.1.0 (SUNDIALS v5.1.0); Technical Report; Lawrence Livermore National Laboratory: Livermore, CA, USA, 2020. [Google Scholar]
  168. Cellier, F.E.; Kofman, E. Continuous System Simulation; Springer: New York, NY, USA, 2006. [Google Scholar]
  169. Colavizza, G.; Cadwallader, L.; LaFlamme, M.; Dozot, G.; Lecorney, S.; Rappo, D.; Hrynaszkiewicz, I. An analysis of the effects of sharing research data, code, and preprints on citations. PLoS ONE 2024, 19, e0311493. [Google Scholar] [CrossRef]
Figure 1. Schematic MES with exemplary sources, conversions, and deliveries of multiple energies.
Energies 18 04536 g001
Figure 2. Functional system performance with resilience stages before, during, and after a disturbance.
Energies 18 04536 g002
Figure 3. The review protocol to identify documents based on PRISMA 2020 [52].
Energies 18 04536 g003
Figure 4. Number of documents published each year on equity, resilience, or both. Note that the final year (2023) is a partial year.
Energies 18 04536 g004
Figure 5. Homogeneous network map of commonly occurring terms from all included documents. Top three countries from first author affiliations are listed for each cluster.
Energies 18 04536 g005
Figure 6. Adoption of (a) source energy types (20 most frequently occurring) and (bd) energy class for decarbonization goals with documents focusing on (b) resilience only, (c) equity only, and (d) equity and resilience. In (a), energies with * are not primary sources (primary sources not specified in text). Energies with † are generic categories given in text without further details.
Energies 18 04536 g006
Figure 7. Occurrence frequency of multi-energy conversion equipment and systems with more than one occurrence. Sector couplings include biomass-to-gas (B2G), biomass-to-heat (B2H), power-to-gas (P2G), and power-to-heat (P2H).
Energies 18 04536 g007
Figure 8. Relative number of documents published each year since 2015 that include storage.
Energies 18 04536 g008
Figure 9. Number of network types included in each case study. Lines are annual averages for each category. Shaded regions are the annual minimum and maximum for each category. The dashed black line is the linear fit of the annual average number of networks for all categories.
Energies 18 04536 g009
Figure 10. Geographical locations of case studies with respect to country-level economic statuses, with larger circles indicating a higher number of studies at a given location. Low-income countries are not represented in the studied literature.
Energies 18 04536 g010
Figure 11. Model features with statistically significant differences (asterisks) with respect to scope.
Energies 18 04536 g011
Figure 12. Optimization objectives in papers with various resilience/equity scopes. Asterisks indicate statistically significant differences.
Energies 18 04536 g012
Figure 13. Distribution of resilience index results for baseline and proposed model systems with respect to (a) the number of network types and (b) the overall frequency distribution.
Energies 18 04536 g013
Figure 14. Resiliency index with respect to relative total and operational costs/profits (profit if greater than one). Linear regression trend-lines are included for publications exhibiting R 2 > 80 % . Citations are: Liu et al. [29], Yodo and Arfin [131], Javadi et al. (2022a) [157], Javadi et al. (2022b) [161], Rezaei and Ghasemi [160], and Wang et al. [156].
Energies 18 04536 g014
Table 1. Keywords for literature search.
orandor
multi-energy, multiple energy, energy hub*, integrated energy, interconnected energy, hybrid energy resilien*, vulnerab*, disadvant*, protect*, secur*, *equality, equit, justice, developing countr*, underdeveloped countr*, low-income, afordab*
Total number of documents: 2420. * The asterisk (*) is a wildcard character that allows for variations of the root word.
Table 2. Classification categories for all documents included in the detailed review.
CategoryVariables
Physical SystemsEnergy classnonrenewable/carbon-producing, renewable/carbon-producing, renewable/carbon-free
Source energiesgrid, natural gas, solar (thermal), wind, biomass, etc.
Equipmentboiler, chiller, CHP, anaerobic digestion, mobile storage, etc.
Networkselectric, heating, cooling, transportation, gas, etc.
End useselectric, heating, cooling, gas, etc.
Research ApproachesScopeequity only, resilience only, equity and resilience
Scalebuilding, district, region
LocationGeographical coordinates of the case study site
Income levelCountry-level income classification of case study site
ClimateKöppen climate classification of case study site
SoftwareMATLAB, GAMS, Python, etc.
Model typeMILP, MINLP, ODE, etc. †
Model formulationdynamic or steady; stochastic or deterministic; linear or nonlinear
Time step ( d t )time increment assumed for dynamic models
Engineering stageplanning, design, control/operation
MOO method †weighs, levels/stages, Pareto front, single
Optimization objectivemetric(s) being minimized/maximized in the study
Key metricslife cycle cost, resilience index, total shifted load, etc.
† MOO: multi-objective optimization. MILP: mixed integer linear programming. MINLP: mixed integer nonlinear programming. ODE: ordinary differential equations.
Table 3. Top ten frequently occurring terms excluding original search criteria and common single energy terms.
TermFrequencyn
energy storage5641
demand response2620
combined heat and power2323
cascading failure1912
environmental protection1812
renewable energy sources1714
transportation network169
distributed energy resources1310
CO2 emissions128
extreme weather events119
Table 4. Total number of occurrences of case studies across major climates in Köppen-Geiger [58].
Climate Groupn
A (Tropical)5
B (Arid)13
C (Warm temperate)56
D (Snow)16
E (Polar)2
Disclaimer/Publisher’s Note: The statements, opinions and data contained in all publications are solely those of the individual author(s) and contributor(s) and not of MDPI and/or the editor(s). MDPI and/or the editor(s) disclaim responsibility for any injury to people or property resulting from any ideas, methods, instructions or products referred to in the content.