Article

Simulation of Combustor Inlet Flow Field via Segmented Blade Twist and Leading-Edge Baffles

1
School of Energy and Power Engineering, Chongqing University, Chongqing 400044, China
2
AECC Sichuan Gas Turbine Estab, Mianyang 621000, China
3
Key Laboratory of Low-Grade Energy Utilization Technologies and Systems, Chongqing University, Ministry of Education, Chongqing 400030, China
*
Author to whom correspondence should be addressed.
Energies 2025, 18(17), 4535; https://doi.org/10.3390/en18174535
Submission received: 16 July 2025 / Revised: 20 August 2025 / Accepted: 25 August 2025 / Published: 27 August 2025

Abstract

High-fidelity replication of compressor exit flow fields is critical for combustor design, yet current simulation facilities lack effective, decoupled control of flow parameters. This study proposes a coordinated optimization strategy combining segmented stationary blade twist with leading-edge baffle configurations. The blades are divided into three spanwise sections with independently optimized twist angles to match airflow deflection. Upstream baffles are redesigned by reducing thickness, shortening horizontal length, and adjusting spanwise position to improve total velocity distribution. The final Plate-T configuration achieves a peak total velocity error of ~3.0% and position error of ~8.5%, while maintaining deflection angle accuracy. Experimental validation confirms improved agreement with compressor outlet flow fields, providing robust support for studies on flame stability, emissions, and combustion performance, as well as guidance for aero-engine experimental facility design.

1. Introduction

High-fidelity simulation of compressor exit flow fields is crucial for evaluating combustion stability, emission characteristics, and thermoacoustic performance in modern aero-engines and gas turbines [1,2,3]. At the combustor inlet, the coupled distributions of total velocity and flow deflection angle directly determine fuel–air mixing efficiency and flame anchoring behavior [4]. However, traditional experimental test rigs often face limitations when reproducing complex coupled flow fields due to structural constraints. The previous work in [5] provides valuable insights into boundary condition modeling, but its scope does not directly address high-fidelity replication of realistic exit flow fields. Single-twist-angle stationary blades are insufficient to control spanwise flow, and conventional flow regulation devices often introduce excessive pressure losses and turbulence distortion. This mismatch causes deviations in critical parameters relative to real engine conditions, which fundamentally limits the reliability of combustor performance validation [6,7].
Previous studies indicate that the typical compressor outlet flow characteristics—characterized by high peak flow deflection angles at mid-span and lower values near the root and tip—directly influence fuel–air mixing efficiency and flame anchoring behavior [8,9,10,11,12]. Additionally, the total velocity distribution along the blade height governs the inlet momentum distribution and flow uniformity at local mixers, thereby affecting combustion efficiency and emissions [13,14]. Numerical simulations of traditional fixed-twist-angle stator blades often fail to simultaneously match the peak magnitudes, spatial positions, and overall velocity distribution, resulting in significant deviations from real compressor exit flow fields [15].
Research focused on blade design optimization for matching target flow fields has been conducted by researchers such as Asgari et al. [16], who developed a multi-objective optimization framework for subsonic axial compressors using integrated computational methods, aeroelastic modeling, and advanced optimization techniques including NSGA-II, ANN, and TOPSIS. CFD and FEA were used to evaluate complex fluid–structure interactions, resulting in a 2.8% increase in the total pressure coefficient, a 3.2% improvement in efficiency, and an 8.9% reduction in maximum stress. Similarly, Xu et al. [17] introduced TurbineNet, coupled with FFD and DE algorithms, to enhance aerodynamic performance prediction and optimize NREL S814 blades, increasing the power coefficient by at least 20% across a range of tip speed ratios. Krishnan et al. [18] combined blade design with biomimetic principles to improve flow adaptability under adverse conditions, which led to an improved self-starting capability. Fan et al. [19] simplified rotating blades with variable cross-sections into cantilever trapezoidal plates to investigate the effects of rotational speed, taper ratio, and excitation parameters on amplitude–frequency and amplitude–force characteristics.
Nevertheless, blade twisting alone has only a limited effect on total velocity distributions. Although blade twist modifications improve flow angle distributions, the lack of effective local channel blockage control makes it difficult to replicate compressor outlet velocity characteristics. This limitation can result in non-uniform combustor inlet velocity distributions, the formation of circulating vortices, and flame instability [20,21,22]. Consequently, researchers have proposed additional structural elements to adjust the velocity distribution within annular flow passages, enabling closer alignment with target flow fields. Liu et al. [23] developed a novel pre-swirl modulation system using blade-shaped nozzles to address circumferential non-uniformities in the flow field. Increasing the number of pre-swirl nozzles significantly enhanced the efficiency and effectiveness of flow regulation. Asim et al. [24] incorporated stators into transient CFD analyses of traditional multi-blade, drag-based vertical axis wind turbines (VAWTs) to improve startup performance and enhance downstream flow uniformity.
Current research predominantly focuses on individual influencing factors—for example, optimizing blade twist or hub lean to improve stage matching and stability [15], or incorporating inlet guide vanes or other structures to adjust swirl and velocity distributions at combustor inlets [25]. However, studies investigating the coupling effects between blade twist and upstream flow control structures are still limited. To address this gap, the present study proposes a coordinated flow control strategy that combines segmented variable-twist stator blades with upstream baffle structures. Through numerical simulations under full-load conditions, the coupling effects of different twist-angle combinations and baffle configurations are analyzed to evaluate their ability to regulate flow uniformity and velocity distribution. A feasible design methodology is subsequently proposed to achieve targeted flow field matching, offering practical guidance for designing combustor test platforms and annular flow simulation devices in aero-engine applications. The remainder of this paper is organized as follows: Section 2 describes the physical model, governing equations, turbulence model, mesh generation, boundary conditions, and evaluation indicators used in the numerical simulations. Section 3 presents and discusses the results of segmented variable-twist blade optimization and upstream baffle design, highlighting their effects on the combustor inlet flow field. Section 4 summarizes the key conclusions and potential implications for combustor test platform design and aero-engine experimental facilities.

2. Materials and Methods

2.1. Physical Model

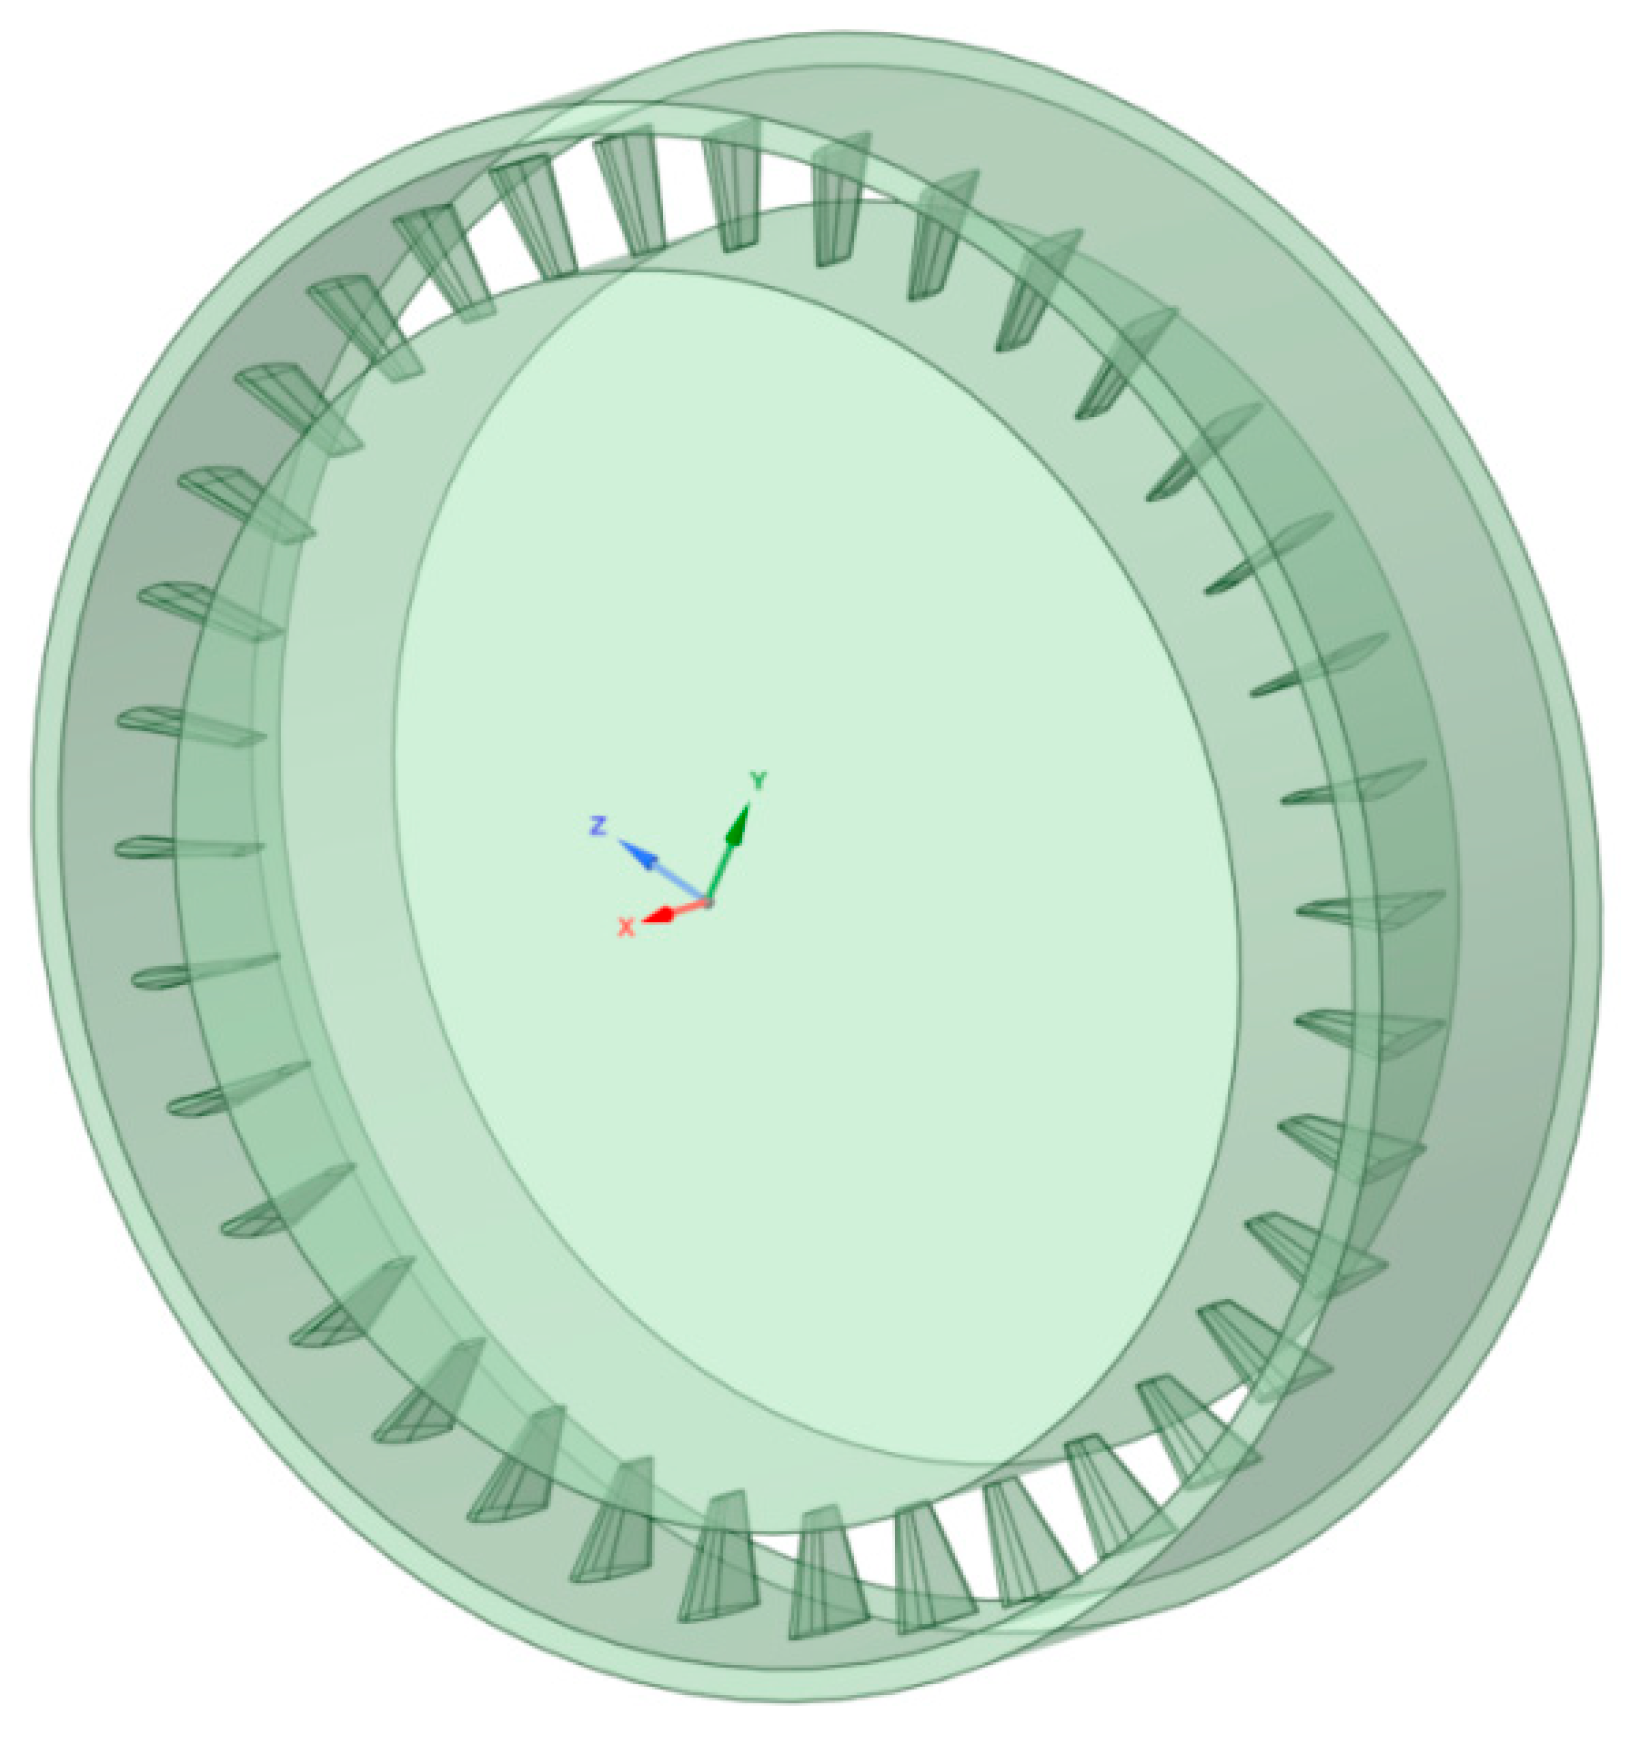
The compressor outlet flow field simulation device was developed based on a five-stage axial compressor model [26], with a designed outer casing diameter of 210.1 mm, inner casing diameter of 200.1 mm, hub diameter of 172.8 mm, and flow passage length of 68.4 mm, as shown in Figure 1.
The stator blade airfoil of the simulation apparatus was designed using the NACA0008 airfoil profile and analyzed accordingly, as illustrated in Figure 2.
Blades are uniformly distributed along the circumferential direction of the simulation device flow passage. The complete model of the simulation device is shown in Figure 3. A uniform inlet flow enters the device and undergoes directional deflection and abrupt velocity changes after passing through the blades. This study adjusts blade geometric parameters and the local blockage ratio within the flow passage to calibrate the outlet flow field of the simulation device to match that of the five-stage axial compressor under full load (100% n0) conditions, thus determining the optimal blade design and flow passage structure. Based on the optimized configuration, the installation angles of the blades are further adjusted according to the variations in total velocity and airflow deflection angle at the combustor inlet cross-section under different operating conditions to ensure accurate reproduction of the target flow field across various rotational speeds.
For performance evaluation, the radial velocity and airflow deflection angle were calculated as follows:
The radial velocity, denoted by V , represents the total airflow component in the radial direction. The airflow deflection angle, denoted by θ , describes the angular deviation of the airflow relative to the circumferential direction. In multi-stage axial compressors, this angle characterizes the extent to which the flow direction changes after passing through the compressor blades. This parameter is critical for assessing compressor performance, as it indicates the degree of flow turning induced by the blade rows.
The expression for the airflow deflection angle is defined as follows:
a = a tan ( V t V m )
V m = V r 2 + V z 2
Vz denotes the axial component of the airflow velocity; Vt denotes the tangential component; Vr denotes the radial component; and Vm denotes the meridional velocity of the airflow.

2.2. Governing Equations

The content of Table 1 includes the definitions of the relevant variables mentioned below.
Based on the continuum assumption, the flow within the combustor is governed by the fundamental conservation laws of mass and momentum. Since only single-species incompressible air was considered and no heat transfer was modeled in this study, the energy equation was omitted. The governing equations used in the numerical simulations are given below [27,28,29,30]:
  • Continuity Equation:
ρ δ v i δ x i = 0 i = 1 , 2 , 3
where ρ represents the fluid density (kg/m3) and v denotes the velocity (m/s).
2.
Momentum Conservation Equation:
( ρ u i u j ) = p + τ + F i j = 1 , 2 , 3
where p represents the pressure acting on the fluid element (Pa), τ is the shear stress tensor, and F denotes the external body force tensor.
In turbulence modeling, this equation is further processed via Reynolds decomposition and time-averaging to yield the Reynolds-Averaged Navier–Stokes (RANS) equations, which are introduced in Section 2.3.

2.3. Turbulence Model

The RANS equations, derived from the instantaneous momentum equation (Equation (4)) by decomposing each flow variable into mean and fluctuating components and performing time-averaging, describe the transport of mean flow quantities. The resulting form, shown in Equation (5), introduces an additional Reynolds stress term, which requires closure through a turbulence model.
The Reynolds-Averaged Navier–Stokes (RANS) equations describe the time-averaged behavior of physical quantities within the flow field and can be written as follows [31,32]:
( ρ u i u j ) x j = p x i + x j [ μ ( u i x j + u j x i 2 3 δ i j u k x k ) ] + x j ( ρ u i u j ¯ )
where ρ u i u j ¯ represents the additional Reynolds stress term. To close the RANS equations, the Boussinesq eddy viscosity hypothesis is introduced, under which the turbulent stresses are modeled as follows:
( ρ u i u j ¯ ) = ( τ i j ) t = p t δ i j + μ t ( u i x j + u j x i ) 2 3 ( ρ k + μ t u i x j ) δ i j
where k denotes the turbulent kinetic energy per unit mass, and μ t represents the eddy viscosity coefficient.
By introducing a turbulence closure for the eddy viscosity μ t , the Reynolds-Averaged Navier–Stokes equations for turbulent flow can be solved. Among the various models, the two-equation k ε model remains the most widely used approach for simulating turbulent flow in combustor flow simulations [33].
The k ε model estimates the turbulent length and time scales by solving the transport equations for turbulent kinetic energy k and its dissipation rate ε . Depending on whether modifications are applied to the dissipation rate equation, this model can be categorized into the Standard k ε turbulence model and the Realizable k ε turbulence model. The following section provides an overview of these two models [34].
The Standard k ε turbulence model is characterized by the following transport equations for turbulent kinetic energy k and its dissipation rate ε [35]:
( ρ k u i ) x i = x j [ ( μ + μ t σ k ) k x j ] + G k + G b ρ ε Y M + S k
( ρ ε u i ) x i = x j [ ( μ + μ t σ ε ) ε x j ] + C 1 ε ε k ( G k + C 3 ε G b ) C 2 ε ρ ε 2 k + S ε
σ k and σ ε denote the turbulent Prandtl numbers for k and ε , with values of 1.0 and 1.3, respectively. S k and S ε represent the corresponding source terms. The empirical constants are C 1 ε = 1.44 and C 2 ε = 1.92. The expressions for G k , G b , and Y M are given as follows:
G k = ρ u i u j ¯ u j x i
G b = β g i μ t Pr t T x i
Y M = 2 ρ ε M t 2
In this turbulence model, the eddy viscosity μ t is defined as
μ t = ρ C μ k 2 ε
in which C μ = 0.09.
Although the Standard kε model was not used in the present simulations, its equations are included here for completeness and to highlight the differences from the Realizable k–ε model applied in this study.
The Realizable k ε turbulence model is developed based on the Standard k ε model, with specific modifications applied to the dissipation rate ε . The Realizable kε model was selected because it provides improved predictions for swirling and separating flows, better accounts for normal stress anisotropy, and enhances near-wall accuracy, making it suitable for the complex turbulent flow at the combustor inlet in this study. The expression for ε in this model is given as follows [31]:
( ρ ε u j ) x i = x j [ ( μ + μ t σ s ) ε x j ] + ρ C 1 S ε ρ C 2 ε 2 k + ν ε + C 1 ε ε k C 3 ε G b + S ε
In this equation, the coefficient C 1 is defined as C 1 = max [ 0.43 , η η + 5 ] , η = S k ε , S = 2 S i j S i j . The constants C 1 ε , C 2 , σ k , and σ ε are assigned values of 1.44, 1.9, 1.0, and 1.2, respectively. The expression for the eddy viscosity μ t remains consistent with that in Equation (12); however, C μ is not a constant. Its expression is given by
C μ = 1 A 0 + A s k U ε
In this equation, A 0 = 4.04 , A s = 6 cos φ , U = S i j S i j + Ω i j ˜ Ω i j ˜ , Ω i j ˜ = Ω i j 2 ε i j k ω k , Ω i j = Ω i j ¯ ε i j k ω k .
The Realizable k ε turbulence model is employed in this study as it offers improved computational accuracy and reliability.

2.4. Boundary Conditions

In this study, numerical simulations of the device were performed using Fluent software 2021R1. The Realizable k ε turbulence model was employed, with the standard wall function applied near solid boundaries. A second-order upwind scheme was employed for spatial discretization, and the Coupled algorithm was applied for pressure–velocity coupling [36]. During the simulation, a mass flow inlet boundary condition was specified at the inlet, while the outlet was set as a pressure outlet. All wall surfaces were set as adiabatic with a no-slip velocity condition. For the turbulence quantities at the inlet, the specification method was “Intensity and Hydraulic Diameter”. A turbulence intensity of I = 5% was adopted, and the hydraulic diameter of the annular passage was set to Dh = 27.3 mm. Accordingly, the turbulence kinetic energy and dissipation rate were evaluated from k = 3/2(UI)2 and ε = C μ 3 4 k 3 2 / l , with C μ = 0.09 and l = 0.07 Dh. The mean inlet velocity U was obtained from the specified mass flow rate and the annulus area under the inlet thermodynamic state, yielding U ≈ 286.9 m/s, k ≈ 3.09 × 10² m2/s2, and ε ≈ 4.66 × 10⁵ m2/s3. These values were passed to the solver through the intensity–diameter option to ensure a consistent and reproducible inlet turbulence level. For clarity, only a single-species flow was considered; therefore, species indices were omitted throughout the governing equations. The boundary conditions for the representative operating case are summarized in Table 2.

2.5. Grid Independence Verification

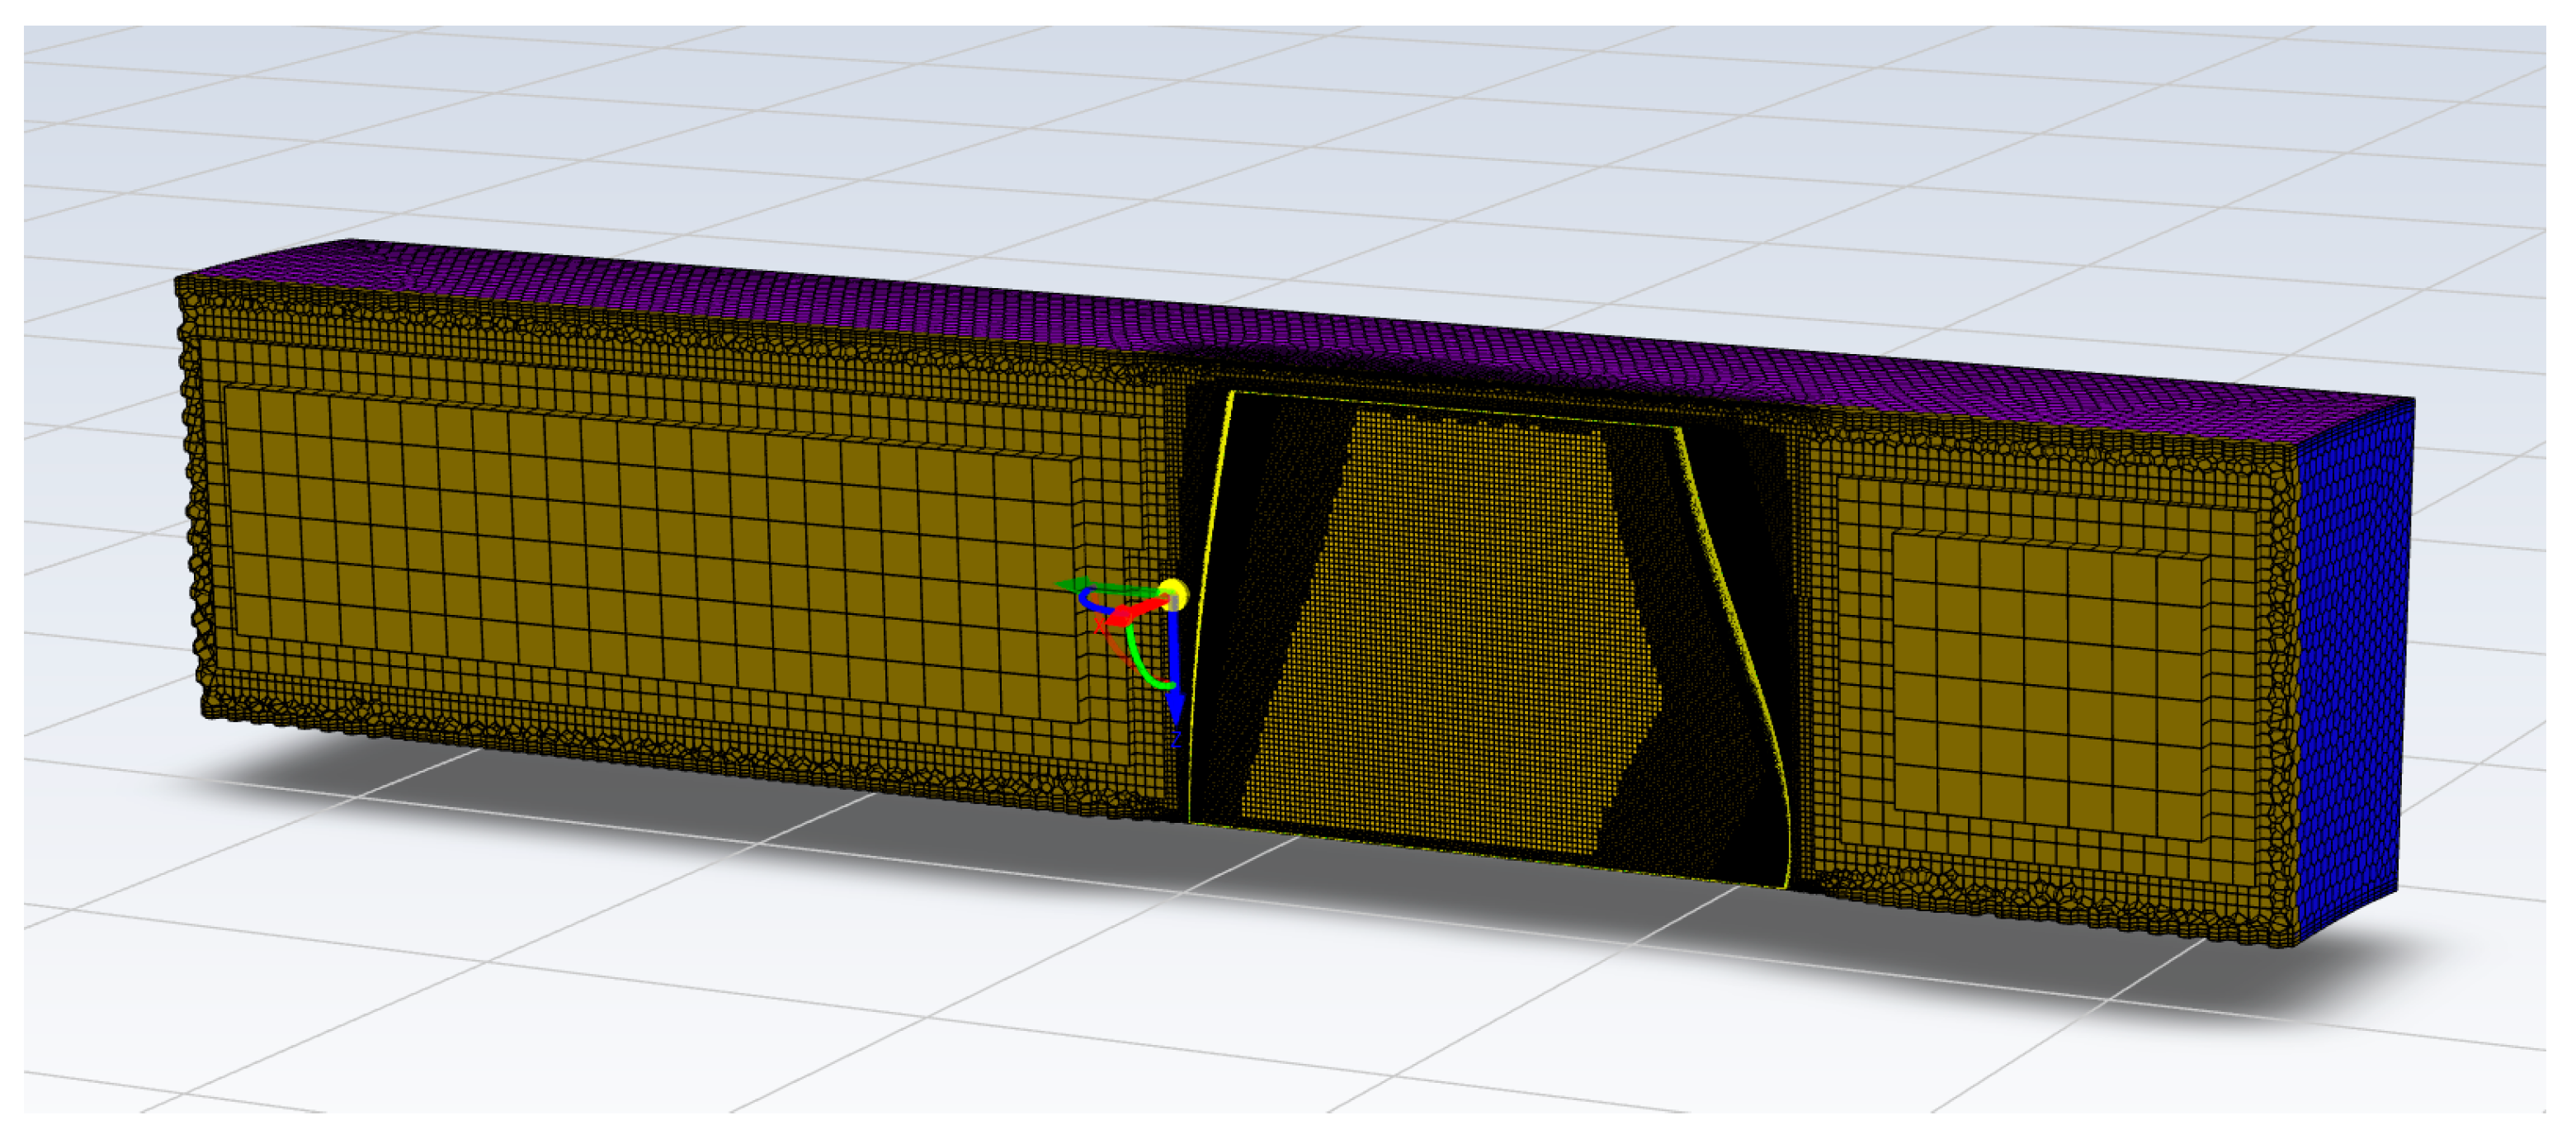
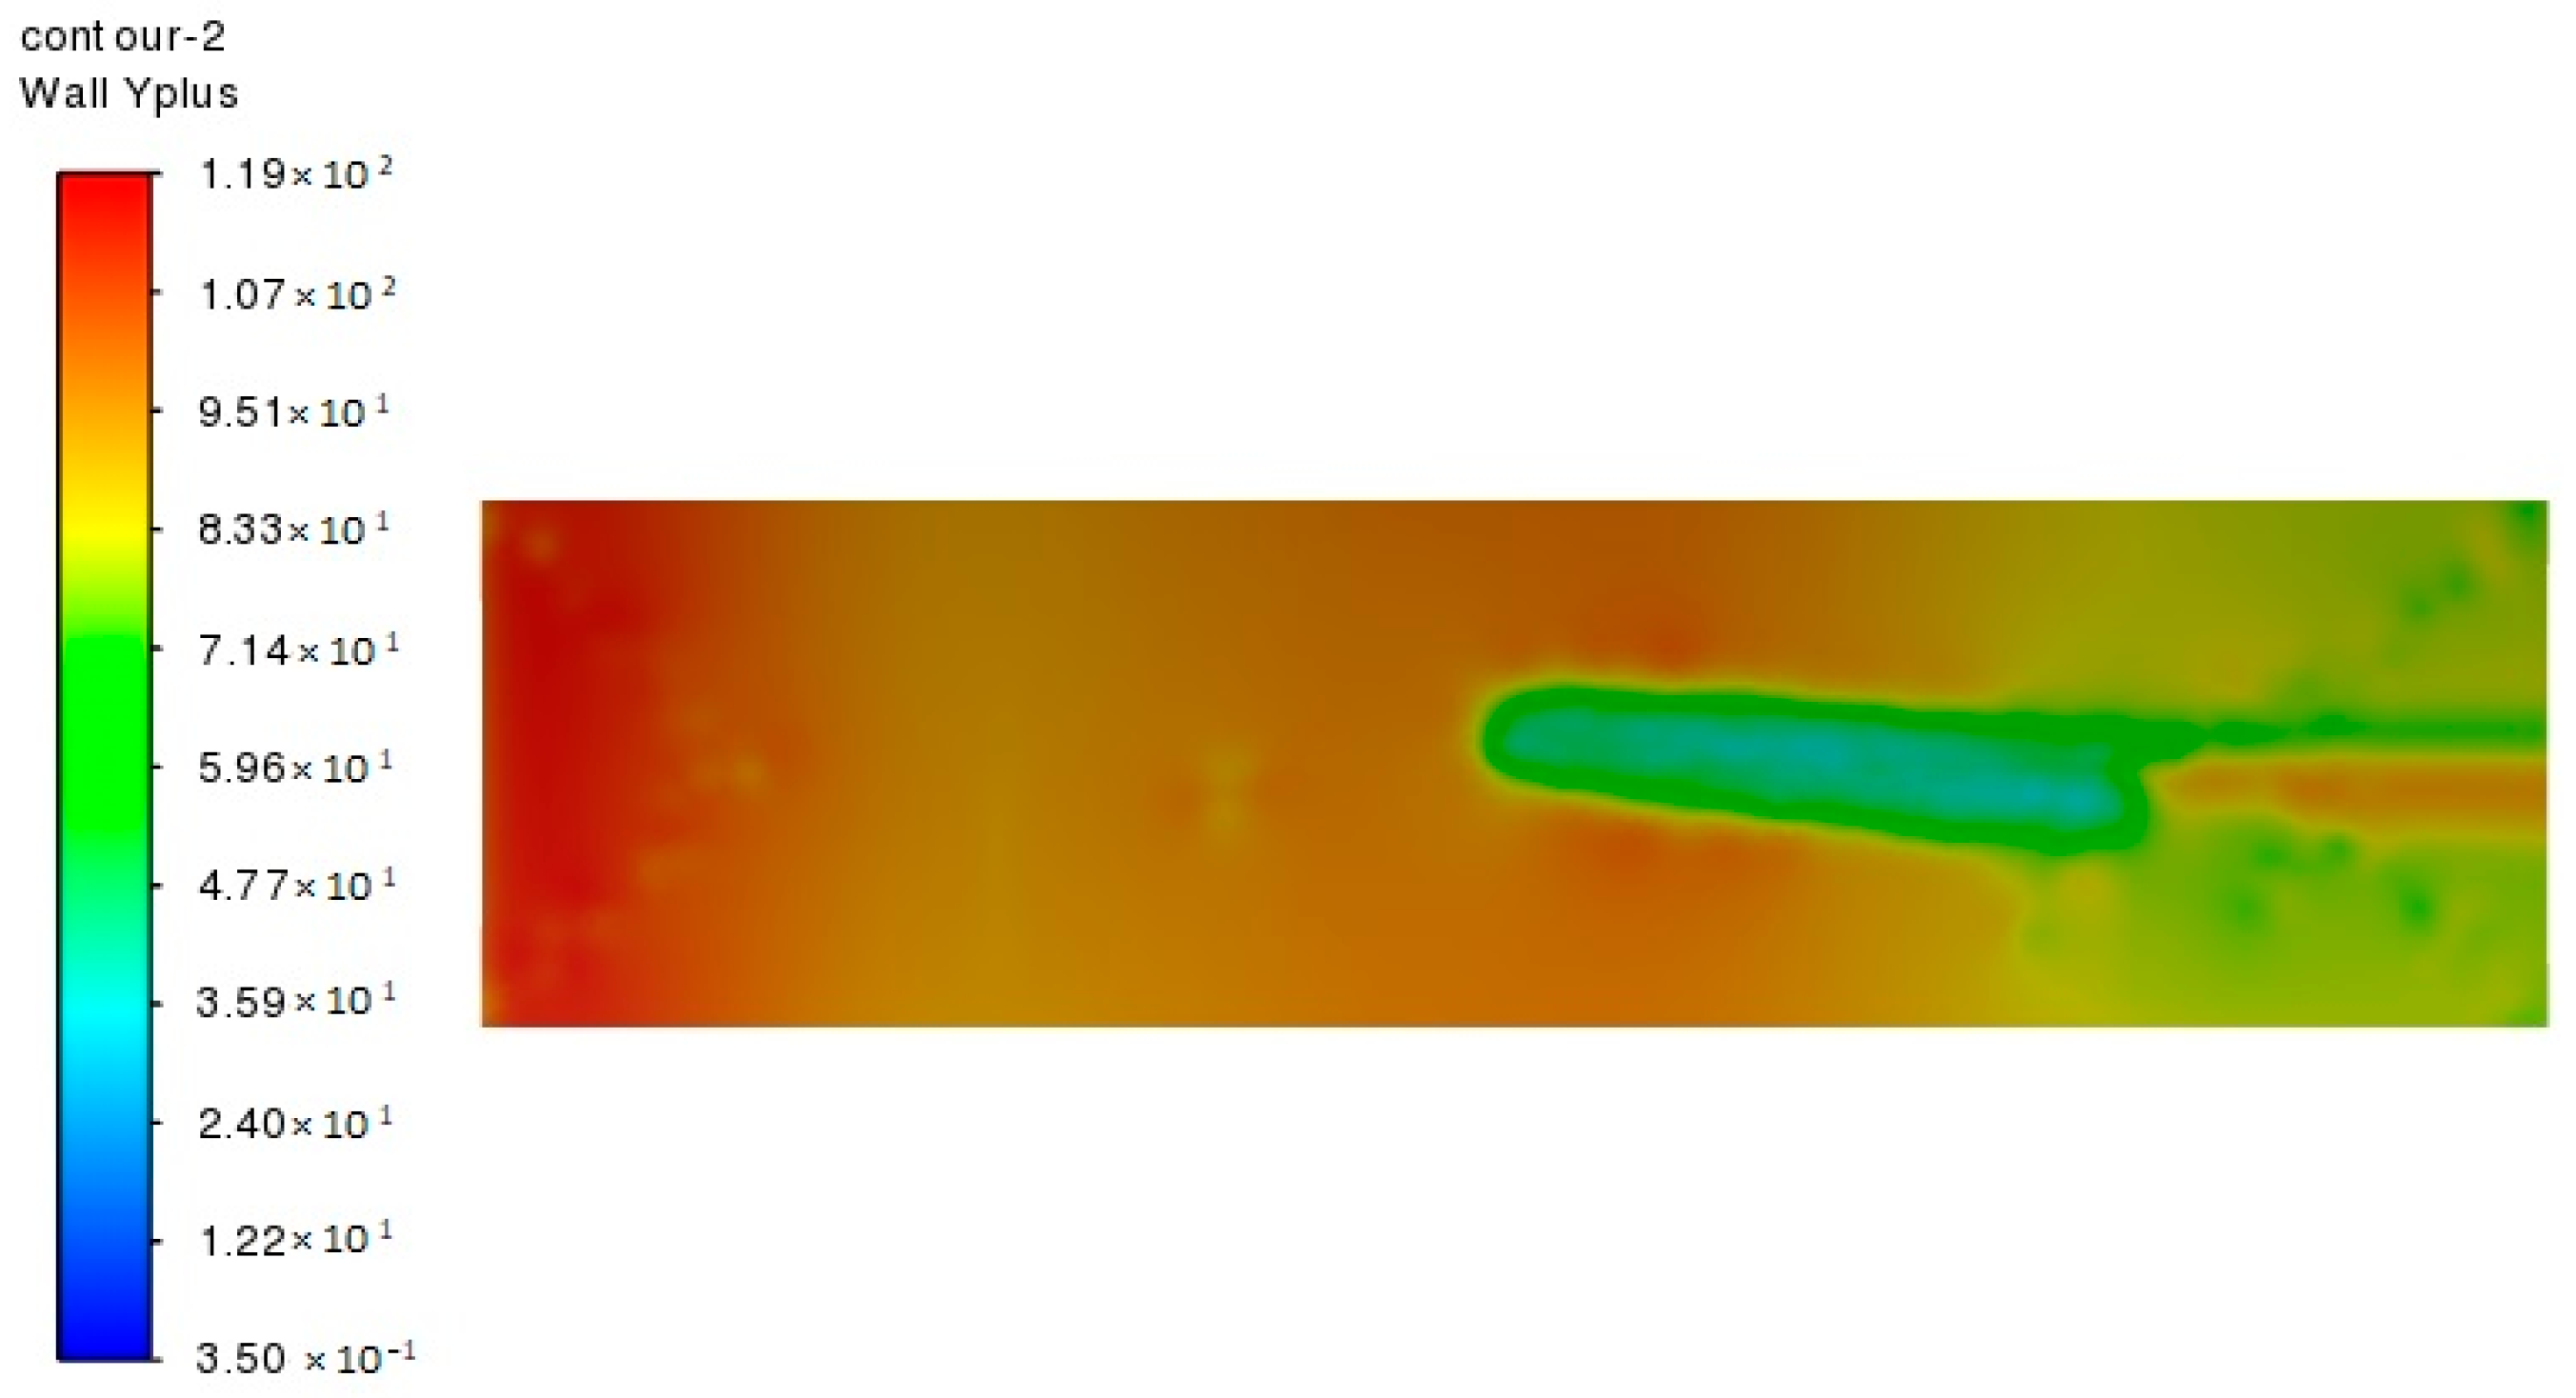
In this study, the mesh of the combustor inlet simulator was generated using unstructured Poly-Hexcore grids in Fluent Meshing, with local refinement in critical regions, as illustrated in Figure 4. The near-wall mesh resolution was controlled to achieve a minimum grid size of 0.08 mm at the leading and trailing edges, 0.12 mm on the hub/casing walls, and 0.15 mm on the blade surfaces, with 20 prism layers in the wall’s normal direction. The wall y+ values were monitored during the simulations and were found to range from approximately 35 to 120 over all solid surfaces, as illustrated in Figure 5. This distribution confirms that the near-wall resolution satisfies the requirements for the standard wall function approach used in the Realizable kε turbulence model. The total cell counts of the four mesh cases were 2.4 million, 3.7 million, 4.3 million, and 5.5 million, respectively. All cases were simulated at an inlet mass flow rate of 6.574 kg/s under full load conditions.
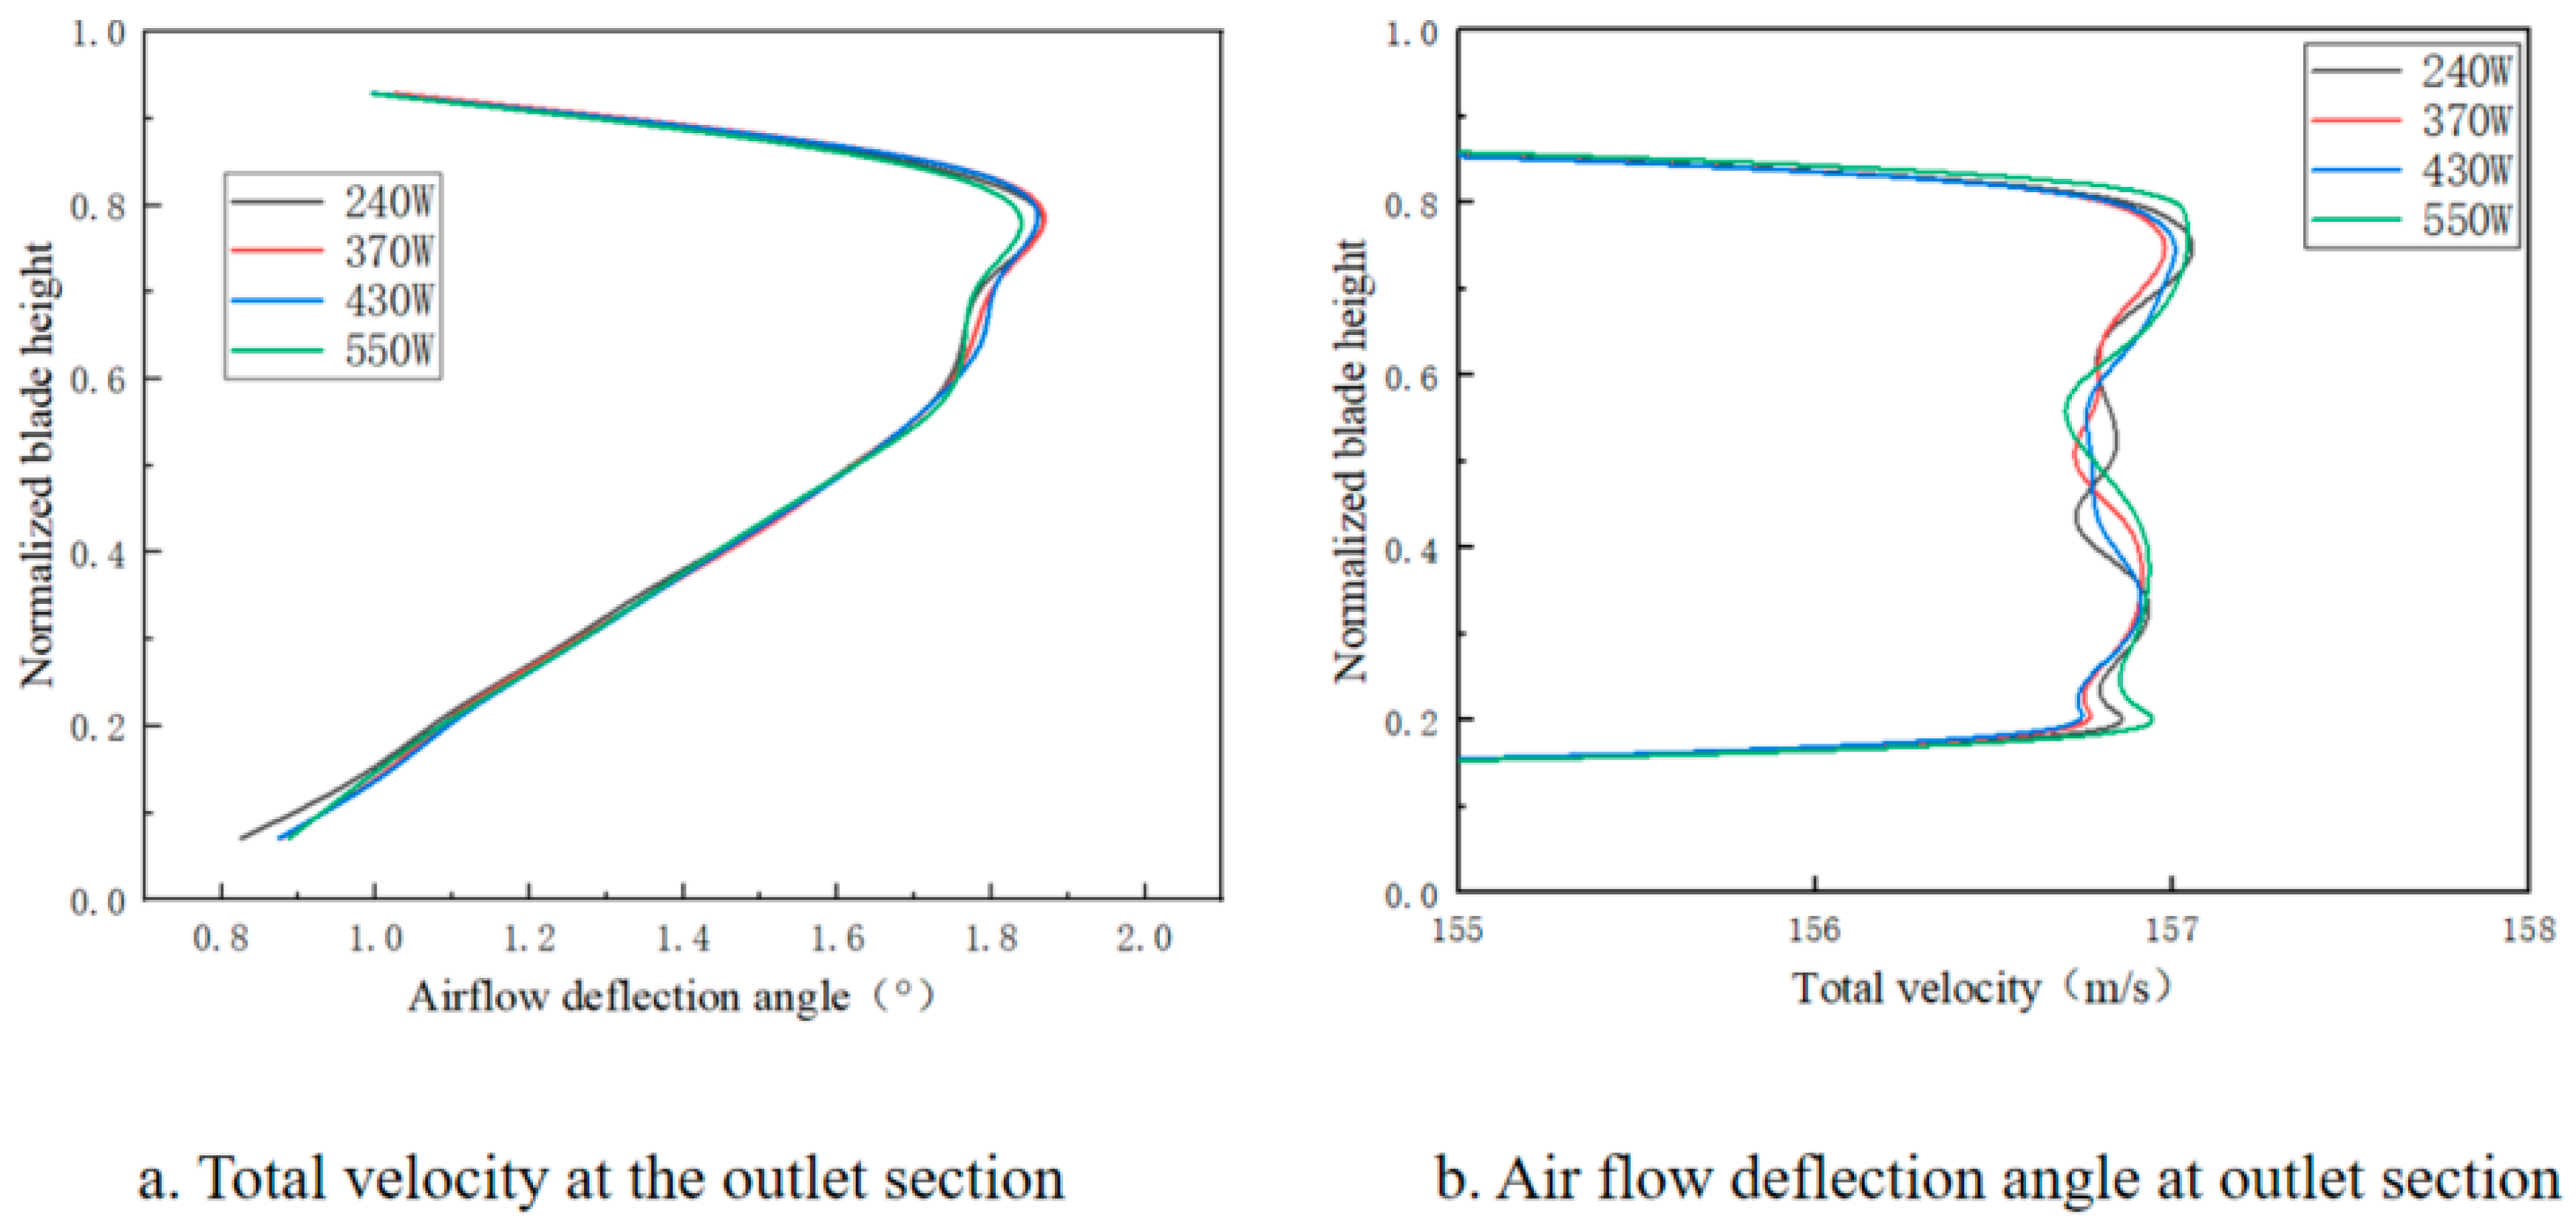
Figure 6a compares the radial distributions of total velocity and flow deflection angle at the outlet cross-section for the four mesh cases. The 2.4 M-cell mesh shows small deviations from finer meshes, with a maximum velocity difference of 1.8% compared to the 3.7 M-cell case. When the mesh density increases to 4.3 M cells, the difference from the finest mesh (5.5 M) is within 0.5% for total velocity and within 0.1° for flow deflection angle. Figure 6b shows the convergence histories of residuals and monitored outlet parameters. All cases reached residual levels below 1 × 10⁻⁵ for the continuity, momentum, and energy equations, and the outlet mass flow and total pressure stabilized within ±0.1% over the last 500 iterations. The similarity of the results between the 4.3 M- and 5.5 M-cell meshes indicates that further refinement has a negligible influence on the predicted flow field while increasing computational cost. Therefore, the 4.3 M-cell mesh was selected for subsequent simulations to ensure both accuracy and efficiency, reducing computational cost and shortening the design cycle of the simulation apparatus.

3. Results and Discussion

3.1. Effect of Two-Section Variable-Twist Blade Design on the Flow Field

Numerical simulations of the flow field based on a conventional blade configuration demonstrate that the standard design does not satisfy the required airflow deflection angle at the inlet of the combustion chamber simulation device. Therefore, the blade geometry must be further modified to adjust both the peak location and magnitude of the deflection angle in order to reduce deviations from the flow deflection characteristics at the compressor outlet. Considering that the airflow deflection angle is significantly influenced by the inlet flow angle—and that under uniform inflow conditions, the inlet flow angle is in turn affected by the blade twist angle—the spanwise distribution of blade twist plays a key indirect role in determining the radial distribution of the deflection angle. Based on the conventional blade design, this study retains the optimized blade chord length, blade height, and number of circumferential blades, while focusing on the distribution and intensity of blade twist along the span. A series of numerical simulations were performed to investigate the influence of twist angle distribution on the flow field, aiming to evaluate the effectiveness of this approach in improving the deflection angle distribution at the inlet of the combustion chamber simulation device.

3.1.1. Variable-Twist Blade Structure

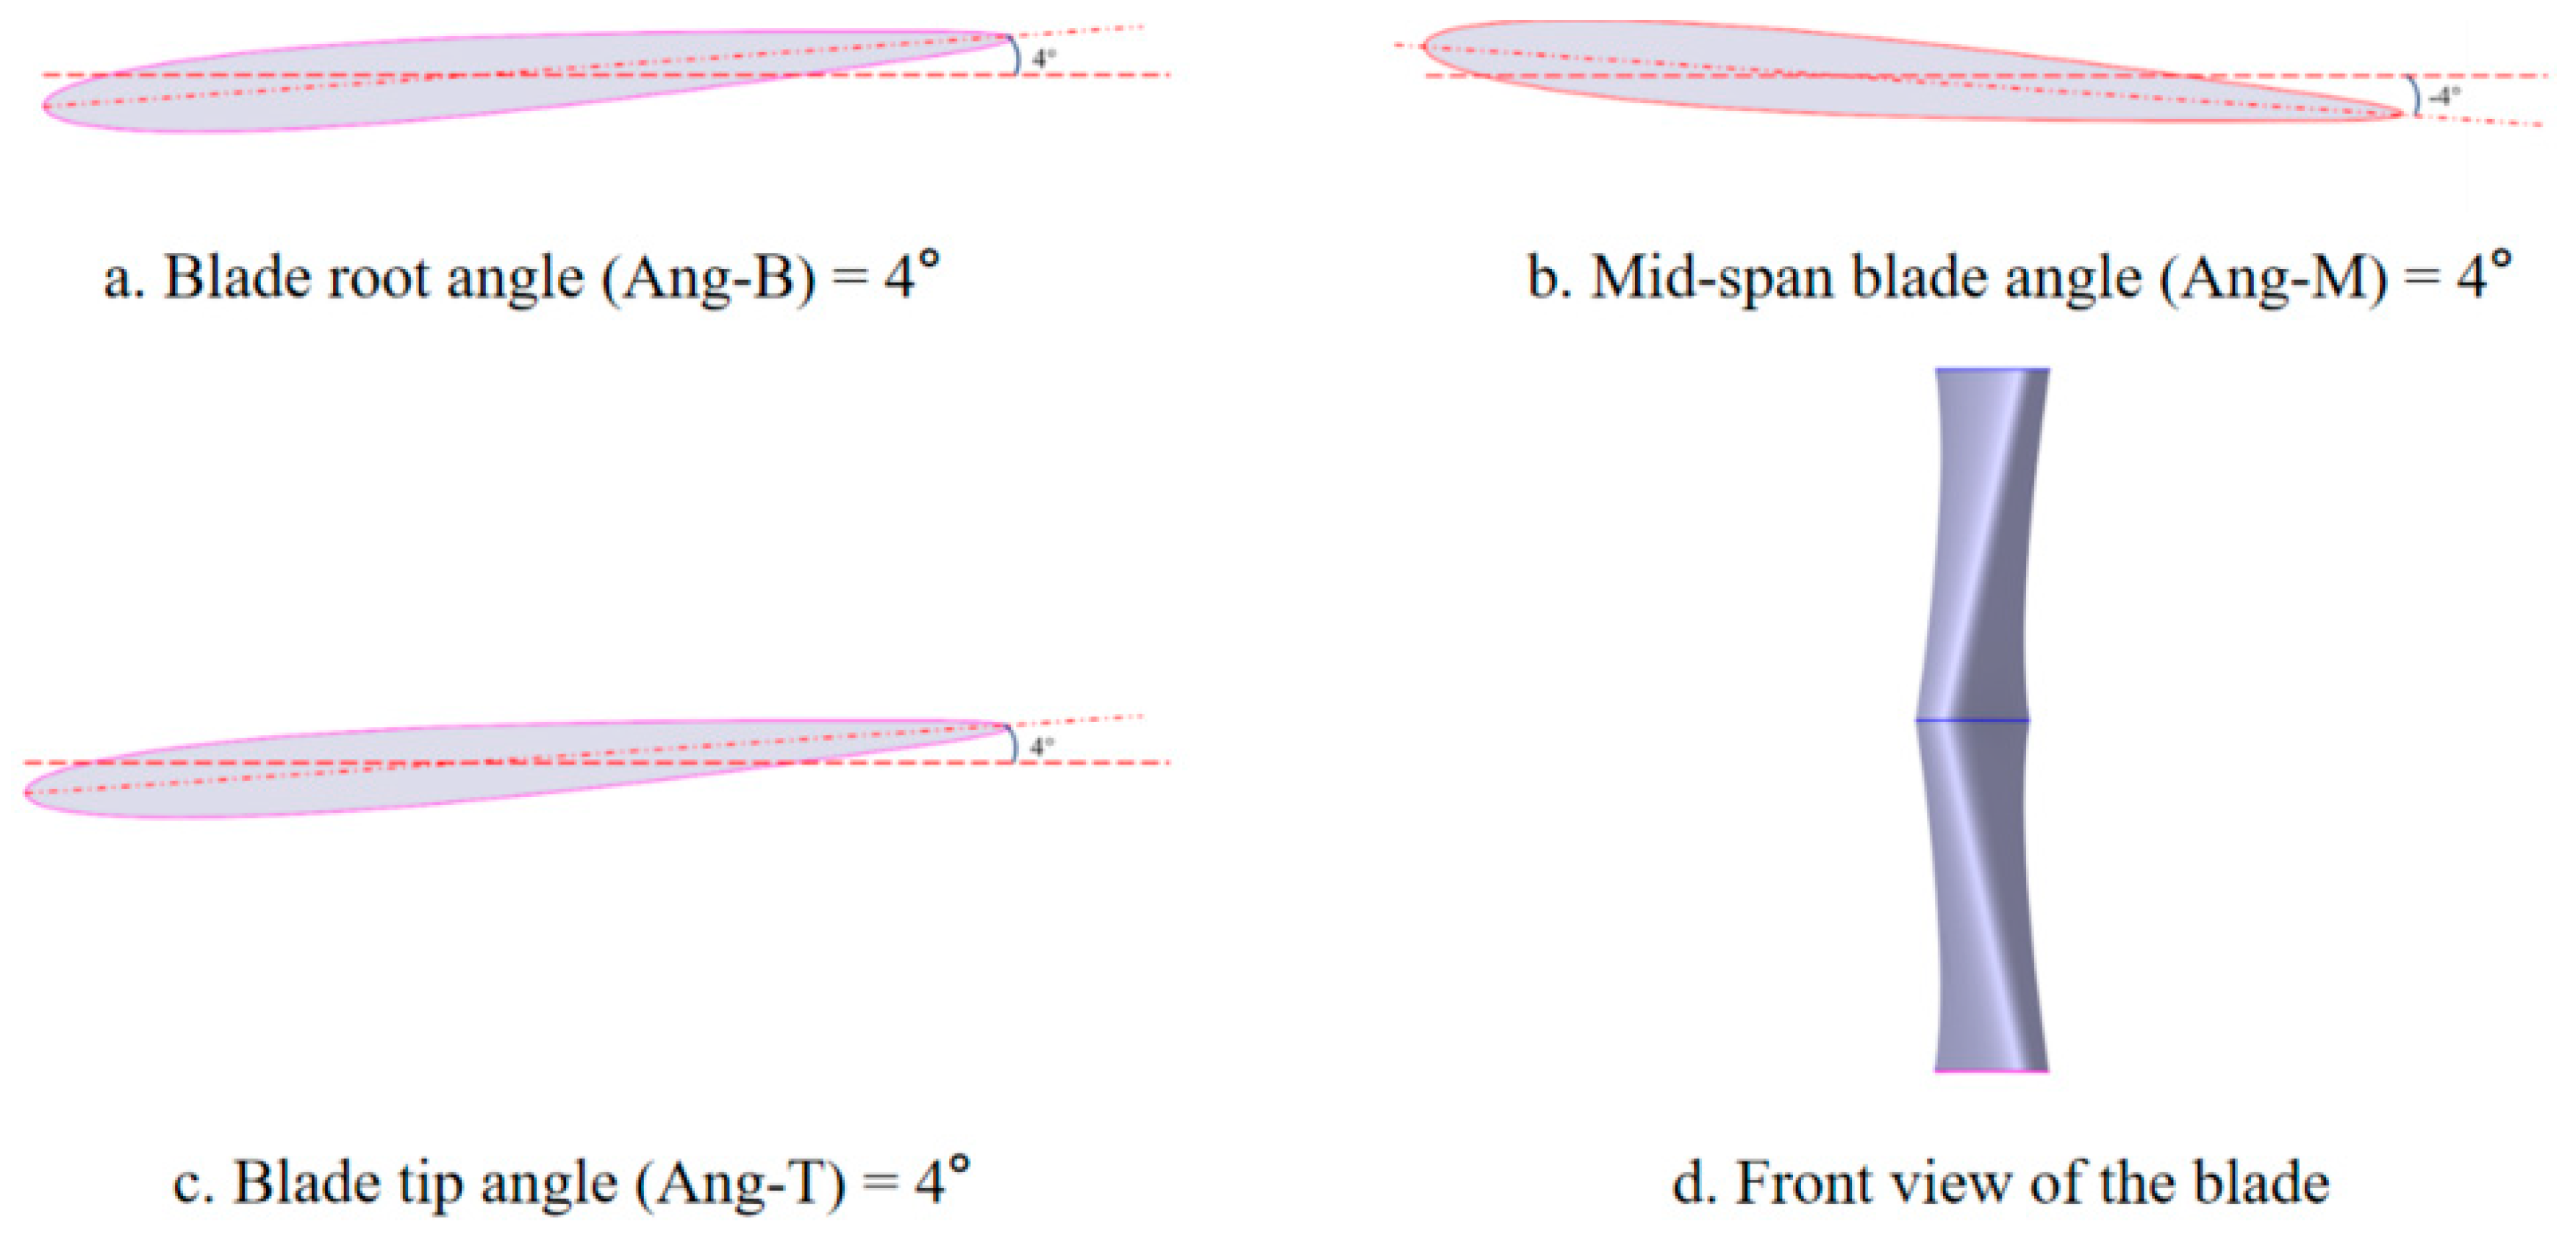
In the design of variable-twist blades, the blade is divided into three sections along the spanwise (blade height) direction: the bottom, middle, and top sections. Each section shares the same size and shape, adopting the NACA 0008 airfoil profile. The twist angle at each section is defined as the angle between the chord line of the airfoil and the hub axis. Figure 7 illustrates a representative variable-twist blade model with a chord length of 20 mm, in which the twist angles are set to 4° counterclockwise at the bottom section, −4° (clockwise) at the middle section, and 4° counterclockwise at the top section.

3.1.2. Effect of Opposite Twist Angles at Blade Root and Tip on Airflow Deflection Angle

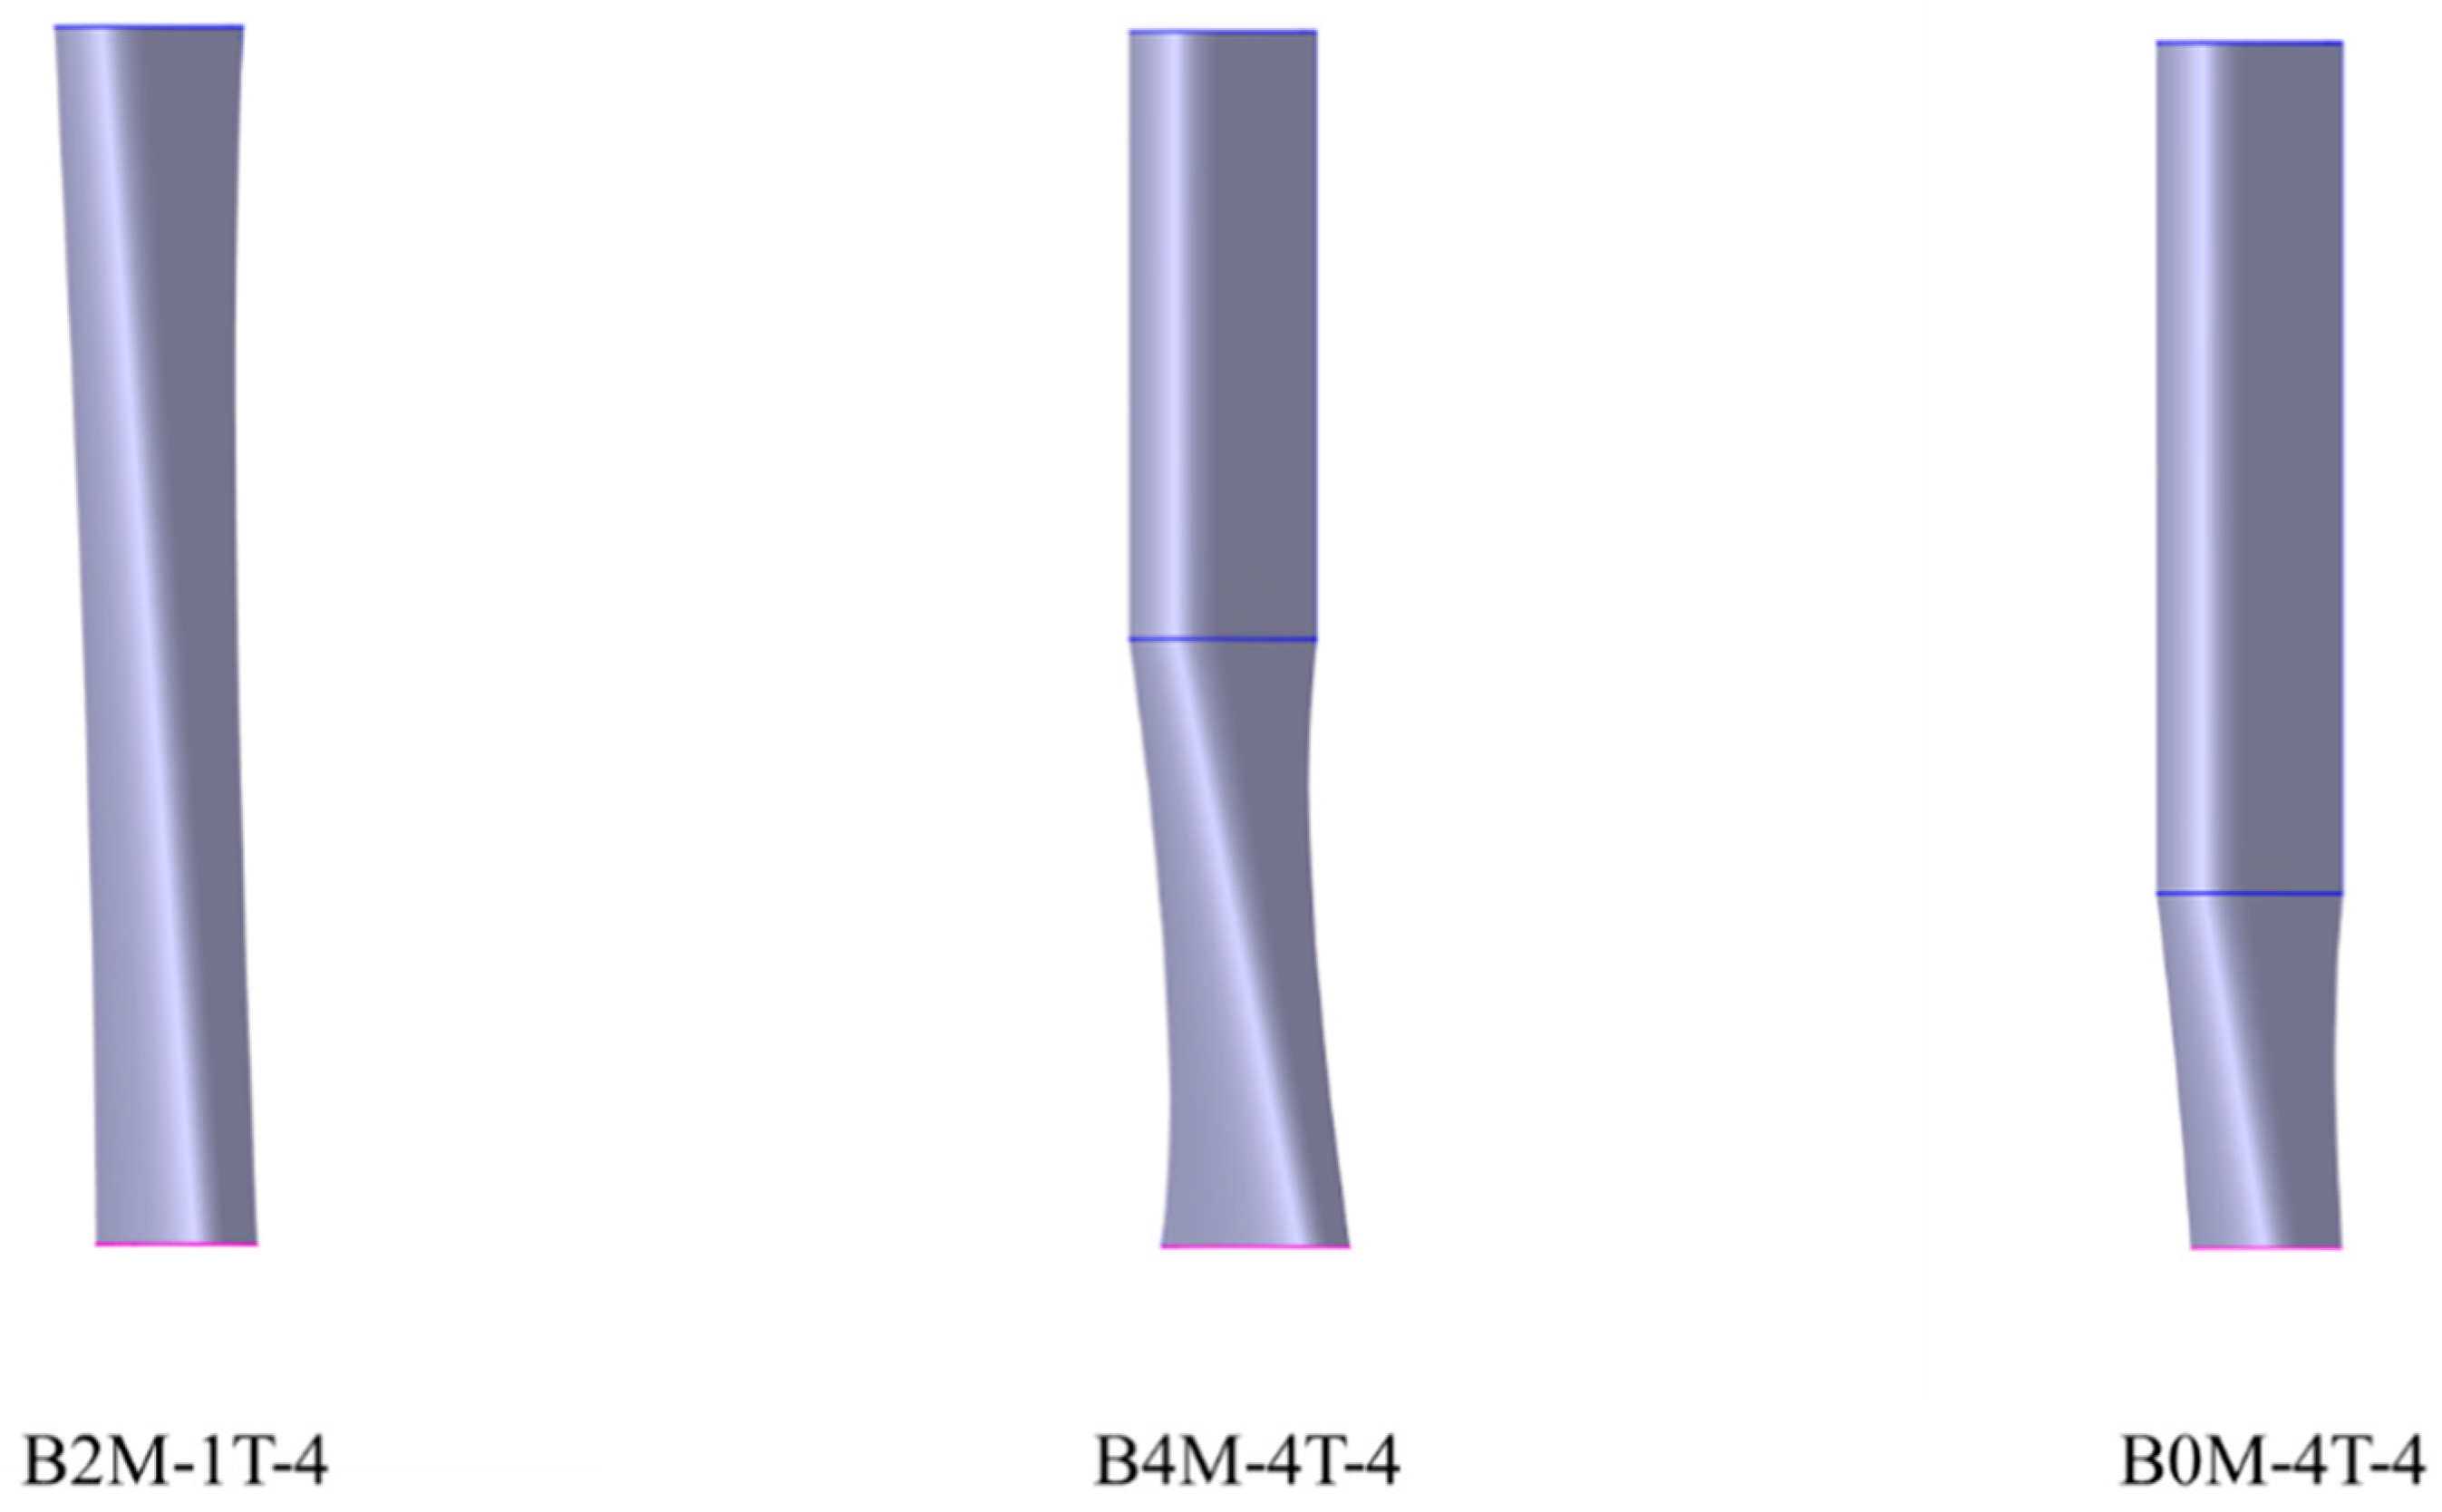
To investigate the influence of spanwise twist angle distribution on the flow field within the simulation apparatus, three blade configurations were selected, with the twist angles at the bottom (Ang-B), middle (Ang-M), and top (Ang-T) sections set as follows: (1) 2°, −1°, and −4°; (2) 4°, −4°, and −4°; and (3) 0°, −4°, and −4°, respectively. These configurations are referred to as B2M-1T-4, B4M-4T-4, and B0M-4T-4. The geometric models corresponding to these blade designs are shown in Figure 8.
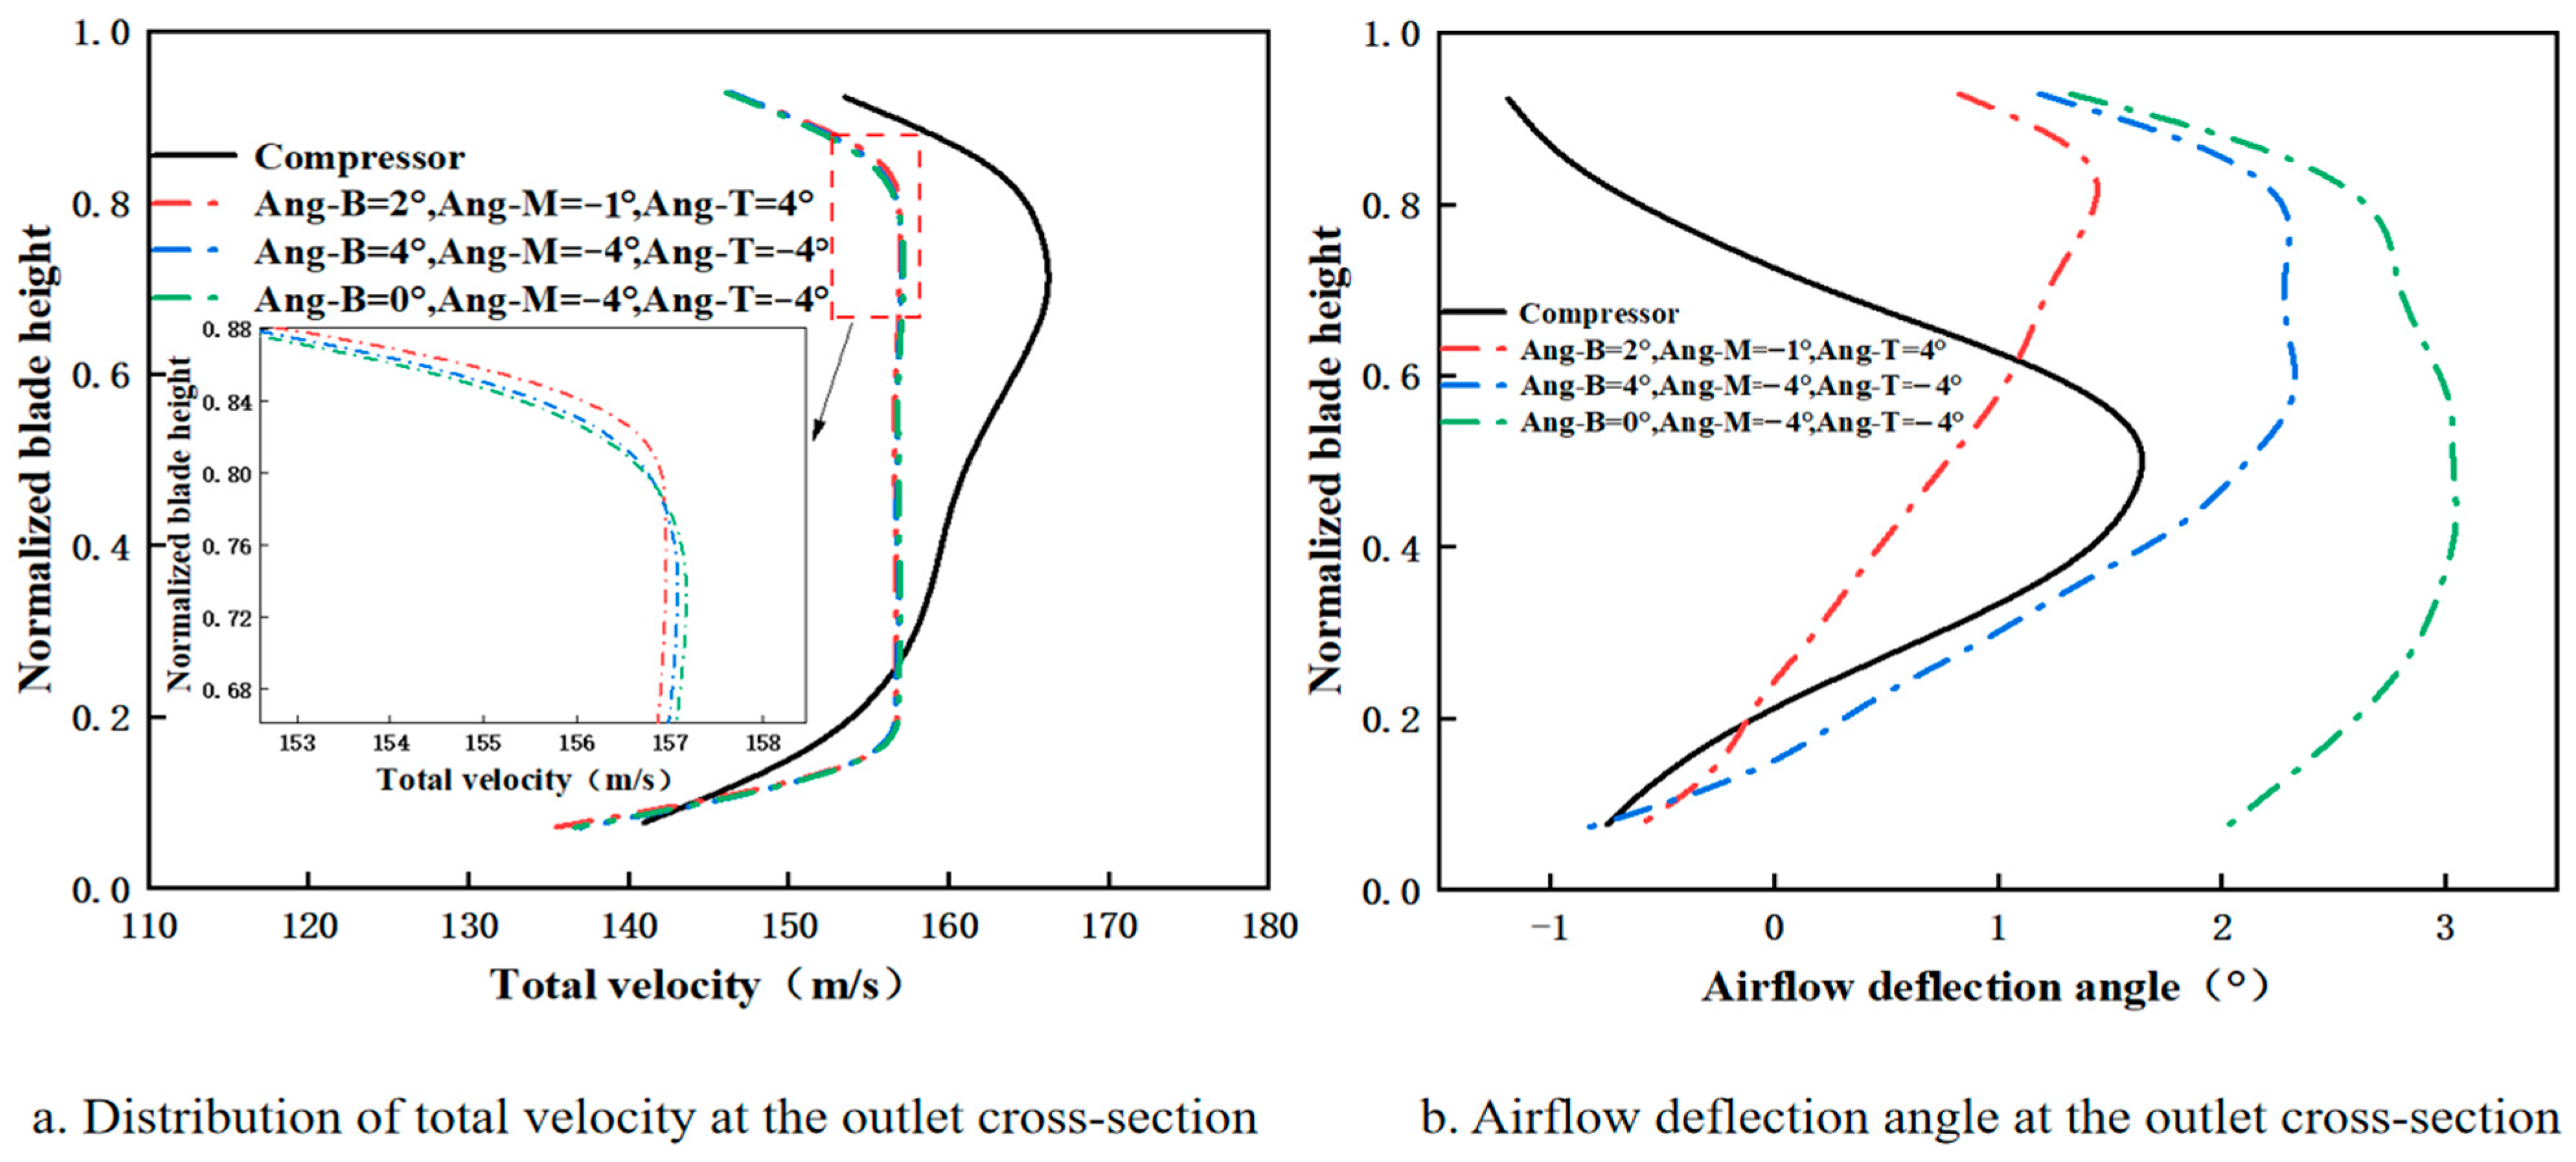
Figure 9 presents the distributions of total velocity and airflow deflection angle at the outlet cross-section of the simulation device. The total velocity and airflow deflection angle data for the compressor section are taken from the aforementioned five-stage axial compressor [26]. As shown in Figure 9a, variations in twist angles across blade sections have a minimal effect on the blockage ratio of the annular flow passage. Consequently, the peak position and magnitude of total velocity at the outlet remain largely unchanged among the three blade configurations. In contrast, as illustrated in Figure 9b, the peak position and magnitude of the flow deflection angle exhibit significant variation among the different blade configurations. For the B2M-1T-4 configuration, in which the bottom and top twist angles are oriented in opposite directions relative to the middle section, there is a substantial twist difference between the upper and lower portions along the blade height. This results in a distinctly sharp and localized peak in the deflection angle distribution.
For the blade configurations B4M-4T-4 and B0M-4T-4, where the twist angles at the top and middle sections are identical, the upper part of the blade span exhibits a greater twist angle, resulting in a broader flow deflection angle peak. Furthermore, the larger the difference between the bottom and middle twist angles, the more rapidly the deflection angle in the lower span rises to its peak. The peak airflow deflection angles for B2M-1T-4, B4M-4T-4, and B0M-4T-4 are 1.48°, 2.36°, and 3.07°, respectively. These values deviate from the compressor outlet peak of 1.68° by 11.9%, 40%, and 80%, respectively. The corresponding peak positions along the blade height are 0.857, 0.57, and 0.43, representing deviations of 59.3%, 5.9%, and 20% from the compressor outlet peak position of 0.538.
The airflow deflection angle distribution at the compressor outlet exhibits a symmetric profile, characterized by higher values at mid-span and lower values near the root and tip. Therefore, further optimization of blade geometry should be pursued by exploiting the influence of sectional twist angles on the radial distribution of airflow deflection.
In summary, when the twist directions at the blade tip and root are opposite, the peak of the airflow deflection angle distribution at the outlet tends to shift toward the tip region. For the three blade configurations—B2M-1T-4, B4M-4T-4, and B0M-4T-4—the peak magnitudes of the airflow deflection angle deviate from the compressor outlet value by 11.9%, 40%, and 80%, respectively. The corresponding peak positions along the blade height deviate by 59.3%, 5.9%, and 20%, respectively.

3.1.3. Effect of Aligned Twist Angles at Blade Root and Tip on Airflow Deflection Angle

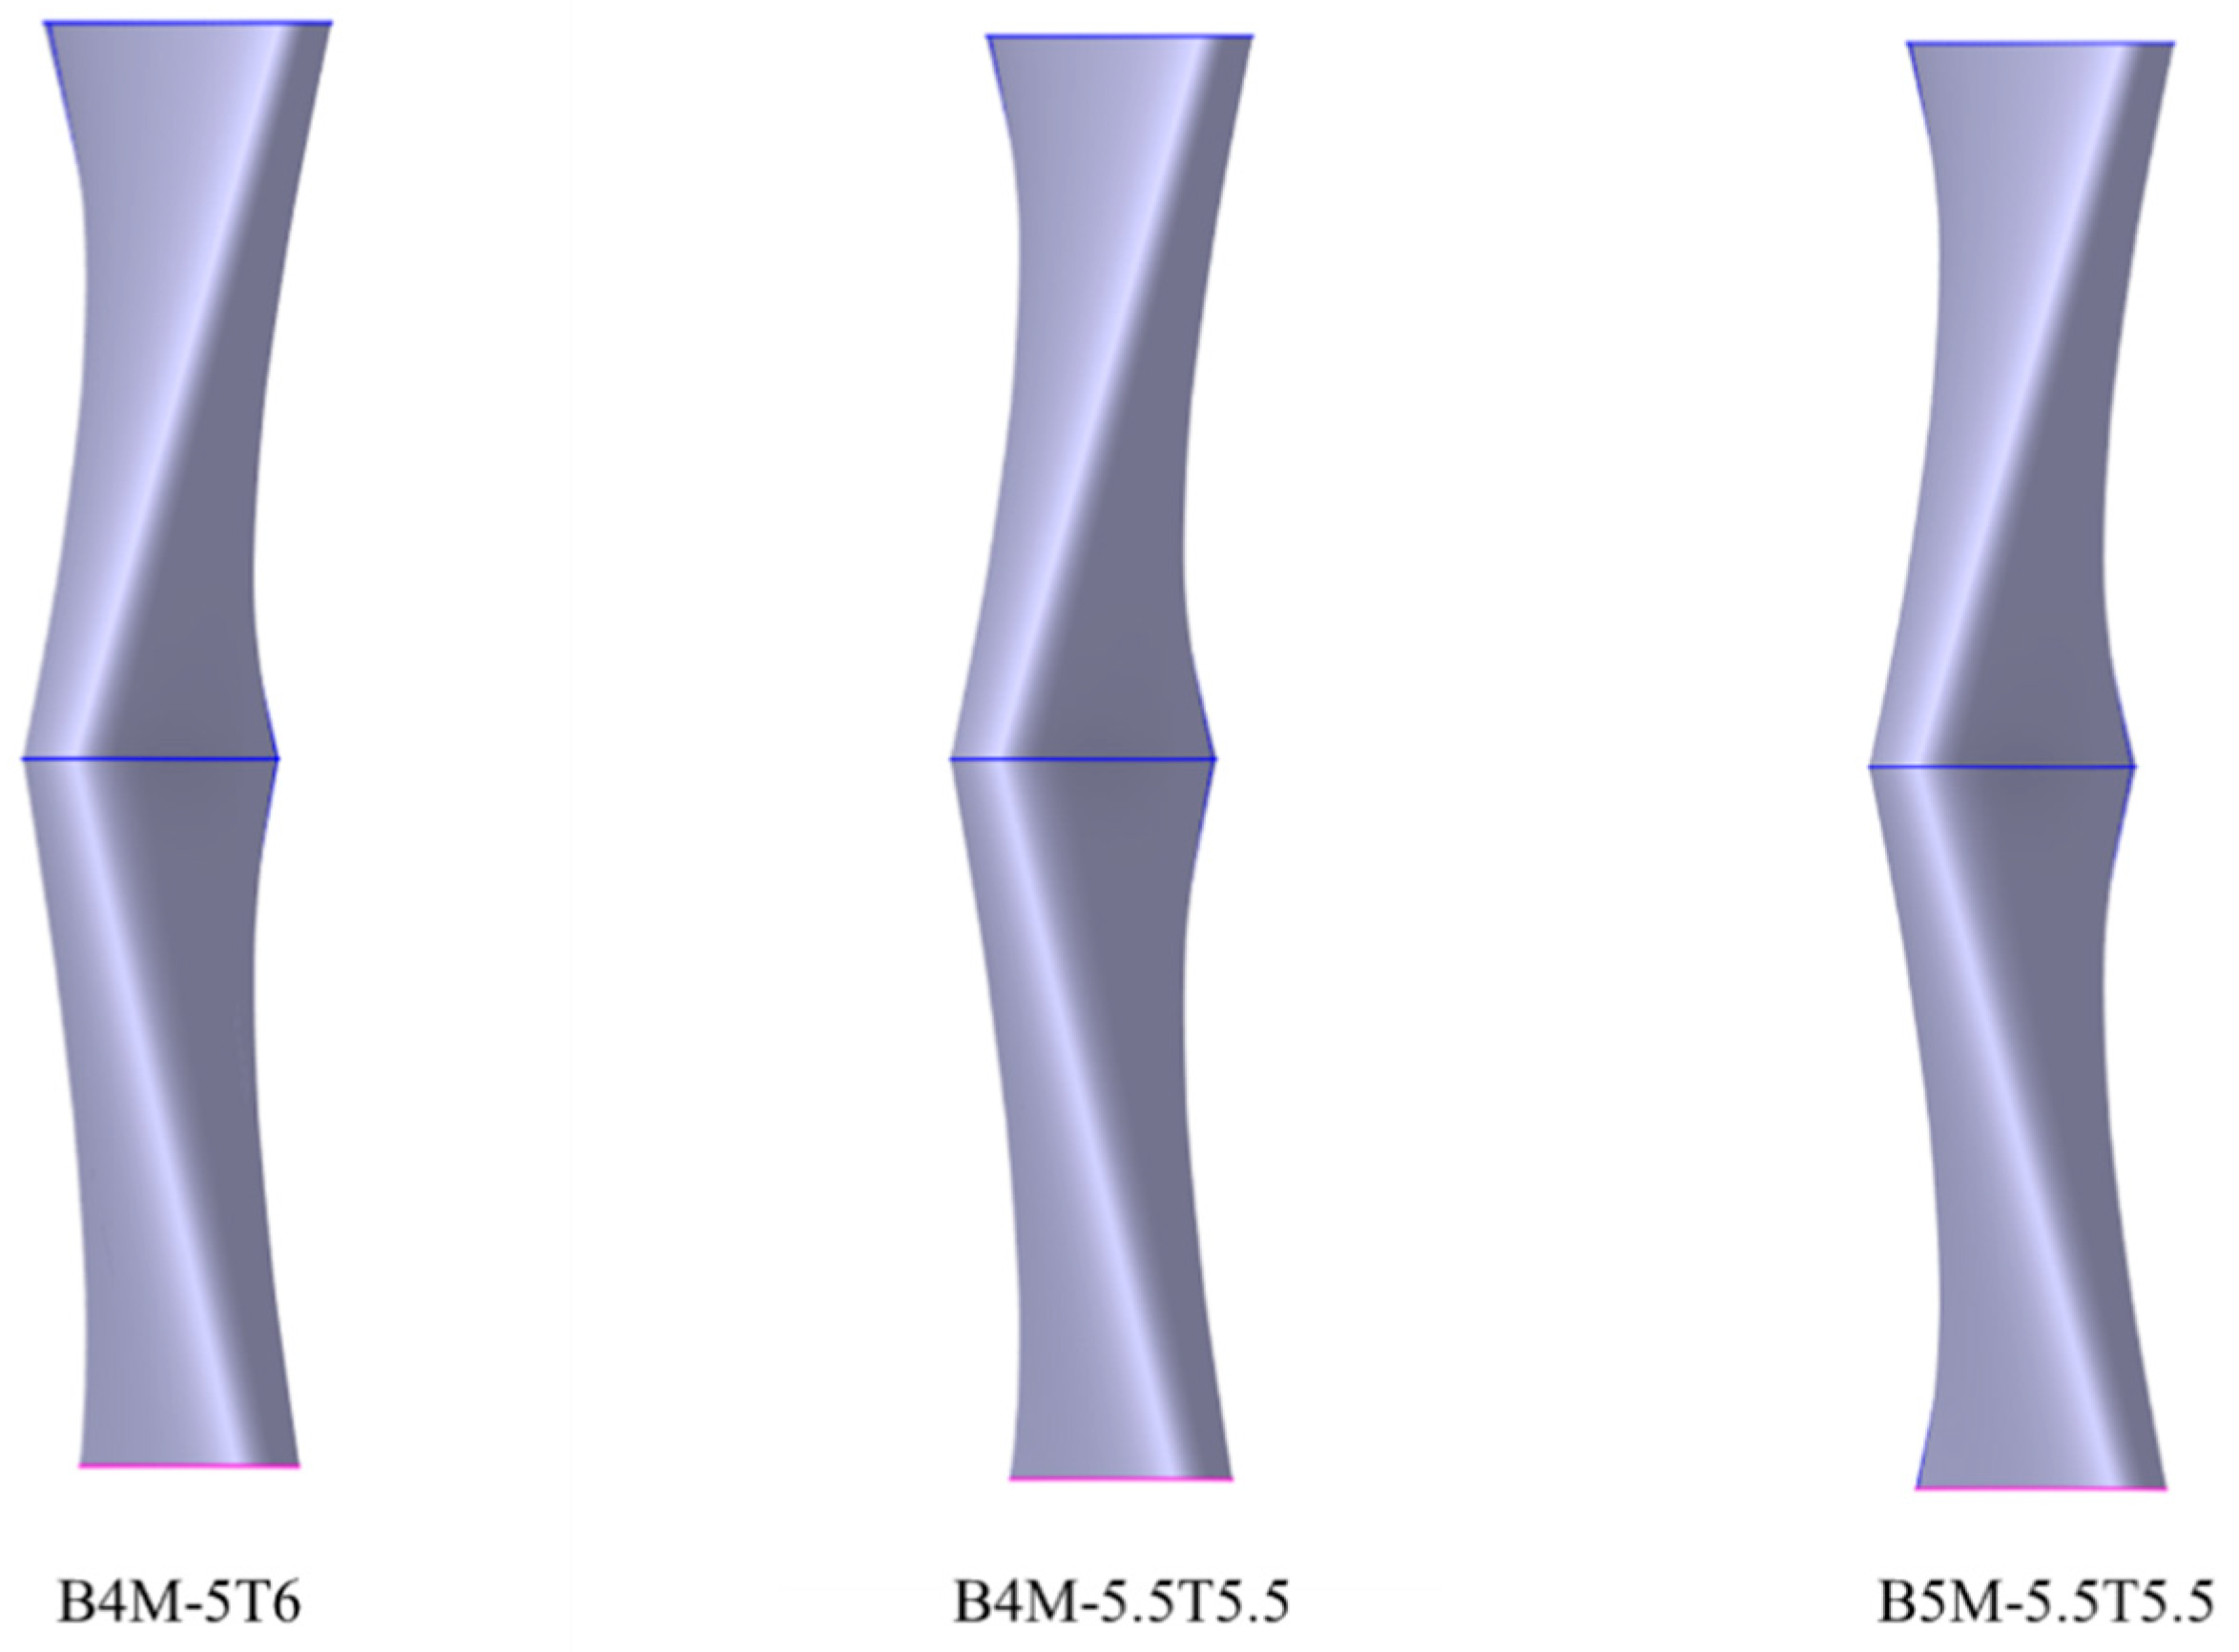
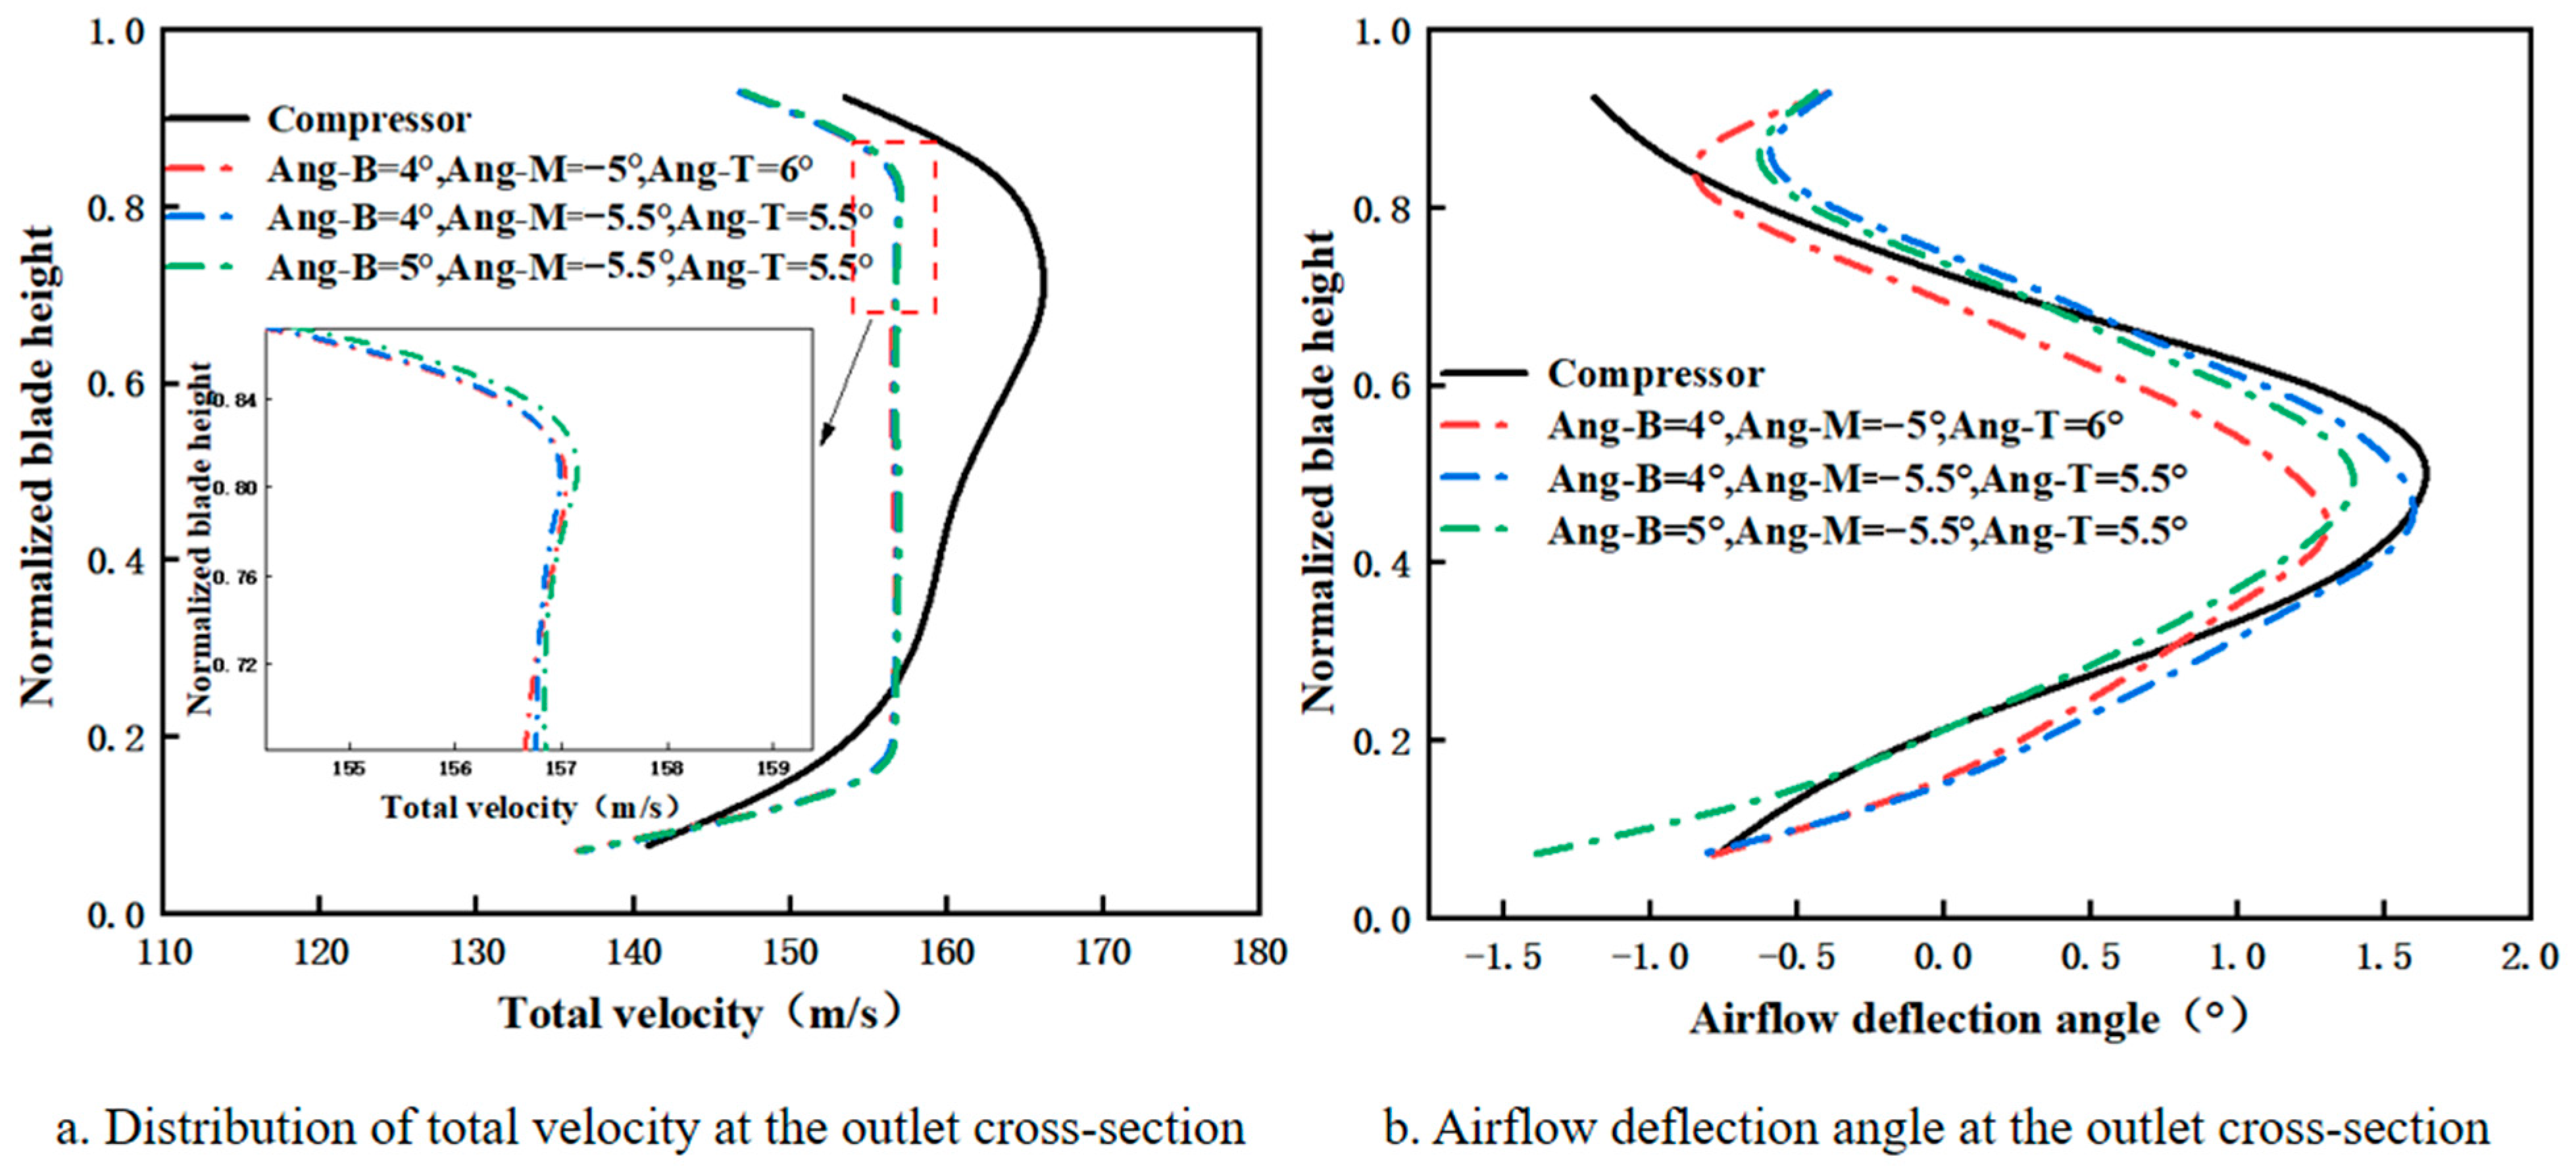
Considering that the flow field at the compressor outlet exhibits a symmetric distribution along the blade height—with higher values at mid-span and lower values near the root and tip—the stator blade design for the simulation device aims to produce an airflow deflection angle distribution that is symmetric about the mid-span and exhibits a narrow peak width. To achieve this, the blade geometry must be symmetric about the middle section. Accordingly, three blade configurations were selected, with the bottom (Ang-B), middle (Ang-M), and top (Ang-T) twist angles defined as follows: (1) 4°, −5°, and 6°; (2) 4°, −5.5°, and 5.5°; and (3) 5°, −5.5°, and 5.5°, respectively. These configurations are referred to as B4M-5T6, B4M-5.5T5.5, and B5M-5.5T5.5. The geometric models of the three blade configurations are shown in Figure 10.
Figure 11 illustrates the distribution of total velocity and flow deflection angle at the outlet cross-section of the simulation device. As shown in Figure 11a, the implementation of symmetrically twisted blade configurations exerts minimal influence on the total velocity at the outlet. The velocity profiles and magnitudes across different blade designs remain nearly identical. As shown in Figure 11b, the flow deflection angle distributions for all blade configurations closely match that of the compressor outlet, featuring a mid-span peak and lower values near the root and tip. For the B4M-5T6 configuration, the twist angle differences between the tip and root sections relative to the middle section are minimal, resulting in insufficient flow turning near the blade center.
Additionally, the twist angles at the bottom and middle sections affect the peak position of the flow deflection angle. For B4M-5.5T5.5 and B5M-5.5T5.5, when the middle and top twist angles are held constant, an increase in the bottom twist angle causes the peak of the flow deflection angle to shift toward the blade tip. The peak deflection angles for B4M-5T6, B4M-5.5T5.5, and B5M-5.5T5.5 are 1.39°, 1.64°, and 1.47°, respectively. These values deviate from the compressor outlet peak of 1.68° by 17.2%, 2.4%, and 12.5%, respectively. The corresponding peak positions are 0.43, 0.42, and 0.50, representing deviations of 20%, 21.9%, and 7.1% from the compressor outlet peak position of 0.538.
Among the three configurations, B5M-5.5T5.5 shows the least deviation in terms of both peak deflection angle and peak position. Under this blade design, the airflow deflection angle distribution at the outlet cross-section of the simulation device closely replicates the distribution observed at the compressor outlet. However, further optimization remains necessary to refine the deflection angle values near the blade root and tip regions.
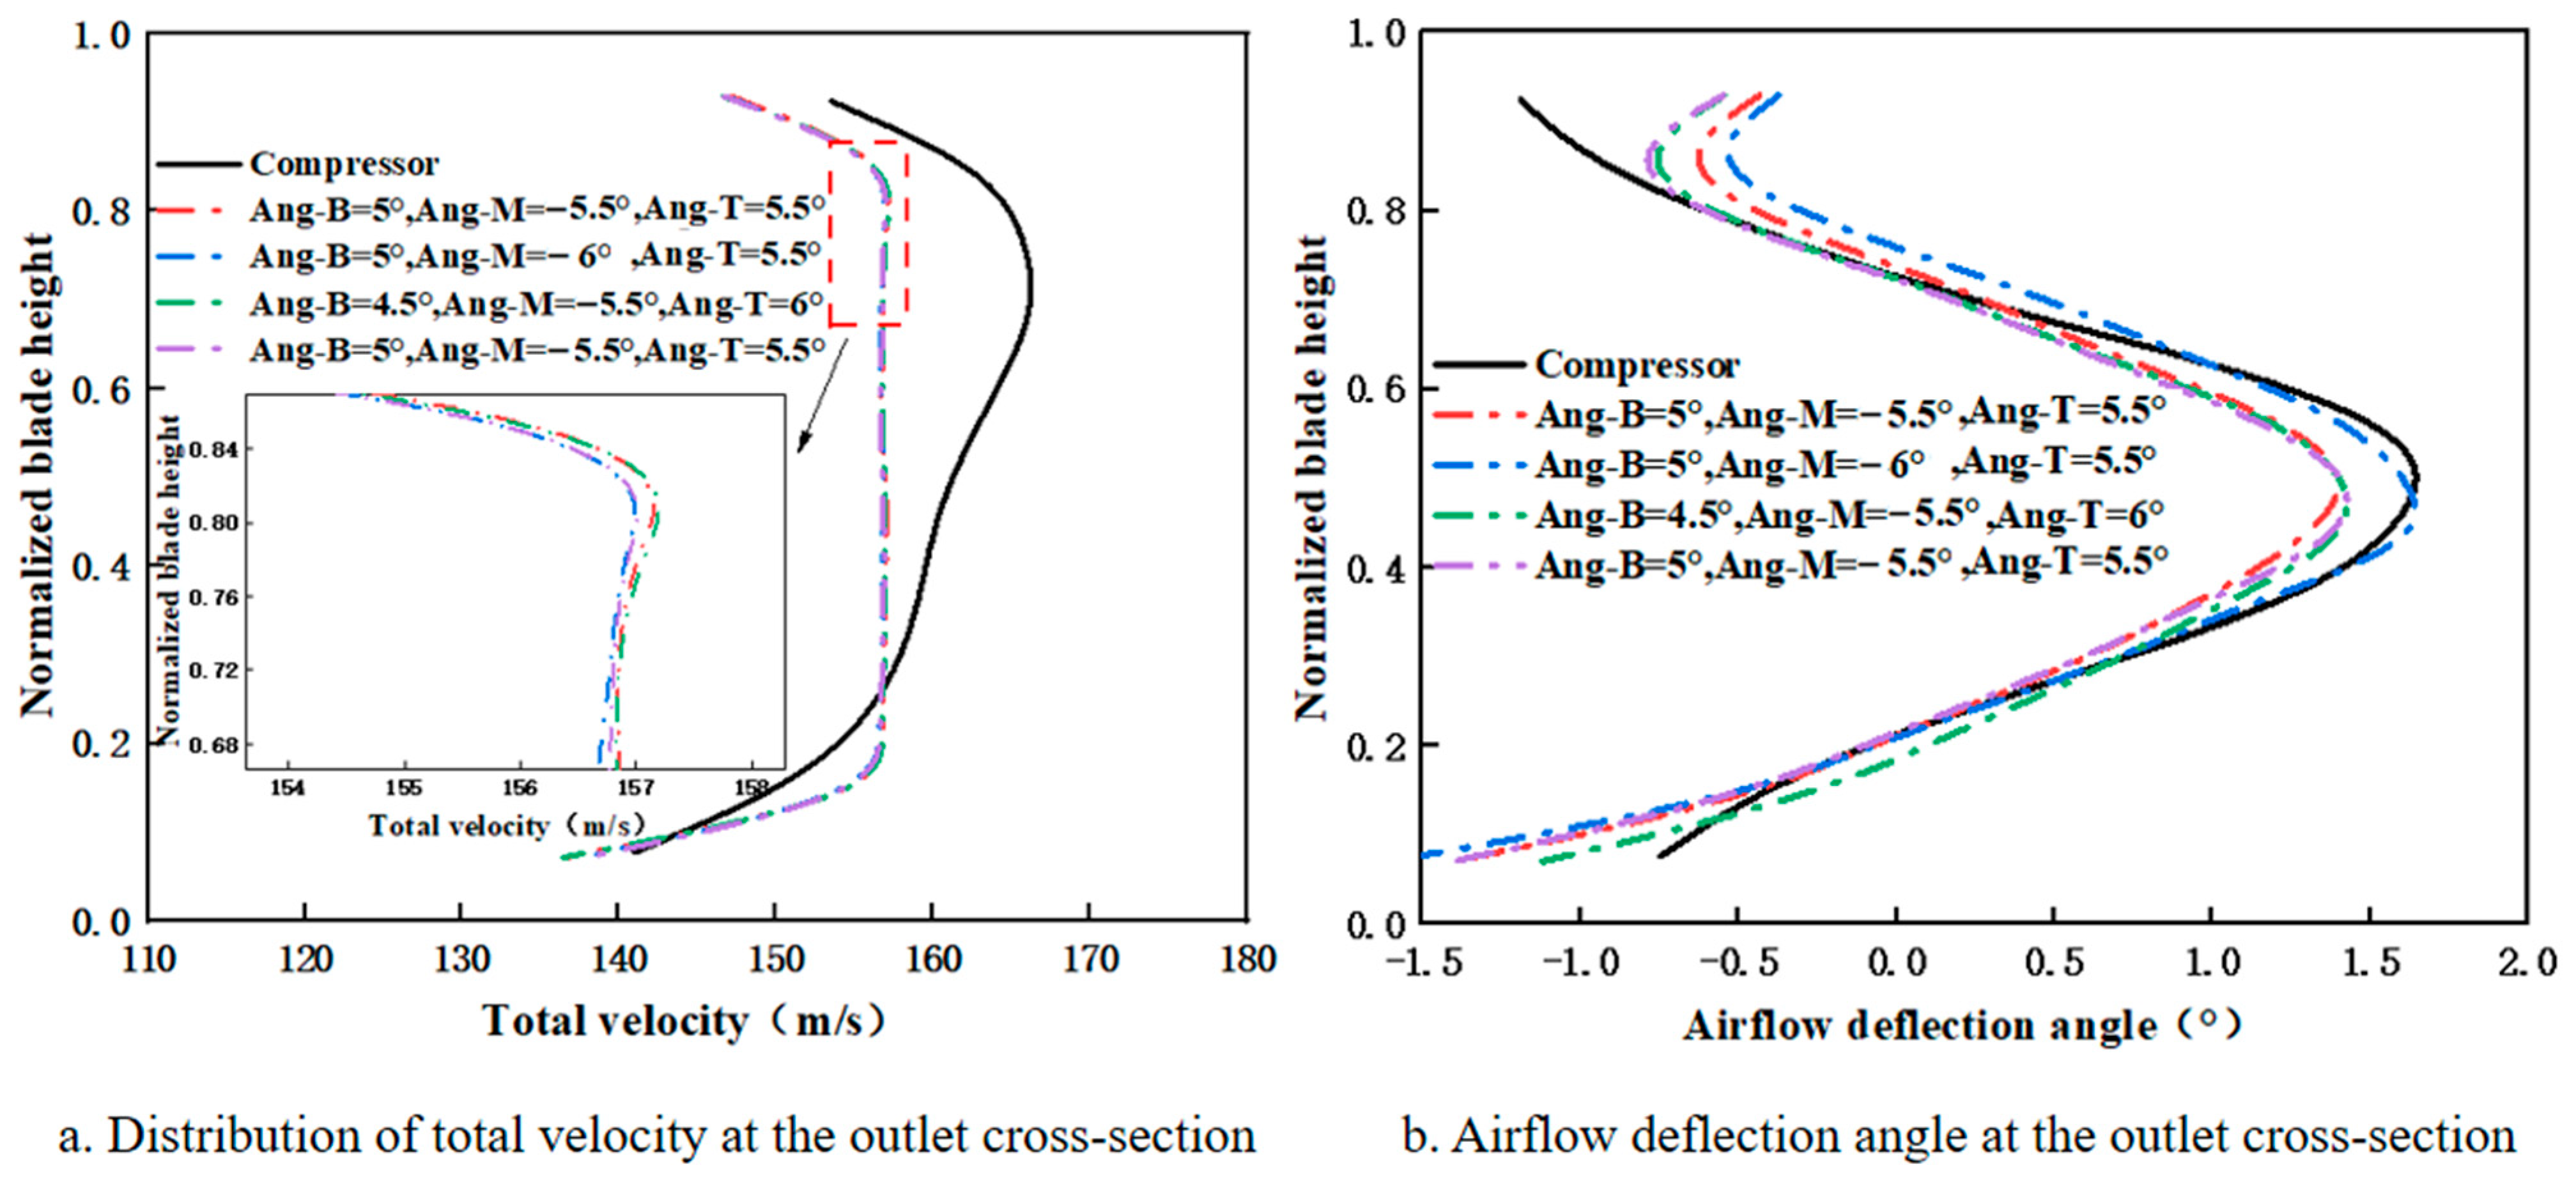
To further refine the airflow deflection angles near the blade root and tip regions, the bottom and top twist angles were slightly increased. Three blade configurations were selected for comparison, with the twist angles at the bottom (Ang-B), middle (Ang-M), and top (Ang-T) sections set as follows: (1) 5°, −6°, and 5.5°; (2) 4.5°, −5.5°, and 6°; and (3) 5°, −5.5°, and 5.5°. These configurations are referred to as B5M-6T5.5, B4.5M-5.5T6, and B5M-5.5T5.5, respectively.
Figure 12 presents the total velocity and flow deflection angle distributions at the outlet cross-section of the simulation device. As shown in Figure 12a, the implementation of symmetric twist angle blade configurations exerts negligible influence on the total velocity distribution. The total velocity magnitude and profile are nearly identical across all blade designs. Future studies will focus on modifying the flow passage structure to further control the total velocity profile at the outlet. As shown in Figure 12b, the B5M-6T5.5 configuration exhibits an overall increase in the flow deflection angle due to its larger twist angle in the middle section. In contrast, the B4.5M-5.5T6 and B5M-5.5T5.5 configurations exhibit minimal variation in peak location compared to the original B5M-5.5T5.5 design and better align with the compressor outlet flow field near both the blade root and tip regions.
The peak airflow deflection angles for B5M-6T5.5, B4.5M-5.5T6, and B5M-5.5T5.5 are 1.69°, 1.45°, and 1.47°, respectively. Compared with the compressor outlet peak value of 1.68°, these values deviate by 0.6%, 13.7%, and 12.5%, respectively. The corresponding peak positions are 0.43, 0.50, and 0.50, representing deviations of 20.1%, 7.1%, and 7.1% from the compressor outlet value of 0.538.
Among these configurations, B4.5M-5.5T6 demonstrates the closest overall agreement with the compressor outlet flow deflection angle distribution and satisfies the requirement of maintaining the deflection angle error within 0.5°. Based on this configuration, future studies will explore the design of new baffle structures to enhance control over the total velocity distribution at the blade root and tip regions.
In summary, when the twist angles at the blade tip and root share the same direction and exhibit similar magnitudes, the peak of the airflow deflection angle at the outlet cross-section of the simulation device tends to align near the mid-span. For the three blade configurations—B5M-6T5.5, B4.5M-5.5T6, and B5M-5.5T5.5—the peak deflection angles deviate from the compressor outlet value by 0.6%, 13.7%, and 12.5%, respectively. The corresponding peak positions deviate by 20.1%, 7.1%, and 7.1%, respectively.

3.2. Effect of Upstream Baffle Design on Flow Field

This study conducted numerical simulation and optimization of stator blade configurations in a flow field simulation device, aiming to improve the airflow deflection angle distribution at the combustor inlet. The implementation of symmetrical variable-twist blades markedly enhances the deflection angle distribution, with improved agreement in both peak position and magnitude compared to the compressor outlet.

3.2.1. Front-End Baffle Structure

The upstream baffles were positioned 2.5 mm ahead of the leading edge of the stator blades in the simulation device. Each baffle was placed symmetrically relative to the centerline of each blade and uniformly arranged in 36 sets along the circumference. By investigating both baffle positioning within the annular flow passage and variations in their geometric structure, the influence of various structural parameters on the total velocity distribution at the outlet cross-section was systematically evaluated. Figure 13 shows a schematic diagram of the baffle arrangement within the annular flow passage. By introducing localized blockage upstream of the blades, the baffles alter the upstream flow and regulate the spanwise distribution of total velocity at the outlet cross-section of the simulation device.

3.2.2. Effect of Front-End Baffle Position on Total Velocity

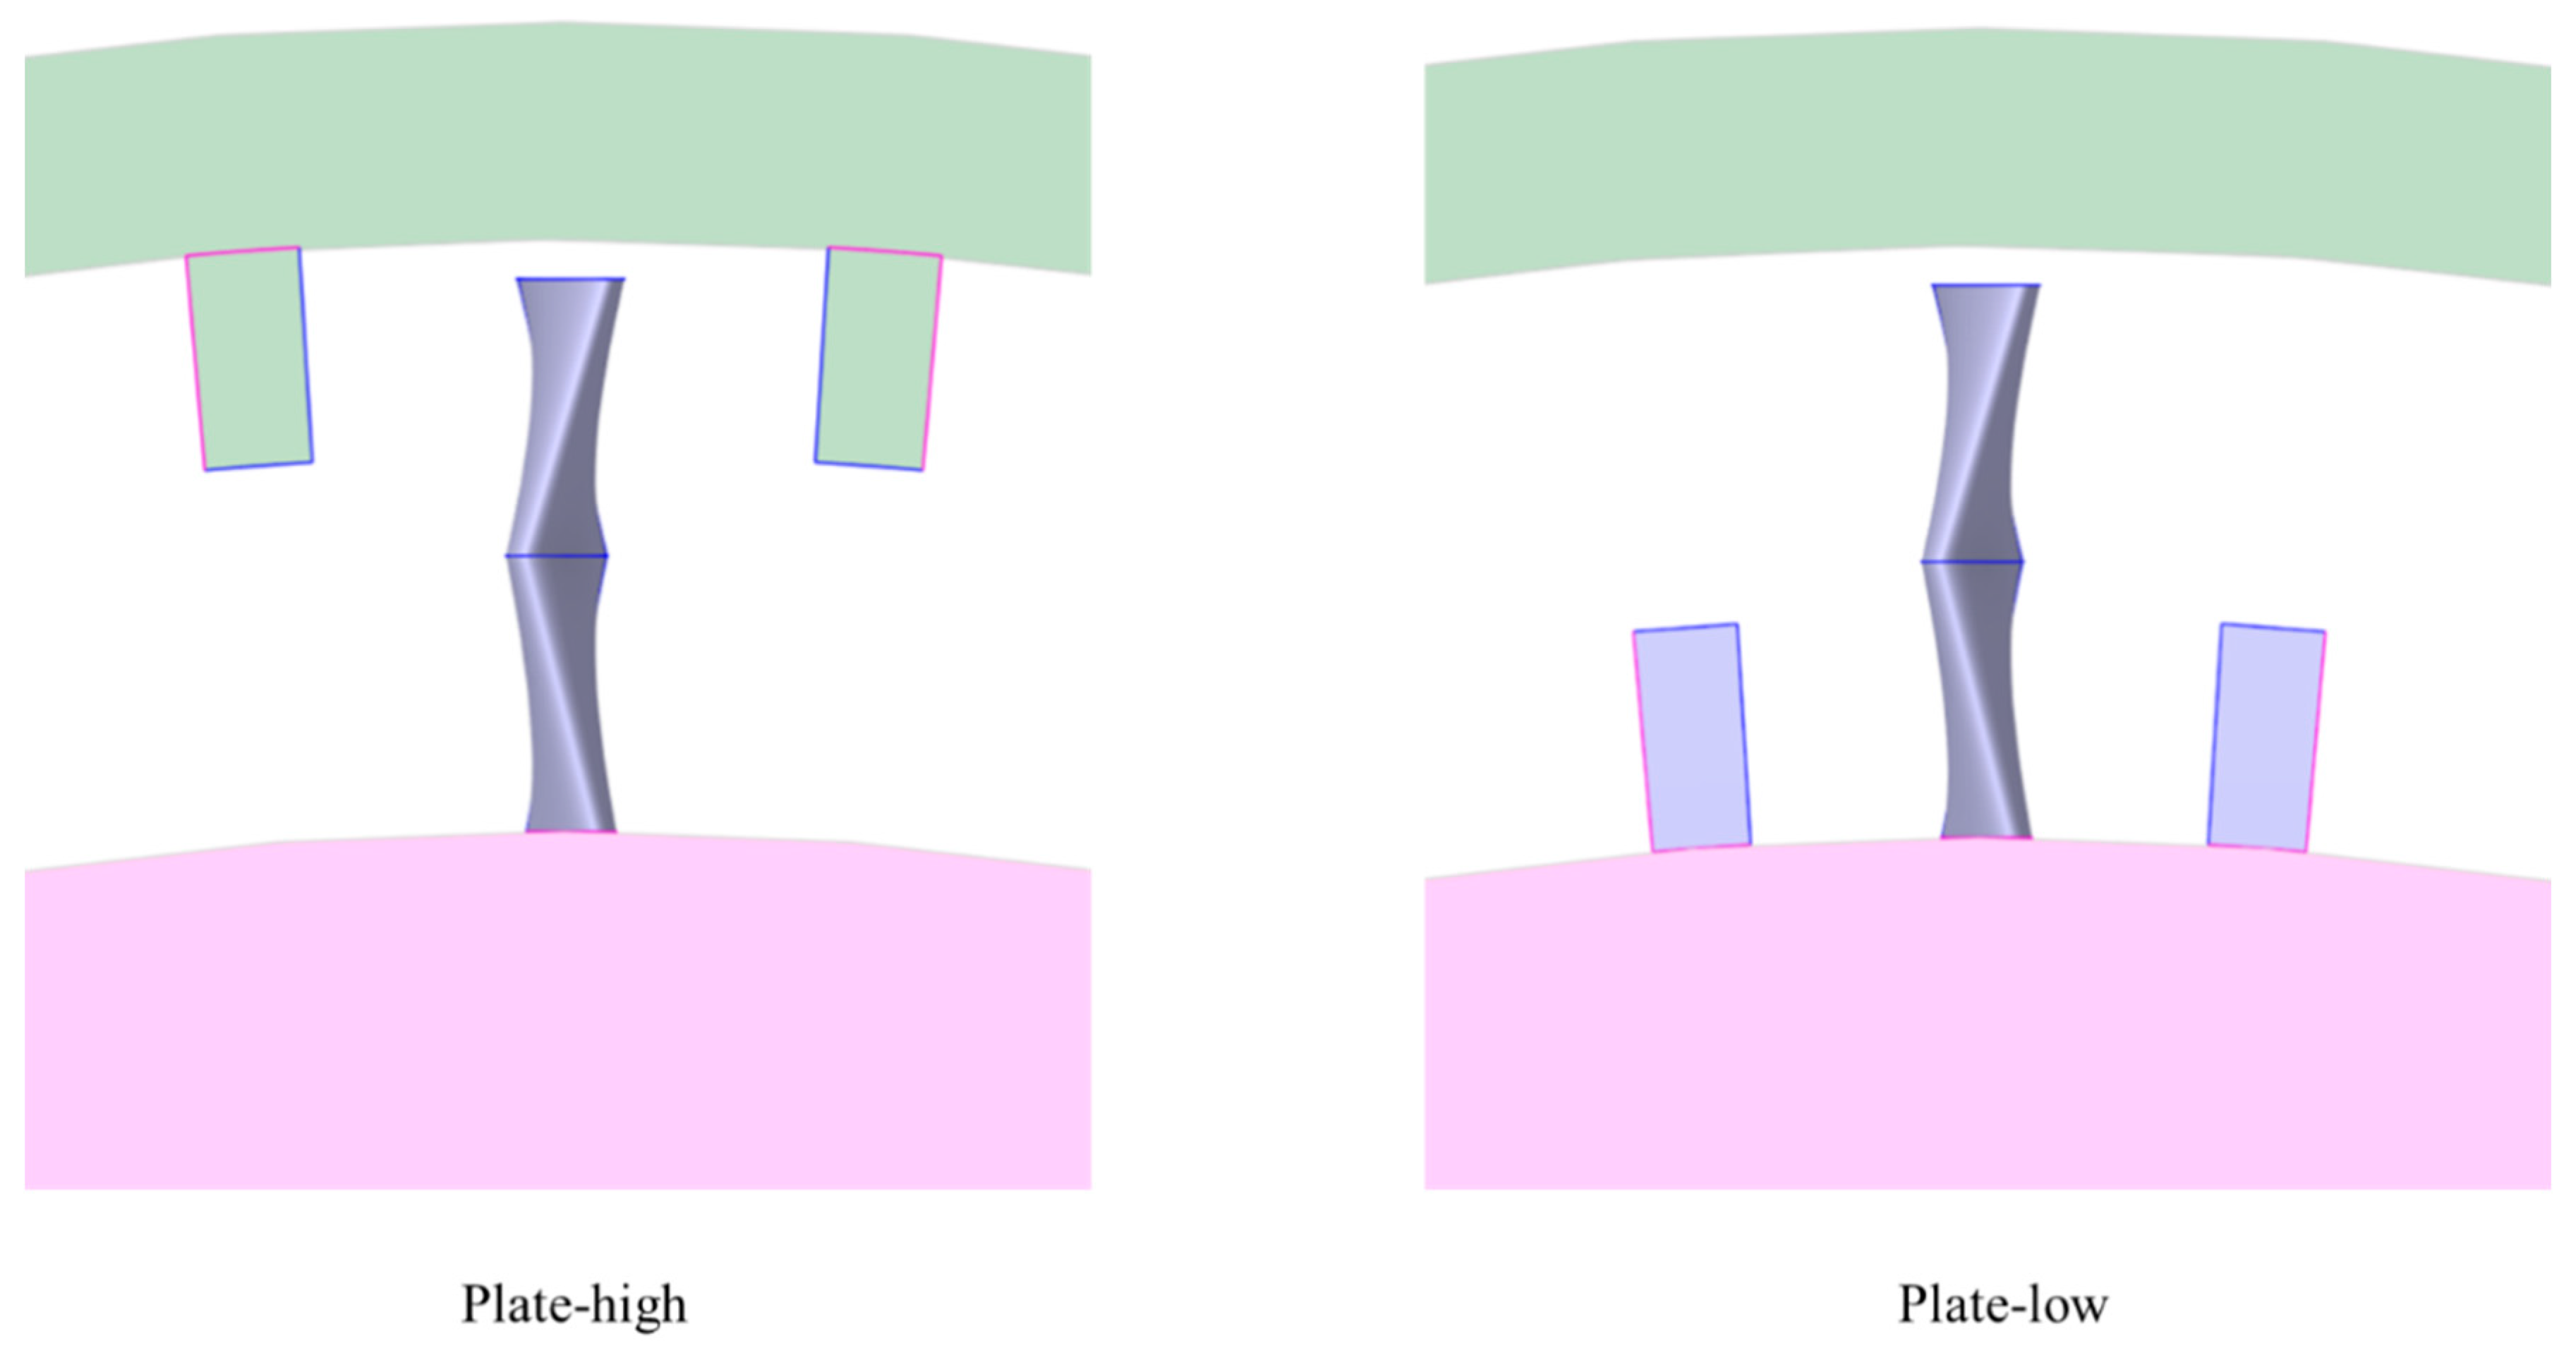
To investigate the influence of upstream baffle positioning on total velocity distribution at the outlet, two configurations were selected for comparison: Plate-high, mounted on the inner casing surface, and Plate-low, mounted on the hub surface. The geometric dimensions of each single-side baffle were 2 mm × 2.6 mm × 5 mm and these were identical in both configurations. The baffles were arranged symmetrically with respect to the centerline of each blade, with axial position as the only variable. Figure 14 shows the geometric models of the two baffle configurations in the annular flow passage.
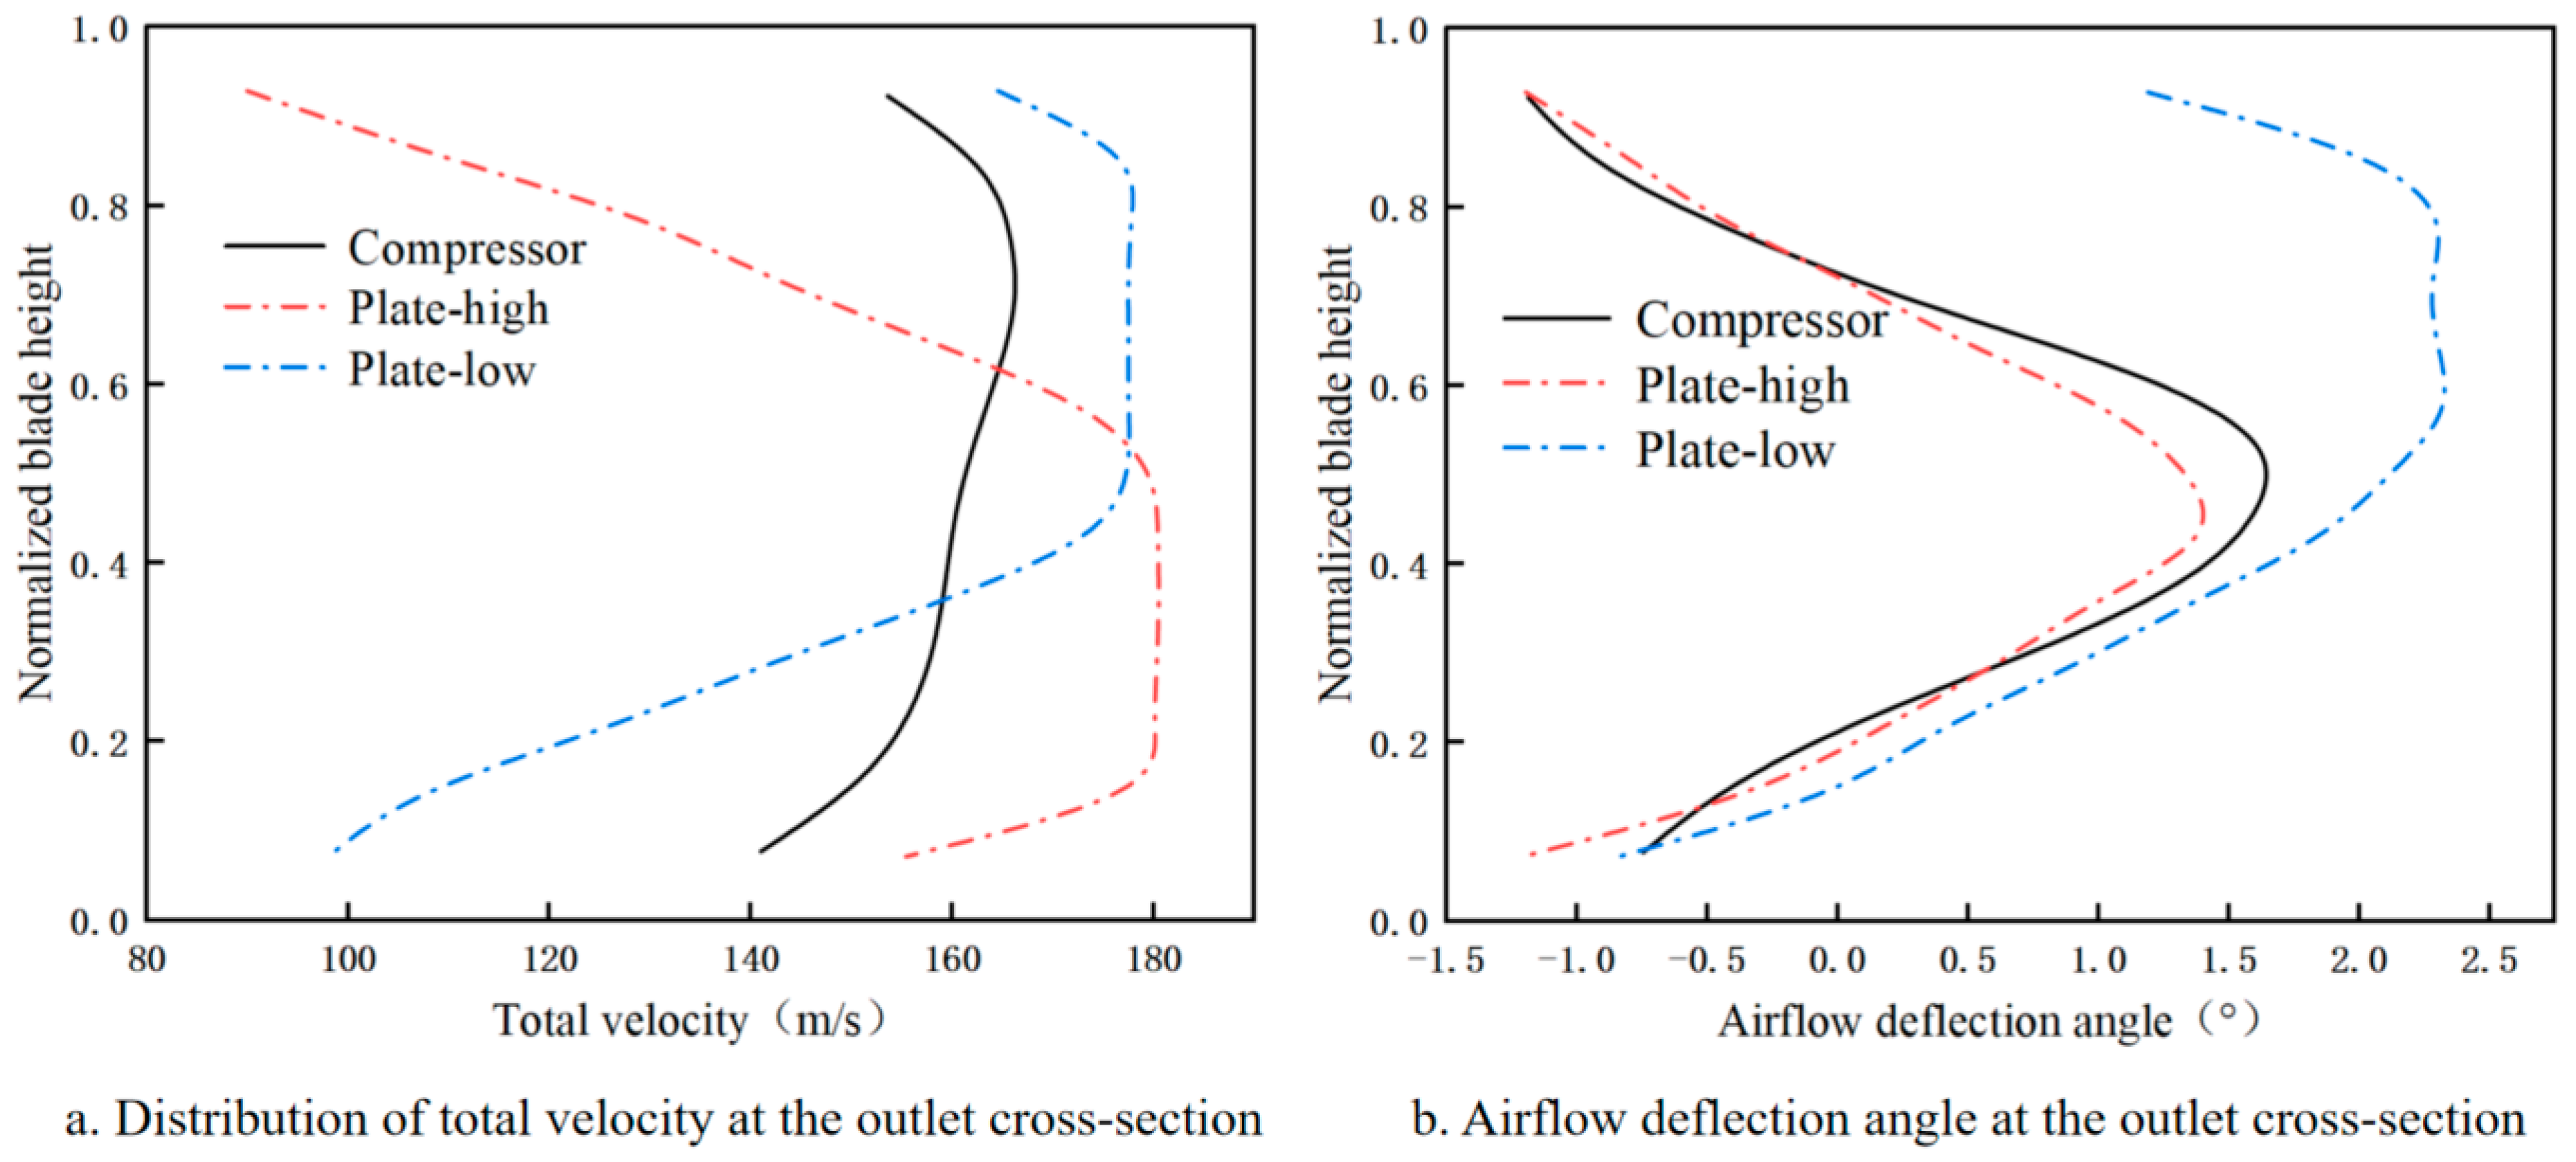
Figure 15 shows the total velocity and flow deflection angle distributions at the outlet cross-section. As seen in Figure 15a, positioning the baffle near the blade tip (Plate-high) or root (Plate-low) produces distinct velocity profiles. With Plate-high, the velocity peak shifts toward the blade root—opposite to the compressor outlet distribution. Conversely, Plate-low shifts the peak toward the blade tip, resembling the compressor profile. This difference arises from local flow blockage near the baffle: as flow passes the baffle, velocity drops locally while increasing elsewhere to conserve mass. Despite the peak shifts, both cases yield similar peak and average velocities. The peak velocities for Plate-high and Plate-low are 178.55 m/s and 180.57 m/s, exceeding the compressor outlet value (166.57 m/s) by 7.2% and 8.4%. Their peak positions are 0.86 and 0.14, compared with 0.69 at the compressor outlet, corresponding to deviations of 24.6% and 79.7%.
The results show that placing the baffle near the blade root yields a more favorable total velocity distribution. As illustrated in Figure 15b, using the B4.5M-5.5T6 blade profile as a baseline, the Plate-high deflection angle distribution closely matches the no-baffle case and aligns with the compressor outlet trend. In contrast, Plate-low produces significant deviations, indicating that baffle position strongly affects airflow deflection. The peak deflection angles for Plate-high and Plate-low are 1.47° and 2.36°, differing from the compressor outlet value (1.68°) by 12.5% and 40.4%. Their peak positions are 0.43 and 0.57, compared to 0.538 at the compressor outlet, with deviations of 20.1% and 5.9%. These results suggest that while a root-positioned baffle improves velocity distribution, further geometry refinement—such as reducing thickness—is needed to limit adverse effects on airflow deflection.
In summary, the total velocity distributions at the outlet cross-section of the simulation device demonstrate inverse distribution trends when the upstream baffles are positioned at the blade tip versus the blade root. When the baffle is placed at the blade tip, the peak total velocity appears near the blade root; conversely, when positioned at the blade root, the velocity peak shifts toward the blade tip. Under the Plate-high and Plate-low configurations, the peak total velocities deviate from the compressor outlet value by 13.7% and 12.5%, respectively. The corresponding peak positions exhibit a deviation of 7.1% for both configurations.

3.2.3. Effect of Upstream Baffle Geometry on Total Velocity

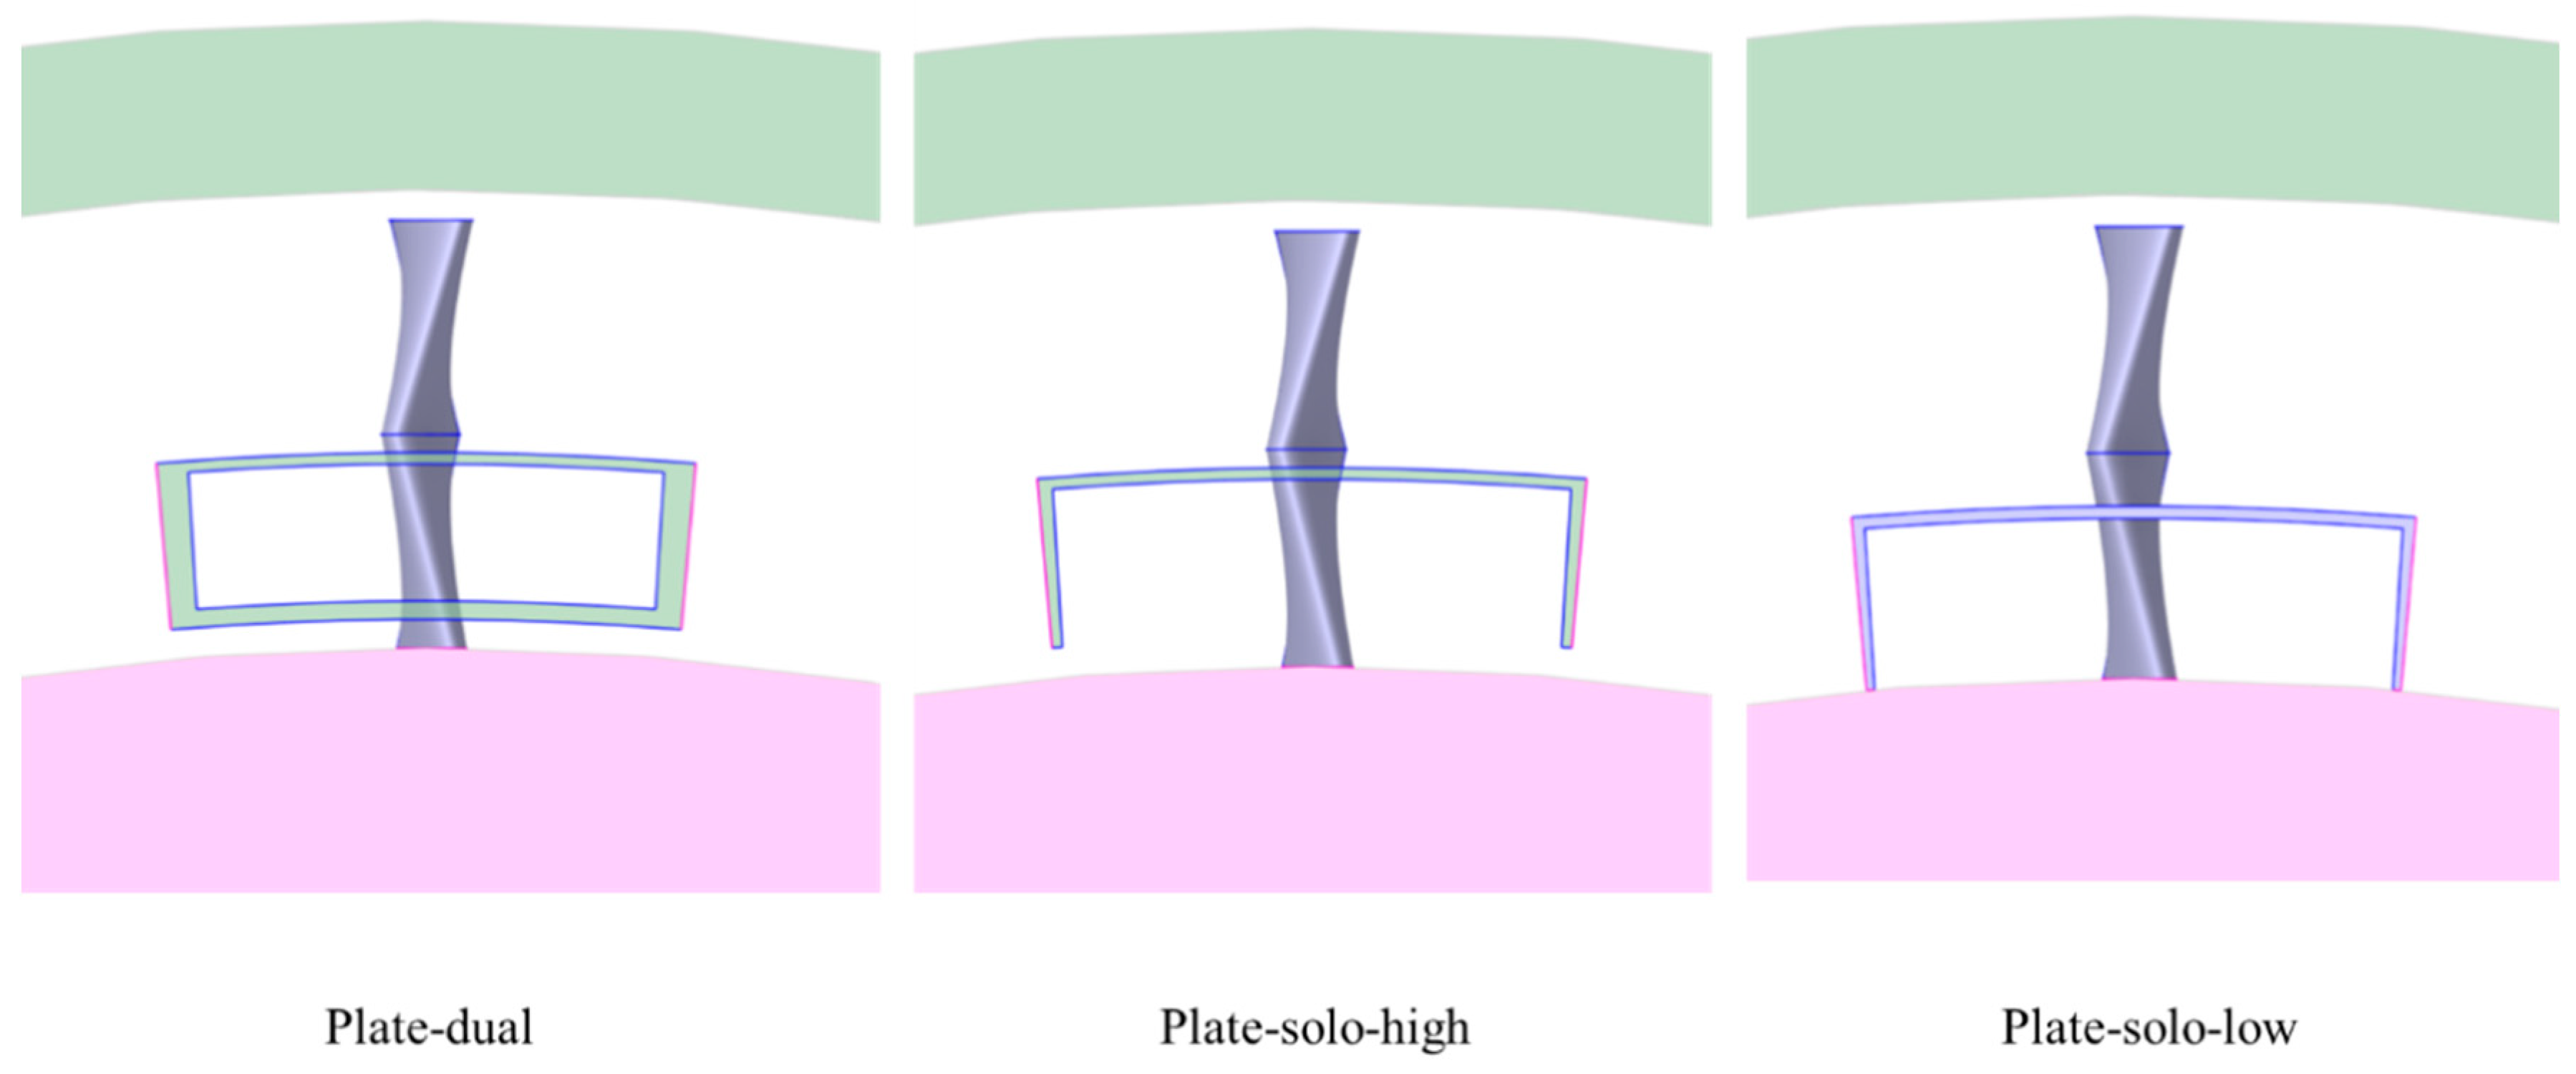
When the baffle thickness is excessive, it can cause significant flow blockage, which would result in an overestimated total velocity peak and an underpredicted velocity near the blade root. To address this issue, the baffle thickness was reduced. Additionally, to maintain a controlled level of blockage, horizontal plates were added in the lateral direction to locally regulate the velocity profile in targeted regions. Three baffle configurations were selected for comparison: Plate-dual, Plate-solo-high, and Plate-solo-low. Plate-dual incorporates horizontal plates mounted both above and below the vertical baffle. Plate-solo-high includes a horizontal plate mounted above the vertical baffle and positioned at a higher axial location, while Plate-solo-low places the horizontal plate at a lower axial location. Figure 16 illustrates the geometric models of these three baffle configurations within the annular flow passage.
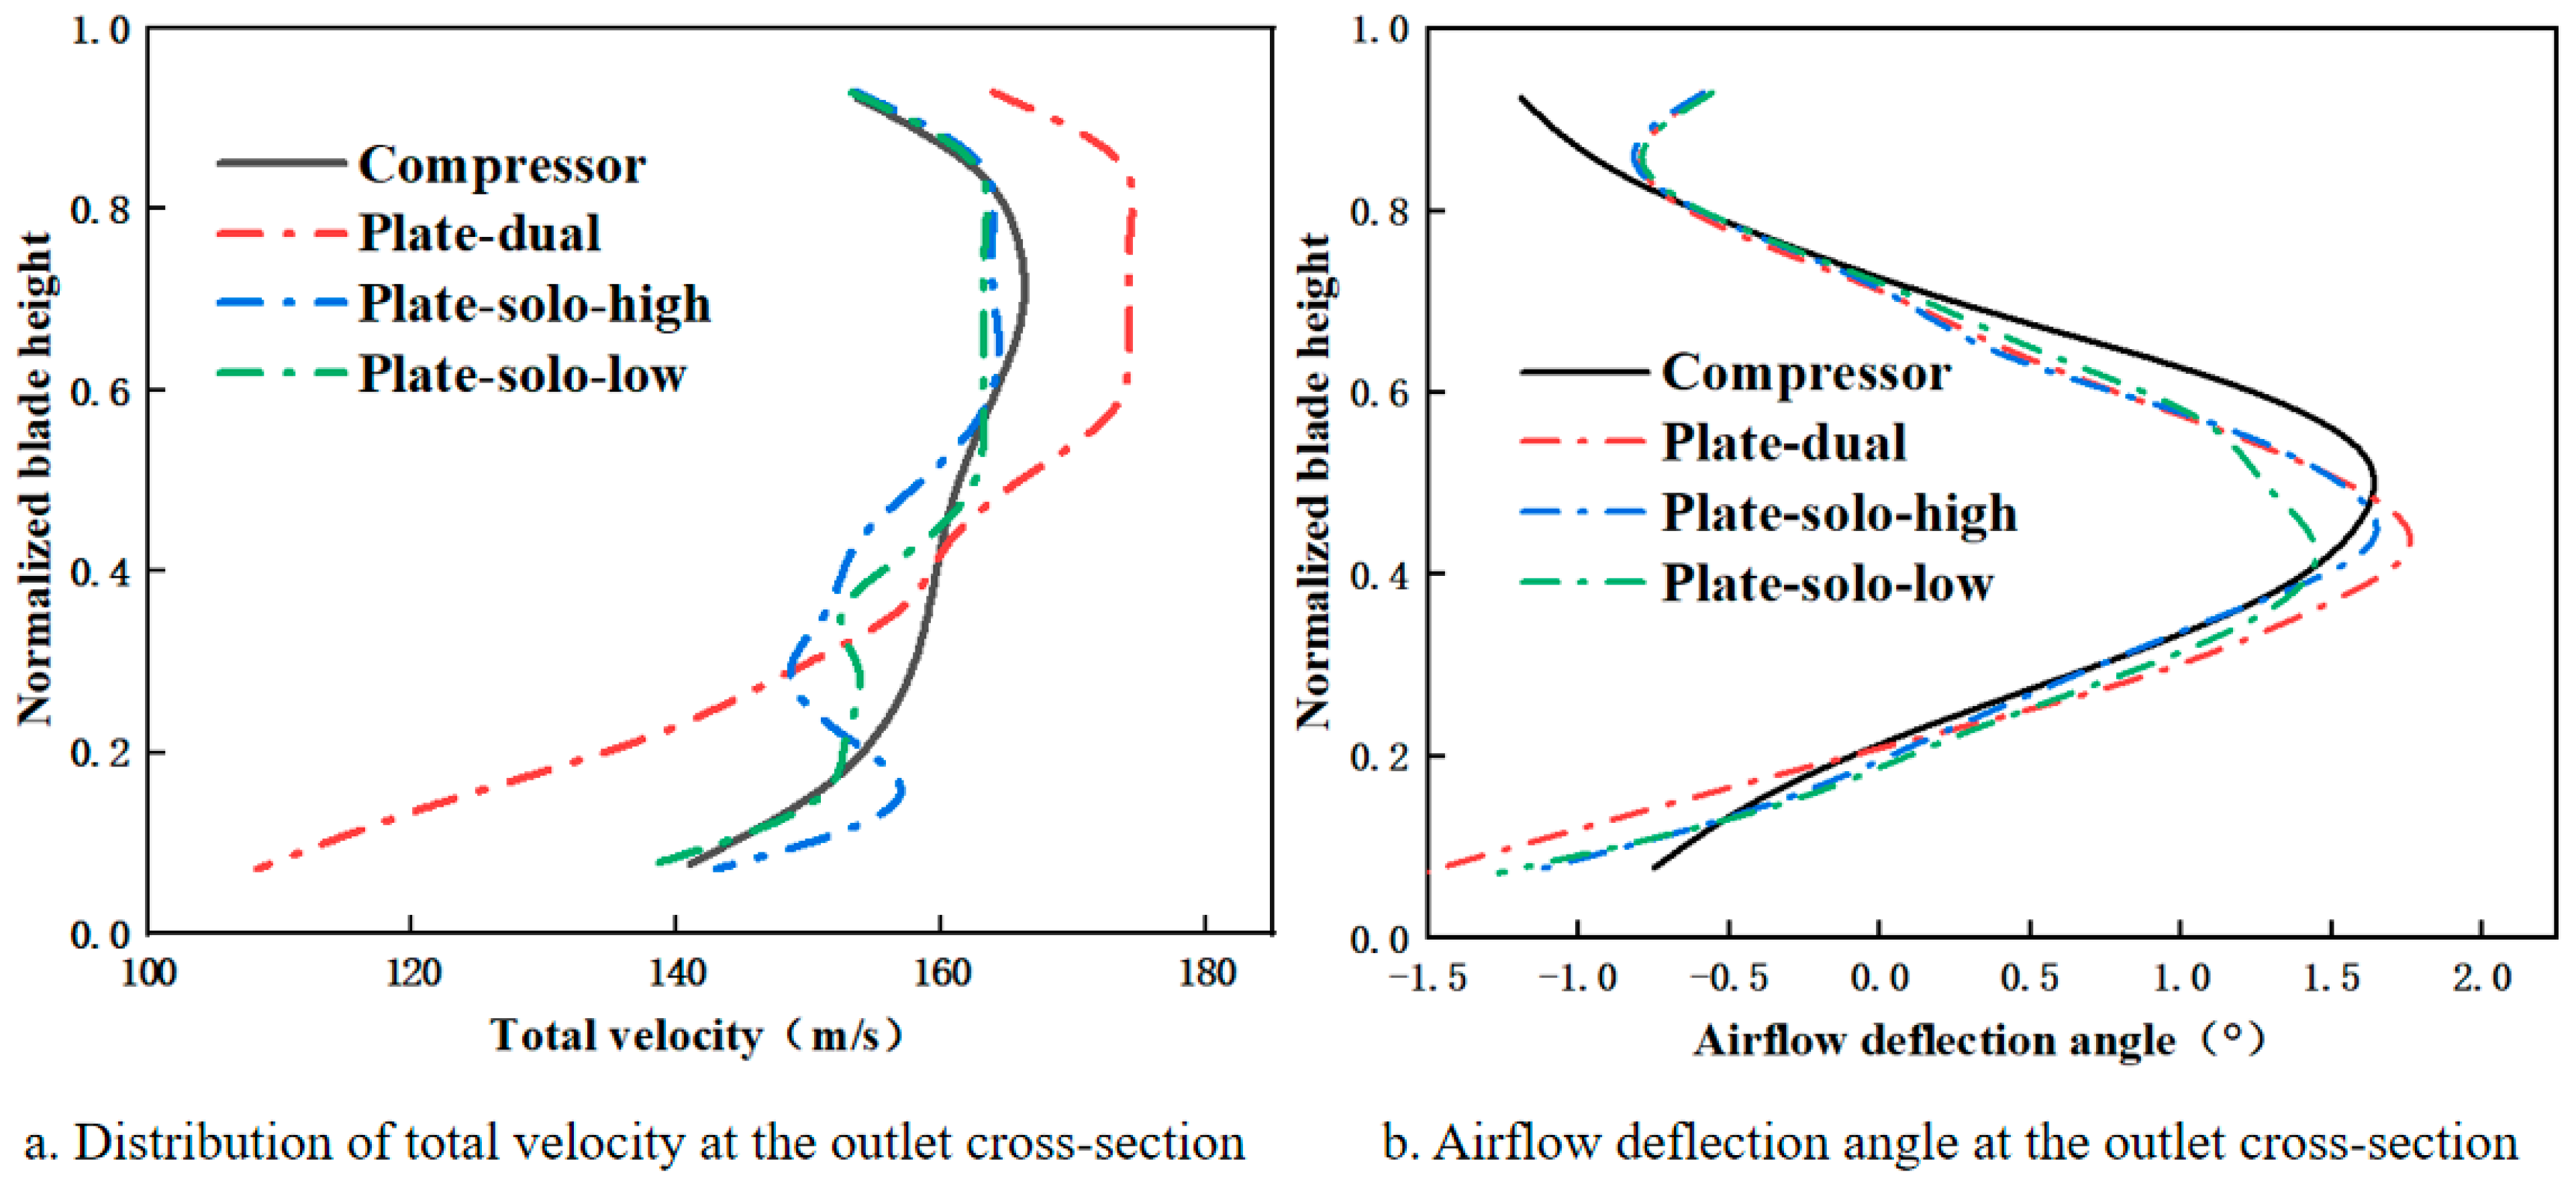
Figure 17 shows the outlet total velocity and flow deflection angle distributions. As seen in Figure 17a, the Plate-dual configuration produces a peak velocity that deviates notably from the compressor outlet, with a strong reduction near the blade root. This results from the combined upper and lower plates, which increase blockage, and the narrow hub gap, which causes severe local restriction.
By contrast, Plate-solo-high and Plate-solo-low yield peak velocities closer to the compressor outlet, with differences mainly near the blade root. Their peak values are 164.7 m/s and 163.8 m/s, compared with 175.1 m/s for Plate-dual and 166.57 m/s for the compressor, and corresponding to deviations of 1.1%, 1.7%, and 5.1%. The peak positions are 0.64, 0.86, and 0.86 versus 0.69 for the compressor, with deviations of 7.2%, 24.6%, and 24.6%. Notably, Plate-solo-high produces a secondary velocity peak near the root, while Plate-solo-low shows only a slight reduction without secondary peaks.
This arises from the elevated placement of Plate-solo-high, which leaves a hub gap: flow beneath the baffle slows moderately, while flow through the gap remains fast, creating a local gradient and secondary peak. Figure 17b shows that all three baffles only slightly affect the deflection angle peak and position, with the overall trend preserved.
The peak deflection angles are 1.88° (Plate-dual), 1.75° (Plate-solo-high), and 1.53° (Plate-solo-low), deviating from the compressor outlet value (1.68°) by 11.9%, 4.2%, and 8.9%. All peak positions are at 0.43, differing by 20% from the compressor value (0.538). Since compressor outlet velocity decreases monotonically across the lower blade span, connecting the upstream baffle to the hub surface may reduce abrupt fluctuations. Thus, future optimization will focus on Plate-solo-low.
Considering that an excessively wide peak in total velocity at the outlet cross-section of the simulation device produces a flattened profile with minimal variation near the blade root—while an overly narrow peak results in excessively low velocities in that region that deviate from the compressor outlet distribution—it is essential to control the peak width. The peak width is influenced by both the length of the horizontal baffles and the spacing between the vertical baffles. To investigate this effect, three baffle configurations were selected: Plate-I, Plate-U, and Plate-L. Plate-I is a configuration without horizontal baffles and with reduced spacing between the vertical baffles. Plate-U features shortened horizontal baffles and reduced spacing between the vertical baffles. Plate-L maintains fully connected horizontal baffles along with reduced spacing between the vertical baffles. Figure 18 shows the geometric models of the three baffle configurations arranged within the annular flow passage.
Figure 19 shows the outlet total velocity and flow deflection angle distributions. As seen in Figure 19a, the Plate-I configuration exhibits a broader velocity peak than Plate-U and Plate-L. Both Plate-U and Plate-L show slight velocity reductions near the blade root, with Plate-I and Plate-L nearly identical in this region. This results from the horizontal baffle length: longer baffles raise peak velocity moderately but, if excessive, reduce root velocity. The peak velocities for Plate-I, Plate-U, and Plate-L are 161.27, 162.63, and 161.56 m/s, deviating from the compressor outlet value (166.57 m/s) by 3.2%, 2.4%, and 3.0%. Their peak positions are 0.85, 0.86, and 0.86 versus 0.69 at the compressor outlet, with deviations of 23.2%, 24.6%, and 24.6%.
Figure 19b shows that all three configurations have only minor effects on the airflow deflection angle. The peak values are 1.52°, 1.56°, and 1.50°, deviating from the compressor outlet value (1.68°) by 9.5%, 7.1%, and 10.7%. All peak positions are 0.43, differing by 20% from the compressor outlet value (0.538). Since the compressor outlet peak is relatively narrow, a shorter baffle length is recommended to maintain peak sharpness and avoid excessive velocity loss near the blade root.
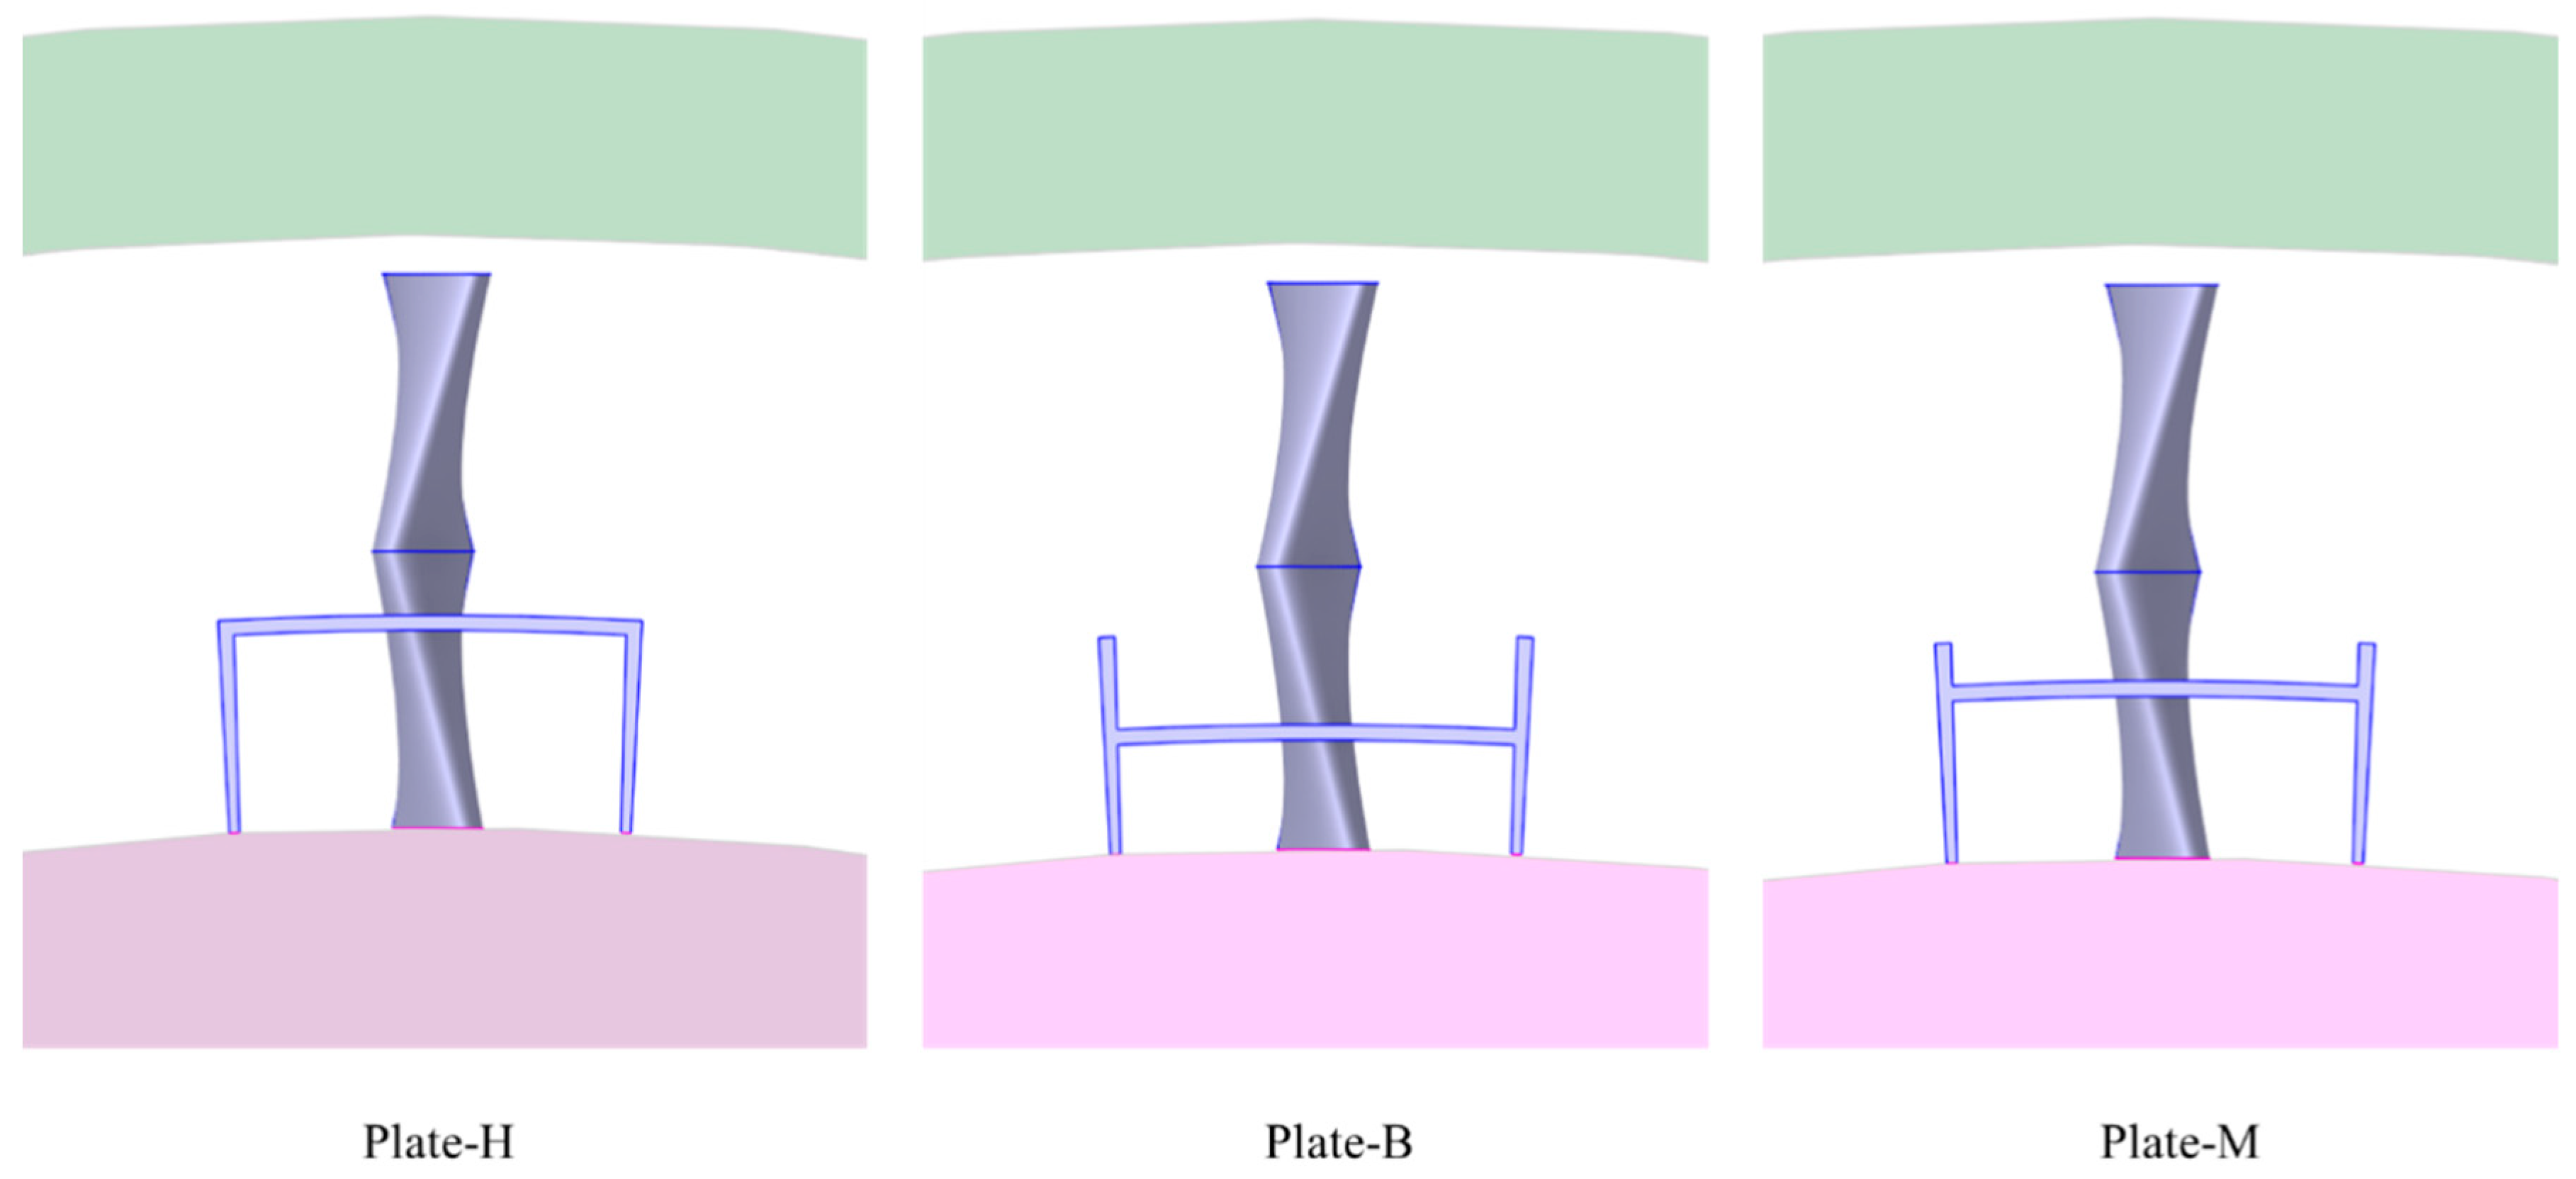
To achieve closer agreement with the total velocity profile of the compressor outlet near the blade root, it is necessary to investigate the vertical positioning of the horizontal baffle along the blade span. To avoid excessive velocity reduction in this region, the baffle should be offset from the hub surface. Accordingly, three baffle configurations were chosen for analysis, Plate-H, Plate-B, and Plate-M, corresponding to horizontal baffle placements at the upper, lower, and middle sections along the blade span, respectively. Figure 20 shows the geometric models of these three configurations arranged within the annular flow passage.
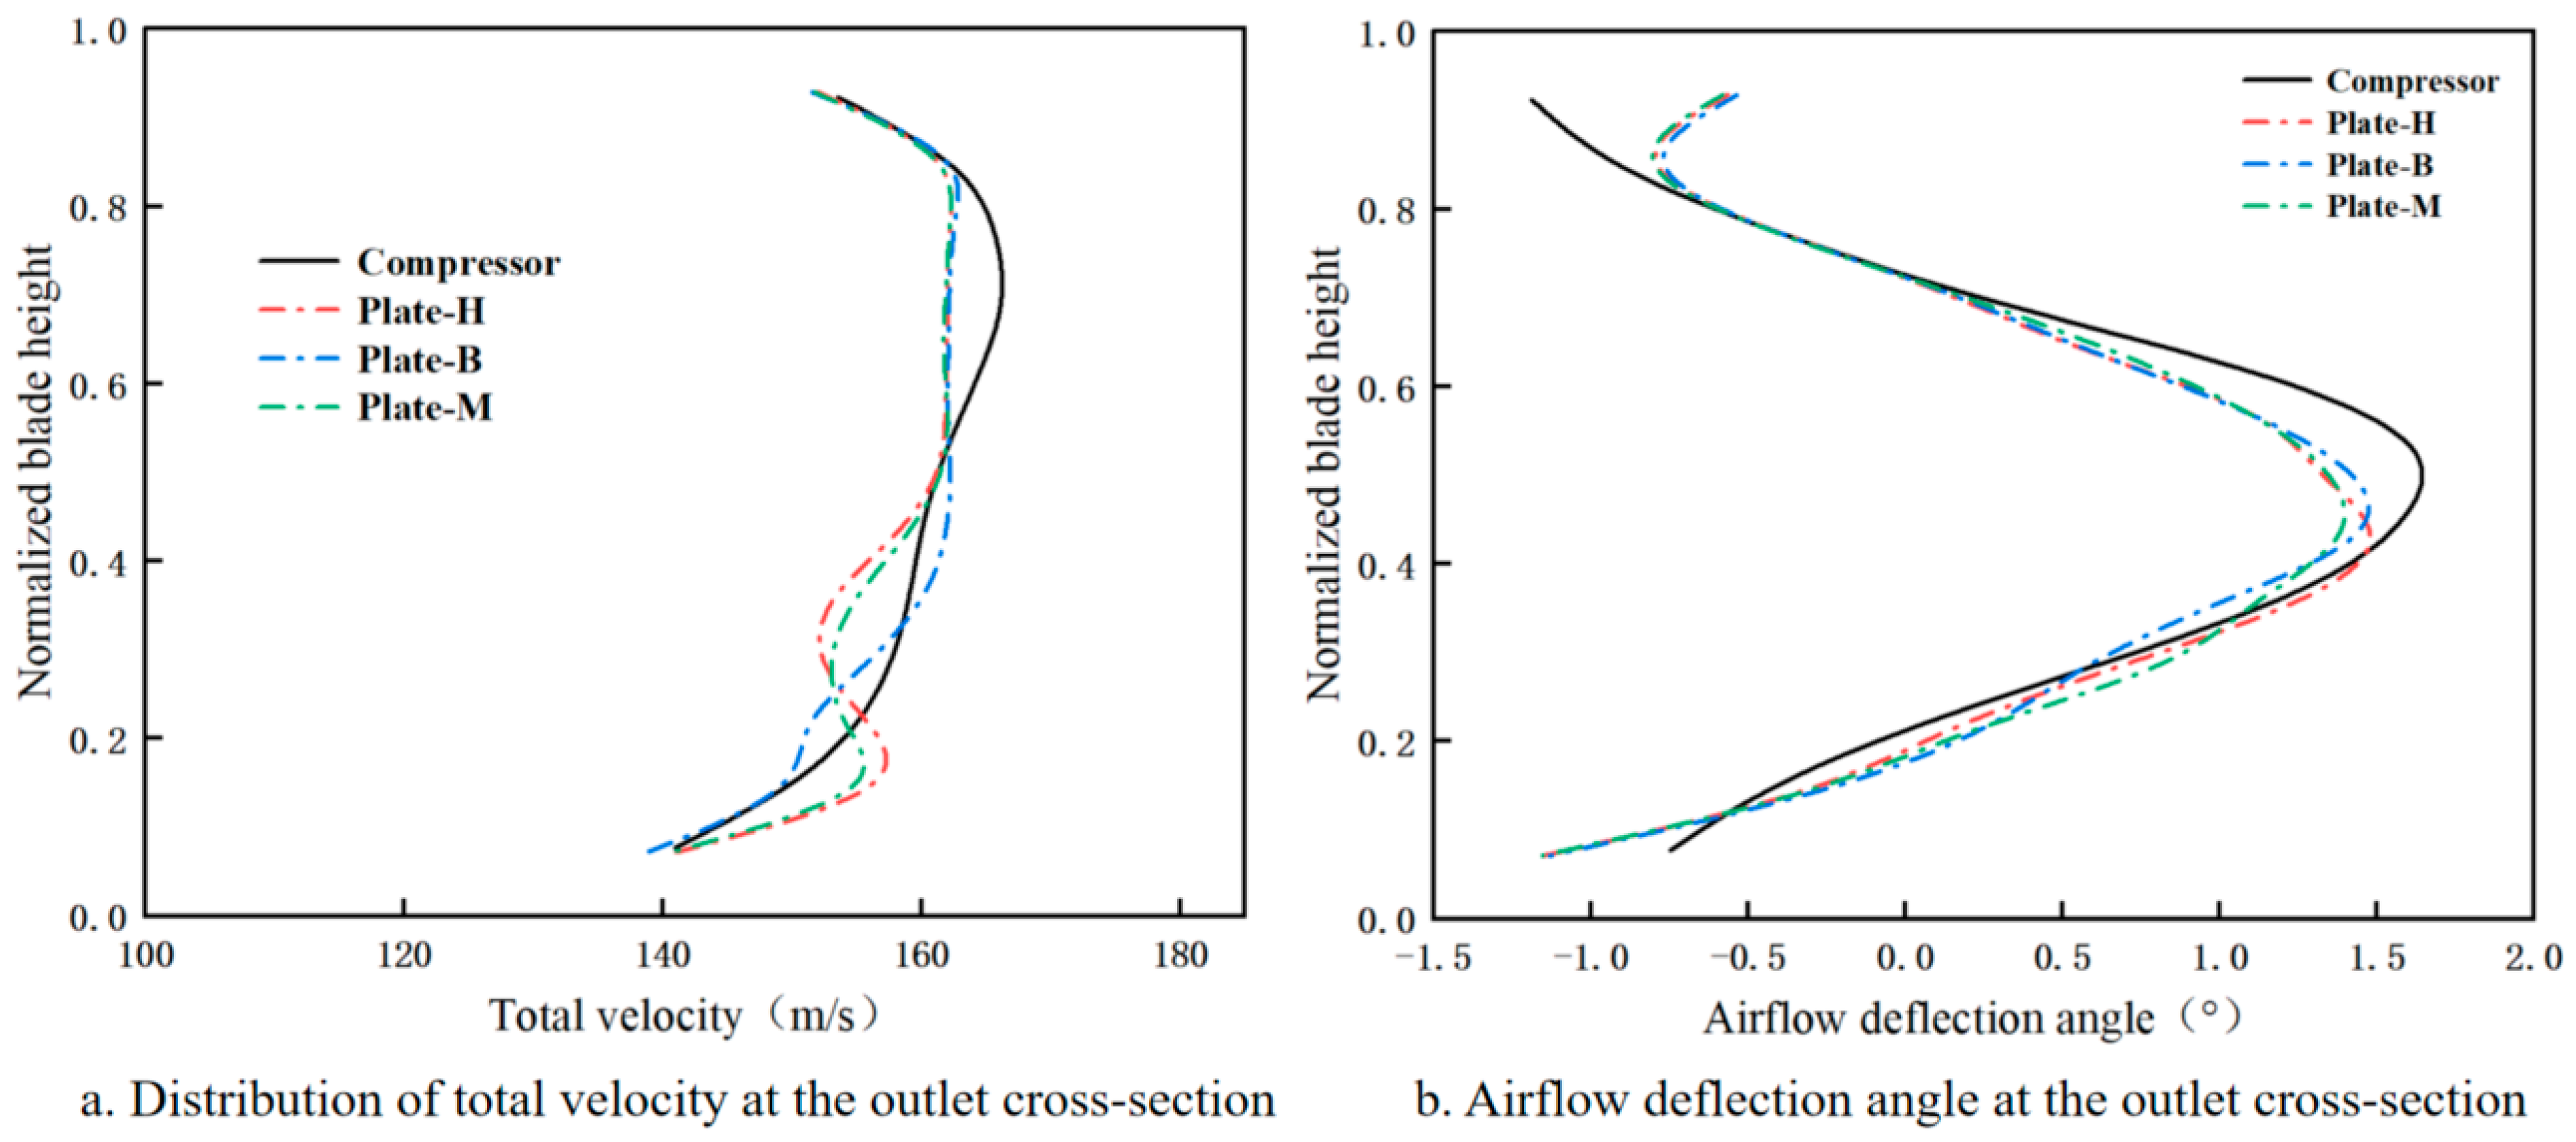
Figure 21 shows the outlet velocity and deflection angle distributions. As seen in Figure 21a, Plate-B produces a slightly broader velocity peak than Plate-H and Plate-M, and its velocity near the blade root aligns more closely with the compressor outlet. In contrast, Plate-H and Plate-M show small reductions at the root with similar overall trends. This difference arises from baffle height: higher placement narrows the peak by causing earlier velocity drops. The peak velocities are 163.60, 162.63, and 162.63 m/s for Plate-B, Plate-H, and Plate-M, deviating from the compressor outlet value (166.57 m/s) by 1.8%, 2.3%, and 2.4%. All peak positions are 0.86, differing by 24.6% from the compressor outlet (0.69).
Figure 21b shows that all three baffles have little effect on deflection angle distribution. The peak values are 1.51°, 1.57°, and 1.43°, deviating from the compressor outlet value (1.68°) by 10.1%, 6.5%, and 14.9%. All peak positions are at 0.43, differing by 20% from the compressor outlet (0.538). Overall, Plate-B, with the baffle positioned lower in the span, is preferred as it best preserves root velocity consistency with the compressor outlet.
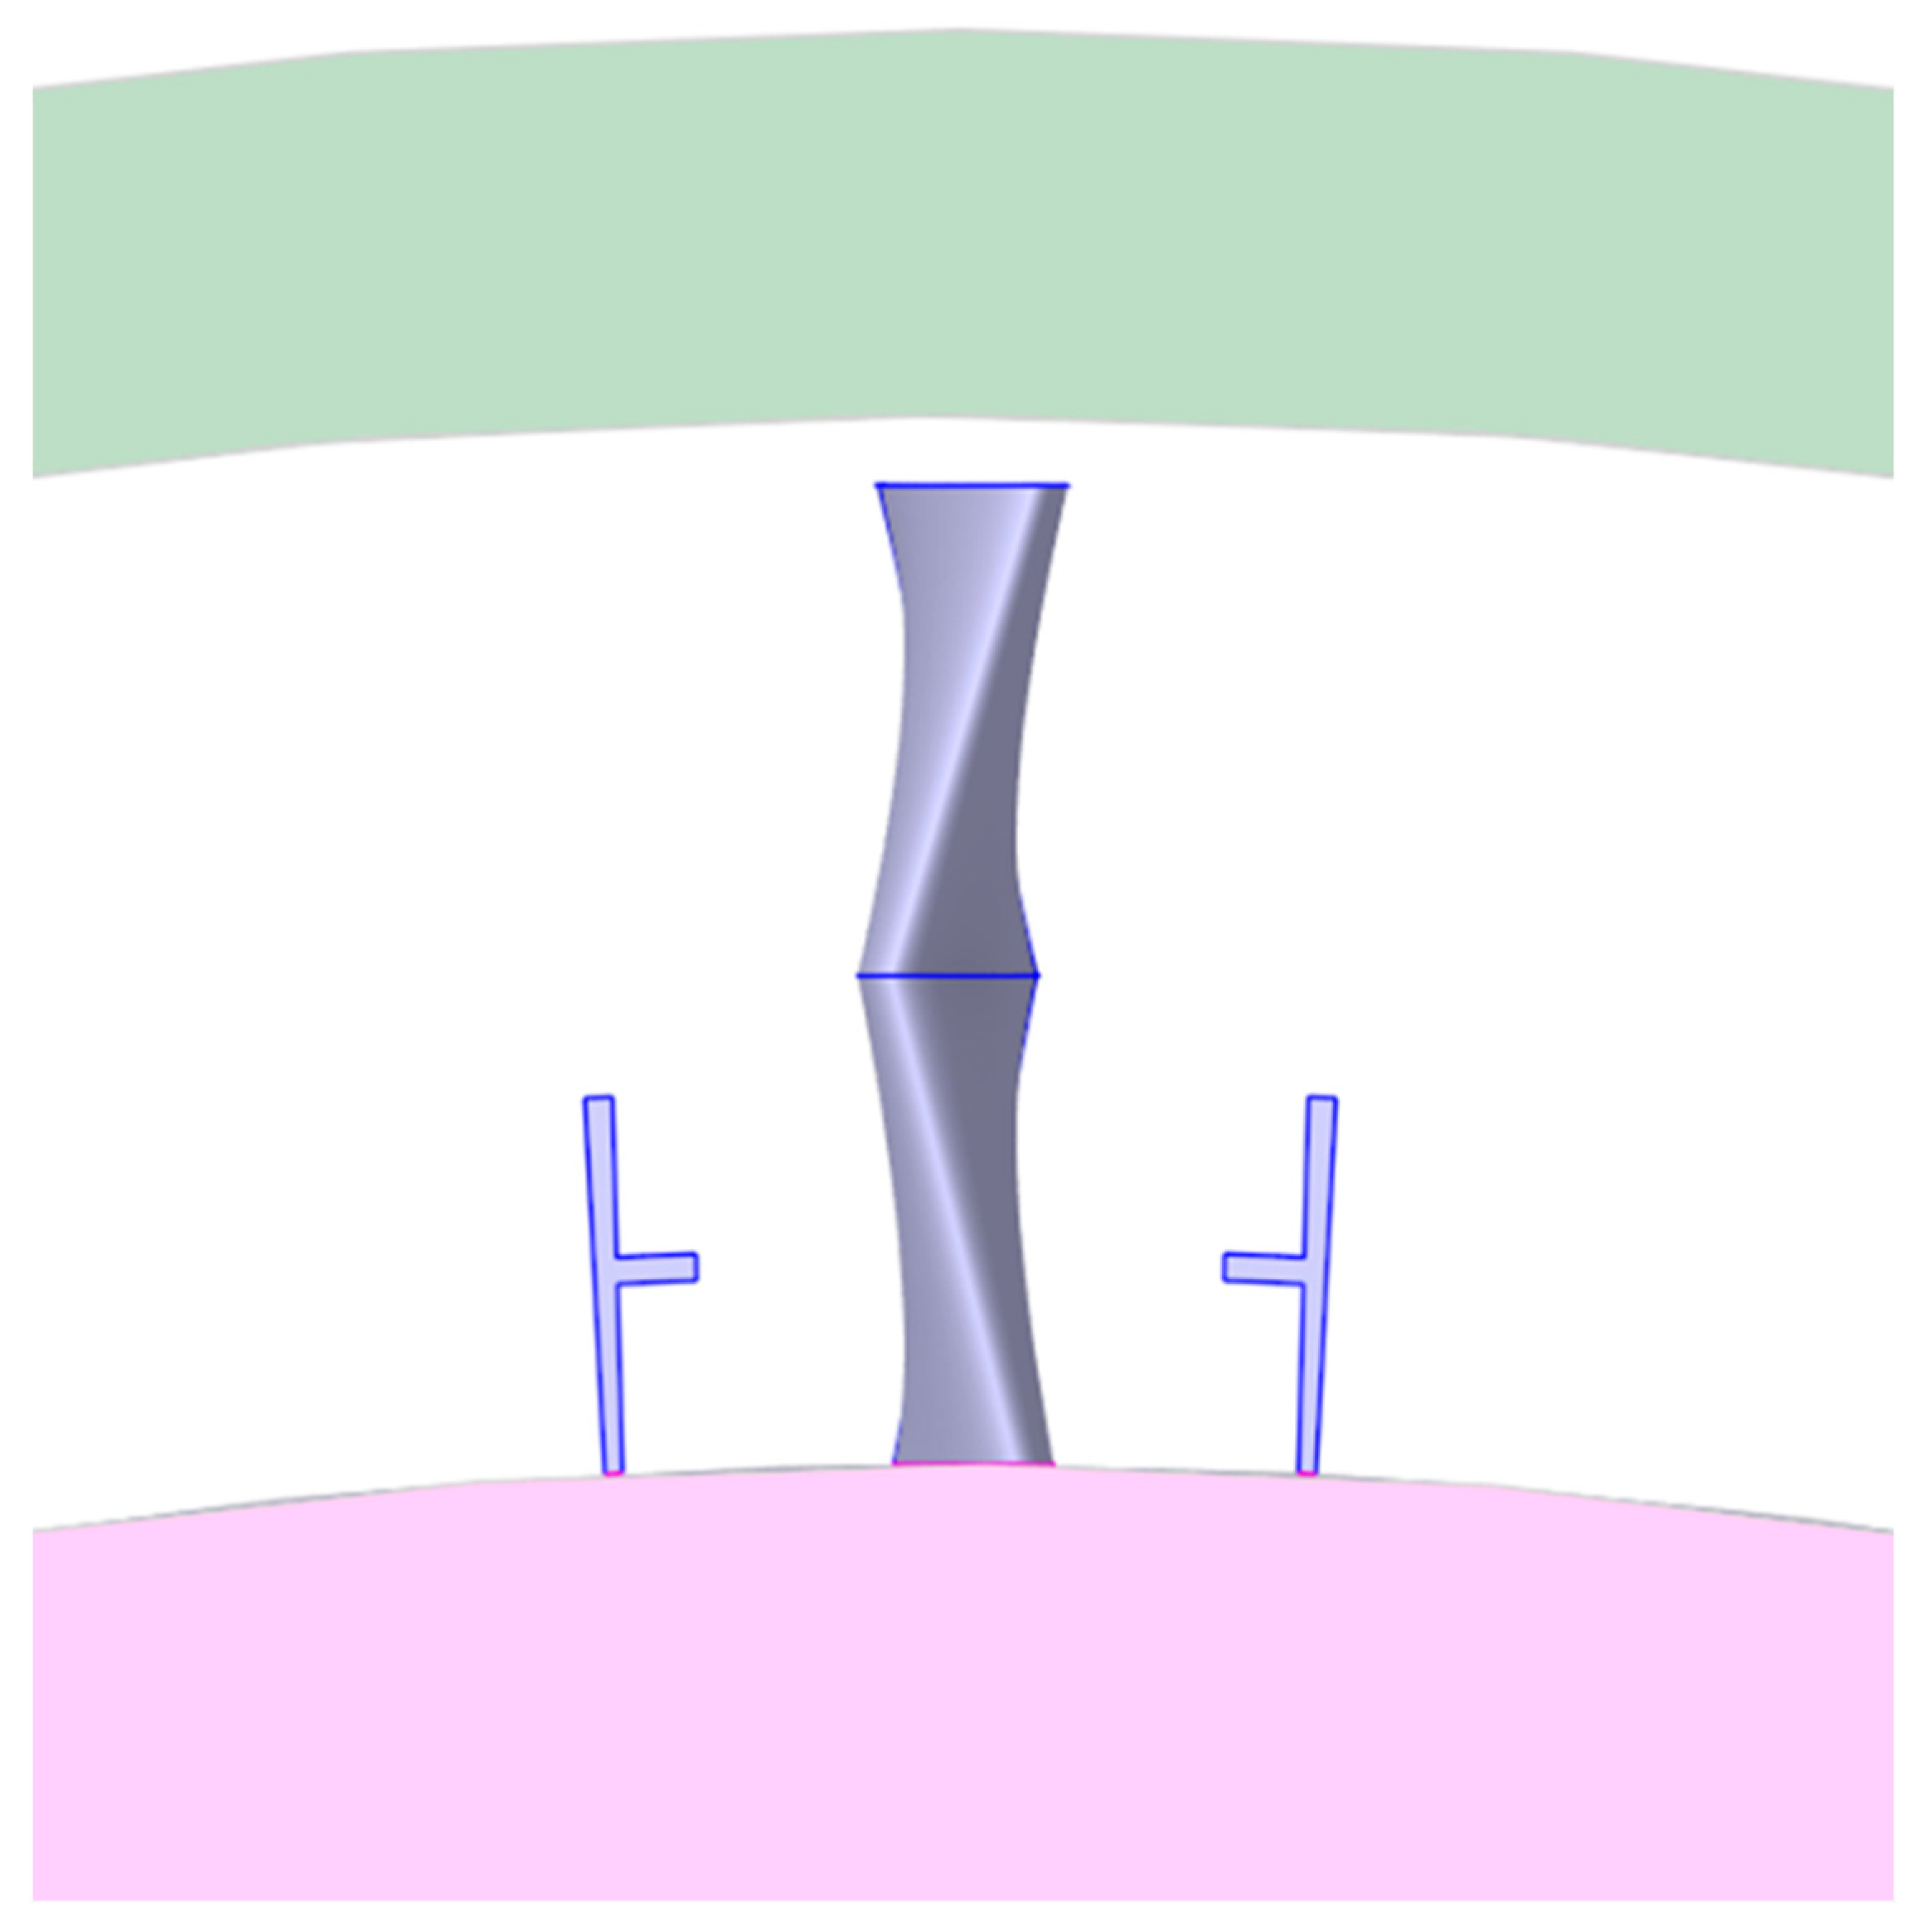
Considering both the peak width of the total velocity and velocity attenuation near the blade root at the outlet cross-section of the simulation device, the Plate-T configuration was identified as the optimized upstream baffle design. This configuration combines a shortened horizontal baffle with a lower spanwise placement. For comparison, it was benchmarked against the Plate-L configuration. Figure 22 depicts the geometric model of the Plate-L baffle arrangement within the annular flow passage.
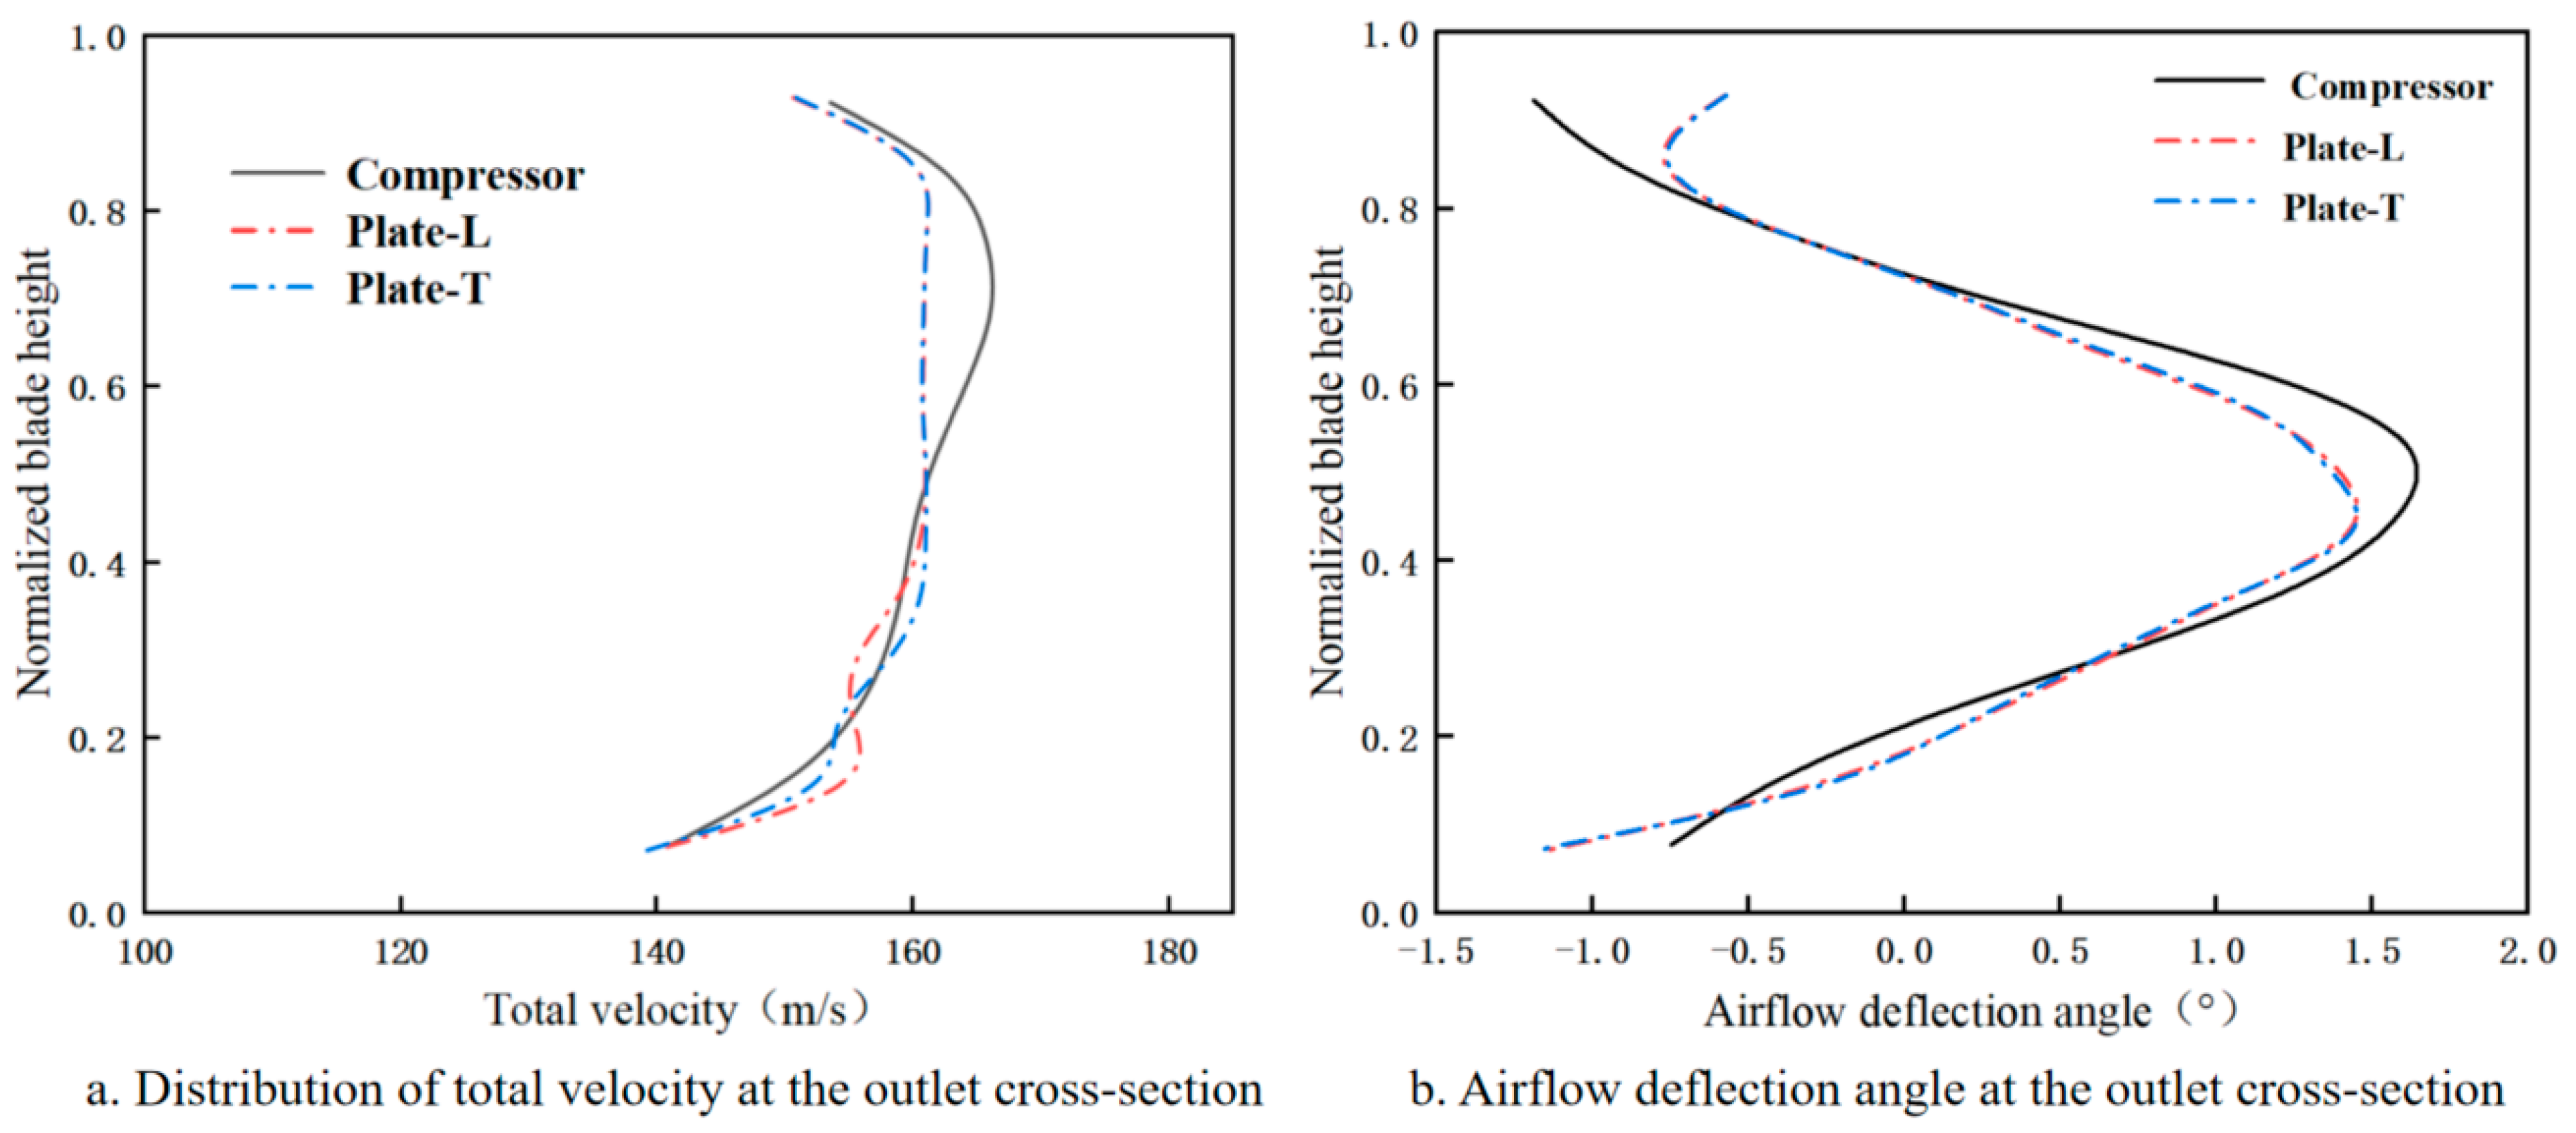
Figure 23 shows the total velocity and flow deflection angle distributions at the outlet cross-section of the simulation device. As illustrated in Figure 23a, when using the Plate-T baffle configuration, the total velocity peak width is marginally wider than in the Plate-L configuration; however, the total velocity near the blade root shows better agreement with that of the compressor outlet. The region where the total velocity falls below the compressor outlet value is notably diminished, and the error near the blade root is significantly reduced. The peak total velocities for Plate-L and Plate-T are 161.56 m/s and 161.57 m/s, respectively. Compared with the compressor outlet peak velocity of 166.57 m/s, both deviate by 3.0%. The corresponding peak positions are 0.86 for Plate-L and 0.72 for Plate-T, representing deviations of 24.6% and 8.5% from the compressor outlet peak position of 0.69, respectively.
As shown in Figure 23b, the two baffle configurations exhibit negligible influence on both the peak magnitude and position of the airflow deflection angle at the outlet cross-section, with the overall distribution trend largely preserved. The peak deflection angles for Plate-L and Plate-T are 1.50° and 1.54°, respectively. Compared with the compressor outlet peak value of 1.68°, these correspond to deviations of 10.7% and 8.3%, respectively. The peak positions for both configurations are located at 0.43, representing a deviation of 20% from the compressor outlet peak position of 0.538.
In summary, through coordinated optimization of the upstream baffle’s geometry and placement, a configuration was achieved that closely replicates the total velocity distribution at the compressor outlet. The final Plate-T design achieves a narrow peak width while simultaneously providing improved alignment with the compressor outlet velocity near the blade root.
In summary, reducing the baffle thickness decreases the peak total velocity at the outlet cross-section of the simulation device. Narrowing the spacing between vertical baffles mitigates the velocity deviation near the blade root compared to the compressor outlet. Shortening the horizontal baffle length improves the total velocity distribution near the blade root, while slightly increasing the peak width. Placing the horizontal baffle in the lower-to-mid-span region results in the most favorable total velocity distribution. For the Plate-dual, Plate-solo-high, and Plate-solo-low configurations, the peak total velocity deviations relative to the compressor outlet are 5.1%, 1.1%, and 1.7%, respectively, while the corresponding deviations in peak position are 24.6%, 7.2%, and 24.6%. For Plate-I, Plate-U, and Plate-L, the peak total velocity differences are 3.2%, 2.4%, and 3.0%, with peak position deviations of 23.2%, 24.6%, and 24.6%, respectively. For Plate-H, Plate-B, and Plate-M, the peak total velocity differences are 2.3%, 2.4%, and 1.7%, respectively, with all three exhibiting a 24.6% deviation in peak position. Finally, the Plate-T configuration—featuring a short horizontal baffle placed in the lower span—achieves a peak total velocity deviation of 3.0% and a peak position deviation of only 8.5%, indicating good overall agreement with the compressor outlet characteristics.

4. Conclusions

In this study, numerical simulations were performed for a flow field simulation device at the combustion chamber inlet. The analysis focused on two key aspects: the design of segmented variable-twist stator blades and the optimization of upstream baffle structures. Based on the simulation results and parametric analyses, the main conclusions can be summarized as follows:
(1)
When a variable-twist blade configuration with a consistent twist direction at the blade root and tip is adopted, the airflow deflection angle distribution at the outlet cross-section of the simulation device exhibits strong agreement with that of the compressor outlet. For the B4.5M-5.5T6 configuration—with twist angles of 4.5° (bottom), 5.5° (middle), and 6° (top)—the peak airflow deflection angle at the outlet is 1.45°, differing by 0.23° from the compressor outlet value. The corresponding peak position is 0.50, representing a 7.1% deviation from that of the compressor outlet. Both deviations fall within the acceptable error range.
(2)
Introducing horizontal and vertical baffles upstream from the blade passage effectively modifies the total velocity distribution at the outlet cross-section of the simulation device by increasing velocity near the blade tip and decreasing it near the blade root. When the Plate-T baffle configuration is applied, the peak total velocity at the outlet is 161.57 m/s, representing a 3% deviation from the compressor outlet. The peak position is 0.72, with a deviation of 8.5%. Both values fall within the acceptable deviation range.
(3)
Numerical simulations show that placing baffles at the blade tip or blade root leads to inverse trends in peak velocity positioning within the outlet cross-section. Reducing baffle thickness, decreasing vertical baffle spacing, shortening horizontal baffle length, and lowering horizontal baffle placement along the blade span effectively controls the total velocity distribution near the blade root and tip, thereby reducing deviations from the compressor outlet. Ultimately, the Plate-T configuration limits the errors in peak total velocity magnitude and position to approximately 3.0% and 8.4%, respectively, meeting the design requirements. These results highlight the critical importance of upstream baffle geometry optimization in achieving precise flow field control within the simulation device.

Author Contributions

Conceptualization, D.J.; Methodology, D.J. and Y.Y.; Investigation, H.L.; Data curation, H.L., X.L. and Y.L.; Writing—original draft, D.J.; Writing—review & editing, X.L., Y.H., C.L. and C.Z.; Funding acquisition, Y.Y. All authors have read and agreed to the published version of the manuscript.

Funding

This research received no external funding.

Data Availability Statement

The original contributions presented in this study are included in the article. Further inquiries can be directed to the corresponding author.

Acknowledgments

This research is derived from the outsourced project of AECC Sichuan Gas Turbine Estab.

Conflicts of Interest

Authors Dong Jiang, Huadong Li and Xiang Li were employed by the company AECC Sichuan Gas Turbine Estab. The remaining authors declare that the research was conducted in the absence of any commercial or financial relationships that could be construed as a potential conflict of interest.

References

  1. Zhang, X.; Zhang, T.; Sheng, H. A novel aeroengine real-time model for active stability control: Compressor instabilities integration. Aerosp. Sci. Technol. 2024, 145, 108844. [Google Scholar] [CrossRef]
  2. Silva, C.F.; Duran, I.; Nicoud, F.; Moreau, S. Boundary conditions for the computation of thermoacoustic modes in combustion chambers. AIAA J. 2014, 52, 1180–1193. [Google Scholar] [CrossRef]
  3. Semlitsch, B. Boundary conditions to represent the wave impedance characteristics of axial compressors. Appl. Acoust. 2023, 204, 109236. [Google Scholar] [CrossRef]
  4. Agarwal, A.; Kalenga, M.K.W.; Ilunga, M. CFD Simulation of Fluid Flow and Combustion Characteristics in Aero-Engine Combustion Chambers with Single and Double Fuel Inlets. Processes 2025, 13, 124. [Google Scholar] [CrossRef]
  5. Palanti, L.; Pampaloni, D.; Andreini, A.; Facchini, B. Numerical simulation of a swirl stabilized methane-air flame with an automatic meshing CFD solver. Energy Procedia 2018, 148, 376–383. [Google Scholar] [CrossRef]
  6. Fan, L.; Yang, G.; Zhang, Y.; Gao, L.; Wu, B. A novel tolerance optimization approach for compressor blades: Incorporating the measured out-of-tolerance error data and aerodynamic performance. Aerosp. Sci. Technol. 2025, 158, 109920. [Google Scholar] [CrossRef]
  7. Zhou, J.-W.; Qin, Z.; Zhai, E.; Liu, Z.; Wang, S.; Liu, Y.; Chu, F. Bend-twist adaptive control for flexible wind turbine blades: Principles and experimental validation. Mech. Syst. Signal Process. 2025, 224, 111981. [Google Scholar] [CrossRef]
  8. Rahimi, H.; Schepers, J.G.; Shen, W.Z.; García, N.R.; Schneider, M.S.; Micallef, D.; Herráez, I. Evaluation of different methods for determining the angle of attack on wind turbine blades with CFD results under axial inflow conditions. Renew. Energy 2018, 125, 866–876. [Google Scholar] [CrossRef]
  9. Zhang, K.; Hayostek, S.; Amitay, M.; He, W.; Theofilis, V.; Taira, K. On the formation of three-dimensional separated flows over wings under tip effects. J. Fluid Mech. 2020, 895, A9. [Google Scholar] [CrossRef]
  10. Silva, L.J.O.; Wolf, W.R. Embedded shear layers in turbulent boundary layers of a NACA0012 airfoil at high angles of attack. Int. J. Heat Fluid Flow 2024, 107, 109353. [Google Scholar] [CrossRef]
  11. Bashir, M.; Zonzini, N.; Botez, R.M.; Ceruti, A.; Wong, T. Flow Control around the UAS-S45 Pitching Airfoil Using a Dynamically Morphing Leading Edge (DMLE): A Numerical Study. Biomimetics 2023, 8, 51. [Google Scholar] [CrossRef]
  12. Qi, W.; Yang, J.; Zhang, Z.; Wu, J.; Lan, P.; Xiang, S. Investigation on thermal management of cylindrical lithium-ion batteries based on interwound cooling belt structure. Energy Convers. Manag. 2025, 340, 119962. [Google Scholar] [CrossRef]
  13. Deng, H.; Luo, L.; Yan, H.; Zhou, X.; Du, W.; Luo, Q. Experimental and numerical study on a three-stage high-load axial compressor with 3D blade design. Energy 2025, 316, 134399. [Google Scholar] [CrossRef]
  14. Zhang, X.; Ju, Y.; Li, Z.; Liu, F.; Zhang, C. Optimization of Three-Dimensional Blade and Variable Stators for Efficiency and Stability Enhancement of Multistage Axial Flow Compressor at Variable Speeds. J. Turbomach. 2023, 146, 041004. [Google Scholar] [CrossRef]
  15. Zhang, X.; Ju, Y.; Li, Z.; Liu, F.; Zhang, C. Metamodel-Interpreted Data Mining for Stability and Efficiency Enhancement of Multistage Axial-Flow Compressors. J. Turbomach. 2022, 145, 041001. [Google Scholar] [CrossRef]
  16. Asgari, M.; Ommi, F.; Saboohi, Z. Aeroelastic modeling and multi-objective optimization of a subsonic compressor rotor blade using a combination of modified NSGA-II, ANN, and TOPSIS. Results Eng. 2025, 26, 104615. [Google Scholar] [CrossRef]
  17. Xu, J.; Wang, L.; Yuan, J.; Fu, Y.; Wang, Z.; Zhang, B.; Tan, A.C. Mesh-based data-driven approach for optimization of tidal turbine blade shape. Energy 2025, 328, 136699. [Google Scholar] [CrossRef]
  18. Krishnan, A.; Al-Obaidi, A.S.M.; Hao, L.C. A comprehensive review of innovative wind turbine airfoil and blade designs: Toward enhanced efficiency and sustainability. Sustain. Energy Technol. Assess. 2023, 60, 103511. [Google Scholar] [CrossRef]
  19. Fan, M.-Y.; Chen, J. Nonlinear dynamics of rotating functionally graded graphene platelets/titanium alloy trapezoid plates under 1:3 internal resonance. Nonlinear Dyn. 2024, 112, 20793–20812. [Google Scholar] [CrossRef]
  20. Mansouri, Z.; Jefferson-Loveday, R. Heat transfer characteristics of a high-pressure turbine under combined distorted hot-streak and residual swirl: An unsteady computational study. Int. J. Heat Mass Transf. 2022, 195, 123143. [Google Scholar] [CrossRef]
  21. Fathi, S.; Boroomand, M.; Eshraghi, H. Improving near-stall performance of axial flow compressors using variable rotor tandem stage. A steady analysis. Phys. Fluids 2024, 36, 097101. [Google Scholar] [CrossRef]
  22. Qi, W.; Lan, P.; Yang, J.; Chen, Y.; Zhang, Y.; Wang, G.; Hong, J. Multi-U-Style micro-channel in liquid cooling plate for thermal management of power batteries. Appl. Therm. Eng. 2024, 256, 123984. [Google Scholar] [CrossRef]
  23. Liu, C.; Guo, J.; Wang, C.; Liu, P.; Ding, S. An adjustable vane-shaped nozzle-based modulated pre-swirl system for gas turbine aero-engine: Structure parameters and aerodynamic performance analysis. Appl. Therm. Eng. 2024, 257, 124302. [Google Scholar] [CrossRef]
  24. Asim, T.; Singh, D.; Siddiqui, M.S.; McGlinchey, D. Effect of Stator Blades on the Startup Dynamics of a Vertical Axis Wind Turbine. Energies 2022, 15, 8135. [Google Scholar] [CrossRef]
  25. Hurtado, J.P.; Villegas, B.; Pérez, S.; Acuña, E. Optimization Study of Guide Vanes for the Intake Fan-Duct Connection Using CFD. Processes 2021, 9, 1555. [Google Scholar] [CrossRef]
  26. Jiang, D.; Li, H.; Liu, C.; Hu, Y.; Li, Y.; Yan, Y.; Zhang, C. Aerodynamic Characteristics of Typical Operating Conditions and the Impact of Inlet Flow Non-Uniformity in a Multi-Stage Transonic Axial Compressor. Processes 2025, 13, 1428. [Google Scholar] [CrossRef]
  27. Nakhchi, M.E.; Naung, S.W.; Rahmati, M. Influence of blade vibrations on aerodynamic performance of axial compressor in gas turbine: Direct numerical simulation. Energy 2022, 242, 122988. [Google Scholar] [CrossRef]
  28. Şöhret, Y.; Ekici, S.; Altuntaş, Ö.; Hepbasli, A.; Karakoç, T.H. Exergy as a useful tool for the performance assessment of aircraft gas turbine engines: A key review. Prog. Aerosp. Sci. 2016, 83, 57–69. [Google Scholar] [CrossRef]
  29. Liu, X.; Guo, S.; Wang, Y.; Wang, D.; Wang, G.; Li, H. CFD-based unsteady simulation and performance analysis of scroll compressor. Int. J. Refrig. 2025, 170, 150–163. [Google Scholar] [CrossRef]
  30. Huang, P.; Bu, X.; Lin, G.; Wen, D. Numerical simulations of ice crystal icing within a 1.5-stage compressor in an aero-engine. Case Stud. Therm. Eng. 2025, 69, 106026. [Google Scholar] [CrossRef]
  31. Kumar, A.; Bharti, R.P. Assessment of RANS-based turbulence models for isothermal confined swirling flow in a realistic can-type gas turbine combustor application. J. Comput. Sci. 2024, 81, 102362. [Google Scholar] [CrossRef]
  32. Waluyo, R.; Aziz, M. Advanced numerical simulation of hydrogen/air turbulent non-premixed flame on model burner. Therm. Sci. Eng. Prog. 2024, 49, 102467. [Google Scholar] [CrossRef]
  33. Pope, S.B. Turbulent Flows; Cambridge University Press: Cambridge, UK, 2000. [Google Scholar]
  34. Nallasamy, M. Turbulence models and their applications to the prediction of internal flows: A review. Comput. Fluids 1987, 15, 151–194. [Google Scholar] [CrossRef]
  35. Gong, C.; Zhao, S.; Chen, W.; Li, W.; Zhou, Y.; Qiu, M. Numerical study on the combustion process in a gas turbine combustor with different reference velocities. Adv. Aerodyn. 2023, 5, 24. [Google Scholar] [CrossRef]
  36. Amerini, A.; Paccati, S.; Andreini, A. Computational Optimization of a Loosely-Coupled Strategy for Scale-Resolving CHT CFD Simulation of Gas Turbine Combustors. Energies 2023, 16, 1664. [Google Scholar] [CrossRef]
Figure 1. Geometric model of the flow passage in the simulation device.
Energies 18 04535 g001
Figure 2. Geometric model of a single stator blade in the simulation device.
Energies 18 04535 g002
Figure 3. Geometric model of the simulation device.
Energies 18 04535 g003
Figure 4. Mesh generation of the simulation device.
Energies 18 04535 g004
Figure 5. Wall y+ distribution of the selected mesh.
Energies 18 04535 g005
Figure 6. Grid independence verification.
Energies 18 04535 g006
Figure 7. Schematic diagram of twist angles at different blade sections.
Energies 18 04535 g007
Figure 8. Geometric models of blade configurations with different twist angles.
Energies 18 04535 g008
Figure 9. Distribution of total velocity and airflow deflection angle at the outlet cross-section of the simulation device.
Energies 18 04535 g009
Figure 10. Geometric models of symmetric variable-twist blade configurations.
Energies 18 04535 g010
Figure 11. Outlet cross-section distributions of total velocity and airflow deflection angle in the simulation device.
Energies 18 04535 g011
Figure 12. Outlet cross-section distributions of total velocity and airflow deflection angle in the simulation device.
Energies 18 04535 g012
Figure 13. Schematic diagram of the upstream baffle arrangement.
Energies 18 04535 g013
Figure 14. Schematic diagram of different upstream baffle placement positions.
Energies 18 04535 g014
Figure 15. Outlet cross-section distributions of total velocity and airflow deflection angle in the simulation device.
Energies 18 04535 g015
Figure 16. Geometric models of upstream baffle structures.
Energies 18 04535 g016
Figure 17. Outlet cross-section distributions of total velocity and airflow deflection angle in the simulation device.
Energies 18 04535 g017
Figure 18. Schematic diagram of different horizontal baffle lengths.
Energies 18 04535 g018
Figure 19. Outlet cross-section distributions of total velocity and airflow deflection angle in the simulation device.
Energies 18 04535 g019
Figure 20. Schematic diagram of different horizontal baffle positions.
Energies 18 04535 g020
Figure 21. Outlet cross-section distributions of total velocity and airflow deflection angle in the simulation device.
Energies 18 04535 g021
Figure 22. Geometric model of the Plate-T upstream baffle.
Energies 18 04535 g022
Figure 23. Outlet cross-section distributions of total velocity and airflow deflection angle in the simulation device.
Energies 18 04535 g023
Table 1. Definition of variables.
Symbol/VariableDefinitionUnit
ρFluid densitykg/m3
vVelocity vectorm/s
viVelocity component in the i-th Cartesian coordinate direction (i = 1, 2, 3)m/s
pStatic pressurePa
τijShear stress component in the i-th direction on a plane normal to the j-th directionPa
fExternal body force vectorN/m3
fiExternal body force component in i-th directionN/m3
VzAxial velocity componentm/s
VtTangential velocity componentm/s
VrRadial velocity componentm/s
VmMeridional velocity magnitude (Vm = sqrt(Vz2 + Vr2))m/s
Table 2. Inlet parameters under full load condition.
Operating ParametersValues
Operating Pressure Po/MPa0.51
Inlet Temperature T1/K620
Inlet Air Flow Rate (kg/s)6.574
Outlet Gauge Pressure Pg2/MPa0
Disclaimer/Publisher’s Note: The statements, opinions and data contained in all publications are solely those of the individual author(s) and contributor(s) and not of MDPI and/or the editor(s). MDPI and/or the editor(s) disclaim responsibility for any injury to people or property resulting from any ideas, methods, instructions or products referred to in the content.