Article

Modeling and Numerical Investigations of Flowing N-Decane Partial Catalytic Steam Reforming at Supercritical Pressure

Department of Mechanical Engineering and Automation, Harbin Institute of Technology, Shenzhen 518055, China
*
Author to whom correspondence should be addressed.
Energies 2024, 17(20), 5215; https://doi.org/10.3390/en17205215
Submission received: 16 September 2024 / Revised: 15 October 2024 / Accepted: 18 October 2024 / Published: 20 October 2024

Abstract

:
Steam reforming is an effective method for improving heat sinks of hypersonic aircraft at high flight Mach numbers. However, unlike the industrial process of producing hydrogen with a high water content, the catalytic steam reforming mechanism for the regeneration cooling process of hydrocarbon fuels with a water content below 30% is still unclear. Catalytic steam reforming (CSR) and catalytic thermal cracking (CTC) reactions occur at low temperatures, with the main products being hydrogen and carbon oxides. Thermal cracking (TC) reactions occur at high temperatures, with the main products being alkanes and alkenes. The above reaction exists simultaneously in the regeneration cooling channel, which is referred to as partial catalytic steam reforming (PCSR). Based on the experimental measurement results, an improved neural network correction method was used to establish a four-step global reaction model for the PCSR of n-decane under low water conditions. The reliability of the four-step model was verified by combining the model with a numerical simulation program and comparing it with the experimental results obtained by electric heating hydrocarbon fuels with a pressure of 3 MPa and a water content of 5/10/15%. The experimental and predicted results using the developed kinetic model are consistent with an error of less than 5% in the decane conversion rate. The average absolute error between the fuel outlet temperature and total heat sink is less than 10%. Using the PCSR model to predict the heat transfer characteristics of mixed fuels with different water contents, the convective heat transfer coefficient is basically the same, and the Nu number is affected by the thermal conductivity coefficient, showing different patterns with changes in the water content.

1. Introduction

The thermal load on the engine surface increases sharply with the increase in the flight Mach number [1]. The use of hydrocarbon fuel regeneration cooling technology is one effective method of protecting combustion chamber materials [2,3,4]. The lack of sufficient endothermic capacity in TC reactions limits their development under high Mach number conditions, and during the TC reaction process, channel walls are prone to coking [5,6,7]. Therefore, it is necessary to develop fuel regeneration cooling technologies that meet higher Mach number heat absorption requirements and improve carbon deposition. Water is added to fuel to improve heat sinks by utilizing the strong heat absorption capacity of steam reforming reaction. Simultaneously, the high-temperature generation of water gas from water and carbon can effectively improve carbon deposition. The PCSR advantage of hydrocarbon fuels is a promising cooling technology for supersonic aircraft in the future.
Regarding regenerative cooling, previous researchers mainly conducted modeling studies on TC reactions. The models can be divided into three types. Detailed models include thousands of elementary reactions and hundreds of species, increasing the difficulty of future numerical simulation [8,9,10,11]. The mechanism model requires the prediction of a large number of kinetic parameters and thermodynamic properties through the thermodynamic theory or quantum chemistry, and its calculation time is relatively long, so the detailed mechanism model is not suitable for engineering applications. It is necessary to develop lumped and global parameter models. The lumped model combines multiple products into fewer lumped components, reducing the complexity of the chemical reaction network. However, the distortion of product information can affect the accuracy of calculations [12]. Numerical simulation focuses on the macroscopic process of material and energy conversion during flow and heat transfer without paying attention to microscopic processes. The global model is the most practical model for studying the macroscopic flow and heat transfer processes of multidimensional fluids. Ward et al. [13,14] demonstrated through experiments that mild cracking products are proportionally distributed. A proportional product distribution (PPD) model for fuel conversion rates of less than 20% was established. The molecular dynamics model established by Jiang et al. [15] showed a high degree of agreement with the experimental results when the RP-3 conversion rate reached 86%. Wang et al. [16] established a molecular reaction model for predicting TC behavior based on experimental research on the pyrolysis of n-decane under supercritical conditions. This model effectively predicts the distribution of product components and thermal properties within a high conversion rate range (with a cracking conversion rate of 93%). Zhu et al. [17] established a global TC reaction model for supercritical fuels using experimental data, including 18 main products. The global model of TC reaction is accurate and practical in studying macroscopic flow and heat transfer. Currently, there is no global model for CSR in the regeneration cooling process, so it is necessary to conduct research on this topic.
Research on steam reforming mainly focuses on the development and transformation of catalysts to improve the hydrogen production rate, promote the distribution of required products, and achieve efficient hydrogen production [18,19,20,21]. The main challenges facing n-decane steam reforming technology include the development of efficient catalysts, the development of supercritical reforming reaction kinetics, and the addition of water to reduce fuel thrust. First, the steam reforming process of n-decane is accompanied by a large amount of energy absorption, requiring precise thermal management to maintain the stability of the reaction. The prediction of thermal management capability requires highly accurate chemical reaction models. Secondly, the hydrogen production reaction model is different from the regenerative cooling model because hydrogen production is carried out under the condition of sufficient water at constant temperature and atmospheric pressure, and the chemical reaction model is simple. Under the condition of constant heat flux, the whole process of regenerative cooling is a variable temperature process with a large temperature span and different reactions involved in different temperature ranges. When the fuel temperature rises, the CSR reaction, CTC reaction, and TC reaction occur successively. This makes the whole reaction system more complex and not only changes the distribution of reaction products and the thermal properties of the fluid, but also causes changes in the reaction rate, which affects the flow and heat transfer. The three reactions are coupled and influence each other in different temperature ranges, but the specific coupling mechanism has not been studied. Thirdly, the amount of water added and temperature control are crucial to the balance of reaction paths between catalytic steam reforming and non-catalytic thermal cracking. At the temperature boundary between catalytic and non-catalytic reactions, the transition of the reaction mechanism requires fine process control. The change in water content throughout the reaction will also change the proportion and rate of the reaction. To solve these problems, it is necessary to develop the chemical reaction model of the regenerative cooling process accurately.
This article develops a global PCSR model for fluid dynamics calculations, which couples fuel flow, heat transfer, and chemical reactions to analyze heat transfer and heat sink characteristics. The calculation results of the global reaction model using low-water-content PCSR conditions show a high degree of agreement with the experimental results. This work provides valuable experimental results and kinetic methods for the PCSR of supercritical n-decane in regenerative cooling microchannels.

2. Experimental Principles and System

2.1. Experimental Principles

The PCSR reaction of hydrocarbon fuels essentially involves the breaking of C-C, C-H, and H-O bonds between the fuel and water, which are then converted to H2, CO, CO2, and small-molecule CnHm on the catalyst surface.
aCnHm + bH2O → {H2; CH4; CO2; CO…}

2.2. Experimental System

In this study, the total flow rate of n-decane (purity 99%) and deionized water was 0.25 g/s. The critical values of n-decane are 344 °C and 2.11 MPa. The experimental pressure is 3 MPa, and with the increase in the flight Mach number, the pressure range of the engine cooling channel is 3–5 MPa. The amount of water added should be controlled within 15%. The presence of water can damage the engine, and it is necessary to completely convert water into other combustible gasses. Excessive water content can weaken the release of combustion heat and reduce engine thrust. Repeated experiments have confirmed that controlling the water content within 15% can completely consume it. We select nickel-based catalysts that are efficient, inexpensive, and widely used in the field of hydrogen production.
Figure 1 shows the experimental system for catalytic reforming reaction, which includes a fuel supply system, preheater, testing section, cooler, and sampling and measurement system. The experimental process can be found in reference [22].
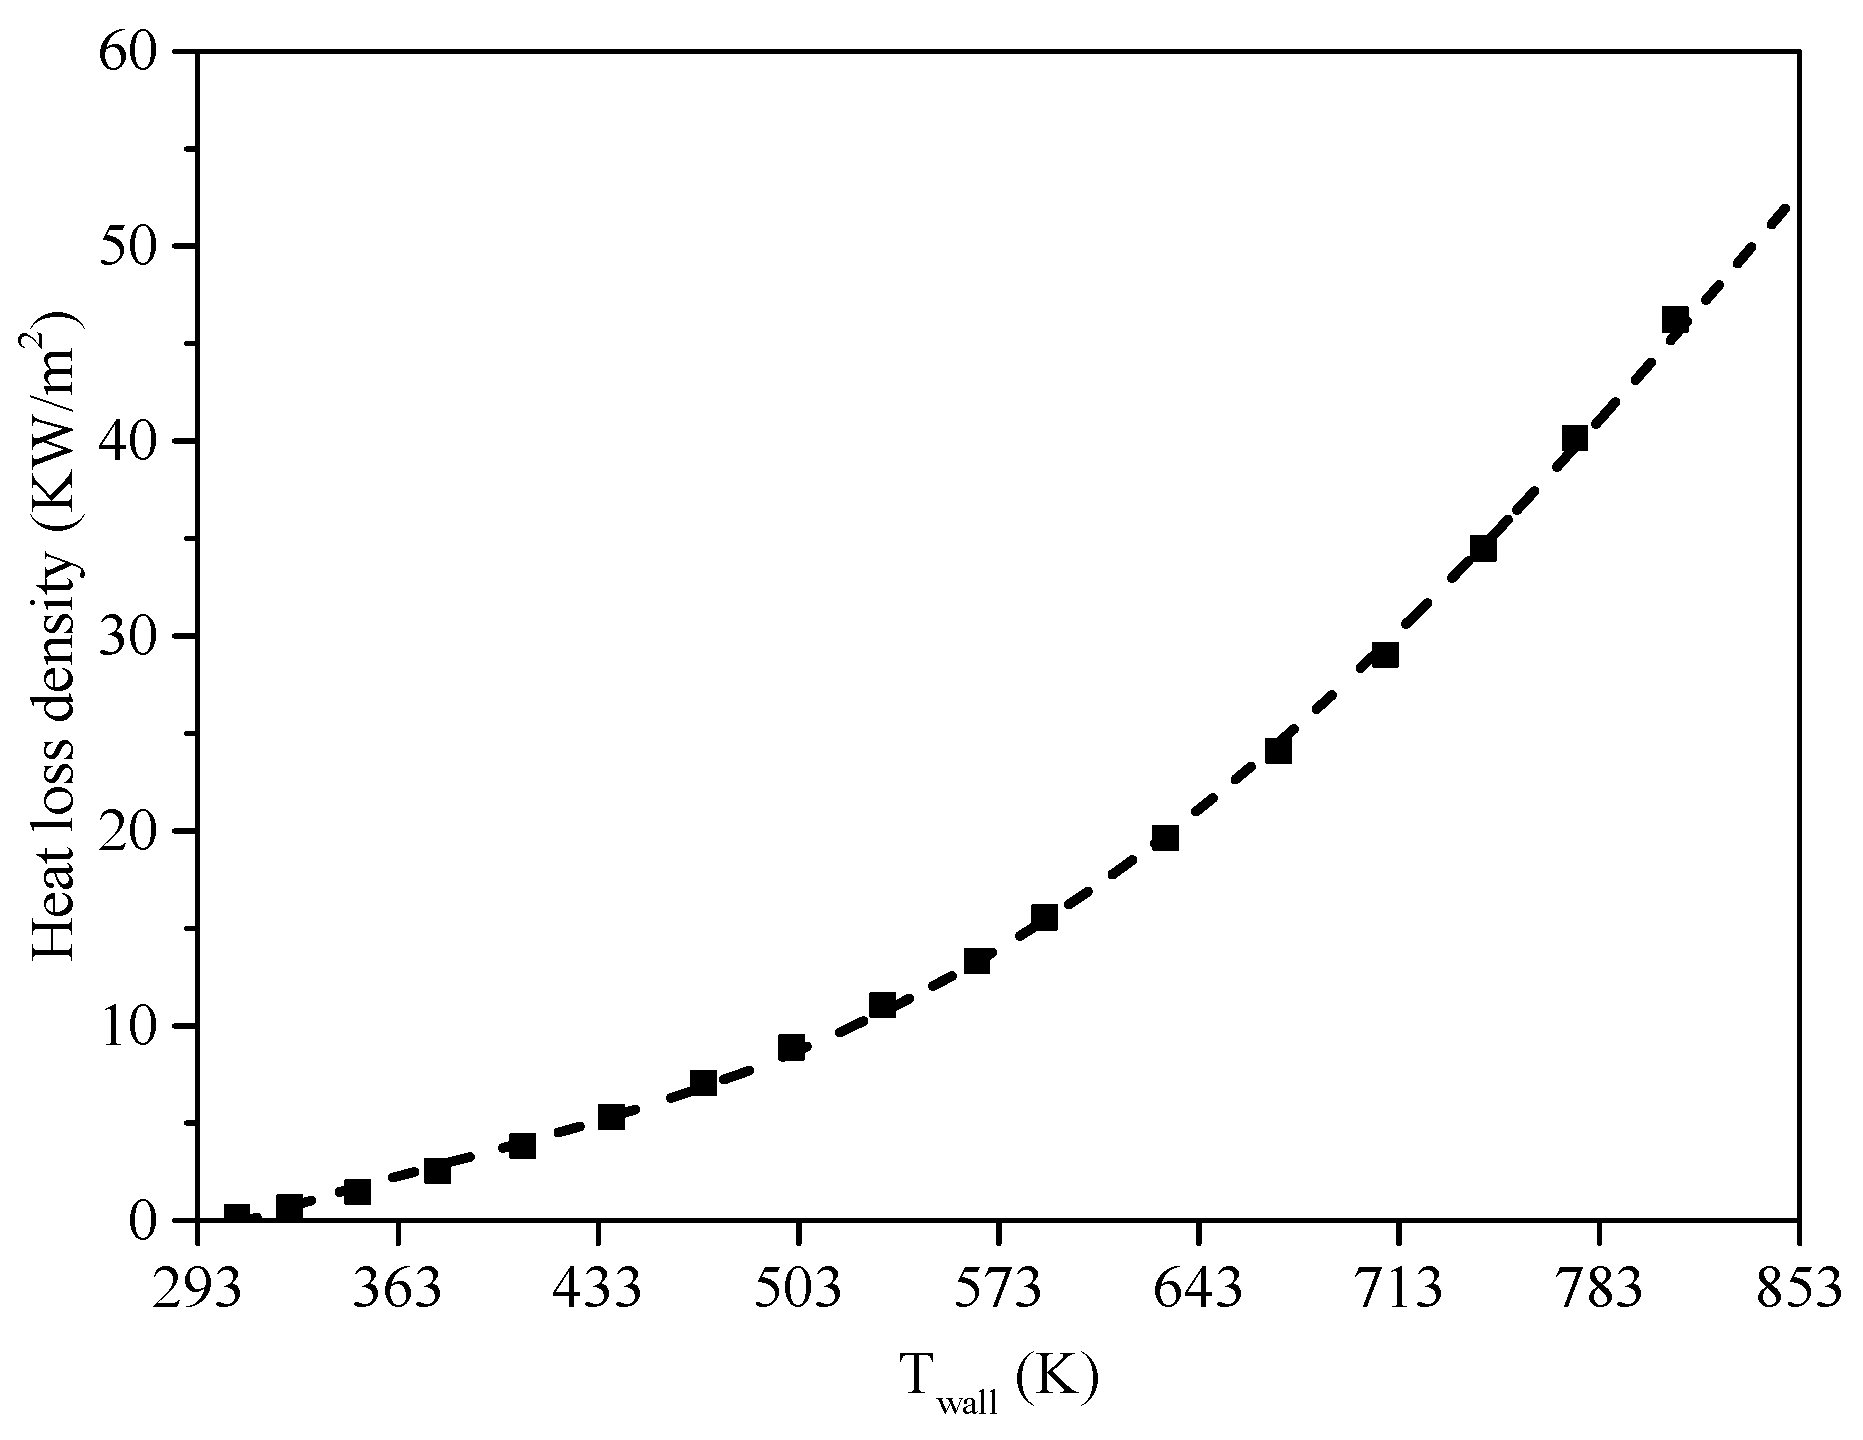
A steel circular tube with a length of 1800 mm and a cross-sectional size of 3 mm × 2 mm was used as the reactor in the experiment. The thickness of the nickel-based catalyst layer on the inner wall of the tube is 0.2 mm. Electric heating simulates external high-temperature heat flow. The mixed fuel was preheated to a supercritical state at 350 °C without any chemical reaction occurring. The heat loss density of the reactor is shown in Figure 2.
After the reaction, the fluid was cooled and pressure was reduced. The product was separated in a gas–liquid separator. The gas product was collected using an air bag and injected into GC for qualitative and quantitative analysis. The detector used FID and TCD. Residual liquid samples were collected for 1 min, and an offline analysis was performed using GC-MS.

2.3. Catalyst Preparation

The GH3128 reaction tube was passivated in an 800 °C high-temperature furnace for 5 h. The purpose of this step is to suppress the catalytic effect of Ni on the metal surface and provide a rough inner surface for subsequent catalyst coating, facilitating the firm adhesion of the catalyst coating on the inner wall of the tube. The Ni/CeO2-Al2O3 composite oxide with a Ni content of 8.0 wt% was prepared by the co-precipitation method. The pseudo boehmite was dissolved in deionized water and glacial acetic acid with the required mass ratio, and CeO2, γ-Al2O3, and Ni(NO3)2·6H2O were added with the required mass ratio to prepare the catalyst slurry. The prepared slurry was adsorbed onto the inner wall of the passivated GH3128 tube using a micro negative pressure pump, and a drying program (60–120 °C, 10 °C/h) was set in the drying furnace. During the drying process, the water/acid vapor inside the tube should be discharged and then calcined at a high temperature of 700 °C for 4 h. The final coated catalyst reaction tube is shown in Figure 3.

2.4. Uncertainty Analysis and Error Analysis

The uncertainty analysis of experiments is a key step in evaluating the accuracy and reliability of the measurement results. It involves statistical processing of experimental data and a systematic evaluation of all factors that may affect the measurement results, aiming to provide a quantitative indicator to describe the confidence interval of the measurement results. The uncertainty of the experimental results mainly comes from the instruments. The uncertainties of the mass flow meters, thermocouples, differential pressure gauges, and pressure gauges are 0.01%, 0.75%, 0.04%, and 0.05%, respectively. The measurement results of temperature and pressure have a direct impact on the calculation of the Arrhenius coefficient in the chemical reaction model. The impact of instrument uncertainty on the experimental results fluctuates weakly and is negligible. The reaction products were collected and weighed to calculate the fuel conversion rate, the mass balance before and after the reaction was verified by repeated experiments, and the equilibrium rate was greater than 96.4%.
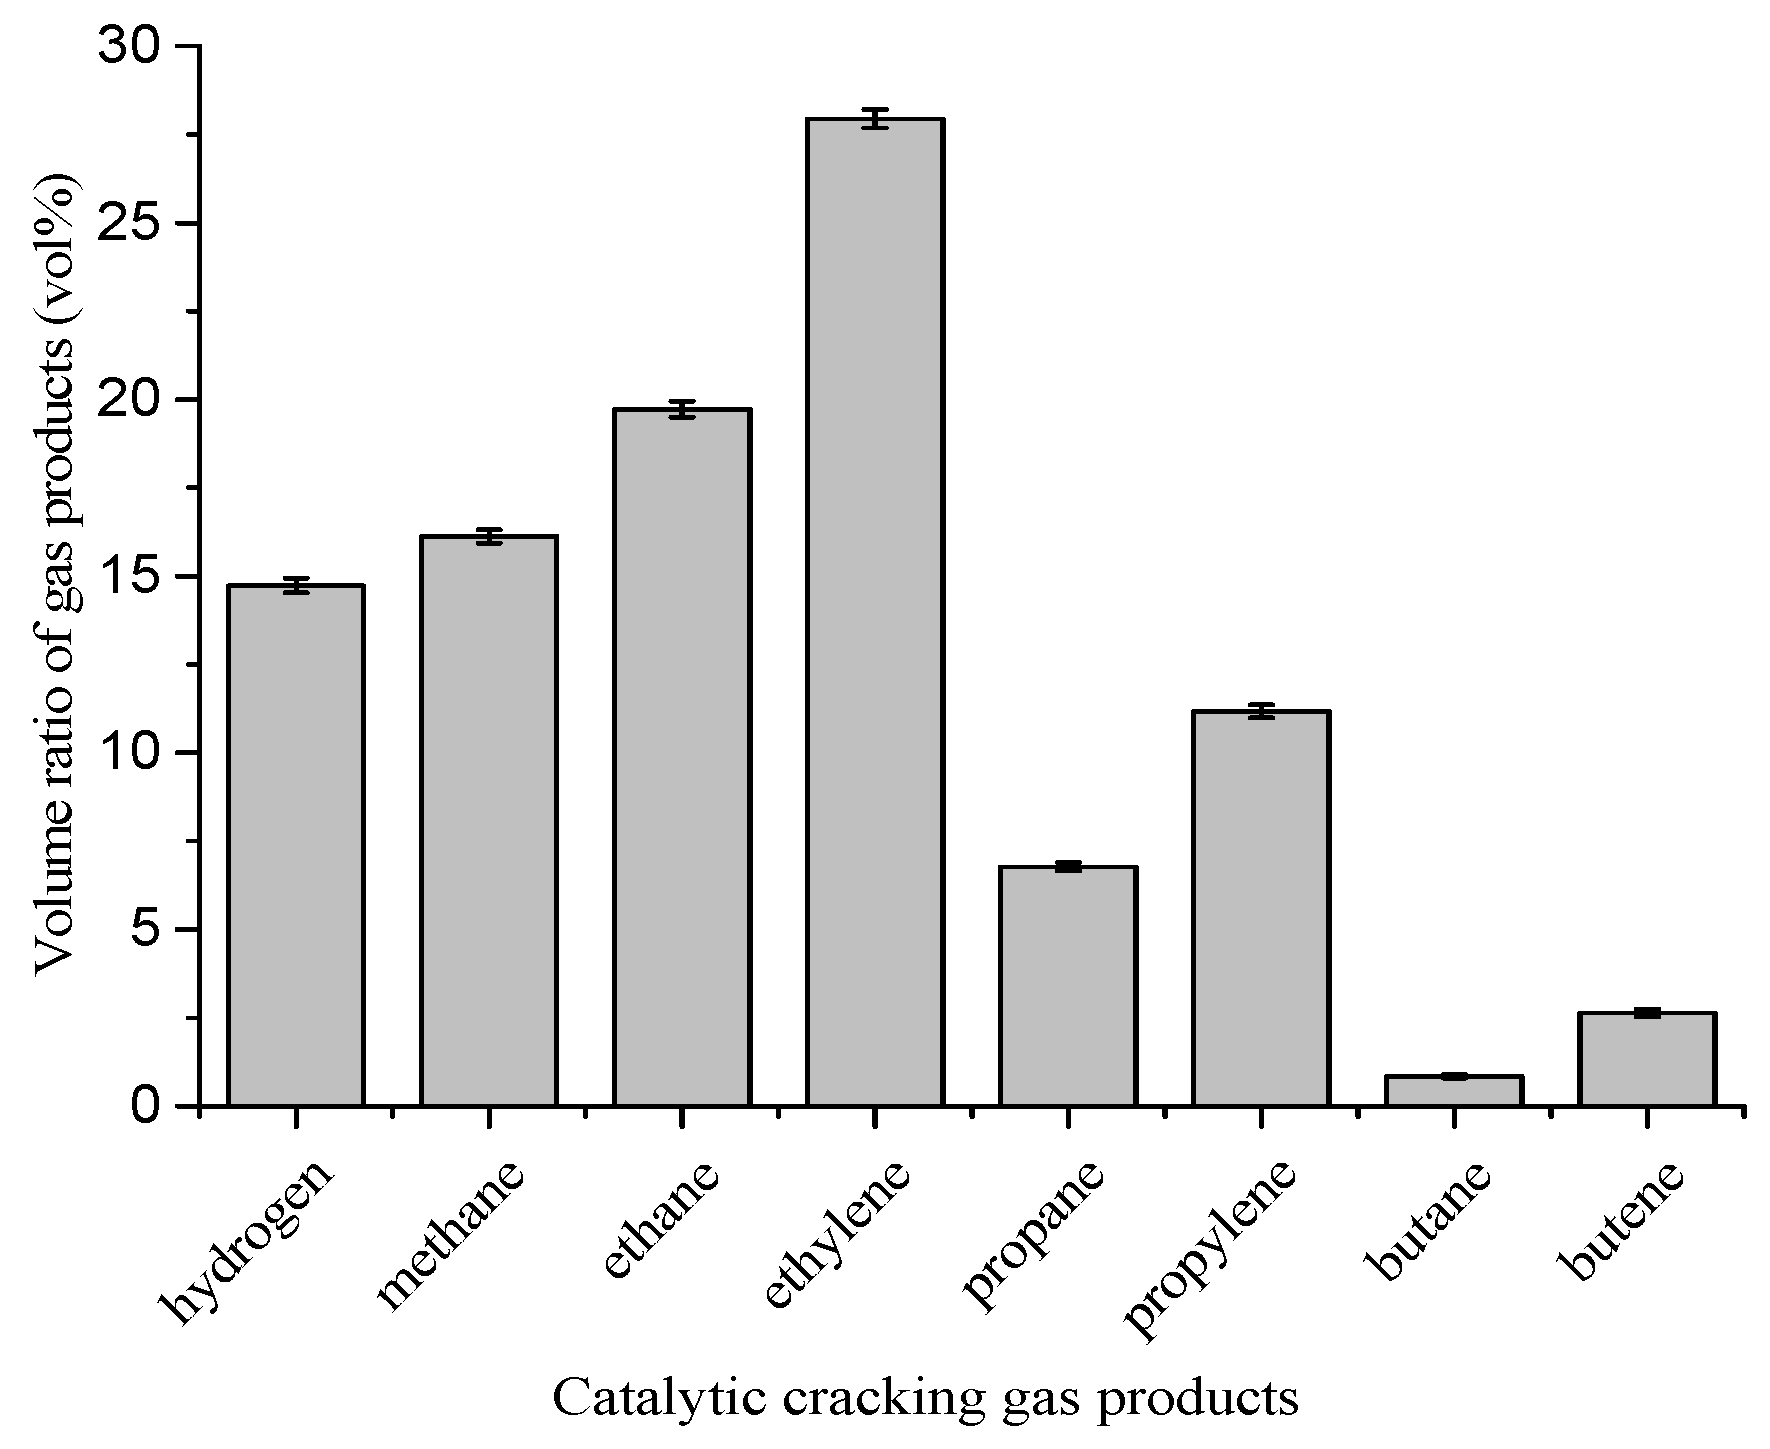
When establishing the reaction kinetic model, the content of the product components was accurately determined by gas chromatography (GC) and gas chromatography–mass spectrometry (GC-MS), which was used to deduce the stoichiometric number of the reaction model. It was measured no less than three times, and the average of the results was taken. Figure 4 shows the error bars of the gaseous product content near the CTC experimental temperature of 618 °C. The reason for the error is that the temperature is in dynamic equilibrium and fluctuates by ±5 °C. The short error bar in Figure 4 indicates that the measurement of the reaction product components involved in the establishment and verification process of this model is highly reliable, and the experimental repeatability and stability are high.

3. Numerical Model

3.1. Governing Equations

The flow conservation control equation for compressible steady-state flow in the coordinate system of a cylindrical (x, r) reaction tube is as follows:
x ( ρ u ) + r ( ρ v ) + ρ v r = 0
1 r x ( r ρ u u ) + 1 r r ( r ρ u v ) = p x + 1 r x [ r μ ( u x 2 3 ( v ) ) ] + 1 r r [ r μ ( u r + v x ) ] + ρ g
1 r x ( r ρ u v ) + 1 r r ( r ρ v v ) = p r + 1 r r [ r μ ( 2 v r 2 3 ( v ) ) ] + 1 r x [ r μ ( u r + v x ) ] 2 μ v r 2 + 2 3 μ r ( v )
x ( ρ u h ) + r ( ρ v h ) = x ( λ T x ) + r ( λ T r ) ρ v h r + λ r T r + S h
x ( ρ u Y i ) + r ( ρ v Y i ) = J i x + J i r ρ v Y i r + J i r + R i
where ( v ) = ( u / x ) + ( v / r ) + ( v / r ) . Yi is the mass fraction of species i, and Ji is the diffusion flux of species i. Ri is the net generation rate of species i in the TC reaction. Sh is the energy source term.
The convection heat transfer coefficient (h) and Nussel number (Nu) are calculated as follows:
h = q w T w T b
N u = h d λ

3.2. Real Gas Properties

The PR equation is used to calculate the thermal performance of mixed fuels, as it is widely applicable and easy to implement.
p = R T / ( V b ) a / ( V 2 + 2 b V b 2 )
where the explanation of variables can be found in ref. [23].

3.3. Computational Model and Solution Strategy

CSR and CTC reactions are surface reactions that require the catalytic action of the wall catalyst coating to occur. The research on surface reactions currently faces certain difficulties. The treatment of the catalytic surface reaction rate in this article is carried out using the method proposed by Irani et al. [24] in chemical engineering, where the diffusion and reactions of chemical substances occur in the thin layer of the catalyst, and the reactions are equivalent to bulk reactions. The processing is carried out as follows:
P w a s h c o a t = 2 π r i n h π h ( r o u t 2 r i n 2 )
V i = S i × P w a s h c o a t = m o l m 2 s × m 2 m 3 = m o l m 3 s
where Vi is the bulk reaction rate, and Si is the surface reaction rate.
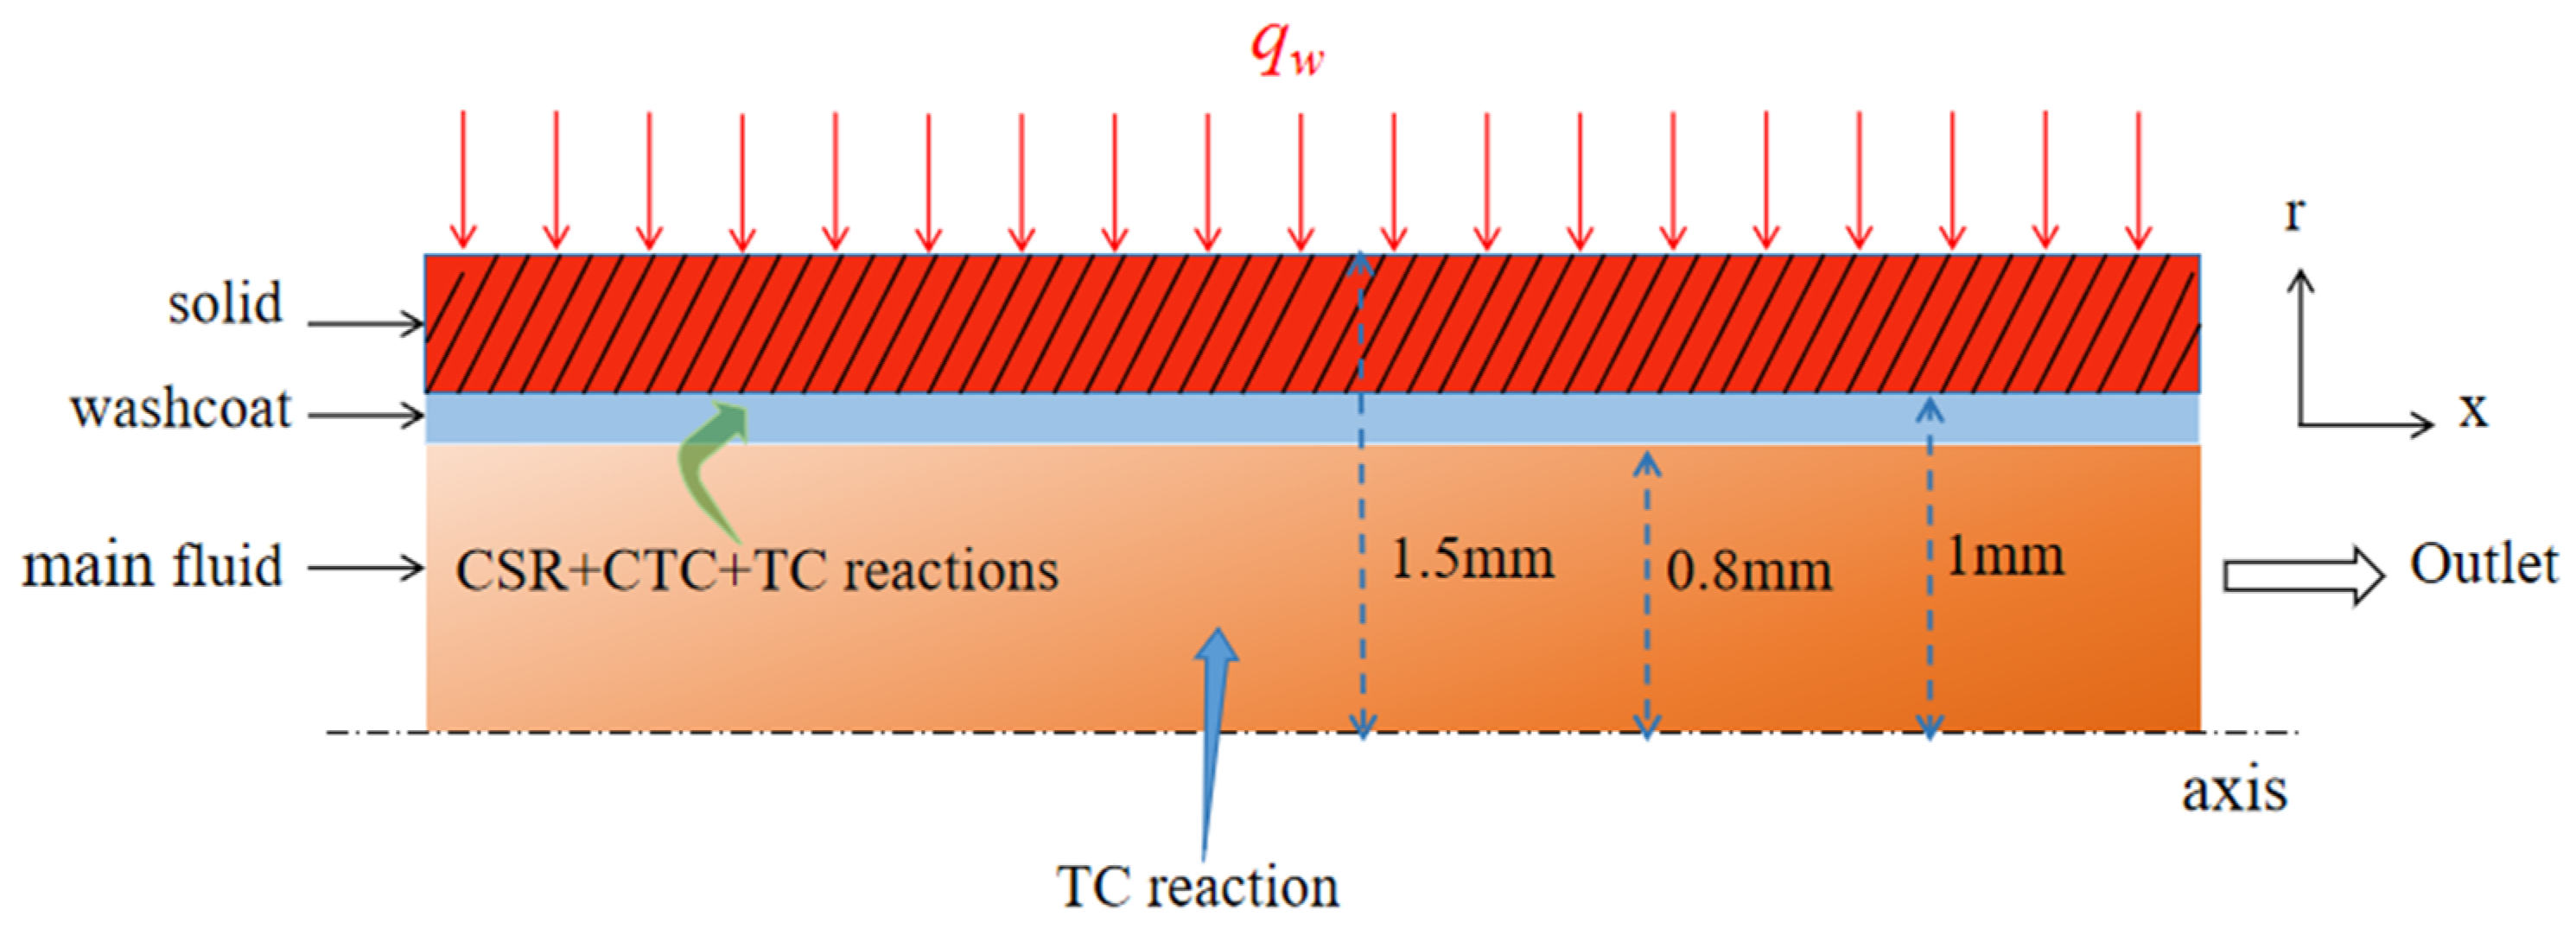
The experimental section calculation model is shown in Figure 5. CTC, TC, and CSR reactions occur within the washcoat, while TC reactions occur within the main fluid. This paper uses OpenFOAM version 4.0to numerically simulate and solve the above equation. Detailed parameter information can be found in reference [25].

4. Chemical Reaction Model

Refer to the actual operating conditions of the regenerative cooling system for ultra high-speed aircraft. This study used a flow pressure of 3 MPa, a water content of 5–15 wt%, a fuel inlet mass flow rate of 0.25 g/s, and a heating flux ranging from 190 to 630 W.
The conversion rate of raw materials and the yield of gas-phase products in this article are defined as follows:
x = 1 w l i × m l / m
y g = m g / m
The yields of gas phase product i and liquid phase product j are defined as follows:
y g j = w g j × m g / m
y l j = w l j × m l / m
The molar selectivity of product j is defined as follows:
S j = M i × y j / M j × x

4.1. Product Distribution

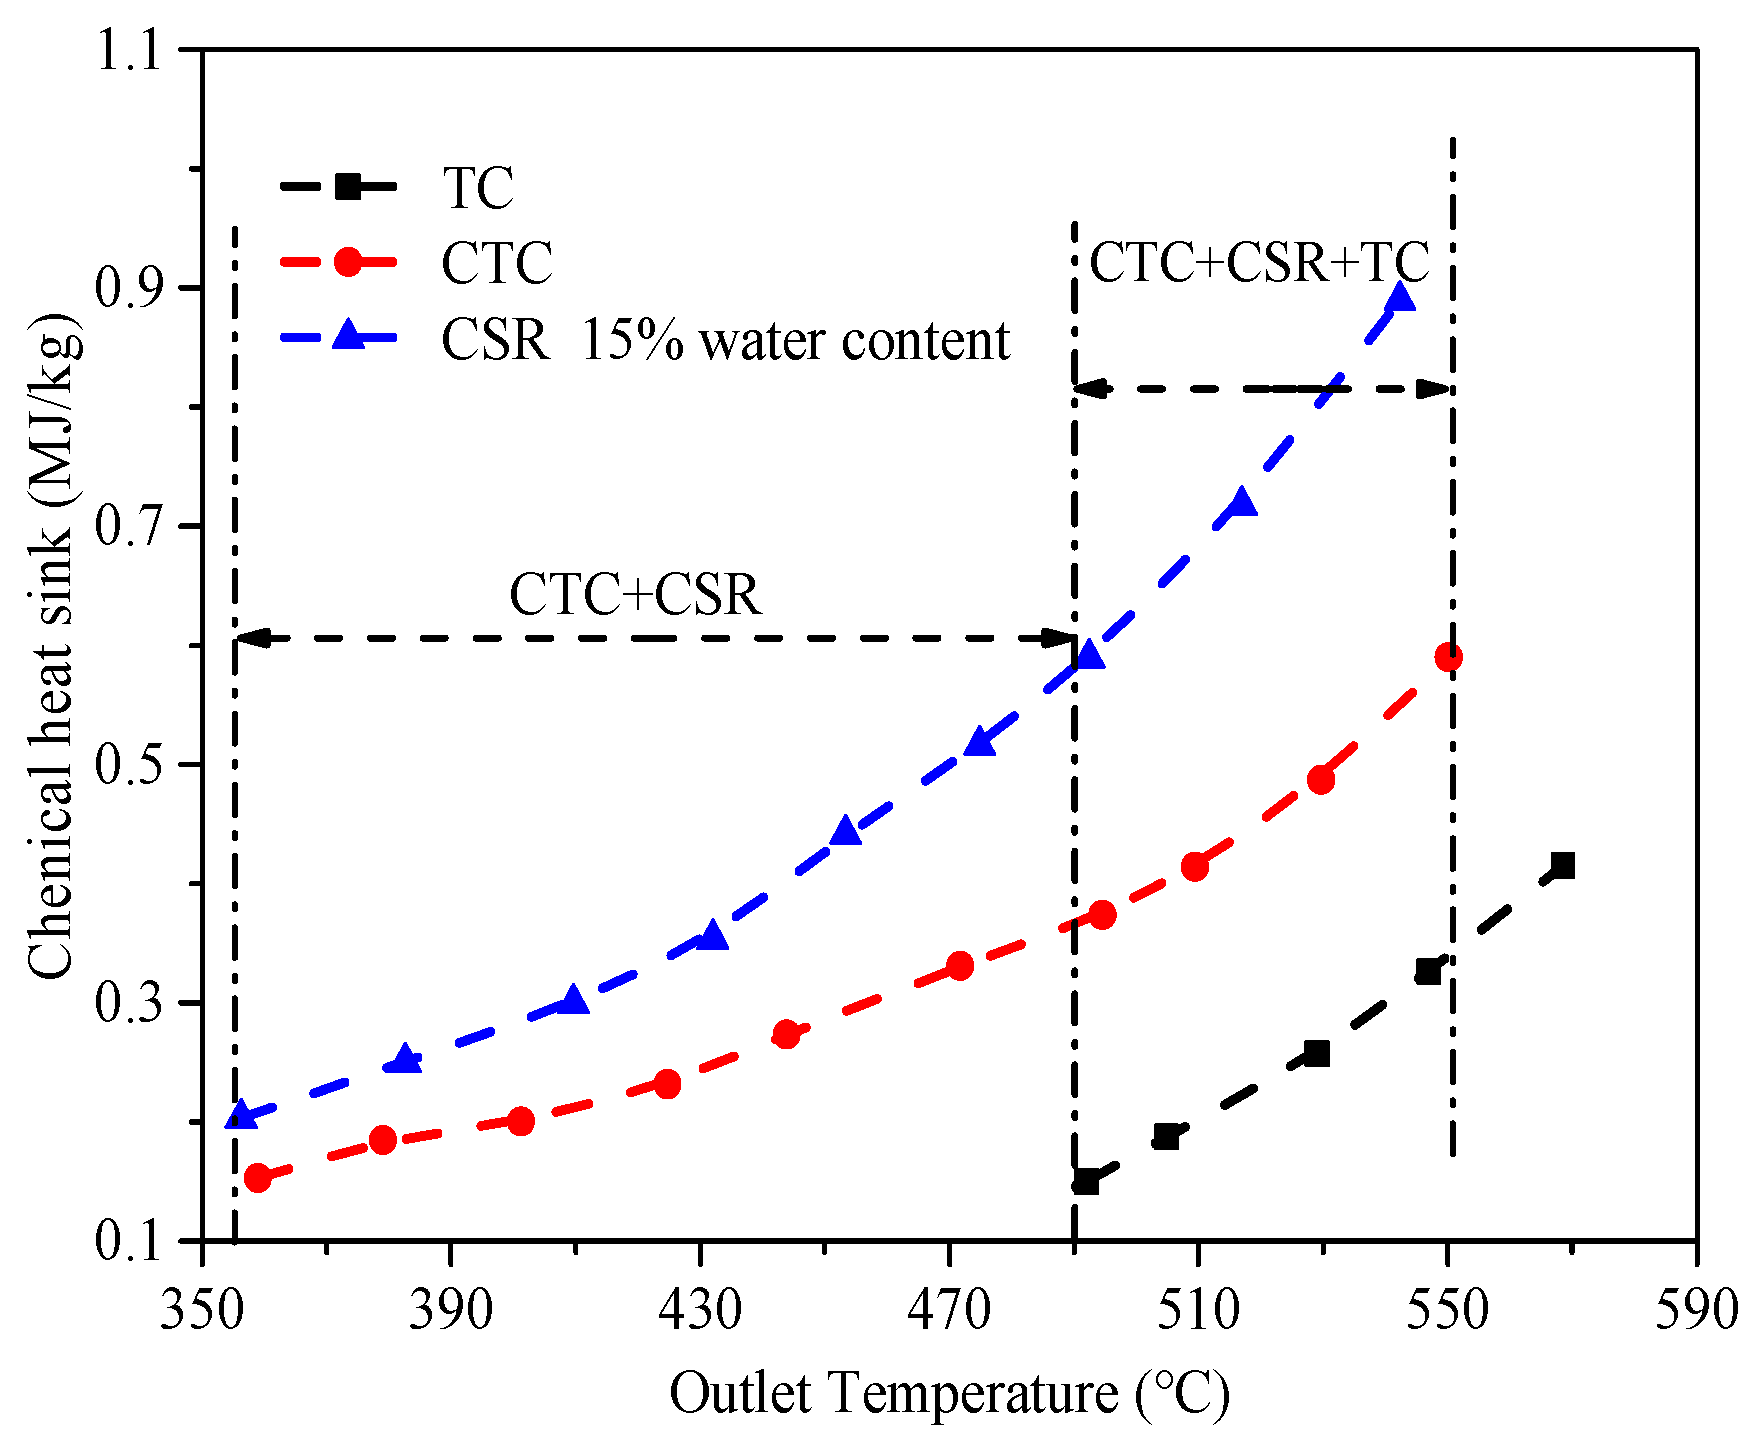
The variation in the chemical heat sink with fuel temperature under different types of chemical reactions is shown in Figure 6. The figure shows that (1) under the action of the catalyst, 360 °C is the initial temperature for the reaction between CSR and CTC; (2) 490 °C is the initial temperature for the TC reaction [11,26]; and (3) the chemical heat sink of CSR is significantly higher than that of TC and CTC. The generation of a large amount of H2 in the CSR reaction is beneficial to improve fuel heat absorption. The products of the CTC reaction contain larger molecules of olefins and alkanes, which can become a limiting factor in improving the fuel chemical heat sink. The product distribution is shown in Figure 7 and Figure 8.
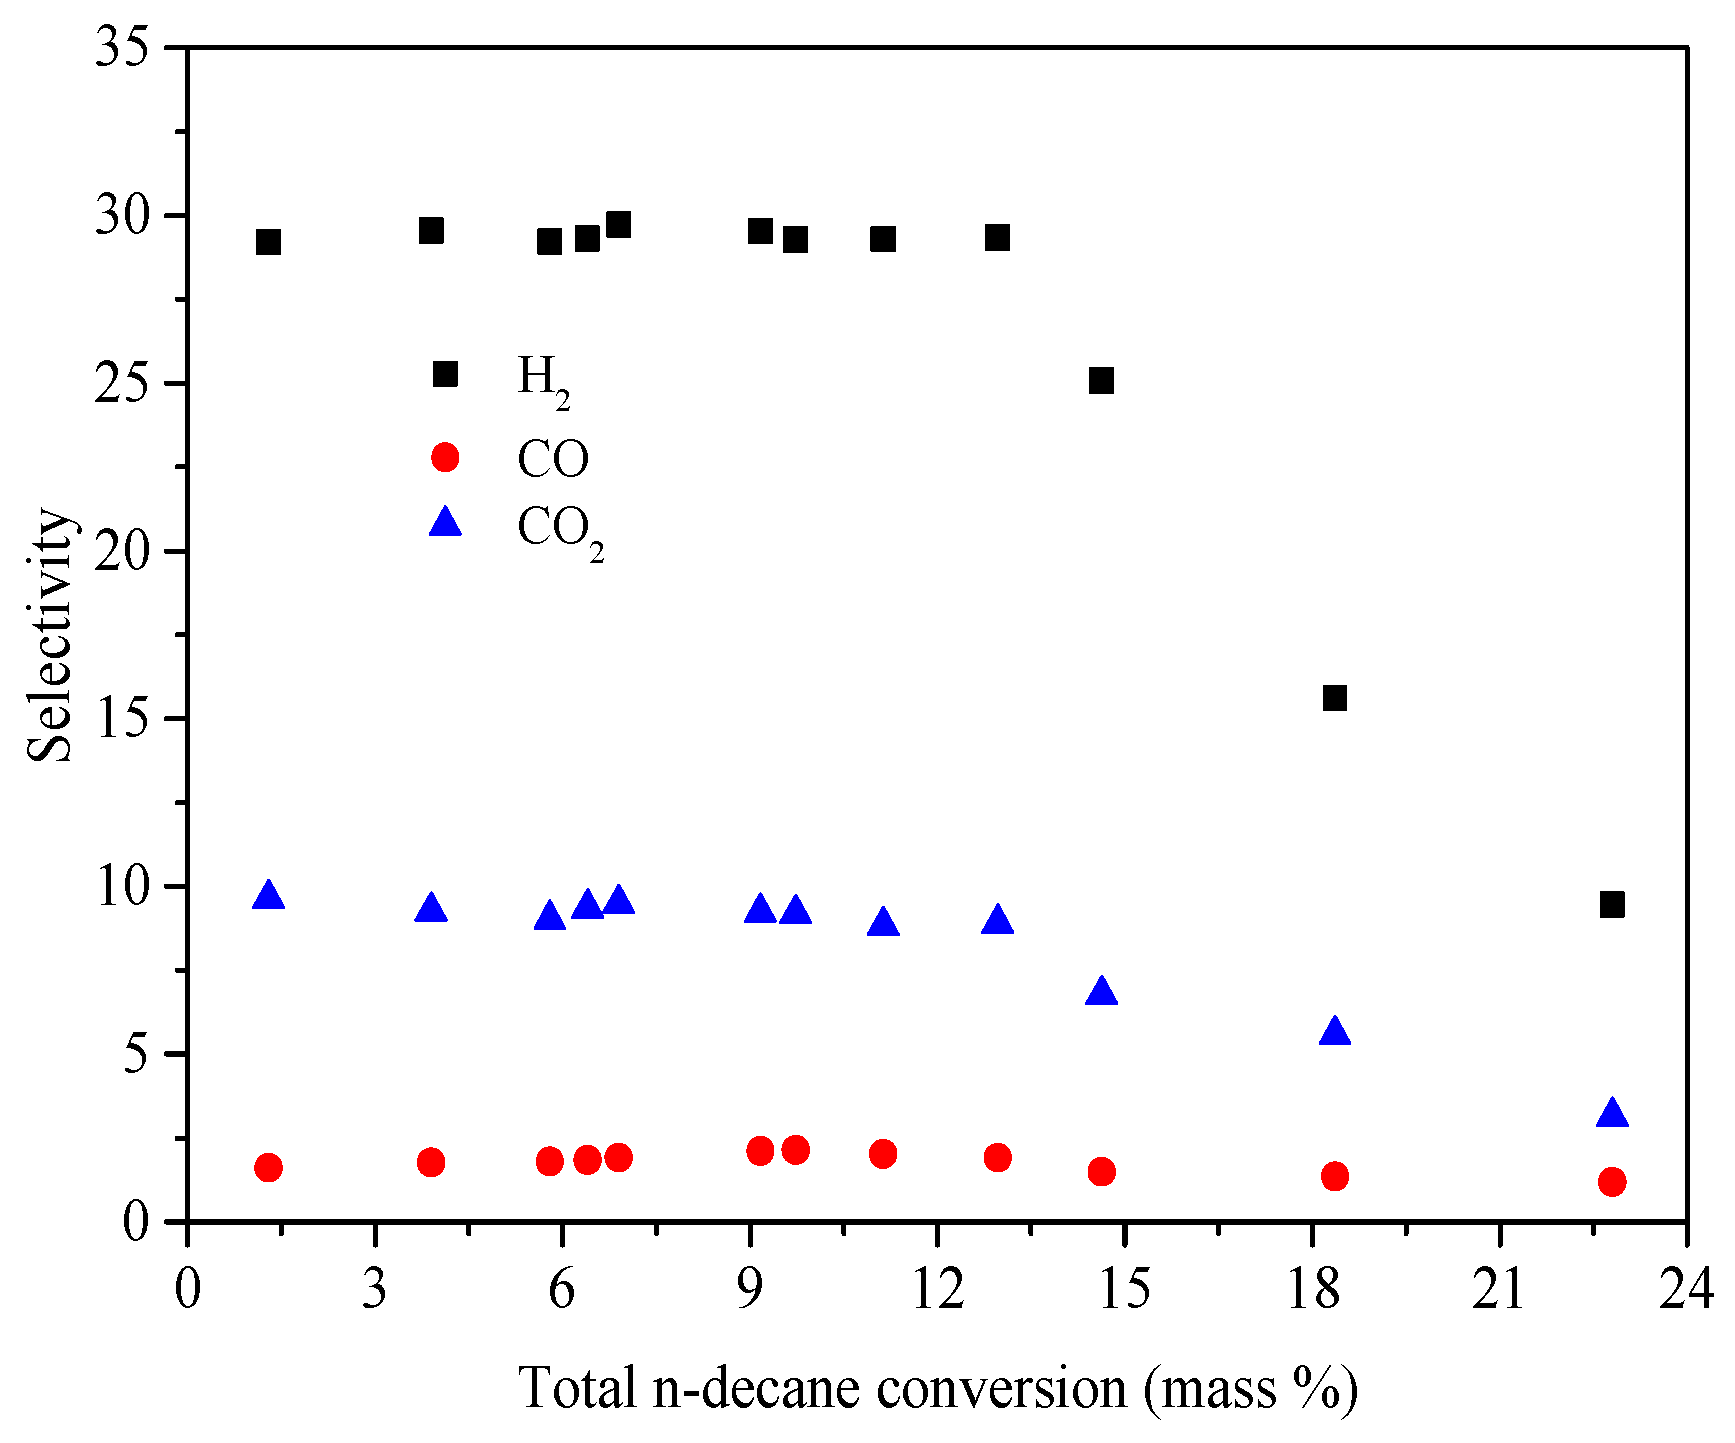
The panel in Figure 7 shows the molar selectivity of products as a function of n-decane conversion. The water content in the fuel is 15%, and the conversion rate of n-decane is less than 13%. The reaction products measured in the experiment were only H2, CO, and CO2, and no representative hydrocarbon products of the cracking reaction were detected. Representative products of steam reforming include H2, CO, and CO2. The distribution of products indicates that in the low conversion rate range, only the CSR reaction exists in the cooling channel, and the selectivity of products is close to linear. When the conversion rate is greater than 13%, the selectivity of each product decreases. This is because n-decane begins the TC reaction to produce hydrocarbons, reducing the contents of H2, CO, and CO2 in the figure. With the intensification of the TC reaction, this downward trend becomes more obvious. Therefore, the establishment of the CSR response model needs to be carried out in the low conversion rate range. The conversion rate of n-decane is less than 13%, and the product distribution is combined with the consumption of n-decane and water to establish a global CSR reaction model. Reaction Equation (R1) is
C10H22 + 18.3H2O = 29.3H2 + 1.7CO + 8.3CO2
As shown in Figure 8, when the mixed fuel does not include added water and the conversion rate of n-decane is less than 15%, H2 is the main gas product, while olefins are the main liquid product. The main difference between the reaction products of CTC and TC is that the reaction product H2 of TC is much less than that of CTC. The distribution of product indicates that in the low conversion range, only the CTC reaction exists in the cooling channel, and the selectivity of the product is close to linear. When the conversion rate is high (15% or higher), the TC reaction is activated, resulting in the formation of more C1–C3 hydrocarbon gasses and 1-CnH2n (n = 5–9) liquid olefins, as well as small amounts of H2, C4H8, C4H10, and liquid alkanes. The distribution of TC products of n-decane can be found in reference [27]. The proportion of thermal cracking reaction in the entire reaction system gradually increases with the increase in the conversion rate. The selectivity law of products changes with low conversion rates. At higher n-decane conversion rates, the selectivity of H2 significantly decreases, and the selectivity of C1–C3 small-molecule hydrocarbon gasses and C5H10, C6H12, C7H14, and C8H16 liquid olefins significantly increases. The other products, C4H8, C4H10, and C5–C9 liquid alkanes, remain almost constant. By combining the product distribution with the consumption of n-decane, a global reaction model for CTC with an n-decane conversion rate of less than 15% can be derived. Reaction Equation (R2) is
C10H22 = 4.623H2 + 0.2CH4 + 0.06C2H4 + 0.1C2H6 + 0.03C3H6 + 0.03C3H8 + 0.007C4H10 + 0.008C4H8 +
0.122C5H12 + 0.211C5H10 + 0.077C6H14 + 0.318C6H12 + 0.072C7H16 + 0.274C7H14 + 0.0136C8H18 + 0.232C8H16 +
0.0042C9H20 + 0.0858C9H18
The TC experimental conditions in this article are similar to those of Jiang [27], and the model involves mechanisms of 18 species. The TC reaction model is
C10H22 = 0.017H2 + 0.184CH4 + 0.198C2H4 + 0.1327C2H6 + 0.0566C3H6 + 0.0372C3H8 + 0.0135C4H8 +
0.0048C4H10 + 0.2015C5H10 + 0.1167C5H12 + 0.3033C6H12 + 0.0735C6H14 + 0.2611C7H14 + 0.0684C7H16 +
0.2209C8H16 + 0.0130C8H18 + 0.0817C9H18 + 0.0040C9H20
Liquid alkanes and olefins in the products, which contribute less to heat absorption and have similar transport and thermodynamic properties, are combined and replaced with other components to obtain a simplified mechanism suitable for engineering calculations. In the numerical simulation process of supercritical heat transfer, reducing one mixture component can reduce the conservation equation of the corresponding component, reduce the calculation time, and improve the calculation efficiency. For example, C5H10 and C9H20 are used to replace the residual liquid-phase olefins and alkanes from TC, respectively. The average product C7H8 is used to represent the liquid-phase vapor remaining from CTC. A methane steam reforming reaction usually occurs during the steam reforming process of high-carbon hydrocarbons [28]. This study considers the methane steam reforming reaction as a side reaction in the PCSR model.
CH4 + H2O = CO + 3H2
The temperature span during the regeneration cooling process is large, and the reforming and cracking reactions that occur throughout the entire cooling process are collectively referred to as PCSR reactions. The PCSR model is a coupling model of the CSR, CTC, and TC models, and there is mutual inhibition or promotion among these models.
The idea of establishing a PCSR reaction model is shown in Figure 9. The CSR model, CTC model, and TC model proposed in this paper are individuals in the population, while the PCSR model is a population. Based on this, this paper adopts a modeling method based on Chemkin and uses the PSO method to iteratively calculate dynamic parameters. Taking the experimental results (the outlet temperature, conversion rate, and distribution of main products) as the optimization objective, the pre-exponential factors of reaction Equations (R1)–(R4) were adjusted with small changes in the activation energy, and repeated iterations were carried out to obtain the reaction model with the best match with the experimental results. Table 1 presents the optimization results of activation energy and pre-exponential factors.

4.2. PSO Algorithm Optimization Model

The Particle Swarm Optimization (PSO) algorithm has a fast convergence speed and does not require much memory on the computer. The experimental temperature range in this article is relatively broad. In the process of searching for the optimal solution of a chemical model, its leap forward makes it easier to find the global optimal value without being trapped in local optimal solutions. The formula is as follows:
v i k + 1 = w v i k + c 1 r 1 ( x i b k x i k ) + c 2 r 2 ( x g b k x i k )
x i k + 1 = x i k + v i k + 1
The explanation of variables can be found in ref. [29].

4.3. Validation of PSCR Reaction Models

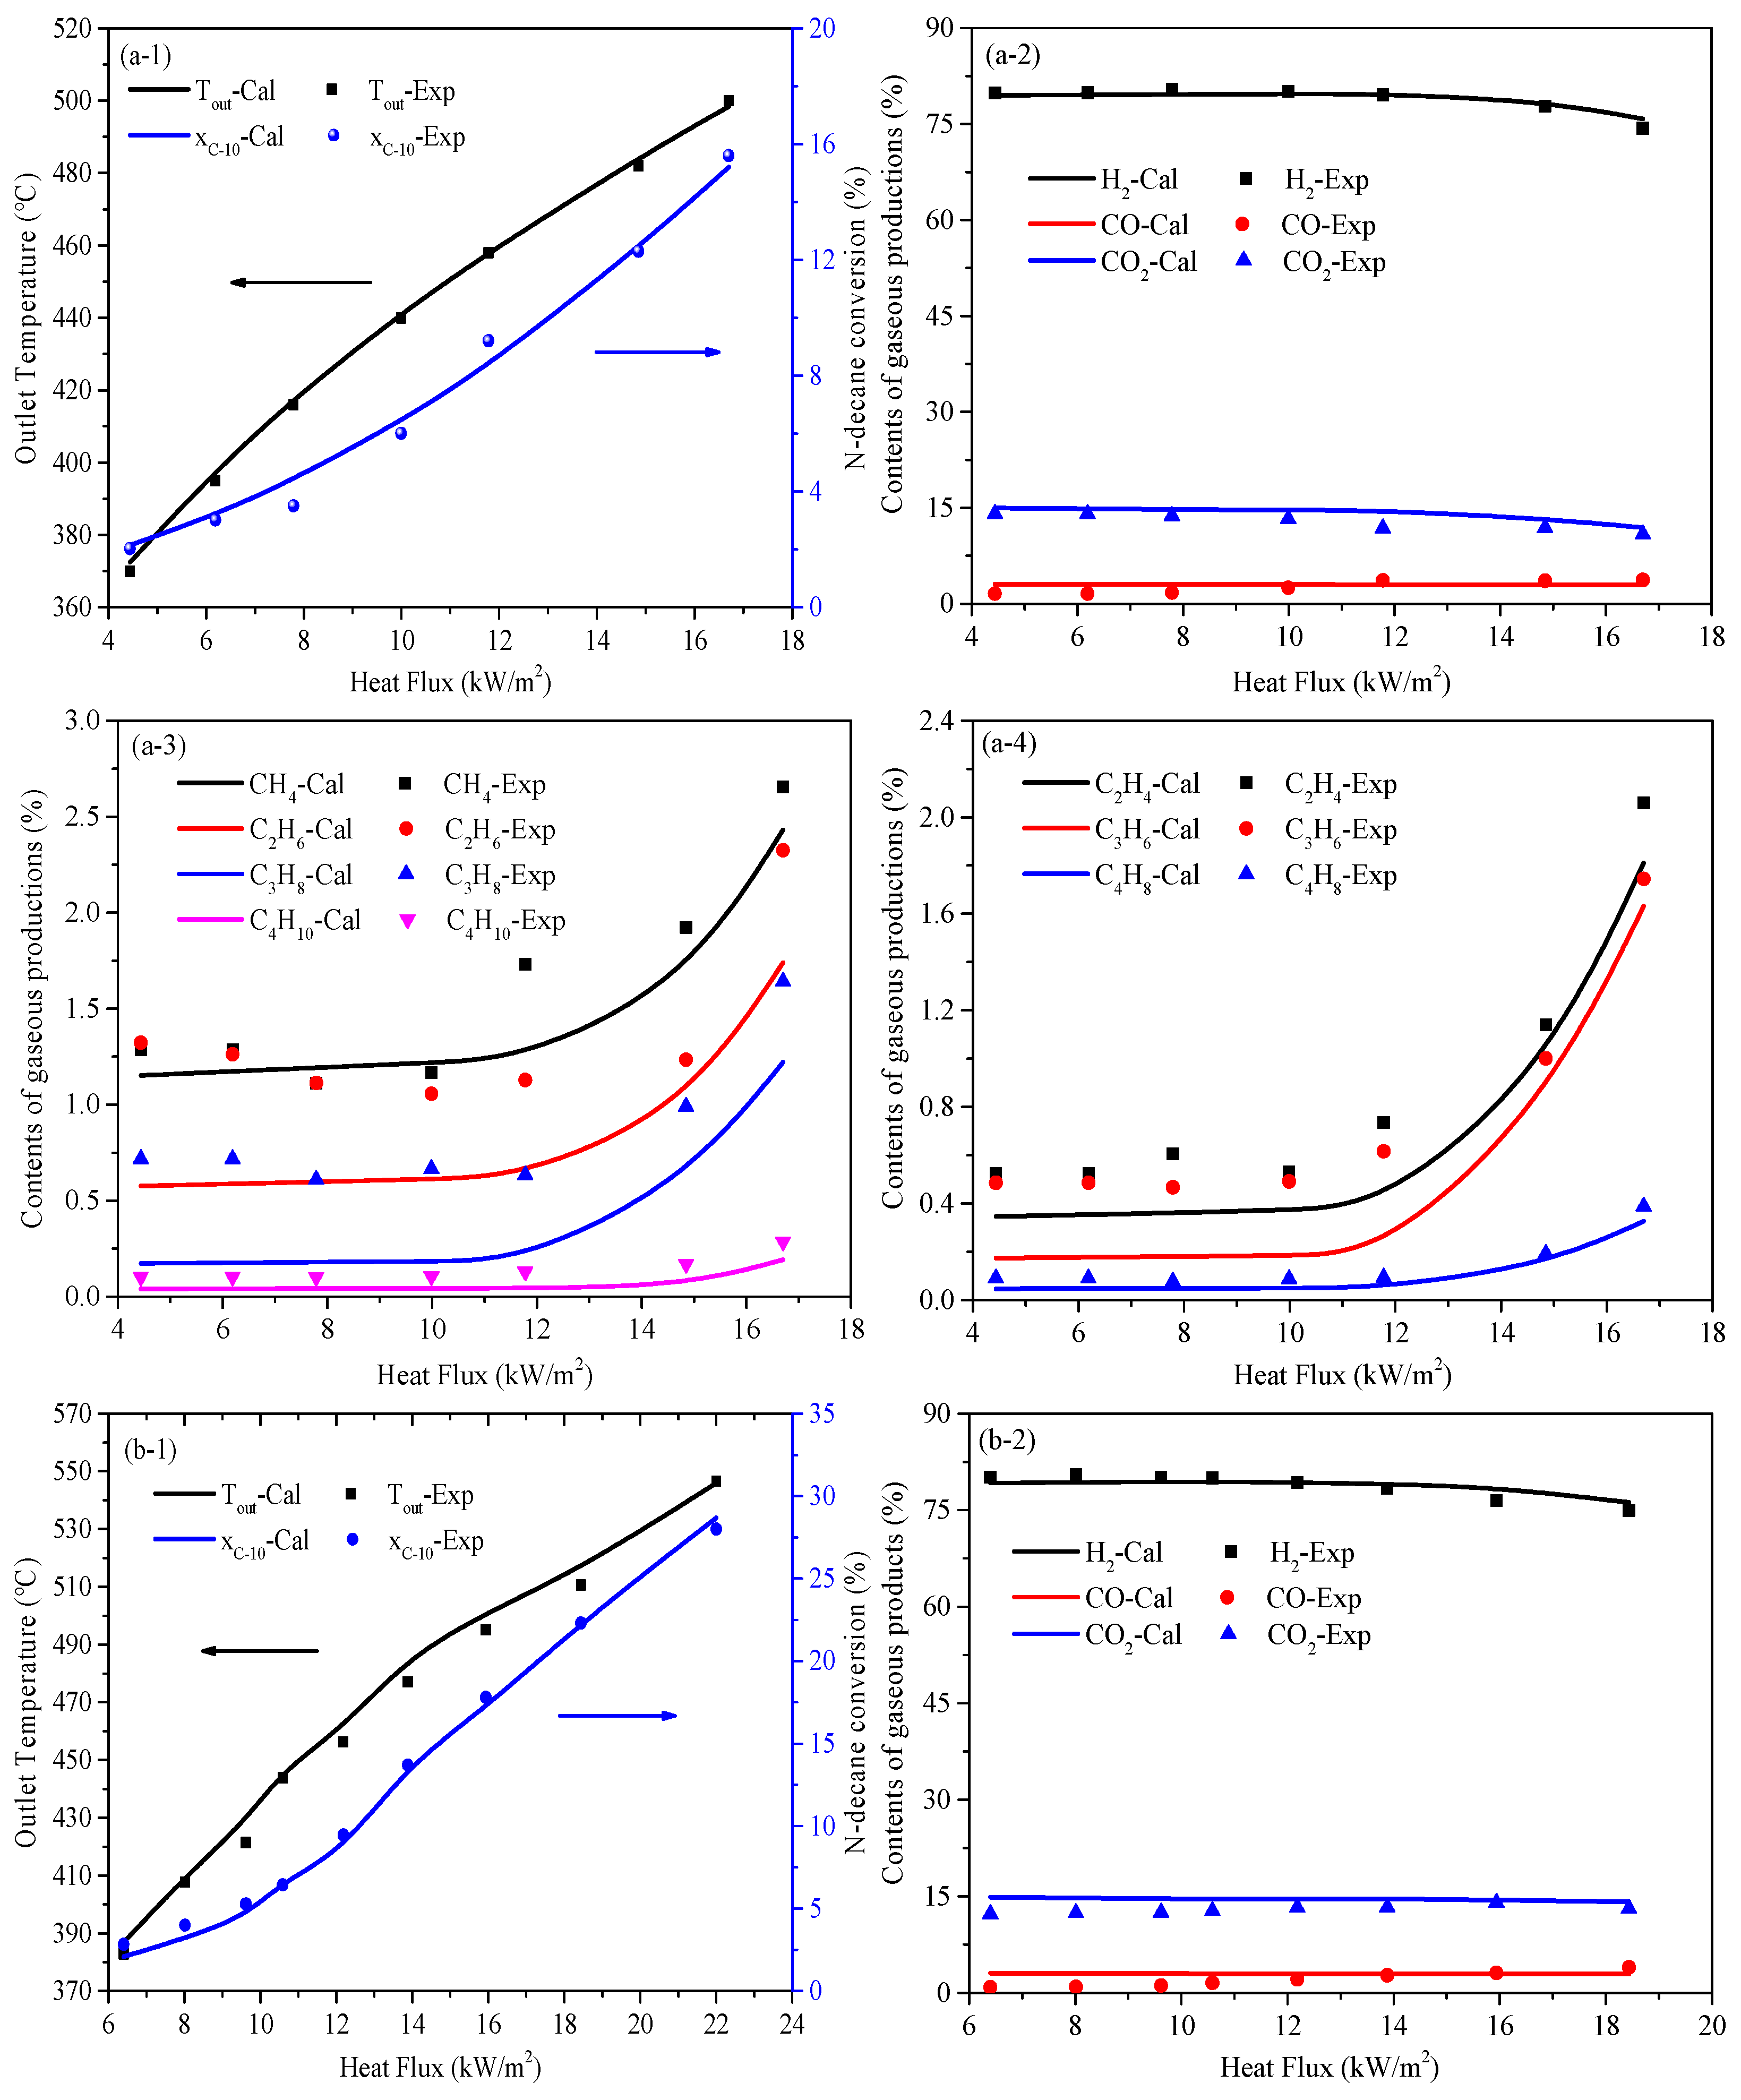
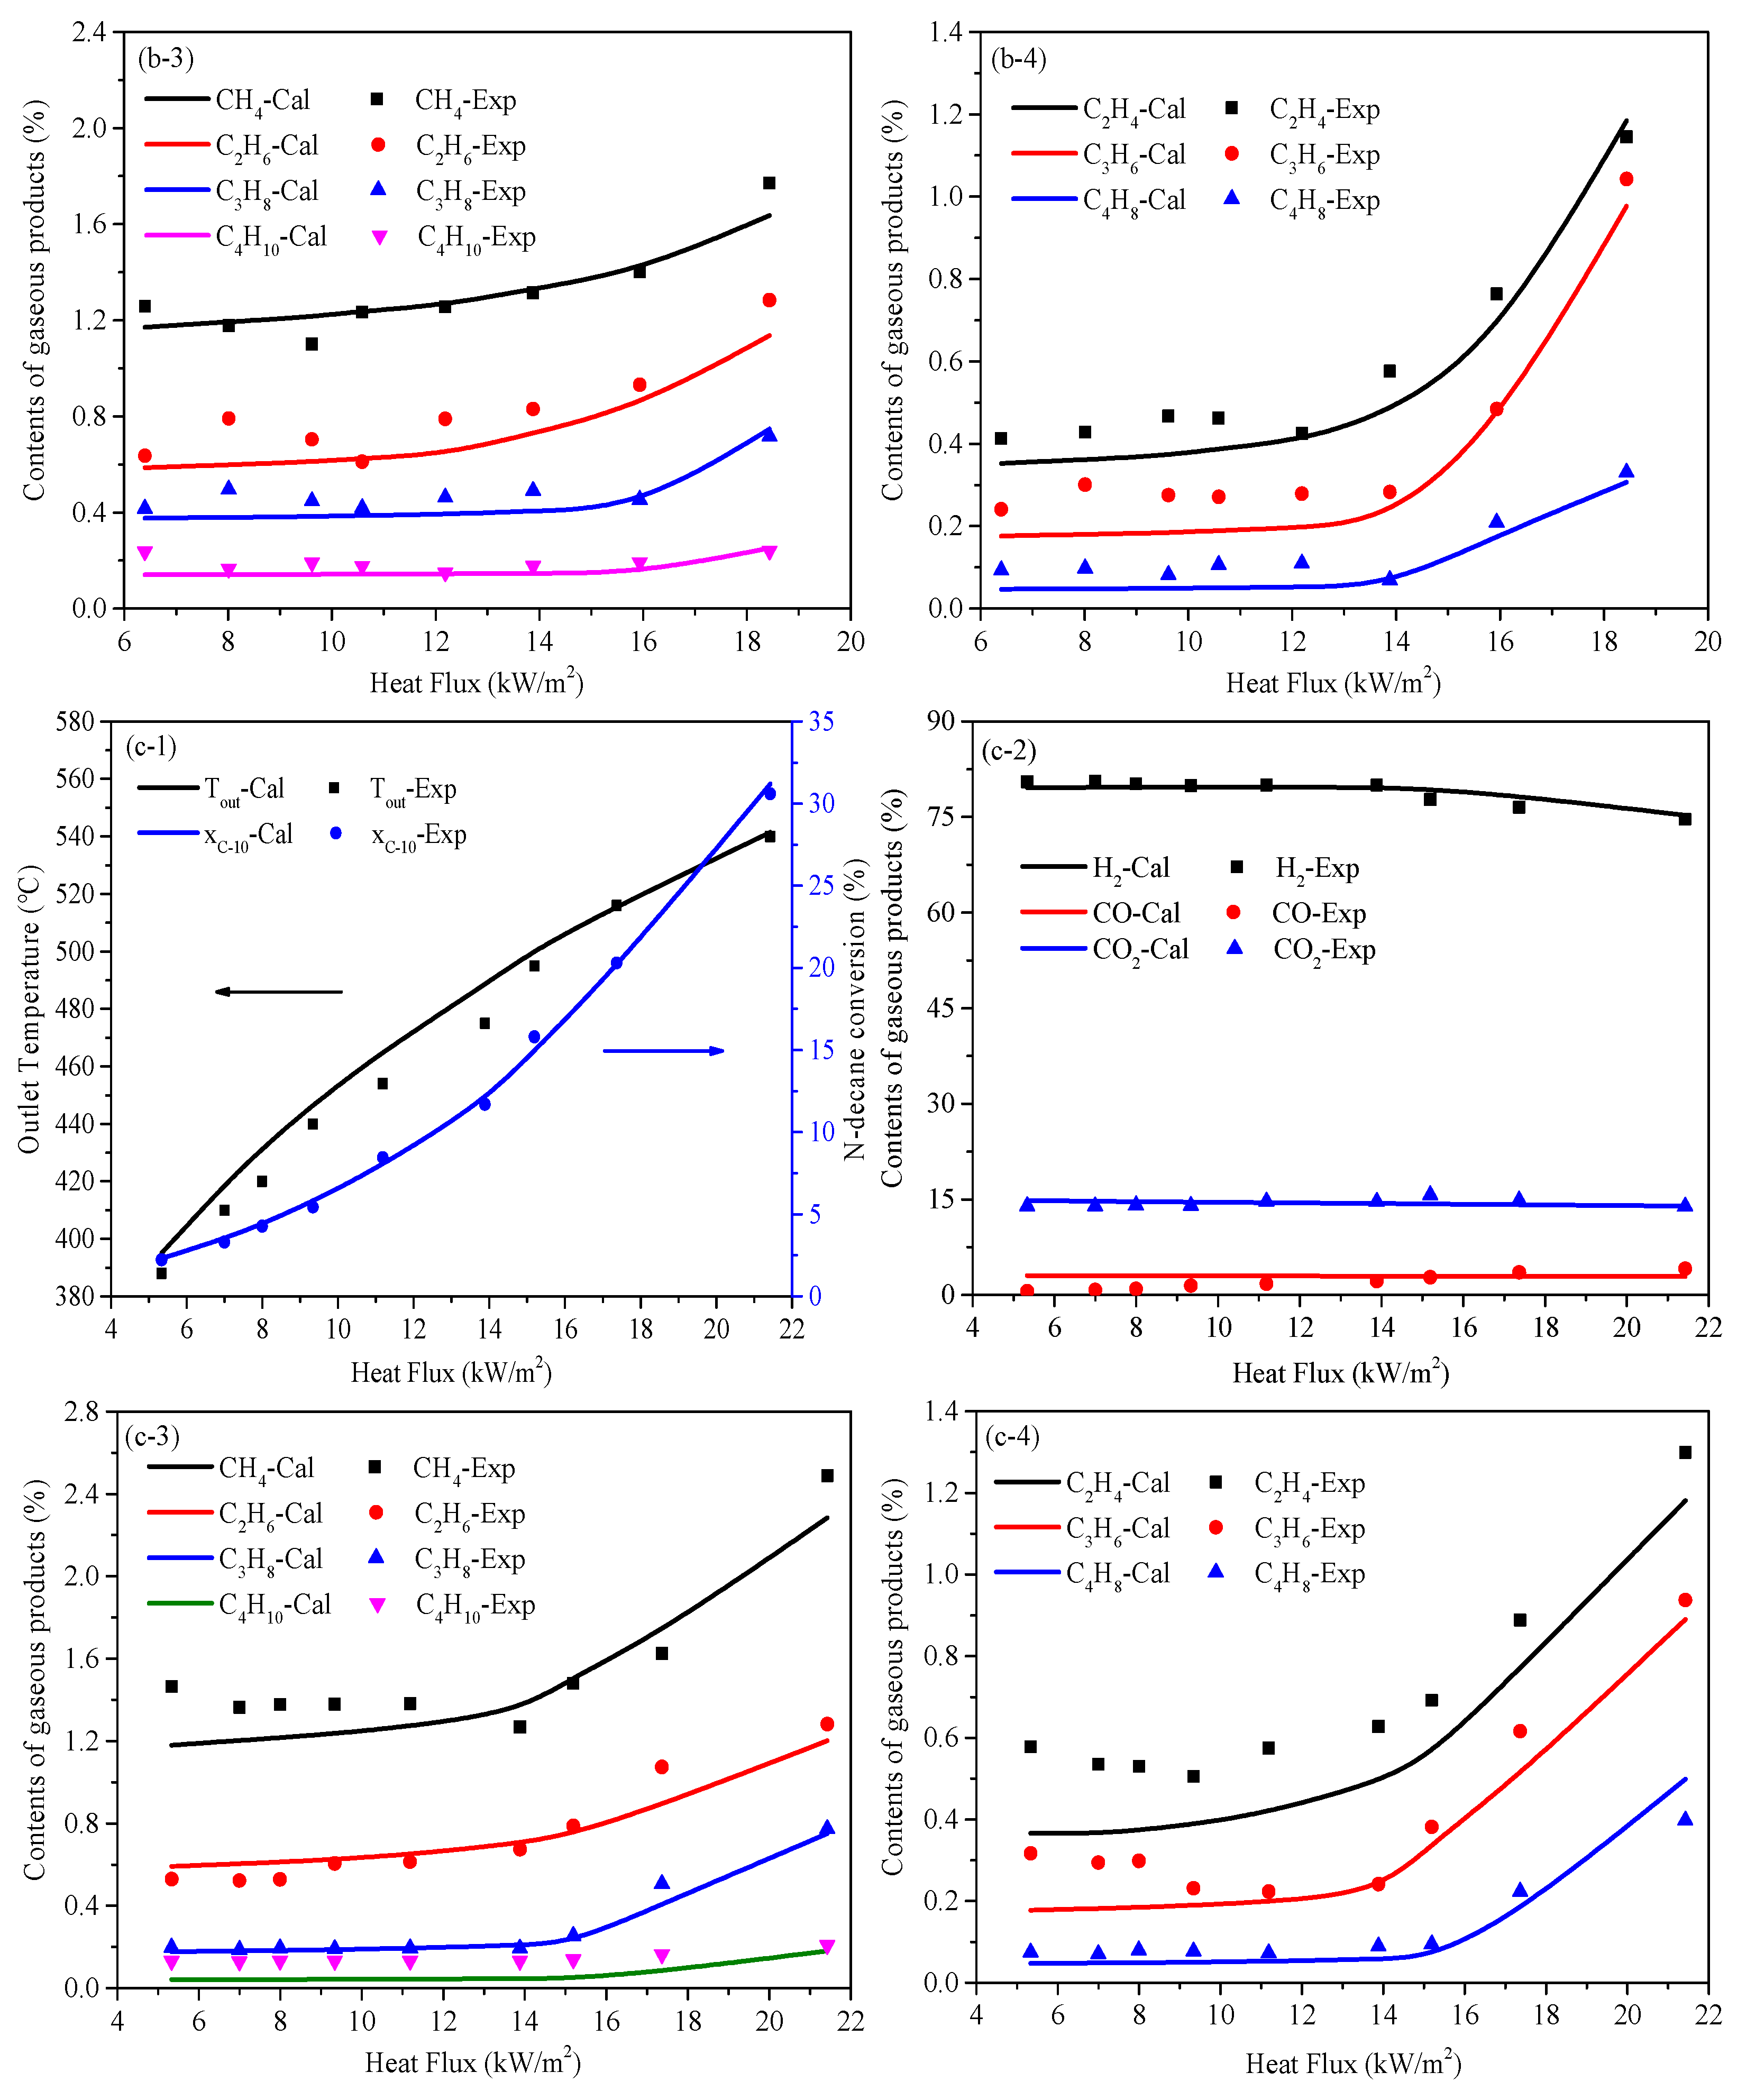
To validate the established four-step global reaction model for n-decane CSR, the heating reaction of n-decane was designed under different water content conditions. Figure 10 compares the experimental results of the n-decane conversion rate, mixture outlet temperature, and gas product volume content with the simulated values. The results indicate a high degree of agreement between the simulation results and the experimental results. For example, the relative error between the simulated outlet temperature, conversion rate, and the content of the main gasses H2, CO, and CO2 and the experimental results is less than 10%. C1–C4 small-molecule hydrocarbons were also well predicted with only slight deviations, which may be due to the higher temperature of the tube than the fluid during the experiment, triggering the TC reaction in advance. The TC reaction will generate a large amount of C1–C4 hydrocarbon gasses, resulting in a generally slightly higher content of small-molecule hydrocarbon gasses measured in experiments compared to the simulation results. Overall, the reaction model developed in this article has high accuracy in describing the PCSR of n-decane.

5. Results and Discussion

5.1. Temperature and Conversion of N-Decane Along Tube

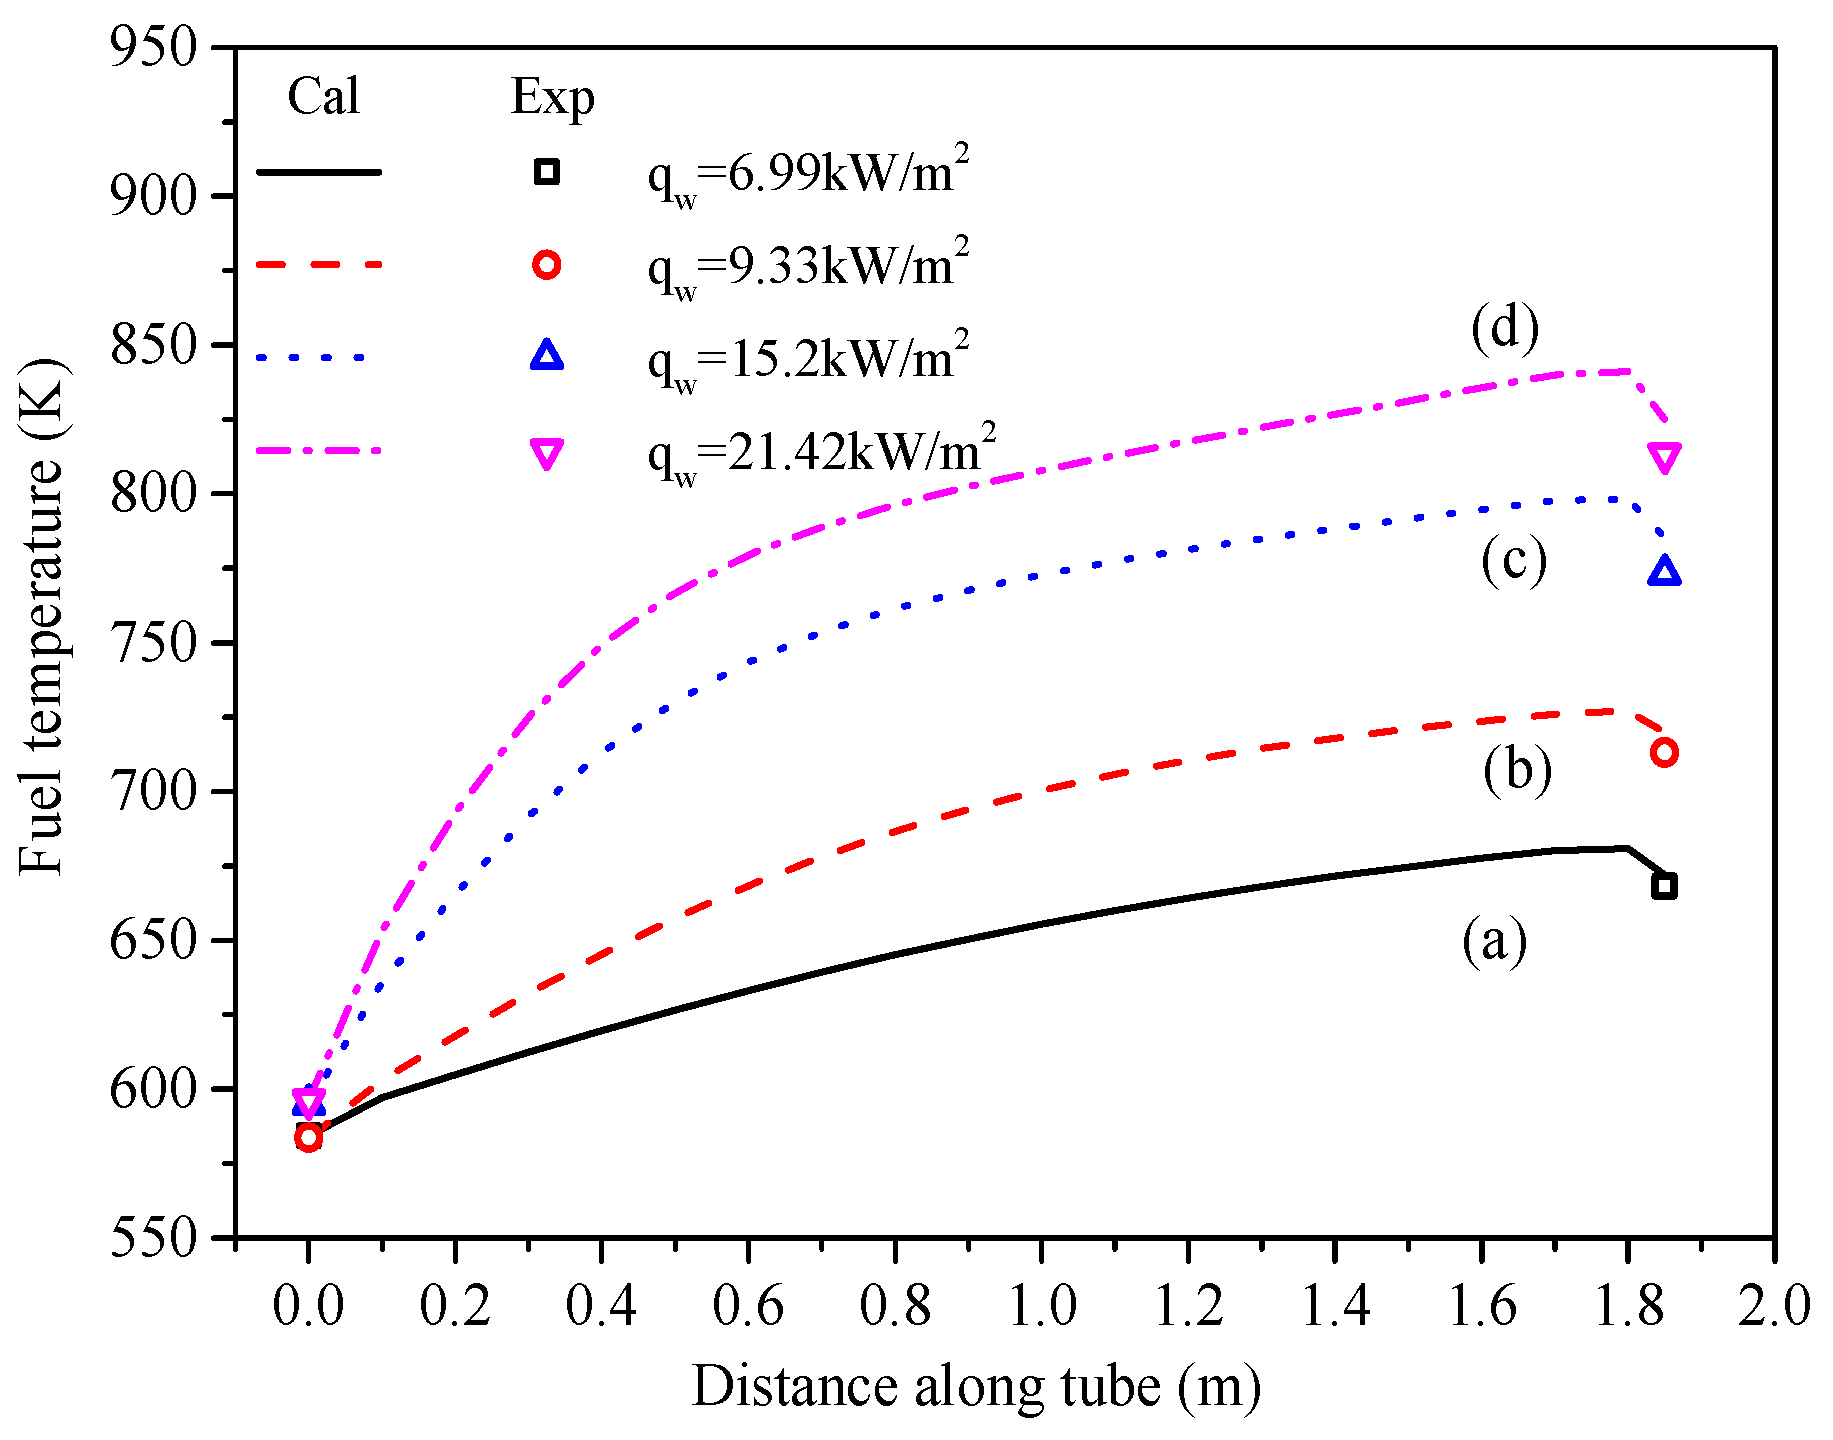
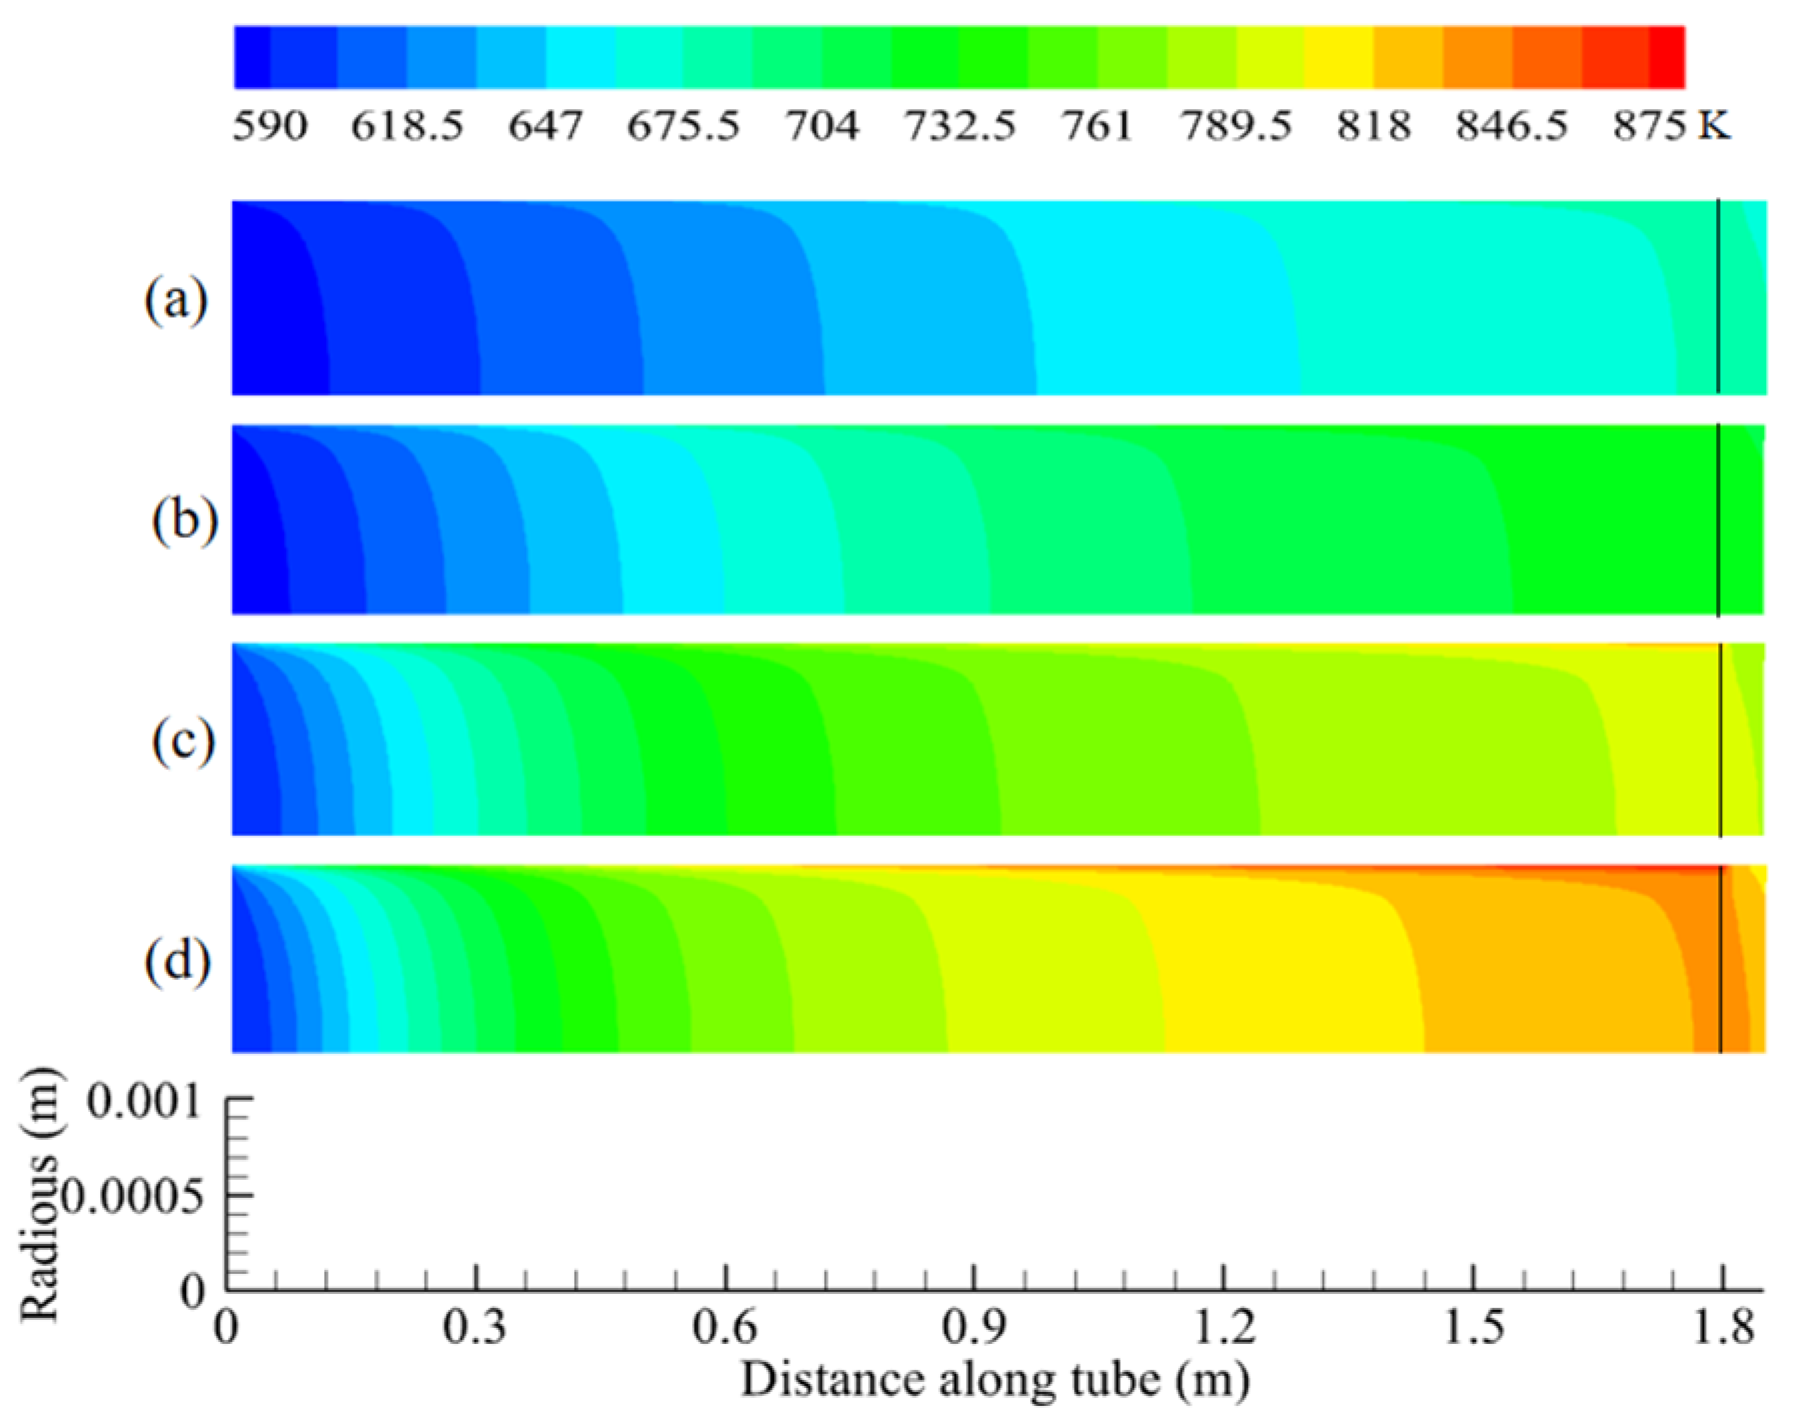
The experimental results when the water content is 15% are compared with those of the numerical model. Figure 11 and Figure 12 show the distribution of the mixed fuel in the tube along the flow direction. The fuel does not react at a low temperature in the inlet area. In this region, the physical heat absorption capacity of fuel is limited, and the temperature gradient in this region is large. The flow process continues to absorb the heat provided by the outside world, the reaction is gradually activated, and the chemical heat absorption capacity of the intake region is low. In the middle and back of the reaction tube, with the continuous heating of the fuel, the chemical heat absorption ability is gradually enhanced, and the fuel can absorb more heat, resulting in a smaller temperature gradient. In the extension area of the reaction tube outlet (>1.8 m), the overall fuel temperature in the outlet area is reduced, taking into account the radiant heat loss and the chemical reaction that still occurs, and the reduction amplitude increases with the heat flux. As shown in Figure 11, under condition (a), the overall fuel temperature decreases by 3 K, while under condition (d), the overall fuel temperature decreases by 12 K. Figure 12 shows the predicted temperature profile of the fuel mixture. In the numerical calculation of this article, the extended zone is set as an adiabatic condition, with no external heat transfer. When the fuel leaves the reaction tube and flows into the temperature thermocouple position, the chemical reaction of n-decane continues. The heat required to maintain a chemical reaction comes from the fuel itself, and the heat absorbed by the chemical reaction increases with the increase in the outflow temperature, resulting in a significant decrease in the overall temperature of the fuel. The reason for the temperature drop is that chemical reactions continue to occur in the extended zone.
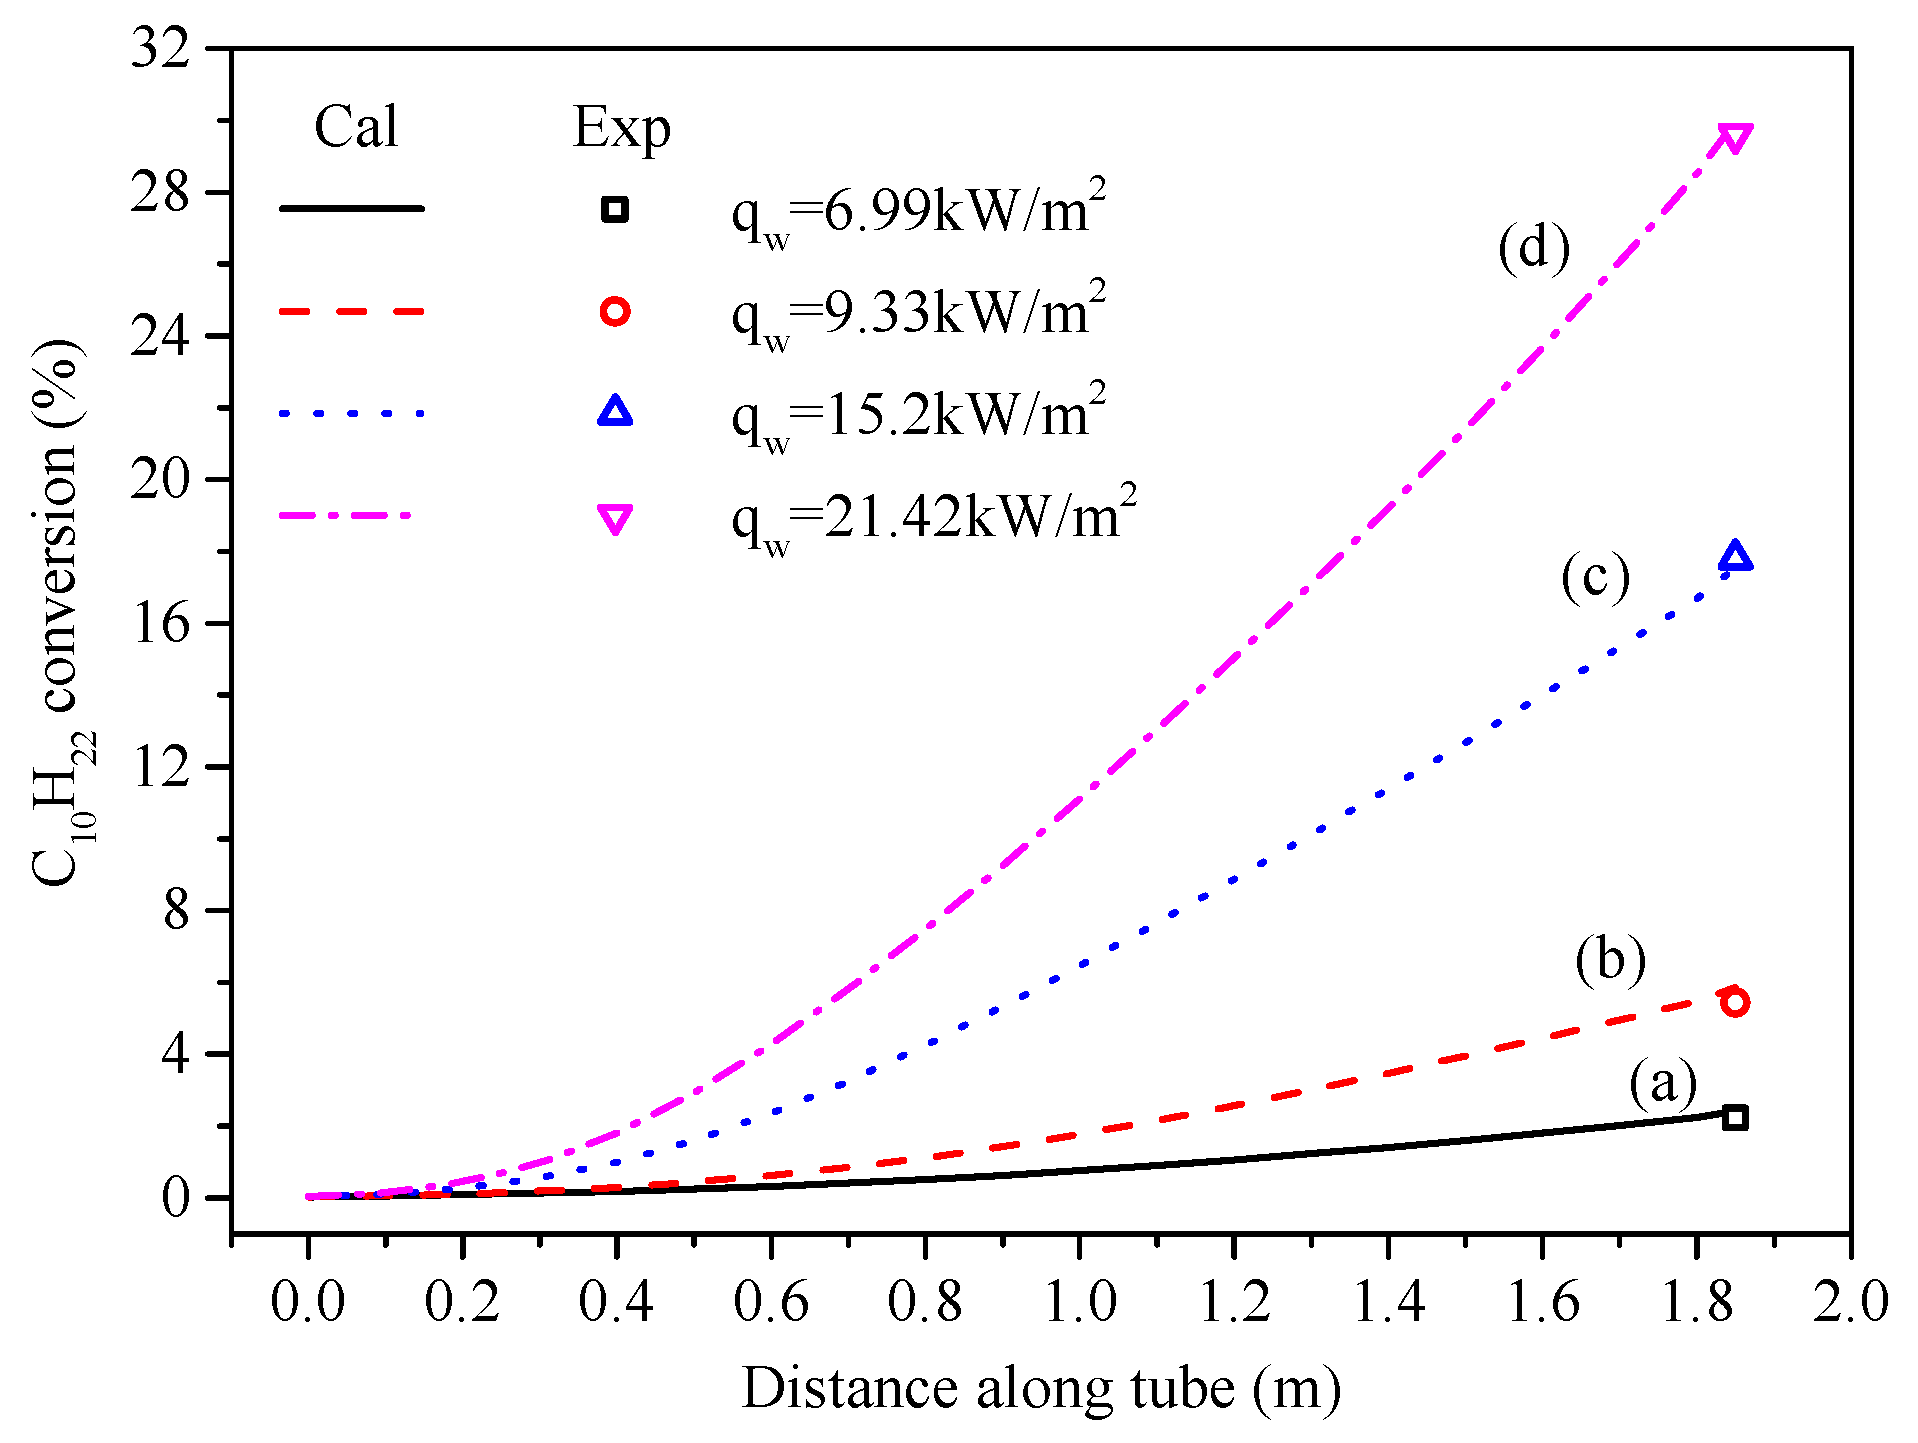
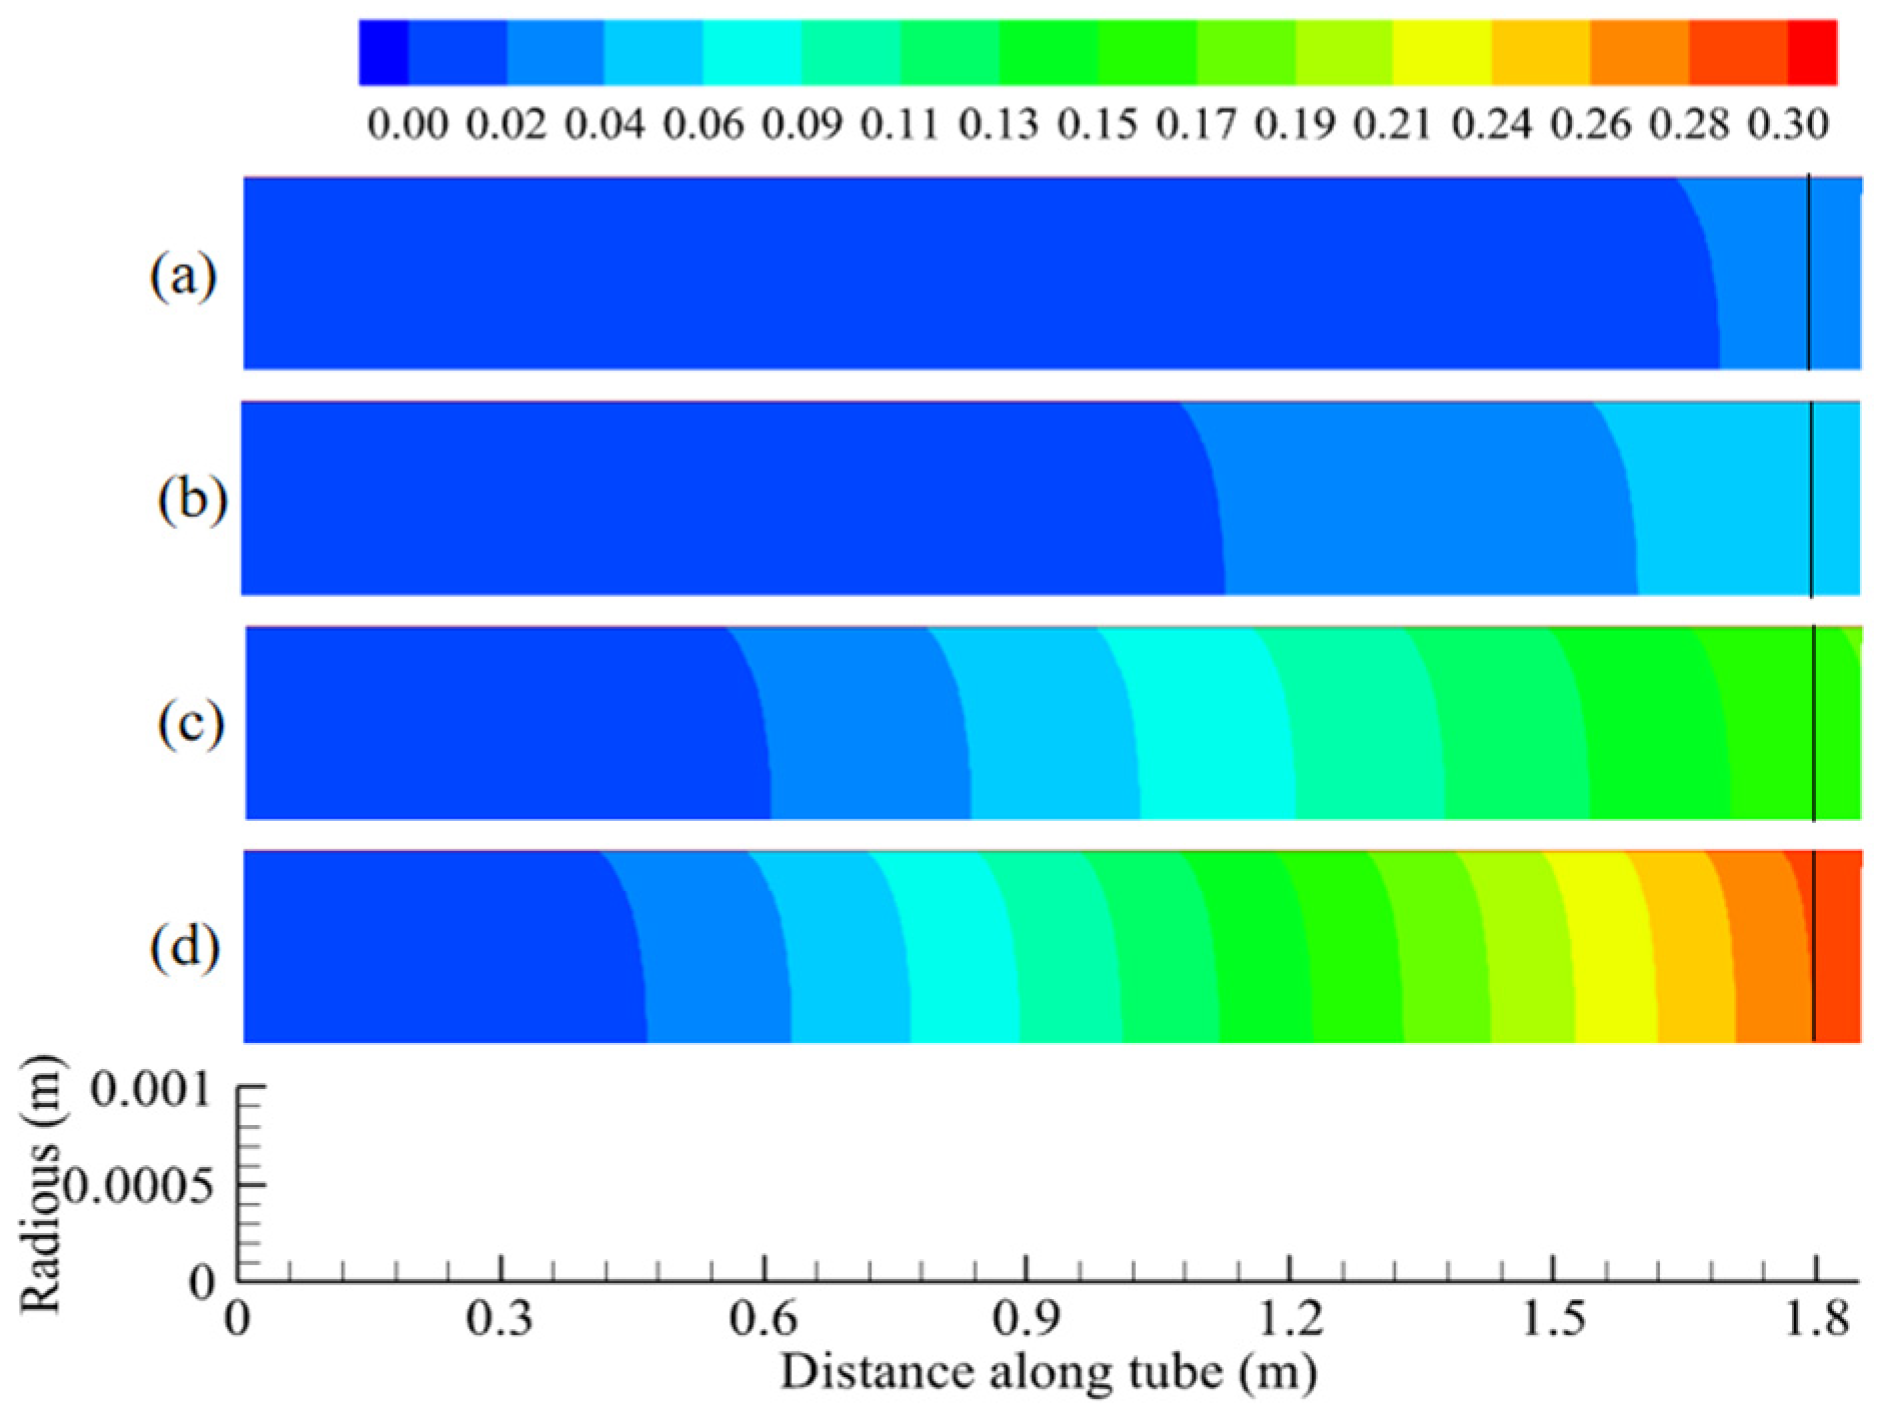
The conversion distribution of n-decane in the tube was studied by numerical simulation, and the deviation from the experimental results was less than 5%. After the fuel left the test tube and flowed into the outlet extension tube, the cracking reaction continued. Under the experimental conditions in Figure 13 and Figure 14, the simulated value of the n-decane conversion rate is lower than the experimental value of the extended outlet tube, and their difference increases with the heat flux density. The results show that the TC of the outlet extension tube will have a certain effect on the total fuel conversion rate, especially in the case of high heat flux. In order to minimize this effect, the outlet extension tube should be as short as possible.

5.2. Heat Transfer Characteristics Along the Tube

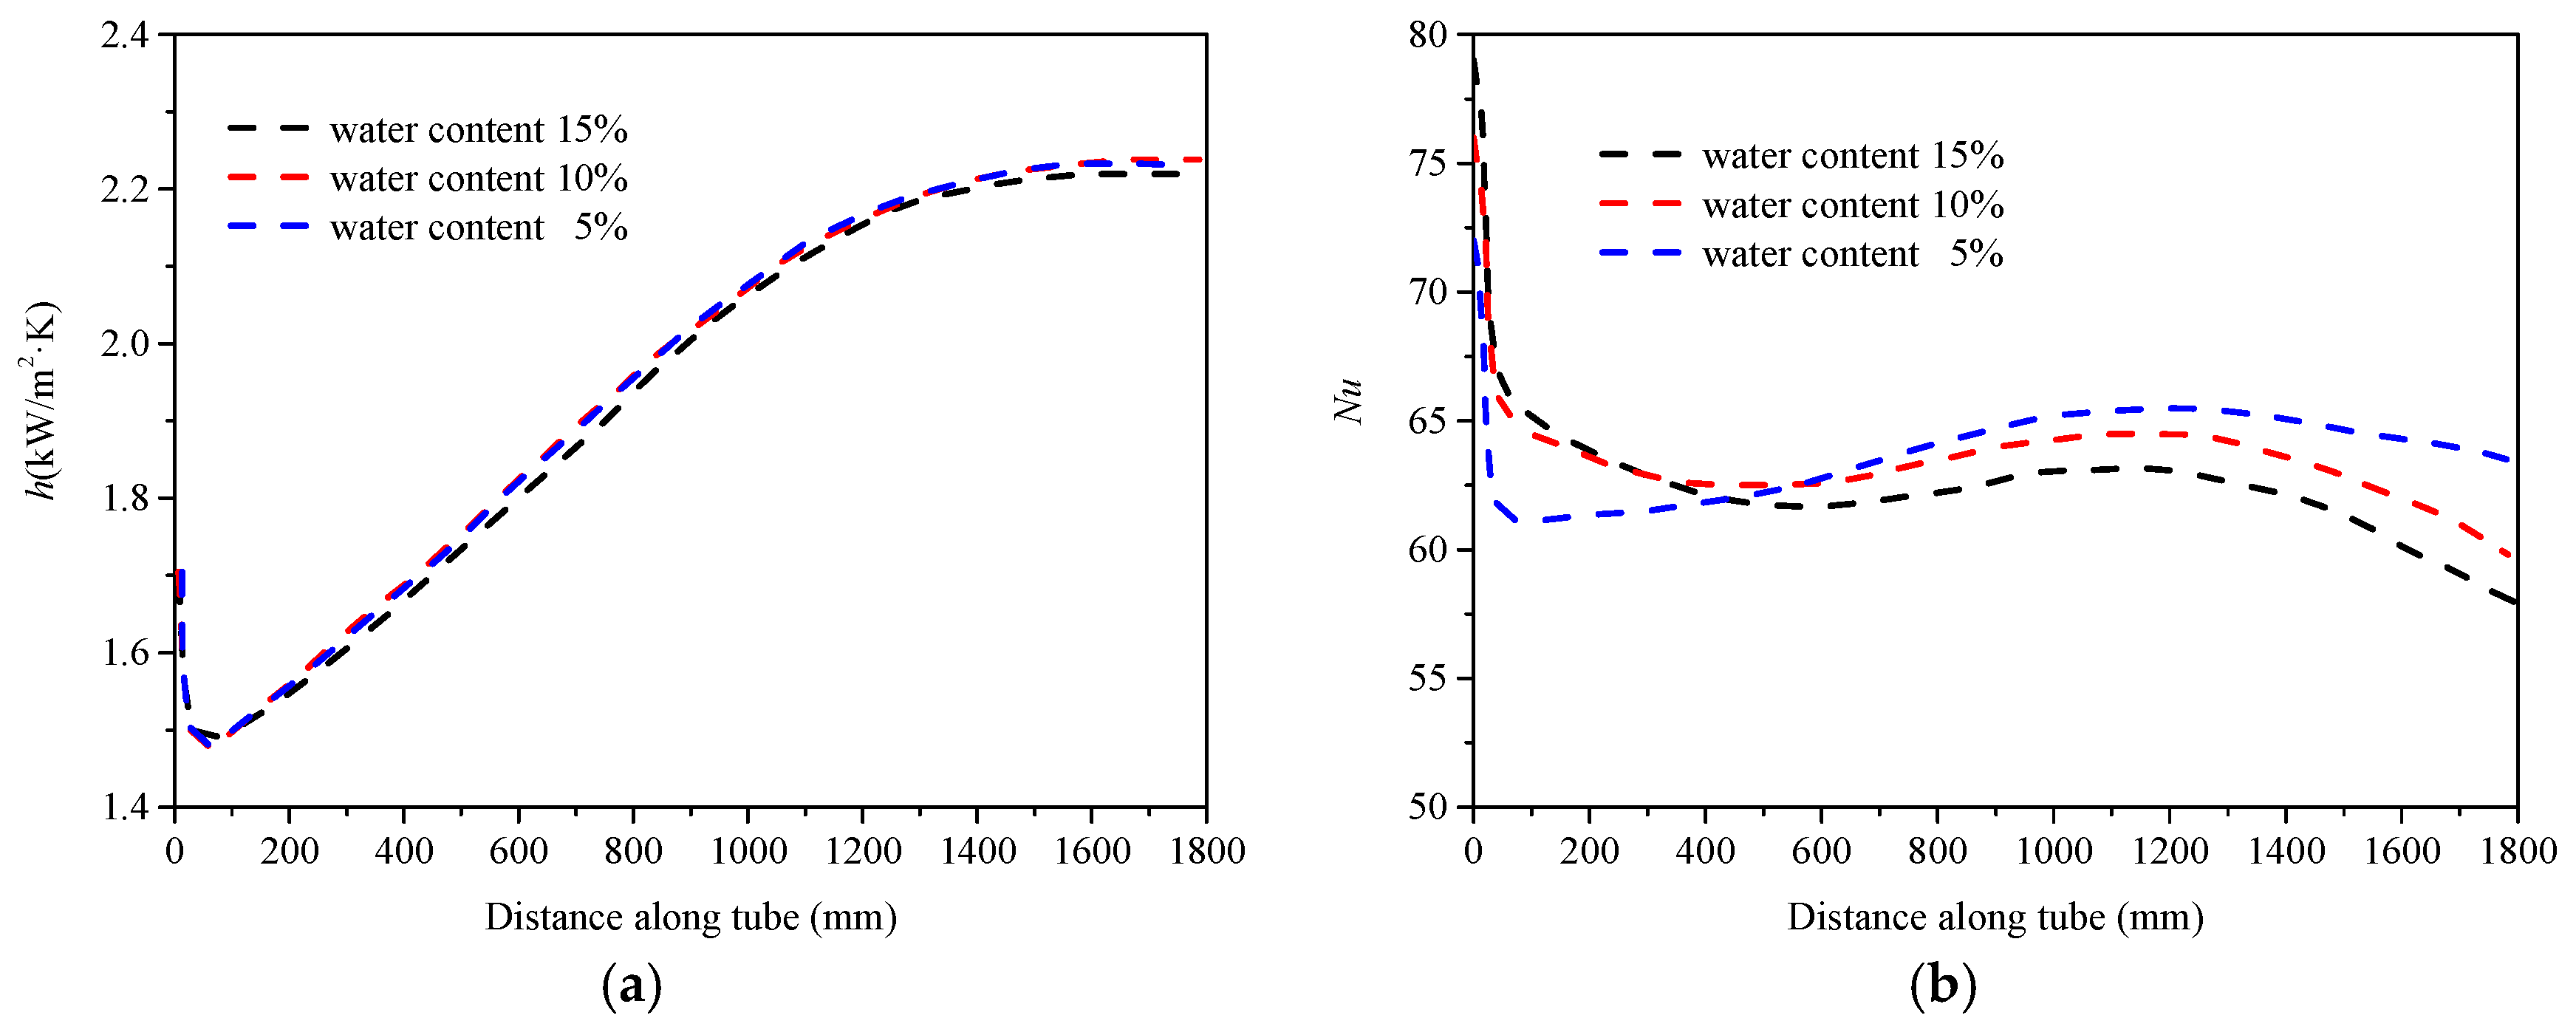
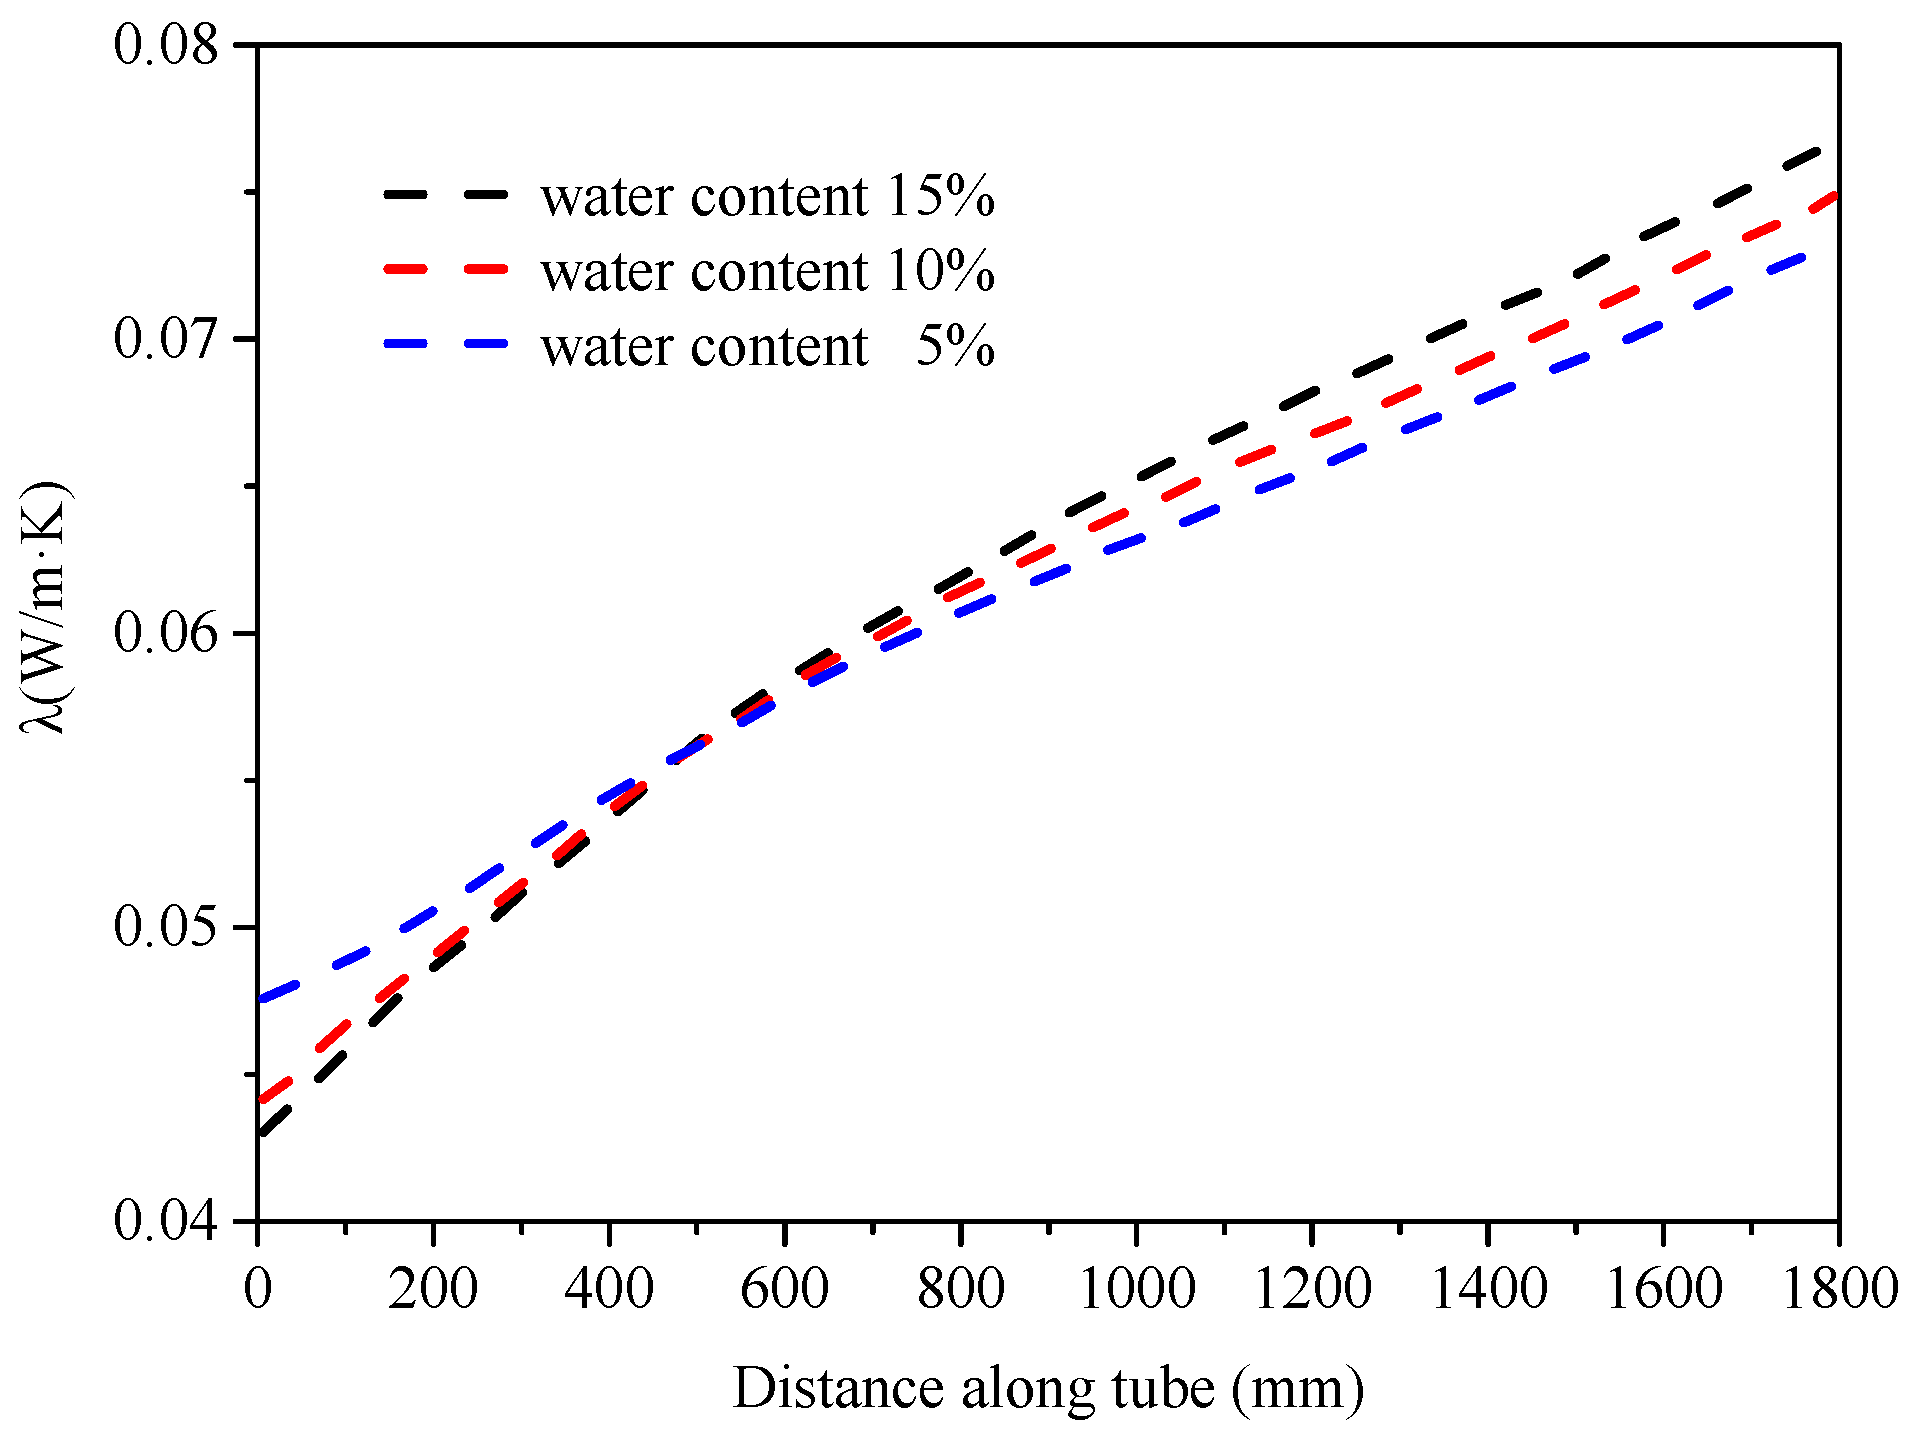
Figure 15a shows that at the same position in cooling channels with different water contents, the convective heat transfer coefficient (h) is almost the same. The Nusselt number (Nu) of a fluid exhibits a different pattern from h as the water content changes, as shown in Figure 15b. The reason is that in the active regeneration cooling channel, the difference in the ratio of gas and liquid reaction products can affect the physical properties of the mixed fuel, thereby affecting the heat transfer characteristics. For example, from the tube inlet to the 500 mm position, CSR and CTC reactions occur, with the main product being gas. The thermal conductivity (λ) of gas increases with the temperature, and an insufficient water content can promote the CTC reaction and produce more gas. According to Formula (8), Nu is inversely proportional to λ. Therefore, Nu increases with the water content from the tube inlet to the 500 mm position. From 500 mm inside the tube to the outlet, the TC reaction occurs and gradually dominates, producing a large amount of liquid products, and the thermal conductivity of the liquid decreases with temperature. An insufficient water content is more conducive to increasing the TC reaction rate and generating a large amount of liquid products, reducing the thermal conductivity, as shown in Figure 16. From 500 mm inside the tube to the outlet, Nu decreases with the water content.

5.3. Heat Sink Distribution

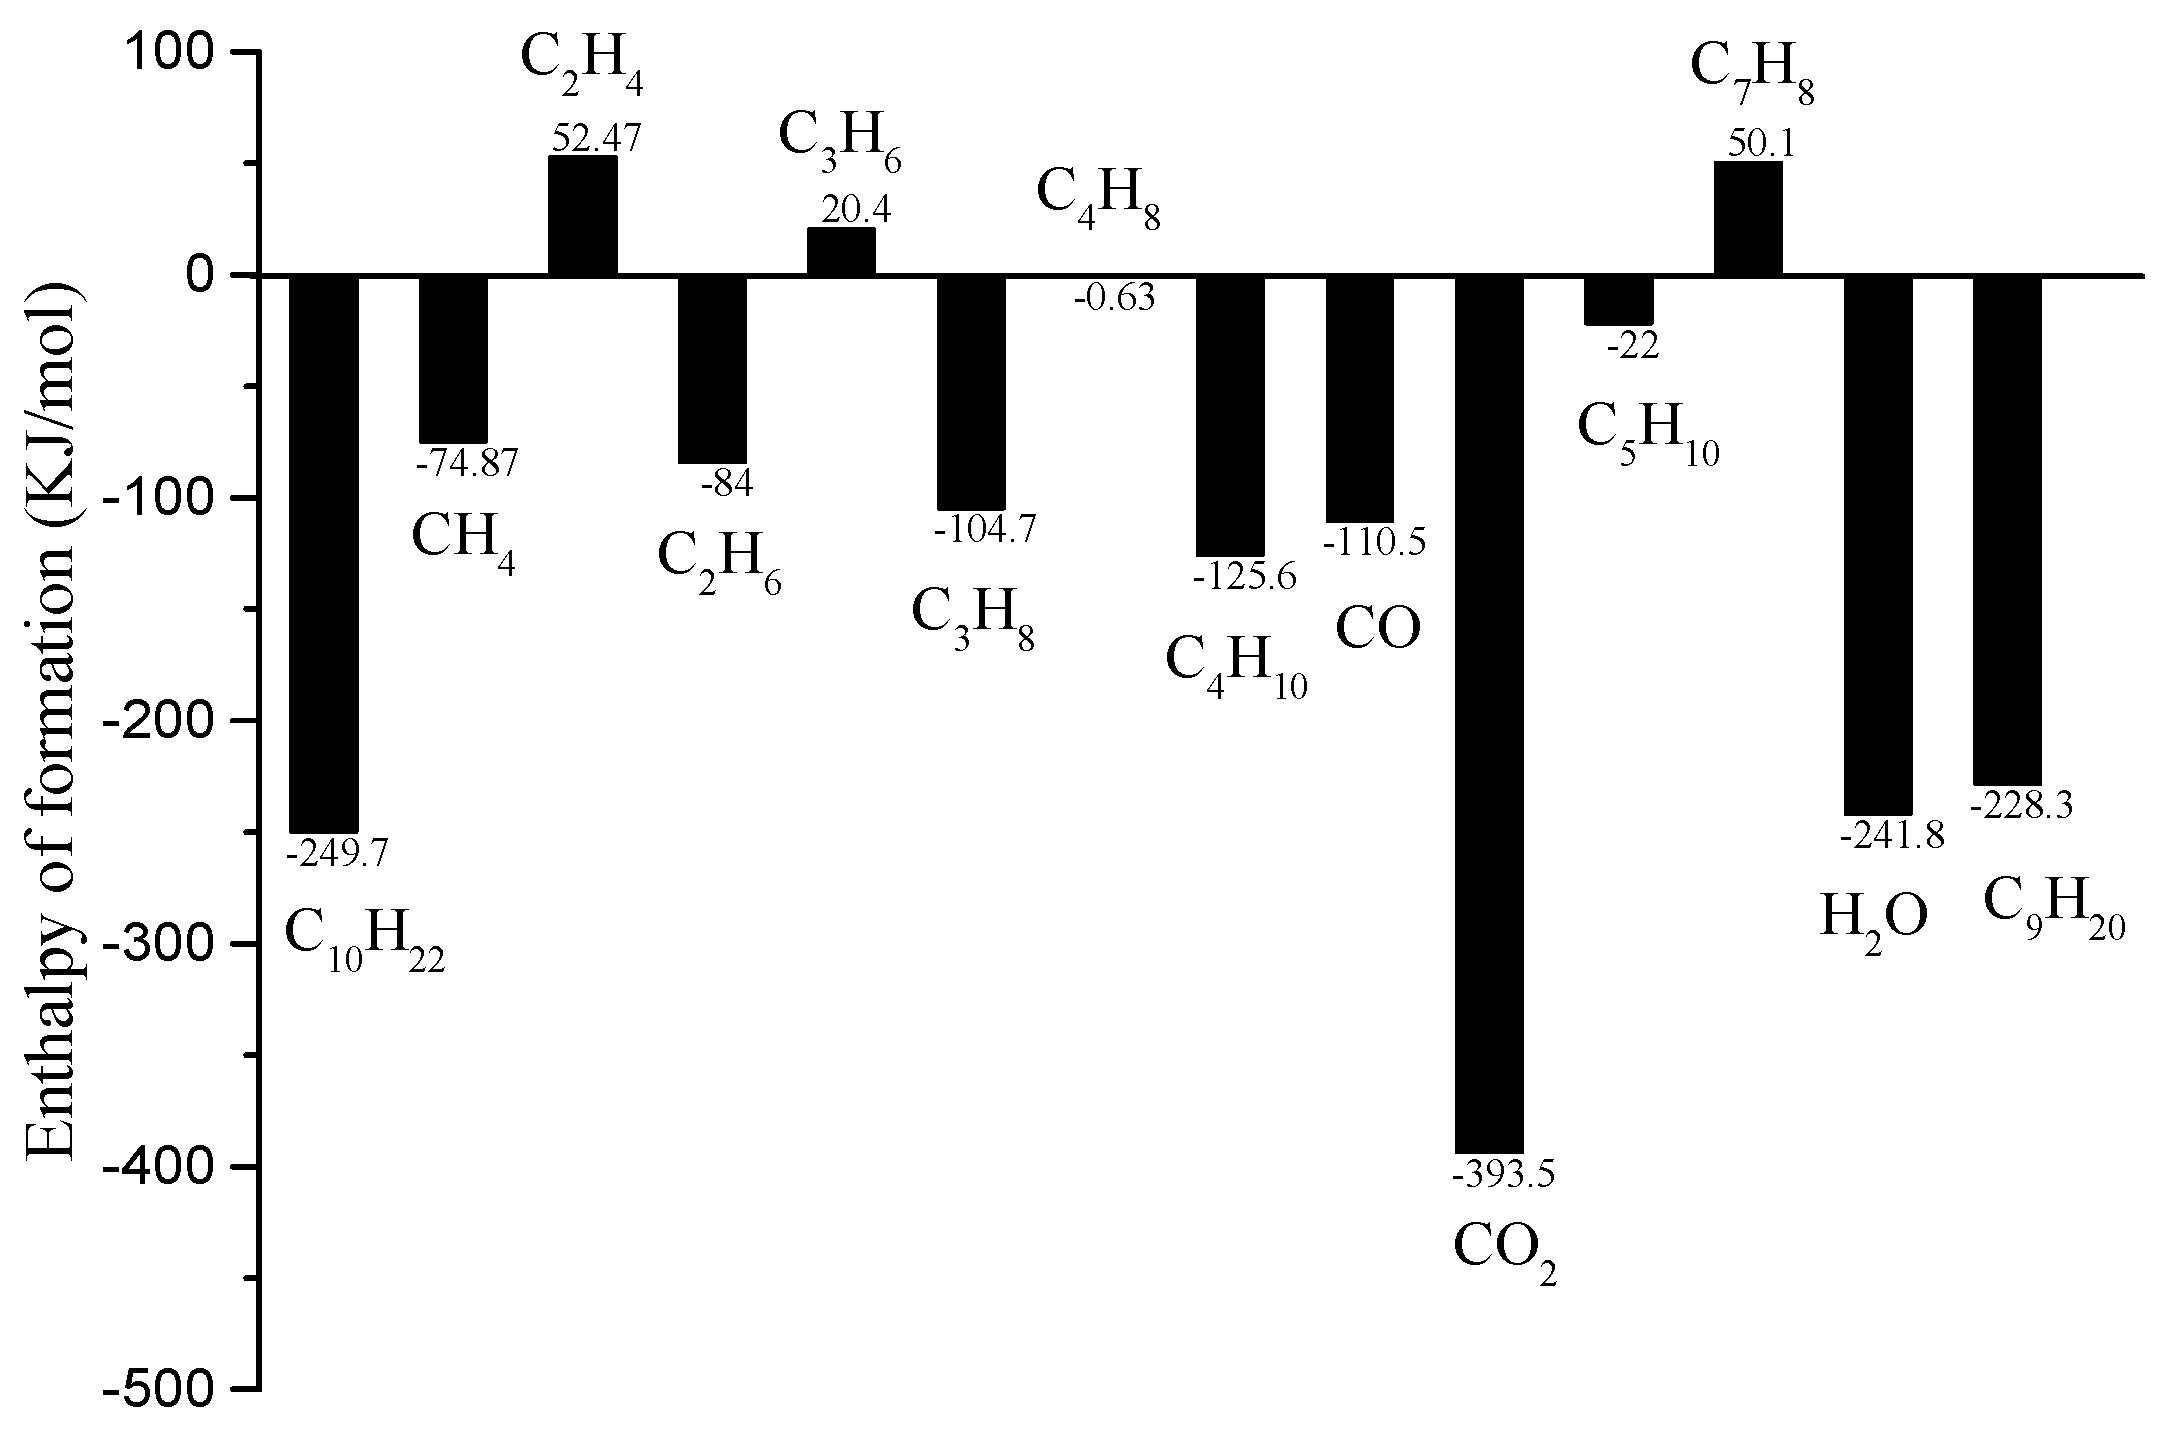
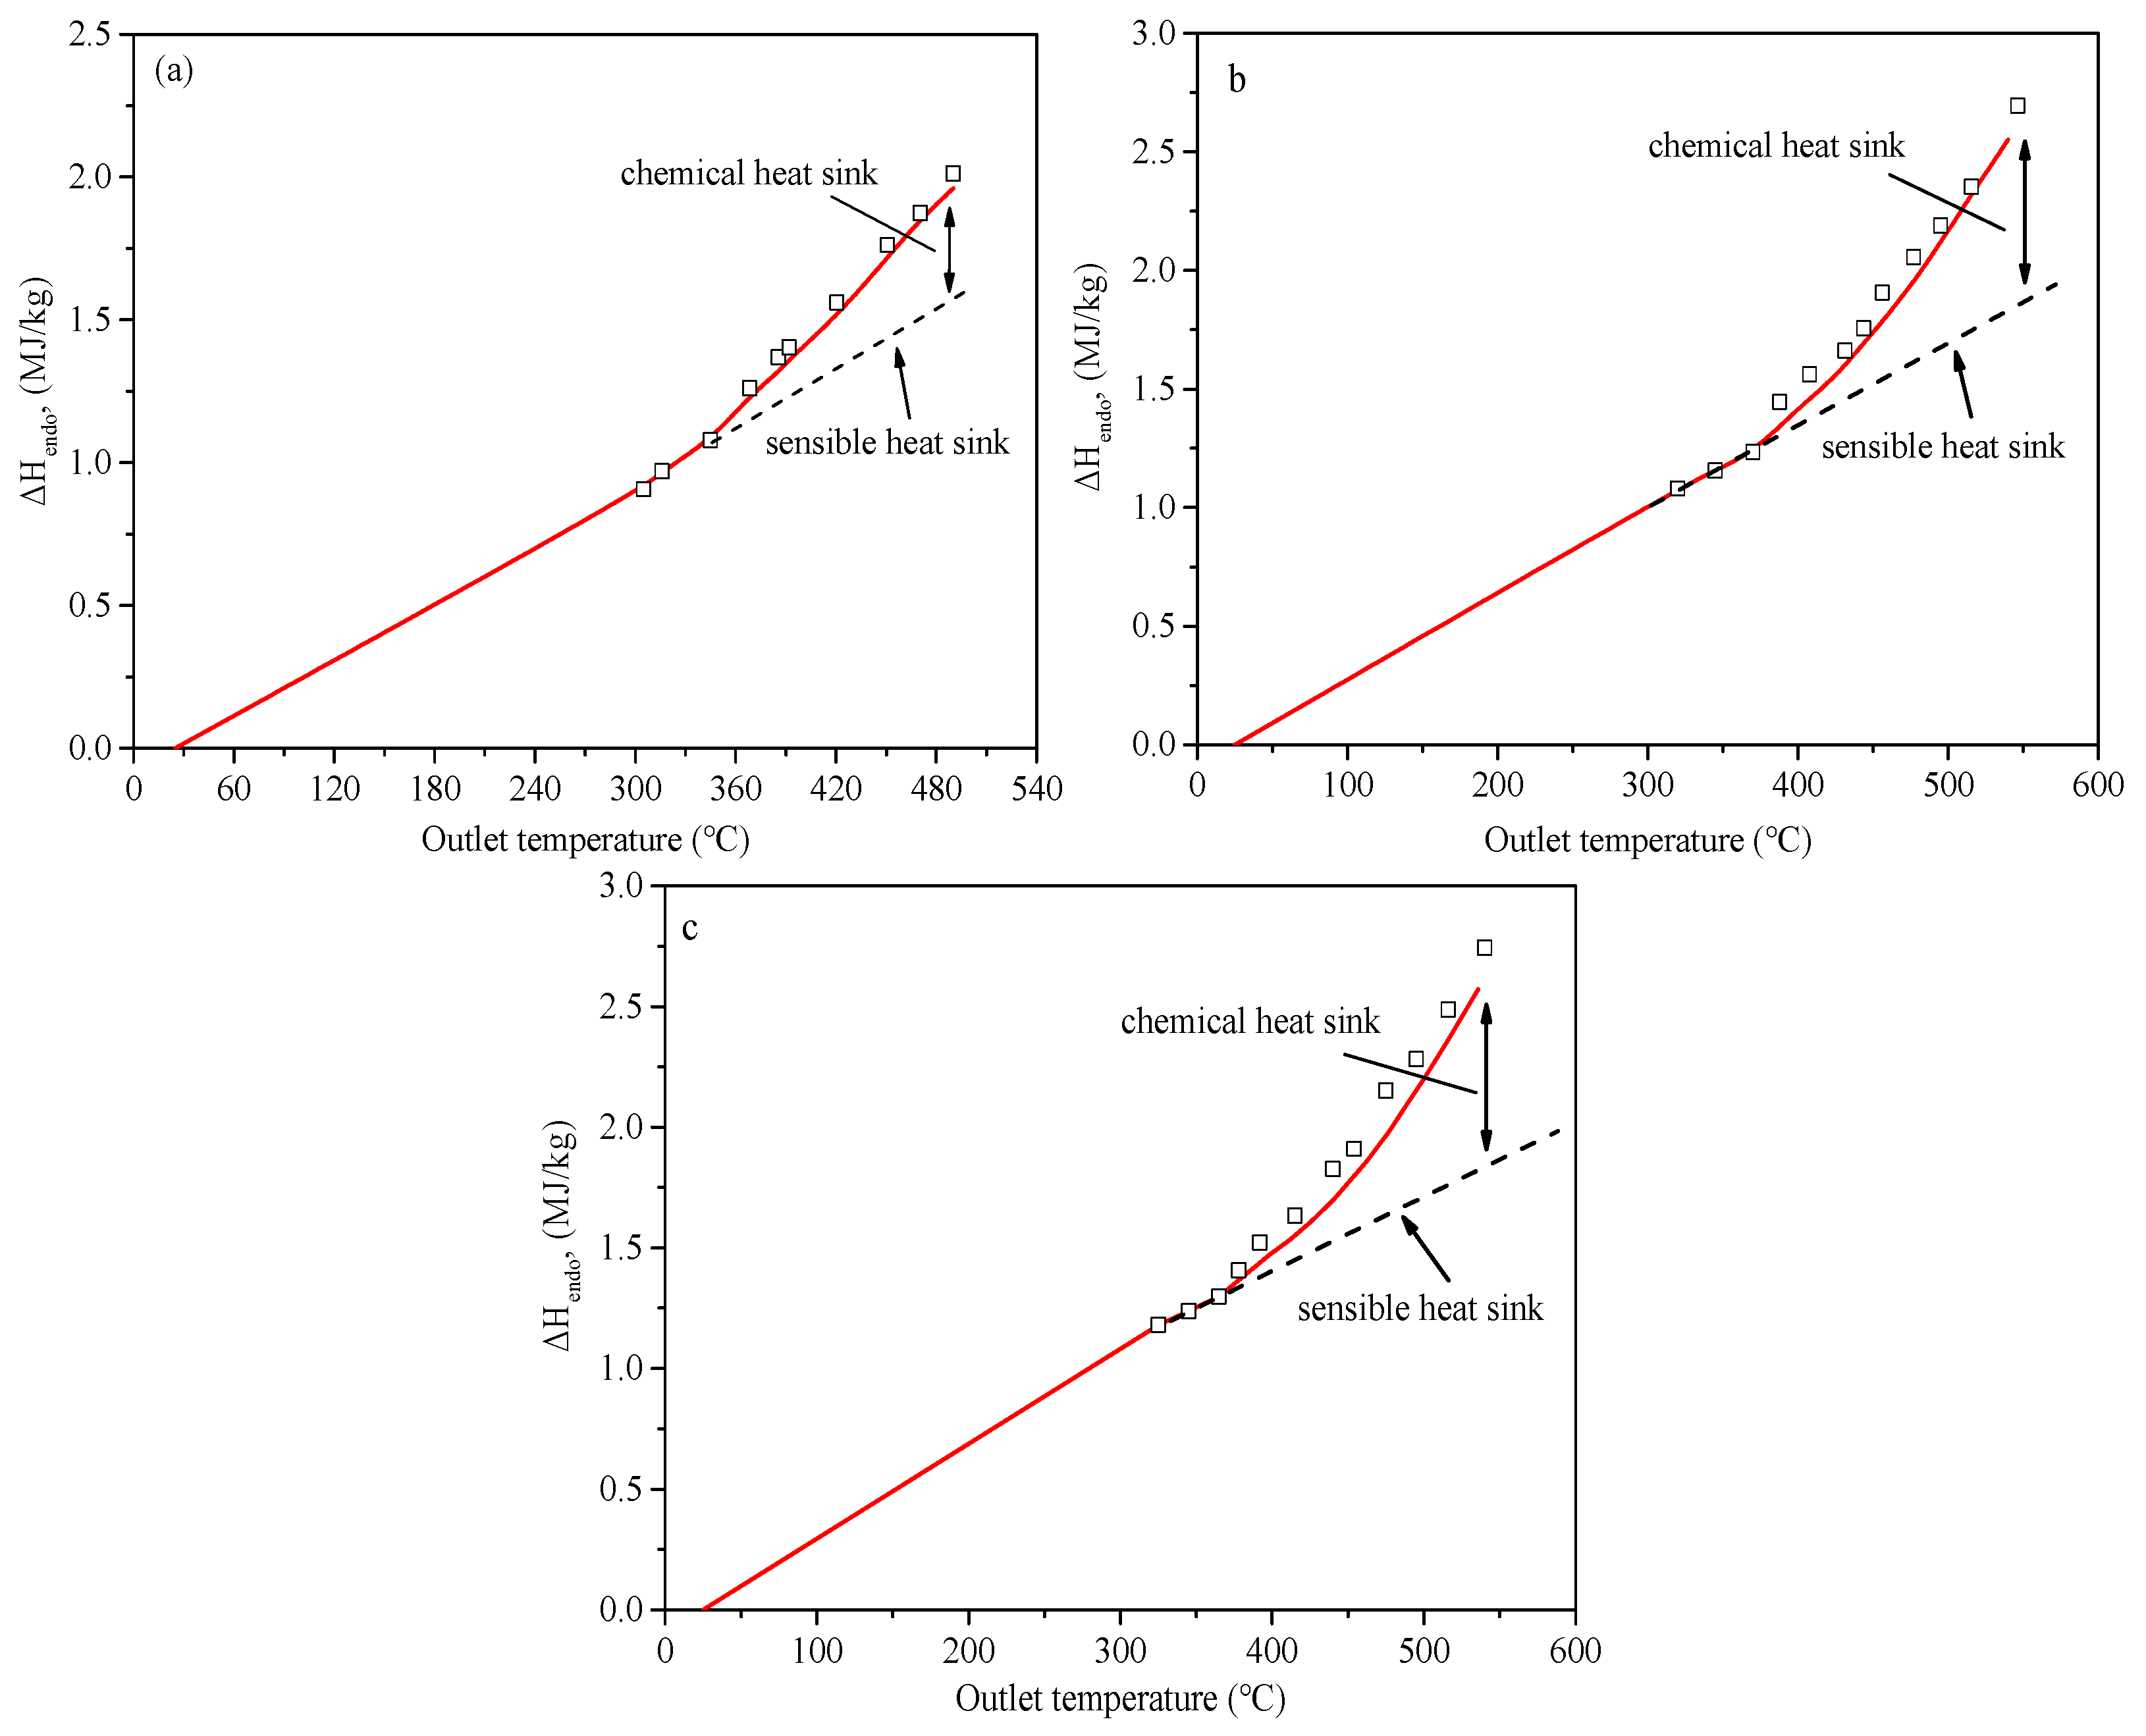
The comparison of the experimental and simulation results of the heat sink of hydrocarbon fuel verifies the accuracy of the established model in the calculation of heat absorption. The experimental heat sink is measured by subtracting the empty tube heat loss from the total heat input (I2R). The standard enthalpy of formation diagrams for different products were plotted using the NIST REFPROP version 9.4 software. The simulation results of the heat sink are calculated based on the calculation results of the export fuel component content combined with the standard enthalpy of formation in Figure 17. It can be seen from Figure 18 that the heat sink of the fuel increases almost linearly before 360 °C, and the chemical heat sink is approximately zero. After 360 °C, the heat sink begins to increase rapidly, and chemical reactions begin to occur. The turning point of 360 °C coincides with the starting point of the catalytic reaction observed during the experimental process. In addition, the heat sink calculated by simulation is well matched with the experimental values, which indicates that the reaction model proposed in this paper can better calculate the heat sink of the PCSR reaction.

6. Conclusions

In this work, a neural network-based approach provides new insights into the establishment of a reaction model for the PCSR of n-decane under low water/carbon conditions. The characteristic of this method is to use optimization algorithms to iteratively calculate dynamic parameters. The heat absorption capacity of the PCSR reaction during n-decane regeneration cooling was simulated by combining the optimized reaction model with the numerical model. The results are as follows:
(1)
During the regeneration cooling process, the H2 generated by the CSR reaction can improve the heat sink. The reaction products of CTC and TC include some liquid hydrocarbons, which have a weak improvement in endothermic capacity.
(2)
By comparing the experimental values of the main product content, outlet temperature, conversion rate, and heat sink with the corresponding simulated values, the results show that the proposed model is reliable for analyzing the RCSR reaction process and heat absorption capacity of regenerative cooling.
(3)
After the fuel flows into the connecting tube, the TC reaction continues, increasing the conversion rate of n-decane. The TC reaction of the connecting tube has a certain impact on the fuel conversion rate and temperature, which should be considered in the numerical calculation.
(4)
Unlike the convective heat transfer coefficient, the Nusselt number of a fluid is influenced by the thermal conductivity of the mixed fluid, exhibiting different patterns with changes in the water content.

Author Contributions

Conceptualization, Y.F.; methodology, Y.F., Z.W., and F.C.; software, F.C.; validation, J.H.; formal analysis, J.H.; investigation, F.C.; resources, Y.F.; data curation, Z.W.; writing—original draft preparation, F.C.; writing—review and editing, F.C., J.H., Z.W., and Y.F.; visualization, J.H.; supervision, Y.F.; project administration, Y.F. All authors have read and agreed to the published version of the manuscript.

Funding

This work is supported by the National Natural Science Foundation of China (No. 51976046) and Shenzhen Technology Projects (No. ZDSYS201707280904031).

Data Availability Statement

The original contributions presented in the study are included in the article, further inquiries can be directed to the corresponding author.

Conflicts of Interest

The authors declare no conflicts of interest.

Notation

Nomenclature
Apre-exponential factorTtemperature, K
bbulk fluid TC thermal cracking
CSR catalytic steam reformingVvolume, m3
CTC catalytic thermal cracking x conversion, %
dinner diameter of the tube, mmyyield of reaction product
Eaactivation energy, kJ/molSubscripts
ΔHendo heat sink, MJ/kgggas phase
hconvective heat transfer coefficient, kW/(m2·K)iraw material component
washcoat thickness, mmjproduct components
specific enthalpy, J/kglliquid phase
mfeed quality of raw materials, gwmass fraction
Mmolar mass, kg/molwall
NuNusselt numberininside surface
PCSR partial catalytic steam reformingoutoutside surface
qheat flux, (kW/m2)Greek Symbols
rradius, mmμdynamic viscosity, N·s/m2
Rmolar gas constant, J/(K·mol)ρdensity, kg/m3
Smolar selectivityλthermal conductivity, W/(m·K)

References

  1. Pan, Y.; Zhang, H.; Zhang, C.; Wang, H.; Jing, K.; Wang, L.; Zhang, X.; Liu, G. Supercritical pyrolysis and coking of JP-10 in regenerative cooling channels. Energy Fuels 2020, 34, 1627–1638. [Google Scholar] [CrossRef]
  2. Feng, Y.; Zhang, H.; Zhang, D.; Chen, F.; Xu, X.; Qin, J.; Jiao, Y. The mechanism of ethanol blending on the variation of chemical heat sink in n-decane thermal cracking process. Fuel 2023, 353, 129204. [Google Scholar] [CrossRef]
  3. Huang, H.; Spadaccini, L.J.; Sobel, D.R. Fuel-Cooled Thermal Management for Advanced Aeroengines. J. Eng. Gas Turbines Power 2002, 126, 284–293. [Google Scholar] [CrossRef]
  4. Zheng, Q.; Xiao, Z.; Xu, J.; Pan, L.; Zhang, X.; Zhou, J. Catalytic steam reforming and heat sink of high-energy-density fuels: Correlation of reaction behaviors with molecular structures. Fuel 2021, 286, 119371. [Google Scholar] [CrossRef]
  5. Edwards, T. Cracking and Deposition Behavior of Supercritical Hydrocarbon Aviation Fuels. Combust. Sci. Technol. 2006, 178, 307–334. [Google Scholar] [CrossRef]
  6. Liu, G.; Wang, X.; Zhang, X. Pyrolytic depositions of hydrocarbon aviation fuels in regenerative cooling channels. J. Anal. Appl. Pyrolysis 2013, 104, 384–395. [Google Scholar] [CrossRef]
  7. Feng, Y.; Liu, Y.; Cao, Y.; Gong, K.; Liu, S.; Qin, J. Thermal management evaluation for advanced aero-engines using catalytic steam reforming of hydrocarbon fuels. Energy 2020, 193, 116738. [Google Scholar] [CrossRef]
  8. Li, J.; Shao, J.; Liu, C.; Rao, H.; Li, Z.; Li, X. Pyrolysis Mechanism of Hydrocarbon Fuels and Kinetic Modeling. Acta Chim Sinica 2010, 68, e45. [Google Scholar]
  9. Jiao, Y.; Li, J.; Wang, J.; Wang, J.; Zhu, Q.; Chen, Y.; Li, X. Experiment and kinetics simulation on the pyrolysis of n-decane. Acta Phys.-Chim. Sin. 2011, 27, 1061–1067. [Google Scholar]
  10. Zeng, M.; Yuan, W.; Wang, Y.; Zhou, W.; Zhang, L.; Qi, F.; Li, Y. Experimental and kinetic modeling study of pyrolysis and oxidation of n-decane. Combust. Flame 2014, 161, 1701–1715. [Google Scholar] [CrossRef]
  11. Jia, Z.; Huang, H.; Zhou, W. Experimental and Modeling Investigation of n-Decane Pyrolysis at Supercritical Pressures. Energy Fuels 2014, 28, 6019–6028. [Google Scholar] [CrossRef]
  12. Zhong, F.; Fan, X.; Yu, G.; Li, J. Thermal cracking of aviation kerosene for scramjet applications. Sci. China Ser. E Technol. Sci. 2009, 52, 2644–2652. [Google Scholar] [CrossRef]
  13. Ward, T.; Ervin, J.; Striebich, R.; Zabarnick, S. Simulations of flowing mildly-cracked normal alkanes incorporating proportional product distributions. J. Propuls. Power 2004, 20, 394–402. [Google Scholar] [CrossRef]
  14. Ward, T.; Ervin, J.; Zabarnick, S.; Shafer, L. Pressure effects on flowing mildly-cracked n-decane. J. Propuls. Power 2005, 21, 344–355. [Google Scholar] [CrossRef]
  15. Jiang, R.; Liu, G.; Zhang, X. Thermal Cracking of Hydrocarbon Aviation Fuels in Regenerative Cooling Microchannels. Energy Fuels 2013, 27, 2563–2577. [Google Scholar] [CrossRef]
  16. Wang, Y.; Zhao, Y.; Liang, C.; Chen, Y.; Zhang, Q.; Li, X. Molecular-level modeling investigation of n-decane pyrolysis at high temperature. J. Anal. Appl. Pyrolysis 2017, 128, 412–422. [Google Scholar] [CrossRef]
  17. Zhu, Y.; Liu, B.; Jiang, P. Experimental and Numerical Investigations on n-Decane Thermal Cracking at Supercritical Pressures in a Vertical Tube. Energy Fuels 2013, 28, 466–474. [Google Scholar] [CrossRef]
  18. Wang, P.; Zhang, X.; Shi, R.; Zhao, J.; Yuan, Z.; Zhang, T. Light-Driven Hydrogen Production from Steam Methane Reforming via Bimetallic Pd/Ni Catalysts Derived from Layered Double Hydroxide Nanosheets. Energy Fuels 2022, 36, 11627–11635. [Google Scholar] [CrossRef]
  19. Lu, M.; Xiong, Z.; Fang, K.; Li, X.; Li, J.; Li, T. Steam reforming of toluene over nickel catalysts supported on coal gangue ash. Renew. Energy 2020, 160, 385–395. [Google Scholar] [CrossRef]
  20. Habib, M.A.; Harale, A.; Paglieri, S.; Alrashed, F.S. Palladium-Alloy Membrane Reactors for Fuel Reforming and Hydrogen Production: A Review. Energy Fuels 2021, 35, 5558–5593. [Google Scholar] [CrossRef]
  21. Zhang, Z.; Qin, C.; Ou, Z.; Xia, H.; Ran, J.; Wu, C. Experimental and thermodynamic study on sorption-enhanced steam reforming of toluene for H2 production using the mixture of Ni/perovskite-CaO. Fuel 2021, 305, 121447. [Google Scholar] [CrossRef]
  22. Chen, F.; Cao, Y.; Feng, Y.; Wang, Z.; Zhang, D.; Qin, J.; He, X. Experimental study on the mechanism of water on heat sink variation in catalytic partial steam reforming of supercritical n-decane. Fuel 2024, 357, 129892. [Google Scholar] [CrossRef]
  23. Gong, K.; Zhang, Y.; Cao, Y.; Feng, Y.; Qin, J. Deep learning approach for predicting the flow field and heat transfer of supercritical hydrocarbon fuels. Int. J. Heat Mass Transf. 2024, 219, 124869. [Google Scholar] [CrossRef]
  24. Irani, M.; Alizadehddkhel, A.; Pour, A.N.; Hoseini, N.; Adinehnia, M. CFD modeling of hydrogen production using steam reforming of methane in monolith reactors: Surface or volume-base reaction model? Int. J. Hydrogen Energy 2011, 36, 15602–15610. [Google Scholar] [CrossRef]
  25. Zhang, Y.; Cao, Y.; Feng, Y.; Xu, S.; Wang, J.; Qin, J. A new modeling method to estimate the heat transfer characteristics of supercritical aviation kerosene RP-3 with pyrolysis. Chem. Eng. Sci. 2023, 267, 118324. [Google Scholar] [CrossRef]
  26. Lei, Z.; Liu, B.; Huang, Q.; He, K.; Bao, Z.; Zhu, Q.; Li, X. Thermal cracking characteristics of n-decane in the rectangular and circular tubes. Chin. J. Chem. Eng. 2019, 27, 2876–2883. [Google Scholar] [CrossRef]
  27. Jiang, P.; Wang, Y.; Zhu, Y. Differential global reaction model with variable stoichiometric coefficients for thermal cracking of n-decane at supercritical pressures. Energy Fuels 2019, 33, 7244–7256. [Google Scholar] [CrossRef]
  28. Jones, W.P.; Lindstedt, R.P. Global reaction schemes for hydrocarbon combustion. Combust. Flame 1988, 73, 233–249. [Google Scholar] [CrossRef]
  29. Wang, L.; Singh, C. Balancing risk and cost in fuzzy economic dispatch including wind power penetration based on particle swarm optimization. Electr. Power Syst. Res. 2008, 78, 1361–1368. [Google Scholar] [CrossRef]
Figure 1. Catalytic steam reforming experimental system [22].
Energies 17 05215 g001
Figure 2. The heat loss density with the outer wall temperature of the tube.
Energies 17 05215 g002
Figure 3. Section and cross-section of catalyst coating.
Energies 17 05215 g003
Figure 4. Volume error bar for catalytic cracking gas products.
Energies 17 05215 g004
Figure 5. The schematic of the physical model.
Energies 17 05215 g005
Figure 6. Chemical heat sink varies with outlet temperature.
Energies 17 05215 g006
Figure 7. CSR product selectivity as a function of conversion. (Water content is 15 wt%).
Energies 17 05215 g007
Figure 8. CTC product selectivity as a function of conversion. (a) Vapor products; (b) liquid products.
Energies 17 05215 g008
Figure 9. The idea of establishing a global PCSR reaction model.
Energies 17 05215 g009
Figure 10. Comparison of experimental and calculated values of n-decane conversion rate, outlet temperature, and gas product contents under different heat flux densities. ((a-1a-4) Water content of 5 wt%; (b-1b-4) water content of 10 wt%; (c-1c-4) water content of 15 wt%).
Energies 17 05215 g010aEnergies 17 05215 g010b
Figure 11. Comparison of calculated fuel temperatures to experimental data. (a) qw = 6.99 KW/m2, (b) qw = 9.33 KW/m2, (c) qw = 15.2 KW/m2, (d) qw = 21.42 KW/m2.
Energies 17 05215 g011
Figure 12. Predicted fuel mixture temperature contours. (a) qw = 6.99 KW/m2, (b) qw = 9.33 KW/m2, (c) qw = 15.2 KW/m2, (d) qw = 21.42 KW/m2.
Energies 17 05215 g012
Figure 13. Comparison of calculated C10H22 conversion to experimental data. (a) qw = 6.99 KW/m2, (b) qw = 9.33 KW/m2, (c) qw = 15.2 KW/m2, (d) qw = 21.42 KW/m2.
Energies 17 05215 g013
Figure 14. Predicted C10H22 conversion distribution contours. (a) qw = 6.99 KW/m2, (b) qw = 9.33 KW/m2, (c) qw = 15.2 KW/m2, (d) qw = 21.42 KW/m2.
Energies 17 05215 g014
Figure 15. Variations in h and Nu under different water content conditions (qw = 21.42 kW/m2). (a) Convective heat transfer coefficient; (b) Nusselt number.
Energies 17 05215 g015
Figure 16. Variation in λ with distance along channel under different water content conditions (qw = 21.42 kW/m2).
Energies 17 05215 g016
Figure 17. Standard enthalpy of formation for reactants and different products.
Energies 17 05215 g017
Figure 18. Heat sink versus fuel temperature. Points, experimental results; line, simulated results. ((a) Water content of 5 wt%; (b) water content of 10 wt%; (c) water content of 15 wt%).
Energies 17 05215 g018
Table 1. Optimized chemical reaction kinetics model.
ReactionEa (KJ/mol)A
C10H22 + 18.3H2O → 29.3H2 + 1.7CO + 8.3CO2 (R1)87.091.6 × 105
C10H22 → 4.623H2 + 0.2CH4 + 0.06C2H4 + 0.1C2H6 + 0.03C3H6 + 0.03C3H8 + 0.007C4H10 + 0.008C4H8 + 1.32C7H8 (R2)91.071.1 × 106
C10H22 → 0.017H2 + 0.184CH4 + 0.198C2H4 + 0.1327C2H6 + 0.0566C3H6 + 0.0372C3H8 + 0.0135C4H8 + 0.0048C4H10 + 0.63626C5H10 + 0.6243C9H20 (R3)267.435.0 × 1016
CH4 + H2O = CO + 3H2 (R4)125.53.0 × 108
Disclaimer/Publisher’s Note: The statements, opinions and data contained in all publications are solely those of the individual author(s) and contributor(s) and not of MDPI and/or the editor(s). MDPI and/or the editor(s) disclaim responsibility for any injury to people or property resulting from any ideas, methods, instructions or products referred to in the content.