Article

Numerical Study on the Vapor–Liquid Interface in the Evaporator of Loop Heat Pipes with Multiscale Wicks Using Pore Network Simulation

1
School of Smart Air Mobility, Korea Aerospace University, Goyang 10540, Gyeonggi-do, Republic of Korea
2
School of Aerospace and Mechanical Engineering, Korea Aerospace University, Goyang 10540, Gyeonggi-do, Republic of Korea
*
Author to whom correspondence should be addressed.
Energies 2025, 18(17), 4526; https://doi.org/10.3390/en18174526
Submission received: 9 July 2025 / Revised: 22 August 2025 / Accepted: 23 August 2025 / Published: 26 August 2025
(This article belongs to the Section J: Thermal Management)

Abstract

This study numerically and experimentally investigated the maximum heat transfer rate of the evaporator in loop heat pipes (LHPs) using a pore network simulation that considers the vapor–liquid interface within the evaporator wick under high heat flux conditions. The numerical model was validated with previous results. Based on the validated model, the boundary conditions were modified to consider high heat flux conditions. Also, a porous medium approach was applied to predict the working fluid flow in multiscale wicks, which were fabricated by sintering micro-sized SAC305 particles onto conventional screen mesh wicks. The effective pore radius and permeability of multiscale wicks were experimentally measured using the rate-of-rise method. Using the modified numerical model and experimental results, a parametric study was conducted on sintered weight fraction (SWF), fin ratio, and wick thickness to evaluate their effects on the maximum heat transfer rate of the LHP evaporator. As a result, the maximum heat transfer rate increased with higher SWF and thicker wicks due to improved capillary performance and greater vapor growth space, while a higher fin ratio reduced the maximum heat transfer rate by decreasing the vapor groove area. Under optimal conditions, a maximum heat flux of 800 W/cm2 was achieved.

1. Introduction

As technological advancements accelerate, the amount of heat generated in various electronic devices, such as laser diodes, semiconductors, and electronic chips, is increasing [1,2,3,4,5]. In addition, laser diodes used in laser weapons and high-performance semiconductors are expected to have heat generation of about 1 kW/cm2 [3,5]. Such high heat flux systems are often subject to space limitations, which further complicates thermal management and demands high cooling efficiency. Therefore, many previous researchers have conducted studies on cooling systems designed for high heat flux applications with enhanced cooling efficiency. The two-phase devices that utilize the phase change of the working fluids, such as heat pipes and loop heat pipes, are suitable for these conditions. Especially, an LHP has a structure in which the evaporator, condenser, transportation lines, and compensation chamber are connected in a loop, allowing the working fluid to circulate in a single direction [6]. Due to this configuration, LHPs do not experience the superficial pressure drop commonly observed in heat pipes, where the opposite flow directions of the liquid in the wick and the vapor in the vapor core cause additional superficial pressure drop. Since the driving force for operating LHPs is the capillary pressure generated by the wick, it must exceed the total pressure drop in the system. This condition is referred to as the capillary limitation, which is the most dominant operating limitation [7]. Once this limit is exceeded, the vapor penetrates the wick and reaches the evaporator core, resulting in a rapid temperature rise in the compensation chamber. This state is defined as dry-out [8,9]. It ultimately restricts the improvement in thermal performance in conventional LHPs, especially under conditions requiring high heat removal capacity [6,10]. Therefore, it is important to predict the dry-out to accurately evaluate the cooling performance of high heat flux cooling systems. In previous studies [11,12], the cooling performance of LHPs was investigated based on the capillary limitation, assuming that the wick within the evaporator is fully saturated. However, it is not reasonable under the high heat flux conditions. Therefore, to accurately investigate the cooling performance of LHPs under high heat flux conditions, identifying the dry-out is required by considering the vapor–liquid interface that separates the liquid and vapor zone in the wick.
Several previous researchers [13,14] investigated the dry-out phenomenon inside the wick of the LHP evaporator, considering the vapor–liquid interface. There are two methods for this approach: continuum model and pore network simulation. The continuum model assumes that material is continuously distributed in space, and it does not account for the discrete pore structure [13]. Therefore, it cannot accurately analyze pore-scale phenomena and has the disadvantage of a very long computation time. Pore network simulation is a numerical analysis model that analyzes fluid flow within a material at the pore scale, with representative studies conducted by previous researchers such as Figus et al. [13] and Mottet et al. [14]. Compared to the continuum model, pore network simulation not only has higher computation efficiency but also provides reasonable accuracy. Figus et al. [13] compared the pore network simulation model with the continuum model to predict the vapor–liquid interface inside the wick of the evaporator. Also, the effect of pore size uniformity on the evaporator was investigated. However, the internal flow is assumed to be channel flow, and some boundary conditions are not physically reasonable considering high heat flux conditions. Mottet et al. [14] developed the theoretical model in a two-dimensional domain and conducted an experiment to visualize the vapor–liquid interface inside the wick of the evaporator, validating the theoretical model. Although the three-dimensional model was also developed to investigate more realistic systems, the two-dimensional theoretical model was well matched with experimental data. They configured computation nodes at the pore scale using a mean-field approach to define the nodes and analyze the fluid flow within the porous structure. However, the number of thermal nodes was significantly reduced by applying the mean-field approach, so there is a limitation regarding the temperature distribution, especially at the vapor–liquid interface. These studies investigated the vapor–liquid phase distribution in porous medium wick inside the evaporator according to heat flux but did not mention the maximum heat transfer rate of the evaporator.
So, in this study, the maximum heat transfer rate of the evaporator in LHPs was numerically investigated by using a two-dimensional pore network simulation model, which improved the previous researchers’ numerical models. The pore network simulation model was validated with the results of Figus et al. [13]. Based on the validated model, the modified pore network simulation model was developed by modifying the boundary conditions presented by Figus et al. [13] to consider the operating conditions of LHPs under high heat flux. Moreover, a screen mesh wick with higher permeability than sintered metal was adopted in the evaporator. To the best of the author’s knowledge, the permeability of the wick becomes more critical under high heat flux due to increased pressure drop within the wick, which may reach the capillary limitation. To enhance the capillary performance, a multiscale wick formed by sintering micro-sized particles onto the conventional screen mesh wick was used. Kang et al. [15] presented that the multiscale wicks have sub-pores at the edges of the main pore. As a result, the effective pore radius decreased more significantly than the permeability, resulting in improved capillary performance. The porous medium approach was used to apply a complex-shaped mesh wick to the pore network simulation model, where the computation nodes of the pore network simulation model were structured based on the representative elementary volume (REV) of the mesh wicks. The wick characteristics of multiscale wicks, such as the effective pore radius and permeability, were experimentally measured by the rate-of-rise method. Finally, using the modified pore network simulation model and experimental results, the effects of evaporator parameters on the maximum heat transfer rate were investigated based on the behavior of the vapor–liquid interface under high heat flux conditions. As the heat load increases, the vapor region expands and the distance between the vapor–liquid interface and the bottom surface of the wick decreases. When the vapor–liquid interface contacts the bottom surface of the wick, the situation is defined as a dry-out state, and the maximum heat transfer rate is obtained based on this phenomenon.

2. Numerical Study

2.1. Numerical Modeling

Figure 1a shows the computational domain, which is determined by considering the symmetric structure of the evaporator. Heat is transferred to the wick through the metallic fin at the top of the evaporator and is used for the vaporization of the working fluid. The wick of the evaporator is divided into the vapor and liquid phase by the evaporated working fluid, forming the vapor–liquid interface. To analyze this phenomenon, a two-dimensional pore network simulation was performed, as shown in Figure 1b. The pore network consists of the pore, solid, and throat, which is the channel between pores. The hydraulic network node used to calculate the pressure distribution is located at each pore. In contrast, since the vapor–liquid interface is assumed to be located at the center of the throat, thermal network nodes for calculating the temperature distribution are arranged at each pore, as well as at the throat and solid.
The governing equations of pore network simulation are based on the following assumptions. In the porous structure, the capillary force is much greater than the gravity [16], and heat transfer between the solid and fluid occurs very rapidly. Based on the criterion presented by Kim and Jang [17], the local thermal equilibrium is satisfied. So, the gravity effect is neglected, and the local thermal equilibrium between the solid phase and the vapor or liquid is assumed. In addition, incompressible laminar flow and steady state are assumed. The temperature distribution was analyzed on the energy balance using the heat diffusion equation, as given by
k e f f T = 0
where keff and T are the effective thermal conductivity and temperature, respectively. As shown in Equation (1), only the conductive heat transfer was considered. The effective thermal conductivity model was applied using the series model and the porosity, as described by
k e f f , f = 1 ε k s + ε k f ,   where   ε = d k f d k s + d k f
k e f f = k e f f , f k s 1 ε k e f f , f + ε k s
where dkf, dks, keff, keff,f, kf, ks, and ε are fluid distance between two thermal nodes, solid distance between two thermal nodes, effective thermal conductivity of porous material, effective thermal conductivity of fluid, thermal conductivity of fluid and solid, and porosity, respectively.
The pressure distribution was analyzed on the mass balance using the continuity equation. Previous researchers [13,14] applied Poiseuille flow or Darcy flow to express fluid velocity. The continuity equation and fluid velocity between two nodes in a pore network are given by
u = 0
u i j = G μ P i P j d i j
where d, G, P, u , and μ are the distance between two hydraulic nodes, hydraulic conductance, pressure, fluid velocity, and fluid dynamic viscosity, respectively. The subscript j is the direction of each node and ranges between 1 and 4. It corresponds to the north, east, south, and west directions, respectively. By combining Equations (4) and (5), the governing equation for the pressure distribution, which is expressed in terms of pressure, can be obtained by
G μ P = 0
The hydraulic conductance depends on the flow model. The hydraulic conductance of each flow model can be defined by
G P o i s e u i l l e = D h 2 32
G D a r c y = K
where Dh, GDarcy, GPoiseuille, and K are hydraulic diameter, hydraulic conductance of Darcy flow, hydraulic conductance of Poiseuille flow, and permeability, respectively.
To numerically analyze the governing equations, they should be transformed into a discretized form in a square lattice, as shown in Figure 1b. Equations (1) and (6) can be discretized and transformed, as given by
j = 1 4 k e f f T i T j d i j * S i j * = 0
j = 1 4 ρ i j D h 2 32 μ i j P i P j d i j S i j = 0
where d*, S, S*, and ρ are the distance between two thermal nodes, cross-section area, heat transfer area, and fluid density, respectively. Equation (10) is derived by using the hydraulic conductance of Hagen–Poiseuille flow to validate the numerical model with the results of Figus et al. [13], since they assumed the flow within the porous medium to be channel flow. Additionally, the flow induced by latent heat and saturation pressure at the vapor–liquid interface must be considered. If the vapor–liquid interface is located on the west side, Equation (10) can be modified, as given by
j = 1 3 ρ i j D h 2 32 μ i j P i P j d i j S i j + ρ 4 D h 2 32 μ 4 P P s a t d 4 * + 1 h f g T v T s a t d * T s a t T l d * S 4 = 0
P s a t = P r e f exp h f g R 1 T s a t 1 T r e f
where hfg, Pref, Psat, R, Tref, Tsat, Tl, and Tv are the latent heat of vaporization, reference pressure, saturation pressure, gas constant, reference temperature, saturation temperature, liquid temperature, and vapor temperature, respectively. In Equation (12), Tsat is equal to the temperature of the vapor–liquid interface since vaporization is assumed to occur at the vapor–liquid interface.
Each boundary condition is applied to the edges of the computation domain.
k e f f T y = q , P y = 0   a t   y = L y , 0 < x < L f i n
T y = 0 , P v = P g r   a t   y = L y , L f i n < x < L i n t
T l = T g r , P l y = 0   a t   y = L y , L i n t < x < L x
T x = 0 , P x = 0   a t   x = 0 , x = L x
T l = T c c , P l = P c c ( a t y = 0 )
where Pcc, Pgr, Tcc, Tgr, and q are the pressure of the compensation and vapor groove, the temperature of the compensation chamber and vapor groove, and heat flux, respectively. At y = Ly and 0 < x < Lfin, it is assumed that the heat flux enters without considering the thermal resistance of the metallic fin and there is no fluid flow. As the vapor region grows, the top part of the wick is divided into a vapor region and a liquid region. At Lfin < x < Lint, it is assumed that this region is a vapor region with no temperature gradient, and the pressure is equal to the pressure in the vapor groove. At Lint < x < Lx, the liquid temperature is equal to the temperature of the vapor groove and there is no fluid flow into the vapor groove. Since the computational domain is determined considering the symmetric part of the evaporator, symmetric boundary conditions are applied to both east and west sides. The bottom of the wick is assumed to be in contact with the compensation chamber, so its temperature and pressure are assumed to be equal to those of the compensation chamber. At the vapor–liquid interface, the continuity conditions for the vapor and liquid phases can be defined by
ρ l u l n = ρ v u v n
To solve the governing equations in PDE form, iterative calculations are required until convergence is achieved. Initially, the wick is assumed to be fully saturated with liquid, except under the fin. This allows the vapor to escape from the fin. Then, the effective thermal conductivity distribution and the temperature distribution are obtained by Equation (3) and Equation (9), respectively. Based on the temperature distribution, the pressure distribution is calculated by Equations (10) and (11). At the vapor–liquid interface, the pressure is assumed to be the average of the two hydraulic nodes, and it is also considered the saturation pressure corresponding to the thermal network node located at the vapor–liquid interface. Temperature and pressure distribution are iteratively determined by repeating the process until the change in each distribution converges to less than 10−3. When the temperature and pressure distributions converge, the vapor invasion takes place by comparing the pressure difference across the vapor–liquid interface and the capillary pressure. The capillary pressure at each bond is defined by the Young–Laplace equation, as given by
P c a p = 2 σ r e f f cos θ
where Pcap, reff, σ, and θ are capillary pressure, effective pore radius, surface tension of fluid, and contact angle, respectively. It is assumed that the fluid fully wets the solid, so the contact angle is assumed to be zero. If the pressure difference across the vapor–liquid interface exceeds the capillary pressure defined by Equation (19), the vapor–liquid interface invades. Since the phase distribution has changed, the process returns to Equation (3) and repeats the same procedure until there is no more vapor–liquid interface invasion.

2.2. Modified Pore Network Simulation Model

The pore network model presented by Figus et al. [13] assumed constant temperature and pressure in the vapor groove regardless of heat flux, as given by
T g r = 30   C ,   T c c = 26   C P g r = P s a t T g r , P c c = P g r 40 Pa
However, the temperature and pressure in the vapor groove are expected to increase with heat flux, especially under high heat flux conditions. Therefore, it is important to determine the temperature and pressure in the vapor groove as a function of heat flux. The working fluid that vaporized at the vapor–liquid interface passes through the vapor zone and exits the wick through the vapor throat region defined by y = Ly, Lint < x < Lfin. The mass flux leaving the wick through the vapor throat depends on the heat flux, and the vapor pressure drop can be determined by
m ˙ = 1 h f g k e f f , v T v T s a t d * k e f f , l T s a t T l d * = K ν v Δ P v d v
where dv, m ˙ , ΔPv, and νv are distance from the vapor–liquid interface to the vapor throat, phase change mass flux, vapor pressure drop from the vapor–liquid interface to the vapor groove, and kinematic viscosity of vapor, respectively. The vapor groove temperature Tgr is the saturation temperature corresponding to Pgr, and Pgr can be expressed as given by
P g r = P ¯ i n t Δ P v ,   T g r = T s a t P g r
P ¯ i n t = 1 l i n t P i n t d l
where lint, and Pint are the vapor–liquid interface length and the pressure at the vapor–liquid interface, respectively. The thermal boundary condition at the vapor throat presented by Figus et al. [13] is an adiabatic condition, as expressed in Equation (15). The vapor exiting the wick through the vapor throat determines the temperature and pressure in the vapor groove. Therefore, the temperature and pressure of the vapor throat region are defined as Tgr and Pgr. For the region Lint < x < Lx, Figus et al. [13] assumed the temperature equals Tgr, as given by Equation (16). In the present model, the convective heat transfer effect from the vapor groove was considered, so the modified thermal boundary conditions are defined by
T v = T g r   A t   y = L y , L f i n < x < L i n t
k e f f T y = h c T g r T   A t   y = L y , L i n t < x < L x
where hc is the convective heat transfer coefficient. The convective heat transfer coefficient was calculated based on Nu = 4.36 under constant heat flux conditions in laminar flow.
For application under high heat flux conditions, a screen mesh wick with higher permeability was applied instead of a sintered wick. However, the pore network model presented by Figus et al. [13] cannot represent complex porous media, such as a screen mesh wick, since it was based on a circular channel. To model the screen mesh wick, a pore network model applying the porous medium approach at the pore scale is presented. This approach allows a simplified representation of the complex geometry of the screen mesh wick, and the pressure distribution can be solved using the hydraulic conductance of Darcy flow. An effective thermal conductivity model is applied to the present model presented by Chang et al. [18], as given by
k e f f = k f 1 + A 2 α 2 A α A α π B 1 k f / k s / 2 + 2 [ 1 + A 1 α ] α π B 1 k f / k s / 4 + [ 1 + A 1 α ] 2 where   A = D W , B = D t ,   π d 2 t α 1 + W D
where D, t, and W are wire diameter, thickness of a layer of screen mesh wick, and wire separation distance, respectively. The constant α has the lower limit, which corresponds to the minimum solid volume fraction, and the upper limit, which corresponds to the maximum solid volume fraction.
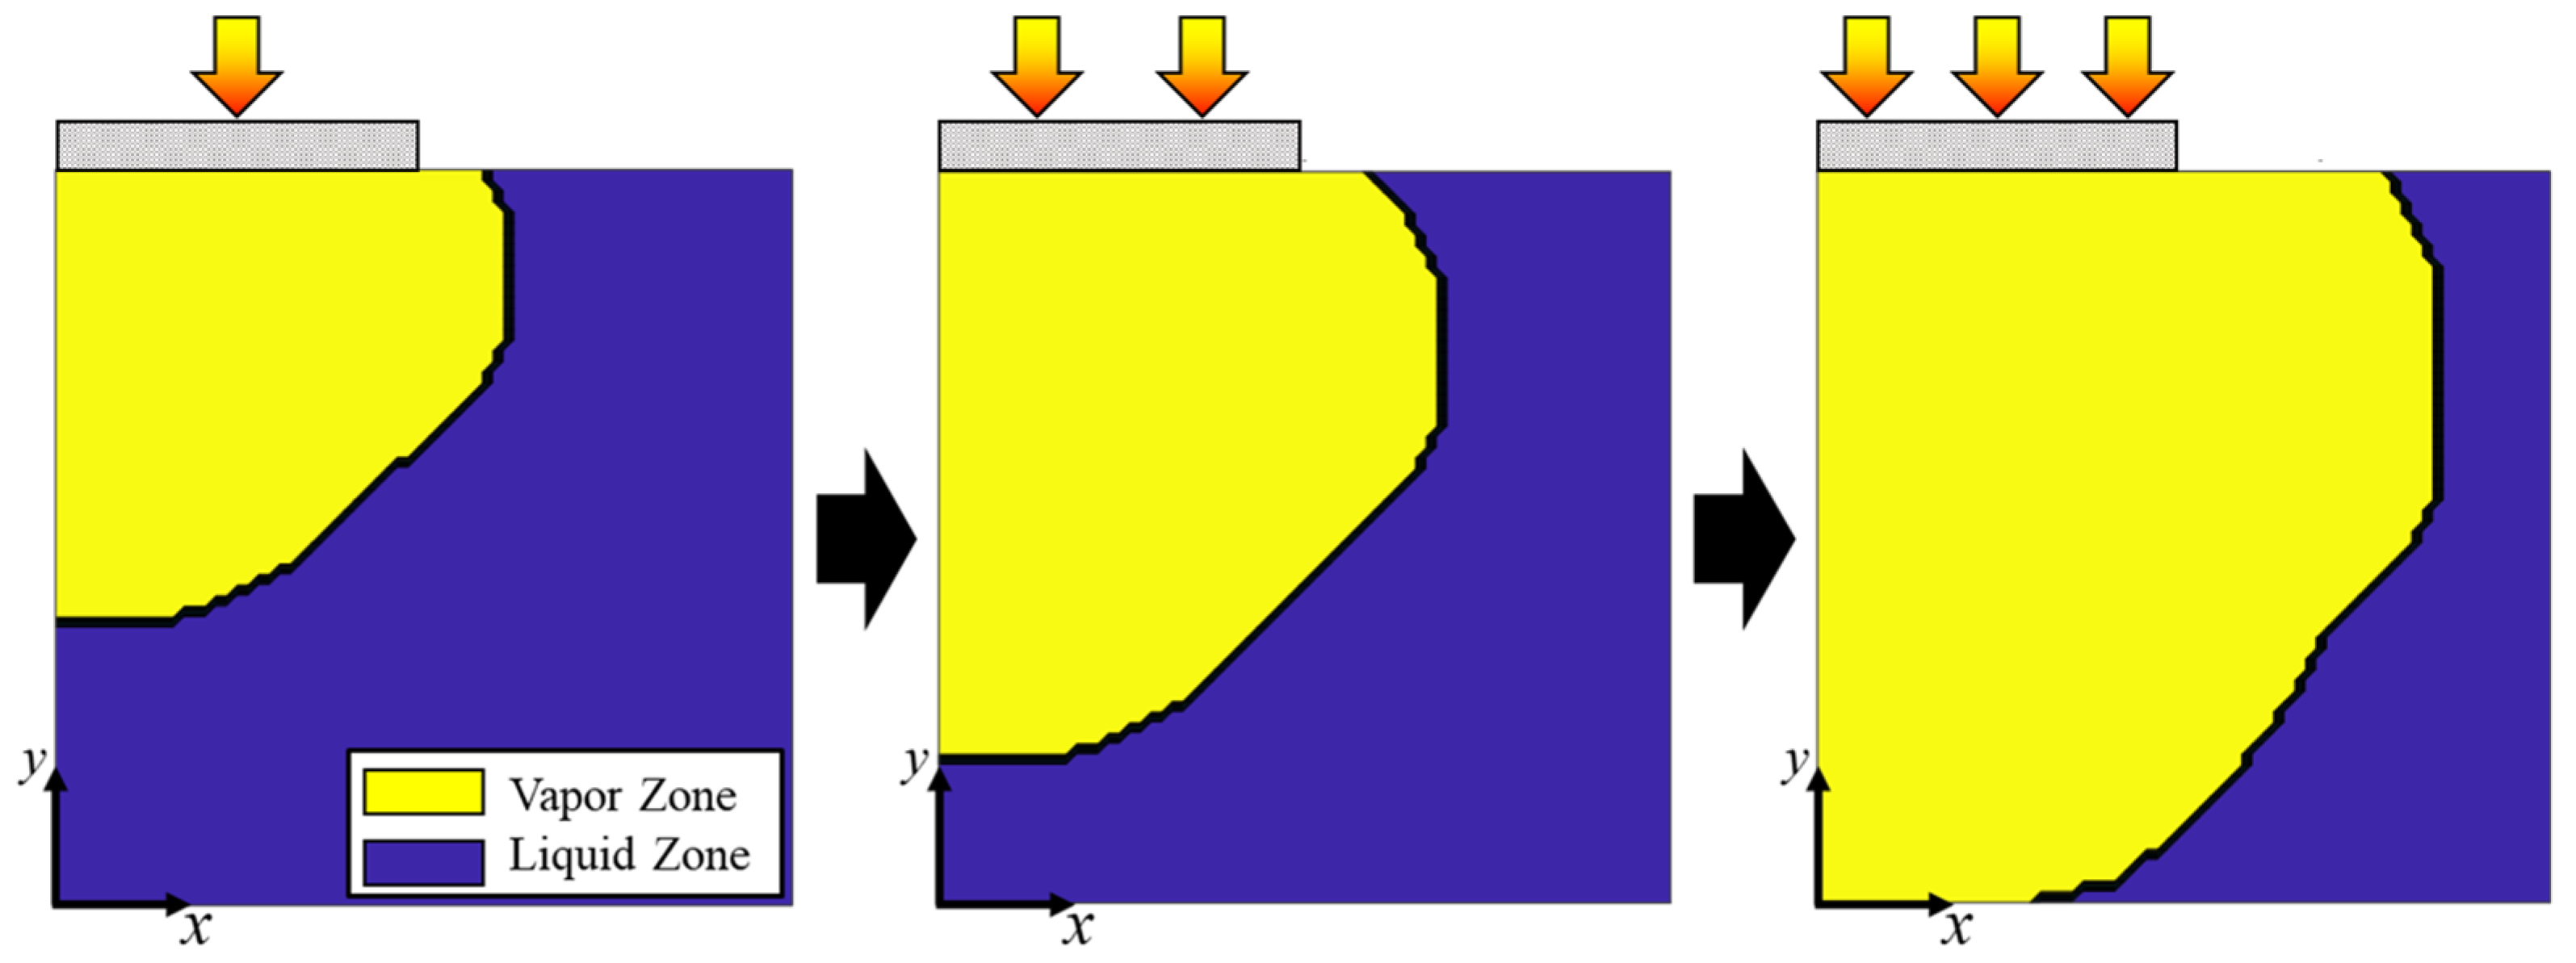
The vapor–liquid interface position inside the wick was investigated, and the maximum heat transfer rate was estimated by identifying the onset of dry-out. As shown in Figure 2, the vapor region within the wick expands as the input heat transfer rate increases and the dry-out occurs, as illustrated on the right side of Figure 2.

3. Experimental Study

3.1. Fabrication of Multiscale Wicks

Although reducing the effective pore radius is effective for enhancing the capillary performance of the wick, there is a limit to this improvement because the permeability also decreases as the effective pore radius becomes smaller. The multiscale wick can overcome this limitation by forming sub-pores through the sintered particles within the wick, which provide a low effective pore radius while maintaining the high permeability of the screen mesh wick by preserving its main pores. To fabricate multiscale wicks, the method presented by Kang et al. [15] was used. Micro-sized SAC3035 particles (Able Metal Co., Ltd., Daegu, Republic of Korea) under 25 μm and conventional copper screen mesh wick with mesh number 100 (M100) were used in the experiment. For the fabrication of multiscale wicks, a suspension was prepared by mixing 5 wt.% SAC305 particles and 1 wt.% indium flux into ethanol. The prepared suspension was sprayed onto an M100 conventional screen mesh wick heated at 185 °C to partially melt the SAC305 particles. To understand the effects of the sintered weight fraction (SWF) on the characteristics of the multiscale wicks, two types of multiscale wicks were fabricated with SWFs of 3.14 wt.% and 5.27 wt.%. The SWF is defined by
SWF   [ wt . % ] = m p a r t i c l e s m m e s h × 100
where mmesh and mparticles are the mass of the conventional screen mesh wick and micro-sized particles sintered on the wick, respectively.

3.2. Measurement of Wick Characteristics

To measure the characteristics of multiscale wicks, the rate-of-rise method, which measures the height or weight of the fluid absorbed by the wick over time [15,19], was used. For the precise measurement of wick parameters, the equation formulated by Kang et al. [15], which enables the measurement of wick characteristics by measuring the mass of the fluid absorbed in the wick over time, was used in this study, as given by
y = 2 σ ε ρ A w i c k 2 μ K r e f f x ρ 2 A w i c k g K μ = β x ρ 2 A w i c k g K μ where   β = 2 σ ε ρ A w i c k 2 μ K r e f f , A w i c k = 2 t w i c k L w i c k , x = 1 m a b s , y = d m a b s d t
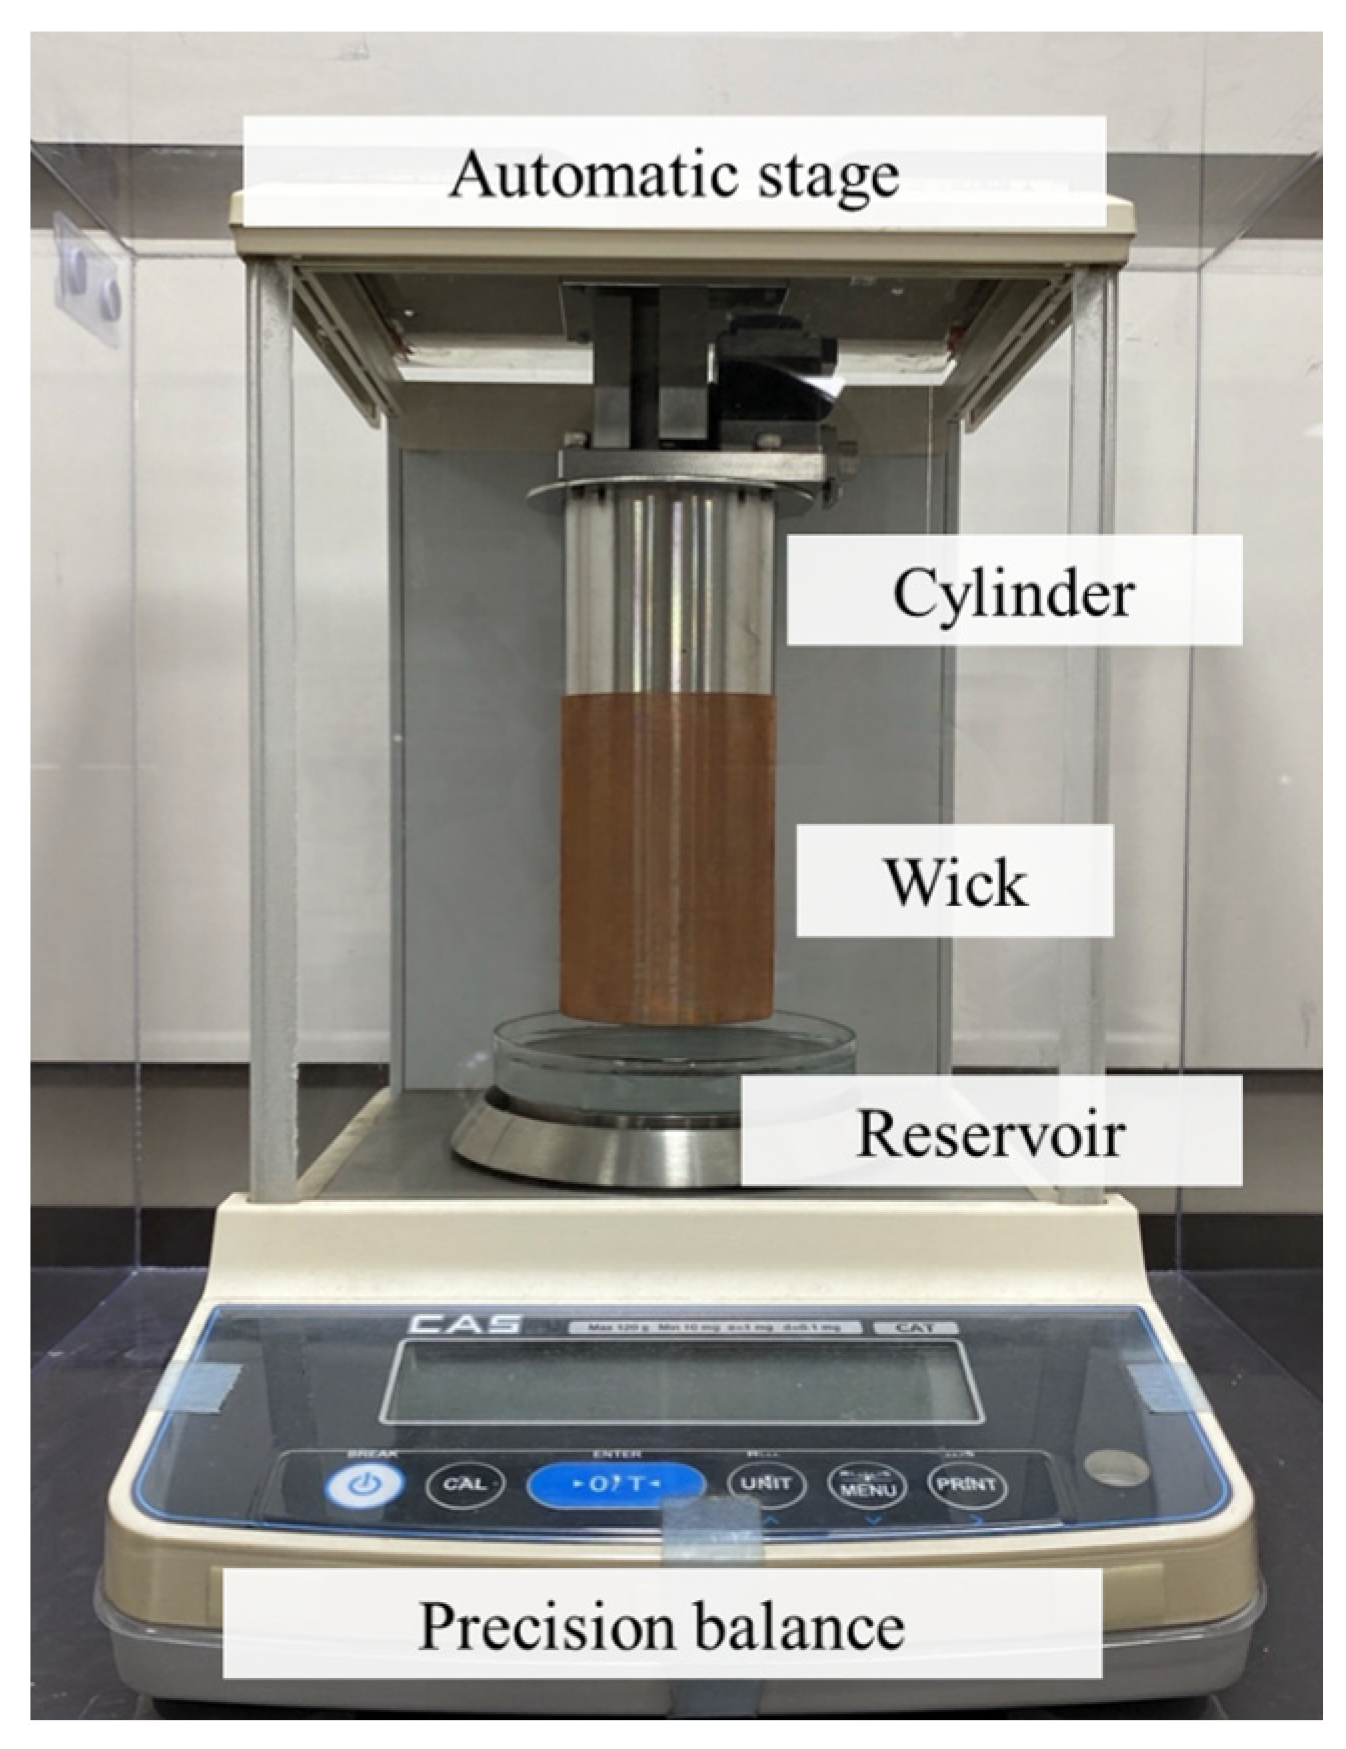
where Awick, Lwick, mabs, twick, and β are the cross-sectional area of the wick, length of wick, mass of fluid absorbed by the wick, wick thickness, and slope, respectively. By using a precision balance, the mass of fluid absorbed by the wick was measured. Since dmabs/dt is linear in 1/mabs, β can be determined by the experimental device, as shown in Figure 3.
The experimental device is in an acrylic box to maintain 100% relative humidity. Using an automatic stage, the wick attached to the cylinder made contact with the working fluid in the reservoir. Then, the working fluid absorbed into the wick over time, and the mass of fluid absorbed by the wick was measured with a precision balance (CAS, CATY-124, Seoul, Republic of Korea) when the absorption stopped.
The porosity, which is the ratio of the pore volume to the total volume, could be calculated by Equation (29).
ε = V p o r e V t o t a l = m f ρ f m f ρ f + m m e s h ρ m e s h + m p a r t i c l e ρ p a r t i c l e
where mf, mmesh, mparticle, Vpore, Vtotal, ρf, ρmesh, and ρparticle are the mass of the fluid, mesh wick, and micro-sized particle; the pore volume and total volume; and the density of the fluid, mesh wick, and micro-sized particle, respectively.
The effective pore radius was determined by the balance of capillary pressure and hydrostatic pressure, as given by
r e f f = 2 σ ρ g h
Since β is determined by the experimental device, the permeability was determined by using Equation (28).
K = μ r e f f 2 σ ε ρ A w i c k 2 × β
The relative uncertainty of the effective pore radius and the permeability can be obtained by
U r e f f r e f f = U H H 2
U K K = U C P C P 2 + U r e f f r e f f 2
where UH, UK, and Ureff are uncertainties of the wicking height, permeability, and effective pore radius, respectively. Each uncertainty was obtained by the bias and precision errors, as given by
U i = B 2 + t λ , 95 % p 2 ,   where λ = n 1 , i = Δ m , h
where B, n, p, tλ,95%, and λ are bias error, number of repeated measurements, precision error, value of t-distribution within 95% confidence level, and degrees of freedom, respectively. The uncertainty of the experimental setup was obtained by measuring the wicking performance for the conventional screen mesh five times. The bias error and precision error were calculated based on the equipment uncertainty and the standard deviation of the experimental results, respectively. Finally, the uncertainties for the effective pore radius and permeability are 1.01% and 3.42%, respectively.

4. Results and Discussion

4.1. Validation Results

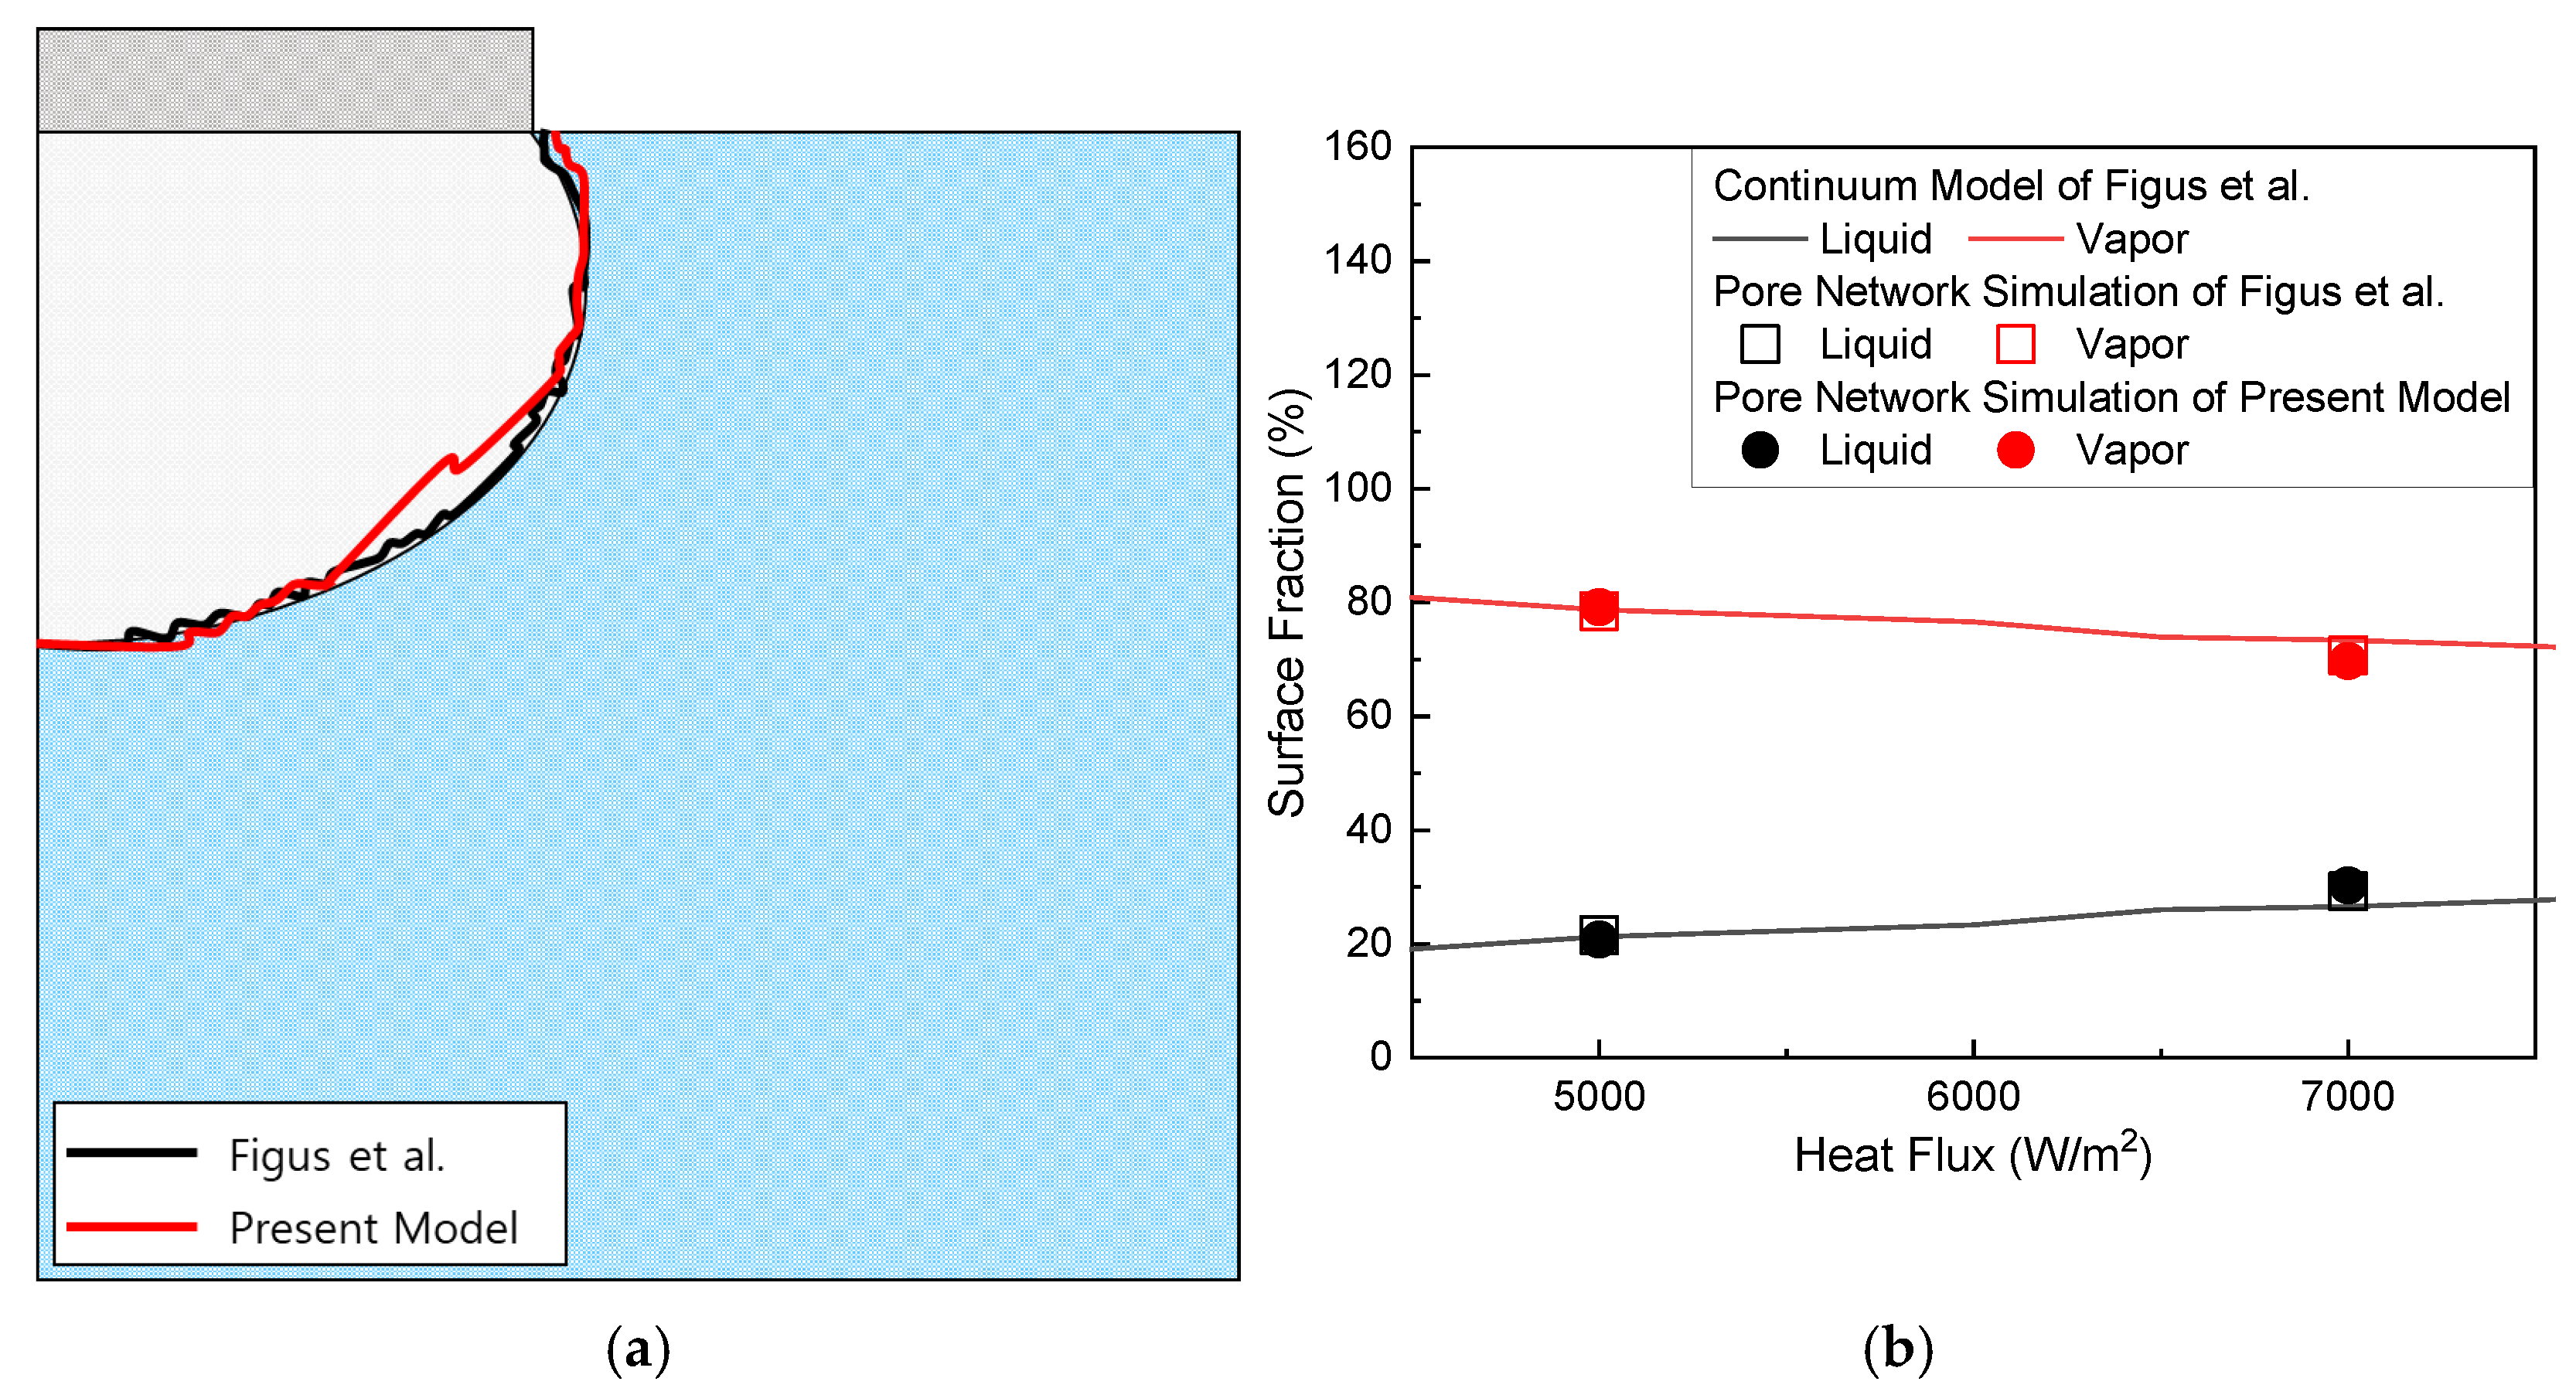
The pore network simulation model used in this study was validated through comparison with the results presented by Figus et al. [13] using the same networks. The hydraulic and thermal network nodes consist of 99 × 99 and 199 × 199, respectively. The geometric parameters of the wick and working fluid properties are shown in Table 1. Figure 4a shows the validation results of the vapor–liquid interface position for q = 5000 W/m2. Figure 4b shows the vapor zone and liquid zone surface fraction, which is expressed as a ratio of the corresponding area to the total area of the control surface as a function of heat flux. Also, it is shown that the present model is well matched with Figus et al. [13].

4.2. Wick Characteristics of Multiscale Wicks

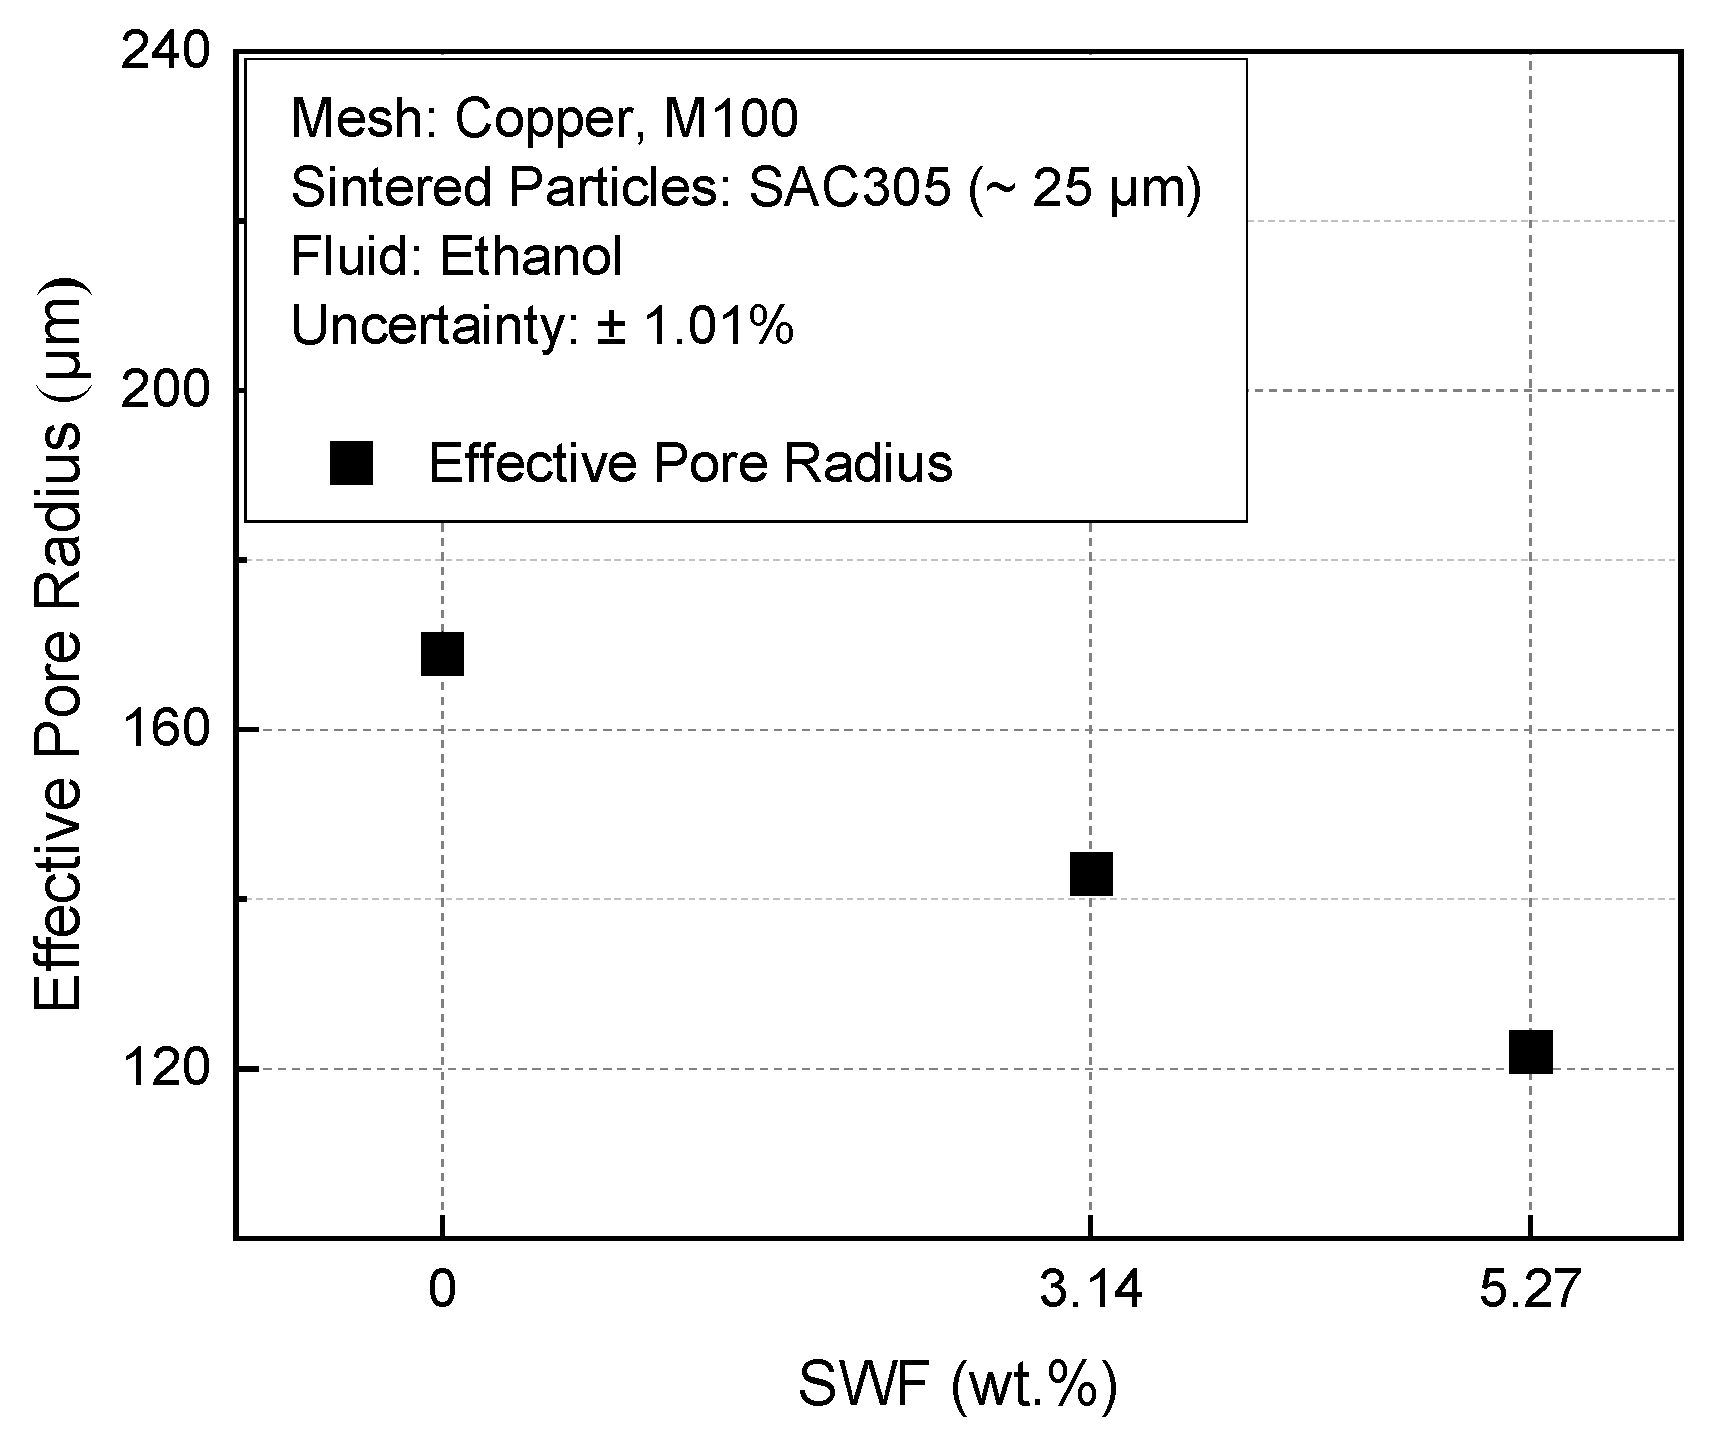
Figure 5 shows the effective pore radius of conventional screen mesh wick (M100) and multiscale wicks with SWFs of 3.14 wt.% and 5.27 wt.%. The effective pore radius proportionally decreased with the increase in SWF. It is shown that the sub-pores formed by sintering SAC305 particles at the edge of the main pores of the screen mesh wick improved the capillary pressure. Consequently, the effective pore radius was rapidly reduced in the multiscale wick, showing a maximum reduction of 38.5% at 5.27 wt.% compared to the conventional screen mesh wick.
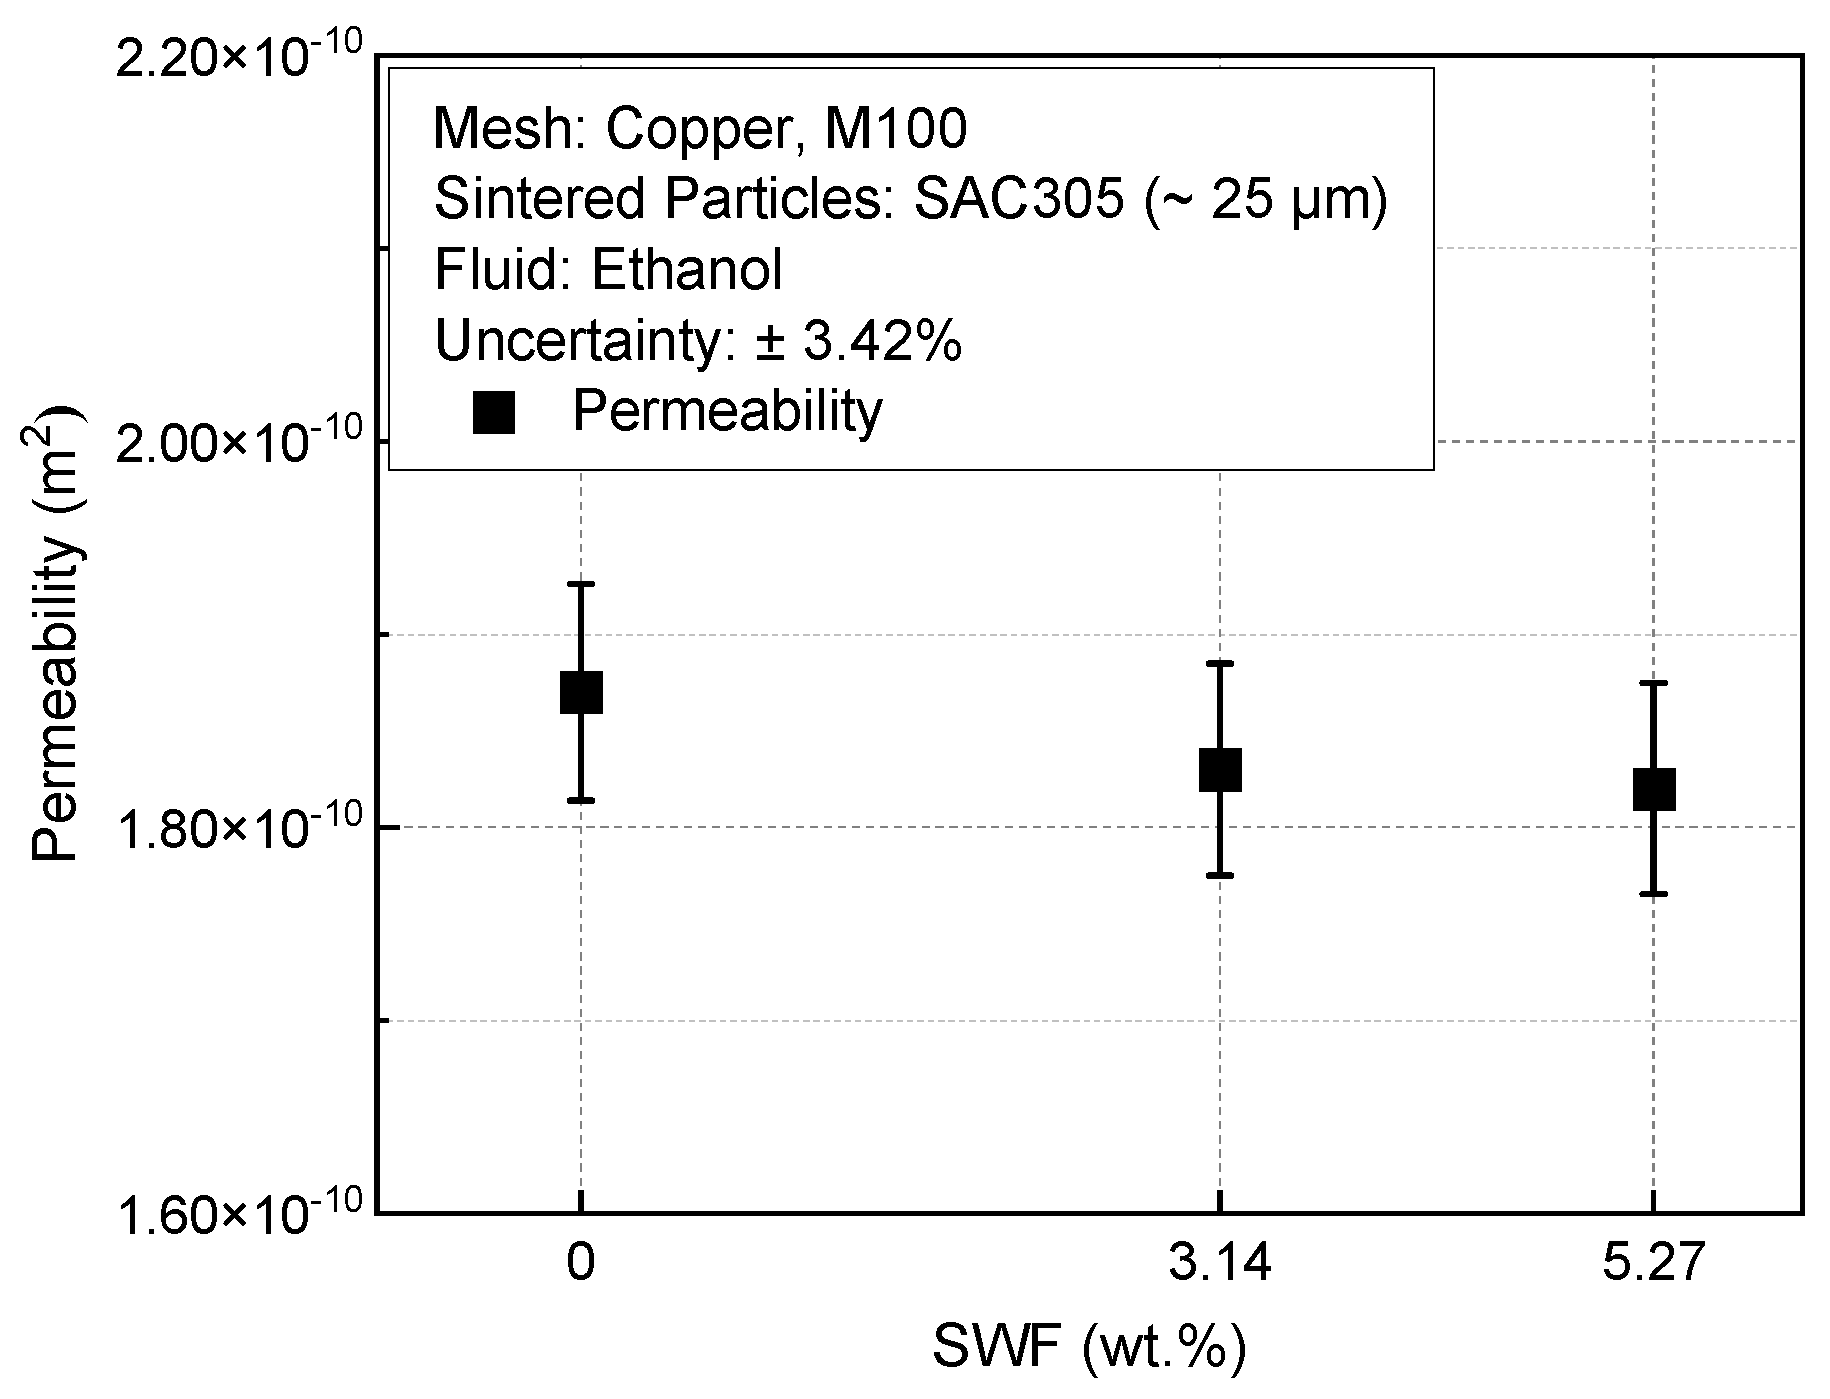
Figure 6 shows the permeability of the conventional screen mesh wick and the multiscale wicks as a function of SWF. Although the permeability decreases as the SWF increases, it is reduced by only approximately 2% compared to the conventional screen mesh wick, which contrasts with the results of the effective pore radius measurements. This is because the main pores of the screen mesh wick are not significantly reduced by the sintered SAC305 particles.

4.3. Effect of Evaporator Parameters on Maximum Heat Transfer Rate

The effects of evaporator parameters, such as fin ratio (Lfin/Lx), wick thickness, and SWF, on the maximum heat transfer rate of the evaporator in the LHP are investigated. The wick width was fixed at 3 mm, and the compensation chamber temperature was set to 50 °C. The working fluid was chosen as water, considering its compatibility with the wick material. The parameters of the copper multiscale wick and water were listed in Table 2.

4.3.1. Effect of SWF of the Multiscale Wick

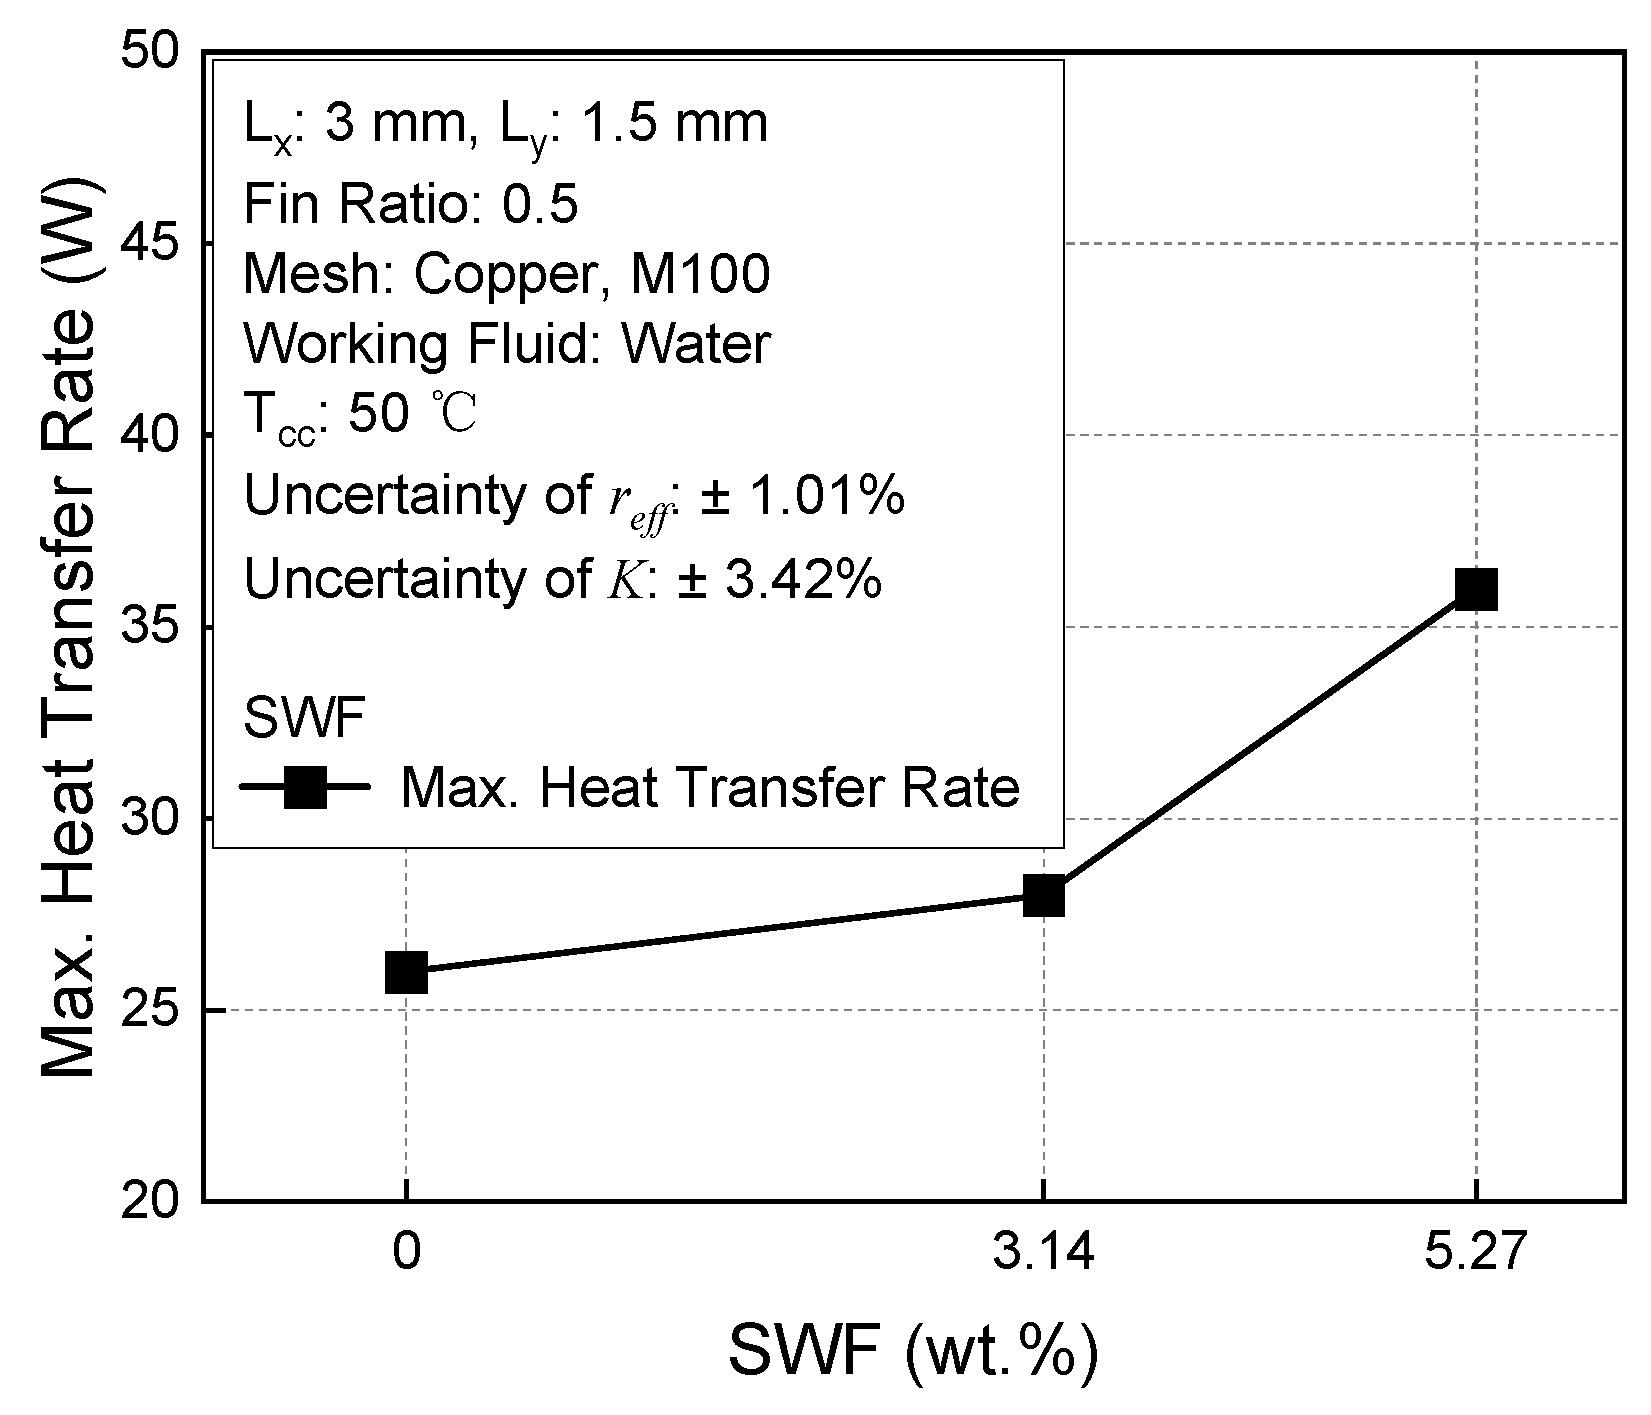
To investigate the effect of fin ratio on the maximum heat transfer rate of the evaporator in the LHP, the width and thickness of wicks and fin ratio were fixed to 3 mm, 1.5 mm, and 0.5, respectively. Water was used as a working fluid. As shown in Figure 7, the maximum heat transfer rate increases to 36 W as the SWF increases, which corresponds to a heat flux of 240 W/cm2. This increase in the maximum heat transfer rate is caused by the significant reduction in the effective pore radius of the multiscale wick, leading to enhanced capillary performance. These results indicate that applying multiscale wicks with improved capillary performance to the LHP evaporator can overcome the capillary limitation. Then, it can also achieve a higher maximum heat transfer rate compared to an LHP evaporator with a conventional screen mesh wick.

4.3.2. Effect of Fin Ratio

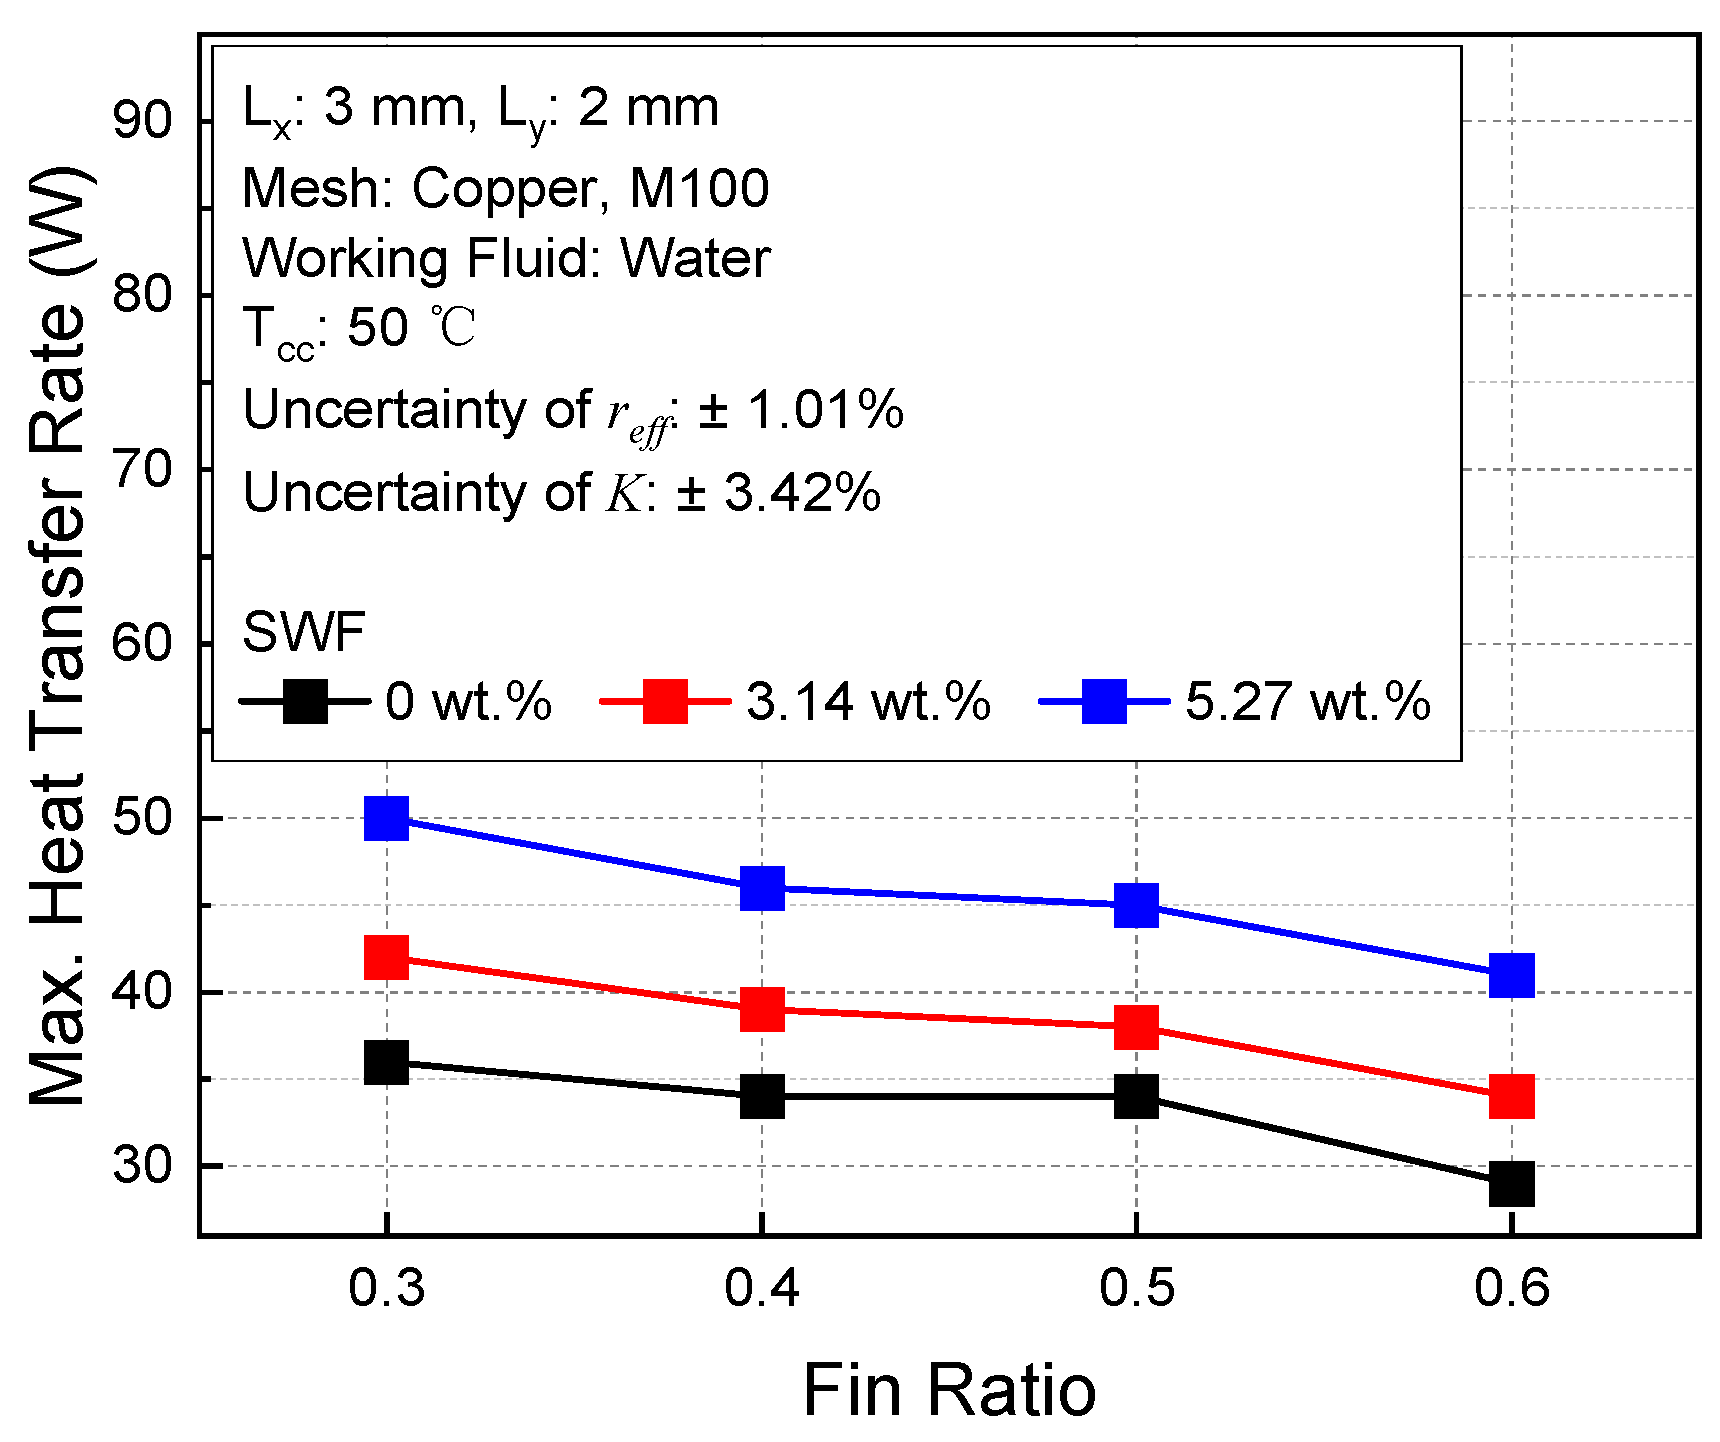
The wick characteristics of the conventional screen mesh wick and multiscale wicks and with a thickness of 2 mm were used to analyze the maximum heat transfer rate of the evaporator in the LHP according to the fin ratio (Lfin/Lx), as shown in Figure 8. The fin ratio is defined as the ratio of the fin length (Lfin) to the width of the control surface (Lx). As the fin ratio decreases, the maximum heat transfer rate of the evaporator in the LHP increases. As shown in Figure 1a, a lower fin ratio results in a larger wick–groove interface. This increase in the evaporation area at the wick–groove interface enhances the convective heat transfer. Also, the enlarged cross-sectional area of the vapor groove reduces the vapor pressure drop, which improves the wicking capability of the wick and further contributes to the increase in the maximum heat transfer rate. As a result, when the fin ratio is the smallest at 0.3, the maximum heat transfer rate reaches 50 W, which corresponds to a heat flux of 555.5 W/cm2. Moreover, depending on SWF, the maximum heat transfer rate difference between 5.27 wt.% and conventional screen mesh wick showed an improvement of 38.8%. So, the maximum heat transfer rate increased by up to 38.8% as the SWF increased, while a maximum improvement of 24.1% was observed with respect to the fin ratio. These results show that the enhancement in capillary performance due to the increased SWF has a more significant effect on the maximum heat transfer rate than the expansion of the steam space (vapor groove) associated with fin geometry.

4.3.3. Effect of Wick Thickness

Figure 9 shows the effect of wick thickness on the maximum heat transfer rate of the evaporator in the LHP with multiscale wicks, based on the wick characteristics of the conventional screen mesh wick and multiscale wicks with a fin ratio of 0.3. The maximum heat transfer rate increases drastically as the wick thickness increases. As the wick thickness increases, the available distance for the vapor region becomes longer, which delays the dry-out. Therefore, at a wick thickness of 2.5 mm, dry-out is significantly delayed, allowing the maximum heat transfer rate to reach 72 W, which corresponds to a heat flux of 800 W/cm2. Depending on SWF, an improvement of 50% was shown in Figure 9. As described in Section 4.3.2, the effect of SWF on fin ratio resulted in a maximum improvement of 38.8%, whereas the effect of SWF on wick thickness led to a larger improvement of 50%. It means that the coupling effect between SWF and wick thickness has a greater influence on the maximum heat transfer rate.

5. Conclusions

In this paper, the maximum heat transfer rate of the evaporator in the LHP with multiscale wicks was numerically and experimentally investigated by considering the vapor–liquid interface within the wick of the LHP evaporator under high heat flux conditions using the pore network simulation. The numerical model was validated with the results of Figus et al. [13] in the same conditions. Based on the validated numerical model, the boundary conditions were modified to consider the high heat flux conditions. Also, to predict the flow of the working fluid within the multiscale wick, a porous medium approach was applied at the pore scale to the numerical model. The multiscale wicks with SWF of 3.14 wt.% and 5.27 wt.% were fabricated to enhance the capillary performance of the LHP evaporator. Then, the wick characteristics of the multiscale wicks were experimentally measured by using the rate-of-rise method. As a result, the multiscale wick showed a decrease of up to 38.5% in the effective pore radius, while the permeability decreased by only 2% compared to the conventional screen mesh wick. Using the modified pore network simulation model and the experimental results, a parametric study was conducted on the evaporator parameters, such as the SWF, fin ratio, and wick thickness. As the SWF increased, the maximum heat transfer rate of the LHP evaporator increased due to the enhanced capillary performance of the multiscale wicks. An increase in fin ratio led to a reduction in the maximum heat transfer rate due to the decreased wick–groove interface and smaller cross-sectional area of the vapor groove, which limits evaporation and increases vapor flow resistance. With a 5.27 wt.% SWF, the multiscale wick improved the maximum heat transfer rate by 38.8% over the conventional screen mesh wick. Also, it was shown that increasing the wick thickness expanded the available distance for vapor growth, which led to an improvement in the maximum heat transfer rate. A maximum heat transfer rate improvement of up to 50% was achieved as SWF increased. This enhancement was more significant when combined with increased wick thickness than with fin ratio, highlighting the dominant role of the SWF–wick thickness interaction. Finally, the LHP evaporator with the multiscale wicks, having a SWF of 5.27 wt.%, a fin ratio of 0.3, and a wick thickness of 2.5 mm, achieved a maximum heat transfer rate of 72 W, corresponding to a heat flux of 800 W/cm2. The modified pore network simulation model and multiscale wicks presented in this study are expected to be applicable for determining the optimal design to maximize the cooling performance of LHPs under high heat flux conditions.

Author Contributions

Conceptualization, S.J. and S.P.J.; Methodology, S.J. and S.P.J.; Validation, S.J.; Formal analysis, S.J. and S.Y.K.; Investigation, S.J., S.Y.K. and H.S.M.; Resources, S.J.P.; Data curation, S.J., S.Y.K. and S.J.P.; Writing—original draft, S.J.; Writing—review & editing, S.Y.K. and S.P.J.; Supervision, S.P.J.; Project administration, S.P.J. All authors have read and agreed to the published version of the manuscript.

Funding

This research received no external funding.

Data Availability Statement

The original contributions presented in this study are included in the article. Further inquiries can be directed to the corresponding author.

Acknowledgments

This work was supported by the Korea Research Institute for defense Technology planning and advancement (KRIT) grant funded by the Korean government (DAPA (Defense Acquisition Program Administration)) (KRIT-CT-22-022, Ultra-High-Flux Cooling System Research Laboratory, 2025).

Conflicts of Interest

The authors declare no conflicts of interest.

Nomenclature

AwickCross-sectional area of wick [m2]
BBias error
DWire diameter [m]
DhHydraulic diameter [m]
dHydraulic distance [m]
dkfFluid thermal distance [m]
dksSolid thermal distance [m]
d* Thermal distance [m]
GHydraulic conductance [m2]
gGravitational acceleration [m/s2]
hHeight of the fluid absorbed in the wick [m]
hcConvective heat transfer coefficient [W/m2·K]
hfgLatent heat of vaporization [J/kg]
KPermeability [m2]
kThermal conductivity [W/m∙K]
keffEffective thermal conductivity of porous material [W/m∙K]
keff,fEffective thermal conductivity of fluid [W/m∙K]
kfThermal conductivity of fluid [W/m∙K]
ksThermal conductivity of solid [W/m∙K]
LfinFin width [m]
LintVapor–liquid interface width [m]
LwickLength of wick [m]
LxWick width [m]
LyWick thickness [m]
lintLength of the vapor–liquid interface [m]
mMass [kg]
mabsMass of fluid absorbed by the wick [kg]
n Unit normal vector
PPressure [Pa]
ΔPPressure drop [Pa]
qHeat flux [W/m2]
RGas constant [J/kg∙K]
SCross-sectional area [m2]
S* Heat transfer area [m2]
TTemperature [K]
twickWick thickness [m]
UUncertainty
uVelocity [m/s]
WWire separation distance [m]
Greek Symbols
αConstant
βSlope
εPorosity
μViscosity [Pa∙s]
νKinematic viscosity [m2/s]
θContact angle [rad]
ρDensity [kg/m3]
Subscripts
absAbsorbed in the wick
capCapillary
ccCompensation chamber
effEffective
grVapor groove
intVapor–liquid interface
lLiquid
meshConventional screen mesh wick
particlesSintered particles on the wick
refReference
satSaturation
sSolid
vVapor
xx-directional coordinate
yy-directional coordinate

References

  1. Abdoli, A.; Jimenez, G.; Dulikravich, G.S. Thermo-fluid analysis of micro pin-fin array cooling configurations for high heat fluxes with a hot spot. Int. J. Therm. Sci. 2015, 90, 290–297. [Google Scholar] [CrossRef]
  2. Zhang, L.-Y.; Zhang, Y.-F.; Chen, J.-Q.; Bai, S.-L. Fluid flow and heat transfer characteristics of liquid cooling microchannels in LTCC multilayered packaging substrate. Int. J. Heat Mass Transf. 2015, 84, 339–345. [Google Scholar] [CrossRef]
  3. Khandekar, S.; Sahu, G.; Muralidhar, K.; Gatapova, E.Y.; Kabov, O.A.; Hu, R.; Zhao, L. Cooling of high-power LEDs by liquid sprays: Challenges and prospects. Appl. Therm. Eng. 2021, 184, 115640. [Google Scholar] [CrossRef]
  4. Lee, Y.J.; Kim, S.J. Experimental investigation on thermal-hydraulic performance of manifold microchannel with pin-fins for ultra-high heat flux cooling. Int. J. Heat Mass Transf. 2024, 224, 125336. [Google Scholar] [CrossRef]
  5. Wu, Z.; Xiao, W.; Song, B. Efficient thermal management of high-power electronics via jet-enhanced HU-type manifold microchannel. Int. J. Heat Mass Transf. 2023, 221, 125113. [Google Scholar] [CrossRef]
  6. Cui, Q.; You, Z.; Ni, Y.; Yang, X.; Zhou, Y.; Wei, J.; Liu, J. A comprehensive review of loop heat pipe: From fundamental re-searches to applications. Int. J. Heat Fluid Flow 2025, 115, 109880. [Google Scholar] [CrossRef]
  7. Ku, J.; Birur, G.C. Testing of a loop heat pipe with two evaporators and two condensers. In Proceedings of the 31st International Conference on Environmental Systems, Orlando, FL, USA, 31 July 2001. [Google Scholar]
  8. Ku, J.; Ottenstein, L.; Rogers, P.; Cheung, K.; Obenschain, A.F. Investigation of capillary limit in a loop heat pipe. In Proceedings of the 12th International Heat Transfer Conference, Grenoble, France, 18–23 August 2002. [Google Scholar]
  9. Caruana, R.; Guilizzoni, M. Modeling of Conventional Heat Pipes with Capillary Wicks: A Review. Energies 2025, 18, 2213. [Google Scholar] [CrossRef]
  10. Sudhakar, S.; Weibel, J.A.; Zhou, F.; Dede, E.M.; Garimella, S.V. The role of vapor venting and liquid feeding on the dryout limit of two-layer evaporator wicks. Int. J. Heat Mass Transf. 2020, 148, 119063. [Google Scholar] [CrossRef]
  11. Bai, L.; Lin, G.; Zhang, H.; Wen, D. Mathematical modeling of steady-state operation of a loop heat pipe. Appl. Therm. Eng. 2009, 29, 2643–2654. [Google Scholar] [CrossRef]
  12. Jung, E.G.; Boo, J.H. A Novel Analytical Modeling of a Loop Heat Pipe Employing the Thin-Film Theory: Part I—Modeling and Simulation. Energies 2019, 12, 2408. [Google Scholar] [CrossRef]
  13. Figus, C.; Le Bray, Y.; Bories, S.; Prat, M. Heat and mass transfer with phase change in aporous structure partially heated: Continuum model andpore network simulations. Int. J. Heat Mass Transf. 1999, 42, 2557–2569. [Google Scholar] [CrossRef]
  14. Mottet, L.; Coquard, T.; Prat, M. Three dimensional liquid and vapour distribution in the wick of capillary evaporators. Int. J. Heat Mass Transf. 2015, 83, 636–651. [Google Scholar] [CrossRef]
  15. Kang, S.Y.; Kim, S.H.; Park, J.; Jang, S.P. Thermal performance of a thin flat vapor chamber with a multiscale wick fabricated by SAC305/Sn58Bi micro-sized particles. Int. J. Heat Mass Transf. 2023, 212, 124305. [Google Scholar] [CrossRef]
  16. Wang, C.; Mehmani, Y.; Xu, K. Capillary equilibrium of bubbles in porous media. Proc. Natl. Acad. Sci. USA 2021, 118, e2024069118. [Google Scholar] [CrossRef] [PubMed]
  17. Kim, S.J.; Jang, S.P. Effects of the Darcy number, the Prandtl number, and the Reynolds number on local thermal non-equilibrium. Int. J. Heat Mass Transf. 2002, 45, 3885–3896. [Google Scholar] [CrossRef]
  18. Chang, W.S. Porosity and effective thermal conductivity of wire screens. J. Heat Transf. 1990, 112, 5–9. [Google Scholar] [CrossRef]
  19. Holley, B.M.; Faghri, A. Permeability and effective pore radius measurements for heat pipe and fuel cell applications. Appl. Therm. Eng. 2006, 26, 448–462. [Google Scholar] [CrossRef]
Figure 1. A schematic of the pore network simulation model in the evaporator of a LHP. (a) Control surface in the evaporator. (b) Two-dimensional pore network modeling.
Energies 18 04526 g001
Figure 2. Dry-out progress.
Energies 18 04526 g002
Figure 3. Wick characteristic measurement device.
Energies 18 04526 g003
Figure 4. Validation results with Figus et al. [13]. (a) Vapor–liquid interface at q = 5000 W/m2 (black line—Figus et al. [13]; red line—present model). (b) Comparison of surface fraction.
Energies 18 04526 g004
Figure 5. The effective pore radius of a conventional screen mesh wick and multiscale wicks according to SWF.
Energies 18 04526 g005
Figure 6. The permeability of a conventional screen mesh and multiscale wicks according to SWF.
Energies 18 04526 g006
Figure 7. Maximum transfer rate of an LHP evaporator with a conventional screen mesh and multiscale wicks according to the SWF.
Energies 18 04526 g007
Figure 8. Maximum heat transfer rate of an LHP evaporator according to the fin ratio.
Energies 18 04526 g008
Figure 9. Maximum transfer rate of an LHP evaporator according to the wick thickness.
Energies 18 04526 g009
Table 1. Parameters used for validation.
Wick properties
ParametersSpecification
Wick width (Lx)5.0 mm
Wick thickness (Ly)5.0 mm
Fin length (Lfin)2.0 mm
Porosity (ε)0.4
Effective pore radius (reff)5.0 μm
Thermal conductivity of solid (ks)0.4 W/m·K
Working fluid
ParametersSpecification
Thermal conductivity of vapor (kv)0.05 W/m·K
Thermal conductivity of liquid (kl)0.50 W/m·K
Latent heat of vaporization (hfg)1.13 × 10⁶ J/kg
Kinematic viscosity of vapor (νv)1.10 × 10⁻⁶ m2/s
Kinematic viscosity of liquid (νl)2.00 × 10⁻⁷ m2/s
Table 2. Parameters used for numerical analysis.
Wick properties
ParametersSpecification
Sintered weight fraction (SWF)0 wt.%3.14 wt.%5.27 wt.%
Effective pore radius (reff)166 μm143 μm122 μm
Permeability (K)1.87 × 10⁻¹⁰ m21.83 × 10−10 m21.82 × 10−10 m2
Porosity (ε)0.6753
Thermal conductivity of solid (ks)400 W/m·K
Working fluid
ParametersSpecification
Thermal conductivity of vapor (kv)0.02 W/m·K
Thermal conductivity of liquid (kl)0.64 W/m·K
Latent heat of vaporization (hfg)2.38 × 10⁶ J/kg
Kinematic viscosity of vapor (νv)1.26 × 10⁻⁴ m2/s
Kinematic viscosity of liquid (νl)5.53 × 10⁻⁷ m2/s
Disclaimer/Publisher’s Note: The statements, opinions and data contained in all publications are solely those of the individual author(s) and contributor(s) and not of MDPI and/or the editor(s). MDPI and/or the editor(s) disclaim responsibility for any injury to people or property resulting from any ideas, methods, instructions or products referred to in the content.