Abstract
At present, the decarbonization of the public transport sector plays a key role in international and regional policies. Among the various energy vectors being considered for future clean bus fleets, green hydrogen and electricity are gaining significant attention thanks to their minimal carbon footprint. However, a comprehensive Life Cycle Assessment (LCA) is essential to compare the most viable solutions for public mobility, accounting for variations in weather conditions, geographic locations, and time horizons. Therefore, the present work compares the life cycle environmental impact of different powertrain configurations for urban buses. In particular, a series hybrid architecture featuring two possible hydrogen-fueled Auxiliary Power Units (APUs) is considered: an H2-Internal Combustion Engine (ICE) and a Fuel Cell (FC). Furthermore, a Battery Electric Vehicle (BEV) is considered for the same application. The global warming potential of these powertrains is assessed in comparison to both conventional and hybrid diesel over a typical urban mission profile and in a wide range of external ambient conditions. Given that cabin and battery conditioning significantly influence energy consumption, their impact varies considerably between powertrain options. A sensitivity analysis of the BEV battery size is conducted, considering the effect of battery preconditioning strategies as well. Furthermore, to evaluate the potential of hydrogen and electricity in achieving cleaner public mobility throughout Europe, this study examines the effect of different grid carbon intensities on overall emissions, based also on a seasonal variability and future projections. Finally, the present study demonstrates the strong dependence of the carbon footprint of various technologies on both current and future scenarios, identifying a range of boundary conditions suitable for each analysed powertrain option.
1. Introduction
In recent years, the transport sector has been responsible for approximately 29% of total CO2 emissions in Europe, with trucks and buses accounting for 27% of this share [1]. Emissions recorded in 2022 were aligned with pre-COVID Greenhouse Gas (GHG) levels and have continued to rise since 2020 [2]. Buses, as a key component of urban transit fleets, offer significant potential for large-scale CO2 reduction through the adoption of decarbonized technologies, particularly when assessed from a life cycle perspective. Among the various powertrain options, Battery Electric Vehicles (BEVs) and Fuel Cell Electric Vehicles (FCEVs) are recognized as promising alternatives, together with emerging technologies as Hydrogen Internal Combustion Engine Vehicles (H2ICEVs), all offering no tailpipe CO2 emissions [3].
BEVs are widely regarded for their high energy efficiency, often above 85% in well-to-wheel energy conversion, and their compatibility with renewable electricity grids, which further amplifies their environmental benefits [4]. They are particularly effective in stop-and-go urban driving, where regenerative braking significantly improves overall energy recovery. Technological advances in lithium-ion batteries, coupled with decreasing costs, are making BEVs increasingly competitive in terms of total cost of ownership and operational flexibility [5]. However, a critical challenge for BEVs lies in their sensitivity to external ambient conditions. At low temperatures, battery efficiency declines, and the energy demand for cabin heating, typically supplied by electric resistive elements or heat pumps, can rival that of propulsion in winter conditions [6], and Heating, Ventilation, Air Conditioning (HVAC) systems alone may demand up to 0.25 kWh/km, or 20% of traction consumption [7]. As a consequence, the bus design often necessitates oversizing batteries, increasing both cost and weight [8].
FCEVs offer an attractive alternative under operational conditions where BEVs face thermal or range limitations. By converting hydrogen into electricity via an electrochemical fuel cell, FCEVs maintain stable performance across a broader temperature range and provide waste heat that can be used for cabin heating and battery preconditioning [9]. This capability not only reduces auxiliary loads but also contributes to improved hydrogen efficiency and vehicle range in cold climates. Integrated thermal management strategies can save up to 10% in hydrogen consumption and improve energy utilization [10,11].
In this context, H2ICEVs are also emerging as a viable technology. They can leverage existing Internal Combustion Engine Vehicle (ICEV) manufacturing chains and potentially reduce the capital cost of transitioning from traditional diesel powertrains, while still offering zero tailpipe CO2 emissions. Furthermore, hydrogen-fueled buses offer diesel-comparable refueling times and extended driving range with respect to BEVs, ensuring high vehicle availability, which is a critical factor in intensive transit operations [12]. Nevertheless, hydrogen-powered technologies face substantial deployment barriers. Infrastructure for hydrogen production, distribution, and refueling remains limited in most regions. More importantly, the life cycle environmental benefit depends heavily on how hydrogen is produced. Steam Methane Reforming (SMR)—currently the dominant pathway—has a high carbon footprint unless combined with Carbon Capture and Storage (CCS), while hydrogen from electrolysis is environmentally favorable only if powered by low-carbon electricity [13,14].
To support sustainable transport planning, it is essential to compare so-called “clean” bus alternatives using a comprehensive and scenario-sensitive methodology [15]. Life Cycle Assessment (LCA) offers a robust approach to evaluate the environmental impacts of various powertrain configurations, considering not just tailpipe emissions but also upstream fuel production, vehicle manufacturing, operation, and End-of-Life (EoL) treatment. LCA is particularly relevant for urban buses, which operate intensively over long lifespans and under widely varying temperature conditions. Yet some works highlighted the impact of varying the auxiliaries load on consumption. In particular, hybrid series bus powertrains offer better fuel economy benefits in urban applications, but HVAC loads significantly diminish these gains during extreme temperature conditions [16]. Furthermore, integrated energy management strategies can meaningfully reduce energy use across all powertrain components [17]. Regarding BEVs, Basma et al. [6] developed a detailed energy model, demonstrating that auxiliary loads could account for up to 40% of total energy consumption in winter conditions. Meanwhile, Bartłomiejczyk et al. [18] quantified the energy reduction potential from optimized auxiliary systems, underscoring the need to better model these subsystems in fleet-level assessments. O’Boyle et al. [19] showed that route gradient and thermal demands strongly influence FCEV energy performance, particularly in cold climates where fuel cell systems are advantaged. In addition, Broatch et al. [10] showed that FCEVs can use residual fuel cell heat to reduce HVAC energy demand, thereby enhancing cold-weather efficiency.
However, few LCA studies to date have explicitly incorporated the influence of external climate conditions on auxiliary energy consumption. Zacharof et al. [20] analyzed the impact of ambient conditions and passenger capacity on CO2 emissions of a diesel bus, revealing significant annual variation due to HVAC use and identifying a correlation between temperature, solar radiation, passenger load, and emissions. To the best of the authors’ knowledge, no previous studies have specifically investigated the impact of auxiliary systems on the lifecycle CO2 emissions of BEVs or hydrogen-powered powertrains.
Against this backdrop, the present study performs a detailed LCA of five powertrain configurations for a 12-m urban bus: a conventional diesel ICEV, three series hybrid electric vehicles powered by diesel or hydrogen, featuring either an Internal Combustion Engine (ICE) or a Fuel Cell (FC) as Auxiliary Power Unit (APU), and a BEV. The analysis explicitly accounts for the impact of external temperatures on auxiliary energy consumption, particularly for thermal management of the cabin and powertrain components. Furthermore, the study evaluates the sensitivity of life cycle results to the carbon intensity of electricity generation across different European countries and considers three hydrogen production scenarios: SMR, SMR with CCS, and electrolysis. Indeed, traditional SMR is used as the baseline for comparison, as it remains the dominant method for hydrogen production. In 2023, SMR accounted for 62% of global hydrogen production, while in Europe, its share reached 97% [21]. Finally, the effect of battery preconditioning in BEVs under varying external temperatures was evaluated, along with a sensitivity analysis on battery sizing in relation to reduced driving range under adverse weather conditions. The goal of this work is to provide a realistic, data-driven comparison of clean bus technologies under variable environmental, energy system conditions and time horizons for a decarbonized scenario. The findings aim to support transport authorities and policymakers in identifying the most suitable technology for specific regional conditions, balancing energy efficiency, climate resilience, and life cycle environmental performance.
2. Materials and Methods
2.1. Goal and Scope
The objective of this study is to evaluate the impact of diverse weather conditions on energy consumption and, consequently, the environmental footprint of different powertrain alternatives for a 12-m urban bus. The comparison includes five powertrain configurations:
- an ICEV fueled by diesel,
- a series Hybrid Electric Vehicle (HEV), featuring a diesel ICE as APU,
- a series hybrid FCEV,
- a series Hydrogen Hybrid Electric Vehicle (H2HEV) featuring an ICE fueled by hydrogen as APU,
- a BEV.
For each powertrain configuration, the load of the auxiliaries is varied, assessing the impact of different external ambient temperatures on cabin/battery conditioning, based on the approach carried out in [6]. In addition, the analysis incorporates real-world data on the Carbon Intensity (CI) of electricity generation in different European countries, considering also seasonal variability. Furthermore, two hydrogen production processes are considered: SMR and electrolysis, adding also the possibility to capture 60/70% of the CO2 produced in the SMR process. Finally, the current European situation is compared with a future scenario with a decreased CI of the grid for each country, and a widespread adoption of emerging technologies (i.e., hydrogen-related components and high-capacity batteries).
2.2. Case Study: Reference Vehicle and Powertrain Characteristics
The main specifications of the 12 m urban bus used in this work are listed in Table 1.

Table 1.
Vehicle specifications.
In this analysis, the powertrains mentioned above are considered, starting with the standard diesel configuration of an ICEV, which is currently the most common option in the bus market [22] and exploring “clean” alternatives based on the same case study analyzed by the authors in [23]. To emphasize the advantages of hybridization in bus design, a HEV with a series architecture is also examined, featuring a downsized diesel engine as an APU, as defined at first in [24]. To assess hydrogen’s potential as a decarbonizing energy source, two additional configurations are considered, both with the same series architecture as the HEV, replacing the APU and obtaining either an FCEV or H2HEV, as already introduced in [25]. The final powertrain option selected for a “zero tailpipe emissions” is a BEV, reflecting the growing adoption of this technology in urban markets. Notably, in 2022, 43.8% of newly registered buses in Europe were “diesel-free” vehicles, with BEVs constituting 21.8% of this figure [22]. Table 2 summarizes the specifications of the key components. The ICEV features a conventional 6.5 L diesel ICE with a rated power of 250 kW. The HEV configuration adopts a downsized version of this engine, rated at 100 kW, and pairs it with a 200 kW Electric Motor (EM) to ensure the same overall performance as the ICEV [26]. Following the same rationale, all series hybrid architectures are equipped with a 100 kW APU and a 200 kW EM [27]. Specifically, the H2HEV adopts a 3.0 L H2 ICE as an APU, retrofitted from the ICEV configuration [26,28], while the FCEV employs a PEM-FC system, including the full Balance of Plant (BoP), rescaled to match the hybrid power level [29]. For H2HEV, FCEV, and BEV, energy storage is sized to support a ~200 km daily mission. The hydrogen configurations (H2HEV and FCEV) use 700 bar type IV tanks with a 28 kg capacity, enabling operation without mid-day refueling [30,31]. Regarding the batteries, a 20 kWh LFP battery was chosen to power the hybrid configurations, selected for its balanced energy density and cycle life in small packs [32]. On the contrary, for the BEV, a large battery pack is needed, aligning with the current standard [33,34]. In particular, a 336 kWh NMC battery has been hypothesized to cover the daily range under moderate external ambient conditions, with depot-only overnight charging [35]. In addition, a sensitivity analysis on the BEV’s battery size has been conducted to account for the reduction in driving range due to increased electricity consumption under adverse weather conditions (i.e., extremely cold or hot external temperatures). All configurations are designed to meet the power demands of the driving scenarios analyzed in this study, and further details on component selection are discussed in [15,23].
Table 2.
Technical specifications of the main powertrains’ components.
In order to evaluate the performance of the proposed solutions, the Braunschweig driving cycle, which is commonly employed in certification programs and research projects [12], is adopted to represent urban bus operations. In fact, this cycle is characterized by a high share of stop phases (i.e., 23%), reflecting the frequent start-and-stop driving pattern typical of public transport (see Figure 1).
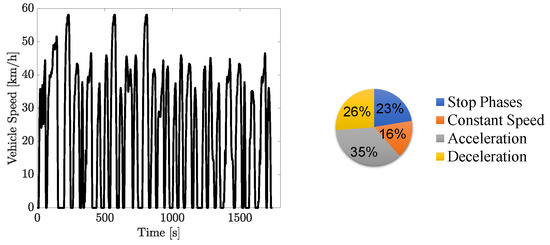
Figure 1.
Mission profile of the Braunschweig driving cycle.
2.3. System Boundaries
A comprehensive Cradle-to-Grave methodology is employed, covering all stages of the vehicle lifecycle, from production to EoL, with the system boundaries sketched in Figure 2.
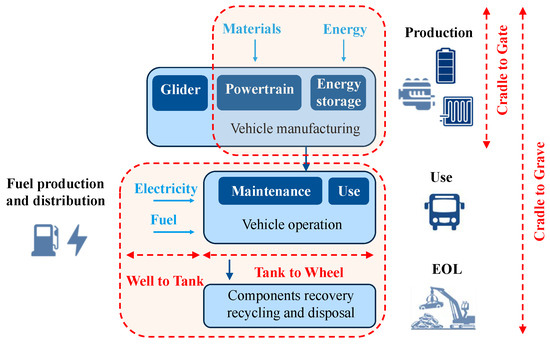
Figure 2.
Considered system’s boundaries for the LCA.
During the production phase, the analysis primarily focuses on the powertrain components and fuel/energy storage systems, excluding emissions associated with glider manufacturing. In the use phase, a Well-to-Wheel (WtW) approach is adopted, incorporating the fuel production process. Specifically, two hydrogen production pathways—electrolysis and SMR—are modeled, and the effect of different electricity production mixes is evaluated. Emissions related to vehicle disposal are considered in the EoL phase. Regarding the temporal context of this analysis, it reflects the current state, assuming limited market penetration of emerging technologies (e.g., fuel cell systems, carbon fiber tanks, lithium-ion batteries). Alternative scenarios for future technologies adoption have been extensively discussed in [15,23] for the same case study. In the present work, a conservative scenario of emerging technologies adoption has also been evaluated. Specifically, a 2030 time horizon is considered, assuming a reduced CF for hydrogen-related technologies and batteries. All relevant details and assumptions are provided in Appendix A. Finally, an average bus capacity has been supposed to be equal for all the powertrains (i.e., 54 passengers, 60% of maximum capacity), based on the comparability of their full passenger capacities and the expectation of similar occupancy under typical operating conditions. Although a reduction in maximum capacity might be expected for BEVs due to battery space requirements, modern BEVs are generally designed to offer a full passenger capacity comparable to that of conventional diesel buses [22,34]. The Functional Unit (FU) used to assess the carbon footprint (CF) of the various powertrains is the CO2 emissions per kilometer traveled by each vehicle.
Sensitivity analyses are incorporated in this study, including a variation of the CI of the electricity mix, using current average values from [36,37,38] of all European countries to assess the impact of regional differences, as well as seasonal variations based on the availability of renewable energies for electricity production. Additionally, the average external temperatures for these countries are considered, as they affect auxiliary loads, including cabin and battery thermal management. Furthermore, the average external temperatures in summer and winter are also included. Figure 3 summarizes the values considered for CIs for electricity production in European countries, and Figure 4 shows the external temperatures [39], for the current time. It is worth mentioning that CI generally decreases across all European countries in summer thanks to greater availability of renewable energy (see Figure 3b), while the opposite occurs in winter. Regarding the 2030 time horizon, a linear decrease in the CI of all European countries is projected in the IEA’s Announced Pledges Scenario (APS) report [40] and is adopted as an assumption in this study.
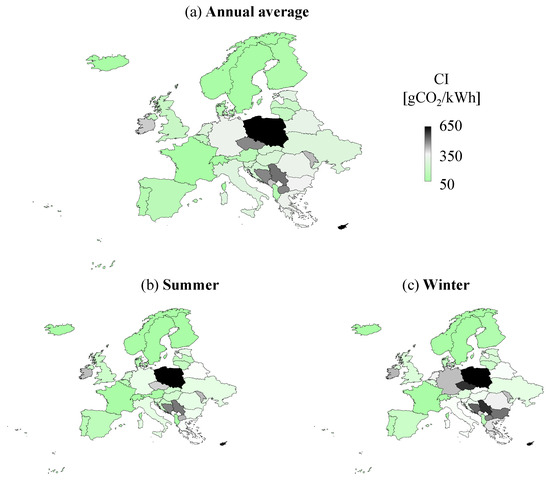
Figure 3.
Input values of grid carbon intensity for electricity production in Europe, at present: (a) annual mean, (b) mean in summer, (c) mean in winter.
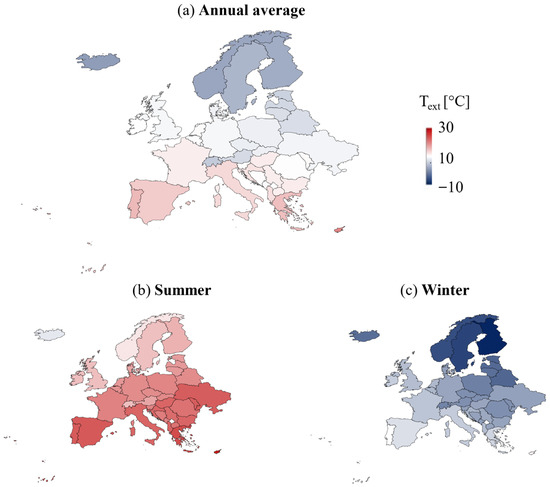
Figure 4.
Input values of external temperatures in Europe: (a) annual mean, (b) mean in winter, (c) mean in summer.
2.4. Data Acquisitions and Assumptions
All life cycle inventory data related to the production, maintenance, replacements, and EoL phases of the various powertrain configurations have been thoroughly examined in the authors’ previous work [15] and are adopted in the present study. For the sake of clarity, Appendix A includes a summary of the data and sources considered for vehicle manufacturing, maintenance, and replacement, together with detailed information about the EoL phase of the main components. In particular, a sensitivity analysis of the BEV’s battery size has been conducted to account for the reduction in driving range resulting from increased electricity consumption under adverse weather conditions. Indeed, aligning the battery capacity with the actual daily operational needs of the BEV, combined with the implementation of an effective charging strategy, is crucial for reducing the load on the electrical grid and optimizing both bus and infrastructure costs [8].
Furthermore, some modifications with respect to previous research by the Authors are included in the use phase. Starting from the Well-to-Tank (WtT) for diesel fuel, the CF associated with its production is estimated at 18.9 gCO2/MJ, based on data from [41]. This value is assumed constant across different energy mixes due to the low electricity input required in diesel production. Additional emissions arise from the combustion of diesel during vehicle operation. A more complex approach is applied to compressed hydrogen, for which three production pathways are modeled on OpenLCA [42]: traditional SMR, electrolysis via a PEM electrolyzer, and SMR with CCS. Traditional SMR, which uses methane as a feedstock and consumes relatively little electricity (1.11 kWh and 165 MJ of methane per kilogram of hydrogen), represents the current industrial benchmark. In contrast, electrolysis is a highly electricity-intensive process, requiring approximately 54.6 kWh per kilogram of hydrogen [13]. The CCS-enhanced SMR process is assumed to capture 60–70% of CO2 emissions. For all scenarios, hydrogen production is considered “domestic”, meaning it occurs in the same country where it is consumed. Then, transportation-related emissions are considered to be of secondary importance compared to those associated with hydrogen production processes [43]. However, a correction factor has been applied to the total CF of hydrogen production to account for transport, distribution, and associated losses. Furthermore, based on market projections for this process, the CF associated with hydrogen compression to 700 bar for onboard storage is included. Figure 5 illustrates the resulting CF of hydrogen production and compression under the three pathways, as a function of the CI of the electricity mix. Notably, current European electricity carbon intensities range from approximately 30 gCO2/kWh in Iceland to 662 gCO2/kWh in Poland.
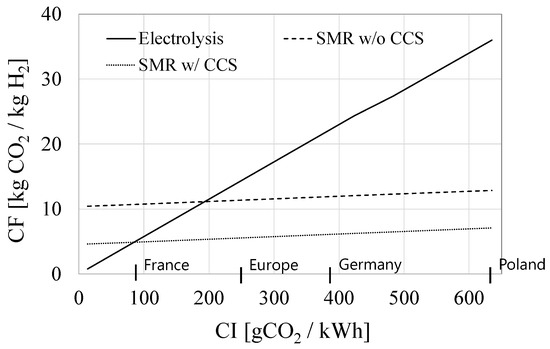
Figure 5.
WtT analysis for three different hydrogen production pathways as a function of the grid CI.
At present, hydrogen produced via electrolysis can only be considered environmentally favorable when the electricity used originates from grids with a high share of renewable energy sources—commonly referred to as “green hydrogen.” In contrast, hydrogen generated through SMR, termed “grey hydrogen”, exhibits a relatively constant CF, largely unaffected by the CI of the electricity grid due to its minimal electricity requirements. As a result, grey hydrogen typically has a lower CF compared to grid-based electrolytic hydrogen, particularly when the electricity is derived from carbon-intensive sources. This advantage becomes even more pronounced when SMR is combined with CCS technologies, yielding a CF that is favorable in the majority of European countries.
The Tank-to-Wheel (TtW) analysis is based on powertrain energy consumption data obtained from the study conducted by the authors in [23]. In that research, the performance of the same bus powertrains was evaluated under specific driving cycles using detailed numerical simulations. This involved designing an effective energy management strategy for the FC systems to both reduce fuel consumption and limit system degradation. It is important to consider the energy used by auxiliary components, as they have a notable impact on total consumption, especially in the Heavy Duty Vehicle (HDV) sector, and the following paragraph will focus on this aspect in greater detail.
2.5. Power Absorption of the Bus Auxiliaries
The impact of external ambient conditions on auxiliary power consumption, particularly for cabin conditioning and thermal management of components, requires dedicated analysis due to its significant influence on overall energy demand. This is especially critical for BEVs, where these loads can substantially affect energy efficiency, as demonstrated by Basma et al. [6]. To enable a fair, technology-neutral comparison, the starting point of the analysis is a reference ambient temperature of 15–20 °C, a range in which auxiliary power consumption is minimal. This baseline avoids penalizing BEVs, which are more sensitive to thermal loads outside this range.
Then, a variation of external ambient conditions is assumed from Text = −10 °C to Text = 40 °C, and Figure 6 illustrates the HVAC, battery and FC thermal conditioning demands as a function of external temperatures. Figure 6a shows the cabin HVAC power demand, while Figure 6b presents the Battery Thermal Management (BTM) and FC Thermal Management (FCTM) requirements. Regarding the HVAC power demand, it has been derived for the BEV based on [6], which considers a similar case study and the same driving cycle. A comprehensive thermal model of the vehicle cabin, adapted from [44] is used in the cited research. This model accounts for heat flux through the cabin walls, heat generated by passengers, and the effects of door openings, all as functions of ambient temperature, cabin temperature, and the duration of door openings. In the 15–20 °C range, HVAC usage is minimal across all architectures, limited to about 1 kW, primarily for ventilation. However, under cold conditions (e.g., −10 °C), HVAC demand in BEVs (yellow bars) increases sharply due to the decrease in HVAC system COP at extreme conditions, approaching propulsion-level energy consumption [18]. For ICEV, HEV, and H2HEV architectures (black bars), waste heat recovery from the engine is assumed sufficient for cabin heating [20]. During cooling, however, HVAC systems in these vehicles exhibit higher power demands than BEVs, since the HVAC compressor is driven by the engine, which has overall lower values of efficiency than the electric motor of the BEV [45]. In FCEVs, cooling behavior is assumed to be similar to the BEV, while in heating mode, the heat rejected by the FC stack is generally sufficient to meet cabin thermal needs in the −10 °C to 10 °C range [19]. All values for the HVAC demand refer to steady-state vehicle conditions, excluding cold starts.
Figure 6b highlights the thermal management loads for batteries and the FC stack. The BTM requirements are modeled based on the daily mission profile of the bus, incorporating an initial phase of battery preconditioning in heating mode characterized by high auxiliary power demand (i.e., BEV preconditioning bars), with values sourced from [6]. This is followed by a steady-state BTM power demand (i.e., BEV steady bars) of approximately 0.8–1 kW to maintain the battery temperature within optimal limits [46]. In cooling mode, a constant cooling load is considered during the daily mission to account for the heat generated by the battery during operation and maintain the battery temperature within a safe range. As a consequence, under extreme ambient conditions, the BTM system exhibits the highest average power demand due to the need for thermal management, which requires active cooling in high temperatures and heating in low temperatures. The FC stack contributes to cabin heating under cold conditions by rejecting heat without the need for component conditioning; however, at ambient temperatures above 25 °C, active cooling becomes necessary [19].

Figure 6.
(a) HVAC unit average electric power consumption and (b) BTM (w/preconditioning and in steady state) ans FCTM as a function of the external temperatures, for the considered powertrain architectures.

Figure 7 summarizes the total auxiliary power demand, including both cabin and component conditioning. A fixed auxiliary load of 1.35 kW is applied across all powertrains, based on [6,20]. This accounts for systems such as the air compressor and steering pump, which are the primary energy consumers, followed by the suspension system, and finally the doors and parking brakes. The contribution of the last categories corresponds to approximately 6% of the default auxiliary load. For FCEVs, an additional 1 kW is included for hydrogen purging, independent of ambient temperature. It is worth mentioning that the power demand exhibited from auxiliaries in cooling mode is consistent among all the powertrains, while in heating mode, the BEV is the most disadvantaged.
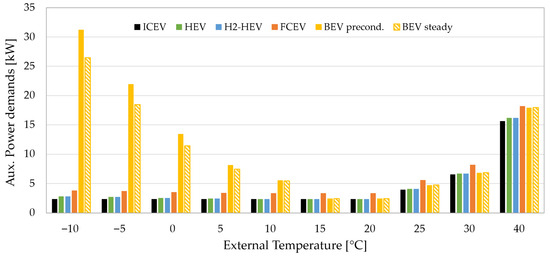
Figure 7.
Auxiliaries’ power demand as a function of the external temperatures, for the considered powertrain architectures.
3. Results
This section presents the results of the sensitivity analyses. First, the impact of external ambient temperature on energy consumption is analyzed, comparing the performance of different powertrain configurations. Subsequently, the environmental impacts over the entire bus lifetime are evaluated, accounting for variations in both ambient temperature and the CI of electricity generation. Two hydrogen production pathways are considered: traditional SMR and electrolysis, both of which are currently technologically mature. Finally, using real-world data on CI and average temperatures across Europe, the most suitable powertrain for each country is identified, in the current market situation, and also including future projections in terms of penetration of emerging technologies and decrease of the grid CI for electricity generation. This assessment also incorporates alternative hydrogen production methods that include CCS technologies.
3.1. TtW Analysis
This section presents a benchmarking analysis of various powertrain configurations under different external ambient temperatures, focusing on the influence of auxiliary power demands. Figure 8 illustrates the primary energy consumption across a temperature range of −10 °C to 40 °C, obtained through detailed numerical simulations employing the platform developed by the Authors in [23]. The reported values reflect the total energy use at the fuel and battery levels, incorporating efficiency losses within the powertrain systems, based on the driving cycle reported in Figure 1. For hybrid powertrains, both the HEV and H2HEV employ a standard Equivalent Consumption Minimization Strategy (ECMS), while the FCEV utilizes an ECMS that accounts for FC degradation, as described in [23]. To capture the impact of degradation on overall FC fuel consumption, the analysis considers the FC’s average energy consumption over its operational lifetime.
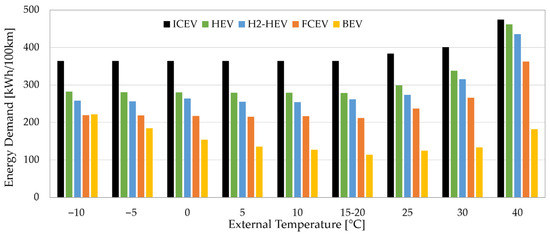
Figure 8.
Comparison of the energy consumption of the different powertrain configurations across a variation of external temperatures.
As shown in Figure 8, increasing the electrification level of the powertrain (from ICEVs to hybrid configurations, HEV, H2HEV, and FCEV, and ultimately to BEVs) results in a notable improvement in energy demand across a broad range of ambient temperatures. From ICEV to HEV, energy consumption decreases by approximately 22% in the ambient temperature range from −10 °C to 25 °C. This reduction is attributed to different factors: the HEV’s downsized internal combustion engine, which operates more frequently in higher-efficiency regions, the contribution of regenerative braking, which is particularly advantageous in HDV applications such as urban buses, and the ICE switching off in idle conditions.
Hydrogen-fueled configurations show further reductions in energy consumption compared to the ICEV. The H2HEV demonstrates an average decrease of 30%, while the FCEV achieves up to 42% savings, even accounting for degradation effects on FC efficiency within the −10 °C to 25 °C range. At 40 °C, the energy consumption of ICEV, HEV, and H2HEV converges, as increased auxiliary loads (particularly for battery thermal management in hybrid architectures) counteract the efficiency gains. For instance, the energy demand of the ICEV increases by 30% between 20 °C and 40 °C, while that of the H2HEV rises by 66%. In contrast, the FCEV maintains an efficiency advantage even at high ambient temperatures. Despite increased cooling demand for the FC stack (as illustrated in Figure 6), the FCEV still exhibits a 25% reduction in energy consumption compared to the ICEV at 40 °C.
Finally, the BEV configuration shows the most pronounced energy savings, with an average reduction of 67% relative to the ICEV in the temperature range of 10 °C to 35 °C. Nevertheless, its performance declines under extreme conditions. At high temperatures, increased thermal management demands due to large battery capacity diminish its advantage, with an increase in BEV energy demand of 60% at 40 °C with respect to the one at an external temperature of 15/20 °C. On the contrary, at low ambient temperatures (<10 °C), the elevated energy requirements of the HVAC significantly impact overall efficiency, due to the lack of exhausted heat to be recovered for cabin heating in the BEV. At −10 °C, the BEV’s energy consumption advantage drops to 38% relative to the ICEV and becomes less efficient than the FCEV.
3.2. Powertrains Life Cycle at Different External Temperatures
A thorough evaluation of the environmental impacts associated with different powertrains over the full vehicle lifecycle requires the integration of data from various phases, as depicted in Figure 2. These include the production, maintenance and the EoL phases (all details available in [15] and a dedicated analysis in Appendix A), the WtT emissions for different fuels (analyzed in Section 2), and the energy consumption for the chosen mission profile (from the previous paragraph).
Figure 9 shows the total CF as a function of the average CI of electricity generation across different ambient temperatures. Hydrogen production pathways considered include electrolysis and traditional SMR. The analysis uses a FU of CO2-equivalent emissions per kilometer traveled, assuming a total vehicle lifespan of 700.000 km. Diesel powertrains serve as a baseline reference in this comparison for all the considered external temperatures, as their CF is largely unaffected by the CI of electricity due to most emissions stemming from fuel combustion. A notable trend is the reduction in total CF when switching to a hybrid configuration, and so, moving from ICEV (black lines) to HEV (green lines). This decrease is primarily due to the improved fuel efficiency of HEVs (as highlighted in Figure 8), which lowers CF during the use phase and has a significant impact over the long operational lifespan of urban buses. Hydrogen-powered vehicles (orange and blue lines) reveal a strong dependency on the hydrogen production method. When hydrogen is generated via SMR, CF remains relatively constant across varying grid CIs due to the minimal electricity involved. In contrast, when produced through electrolysis, the CF of hydrogen is highly sensitive to the electricity grid CI, as well as the BEVs. Among hydrogen powertrains, FCEVs consistently show lower CF than H2HEVs, primarily due to their superior energy efficiency (as shown in Figure 8). Regarding ambient temperature effects, the analysis across Figure 9a–d shows that as the temperature increases from cold to hot conditions, the range of grid CIs where BEVs have the lowest CF expands. Notably:
- At extreme cold conditions (Figure 9a), FCEVs exhibit the lowest CF across most of the CI values, regardless of hydrogen production method, owing to their reduced power demand from the auxiliaries and, consequently, lower energy demand in cold conditions (see Figure 8). Finally, for CI values above 500 gCO2/kWh, the HEV shows slightly lower CF than FCEV.
- At intermediate external conditions (Figure 9b,c), the range of CIs where the BEV has the lowest CF begins to expand. However, for low-carbon grids (CI < 90–100 gCO2/kWh), the FCEV remains the most sustainable option, while for grids with high fossil fuel dependence (CI > 400–500 gCO2/kWh), the HEV continues to exhibit the lowest CF.
- At hot conditions (Figure 9d), BEVs outperform other powertrains in CF for grid CI values ranging from approximately 60 gCO2/kWh to 600 gCO2/kWh.
When comparing ICE-based configurations, the H2HEV only presents a lower CF than the HEV if powered by hydrogen produced via electrolysis with a CI below 180 gCO2/kWh, regardless of external temperatures.

Figure 9.
LCA analysis as a function of the average grid CI, for the considered powertrains, for different external temperatures.

3.3. European Countries’ Analysis of Clean Bus Alternatives
In this paragraph, the powertrain alternative with the lowest CF on the entire life-cycle has been identified for each European country, based on current grid CI, typical ambient temperatures, and their seasonal variations. Therefore, Figure 10 combines data on ambient temperatures and national grid CIs (see also Figure 3 and Figure 4) to identify the most suitable clean bus powertrain alternatives for replacing conventional fossil-fuel fleets under three scenarios: (a) annual average, (b) summer, and (c) winter. Firstly, only hydrogen produced via electrolysis or conventional SMR is considered the main option in today’s European hydrogen market. In Figure 10a, BEVs emerge as the most favorable option in southern European countries, where the climate is temperate and grid CIs are generally below 400 gCO2/kWh. This is confirmed, as an example, for Spain, where BEV results in the option with lower CF for bus fleets in [47]. In contrast, in part of the Balkan region, Poland and the Czech Republic, where grid CIs exceed 500 gCO2/kWh, the HEV offers the lowest CF. In northern Europe (e.g., Iceland and Scandinavia), the electricity mix is heavily renewable, resulting in grid CIs below 150 gCO2/kWh. This makes FCEVs fueled by “green” hydrogen the most advantageous option, although the average annual temperature is close to 0 °C. It has already been pointed out in [48], where a comprehensive LCA on FCEV buses was performed, and a pathway utilizing green hydrogen holds significant potential to support a more sustainable system. Conversely, when hydrogen is excluded as a viable fuel option within the Northern European energy mix, BEVs demonstrate the lowest carbon footprint for urban public transport [49]. Central Europe shows more varied patterns. For example, France combines a temperate climate with a very low grid CI—thanks to its high share of nuclear energy—making FCEVs fueled by “green” hydrogen the best solution.
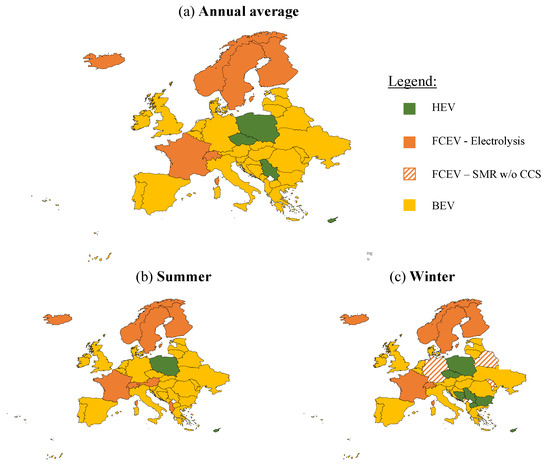
Figure 10.
European map of the powertrain with lower CF depending on the grid CI and the considered average external temperature of each country: (a) mean annual, (b) mean summer, (c) mean winter.
Under summer conditions (Figure 10b), the overall picture remains similar to the annual average. However, in countries with intermediate grid CIs (e.g., the Czech Republic), BEVs perform better than HEVs, largely due to improved efficiency during cooling-dominated operation. In winter conditions (Figure 10c), BEVs start to become less preferable in colder regions. As an example, Germany and Belarus combine intermediate grid CIs and cold climate in winter, making FCEVs powered by SMR hydrogen more favorable. Similar conclusions were drawn in [50] where FCEV city buses powered by grey hydrogen exhibited a lower carbon footprint than BEVs, provided the grid carbon intensity exceeds 500/600 gCO2/kWh. Conversely, the Balkan region exhibits the highest grid CIs (i.e., CI > 400 gCO2/kWh) and average winter temperatures lower than −4 °C, making HEVs the option with lower CF.
An additional hypothesis is presented in Figure 11, which follows the same layout as Figure 10, but with SMR combined with CCS technologies (with an overall process efficiency exceeding 60%) as a possible hydrogen production pathway. Notably, the integration of innovative CO2 capture technologies within the SMR process positions FCEVs as the most favorable option in terms of CF across Europe, while the BEV remains environmentally viable only in selected European countries. Specifically, FCEVs powered by “green” hydrogen retain the lowest CF only in countries where the CI is below 100 gCO2/kWh. In all other regions, FCEVs fueled by hydrogen from SMR with CCS represent the most advantageous choice, except for the Iberian Peninsula and Albania. In these countries, a temperate average annual climate and a grid CI around 100/150 gCO2/kWh make the BEV the option with lower CF. The pattern across European countries remains similar in summer (Figure 11b) and winter (Figure 11c), except in the previously mentioned countries, where BEV performance worsens due to more extreme external conditions. Further investigation is warranted to assess the impact of this technology on hydrogen fuel costs and its current level of technological maturity.
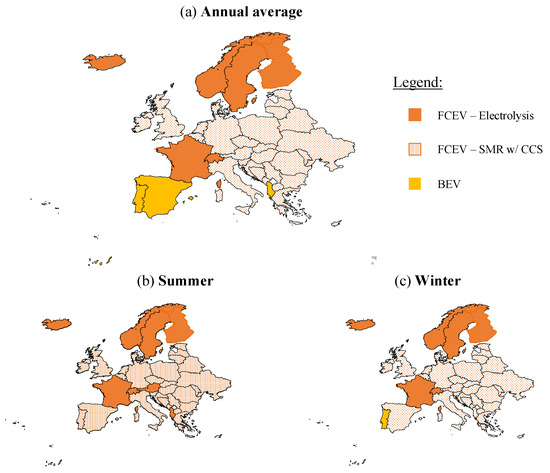
Figure 11.
European map of the powertrain with lower CF depending on the grid CI and the considered external temperature of each country: (a) mean annual, (b) mean summer, (c) mean winter. SMR with CCS is also considered for H2 production.
Finally, Figure 12 presents a focused comparison between ICE-based powertrains, following the same layout as Figure 10 but limited to HEVs and H2HEVs, with hydrogen sourced either from electrolysis or conventional SMR. This analysis aims to evaluate powertrain alternatives with comparable production costs, which are currently more favorable than those associated with FCEVs and BEVs [15]. The results indicate that, among the ICE-based configurations, H2HEVs powered by hydrogen produced via electrolysis represent the most advantageous option in most countries with a grid CI below 200 gCO2/kWh, regardless of external ambient conditions. This outcome is primarily due to the similar auxiliary power demands exhibited by HEVs and H2HEVs across varying temperatures. In contrast, in countries with medium to high CI levels, conventional HEVs remain the most environmentally favorable choice among the ICE-based configurations.
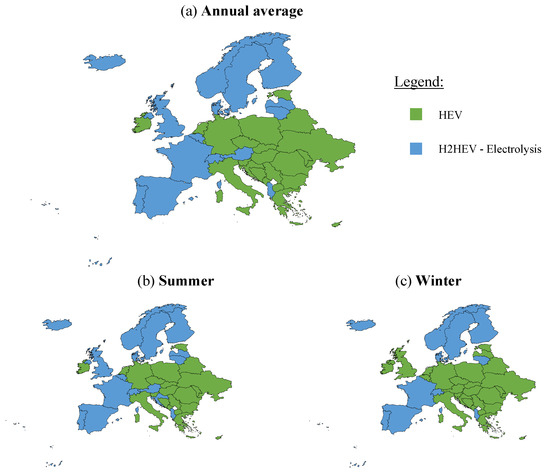
Figure 12.
European map of the powertrain with lower CF depending on the grid CI and the considered external temperature of each country: (a) mean annual, (b) mean summer, (c) mean winter. ICE-based powertrains under consideration.
3.4. European Context for Clean Bus Alternatives in the Future Scenario
Finally, the results obtained for various European countries were extrapolated to a future scenario that assumes reduced CFs for battery manufacturing and hydrogen-related technologies, along with a projected decrease in the CI of electricity generation, as outlined in Section 2. Figure 13 presents a comparison between the current European context (taken from Figure 10a) and the anticipated situation in 2030 under these assumptions. The reduction in grid CI enhances the viability of BEVs in countries with moderately carbon-intensive grids and temperate climates, such as Germany, the Czech Republic, and those in the Balkan region. A similar case study was conducted in [51]. The results of the cited research indicate a lower CF for BEVs across most of Europe under the current scenario, with the exception of Poland, Estonia, the Czech Republic, and Bulgaria.
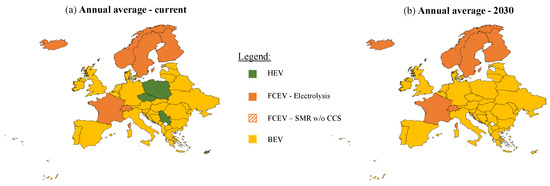
Figure 13.
European map of the powertrain with lower CF depending on the grid CI and the considered annual average external temperature of each country: (a) current, (b) future horizon 2030.
- This outcome is likely attributable to the use of a uniform emission factor for hydrogen production throughout Europe. When this value is reduced to 6 kgCO2/kgH2 in a projected 2030 scenario, FCEVs powered by green hydrogen become a more favorable option in a greater number of European countries.
Then, taking into account the seasonal variations in both grid CI and ambient temperatures, Figure 14 compares the current scenario with the projected future one. A clear trend emerges for the future scenario: during summer, BEVs achieve the lowest CF also in countries with very high grid CIs, as Poland. In winter, although the BEV consistently exhibits high energy consumption due to the impact of auxiliary systems, a future expected decrease in grid CI expands the regions in Europe where it becomes more sustainable than the FCEV powered by hydrogen produced via SMR (e.g., Germany, the Balkan region, and Belarus). The HEV remains the best option for grid CIs that exceed 500 gCO2/kWh and cold winter climates, as in Poland.
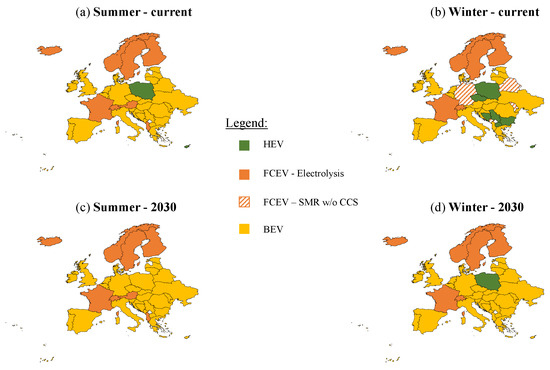
Figure 14.
European map of the powertrain with lower CF depending on the grid CI and the considered external temperature of each country, for different seasons and time horizon.
4. Conclusions
This study presents a comprehensive Life Cycle Assessment (LCA) of five urban bus powertrain configurations, evaluating their energy consumption and Carbon Footprint (CF) under a wide range of external ambient conditions and electricity grid Carbon Intensities (CIs) across Europe. The comparison included a conventional diesel Internal Combustion Engine Vehicle (ICEV), a diesel Hybrid Electric Vehicle (HEV), a Hydrogen Hybrid Electric Vehicle (H2HEV) with an H2-ICE as auxiliary power unit, a Fuel Cell Electric Vehicle (FCEV), and a Battery Electric Vehicle (BEV). The results confirm that increasing levels of electrification lead to improved energy efficiency across different temperature conditions, with BEVs demonstrating the highest average energy savings with an external temperature higher than 0 °C. However, BEV performance deteriorates under extreme cold conditions due to increased auxiliary energy demands, particularly for cabin and battery thermal management. From an LCA perspective, in the current scenario, BEVs achieve the lowest CF only in countries with low/medium grid CI (below ~400 gCO2/kWh), particularly under warm climate conditions. In addition, HEVs still remain a viable option for countries with fossil fuel-based grids. In colder climates and intermediate grid CIs, FCEVs emerge as the superior alternative if hydrogen is produced via Steam Methane Reforming (SMR). A hydrogen production pathway that combines SMR and Carbon Capture and Storage (CCS) allows FCEVs to surpass even BEVs in CF performance under most European conditions, offering a robust solution independent of ambient temperature variability. Among ICE-based configurations, the H2HEV only outperforms the HEV in terms of CF when powered by green hydrogen (electrolysis with CI < 180 gCO2/kWh). HEV offers moderate improvements over ICEV, but not as much as hydrogen and electric alternatives in most evaluated scenarios. In a future projected scenario, the anticipated reduction in grid CI improves the viability of BEVs and FCEVs powered by green hydrogen, making HEVs the most suitable option only under extreme conditions (i.e., grid CIs exceeding 500 gCO2/kWh and harsh winter climates).
Overall, the most convenient powertrain for replacing conventional diesel buses in urban fleets depends on regional climatic conditions and the electricity grid CI. In temperate regions with electricity grids based on a high share of renewables, BEVs remain the optimal solution. However, FCEVs, particularly when supplied with low-CF hydrogen from SMR + CCS or renewable electrolysis, offer a more universally applicable and resilient alternative, capable of delivering substantial emissions reductions regardless of ambient temperature. Future developments should address the economic and infrastructural implications of widespread FCEV deployment, including hydrogen distribution and storage systems, and the maturity of CCS technologies.
Author Contributions
Conceptualization, B.P.P., L.R. and L.P. methodology, A.V., B.P.P. and M.P.; validation, B.P.P. and L.P.; formal analysis, B.P.P., L.R. and M.P.; investigation, A.V., B.P.P. and L.P.; writing—original draft preparation, B.P.P.; writing—review and editing, B.P.P., L.P. and A.V. supervision, L.R. and M.P.; project administration, B.P.P. and L.R.; funding acquisition, L.R., L.P. and A.V. are respectively currently with The Ohio State University, and WinGD, but they were affiliated with Politecnico di Torino at the time the research was conducted. All authors have read and agreed to the published version of the manuscript.
Funding
Research funded by Ministero dell’Università e della Ricerca (MUR). Grant number: 2020R92Y3Z.
Data Availability Statement
The data presented in this study are available on request from the corresponding authors.
Conflicts of Interest
The authors declare no conflicts of interest.
Abbreviations
The following abbreviations are used in this manuscript:
| APU | Auxiliary Power Unit |
| BEV | Battery Electric Vehicle |
| BoP | Balance of Plant |
| BTM | Battery Thermal Management |
| CF | Carbon Footprint |
| CI | Carbon Intensity |
| ECMS | Equivalent Consumption Minimization Strategy |
| EoL | End of Life |
| FC | Fuel Cell |
| FCEV | Fuel Cell Electric Vehicle |
| FCTM | Fuel Cell Thermal Management |
| FU | Functional Unit |
| H2HEV | Hydrogen Hybrid Electric Vehicle |
| HDV | Heavy Duty Vehicle |
| HEV | Hybrid Electric Vehicle |
| HV | High Voltage |
| HVAC | Heating, Ventilation, and Air Conditioning |
| ICE | Internal Combustion Engine |
| ICEV | Internal Combustion Engine Vehicle |
| LCA | Life Cycle Assessment |
| LFP | Lithium iron phosphate |
| NMC | Nickel Manganese Cobalt |
| PM | Permanent Magnet |
| SMR | Steam Methane Reforming |
| TtW | Tank-to-Wheel |
| WtT | Well-to-Tank |
| WtW | Well-to-Wheel |
Appendix A. Production, Maintenance, and EoL Data
In the absence of primary data, environmental impacts related to the production, maintenance, and EoL phases of the assessed powertrains were estimated by scaling values from literature to fit the case study, as detailed in Table A1.
Table A1.
Summary of the considered data and sources for the LCA analysis, with relative references in brackets.
The vehicle glider, common to all configurations, was excluded from the comparative LCA. Variations in vehicle weight were attributed solely to differences in powertrain components such as batteries or hydrogen storage systems. The CF associated with diesel and hydrogen ICEs was considered equivalent, following the findings in [58], at 13 kgCO2/kW, based on a scalable LCA for heavy-duty vehicles [52]. The exhaust aftertreatment system was assumed to have a similar impact for both ICE types, with a CF of 7 kgCO2/kW. For FCEVs, the CF of the FC stack and associated BoP was set at 28 kgCO2/kW, reflecting current production volumes of about 200 units produced by OEM [53]. All powertrains, except conventional ICEs, included an EM and an inverter, whose CFs were sourced from specific inventories, for a PM traction motor [54] and the automotive power electronic inverter unit [55]. Hydrogen storage was based on five 700-bar Type IV carbon fiber tanks, totaling 28 kg capacity, aiming to cover at least an urban bus daily range and aligning with current strategies of packaging [59]. Battery systems also represented a major contributor to the production phase, with distinct CF values used for low-capacity LFP (for hybrids) and high-capacity NMC batteries (for BEVs). Given the high energy intensity of battery manufacturing, the production location—assumed to be China—was recognized as a key determinant of environmental impact due to the local electricity grid’s carbon intensity. An additional sensitivity analysis was conducted by varying the battery size based on the requirement to achieve the daily range with a BEV. The assumed battery capacity of 336 kWh is sufficient when energy consumption remains below 1.3 kWh/km, assuming a conservative daily range of 200 km. However, when the BEV’s energy consumption exceeds this threshold (e.g., at ambient temperatures above 30 °C or below 10 °C, as shown in Figure 8), a larger battery is needed to enable overnight charging as the only viable strategy. In such cases, the battery capacity must be increased up to 550 kWh at an external temperature of −10 °C. This leads to significant variability in the embodied emissions associated with battery production and replacement, as summarized in Table A2.
Table A2.
CF data related to the sensitivity analysis on battery sizing.
The final CF values, including component-level details across powertrain configurations, are presented in Figure A1, with uncertainty for the BEV stemming from its sensitivity to battery size. A clear correlation is observed between the degree of electrification and the associated CF: vehicles with higher electrification levels exhibit increased CF, with the BEV showing the highest impact among the configurations analyzed. Hydrogen-based powertrains (H2HEV and FCEV) display CF values approximately twice those of conventional diesel vehicles (ICEV and HEV), largely due to the high-impact carbon fiber used in 700-bar hydrogen storage systems (i.e., 8.3 tCO2 per vehicle). In addition, the CF of the battery contributes a value of 45.4 tCO2 for the BEV (with a baseline battery of 336 kWh), which is 95% of the total embodied emissions from BEV manufacturing. In addition, assuming higher energy consumption (as presented in Table A2) and a resulting larger battery size, the BEV could reach a CF of over 80 tCO2 for vehicle production.

Figure A1.
Component-level breakdown for the embodied carbon emissions of the different powertrains.

Furthermore, a sensitivity analysis has been conducted to assess the impact of emerging technologies on the market, as done by the same Authors in [15]. Specifically, Table A3 summarizes the current CO2 emission values associated with hydrogen-related technologies and high-capacity batteries, alongside projected values for a future scenario that assumes greater market penetration of these technologies. A 2030 time horizon has been considered, based on varying production volumes, following a similar approach to that adopted in [53].
Table A3.
CF data related to the production of emerging technologies in the current and future scenario (2030).
Furthermore, component replacement plays a significant role, particularly for battery and fuel cell systems. For the BEV, two battery pack replacements are considered over the vehicle’s lifetime, reflecting typical assumptions for high-capacity batteries in this application [49,60]. In contrast, for the H2HEV and FCEV, only one battery replacement is required due to their smaller battery capacities and a consequent higher durability [61]. For FCEVs, the EoL criterion for the fuel cell stack is based on a threshold where efficiency drops to 40% of the initial value [62], resulting in two replacements, thanks to a tailored energy management strategy [23]. The CF of routine maintenance is assumed uniform across powertrain types, at 32 gCO2/km, based on [49].
For the EoL phase, this study adopts the avoided burden approach, as opposed to the cut-off method, to enable a fair comparison of powertrain components with significant production-phase impacts, such as the BEV battery and FC. The avoided burden approach accounts for environmental credits associated with the substitution of virgin materials by recycled ones. In the case of NMC batteries, the EoL process includes material recycling, credit allocation for recovered materials, and disposal of non-recyclable residues. While recycling increases energy use and emissions at the cell level, the EoL phase results in an overall GWP reduction at the battery-pack level. Based on findings by Accardo et al. [57], this translates into a 3–4% net GWP improvement, with an EoL impact for the battery of −6.19 kgCO2/kWh applied in this study. A similar credit mechanism is considered for PEMFCs, particularly for the recovery of Platinum Group Metals (PGMs), with recycling shown to reduce the GWP of PGM production by up to 16.1% [63].
References
- International Energy Agency. IEA, Emissions by Region, Europe. 2022. Available online: https://www.iea.org/regions/europe/emissions (accessed on 18 August 2025).
- European Environment Agency. Passenger Transport Activity. 2024. Available online: https://www.eea.europa.eu/en/analysis/publications/sustainability-of-europes-mobility-systems/passenger-transport-activity (accessed on 18 August 2025).
- Heid, B.; Martens, C.; Orthofer, A. How Hydrogen Combustion Engines Can Contribute to Zero Emissions. 2021. Available online: https://www.mckinsey.com/industries/automotive-and-assembly/our-insights/how-hydrogen-combustion-engines-can-contribute-to-zero-emissions (accessed on 18 August 2025).
- Ercan, T.; Tatari, O. A hybrid life cycle assessment of public transportation buses with alternative fuel options. Int. J. Life Cycle Assess. 2015, 20, 1213–1231. [Google Scholar] [CrossRef]
- Peters, J.F.; Baumann, M.; Zimmermann, B.; Braun, J.; Weil, M. The environmental impact of Li-Ion batteries and the role of key parameters—A review. Renew. Sustain. Energy Rev. 2017, 67, 491–506. [Google Scholar] [CrossRef]
- Basma, H.; Mansour, C.; Haddad, M.; Nemer, M.; Stabat, P. Comprehensive energy modeling methodology for battery electric buses. Energy 2020, 207, 118241. [Google Scholar] [CrossRef]
- Corazza, M.; Conti, V.; Genovese, A.; Ortenzi, F.; Valentini, M.P. A procedure to estimate air conditioning consumption of urban buses related to climate and main operational characteristics. World Electr. Veh. J. 2021, 12, 29. [Google Scholar] [CrossRef]
- Lajunen, A. Lifecycle costs and charging requirements of electric buses with different charging methods. J. Clean. Prod. 2018, 172, 56–67. [Google Scholar] [CrossRef]
- Qu, Y.; Li, D.; Wang, R. Study on integrated thermal management system of hydrogen fuel cell vehicles based on heat pump air conditioning. J. Clean. Prod. 2024, 434, 139951. [Google Scholar] [CrossRef]
- Broatch, A.; Olmeda, P.; Margot, X.; Aceros, S. Different strategies in an integrated thermal management system of a fuel cell electric bus under real driving cycles in winter. Energy Convers. Manag. 2023, 288, 117137. [Google Scholar] [CrossRef]
- Lee, H.; Lee, D.; Kim, Y. Heating performance of a coolant-source heat pump using waste heat from stack and electric devices in fuel cell electric vehicles under cold conditions. Energy Convers. Manag. 2022, 252, 115092. [Google Scholar] [CrossRef]
- Kivekäs, K.; Lajunen, A.; Vepsäläinen, J.; Tammi, K. City bus powertrain comparison: Driving cycle variation and passenger load sensitivity analysis. Energies 2018, 11, 1755. [Google Scholar] [CrossRef]
- Mehmeti, A.; Angelis-Dimakis, A.; Arampatzis, G.; McPhail, S.J.; Ulgiati, S. Life cycle assessment and water footprint of hydrogen production methods: From conventional to emerging technologies. Environments 2018, 5, 24. [Google Scholar] [CrossRef]
- Staffell, I.; Scamman, D.; Velazquez Abad, A.; Balcombe, P.; Dodds, P.E.; Ekins, P.; Shah, N.; Ward, K.R. The role of hydrogen and fuel cells in the global energy system. Energy Environ. Sci. 2019, 12, 463–491. [Google Scholar] [CrossRef]
- Peiretti Paradisi, B.; Pulvirenti, L.; Vinogradov, A.; Rolando, L.; Piano, A.; Millo, F.; Prussi, M. A techno-economic life cycle assessment of H2 fuelled and electrified urban buses. Appl. Energy 2025. under review. [Google Scholar]
- Muncrief, R.L.; Cruz, M.; Ng, H.; Harold, M. Impact of Auxiliary Loads on Fuel Economy and Emissions in Transit Bus Applications; SAE Technical Papers 2012-01-1028; SAE International: Warrendale, PA, USA, 2012. [Google Scholar] [CrossRef]
- Jiménez-Espadafor, F.J.; Guerrero, D.P.; Trujillo, E.C.; García, M.T.; Wideberg, J. Fully optimized energy management for propulsion, thermal cooling and auxiliaries of a serial hybrid electric vehicle. Appl. Therm. Eng. 2015, 91, 694–705. [Google Scholar] [CrossRef]
- Bartłomiejczyk, M.; Kołacz, R. The reduction of auxiliaries power demand: The challenge for electromobility in public transportation. J. Clean. Prod. 2020, 252, 119776. [Google Scholar] [CrossRef]
- O’Boyle, C.; Blades, L.A.W.; McGrath, T.; Early, J.; Harris, A. Investigating Route Gradient and Thermal Demand on Hydrogen Fuel Cell Electric Bus Energy Consumption; SAE Technical Papers 2024-01-2176; SAE International: Warrendale, PA, USA, 2024. [Google Scholar] [CrossRef]
- Zacharof, N.; Özener, O.; Broekaert, S.; Özkan, M.; Samaras, Z.; Fontaras, G. The impact of bus passenger occupancy, heating ventilation and air conditioning systems on energy consumption and CO2 emissions. Energy 2023, 272, 127155. [Google Scholar] [CrossRef]
- International Energy Agency. Global Hydrogen Review 2024. 2024. Available online: https://www.iea.org/reports/global-hydrogen-review-2024; (accessed on 18 August 2025).
- UITP. An Overview of Clean Buses in Europe Clean Bus Report. January 2024. Available online: https://cms.uitp.org/wp/wp-content/uploads/2022/05/ASSURED-Clean-Bus-report_final2.pdf (accessed on 18 August 2025).
- Pulvirenti, L.; Rolando, L.; Vinogradov, A.; Paradisi, B.P. Comparison of hydrogen-fueled powertrains for urban bus applications—Design, modeling, and energy management. Int. J. Hydrogen Energy 2024, 110, 560–574. [Google Scholar] [CrossRef]
- Millo, F.; Rolando, L.; Fuso, R.; Mallamo, F. Real CO2 emissions benefits and end user’s operating costs of a plug-in Hybrid Electric Vehicle. Appl. Energy 2014, 114, 563–571. [Google Scholar] [CrossRef]
- Arsie, I.; Battistoni, M.; Brancaleoni, P.P.; Cipollone, R.; Corti, E.; Di Battista, D.; Millo, F.; Occhicone, A.; Paradisi, B.P.; Rolando, L.; et al. A New Generation of Hydrogen-Fueled Hybrid Propulsion Systems for the Urban Mobility of the Future. Energies 2024, 17, 34. [Google Scholar] [CrossRef]
- Golisano, R.; Scalabrini, S.; Arpaia, A.; Pesce, F.; Vassallo, A.; Borgia, F.; Cubito, C.; Biasin, V.; Knichel, T.; Millo, F.; et al. Hydrogen Internal Combustion Engine & KERS: An Appealing Value-Proposition for Green Power Pack. In Proceedings of the 42nd International Vienna Motor Symposium, Vienna, Austria, 29–30 April 2021. [Google Scholar]
- Bianchi, D.; Rolando, L.; Serrao, L.; Onori, S.; Rizzoni, G.; Al Khayat, N.; Hsieh, T.M.; Kang, P. Layered control strategies for hybrid electric vehicles based on optimal control. Int. J. Electr. Hybrid Veh. 2011, 3, 191. [Google Scholar] [CrossRef]
- Millo, F.; Piano, A.; Rolando, L.; Accurso, F.; Gullino, F.; Roggio, S.; Bianco, A.; Pesce, F.; Vassallo, A.; Rossi, R. Synergetic Application of Zero-, One-, and Three-Dimensional Computational Fluid Dynamics Approaches for Hydrogen-Fuelled Spark Ignition Engine Simulation. SAE Int. J. Engines 2021, 15, 561–580. [Google Scholar] [CrossRef]
- Millo, F.; Rolando, L.; Piano, A.; Peiretti Paradisi, B.; Vinogradov, A. Hydrogen Powertrains: A Comparison Between Different Solutions for an Urban Bus. In Proceedings of the 22. Internationales Stuttgarter Symposium, Stuttgart, Germany, 15–16 March 2022; pp. 259–271. [Google Scholar] [CrossRef]
- Handwerker, M.; Wellnitz, J.; Marzbani, H. Comparison of Hydrogen Powertrains with the Battery Powered Electric Vehicle and Investigation of Small-Scale Local Hydrogen Production Using Renewable Energy. Hydrogen 2021, 2, 76–100. [Google Scholar] [CrossRef]
- Rivard, E.; Trudeau, M.; Zaghib, K. Hydrogen storage for mobility: A review. Materials 2019, 12, 1973. [Google Scholar] [CrossRef]
- A123 Systems. Nanophosphate® High Power Lithium-Ion Cell. 2023. Available online: https://www.batteryspace.com/prod-specs/6610.pdf (accessed on 18 August 2025).
- Borghetti, F.; Longo, M.; Bonera, M.; Libretti, M.; Somaschini, C.; Martinelli, V.; Medeghini, M.; Mazzoncini, R. Battery Electric Buses or Fuel Cell Electric Buses? A Decarbonization Case Study in the City of Brescia, Italy. Infrastructures 2023, 8, 178. [Google Scholar] [CrossRef]
- ZeEUS. EBus Report #2: An Updated Overview of Electric Buses in Europe. August 2024. Available online: https://zeeus.eu/uploads/publications/documents/zeeus-ebus-report-2.pdf (accessed on 18 August 2025).
- Introduction of Samsung SDI’s 94Ah Cells. January 2024. Available online: https://cdn.shopify.com/s/files/1/0480/6521/6669/files/BMW_Samsung_SDI_94Ah_Datasheet.pdf?v=1605781107. (accessed on 18 August 2025).
- Europe Environment Agency. Greenhouse Gas Emission Intensity of Electricity Generation in Europe. July 2024. Available online: https://www.eea.europa.eu/en/analysis/indicators/greenhouse-gas-emission-intensity-of-1 (accessed on 18 August 2025).
- Scarlat, N.; Prussi, M.; Padella, M. Quantification of the carbon intensity of electricity produced and used in Europe. Appl. Energy 2022, 305, 117901. [Google Scholar] [CrossRef]
- Electricity Maps. Electricity Maps Monthly. 2025. Available online: https://app.electricitymaps.com/map/all/monthly (accessed on 18 August 2025).
- Climate Change Knowledge Portal. Data Catalog. 2025. Available online: https://climateknowledgeportal.worldbank.org/ (accessed on 18 August 2025).
- International Energy Agency. CO2 Emissions Intensity of Electricity Generation in the Announced Pledges Scenario, 2022–2030. 2024. Available online: https://www.iea.org/data-and-statistics/charts/co2-emissions-intensity-of-electricity-generation-in-the-announced-pledges-scenario-2022-2030 (accessed on 18 August 2025).
- Prussi, M.; Yugo, M.; Prada, L.; De Padella, M.; Edwards, R. JEC Well-To-Wheels Report v5:Well-to-Wheels Analysis of Future Automotive Fuels and Powertrains in the European Context; JRC Science for Policy Report; JRC: Brussels, Belgium, 2020. [Google Scholar] [CrossRef]
- OpenLCA Software. August 2024. Available online: https://www.openlca.org/ (accessed on 18 August 2025).
- Sens, M.; Danzer, D.; Essen Cvon Brauer, M.; Wascheck, R.; Seebode, J.; Kratzsch, M. Hydrogen Powertrains in Competition to Fossil Fuel based Internal Combustion Engines and Battery Electric Powertrains. In Proceedings of the 42nd International Vienna Motor Symposium, Vienna, Austria, 29–30 April 2021. [Google Scholar]
- Brèque, F.; Nemer, M. Cabin Thermal Needs: Modeling and Assumption Analysis. In Proceedings of the 12th International Modelica Conference, Prague, Czech Republic, 15–17 May 2017; Linköping University Electronic Press: Linköping, Sweden, 2017; pp. 771–781. [Google Scholar] [CrossRef]
- Basma, H.; Mansour, C.; Haddad, M.; Nemer, M.; Stabat, P. Comprehensive energy assessment of battery electric buses and diesel buses. In Proceedings of the 32nd International Conference on Efficiency, Cost, Optimization, Simulation and Environmental Impact of Energy Systems, Wrocław, Poland, 23–28 June 2019. [Google Scholar]
- Broatch, A.; Olmeda, P.; Bares, P.; Aceros, S. Integral Thermal Management Studies in Winter Conditions with a Global Model of a Battery-Powered Electric Bus. Energies 2023, 16, 168. [Google Scholar] [CrossRef]
- García, A.; Monsalve-Serrano, J.; Lago Sari, R.; Tripathi, S. Pathways to achieve future CO2 emission reduction targets for bus transit networks. Energy 2022, 244, 123177. [Google Scholar] [CrossRef]
- Lozanovski, A.; Whitehouse, N.; Ko, N.; Whitehouse, S. Sustainability assessment of fuel cell buses in public transport. Sustainability 2018, 10, 1480. [Google Scholar] [CrossRef]
- Nordelöf, A.; Romare, M.; Tivander, J. Life cycle assessment of city buses powered by electricity, hydrogenated vegetable oil or diesel. Transp. Res. Part D Transp. Environ. 2019, 75, 211–222. [Google Scholar] [CrossRef]
- Gustafsson, M.; Svensson, N.; Eklund, M.; Dahl Öberg, J.; Vehabovic, A. Well-to-wheel greenhouse gas emissions of heavy-duty transports: Influence of electricity carbon intensity. Transp. Res. Part D Transp. Environ. 2021, 93, 102757. [Google Scholar] [CrossRef]
- Brancaleoni, P.P.; Damiani Ferretti, A.N.; Corti, E.; Ravaglioli, V.; Moro, D. Lifecycle CO2 analysis for urban emission reduction of hydrogen-fuelled and battery electric buses in the European Union current and future energetic scenarios. Int. J. Hydrogen Energy 2025, 123, 335–353. [Google Scholar] [CrossRef]
- Wolff, S.; Seidenfus, M.; Gordon, K.; Álvarez, S.; Kalt, S.; Lienkamp, M. Scalable life-cycle inventory for heavy-duty vehicle production. Sustainability 2020, 12, 5396. [Google Scholar] [CrossRef]
- Miotti, M.; Hofer, J.; Bauer, C. Integrated environmental and economic assessment of current and future fuel cell vehicles. Int. J. Life Cycle Assess. 2017, 22, 94–110. [Google Scholar] [CrossRef]
- Nordelöf, A.; Grunditz, E.; Lundmark, S.; Tillman, A.M.; Alatalo, M.; Thiringer, T. Life cycle assessment of permanent magnet electric traction motors. Transp. Res. Part D Transp. Environ. 2019, 67, 263–274. [Google Scholar] [CrossRef]
- Nordelöf, A. A scalable life cycle inventory of an automotive power electronic inverter unit—Part II: Manufacturing processes. Int. J. Life Cycle Assess. 2019, 24, 694–711. [Google Scholar] [CrossRef]
- Quan, J.; Zhao, S.; Song, D.; Wang, T.; He, W.; Li, G. Comparative life cycle assessment of LFP and NCM batteries including the secondary use and different recycling technologies. Sci. Total Environ. 2022, 819, 153105. [Google Scholar] [CrossRef]
- Accardo, A.; Dotelli, G.; Musa, M.L.; Spessa, E. Life cycle assessment of an NMC battery for application to electric light-duty commercial vehicles and comparison with a sodium-nickel-chloride battery. Appl. Sci. 2021, 11, 1160. [Google Scholar] [CrossRef]
- Candelaresi, D.; Valente, A.; Iribarren, D.; Dufour, J.; Spazzafumo, G. Comparative life cycle assessment of hydrogen-fuelled passenger cars. Int. J. Hydrogen Energy 2021, 46, 35961–35973. [Google Scholar] [CrossRef]
- Houchins, C.; James, B.D. DoE Hydrogen and Fuel Cells Program Review Hydrogen Storage Cost Analysis (ST100). 2019. Available online: https://www.hydrogen.energy.gov/docs/hydrogenprogramlibraries/pdfs/progress18/h2f_james2_2018.pdf?sfvrsn=ae86594d_1 (accessed on 18 August 2025).
- Cooney, G.; Hawkins, T.R.; Marriott, J. Life cycle assessment of diesel and electric public transportation buses. J. Ind. Ecol. 2013, 17, 689–699. [Google Scholar] [CrossRef]
- Cusenza, M.A.; Bobba, S.; Ardente, F.; Cellura, M.; Di Persio, F. Energy and environmental assessment of a traction lithium-ion battery pack for plug-in hybrid electric vehicles. J. Clean. Prod. 2019, 215, 634–649. [Google Scholar] [CrossRef]
- Hydrogen and Fuel Cell Technologies Office, United States Department of Energy. DoE Technical Targets for Polymer Electrolyte Membrane Fuel Cell Component. 2024. Available online: https://www.energy.gov/eere/fuelcells/doe-technical-targets-polymer-electrolyte-membrane-fuel-cell-components (accessed on 18 August 2025).
- Lotrič, A.; Sekavčnik, M.; Kuštrin, I.; Mori, M. Life-cycle assessment of hydrogen technologies with the focus on EU critical raw materials and end-of-life strategies. Int. J. Hydrogen Energy 2021, 46, 10143–10160. [Google Scholar] [CrossRef]


Disclaimer/Publisher’s Note: The statements, opinions and data contained in all publications are solely those of the individual author(s) and contributor(s) and not of MDPI and/or the editor(s). MDPI and/or the editor(s) disclaim responsibility for any injury to people or property resulting from any ideas, methods, instructions or products referred to in the content. |
© 2025 by the authors. Licensee MDPI, Basel, Switzerland. This article is an open access article distributed under the terms and conditions of the Creative Commons Attribution (CC BY) license (https://creativecommons.org/licenses/by/4.0/).