Article

Environmental Performance of the Sewage Sludge Gasification Process Considering the Recovered CO2

by
Daichi Terasawa
*,
Mayu Hamazaki
,
Kanato Kumagai
and
Kiyoshi Dowaki
*
Department of Industrial and Systems Engineering, Graduate School of Science and Technology, Tokyo University of Science, Chiba 278-8510, Japan
*
Authors to whom correspondence should be addressed.
Energies 2025, 18(17), 4460; https://doi.org/10.3390/en18174460
Submission received: 18 July 2025 / Revised: 13 August 2025 / Accepted: 19 August 2025 / Published: 22 August 2025

Abstract

An advanced gasification module (AGM) for green hydrogen production involves a small-scale biomass gasification process owing to the low energy density of biomass. Therefore, significant heat loss and the endothermic nature of gasification system require additional fossil fuel heat, increasing CO2 emissions. This study focuses on bioenergy conversion with carbon capture and utilization (BECCU), where carbon-neutral CO2 from biomass gasification is captured and reused as a gasifying agent to reduce the greenhouse gas intensity of green hydrogen. BECCU is expected to achieve negative emissions and enhance gasification efficiency by promoting conversion of char and tar through CO2 gasification. To evaluate the effectiveness of BECCU in the AGM, we conducted a sensitivity analysis of the reformer temperature and S/C ratio using process simulation combined with life cycle assessment. In both sensitivity analyses, the GWP for CO2 capture was lower compared with conventional conditions, considering recovered CO2 from purification and the additional steam generated through heat recovery. This suggests improved hydrogen yields from enhanced char and tar conversion. Consequently, the GWP was reduced by more than 50%, demonstrating BECCU’s effectiveness in the AGM. This represents a step toward operating biomass gasification systems with lower environmental impact and contributing to sustainable energy production.

1. Introduction

Hydrogen (H2), which can be produced from various sources such as water, coal, natural gas, and renewable energy, is a next-generation energy source with a low environmental impact that does not emit CO2 when used [1,2]. The global demand for H2 is projected to increase approximately five-fold by 2050, compared to 2022 levels, to achieve carbon neutrality [3]. In particular, the production of green H2 from renewable sources such as solar and wind power is expected to expand as numerous nations announce roadmaps for H2 production [4]. In this study, we focused on biomass gasification to produce green H2. Biomass is carbon-neutral and can be stably obtained in various regions, unaffected by weather conditions. Additionally, gasification offers advantages over water electrolysis in terms of energy and exergy efficiency [5]. Our research group has focused on a small-scale biomass gasification process, the advanced gasification module (AGM), which enables the synthesis of H2 and is characterized by higher gasification and reforming efficiencies. The AGM employs an indirect pyrolysis gasification process in which syngas is produced through the circulation of heat carriers (HCs) heated by external fuel gas generated from the combustion of fossil fuels and off-gas. However, this implies that the consumption of fossil fuels may be attributed to heat loss in small-scale plants, consequently worsening specific CO2 emissions.
Additionally, biomass feedstock has a lower energy density and calorific value than fossil fuels [6,7]. As a result, the feedstock must be collected from a wider area, leading to increased specific CO2 emissions and higher economic costs during transportation [8]. Therefore, mitigating CO2 emissions through the recycling or sequestration of CO2 gas is necessary [9]. Furthermore, the utilization of recovered CO2 has been widely applied across various fields to address energy shortages and ecological environmental challenges, such as in rock fracturing technology and CO2 fixation in algae cultivation for next-generation bioenergy [10,11]. In this context, we focus on bioenergy conversion with carbon capture and utilization (BECCU), which involves capturing CO2 generated from biomass gasification and reusing it as a gasifying agent for CO2 gasification.
Considering BECCU, the following advantage can be obtained: negative emissions to capture and utilize CO2 gas, corresponding to carbon neutrality [12]. Bioenergy conversion with carbon capture and storage (BECCS) has garnered significant interest as a large-scale carbon-negative technology [13]. However, upgrading waste CO2 into valuable products, such as in BECCU, is a promising complementary approach that improves the carbon balance and provides additional economic value [14]. Current BECCU strategies include biocatalytic approaches, such as biotransformations using algae and biological Sabatier processes, which focus on chemical transformations [12]. Most of these strategies use CO2 not to produce the primary product, but as a feedstock for producing by-products. However, in all these studies, BECCU has been applied to produce by-products, and it has not yet been implemented to produce the main products in H2 production plants via gasification.
Investigating the eco-burden on BECCU is necessary to implement a life cycle assessment (LCA) [15]. In a previous study, Kuroda et al. conducted an LCA evaluation assuming a BECCU for a plant where H2 was produced through gasification [16]. In their research, the captured CO2 was considered available for carbon dioxide fertilization in the plant factory, leading to its fixation. As a result, the BECCU was not counted as an emission to the atmosphere, and the global warming potential (GWP) was reduced by more than half compared to the conventional case. Maran et al. conducted a consequential LCA to evaluate the environmental impacts of a scenario in which the BECCU was integrated into the HTL to produce biocrude and methanol, introducing flexible BECCU operations [17]. BECCU enabled the CO2 supply in this study, thereby reducing the required biomass feedstock. However, as the external energy input for by-product production increased, the environmental impacts in many categories were higher compared to a scenario without BECCU integration. This suggests that using BECCU to produce by-products can generate another valuable energy source, but it also requires additional energy for by-product production.
Based on these concepts, we suggest that the 2-step pressure swing adsorption (PSA) method developed by our research team is effective for CO2 recovery in BECCU [18]. A notable feature of this system, which divides the H2 purification process into two steps, is that it enables low-pressure operation by adsorbing and separating CO2 from syngas in the first step and purifying H2 in the second step. As a result, this method reduces the auxiliary power consumption compared with conventional PSA and reduces the environmental impact. The 2-step PSA is effective for BECCU because it enables purification with a low environmental impact and makes it possible to utilize the recovered CO2 effectively. Therefore, this study introduces 2-step PSA into the AGM to recover CO2 for the BECCU.
Finally, the CO2 recovered by 2-step PSA was utilized as a gasifying agent in the AGM reformer. It is known that adding CO2 to the reformer improves the gasification efficiency. Renganathan et al. evaluated the gasification performance of a reformer using CO2 and steam as gasifying agents through simulation [9]. The results showed that cold gas efficiency (CGE) improved as the conversion of char increased with increasing CO2 flow rate and temperature. Additionally, as the amount of steam added increased, the required amount of CO2 for char conversion and the CO2 reaction rate decreased. Li et al. experimented with toluene as a model component of biomass tar to study the effects of temperature and CO2 flow rate on gasification [19]. Their results indicated that as temperature and CO2 flow rate increased, the tar conversion rate improved, and the yields of H2, CO, and syngas also increased.
Based on the above background, this study proposes a BECCU that utilizes CO2 recovered by the 2-step PSA as a gasifying agent for a reformer in the same H2 production AGM. The introduction of CO2 recovery helps reduce CO2 emissions. Furthermore, using CO2 as a gasifying agent improves the gasification efficiency and increases H2 production. Consequently, the CO2 emission intensity of the AGM was reduced. In this study, we evaluated the impact of introducing BECCU on the CO2 emission intensity at the AGM plant scale using LCA.
This study represents a significant step toward establishing biomass gasification systems that operate with significantly lower environmental impacts. By integrating CO2 recovery and utilization technologies such as BECCU, this work contributes to advancing sustainable energy production and addressing the global need for hydrogen production with low environmental impact [3]. Our approach will contribute to progress toward a cleaner energy future.

2. Materials and Methods

This study aimed to introduce BECCU at the AGM plant scale and evaluate its effectiveness in reducing CO2 emission factors by considering CO2 recovery and recycling. To achieve this, a process simulation was used to conduct a sensitivity analysis of the effects of reformer temperature and steam/carbon ratio (S/C) when recovered CO2 was used as a gasifying agent in addition to the conventional gasifying agent, steam. An increase in the reformer temperature and S/C ratio is expected to enhance the reaction rate between char, tar, and the gasifying agent, resulting in increased H2 production. Although both factors are anticipated to increase CO2 emissions due to higher combustion in the reformer, this can be considered an increase in negative emissions by introducing BECCU, contributing to a reduction in CO2 emission intensity. Additionally, the CO2 mitigation effect of auxiliary power in the H2 purification process, achieved by 2-step PSA, was also considered. Next, sewage sludge (SS) was used as the feedstock for the AGM. Co-locating an AGM with a wastewater treatment plant offers advantages such as a stable collection route and reduced transportation distances.
Furthermore, tar condensation in the gasification process can cause issues such as pipe blockages and reduced heat exchange efficiency, whereas decomposition through gasification can increase H2 production [20]. To gain a deeper understanding of the decomposition behavior during tar reforming in a reformer under various conditions, gasification experiments were conducted using tar collected from an AGM plant [21]. Process simulations were designed using the tar gasification rate equations estimated from preliminary experiments. Finally, an LCA was conducted using the inventory data obtained from the simulations.

2.1. Preliminary Experiments: Estimation of Gasification Rate Equation for Sewage Sludge Tar

Based on the advantages of the captured CO2, the reaction of tar with CO2 was considered in this study.
In the experiments, the SS-derived tar collected from the pyrolizer of the AGM was used as the sample (Figure 1a, Table 1). Tar is composed of numerous compounds, making it difficult to represent accurately in the process simulation used in this study. Therefore, in the simulations described in the later sections, tar was modeled solely as benzene (C6H6) and naphthalene (C10H8). The properties in Table 1 are provided only to describe the experimental samples, and only the gasification rate equation obtained from experiments using these samples was applied in the process simulation. Therefore, the elemental properties, such as C, H, N, O, S, and Cl, were not considered as influencing factors in the gasification process (see Table 1). During the experiment, the sample was dried to a constant weight and heated to a specified temperature in an argon atmosphere. Once the target temperature was reached, the sample was held isothermally under a gasifying agent atmosphere, during which the mass change of the sample was measured as it underwent decomposition. These experimental results were used to determine the reaction rate constant, frequency factor, and activation energy in the gasification reaction rate equation between the sample and the gasifying agent. The experimental conditions are listed in Table 2. CO2 and steam were used as the gasifying agents. Isothermal temperatures were selected at three points where the tar decomposition of each gasifying agent could be easily observed.
Regarding the heating rate, with reference to our previous study as a guide for the experimental method, it was confirmed through preliminary gasification experiments that the gasification rate expression for the samples used in this study is independent of heating rates between 10 and 30 K/min [22]. Therefore, setting the heating rate within this range does not affect the results, and based on this premise, the experiments in this study were conducted at 30 K/min. To ensure that variations in gasifying agent concentration did not affect the decomposition rate of the sample, each experiment was conducted at sufficiently high concentrations of gasifying agents. Because the sample sizes within the furnace were not uniform, the particle size was not standardized. However, samples smaller than approximately 1 mm were used, with approximately 10 mg used per experiment. Thermogravimetric analysis (TGA; TGA-51, SHIMADZU; Figure 1b) was employed for the measurements, and the experimental setup was configured to obtain the data (Figure 1c).
To obtain a detailed understanding of the reactions in the reformer through process simulations, a kinetic model defined by the frequency factor and activation energy for each reaction was used. Using the data obtained from the above method, the frequency factor and activation energy in the reaction rate equation for reformer design were estimated through the analytical method described below.
The sample was a nonporous material, such as coal particles, and the reaction progressed centripetally from the surface to the interior of the solid particles. Based on this observation, the gasification rate was considered proportional to the surface area; therefore, the unreacted core model was applied. The reaction rate constants were determined using Equations (1) and (2) [23].
d X d t = k 1 X n ,
k t = 1 X 1 n 1 n 1 ,
where k [1/s] is the reaction rate constant, t [s] is time, X is the conversion rate, and n [-] is the reaction order. Note that n is 2/3, which is assumed to be proportional to the surface area according to the unreacted core model. Regarding the assumption of nonporosity in the unreacted core model used for kinetic analysis, the experimental sample, sewage sludge tar, was treated as nonporous because, when comparing reaction orders, the case assuming a nonporous material (reaction order of 2/3) provided a better fit to the experimental data than the case assuming a porous material (reaction order of 1/3) [23]. This justifies the use of the unreacted core model in this study.
A potential limitation of this model is that, for truly porous reactants where the reaction gas can penetrate into the interior, the unreacted core model may not be applicable [24]. In such cases, the estimated reaction rate constant could be influenced by heat and mass transfer effects, and a more detailed model reflecting the actual reaction mechanism would be required.
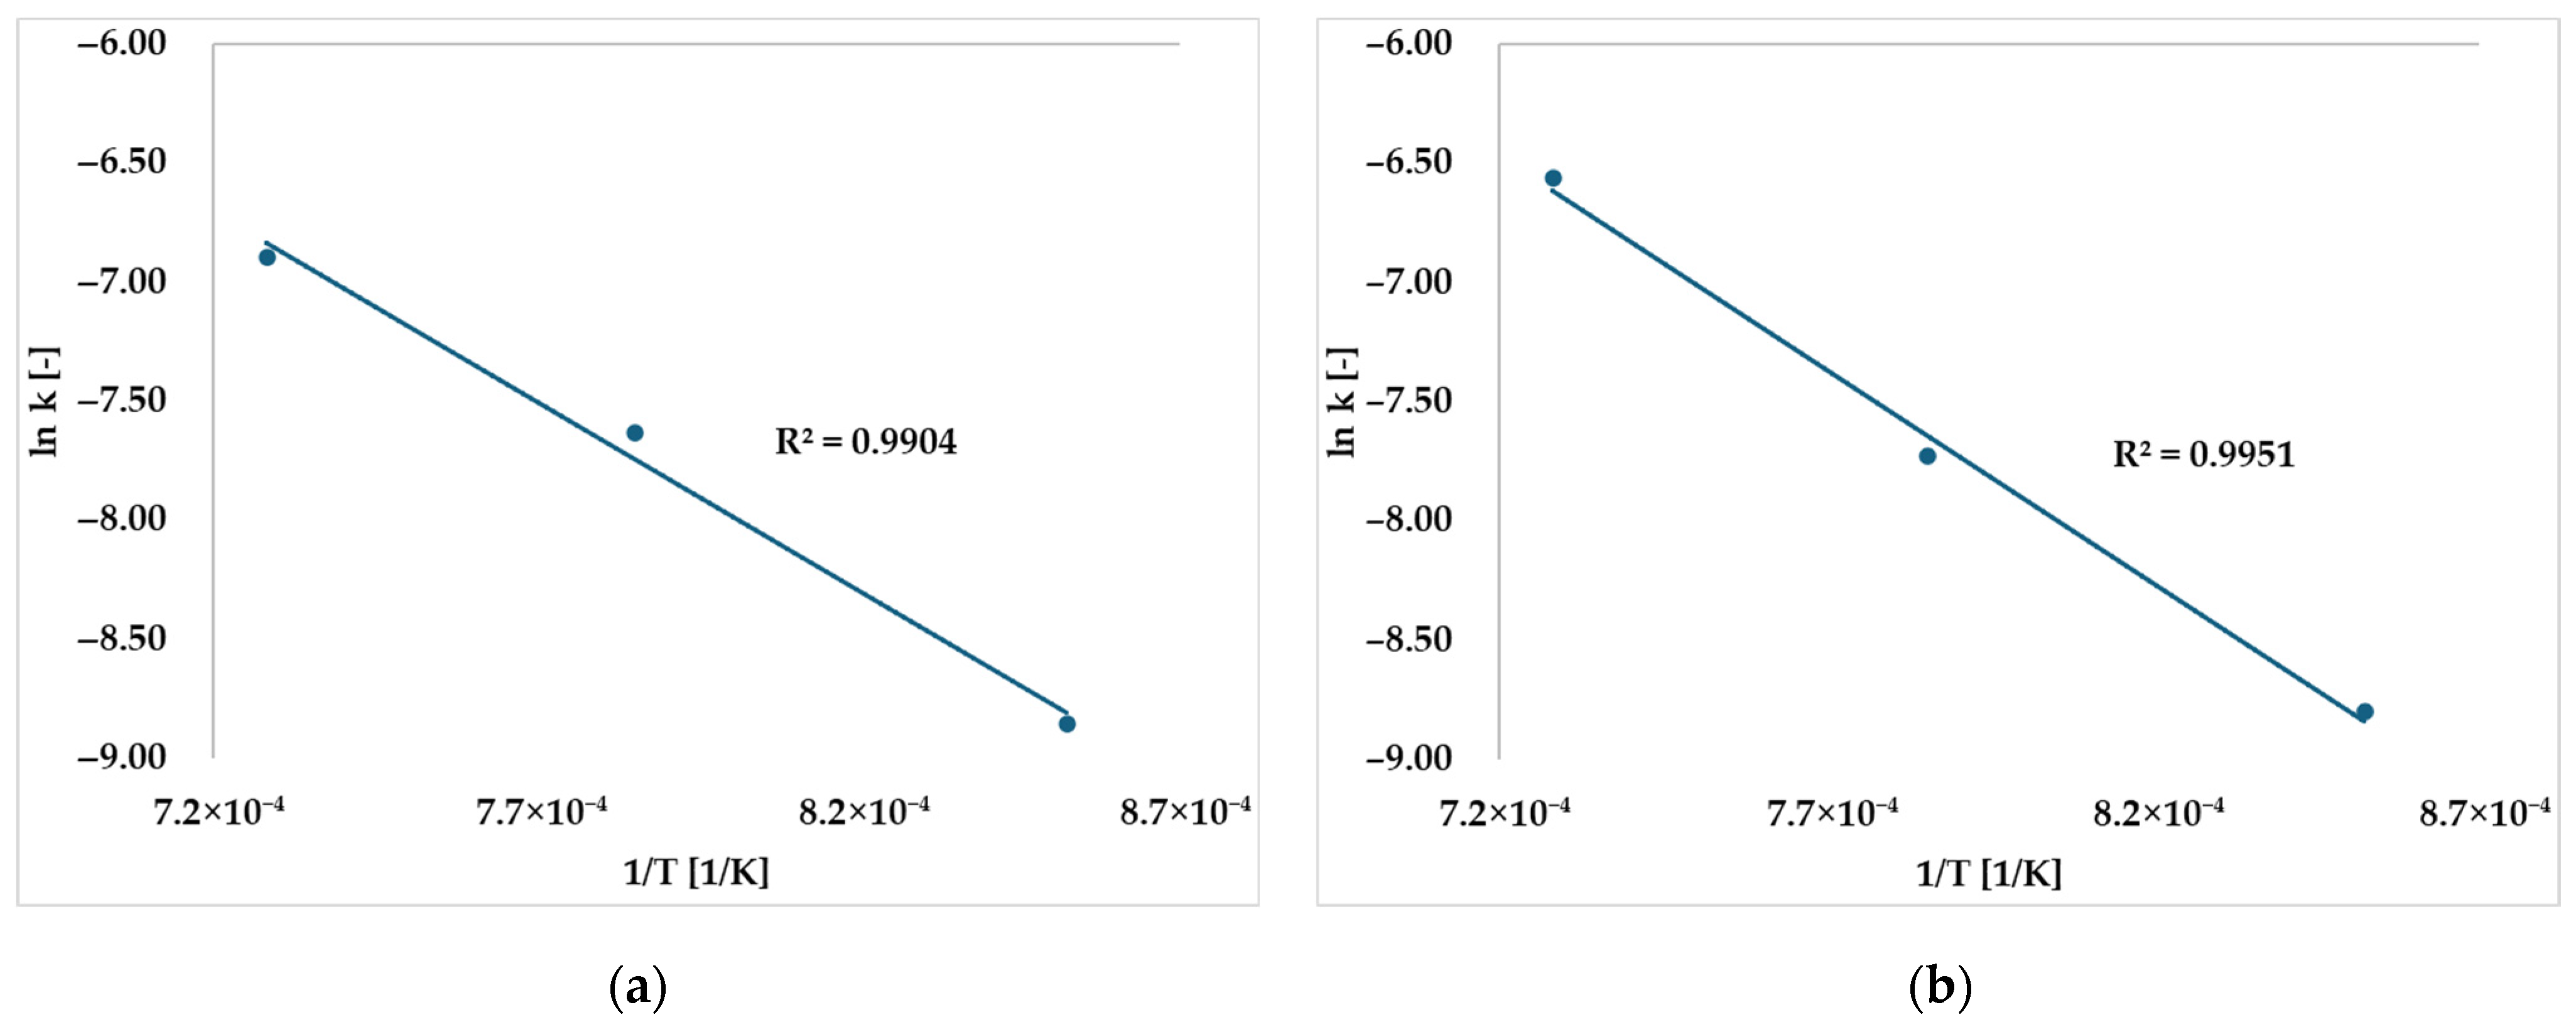
The reaction rate constants obtained from Equations (1) and (2) follow the Arrhenius correlation. Therefore, an Arrhenius plot, as defined by Equation (3), can be used to determine the frequency factor and activation energy (Figure 2).
ln k = ln A E R T ,
where A [1/s] is the frequency factor, E [kJ/mol] is the activation energy, R [J/(K·mol)] is the gas constant, and T [K] is the temperature.
The frequency factor and activation energy of each gasifying agent were statistically determined by calculating the slope and intercept from the estimated equations of the plotted graphs (Table 3). In Table 3, the frequency factor ranges from 102 to 105 s−1, and the activation energy is approximately 93–125 kJ/mol, indicating reasonable results [25,26].

2.2. Design of Process Simulation

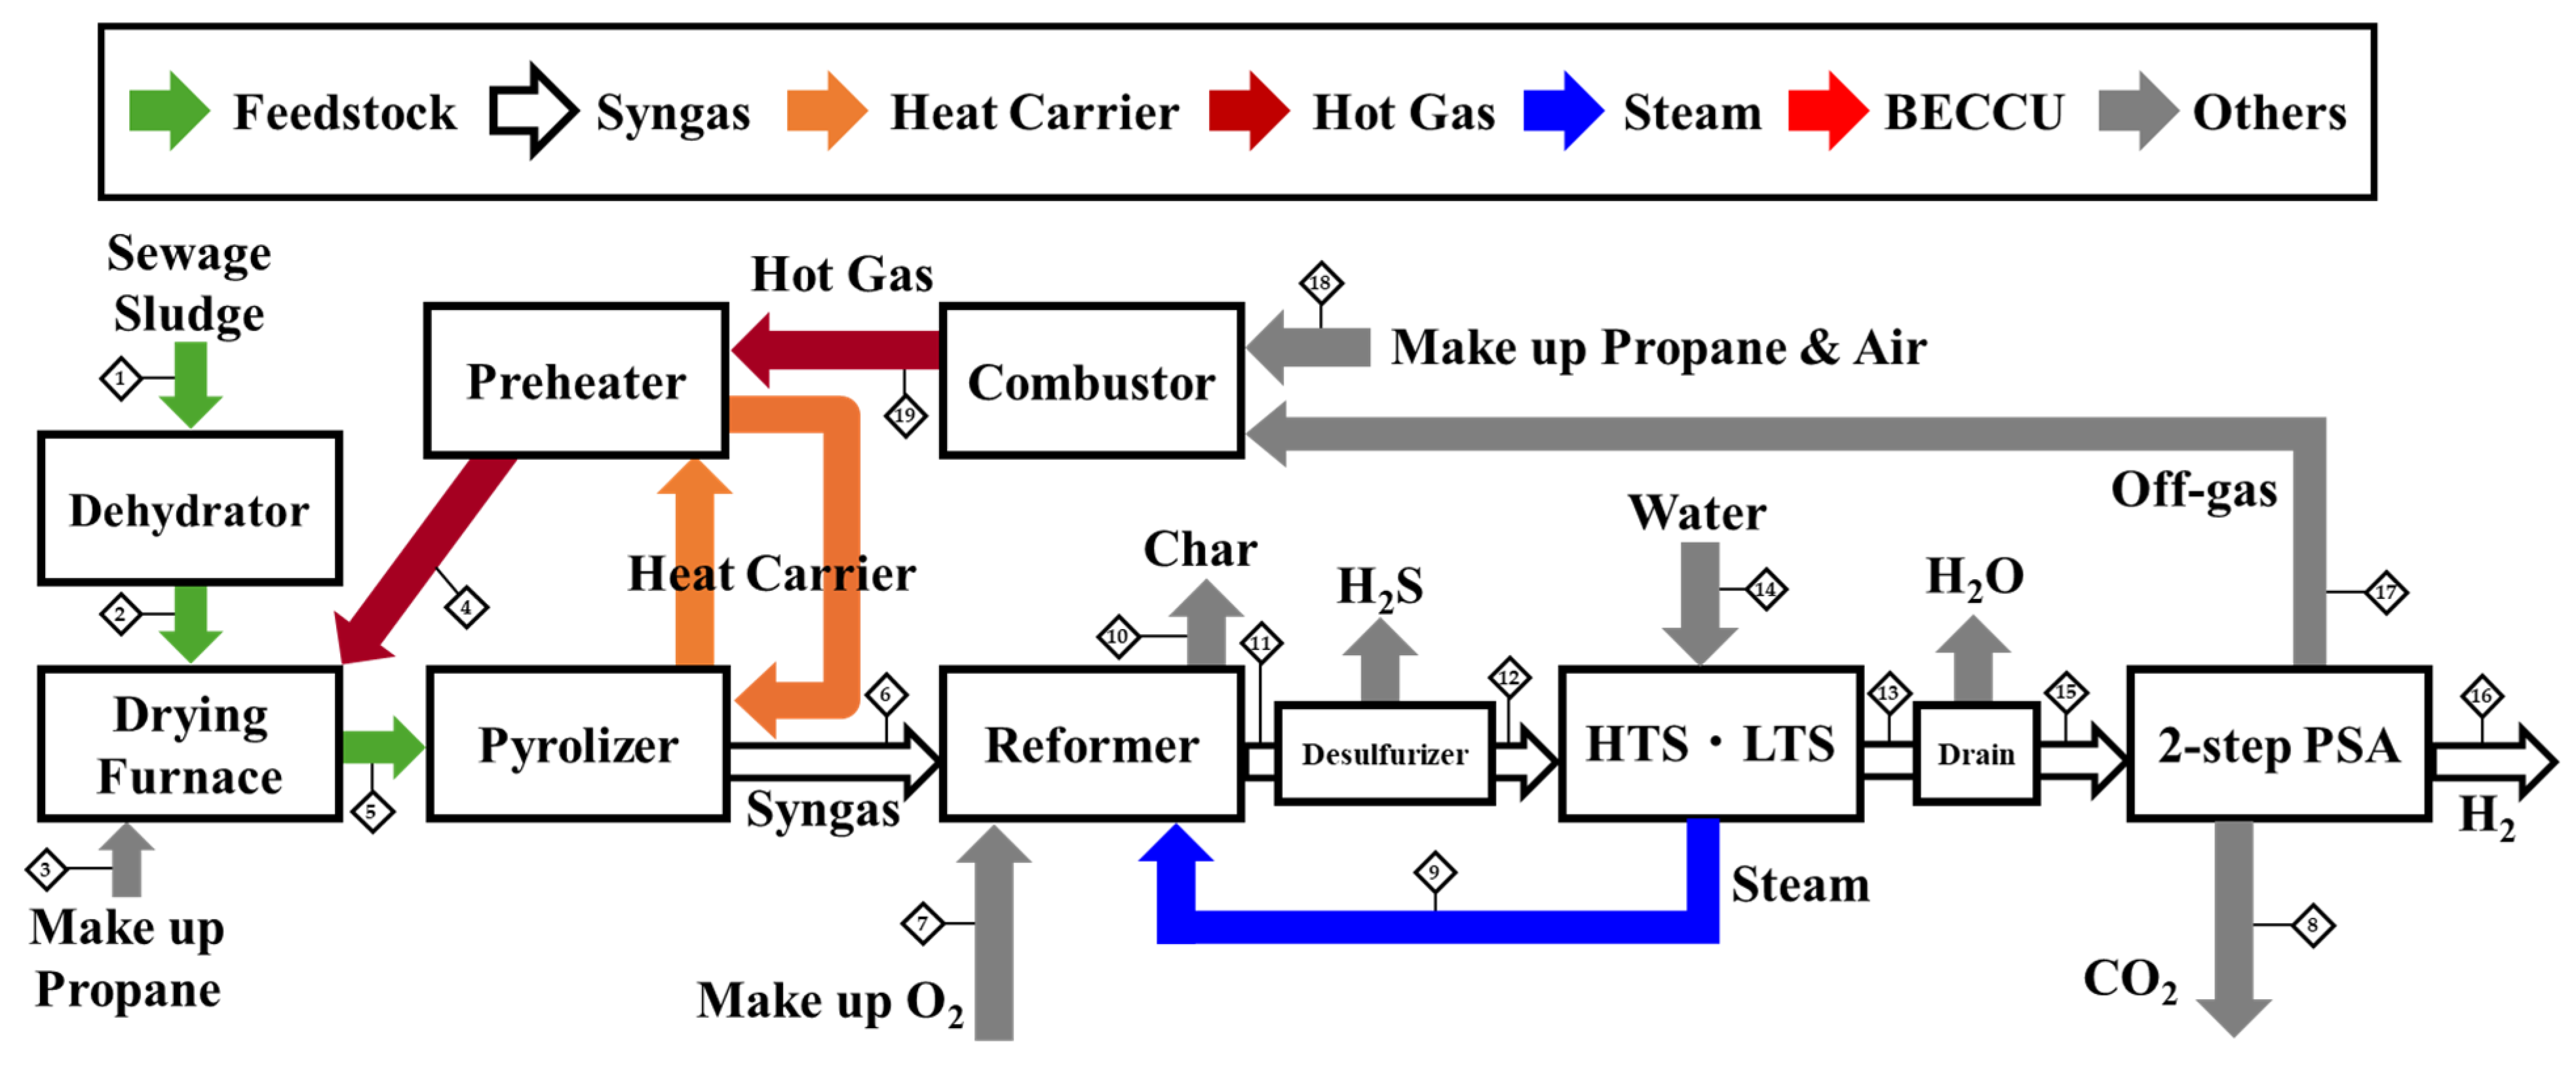
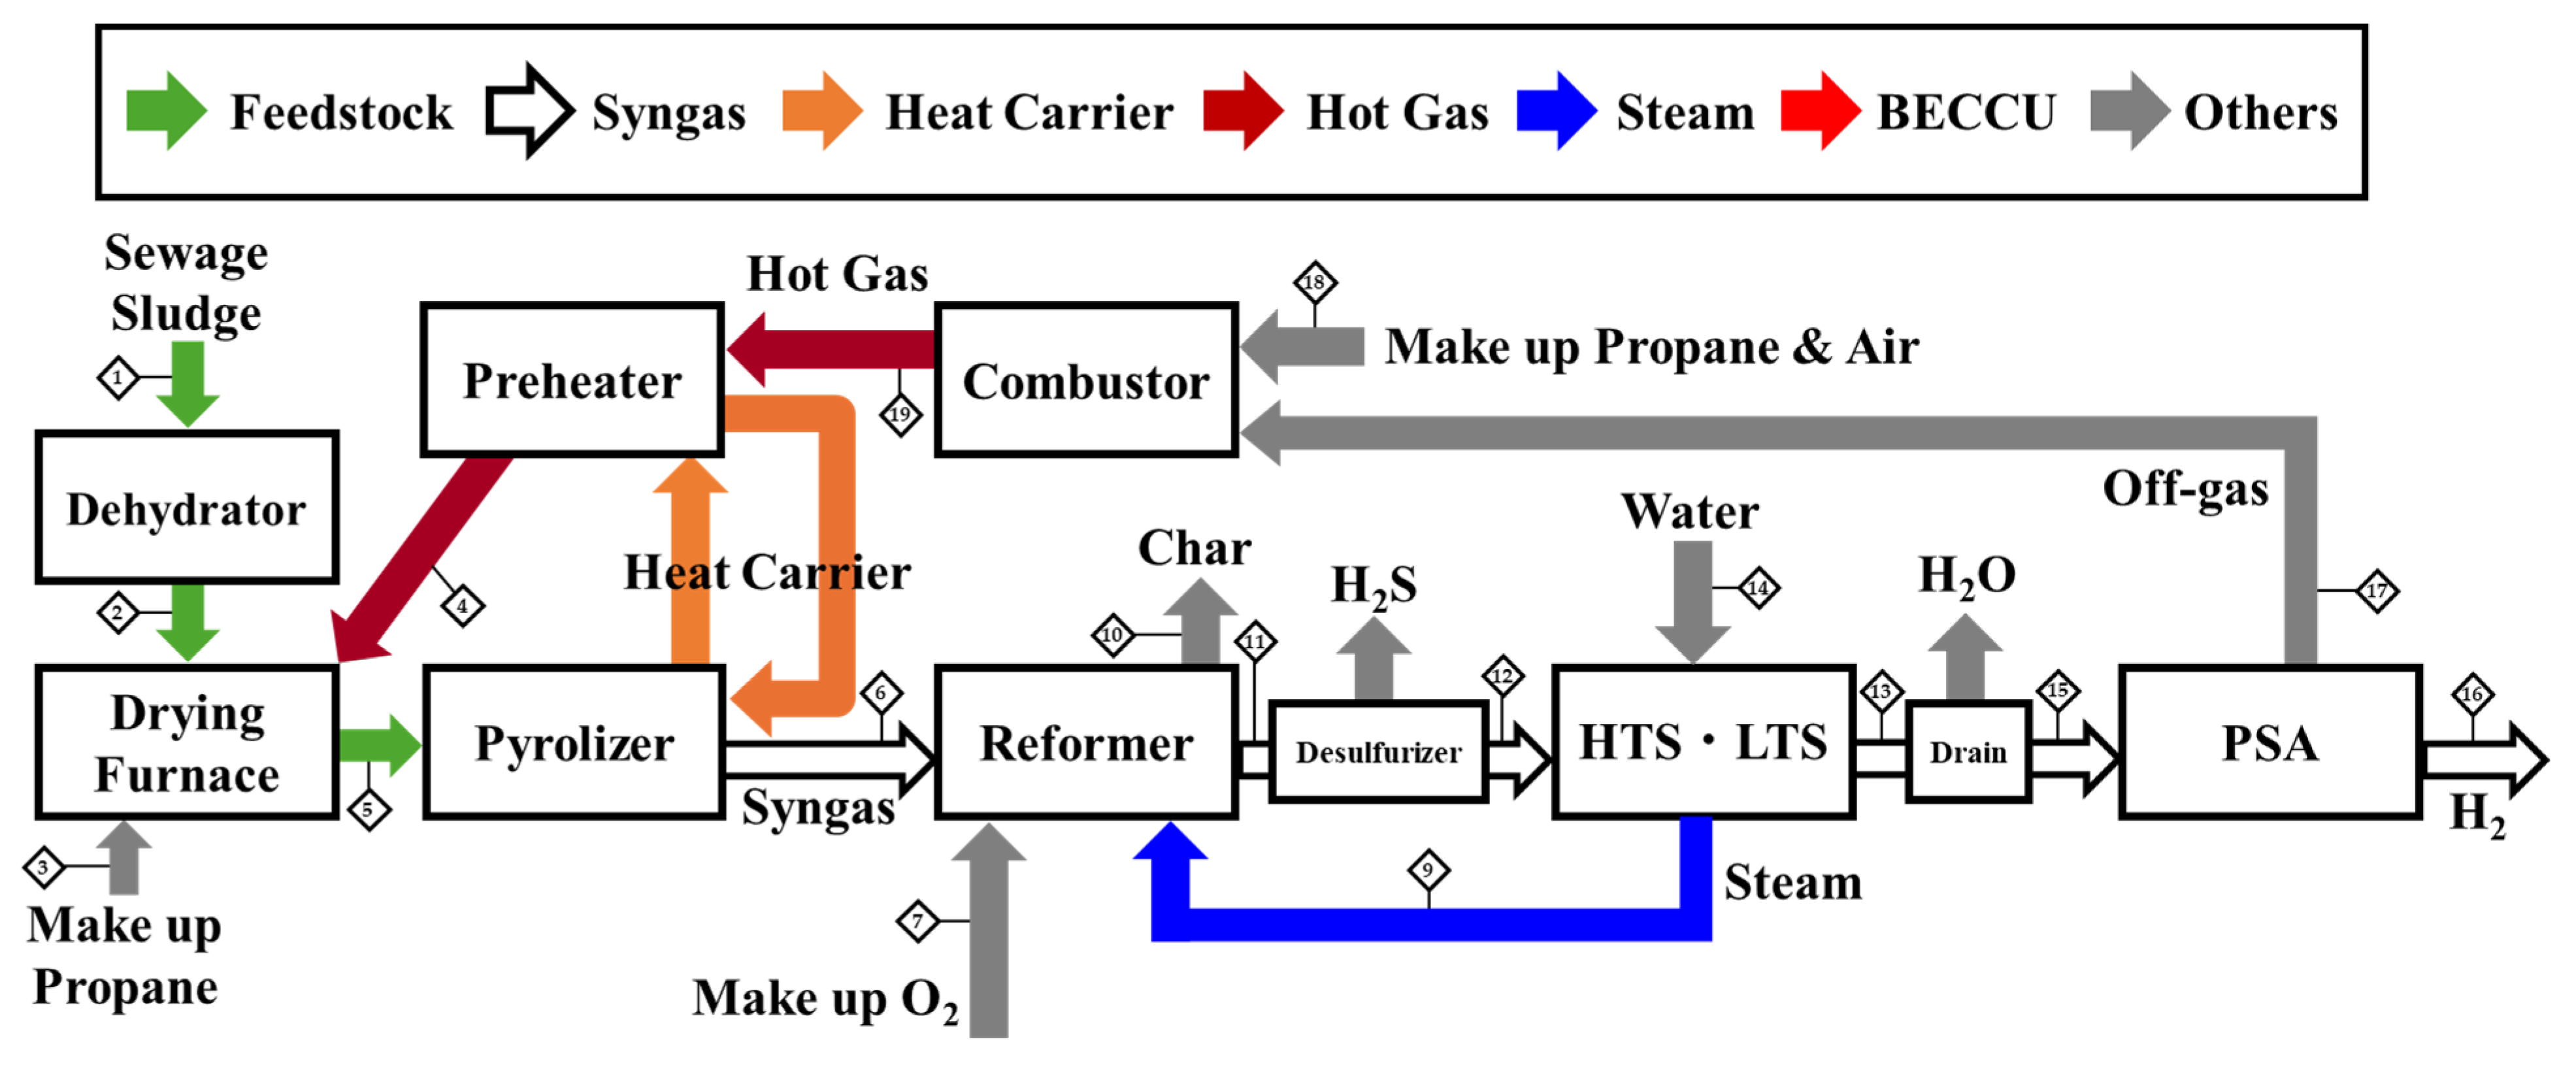
To evaluate the effects of reformer temperature and S/C ratio on CO2 emission reduction when recycling recovered CO2 for gasification, a process simulation of the AGM plant was designed. The simulation was performed using the AVEVA Process Simulation (Version 8.0.0.2238, AVEVA Group, Cambridge, UK) under steady-state conditions (Figure 3). In addition, the stream data table for the most common operating condition of the AGM—reformer temperature of 1173 K and S/C ratio of 1.4—is shown in Table 4. The stream data table includes pressure, temperature, flow rate, and composition. Details of the process are described below.
In the simulation, the design scope was limited to the process downstream of the drying furnace within the AGM, specifically from pyrolysis to PSA. Upstream processes before the pyrolizer, such as dewatering and drying, were not included in the simulation because the process simulation software used in this study cannot design these units. The eco-burdens of the auxiliary power of the dehydrator and drying furnace were accounted for in the LCA. Furthermore, the primary focus of this study is on the BECCU system, particularly the section between the reformer and the 2-step PSA, which plays a key role in CO2 recovery and utilization. For the upstream processes, we referred to the detailed studies by Kobayashi et al. [27] and Nakakubo [28], which specifically investigated dewatering and drying operations for sewage sludge. Their findings were used to estimate the performance and energy requirements of these processes, thereby ensuring the validity and consistency of the overall system analysis.
The AGM can be divided into the following four steps.
First, the feedstock SS was fed into the pyrolizer at a rate of 720 kg/d, corresponding to a feed rate of 0.00833 kg/s for the simulation calculations. In the demonstration AGM plant, the sewage sludge feedstock fed into the pyrolizer is operated with a particle size of 10 mm or less, and this study also assumes a particle size of 10 mm or less. The results of the property analysis of SS during feeding are listed in Table 5. In the pyrolizer, the indirect pyrolysis of SS occurs at 873 K using HCs heated in the preheater by combustion heat in the combustor. Note that in a 1473 K combustor, off-gas and supplementary propane are consumed during combustion. The composition of the syngas after pyrolysis was estimated based on the properties of the SS and SS char (Table 5), as reported by Hamazaki et al. [29] for the pyrolysis product distribution, which is presented in Table 6. As biomass-derived tar consists of many hydrocarbon species, it was simplified by assuming that it comprises two relatively well-studied components: benzene (C6H6) and naphthalene (C10H8). The heat remaining in the HC after preheating was directed to a drying furnace.
Second, the syngas and char obtained after pyrolysis were sent to the reformer, where they underwent conversion through three main reactions: partial oxidation, steam reforming, and CO2 reforming (Table 7). In this study, it was expected that the addition of CO2 would promote Boudouard and tar dry reforming. Additionally, the dry reforming of methane, in which methane reacts with CO2, is likely to occur at high temperatures [30]. The frequency factor and activation energy of the tar gasification reaction rate equation were used in the design. To promote these reactions, O2 (298 K), steam (500 K), and CO2 (298 K) were added as gasifying agents. O2 was externally generated and added to reach the target temperature. Steam was generated through heat exchange with hot gas from the reformer and added at S/C = 1.4 in conventional operation. CO2 was added from the separated and recovered amount using 2-step PSA.
Third, two shift reactors were installed: a high-temperature shift (HTS) reactor with an inlet temperature of 623 K and a low-temperature shift (LTS) reactor with an inlet temperature of 513 K to produce H2-rich gas through water–gas shift reactions [16]. For the removal of H2S contained in the reformed gas, a desulfurizer was installed between the reformer and the HTS unit, which is an earlier stage than the 2-step PSA, referencing Nakayama et al. [18]. In addition, fuel cells intended to use hydrogen produced by the AGM degrade in performance if the hydrogen fuel contains more than 1 ppm of H2S [31]. Therefore, the desulfurizer must remove H2S to less than 1 ppm. Kitayama et al. of our research team have demonstrated that neutralized sediments, a mining waste, can be used as an H2S adsorbent and can remove H2S down to 0 ppm [32]. Accordingly, in this study, it was assumed in the calculations that H2S was completely removed.
Finally, the 2-step PSA, which reduces auxiliary power, separated CO2 from the other gases in the first step and purified H2 in the second step. From 2-step PSA, CO2, and off-gas, in addition to purified H2, were recovered. 2-step PSA is more advantageous than conventional PSA because of its lower operating pressure and higher purification performance [18]. According to Kuroda et al., the purity of recoverable CO2, depending on the gas composition, was 98.4% and the recovery rate was 58.4% [16]. This study assumed that the purity of CO2 was 100% and that the purity of the purified H2 was 98.2%, with a recovery rate of 78.14%.

2.3. LCA

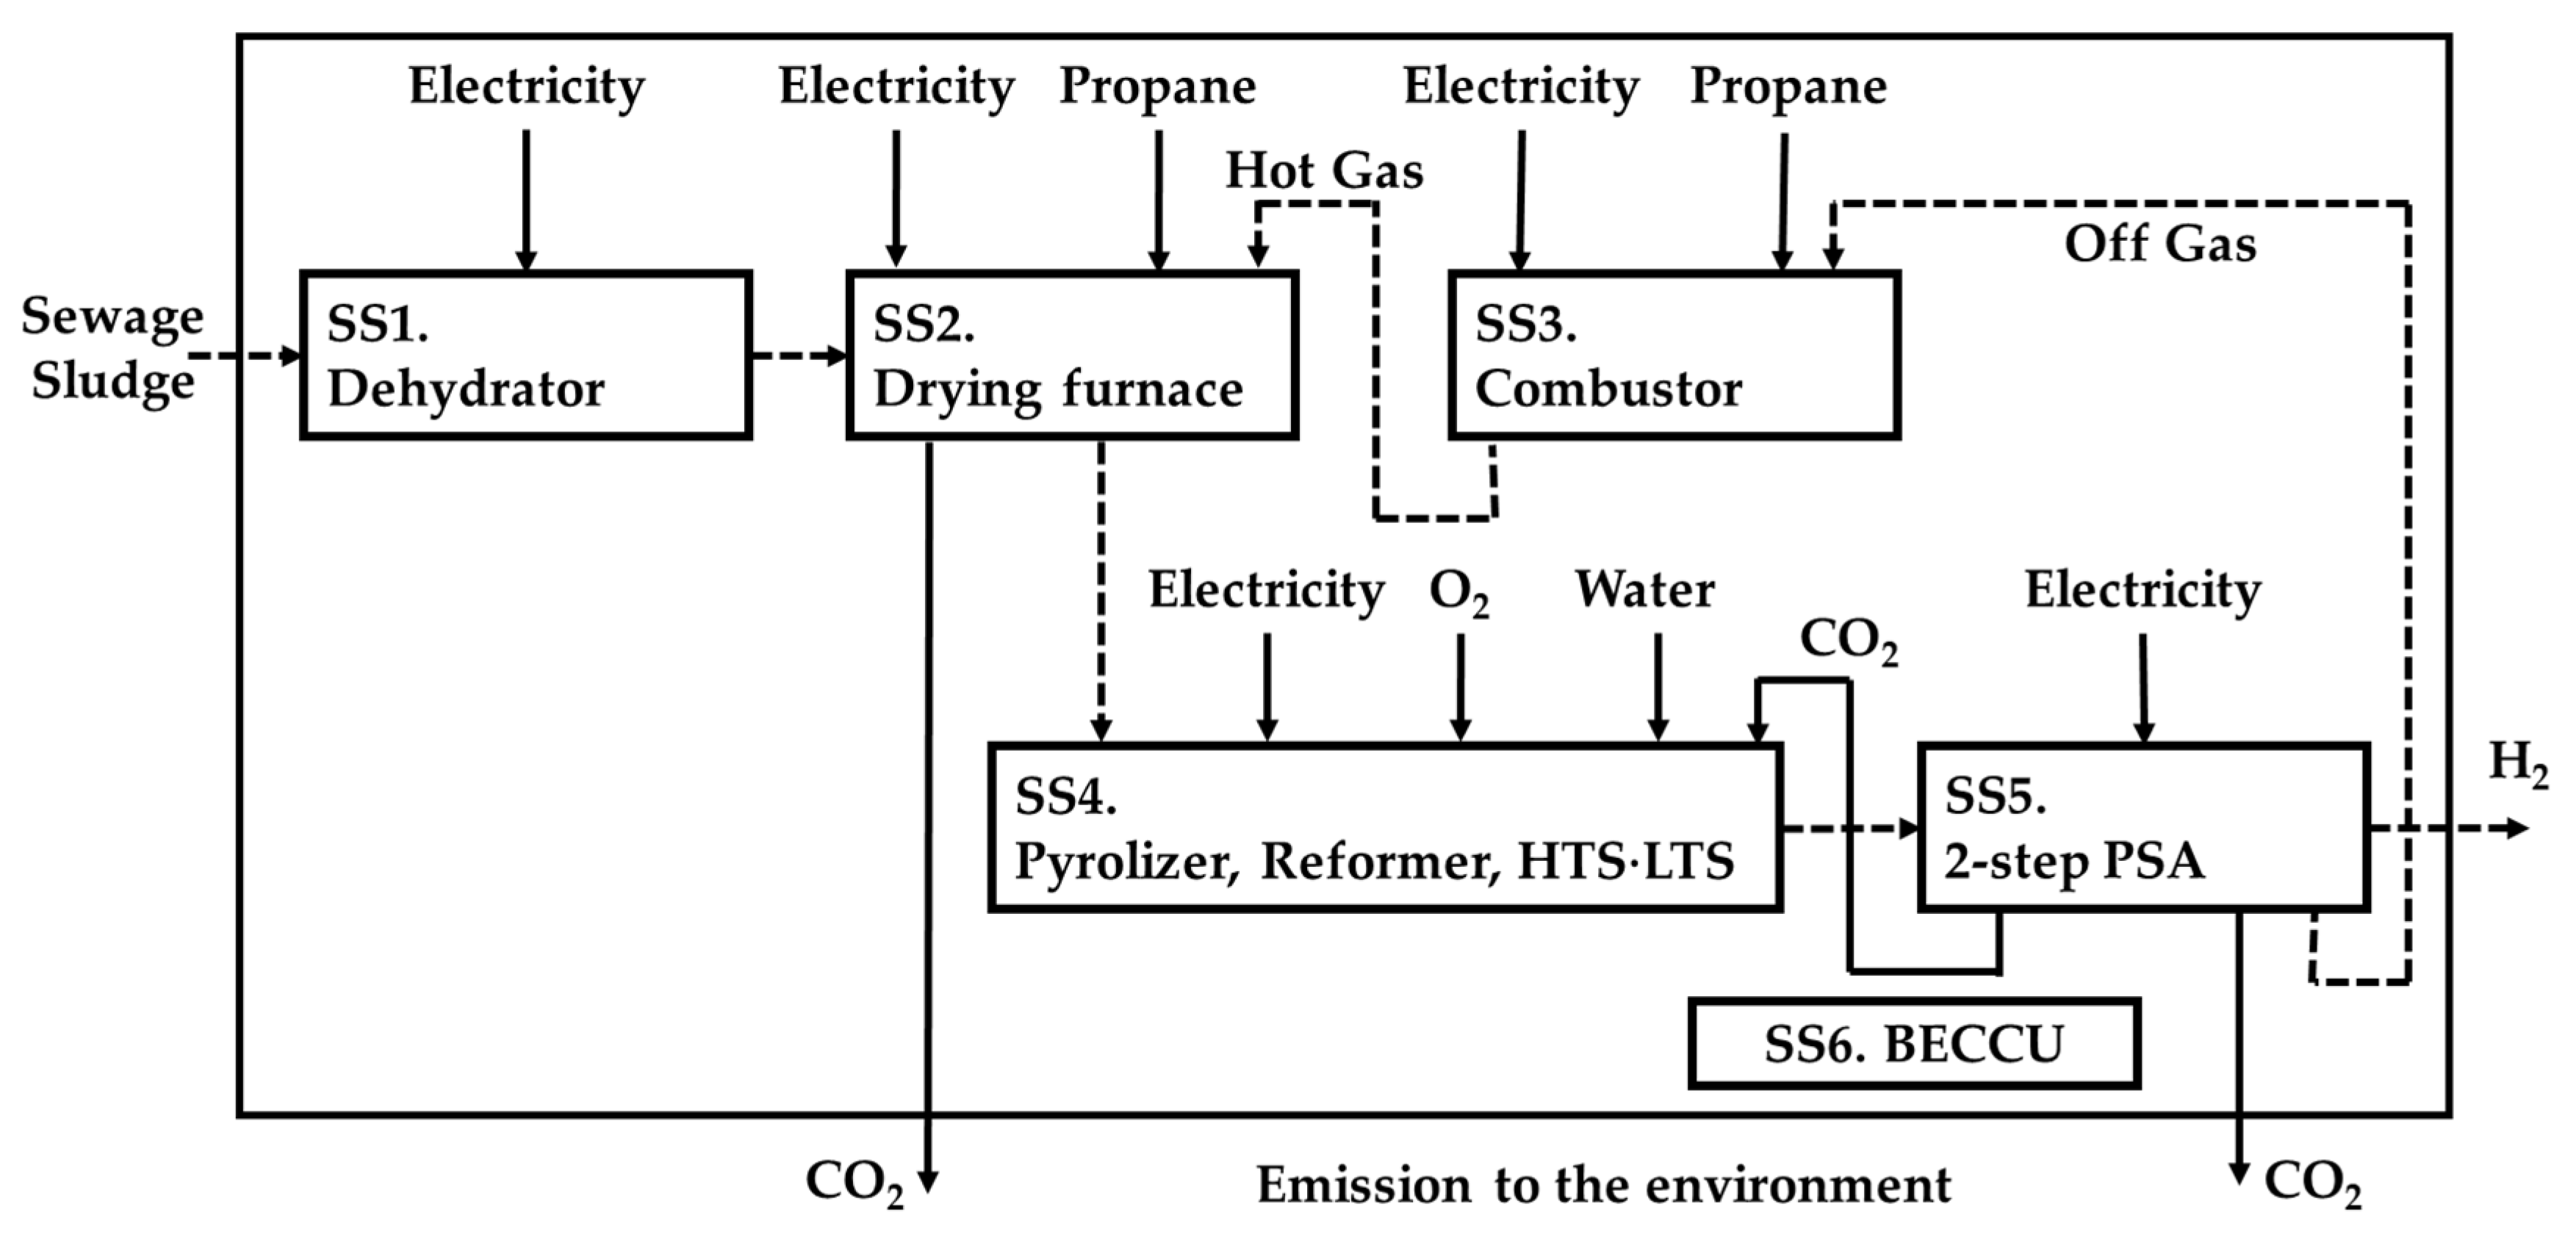
In this study, an environmental impact assessment was conducted using LCA. The functional unit for the evaluation was set to 1 MJ of H2, which corresponds to the produced gas. The system boundary followed the well-to-gate approach, encompassing six defined subsystems from the collection of the SS feedstock onward: dehydrator (SS1), drying furnace (SS2), combustor (SS3), pyrolizer, reformer, HTS, and LTS (SS4), 2-step PSA (SS5), and BECCU (SS6) (Figure 4). In the impact analysis, only the GWP was selected because it is a technology for capturing and utilizing CO2.
Kobayashi et al. assumed that SS1 utilized screw press dewatering to reduce the moisture content of the sewage sludge from 96.5% to 80.0% [27]. The electricity consumption for this process was reported as 5.8 kWh/t of dewatered sludge.
Next, the sewage sludge was dried from a moisture content of 80.0% to 16.2% using a kiln dryer. The electricity required for this process was 85 kWh/t of dewatered sludge [28]. The heat necessary for moisture evaporation was calculated using Equation (4) (SS2). Any shortfall in the required heat was assumed to be provided by propane combustion (LHV = 46.6 MJ/kg).
Q = M H 2 O × c × 373   K 298   K + M H 2 O × L / η ,
where Q [kJ] is the total heat required for drying; M H 2 O [kg] is the amount of water to be removed; c [kJ/(kg·K)] is the specific heat of water; L [kJ/kg] is the latent heat of evaporation of water; and η [%] is the drying efficiency (i.e., the ratio of energy required for evaporation to the energy consumed). According to Kobayashi et al., η was set to 60% [27].
Propane was supplied to provide the necessary heat for heating the heat HCs, and the electricity consumption of the air supply pump required for combustion was also accounted for (SS3).
The power required to produce oxygen for the reformer, the electricity consumption of the pumps supplying the gasifying agents (oxygen and CO2), and the power needed to supply water for heat exchange with high-temperature gas after reforming were all included (SS4).
Finally, based on a study by Kuroda et al., the energy required for the 2-step PSA was assumed [16]. The operating performance of the 2-step PSA generally depends on the composition and flow rate of the supplied syngas, so a detailed process simulation would be necessary for precise evaluation. However, because the primary focus of this study was to conduct an LCA for the entire process, reference values were used for simplicity. Regarding CO2 accounting in the BECCU system, the CO2 recovered by the 2-step PSA and added to the reformer was subtracted from the total CO2 emissions (SS6). Any CO2 not recovered by the 2-step PSA, which became off-gas, was considered to have zero emissions due to its carbon neutrality. The intensities of electricity, propane, oxygen production, water, and the 2-step PSA used in the LCA calculations described above are summarized in Table 8.

2.4. Evaluation Method

The effects of BECCU, as determined by the above method, were evaluated using the following indicators: GWP, H2 production, syngas composition, auxiliary power, CGE, recycled CO2/C, and reaction rates of char and tar. The H2 production was defined as the amount of H2 that could be produced from 1 kg of SS feedstock, and the auxiliary power was defined as the power consumed per second to produce 1 MJ of H2. The syngas composition consisted of four components –H2, CO, CO2, and CH4 after reforming, and LTS was used to observe the effect of CO2 addition on the reactions. The CGE is defined as follows:
CGE = L H V p r o d u c t   H 2 + L H V o f f g a s L H V f e e d s t o c k .
The CO2 recovered and added in 2-step PSA was defined as recycled CO2. The amount of recycled CO2 was defined as follows:
r e c y c l e d   C O 2 / C = m o l e s   o f   C O 2   r e c o v e r e d m o l e s   o f   c a r b o n   i n   f u e l .
The following equation defines the reaction rates of char and tar with CO2. Additionally, the CO2 was divided into pyrolysis CO2 and recycled CO2 to examine the effects of recycled CO2.
C h a r   r e a c t i o n   r a t e = m o l e s   o f   c h a r   r e a c t e d   w i t h   p y r o l y s i s   C O 2 + r e c y c l e d   C O 2 + o t h e r s m o l e s   o f   c h a r   b e f o r e   r e f o r m e r .
T a r   r e a c t i o n   r a t e = m o l e s   o f   t a r   r e a c t e d   w i t h   p y r o l y s i s   C O 2 + r e c y c l e d   C O 2 + o t h e r s m o l e s   o f   t a r   b e f o r e   r e f o r m e r .
*Tar = C 6 H 6 + C 10 H 8
The amount of recycled CO2 consumed in the reaction between the char and tar is defined by the following equation:
recycled   C O 2   reaction   rate = m o l e s   o f   C O 2   r e a c t e d   w i t h   c h a r   a n d   t a r m o l e s   o f   r e c y c l e d   C O 2   a d d e d   t o   t h e   r e f o r m e r .
In this study, the GWP was used as a quantitative indicator of the synergistic effect of direct CO2 recovery and improved gasification efficiency. The GWP was calculated using the following equation:
GWP   [ g - C O 2 eq . / M J - H 2 ]   = i = 1 5 S S i S S 6 1   M J   o f   H 2   p r o d u c t i o n .
Here, SS1 to SS5 represent the CO2 emissions from each process step involved in producing 1 MJ of H2, and SS6 represents the amount of CO2 recovered and recycled within the system. Increasing the quantity of CO2 recovered and recycled in SS6 directly reduces the GWP.
In addition, the reuse of the recovered CO2 enhances the gasification efficiency, thereby increasing H2 production. This increase in H2 output results in a relative decrease in the total CO2 emissions from SS1 to SS5 per unit of H2 produced. Consequently, the reduction in GWP is the combined result of (i) direct CO2 removal from the system boundary and (ii) the indirect effect of improved process efficiency. This combined mechanism constitutes the “synergistic effect” referred to in the manuscript.
Furthermore, the calculation accounts for energy penalties, including heat losses occurring during heat exchange in the dryer and heat exchanger units, ensuring that the GWP values reflect realistic process performance.

3. Results

3.1. Sensitivity Analysis Results

3.1.1. Effect of Reformer Temperature

A sensitivity analysis of the reformer temperature was conducted in the range from 973 K, where carbon deposition is unlikely to occur, to 1373 K, which is the heat-resistance temperature of the furnace [35]. The S/C ratio was set to 1.4, as under conventional operating conditions.
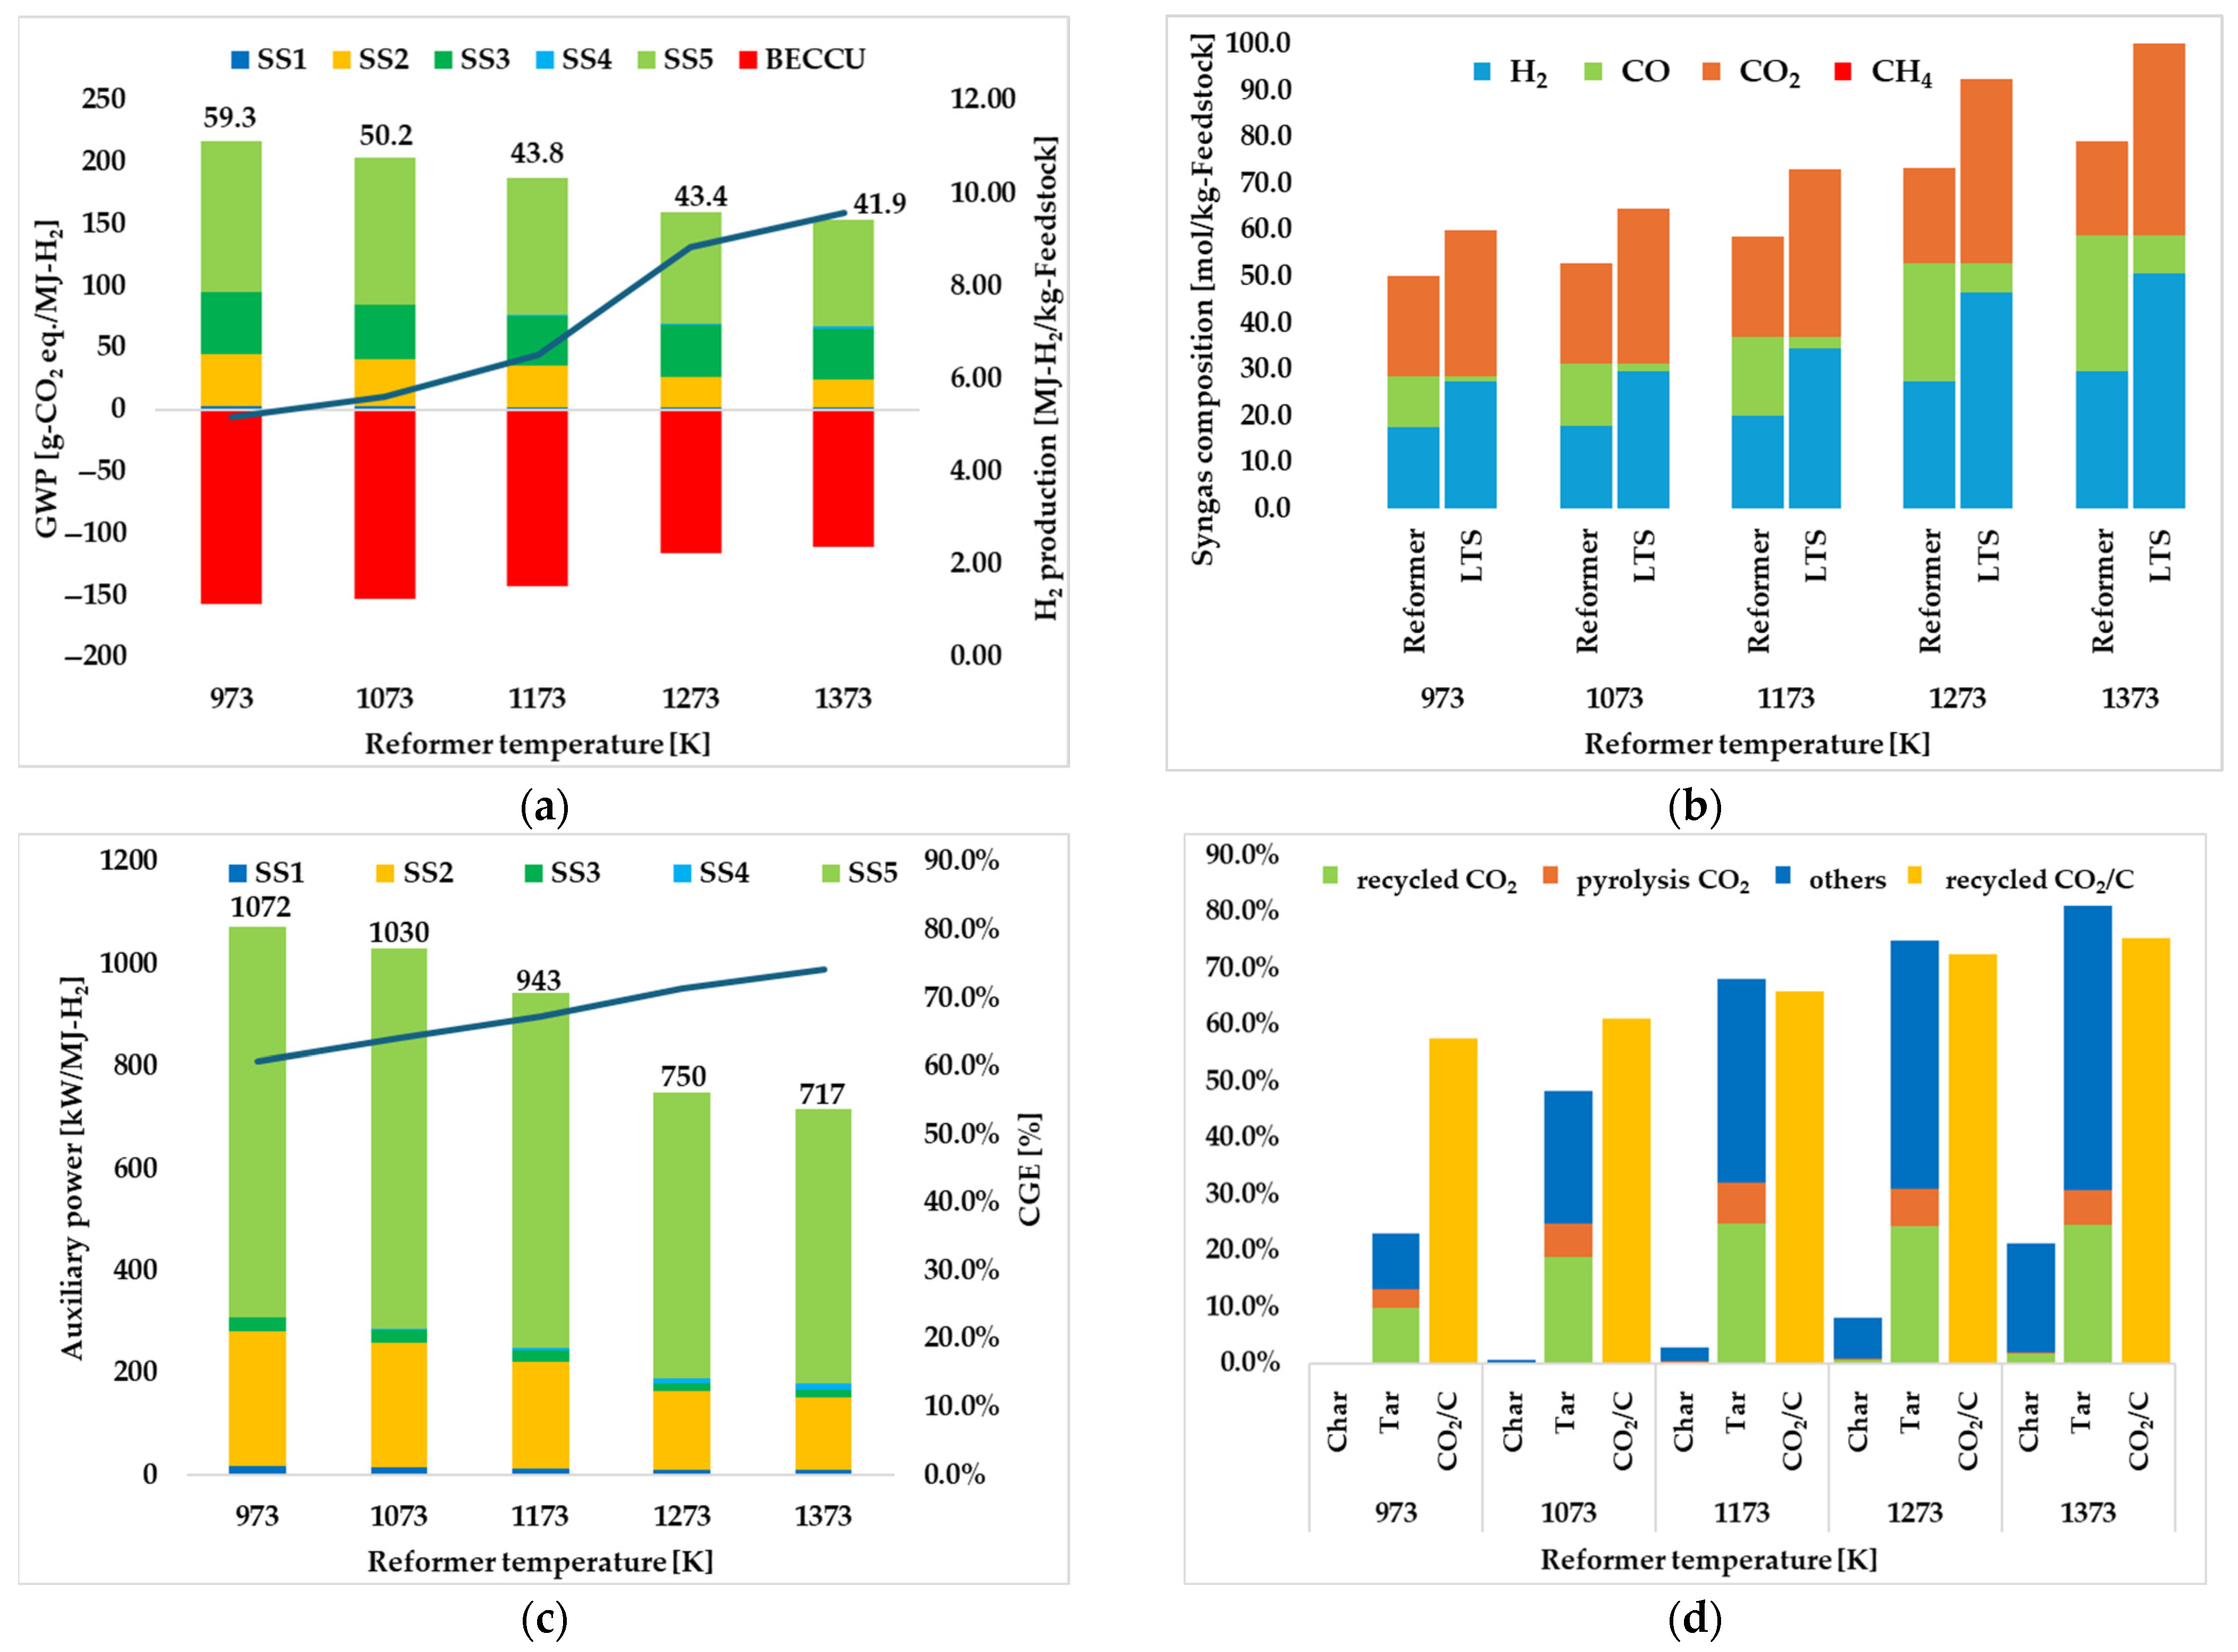
Figure 5a and Table 9 show that increasing the reformer temperature results in a significant reduction in the GWP. Specifically, increasing the temperature from 973 to 1373 K reduced the GWP from 59.3 g-CO2 eq./MJ-H2 to 41.9 g-CO2 eq./MJ-H2, representing a reduction of approximately 29%. This result demonstrates that BECCU, which utilizes CO2 derived from biomass and recovered through a 2-step PSA process as a gasifying agent within the same process, effectively reduces the CO2 intensity of green H2 production.
The reduction in GWP can be attributed to the synergistic effect of reusing recovered CO2 as a gasifying agent and high-temperature operation, both of which improve gasification efficiency and increase H2 production. The reuse of CO2, which was not utilized in the conventional process, as a gasifying agent promoted the decomposition of char and tar. As the reformer temperature increased, the total char reaction rate rose significantly from approximately 0% to 21.2%, and the total tar reaction rate increased from 23.0% to 83.4% (Table 9).
In this gasification process, although the overall reaction with steam predominates, as shown in Figure 5d, the contribution of recycled CO2, central to this study, increases significantly with increasing temperature.
The reason for this is the increase in CO2 concentration during the process. As shown in Figure 5b, CO at the reformer outlet is converted to CO2 in the subsequent HTS and LTS processes. Therefore, as the reformer temperature increases and more char and tar are decomposed, a greater amount of CO2 is generated and recovered throughout the process. The recycled CO2 was reused as a gasifying agent, creating a positive cycle that promoted the decomposition of char and tar. Regarding methane reforming, steam reforming was the dominant process because of the presence of steam in the atmosphere, whereas dry reforming occurred only minimally. This improvement directly increased gasification efficiency, leading to higher H2 production per unit of feedstock. As shown in Table 9 and Figure 5a, H2 production increased approximately 1.9 times, from 5.17 MJ/kg-SS (973 K) to 9.59 MJ/kg-SS (1373 K). Because more H2 can be produced from the same amount of feedstock, the relative environmental impact per MJ of H2, that is, the GWP, was significantly reduced.
Additionally, the improvement in gasification efficiency resulted in enhancements in CGE and auxiliary power. The CGE increased from 60.9% to 74.2% as the reformer temperature increased (Table 9 and Figure 5c). This indicates that the chemical energy of the feedstock was converted more efficiently into H2 and CO at high temperatures. In contrast, the 2-step PSA, which is central to the BECCU, remains the primary source of power consumption, accounting for approximately 70% of the entire process (Table 9). In this simulation, the overall power consumption increased due to higher H2 production, driven by the larger volume of processed syngas. However, when considering energy consumption per purified H2, the total auxiliary power required to produce 1 MJ of H2 decreased from 1072 kW at 973 K to 717 kW at 1373 K (Figure 5c).
From the above, it can be concluded that the introduction of BECCU and the increase in reformer temperature are effective in reducing the GWP in AGM plants. However, operating above the furnace’s heat-resistance temperature may cause damage to the furnace and shorten its lifespan [36]. In practice, in the demonstration plant of the AGM, SUS304 was used as the furnace material, with a maximum heat-resistance temperature of 1673 K; however, during actual operation, the operating temperature was reduced to below 1273 K. Furthermore, furnaces capable of withstanding higher temperatures generally incur increased costs. Therefore, it is necessary to select furnace materials and designs while considering the trade-offs between operating temperature requirements, durability, and economic factors.

3.1.2. Effect of S/C

A sensitivity analysis of the S/C ratio was conducted within the range from 1.4, which is the conventional operating condition, to 4.0, which can be generated through heat exchange with the hot gas after the reformer. The S/C ratio of less than 1.4 was not considered because carbon deposition may occur [37]. The reformer temperature was set to 1173 K under conventional operating conditions.
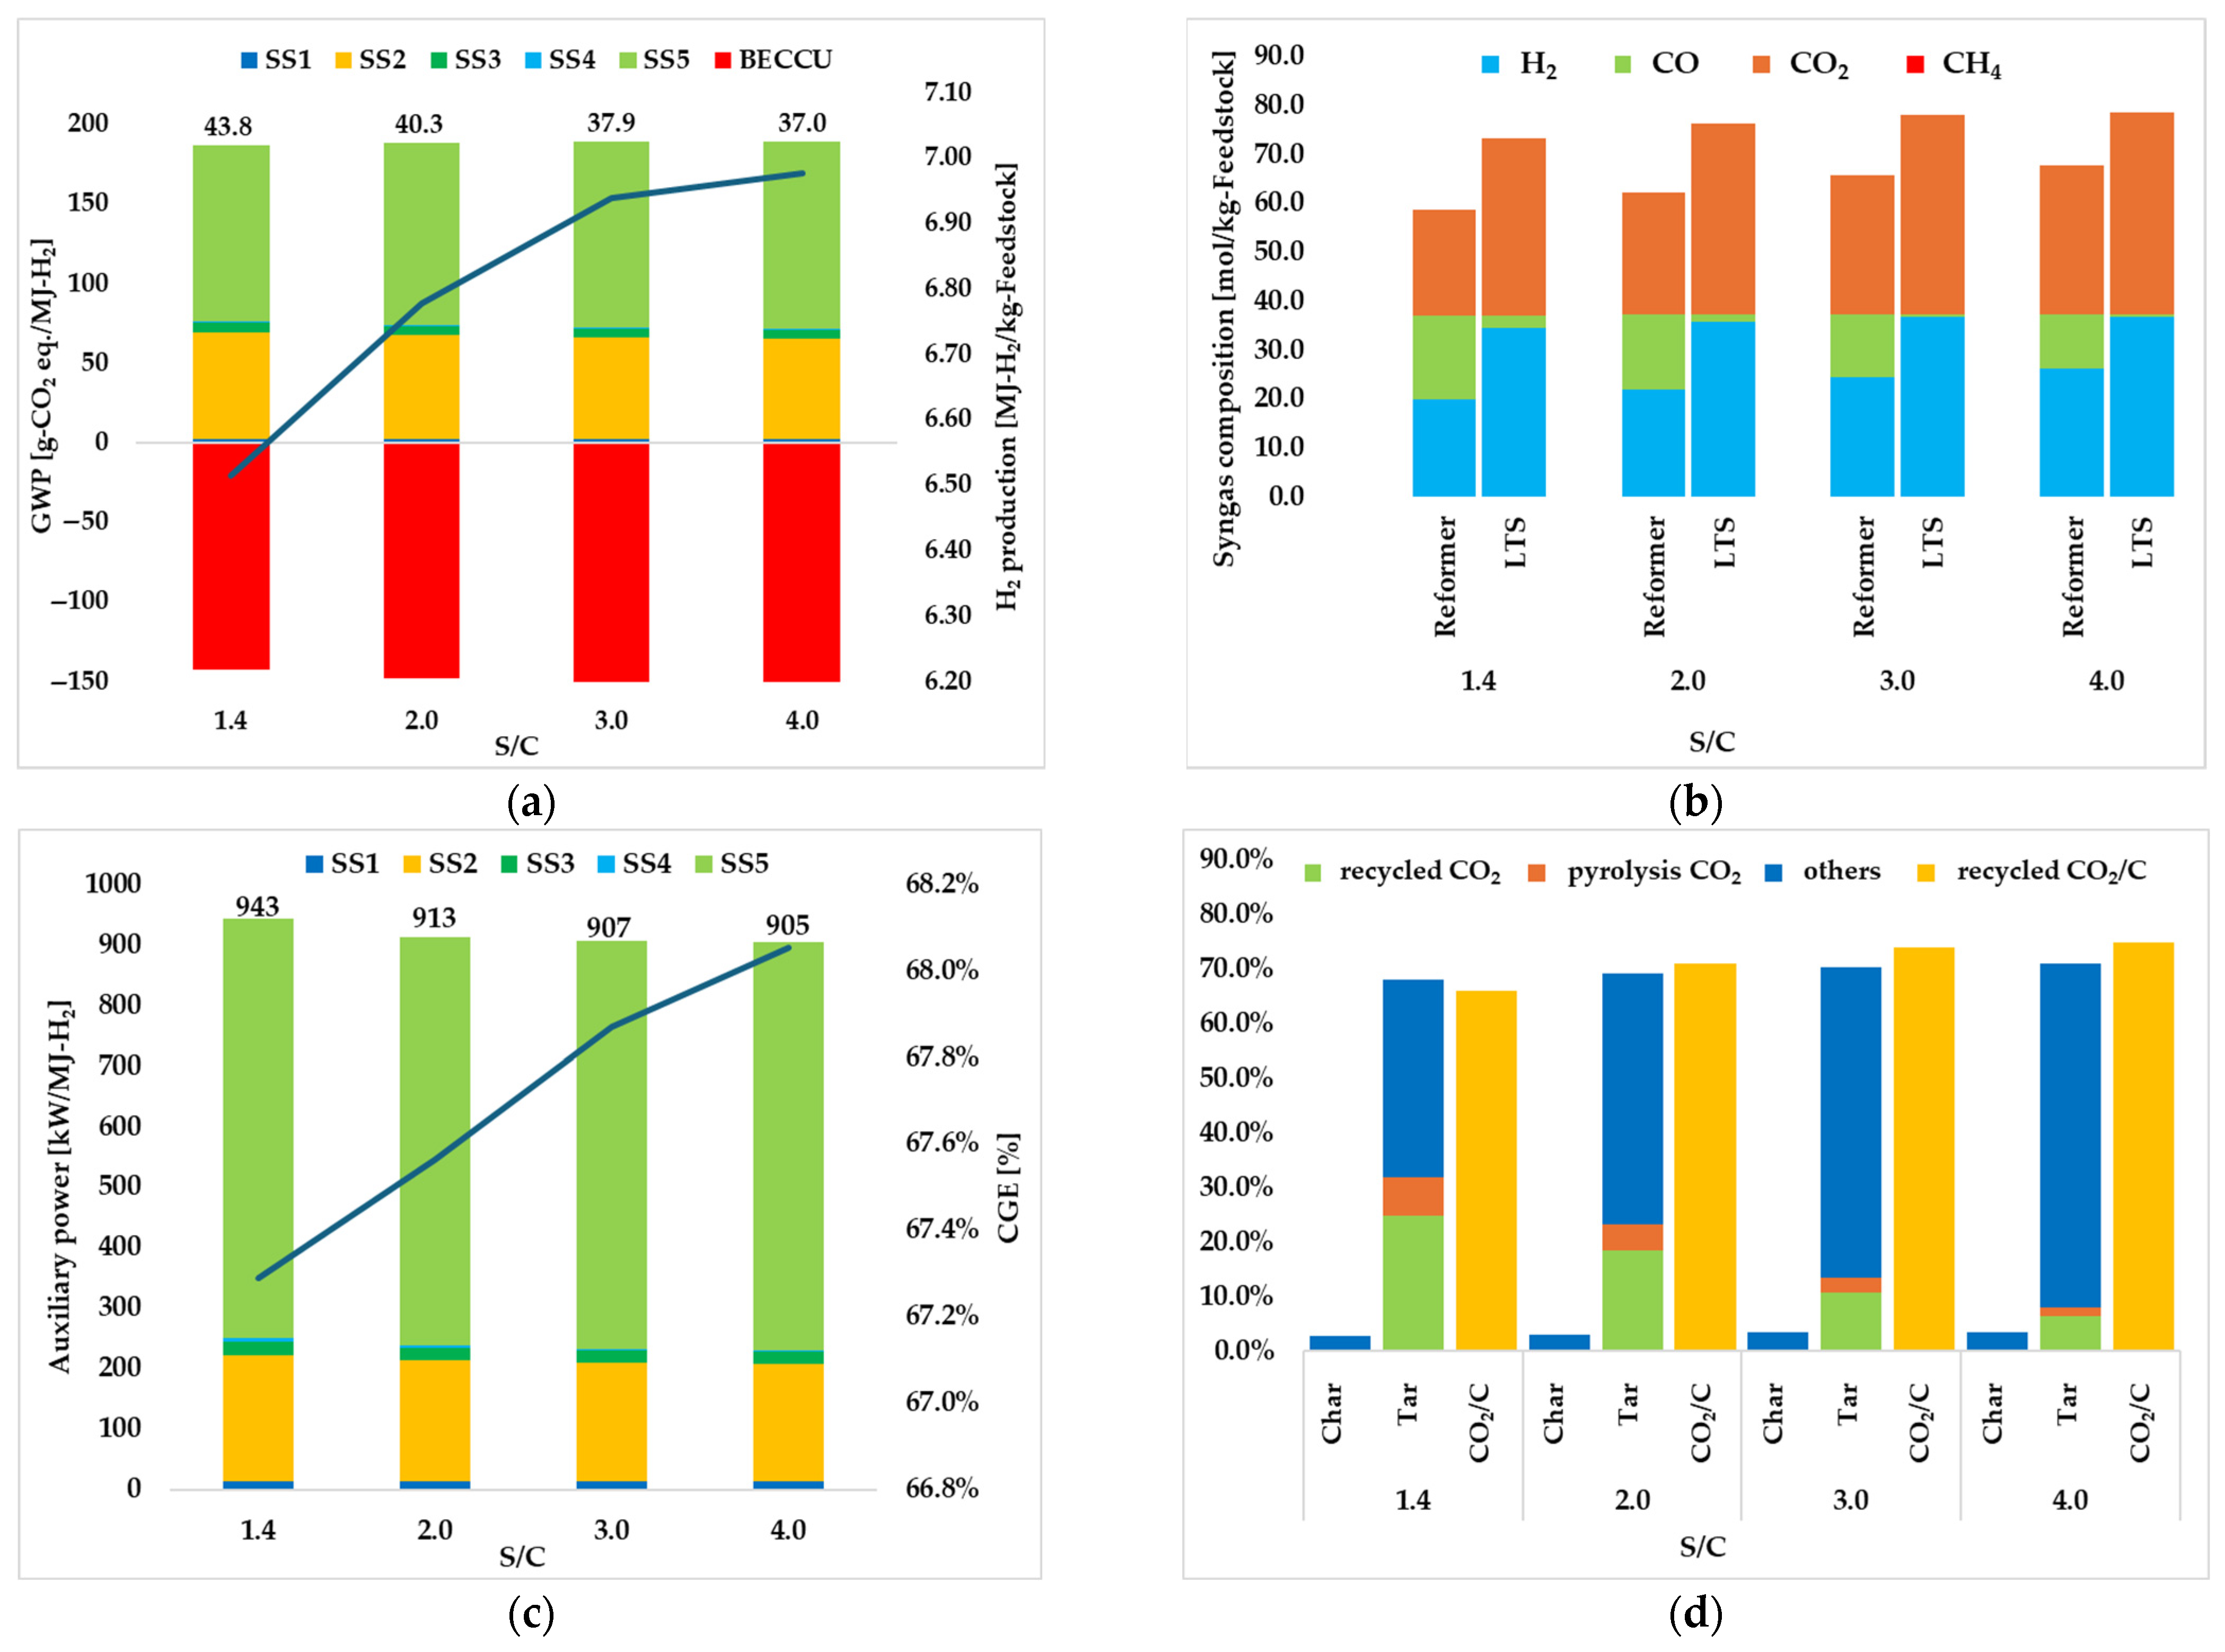
As shown in Figure 6a and Table 10, increasing the S/C from 1.4 to 4.0 reduced the GWP from 43.8 g-CO2 eq./MJ-H2 to 37.0 g-CO2 eq./MJ-H2. This reduction in GWP is attributed to the gradual increase in H2 production from 6.51 MJ/kg-SS to 6.98 MJ/kg-SS. Thus, increasing the S/C ratio was found to be an effective means of reducing GWP.
The primary reason for the increase in H2 production is the promotion of the water–gas shift reaction (WGS). An increase in the amount of steam input caused the WGS equilibrium to shift significantly toward the product side (right side). This promoted the conversion of CO to H2, resulting in an improved final H2 yield. This is supported by the increase in H2 concentration after LTS, accompanied by an increase in the S/C ratio, as shown in Figure 6b.
However, the gasification reaction pathways of char and tar differed from those at the reformer temperature. As shown in Figure 6d, increasing the S/C ratio reduced the contribution of gasification by recycled CO2. This is believed to be because the abundant steam competes with CO2 in the gasification reaction with char and tar, exerting a dominant effect. In other words, it can be suggested that H2 production under these conditions relied more on the conventionally known “gasification by steam” and “WGS reaction” than on “gasification by CO2,” which is the core mechanism of BECCU.
Additionally, their effects on the CGE and auxiliary power are limited. The CGE improved slightly from 67.3% to 68.1%; however, the total auxiliary power required to produce 1 MJ of H2 decreased slightly from 943 kW to 905 kW (Figure 6c). This is believed to be due to the limited increase in H2 production and the increased load on the 2-step PSA resulting from the higher CO2 production caused by the WGS.
Based on the above, although the reduction in GWP from increasing the S/C ratio is primarily due to the promotion of WGS rather than the effect of BECCU, it has proven to be an effective strategy in AGM plants; it reduces GWP through increased H2 production and negative emissions resulting from CO2 recovery. In particular, increasing the S/C ratio is effective because it enables the efficient utilization of waste heat after reforming. However, H2 production and GWP tend to converge, and excessive steam addition leads to a drop in the reformer temperature, resulting in the combustion of H2 and CO, which in turn increases the GWP. In addition, the amount of steam that can be generated through heat exchange with the hot gas after reforming is limited. Using external fossil energy to generate supplementary steam would damage the GWP.

3.2. Effectiveness of 2-Step PSA

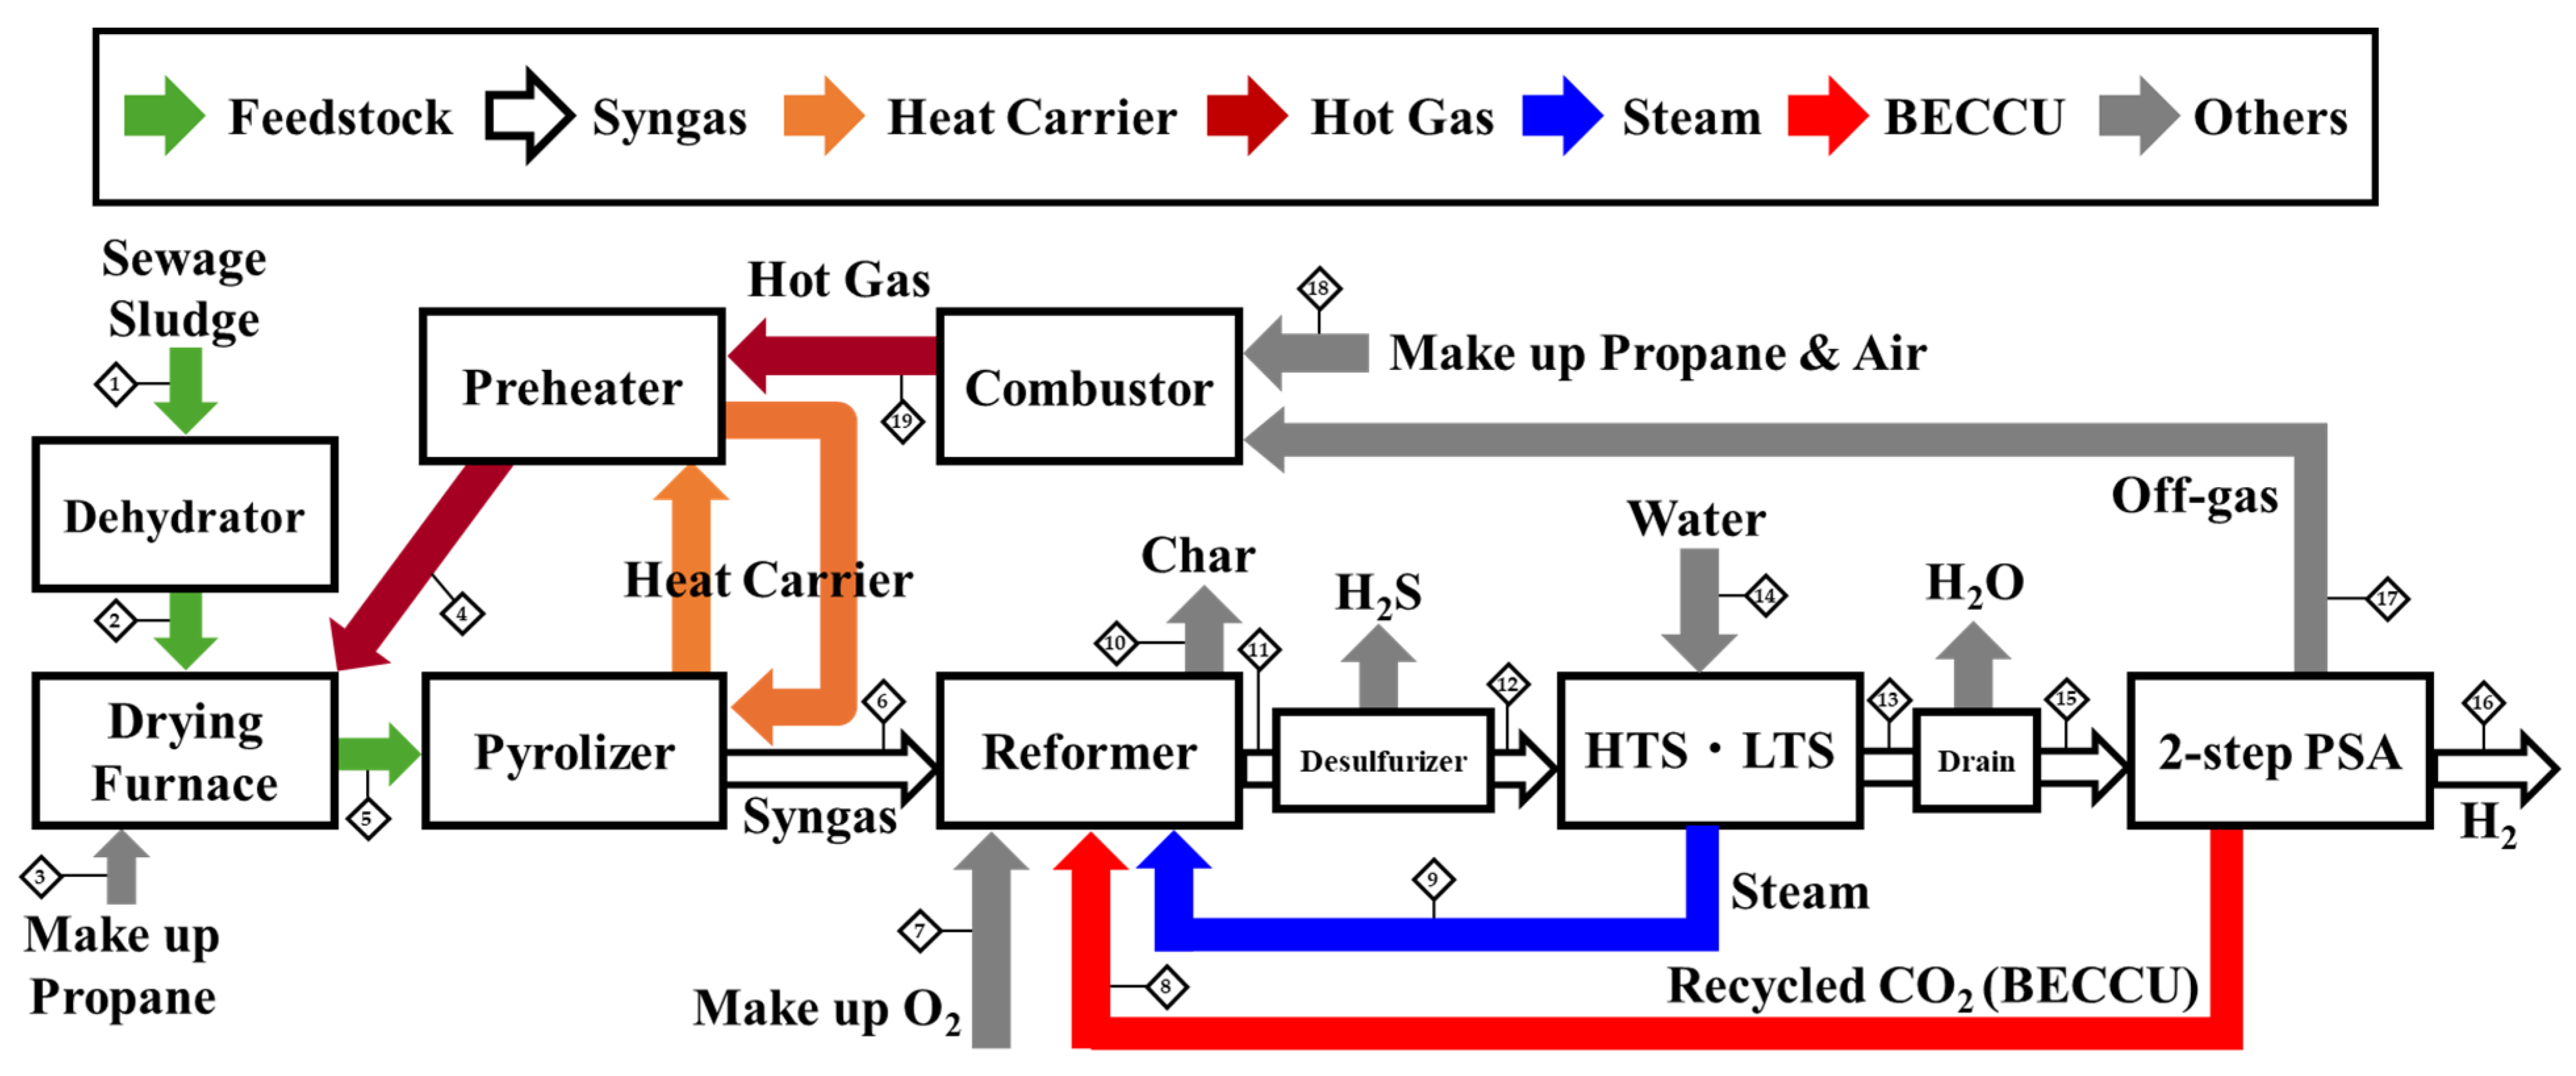
To demonstrate the effectiveness of the BECCU system proposed in this study, which utilizes CO2 recovered through a 2-step PSA process in the same H2 production gasification process, three different scenarios were considered (see Table 11). Their performances were compared and evaluated under identical conditions: a reformer temperature of 1173 K and an S/C ratio of 1.4, ensuring a fair comparison. The schematics of the process and stream data tables for Case 1 and Case 2 are provided in the Appendix A. The schematic of the process and stream data table for Case 3 are shown in Figure 3 and Table 4, respectively.
Case 1 represents the conventional AGM configuration, in which a single-step PSA is used only for H2 purification. As a result, the auxiliary power due to gas compression becomes very large. In addition, CO2 is not recovered, and all off-gas containing CO2 other than H2 is sent to the combustor. The PSA is operated at high pressure, and according to the report by Nakayama et al. [18], the auxiliary power is 4.17 kW/kg-H2 and the H2 recovery efficiency is 74.0%.
Case 2 introduces a 2-step PSA system that divides the purification process into two stages. This enables low-pressure operation, thereby reducing the auxiliary power consumption (from 759 to 556 kW/MJ-H2). CO2 is recovered as a single high-purity stream, which is assumed to be used externally (for example, as a growth agent in agricultural facilities). Since this utilization occurs outside the system boundary, CO2 is regarded as carbon neutral in the LCA, and no negative emission credit is applied in the GWP calculation.
The focus of this study, Case 3, is based on Case 2 but features the reuse of recovered CO2 as a gasifying agent within the same H2 production AGM process. This increases the CO2 inflow to the 2-step PSA, resulting in higher auxiliary power (943 kW/MJ-H2). However, the reused CO2 promotes the decomposition of char and tar, improving both the cold gas efficiency (CGE) and H2 yield. Furthermore, because the reused CO2 is derived from biomass, it is counted as a negative emission in the LCA, directly contributing to a significant reduction in GWP.
Cases 1 and 2 have lower auxiliary power than Case 3 and almost the same CGE, but the remarkable reduction in GWP in Case 3 (down to 43.8 g-CO2 eq./MJ-H2) results from the combination of two advantages: improved PSA efficiency through the 2-step PSA and the negative emission effect from CO2 reuse. This synergistic effect maximizes both environmental and process performance, enabling Case 3 to outperform the other two cases.
At the current stage, a conventional PSA system performs hydrogen separation and recovery in a single step at an adsorption pressure of approximately 1.0 to 2.0 MPa, resulting in a high auxiliary power requirement. In light of this issue, this study examined the two-step PSA as an alternative technology. The two-step PSA divides the separation and recovery into two steps, enabling operation at lower compression pressures and thereby reducing auxiliary power consumption. Furthermore, it can recover CO2 as a high-purity gas, making it suitable for reuse in the BECCU system. In this study, the effectiveness of the BECCU system was evaluated by reusing the recovered CO2 as a gasifying agent in the H2 production process, which enhances gasification efficiency while maximizing the GWP reduction effect. It should be noted that, as the amount of recovered CO2 increases, the internal power consumption of the two-step PSA also rises; strategies to further reduce this power consumption will be addressed in future work.
The above comparison demonstrates that BECCU, in the same H2 production process using 2-step PSA, not only recovers and utilizes CO2 with a low environmental impact but also maximizes the environmental impact reduction by reusing it as a gasifying agent to promote gasification. This is due to the synergistic effect of two mechanisms: direct GWP reduction through CO2 recovery and indirect GWP reduction through improved gasification efficiency. Therefore, BECCU, which reuses recovered CO2 as a gasifying agent for H2 production in AGM, can be considered effective in reducing CO2 emissions per unit of energy.

4. Conclusions

In this study, we focused on BECCU, which utilizes CO2 recovered by 2-step PSA as a gasifying agent to reduce the CO2 intensity of H2 production in the AGM. To evaluate the effectiveness of the BECCU in AGM, we conducted a sensitivity analysis of the reformer temperature and S/C ratio using process simulation and LCA, incorporating the results from tar gasification experiments.
Sensitivity analysis revealed that increasing the reformer temperature is a highly effective strategy for reducing the GWP. This improvement is attributed to the enhanced gasification of char and tar, particularly through the reuse of recycled CO2 as a gasifying agent, which improves the overall process efficiency, such as the CGE and auxiliary power. Increasing the S/C also reduced the GWP, but this effect was primarily due to the promotion of the WGS reaction rather than the CO2 gasification central to the BECCU concept.
Furthermore, a comparative analysis demonstrates the superiority of the proposed in-process BECCU system (Case 3), which achieved the lowest GWP. By considering this BECCU system, the GWP can be reduced by more than 50% compared with the conventional process. Its effectiveness stems from a synergistic effect: (1) direct GWP reduction by capturing carbon-neutral CO2 using a low-environmental-impact 2-step PSA, and (2) indirect GWP reduction by improving the gasification efficiency of char and tar by reusing the captured CO2 as a gasifying agent.
Therefore, this study concludes that implementing a BECCU system with in-process CO2 recycling, especially when combined with high-temperature operation, is a promising and practical approach for significantly reducing the environmental impact of green H2 production in AGM plants.
In this study, to simplify the calculations, the heat required for drying the sewage sludge and the auxiliary power for the 2-step PSA were estimated using theoretical values and constants. However, the actual heat required for drying varies depends on factors such as the method of supplying hot air, the surface area of the feedstock, and the auxiliary power for the 2-step PSA, which also depends on the flow rate and composition of the process gas. Currently, the GWP of the entire AGM process is primarily driven by the drying process and the power consumption of the 2-step PSA. Therefore, future work will focus on conducting a more detailed analysis of these factors and proposing specific methods to further reduce GWP from an LCA perspective.

Author Contributions

Conceptualization, D.T.; methodology, D.T. and M.H.; validation, D.T.; formal analysis, D.T.; investigation, D.T., M.H. and K.K.; data curation, D.T.; writing—original draft preparation, D.T.; writing—review and editing, K.D.; visualization, D.T.; supervision, K.D.; project administration, D.T. and K.D. All authors have read and agreed to the published version of the manuscript.

Funding

This study received no external funding.

Data Availability Statement

The original contributions of this study are included in this article. Further inquiries can be directed to the corresponding author.

Conflicts of Interest

The authors declare no conflicts of interest.

Appendix A

Schematic of the Process and Stream Data Table
Here, the schematic of the process and the stream data table for Case 1 and Case 2 in Section 3.2 are presented.
Figure A1. Schematic of the process in Case 1.
Energies 18 04460 g0a1
Table A1. Stream data table in Case 1.
Case 1Units12345678910111213141516171819
PressurekPa101.3101.3101.3104.0106.0106.0106.0-106.0106.0106.0105.0102.0109.0101.0101.0106.0106.0106.0
TemperatureK298.2298.2298.2423.2298.2957.7303.6-423.21173.21173.2623.2630.1303.2303.2313.2315.1298.21273.2
Mass Flowskg/s0.1995 0.0349 0.0000 0.3318 0.0083 0.0074 0.0002 -0.0054 0.0009 0.0122 0.0187 0.0187 0.0054 0.0145 0.0004 0.0073 0.1716 0.1789
Mole Flowsmol/s11.5739 2.4367 0.0000 11.4559 0.9853 0.3411 0.0092 -0.2995 0.0742 0.7053 0.7014 0.7014 0.2995 0.4780 0.2203 0.2577 5.9352 6.1748
Cmol/s0.2674 0.2674 0.0000 0.0000 0.2674 0.0000 0.0000 -0.0000 0.0000 0.0000 0.0000 0.0000 0.0000 0.0000 0.0000 0.0000 0.0000 0.0000
Hmol/s0.4711 0.4711 0.0000 0.0000 0.4711 0.0000 0.0000 -0.0000 0.0000 0.0000 0.0000 0.0000 0.0000 0.0000 0.0000 0.0000 0.0000 0.0000
Nmol/s0.0241 0.0241 0.0000 0.0000 0.0241 0.0000 0.0000 -0.0000 0.0000 0.0000 0.0000 0.0000 0.0000 0.0000 0.0000 0.0000 0.0000 0.0000
Omol/s0.1213 0.1213 0.0000 0.0000 0.1213 0.0000 0.0000 -0.0000 0.0000 0.0000 0.0000 0.0000 0.0000 0.0000 0.0000 0.0000 0.0000 0.0000
Smol/s0.0019 0.0019 0.0000 0.0000 0.0019 0.0000 0.0000 -0.0000 0.0000 0.0000 0.0000 0.0000 0.0000 0.0000 0.0000 0.0000 0.0000 0.0000
Clmol/s0.0002 0.0002 0.0000 0.0000 0.0002 0.0000 0.0000 -0.0000 0.0000 0.0000 0.0000 0.0000 0.0000 0.0000 0.0000 0.0000 0.0000 0.0000
H2mol/s0.0000 0.0000 0.0000 0.0000 0.0000 0.0330 0.0000 -0.0000 0.0000 0.2231 0.2231 0.2977 0.0000 0.2977 0.2203 0.0774 0.0000 0.0000
COmol/s0.0000 0.0000 0.0000 0.0000 0.0000 0.0176 0.0000 -0.0000 0.0000 0.0818 0.0818 0.0072 0.0000 0.0072 0.0000 0.0072 0.0000 0.0000
CO2mol/s0.0000 0.0000 0.0000 0.3258 0.0000 0.0506 0.0000 -0.0000 0.0000 0.0658 0.0658 0.1404 0.0000 0.1404 0.0000 0.1404 0.0389 0.2730
CH4mol/s0.0000 0.0000 0.0000 0.0000 0.0000 0.0414 0.0000 -0.0000 0.0000 0.0000 0.0000 0.0000 0.0000 0.0000 0.0000 0.0000 0.0000 0.0000
C2H4mol/s0.0000 0.0000 0.0000 0.0000 0.0000 0.0017 0.0000 -0.0000 0.0000 0.0013 0.0013 0.0013 0.0000 0.0013 0.0000 0.0013 0.0000 0.0000
C2H6mol/s0.0000 0.0000 0.0000 0.0000 0.0000 0.0286 0.0000 -0.0000 0.0000 0.0225 0.0225 0.0225 0.0000 0.0225 0.0000 0.0225 0.0000 0.0000
N2mol/s0.0000 0.0000 0.0000 8.8893 0.0000 0.0088 0.0000 -0.0000 0.0000 0.0088 0.0088 0.0088 0.0000 0.0088 0.0000 0.0088 4.7612 4.7700
C6H6mol/s0.0000 0.0000 0.0000 0.0000 0.0000 0.0051 0.0000 -0.0000 0.0000 0.0019 0.0000 0.0000 0.0000 0.0000 0.0000 0.0000 0.0000 0.0000
C10H8mol/s0.0000 0.0000 0.0000 0.0000 0.0000 0.0006 0.0000 -0.0000 0.0000 0.0002 0.0000 0.0000 0.0000 0.0000 0.0000 0.0000 0.0000 0.0000
H2Omol/s10.6878 1.5506 0.0000 0.1994 0.0749 0.0749 0.0000 -0.2995 0.0000 0.2980 0.2980 0.2234 0.2995 0.0000 0.0000 0.0000 0.0000 0.1994
H2Smol/s0.0000 0.0000 0.0000 0.0000 0.0000 0.0017 0.0000 -0.0000 0.0000 0.0017 0.0000 0.0000 0.0000 0.0000 0.0000 0.0000 0.0000 0.0000
O2mol/s0.0000 0.0000 0.0000 2.0414 0.0000 0.0000 0.0092 -0.0000 0.0000 0.0000 0.0000 0.0000 0.0000 0.0000 0.0000 0.0000 1.1222 0.9324
HClmol/s0.0000 0.0000 0.0000 0.0000 0.0000 0.0002 0.0000 -0.0000 0.0000 0.0002 0.0000 0.0000 0.0000 0.0000 0.0000 0.0000 0.0000 0.0000
C-CHARmol/s0.0000 0.0000 0.0000 0.0000 0.0000 0.0610 0.0000 -0.0000 0.0589 0.0000 0.0000 0.0000 0.0000 0.0000 0.0000 0.0000 0.0000 0.0000
H-CHARmol/s0.0000 0.0000 0.0000 0.0000 0.0000 0.0113 0.0000 -0.0000 0.0106 0.0000 0.0000 0.0000 0.0000 0.0000 0.0000 0.0000 0.0000 0.0000
O-CHARmol/s0.0000 0.0000 0.0000 0.0000 0.0000 0.0013 0.0000 -0.0000 0.0013 0.0000 0.0000 0.0000 0.0000 0.0000 0.0000 0.0000 0.0000 0.0000
N-CHARmol/s0.0000 0.0000 0.0000 0.0000 0.0000 0.0032 0.0000 -0.0000 0.0032 0.0000 0.0000 0.0000 0.0000 0.0000 0.0000 0.0000 0.0000 0.0000
S-CHARmol/s0.0000 0.0000 0.0000 0.0000 0.0000 0.0002 0.0000 -0.0000 0.0002 0.0000 0.0000 0.0000 0.0000 0.0000 0.0000 0.0000 0.0000 0.0000
Cl-CHARmol/s0.0000 0.0000 0.0000 0.0000 0.0000 0.0000 0.0000 -0.0000 0.0000 0.0000 0.0000 0.0000 0.0000 0.0000 0.0000 0.0000 0.0000 0.0000
Ashmol/s0.0000 0.0000 0.0000 0.0000 0.0243 0.0000 0.0000 -0.0000 0.0000 0.0000 0.0000 0.0000 0.0000 0.0000 0.0000 0.0000 0.0000 0.0000
PROPANEmol/s0.0000 0.0000 0.0000 0.0000 0.0000 0.0000 0.0000 -0.0000 0.0000 0.0000 0.0000 0.0000 0.0000 0.0000 0.0000 0.0000 0.0130 0.0000
Table A2. Stream data table in Case 2.
Case 2Units12345678910111213141516171819
PressurekPa101.3101.3101.3104.0106.0106.0106.0106.0106.0106.0106.0105.0102.0109.0101.0101.0106.0106.0106.0
TemperatureK298.2298.2298.2423.2298.2957.7303.6307.6423.21173.21173.2623.2630.1303.2303.2313.2315.1298.21273.2
Mass Flowskg/s0.19950.03490.00000.33180.00830.00740.00020.00360.00540.00090.01220.01870.01870.00540.01450.00040.00730.17160.1789
Mole Flowsmol/s11.57392.43670.000011.22820.98530.34110.00920.00010.29950.07420.70530.70140.70140.29950.47800.23260.16346.06126.2171
Cmol/s0.26740.26740.00000.00000.26740.00000.00000.00000.00000.00000.00000.00000.00000.00000.00000.00000.00000.00000.0000
Hmol/s0.47110.47110.00000.00000.47110.00000.00000.00000.00000.00000.00000.00000.00000.00000.00000.00000.00000.00000.0000
Nmol/s0.02410.02410.00000.00000.02410.00000.00000.00000.00000.00000.00000.00000.00000.00000.00000.00000.00000.00000.0000
Omol/s0.12130.12130.00000.00000.12130.00000.00000.00000.00000.00000.00000.00000.00000.00000.00000.00000.00000.00000.0000
Smol/s0.00190.00190.00000.00000.00190.00000.00000.00000.00000.00000.00000.00000.00000.00000.00000.00000.00000.00000.0000
Clmol/s0.00020.00020.00000.00000.00020.00000.00000.00000.00000.00000.00000.00000.00000.00000.00000.00000.00000.00000.0000
H2mol/s0.00000.00000.00000.00000.00000.03300.00000.00000.00000.00000.22310.22310.29770.00000.29770.23260.06510.00000.0000
COmol/s0.00000.00000.00000.00000.00000.01760.00000.00000.00000.00000.08180.08180.00720.00000.00720.00000.00720.00000.0000
CO2mol/s0.00000.00000.00000.25560.00000.05060.00000.00010.00000.00000.06580.06580.14040.00000.14040.00000.05840.03970.2055
CH4mol/s0.00000.00000.00000.00000.00000.04140.00000.00000.00000.00000.00000.00000.00000.00000.00000.00000.00000.00000.0000
C2H4mol/s0.00000.00000.00000.00000.00000.00170.00000.00000.00000.00000.00130.00130.00130.00000.00130.00000.00130.00000.0000
C2H6mol/s0.00000.00000.00000.00000.00000.02860.00000.00000.00000.00000.02250.02250.02250.00000.02250.00000.02250.00000.0000
N2mol/s0.00000.00000.00008.77620.00000.00880.00000.00000.00000.00000.00880.00880.00880.00000.00880.00000.00884.85884.8676
C6H6mol/s0.00000.00000.00000.00000.00000.00510.00000.00000.00000.00000.00190.00000.00000.00000.00000.00000.00000.00000.0000
C10H8mol/s0.00000.00000.00000.00000.00000.00060.00000.00000.00000.00000.00020.00000.00000.00000.00000.00000.00000.00000.0000
H2Omol/s10.68781.55060.00000.20530.07490.07490.00000.00000.29950.00000.29800.29800.22340.29950.00000.00000.00000.00000.2053
H2Smol/s0.00000.00000.00000.00000.00000.00170.00000.00000.00000.00000.00170.00000.00000.00000.00000.00000.00000.00000.0000
O2mol/s0.00000.00000.00001.99110.00000.00000.00920.00000.00000.00000.00000.00000.00000.00000.00000.00000.00001.14520.9388
HClmol/s0.00000.00000.00000.00000.00000.00020.00000.00000.00000.00000.00020.00000.00000.00000.00000.00000.00000.00000.0000
C-CHARmol/s0.00000.00000.00000.00000.00000.06100.00000.00000.00000.05890.00000.00000.00000.00000.00000.00000.00000.00000.0000
H-CHARmol/s0.00000.00000.00000.00000.00000.01130.00000.00000.00000.01060.00000.00000.00000.00000.00000.00000.00000.00000.0000
O-CHARmol/s0.00000.00000.00000.00000.00000.00130.00000.00000.00000.00130.00000.00000.00000.00000.00000.00000.00000.00000.0000
N-CHARmol/s0.00000.00000.00000.00000.00000.00320.00000.00000.00000.00320.00000.00000.00000.00000.00000.00000.00000.00000.0000
S-CHARmol/s0.00000.00000.00000.00000.00000.00020.00000.00000.00000.00020.00000.00000.00000.00000.00000.00000.00000.00000.0000
Cl-CHARmol/s0.00000.00000.00000.00000.00000.00000.00000.00000.00000.00000.00000.00000.00000.00000.00000.00000.00000.00000.0000
Ashmol/s0.00000.00000.00000.00000.02430.00000.00000.00000.00000.00000.00000.00000.00000.00000.00000.00000.00000.00000.0000
PROPANEmol/s0.00000.00000.00000.00000.00000.00000.00000.00000.00000.00000.00000.00000.00000.00000.00000.00000.00000.01750.0000
Figure A2. Schematic of the process in Case 2.
Energies 18 04460 g0a2

References

  1. Garzón Baquero, J.E.; Bellon Monsalve, D. From fossil fuel energy to hydrogen energy: Transformation of fossil fuel energy economies into hydrogen economies through social entrepreneurship. Int. J. Hydrogen Energy 2024, 54, 574–585. [Google Scholar] [CrossRef]
  2. Gaudernack, B.; Steinar, L. Hydrogen from natural gas without release of CO2 to the atmosphere. Int. J. Hydrogen Energy 1998, 23, 1087–1093. [Google Scholar] [CrossRef]
  3. Agency for Natural Resources and Energy. Available online: https://www.enecho.meti.go.jp/about/special/johoteikyo/suisohou_01.html (accessed on 22 June 2025).
  4. Tarkowski, R.; Uliasz-Misiak, B. Towards underground hydrogen storage: A review of barriers. Renew. Sustain. Energy Rev. 2022, 162, 112451. [Google Scholar] [CrossRef]
  5. Dincer, I.; Acar, C. Review and evaluation of hydrogen production methods for better sustainability. Int. J. Hydrogen Energy 2015, 40, 11094–11111. [Google Scholar] [CrossRef]
  6. Li, P.; Shi, X.; Wang, X.; Song, J.; Fang, S.; Bai, J.; Zhang, G.; Chang, C.; Pang, S. Bio-oil from biomass fast pyrolysis: Yields, related properties and energy consumption analysis of the pyrolysis system. J. Clean. Prod. 2021, 328, 129613. [Google Scholar] [CrossRef]
  7. Yamazaki, Y.; Kaneko, S. Study on Small-Sized Gas Engine with Biomass Gas. J. Combust. Soc. Jpn. 2007, 49, 236–245. [Google Scholar] [CrossRef]
  8. Kuroda, K.; Kim, H.B.; Yoshioka, T. Forest resource distribution and transport cost optimization-based economic evaluation of gasification and steam-turbine biomass power generation systems. Renew. Energy Focus 2024, 50, 100595. [Google Scholar] [CrossRef]
  9. Renganathan, T.; Yadav, M.V.; Pushpavanam, S.; Voolapalli, R.K.; Cho, Y.S. CO2 utilization for gasification of carbonaceous feedstocks: A thermodynamic analysis. Chem. Eng. Sci. 2012, 83, 159–170. [Google Scholar] [CrossRef]
  10. Li, Q.; Wang, Y.; Owusu, A.B. A modified Ester-branched thickener for rheology and wettability during CO2 fracturing for improved fracturing property. Environ. Sci. Pollut. Res. Int. 2019, 26, 20787–20797. [Google Scholar] [CrossRef]
  11. Natsumi, Y.; Nochi, K.; Otsuka, M. Immobilization Experiment of the Carbon Dioxide by the Minute Algal Biomass Apparatus. Soc. Heating. Air Cond. Sanit. Eng. Jpn. 2011, 45–48. [Google Scholar] [CrossRef]
  12. Hayashi, A.; Akimoto, K.; Sano, F. An Evaluation on Bioenergy Potentials for Negative CO2 Emissions. Dai 25 Kai Nihon Enerugī Gakkai Taikai 2016, 25, 210–211. [Google Scholar] [CrossRef]
  13. Guntermann, N.; Mengers, H.G.; Franciò, G.; Blank, L.M.; Leitner, W. Bio-energy conversion with carbon capture and utilization (BECCU): Integrated biomass fermentation and chemo-catalytic CO2 hydrogenation for bioethanol and formic acid co-production. Green Chem. 2021, 23, 9860–9864. [Google Scholar] [CrossRef]
  14. Artz, J.; Múller, T.E.; Thenert, K.; Kleinekorte, J.; Meys, R. Sustainable Conversion of Carbon Dioxide: An Integrated Review of Catalysis and Life Cycle Assessment. Chem. Rev. 2018, 118, 434–504. [Google Scholar] [CrossRef]
  15. New Energy and Industrial Technology Development Organization. Available online: https://www.nedo.go.jp/content/100949869.pdf (accessed on 22 June 2025).
  16. Kuroda, S.; Dowaki, K.; Mori, S.; Harada, T. Design of an Impurity Removal System for H2S in Biohydrogen Using HAS-Clay/Zeolite A5 (HAS-Clay/Zeolite A5を用いたバイオ水素中のH2Sを含む不純物除去システムの設計). Master’s Thesis, Tokyo University of Science, Tokyo, Japan, 2018. [Google Scholar]
  17. Maran, K.; Sinha, R.; Brandão, M.M.R. LCA of Advanced Biofuel Production. Master’s Thesis, KTH Royal Institute of Technology, Stockholm, Sweden, 2024. [Google Scholar]
  18. Nakayama, H.; Kameyama, M.; Long, Y.; Dowaki, K. An Environmental Analysis of Bio-H2 Production Introducing the 2-step PSA and Waste Heat Recovery. J. Jpn. Inst. Energy 2020, 99, 129–135. [Google Scholar] [CrossRef]
  19. Li, X.; Liu, P.; Huang, S.; Wu, S.; Li, Y.; Wu, Y.; Lei, T. Study on the mechanism of syngas production from catalytic pyrolysis of biomass tar by Ni–Fe catalyst in CO2 atmosphere. Fuel 2023, 335, 126705. [Google Scholar] [CrossRef]
  20. Luo, S.; Xiao, B.; Guo, X.; Hu, Z.; Liu, S.; He, M. Hydrogen-rich gas from catalytic steam gasification of biomass in a fixed bed reactor: Influence of particle size on gasification performance. Int. J. Hydrogen Energy 2009, 34, 1260–1264. [Google Scholar] [CrossRef]
  21. Murakami, T. Detailed Analysis of Tar Components in Syngas Generated by Lignite Gasification in a Fluidized Bed Gasifier. J. Jpn. Pet. Inst. 2025, 68, 69–80. [Google Scholar] [CrossRef]
  22. Dowaki, K. Life Cycle Analysis of Biomass Energy Systems Using Gasification Processes (ガス化プロセスによるバイオマスエネルギーシステムのライフサイクル分析). Ph.D. Thesis, The University of Tokyo, Tokyo, Japan, 2001. [Google Scholar]
  23. The Society of Chemical Engineers, Japan. Kagaku Kogaku Binran (Chemical Engineering Handbook), 6th ed.; Maruzen Publishing: Tokyo, Japan, 1999; pp. 952–955. [Google Scholar]
  24. Asaki, Z.; Kondo, Y. Gas-solid phase reaction models in metal refining. Denki Kagaku 1975, 43, 352–359. [Google Scholar] [CrossRef]
  25. Fujioka, Y.; Jung, W.S. Simplified Coal Gasification Rate for Fluidzed Bed Coal Gasifier. J. Chem. Eng. Jpn. 1996, 22, 433–445. [Google Scholar] [CrossRef]
  26. Wang, Q.; Ikoda, K. Study on heterogeneous reactions between tar and ash during coal gasification. Sci. Eng. Rep. Saitama Univ. 2008, 41, 10–14. [Google Scholar]
  27. Kobayashi, N.; Itaya, Y.; Suami, A. Case Study of Energy Recovery and CO2 Reduction in Sewage Sludge Drying Process. Mater. Cycles Waste Manag. Res. 2022, 33, 242–253. [Google Scholar] [CrossRef]
  28. Nakakubo, T. Analysis of energy balances for a recycling system to input dewatered sludge directly in cement kiln. J. Jpn. Soc. Civ. Eng. Ser. G Environ. Res. 2017, 73, II_233–II_244. [Google Scholar] [CrossRef]
  29. Hamazaki, M.; Torii, K.; Shan, M.; Kameyama, M.; Mercado, J.V.L.; Dowaki, K. Discussions on the heat transfer performance of the indirect pyrolysis plant using CFD modeling. In IOP Conference Series: Earth and Environmental Science; IOP: Bristol, UK, 2023; Volume 1187, p. 012026. [Google Scholar] [CrossRef]
  30. Fujitsuka, H.; Kobayashi, T.; Tago, T. Preparation of Birdcage-type zeolite catalyst and its application in dry reforming of methane. Zeoraito 2019, 36, 106–114. [Google Scholar] [CrossRef]
  31. Urdampilleta, I.; Uribe, F.; Rockward, T.; Brosha, E.L.; Pivovar, B.; Garzon, F.H. PEMFC poisoning with H2S: Dependence on operating conditions. ECS Trans. 2007, 11, 831. [Google Scholar] [CrossRef]
  32. Kitayama, S.; Hamazaki, M.; Kumon, S.; Sato, K.; Dowaki, K. Enhancement of Bio-H2 Purification Performance in a Multi-Stage Desulfurization Process Using Mining Waste and LaNi5. Energies 2025, 18, 1000. [Google Scholar] [CrossRef]
  33. Inaba, A. Kiso Kara Manabu LCA -LCA no Jisshi to Katsuyo (Learning LCA from the Basics—Implementing and Utilizing LCA Life Cycle Assessment; Japan Life Cycle Assessment Facilitation Centre LCAF: Tokyo, Japan, 2023; pp. 96–97. [Google Scholar]
  34. Tamura, M. History of Air Separation Unit Technologies Developed by TNSC. TAIYO NIPPON SANSO Technical Report No. 41. 2022. Available online: https://www.tn-sanso.co.jp/Portals/0/resources/en/rd/giho/pdf/41/tnscgiho41_E00.pdf (accessed on 23 June 2025).
  35. Nishihiro, K. Study on the Mechanism of Carbon Precipitation from CO-H2 Mixed Gas Using Iron as a Catalyst and the Gasification Behavior of Precipitated Carbon (鉄を触媒としたCO-H2混合ガスからの炭素析出反応メカニズムおよび析出炭素のガス化挙動に関する研究). Ph.D. Thesis, Kyushu University, Fukuoka, Japan, 2020. [Google Scholar] [CrossRef]
  36. Takahashi, Y. Recent Movements in Structural Integrity Evaluation for High-Temperature Plant Components. Jpn. Soc. Mech. Eng. 2011, 77, 1156–1168. [Google Scholar] [CrossRef]
  37. Khoshnoudı, A.; Akay, R. Simulation and optimization of hydrogen production by steam reforming of natural gas. J. Turk. Chem. Soc. Sect. B Chem. Eng. 2023, 6, 123–136. [Google Scholar] [CrossRef]
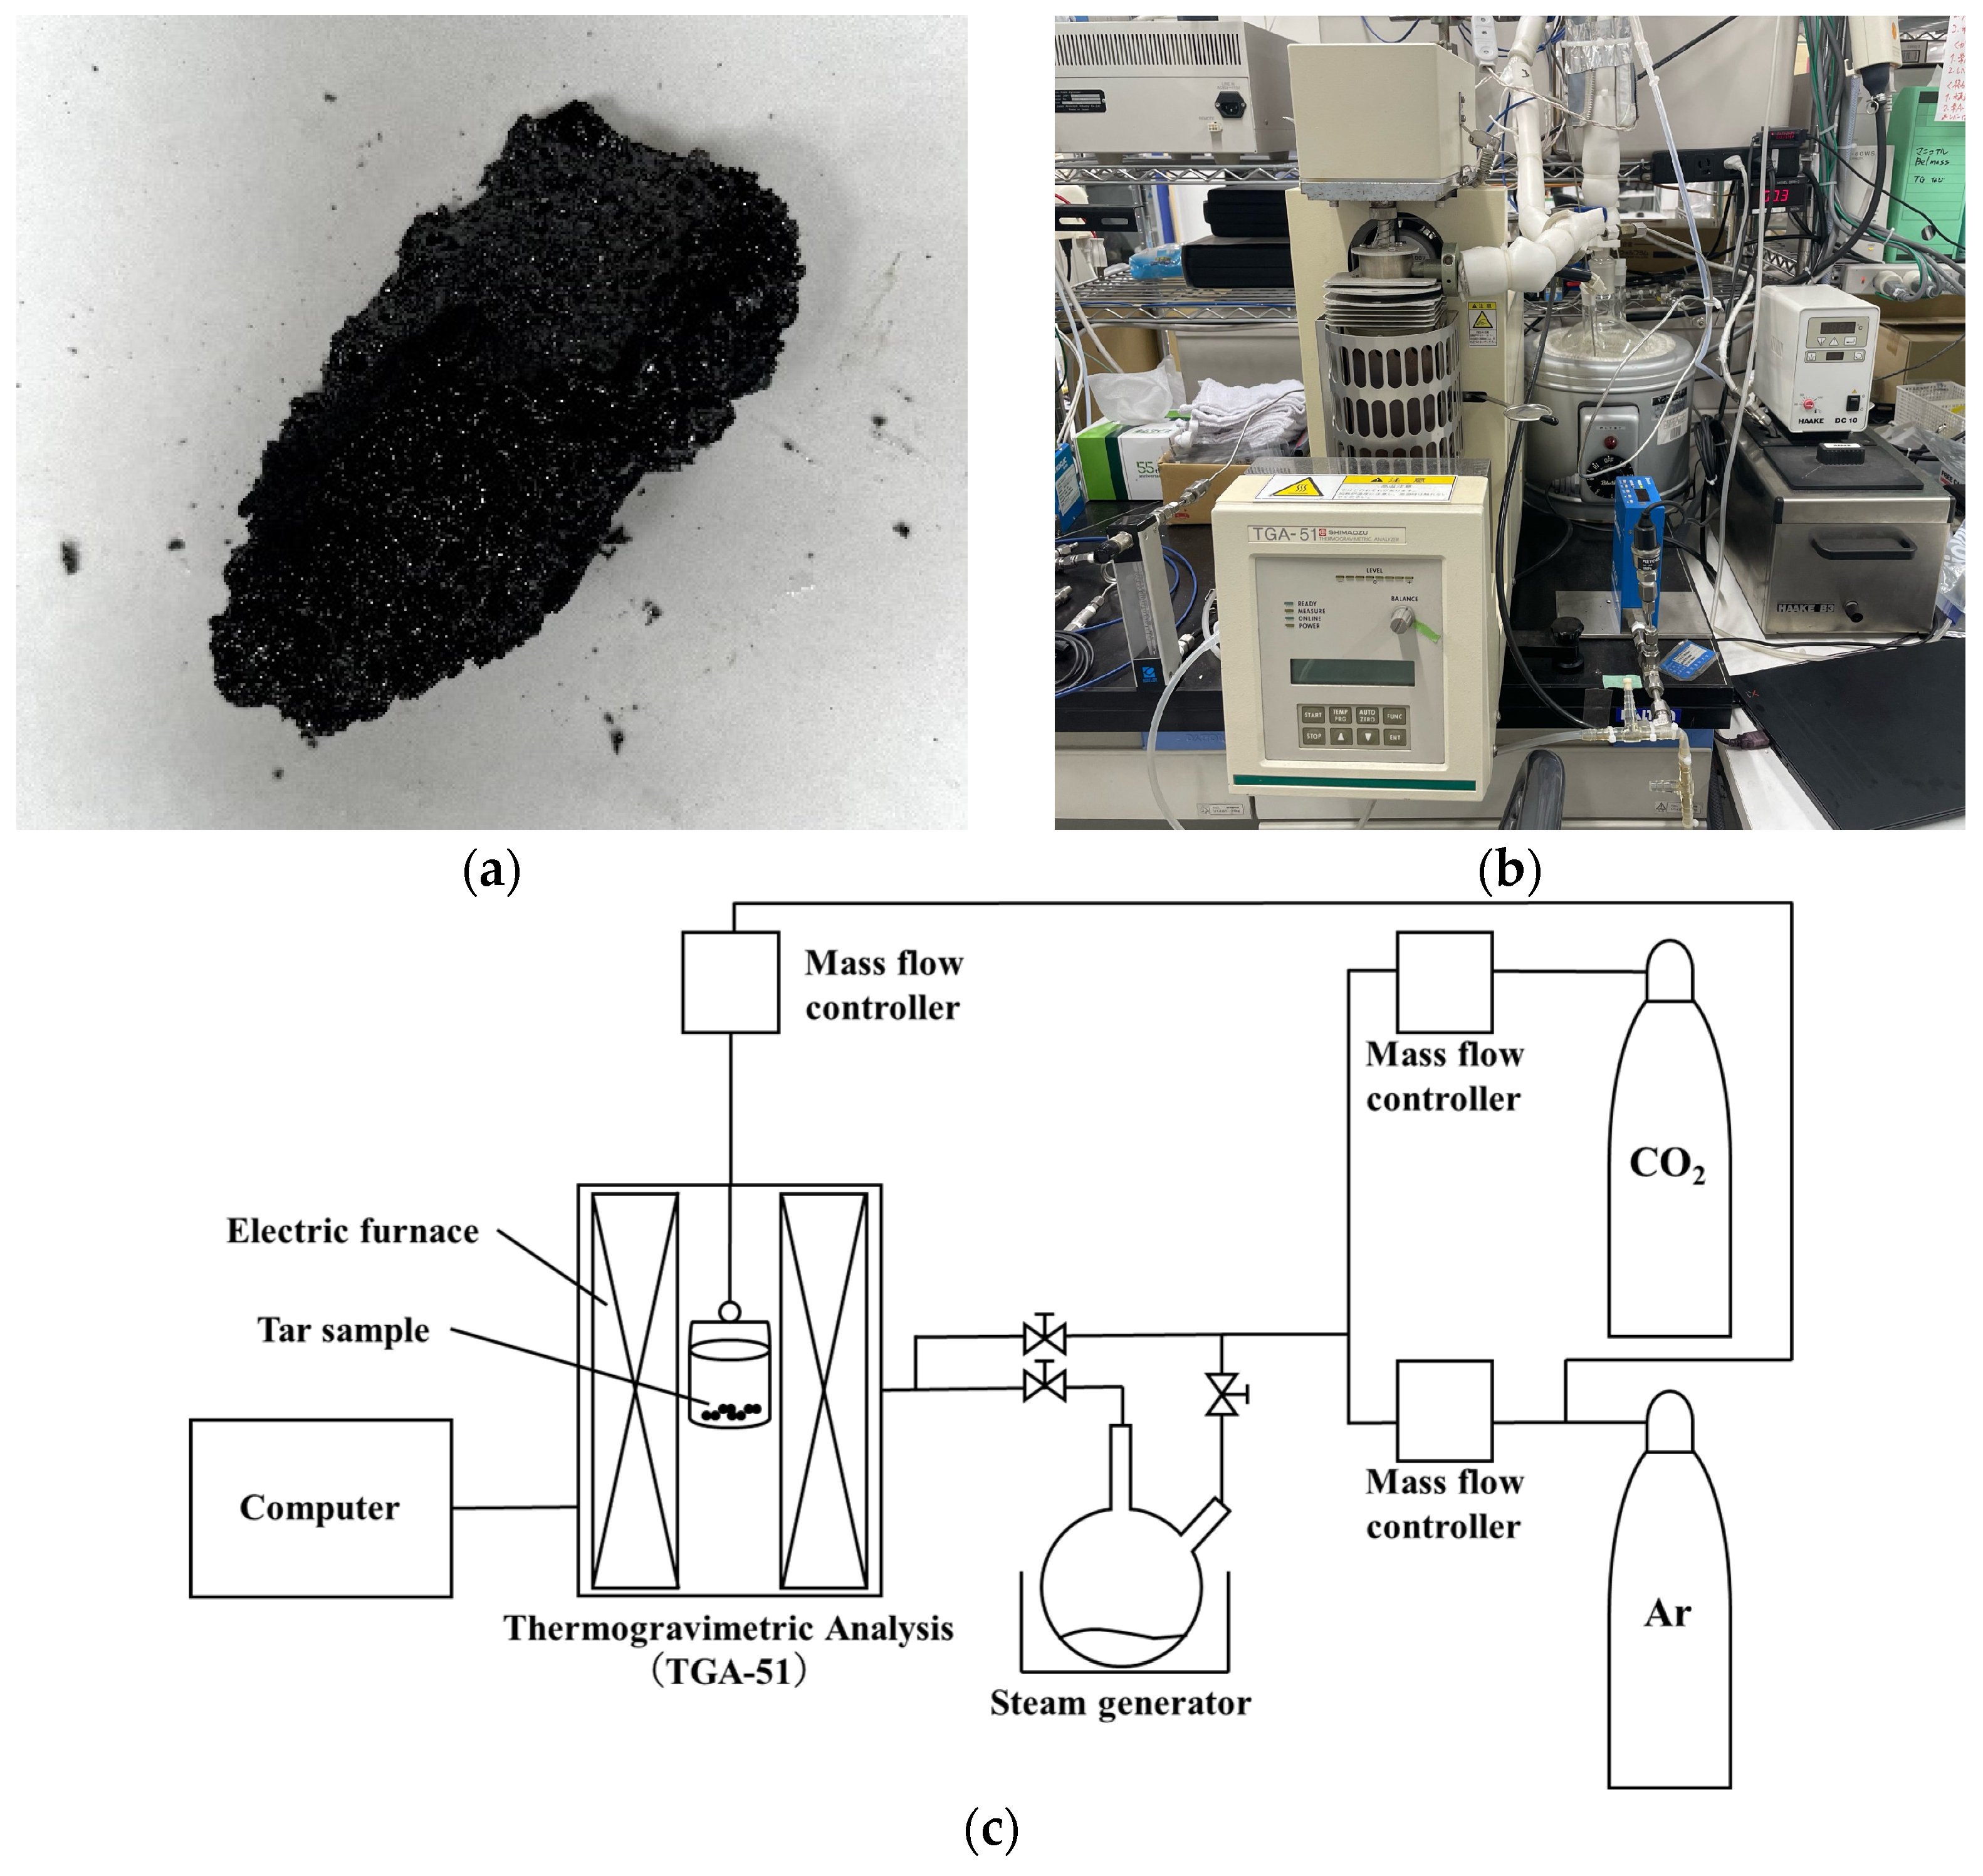
Figure 1. Samples and apparatus used in the experiment. (a) Sewage sludge-derived tar; (b) TGA-51 (SHIMADZU, Kyoto 604-8511, Japan); (c) Schematic of tar gasification experiment.
Energies 18 04460 g001
Figure 2. Arrhenius plot for each gasifying agent. (a) CO2; (b) steam.
Energies 18 04460 g002
Figure 3. Schematic of process design considering BECCU.
Energies 18 04460 g003
Figure 4. System boundary.
Energies 18 04460 g004
Figure 5. Sensitivity analysis results: reformer temperature. (a) GWP and H2 production; (b) syngas composition; (c) auxiliary power and CGE; (d) recycled CO2/C, reaction rate of char, and reaction rate of tar.
Energies 18 04460 g005
Figure 6. Sensitivity analysis results: S/C. (a) GWP and H2 production; (b) syngas composition; (c) auxiliary power and CGE; (d) recycled CO2/C, reaction rate of char, and reaction rate of tar.
Energies 18 04460 g006
Table 1. Properties of sewage sludge tar.
C * [wt.%]72.37
H * [wt.%]7.07
N * [wt.%]9.08
O *,** [wt.%]11.49
S * [wt.%]0.00
Cl * [wt.%]0.00
Higher heating value (HHV) [kJ/kg]30,711
* Dry basis, ** O = 1 − (C + H + N + S + Cl + Ash).
Table 2. Experimental conditions.
Gasifying AgentCO2, Steam
Temperature [K]1173, 1273, 1373
Heating rate [K/min]30
Sample particle size [mm]≤1
Sample weight [mg]10
Table 3. The kinetics parameters.
Gasifying Agent A [1/s] E [kJ/mol]
CO2 1.09 × 10 2 1.32 × 10 2
Steam 6.31 × 10 2 1.49 × 10 2
Table 4. Stream data table.
Units12345678910111213141516171819
PressurekPa101.3101.3101.3104.0106.0106.0106.0106.0106.0106.0106.0105.0102.0109.0101.0101.0106.0106.0106.0
TemperatureK298.2298.2298.2423.2298.2957.7303.6307.6423.21173.21173.2623.2630.1303.2303.2313.2315.1298.21273.2
Mass Flowskg/s0.19950.03490.00000.33180.00830.00740.00020.00680.00540.00090.01880.01870.01870.00540.01450.00040.00730.17160.1789
Mole Flowsmol/s11.57392.43670.000011.44530.98530.34110.00470.17640.29950.07490.87810.87440.87440.29950.64380.22440.24305.94746.1745
Cmol/s0.26740.26740.00000.00000.26740.00000.00000.00000.00000.00000.00000.00000.00000.00000.00000.00000.00000.00000.0000
Hmol/s0.47110.47110.00000.00000.47110.00000.00000.00000.00000.00000.00000.00000.00000.00000.00000.00000.00000.00000.0000
Nmol/s0.02410.02410.00000.00000.02410.00000.00000.00000.00000.00000.00000.00000.00000.00000.00000.00000.00000.00000.0000
Omol/s0.12130.12130.00000.00000.12130.00000.00000.00000.00000.00000.00000.00000.00000.00000.00000.00000.00000.00000.0000
Smol/s0.00190.00190.00000.00000.00190.00000.00000.00000.00000.00000.00000.00000.00000.00000.00000.00000.00000.00000.0000
Clmol/s0.00020.00020.00000.00000.00020.00000.00000.00000.00000.00000.00000.00000.00000.00000.00000.00000.00000.00000.0000
H2mol/s0.00000.00000.00000.00000.00000.03300.00000.00000.00000.00000.16600.16600.28720.00000.28720.22440.06280.00000.0000
COmol/s0.00000.00000.00000.00000.00000.01760.00000.00000.00000.00000.14170.14170.02060.00000.02060.00000.02060.00000.0000
CO2mol/s0.00000.00000.00000.32210.00000.05060.00000.17640.00000.00000.18100.18100.30210.00000.30210.00000.12570.03890.2770
CH4mol/s0.00000.00000.00000.00000.00000.04140.00000.00000.00000.00000.00000.00000.00000.00000.00000.00000.00000.00000.0000
C2H4mol/s0.00000.00000.00000.00000.00000.00170.00000.00000.00000.00000.00140.00140.00140.00000.00140.00000.00140.00000.0000
C2H6mol/s0.00000.00000.00000.00000.00000.02860.00000.00000.00000.00000.02370.02370.02370.00000.02370.00000.02370.00000.0000
N2mol/s0.00000.00000.00008.88410.00000.00880.00000.00000.00000.00000.00880.00880.00880.00000.00880.00000.00884.77034.7791
C6H6mol/s0.00000.00000.00000.00000.00000.00510.00000.00000.00000.00000.00160.00000.00000.00000.00000.00000.00000.00000.0000
C10H8mol/s0.00000.00000.00000.00000.00000.00060.00000.00000.00000.00000.00020.00000.00000.00000.00000.00000.00000.00000.0000
H2Omol/s10.68781.55060.00000.20620.07490.07490.00000.00000.29950.00000.35170.35170.23060.29950.00000.00000.00000.00000.1922
H2Smol/s0.00000.00000.00000.00000.00000.00170.00000.00000.00000.00000.00170.00000.00000.00000.00000.00000.00000.00000.0000
O2mol/s0.00000.00000.00002.03300.00000.00000.00470.00000.00000.00000.00000.00000.00000.00000.00000.00000.00001.12440.9262
HClmol/s0.00000.00000.00000.00000.00000.00020.00000.00000.00000.00000.00020.00000.00000.00000.00000.00000.00000.00000.0000
C-CHARmol/s0.00000.00000.00000.00000.00000.06100.00000.00000.00000.05930.00000.00000.00000.00000.00000.00000.00000.00000.0000
H-CHARmol/s0.00000.00000.00000.00000.00000.01130.00000.00000.00000.01080.00000.00000.00000.00000.00000.00000.00000.00000.0000
O-CHARmol/s0.00000.00000.00000.00000.00000.00130.00000.00000.00000.00130.00000.00000.00000.00000.00000.00000.00000.00000.0000
N-CHARmol/s0.00000.00000.00000.00000.00000.00320.00000.00000.00000.00320.00000.00000.00000.00000.00000.00000.00000.00000.0000
S-CHARmol/s0.00000.00000.00000.00000.00000.00020.00000.00000.00000.00020.00000.00000.00000.00000.00000.00000.00000.00000.0000
Cl-CHARmol/s0.00000.00000.00000.00000.00000.00000.00000.00000.00000.00000.00000.00000.00000.00000.00000.00000.00000.00000.0000
Ashmol/s0.00000.00000.00000.00000.02430.00000.00000.00000.00000.00000.00000.00000.00000.00000.00000.00000.00000.00000.0000
PROPANEmol/s0.00000.00000.00000.00000.00000.00000.00000.00000.00000.00000.00000.00000.00000.00000.00000.00000.00000.01390.0000
Table 5. Properties of sewage sludge and sewage sludge char.
Sewage SludgeSewage Sludge Char
C * [wt.%]46.041.7
H * [wt.%]6.801.30
N * [wt.%]4.845.15
O *,** [wt.%]27.82.36
S * [wt.%]0.8600.340
Cl * [wt.%]0.1000.0500
Ash * [wt.%]13.649.1
HHV [kJ/kg]17,22014,644
* Dry basis, ** O = 1 − (C + H + N + S + Cl + Ash).
Table 6. Pyrolysis composition of sewage sludge at 873 K.
H2 [wt.%]0.797
CO [wt.%]5.92
CO2 [wt.%]26.7
CH4 [wt.%]7.96
C2H4 [wt.%]0.566
C2H6 [wt.%]10.3
N2 [wt.%]2.97
C6H6 [wt.%]4.77
C10H8 [wt.%]0.904
H2O [wt.%]16.2
H2S [wt.%]0.690
O2 [wt.%]0.00
HCl [wt.%]0.0753
C-Char [wt.%]8.79
H-Char [wt.%]0.274
N-Char [wt.%]1.09
O-Char [wt.%]0.497
S-Char [wt.%]0.0716
Cl-Char [wt.%]0.0105
Ash [wt.%]11.4
Total [wt.%]100
Table 7. Reactions in the reformer.
Partial oxidationC-Char + 1/2O2 → CO
CO + 1/2O2 → CO2
H2 + 1/2O2 → H2O
H-Char + 1/2O2 → H2O
CH4 + 1/2O2 → CO + 2H2
C2H4 + O2 → 2CO + 2H2
C2H6 + O2 → 2CO + 3H2
Primary water gasC-Char + H2O → CO + H2
Tar steam reformingC6H6 + 6H2O → 6CO + 9H2
C10H8 + 10H2O → 10CO + 14H2
BoudouardC-Char + CO2 → 2CO
Tar dry reformingC6H6 + 6CO2 → 12CO + 3H2
C10H8 + 10CO2 → 20CO + 4H2
Dry reforming of methaneCH4 + CO2 → 2CO + 2H2
Methane reformingCH4 + H2O ↔ CO + 3H2
Water–gas shiftCO + H2O ↔ H2 + CO2
Table 8. Intensity used in LCA calculations.
ItemIntensityUnitReference
Electricity0.574kg-CO2/kWh[33]
Propane (production)0.508kg-CO2/Nm3[33]
Propane (combustion)0.0499kg-CO2/MJ[33]
Oxygen production0.350kWh/Nm3[34]
Water0.000366kg-CO2/L[33]
2-step PSA (Auxiliary power)2.83MJ/kg-CO2[16]
Table 9. Simulation results.
Reformer temperature [K]9731073117312731373
GWP [g-CO2 eq./MJ-H2]
SS12.702.482.141.581.46
SS284.174.967.061.358.3
SS37.947.096.305.635.34
SS40.3130.5510.921.282.03
SS512211911189.585.8
BECCU−157−153−143−116−111
Total59.350.243.843.441.9
H2 production [MJ-H2/kg-SS]5.175.626.518.839.59
CGE [%]60.964.167.371.474.2
Auxiliary power [kW/MJ-H2]
SS116.915.613.49.99.1
SS2263243209155142
SS327.425.221.715.914.6
SS41.683.195.517.912.6
SS5762744693562538
Total10721030943750717
recycled CO2 [%]57.661.066.072.475.4
Char reaction rate [%]
recycled CO20.005460.04440.2250.6271.60
pyrolysis CO20.001790.01370.06460.1640.402
others0.07730.5052.477.2319.2
Total0.08460.5632.768.0221.2
Tar reaction rate [%]
recycled CO29.8118.924.924.424.6
pyrolysis CO23.225.857.136.386.17
others10.023.536.044.152.6
Total23.048.368.074.983.4
Table 10. Results of the simulation.
S/C ratio1.42.03.04.0
GWP [g-CO2 eq./MJ-H2]
SS12.142.062.012.00
SS267.065.063.663.0
SS36.306.105.965.91
SS40.9150.7210.5660.492
SS5111114116117
BECCU−143−148−151−152
Total43.840.337.937.0
H2 production [MJ-H2/kg-SS]6.516.786.946.98
CGE [%]67.367.667.968.1
Auxiliary power [kW/MJ-H2]
SS113.412.912.612.5
SS2209201197195
SS321.720.820.320.2
SS45.514.193.032.38
SS5693674675675
Total943913907905
recycled CO2 [%]66.071.074.074.9
Char reaction rate [%]
recycled CO20.2250.1780.1160.0772
pyrolysis CO20.06460.04740.02960.0195
others2.472.863.213.32
Total2.763.093.353.42
Tar reaction rate [%]
recycled CO224.918.410.646.33
pyrolysis CO27.134.912.721.60
others36.045.957.163.2
Total68.069.270.471.1
Table 11. 2-step PSA effectiveness comparison.
CaseCase 1Case 2Case 3 (This Study)
AGM
+ PSA
AGM
+ 2-Step PSA
AGM
+ 2-Step PSA
+ Reuse As a Gasifying Agent
GWP
[g-CO2 eq./MJ-H2]
15614043.8
H2 production
[MJ-H2/kg-Feedstock]
6.396.756.51
CGE [%]65.465.467.3
Auxiliary power
[kW/MJ-H2]
759556943
Disclaimer/Publisher’s Note: The statements, opinions and data contained in all publications are solely those of the individual author(s) and contributor(s) and not of MDPI and/or the editor(s). MDPI and/or the editor(s) disclaim responsibility for any injury to people or property resulting from any ideas, methods, instructions or products referred to in the content.