Article

Simulation of a Natural Gas Solid Oxide Fuel Cell System Based on Rated Current Density Input

by
Wenxian Hu
1,
Xudong Sun
1,2,* and
Yating Qin
1
1
School of Management, China University of Mining and Technology-Beijing, Beijing 100083, China
2
Engineering Research Center of Integration and Application of Digital Learning Technology, Ministry of Education, Beijing 100039, China
*
Author to whom correspondence should be addressed.
Energies 2025, 18(16), 4456; https://doi.org/10.3390/en18164456
Submission received: 29 June 2025 / Revised: 11 August 2025 / Accepted: 16 August 2025 / Published: 21 August 2025

Abstract

Solid Oxide Fuel Cells (SOFCs) offer high-efficiency electrochemical conversion of fuels like natural gas, yet detailed modeling is crucial for optimization. This paper presents a simulation study of a natural gas-fueled SOFC system, developed using Aspen Plus with Fortran integration. Distinct from prevalent paradigms assuming rated power output, this work adopts rated current density as the primary input, enabling a more direct investigation of the cell’s electrochemical behavior. We conducted a comprehensive sensitivity analysis of key parameters, including fuel utilization, water-carbon ratio, and current density, and further investigated the impact of different interconnection configurations on overall module performance. Results demonstrate that a single unit operating at a current density of 180 mA/cm2, a fuel utilization of 0.75, and a water-carbon ratio of 1.5 can achieve a maximum net stack-level electrical efficiency of 54%. Furthermore, optimizing the interconnection of a 400 kW module by combining series and parallel units boosts the overall net system-level electrical efficiency to 59%, a 5-percentage-point increase over traditional parallel setups. This is achieved by utilizing a bottoming cycle for exhaust heat recovery. This research validates the rated current density approach for SOFC modeling, offering novel insights into performance optimization and modular design for integrated energy systems.

1. Introduction

The critical need to reconcile escalating global energy demands with sustainable transition requirements has accelerated transformative research in high-efficiency clean energy conversion systems [1]. Solid Oxide Fuel Cells (SOFCs) represent a promising technological avenue within this pursuit, offering direct electrochemical energy conversion with inherently high efficiency and minimal pollutant emissions compared to conventional combustion [2]. This high efficiency stems from their operational principle, which electrochemically oxidizes fuel, thereby bypassing the thermodynamic limitations imposed by the Carnot cycle on traditional heat engines [3].
Consequently, SOFC systems, especially when integrated into combined heat and power (CHP) or multi-generation configurations that utilize waste heat, can achieve overall energy utilization efficiencies potentially exceeding 80% [4]. To realize the full potential of SOFCs in future sustainable energy landscapes, it is crucial to optimize these systems for various fuels [5]. Key fuels requiring such optimization include the widely available natural gas [6], renewable biomass-derived syngas [7], and potentially hydrogen [8].
Complex multiphysics coupling processes, encompassing electrochemical reactions [9], multi-component mass transfer [6], and fuel reforming [10], pose significant challenges to the design, optimization, and performance prediction of Solid Oxide Fuel Cell (SOFC) systems [11]. To effectively address these complexities, Process Systems Engineering (PSE) tools, particularly process simulation software like Aspen Plus (V10) [12], have become foundational for system-level thermodynamic modeling and performance analysis of SOFCs [13]. These tools are highly regarded for their ability to accurately perform material balances [14] and energy balances [15].
Furthermore, through the integration of user-defined modules developed in programming environments such as MATLAB (R2017a) [5] or Fortran [13], researchers can construct sophisticated system models. These models accurately describe detailed thermodynamic equilibria [3] and allow for in-depth analysis of electrochemical reaction kinetics [16] and complex heat and mass transfer phenomena [9]. Building upon these comprehensive models [17], researchers conduct extensive parametric studies and sensitivity analyses, specifically focusing on core operational parameters like fuel utilization [10], steam-to-carbon ratio [14], operating temperature [12], and current density [6]. A thorough understanding of these parameters is crucial for comprehending SOFC system behavior and guiding its optimal design [18].
The operational mode and control strategy significantly influence SOFC performance and degradation, making dynamic modeling and analysis essential. Campanari [17] developed a thermodynamic model for a tubular SOFC module, conducting parametric analysis of operating conditions and efficiency with variations in current density, fuel utilization, and steam-to-carbon ratio. This early work laid the groundwork for understanding the complex interplay of operational variables. Beyond standalone operation, a significant research thrust has focused on enhancing the systemic value of SOFCs through their strategic integration into broader energy systems, often involving renewable or alternative fuel sources and advanced power cycles, aiming to maximize overall energy efficiency, diversify product outputs, and improve economic viability. One prominent direction explores the coupling of SOFC/SOEC (Solid Oxide Electrolysis Cell) technologies with biomass valorization pathways, as exemplified by Ali et al. [7], who demonstrated the potential of a combined SOEC-biomass gasification system for renewable methanol production, achieving a commendable 72.08% thermal conversion efficiency by synergistically utilizing electrolysis-derived oxygen for gasification. Further extending the scope of integration, SOFCs are increasingly considered key components in flexible multi-generation systems; Laky et al. [1] developed a sophisticated computational optimization framework for dynamic market-based technoeconomic comparison of systems coproducing hydrogen and electricity using rigorous physics-based SOFC/SOEC models, underscoring the economic advantages of operational flexibility. Addressing specific end-use sectors, Chitgar et al. [4] conducted extensive optimization studies on SOFC-GT-driven systems for residential demands. Collectively, these foundational studies on modeling and system integration, along with ongoing research addressing key environmental challenges like CO2 capture in natural gas systems as investigated by Zhuang et al. [19], illustrate the broad applicability of SOFC technology.
A prevalent paradigm in the majority of SOFC system simulations is the assumption of a rated power output or a fixed fuel utilization factor as the primary input. For instance, Zhu et al. [10], in their Aspen Plus modeling, identified optimal operational parameters for maximum cell electrical efficiency under such rated power assumptions. While this approach is valuable for system-level performance and techno-economic evaluation, it may not fully elucidate the intrinsic electrochemical response of the cell. The current density, a fundamental parameter directly linked to the rate of electrochemical reactions, is a primary determinant of overpotentials and thus cell voltage and efficiency, making it a more direct parameter for investigating electrochemical behavior.
While diverse studies demonstrate significant advancements in SOFC system integration and operational flexibility, a closer examination reveals that the optimization of internal connection topologies within multi-unit SOFC modules has received comparatively less systematic attention. Although valuable insights have been provided by studies on specific arrangements, for instance, Koo et al. [18] highlighted the promise of specific multi-stack arrangements, showing that cascade configurations can significantly enhance fuel utilization and electrical efficiency. Concurrently, Yang et al. [20] investigated the impact of internal gas flow paths for particular SOFC designs, demonstrating that such configurations influence performance. However, despite these valuable insights into specific arrangements, a systematic understanding of how fundamental interconnections such as parallel, series, and series-parallel configurations affect overall module performance remains an evolving area.
To address the aforementioned gaps, this paper presents two primary contributions:
First, we introduce and apply a novel modeling framework for natural gas-fueled SOFC systems that utilizes rated current density as the primary input. This approach enables a more direct investigation of the cell’s intrinsic electrochemical behavior, moving beyond the limitations of traditional power- or utilization-based models, and providing a more robust foundation for simulating scenarios that require dynamic operation and enhanced durability.
Second, leveraging this framework, we investigate the optimization of multi-unit SOFC module configurations. We demonstrate that a strategically designed series-parallel interconnection topology can achieve significantly higher overall electrical efficiency compared to conventional parallel setups, offering practical guidance for future modular SOFC system design.

2. Materials and Methods

2.1. SOFC Electrochemical Model

2.1.1. SOFC Output Current

In the construction of the SOFC simulation model, the molar flow rate of the inlet fuel n f u e l is initially set as an estimated value. Its precise value is subsequently determined based on the amount of hydrogen required for the cell to achieve the target output current. This study adopts the rated current density i c as a key input parameter. A defined quantitative relationship exists between the molar flow rate of hydrogen actually participating in the electrochemical reaction n H 2 , r e a c t i o n and the output current density i c of the SOFC system, as described by Equation (1).
n H 2 , r e a c t i o n = i c × n × A F × n e
where,
  • n H 2 , r e a c t i o n is the molar flow rate of hydrogen actually participating in the electrochemical reaction (mol/h)
  • i c is the rated current density of the system (A/m2)
  • n is the number of single SOFC cells
  • A is the total activation area for the electrochemical reaction in the SOFC (m2)
  • F is Faraday’s constant, valued at 96,485 C/mol
  • n e is the number of electrons transferred per mole of hydrogen undergoing electrochemical oxidation
After calculating n H 2 , r e a c t i o n using Equation (1) and considering the fuel utilization rate ( u f , set to 0.85 in this study as per model assumptions), the total molar flow rate of hydrogen required at the anode can be deduced. Given that the hydrogen in the SOFC anode primarily originates from the steam reforming of hydrocarbons and the water-gas shift reaction of CO present in the inlet fuel, the total molar flow rate of the inlet fuel n f u e l can be determined using Equation (2), based on the theoretical hydrogen contribution from each fuel component upon complete conversion.
n f u e l = n H 2 , r e a c t i o n C H 2 + C C O + 4 × C H 4 + + 13 × C C 4 H 10 u f
where,
  • n f u e l is the total molar flow rate of the inlet fuel (mol/h)
  • C X is the mole fraction of each gaseous component X in the inlet fuel
  • u f is the specified fuel utilization rate
The aforementioned calculation procedures for determining the inlet fuel molar flow rate are defined within a Calculator block in the Aspen Plus software. As this inlet fuel flow rate is fundamental to all subsequent material and energy balance calculations and directly dictates the final operational results of the model, this Calculator block is designated as the first program to be executed in the Aspen Plus simulation sequence.

2.1.2. SOFC Output Voltage

The core of the Solid Oxide Fuel Cell (SOFC) electrochemical model lies in the accurate calculation of its output voltage. The computational methodology employed in this study is based on a well-established semi-empirical model, an approach pioneered by Zhang et al. [15] for Aspen Plus-based SOFC simulation, the accuracy of which has been validated in numerous subsequent literature sources. This model posits that the SOFC output voltage under actual operating conditions is the algebraic sum of its voltage under specific reference conditions V r e f and various voltage losses incurred due to deviations of the actual operating conditions from this reference state, as detailed in Equation (3):
V = V r e f + V T + V P + V a n o d e + V c a t h o d e
where,
  • V is the output voltage of the SOFC under actual operating conditions (V)
  • V r e f is the baseline voltage of the SOFC under specific reference conditions (V). In this study, the reference operating conditions are based on experimental data from the literature: inlet fuel composition of 67% H2, 22% CO, and 11% H2O; fuel utilization of 0.85; air utilization of 0.25; stack operating temperature of 1000 °C; and stack operating pressure of 1 bar. Under these reference conditions, V r e f is taken as 0.7 V.
  • V T is the voltage loss due to the deviation of the actual operating temperature from the reference temperature (V)
  • V P is the voltage loss due to the deviation of the actual operating pressure from the reference pressure (V)
  • V a n o d e is the voltage loss due to the deviation of the anode-side fuel composition from the reference state (V)
  • V c a t h o d e is the voltage loss due to the deviation of the cathode-side oxidant composition from the reference state (V)
It should be noted that in this semi-empirical framework, the ohmic losses caused by contacts, interconnections, and the electrolyte are not treated as a separate, explicit term. Instead, they are implicitly accounted for within the model’s structure: the baseline ohmic loss is inherently included in the experimentally-derived reference voltage ( V r e f ), while variations in these losses due to changes in operating conditions are captured by the deviation terms ( V ). This modeling approach is common for system-level analysis as it allows the model to focus on the impact of macroscopic operating parameters without requiring detailed microstructural data, a methodology consistent with other foundational models such as that of Campanari [17], and widely applied in system-level studies like the one by Doherty et al. [13].
Then, via Equations (4)–(7), we can calculate the difference between the actual working condition and the reference condition, where
The impact of the actual operating pressure on the voltage
Δ V P = 76 × ln p p r e f
where,
  • p is the absolute operating pressure of the SOFC under actual working conditions (bar)
  • p r e f is the absolute operating pressure under reference conditions (1 bar)
The impact of the operating temperature on the voltage
Δ V T = 0.008 × T T r e f × I C
where,
  • T is the operating temperature of the SOFC under actual working conditions (°C)
  • T r e f is the operating temperature under reference conditions (1000 °C)
  • I C is the input current density to the SOFC (mA/cm2)
The impact of the anode fuel components on voltage during actual operation
Δ V a n o d e = 172 × ln p H 2 / p H 2 O p H 2 / p H 2 O r e f
where,
  • p H 2 / p H 2 O is the ratio of the partial pressure of H2 to the partial pressure of H2O in the anode stream under actual SOFC operating conditions. In this model, this value is taken as the arithmetic mean of the corresponding ratios at the anode inlet and outlet.
  • p H 2 / p H 2 O r e f is the ratio of the partial pressure of H2 to the partial pressure of H2O in the anode stream under reference conditions (0.15)
The impact of the oxidizing agent components on voltage during actual operation
V c a t h o d e = 92 × ln p O 2 p O 2 r e f
where,
  • p O 2 is the average partial pressure of O2 on the cathode side under actual SOFC operating conditions (bar). In this model, this value is taken as the arithmetic mean of the O2 partial pressures at the cathode inlet and outlet.
  • p O 2 r e f is the average partial pressure of O2 on the cathode side under reference conditions (0.164 bar)
All the aforementioned voltage calculation procedures are implemented within a Calculator block in the Aspen Plus software (V11, Aspen Technology, Inc., Bedford, MA, USA). Since the calculation of the output voltage depends on the simulation results of multiple stream parameters within the model, this Calculator block is designated to execute after all relevant stream parameters have been computed.

2.1.3. SOFC Output Power

Subsequent to the calculation of the SOFC’s actual operating voltage using the aforementioned electrochemical model, and given the known operating voltage and input current density ( i c ), the DC output power ( W ) of the SOFC power generation system can be determined using Equation (8):
W = i c × A × V
where,
  • W is the DC output power of the SOFC power generation system (W)
  • i c is the input current density to the SOFC (A/m2)
  • A is the total activation area for the electrochemical reaction in the SOFC (m2), which is set to 96.1 m2 in this study
  • V is the output voltage of the SOFC under actual operating conditions (V)
To evaluate the energy conversion performance of the SOFC, its electrical efficiency ( η ) is defined analogously to conventional power generation systems, as the ratio of the DC output power ( W ) to the total lower heating value ( L H V ) input rate of the fuel. This efficiency can be calculated using Equation (9):
η = i c × A × V n f u e l × L H V f u e l / 3600
where,
  • η is the electrical efficiency of the SOFC
  • n f u e l is the total molar flow rate of the inlet fuel (mol/h), the calculation of which is detailed in Equation (2)
  • L H V f u e l is the average lower heating value of the inlet fuel (J/mol). In this study, this value is calculated as the weighted average of the standard LHV of each gaseous component in the inlet fuel, based on their respective mole fractions.
  • The factor “3600” in the denominator is used to convert the hourly molar flow rate ( n f u e l ) to a per-second basis, to align with the unit of power (W, J/s).

2.2. System Process Modeling in Aspen Plus

2.2.1. Model Hypothesis

Given that the 100 kW tubular SOFC power generation system developed by Siemens Westinghouse has realized long-term stable operation, and the data are easily accessible, we would like to take this cell as our research object and make use of Aspen Plus to build a simulation model [15,17]. Aspen Plus is a kind of commercial software applicable to process analysis that incorporates a complete thermodynamic and physical property database so that it can be applied to chemical process research [13,21,22]. To facilitate our research during the modelling process, we can have the following hypotheses:
(1) The SOFC model is developed as a zero-dimensional (0D) representation, a common approach for system-level performance assessment and parametric studies in fuel cell modeling [15,23].
(2) All gaseous streams are treated as ideal gases, and individual unit operation modules are assumed to operate under isothermal and isobaric conditions, which are standard simplifications for 0D module representations under typical SOFC operating conditions [17,23].
(3) Chemical equilibrium, based on Gibbs free energy minimization, is assumed for reforming and water-gas shift reactions within designated Gibbs reactor modules, a widely adopted practice in Aspen Plus simulations of such high-temperature processes [13,15,21,22].
(4) The overall electrochemical reaction is represented by an equivalent global oxidation of H2 by O2, simulated within a Gibbs reactor for macroscopic energy and mass balancing, as utilized in some Aspen Plus-based SOFC system models [15].
(5) Only hydrogen (H2) is assumed to participate directly in the anode electrochemical reactions; other fuel components like CH4 and CO are considered fully converted to H2 beforehand, a common simplification in system-level SOFC modeling [13,15,17,23].

2.2.2. System Flow

Figure 1 is the SOFC power generation system flow built in this paper. First, natural gas (stream 1) and recirculating anode outlet’s spent fuel (stream 6) are mixed, and then the fuel mixture (stream 3) enters the pre-reformer for fuel pretreatment, i.e., reaction (10)~(11). After that, the treated fuel (stream 4) gets into the SOFC anode, where it has an electrochemical reaction with oxygen (stream 11) from the cathode, and reaction (12). Part of the spent fuel from the anode (stream 5) will have recirculation, i.e., stream 6, to provide high heat vapor for fuel pre-reforming, whose specific circulation proportion is determined by the specified water/carbon ratio. The other part of spent fuel enters the afterburner and gets mixed with the nitrogen-enriched air at the anode outlet (stream 13), where combustion reaction and reaction take place (13)~(14).
C n H 2 n + 2 + n H 2 O 2 n + 1 H 2 + n C O
C O + H 2 O = C O 2 + H 2
H 2 + 1 2 O 2 = H 2 O
2 H 2 + O 2 = 2 H 2 O
2 C O + O 2 = 2 C O 2
In this study, the control and calculation of several critical parameters, including the molar flow rate of oxygen separated at the cathode, the molar flow rate of recycled anode off-gas, and the equalization of SOFC anode and cathode temperatures, were implemented using the “Calculator” blocks within Aspen Plus software, incorporating custom Fortran statements. This approach enhances model fidelity and allows for specific process logic that standard unit operations may not directly support. The specific implementations are as follows:
The specific implementations are as follows:
(1) Cathode Oxygen Flow Control:
The molar flow rate of O2 separated at the cathode, designated as Stream 11, is determined by the stoichiometric O2 requirement for the electrochemical reactions at the anode. This stoichiometric relationship is derived from Equations (1) and (13).
(2) Anode Off-Gas Recirculation Control:
To determine the recirculation ratio of the anode off-gas, the required molar flow rate of steam within the recycled off-gas is first calculated. This calculation is based on the number of carbon atoms in the stream entering the pre-reformer and the specified steam-to-carbon ratio, commonly denoted as S/C. Recognizing that standard Aspen Plus separator blocks do not alter stream compositions, the calculator block was employed. This block calculates the total molar flow rate of the recycle stream, Stream 6, by utilizing the molar composition of an upstream reference stream, Stream 5. Stream 5 shares the same composition as the target recycle streams, Streams 6 and 7.
(3) SOFC Temperature Equalization:
To simulate the operational condition where SOFC anode and cathode temperatures are maintained approximately equal, a “Calculator” block was also used. This block sets the temperature of Stream 5, which represents the anode inlet or a key anode location, equal to the temperature of Stream 13, representing the cathode inlet or a key cathode location. The specific implementation logic for this temperature equalization also relies on parameter settings within the calculator module.
By embedding these tailored Fortran calculations within Aspen Plus, we achieved more precise control over key stoichiometric relationships, material balances, and thermodynamic conditions throughout the simulation. This methodology significantly enhances the accuracy, transparency, and reproducibility of our model, allowing for a clearer understanding of the underlying calculations and facilitating verification by other researchers.

2.3. Simulation Input Parameters

The primary input parameters for the SOFC model are detailed in Table 1. Key operational settings include an internal operating pressure of 1.08 atm for the SOFC unit, effectively atmospheric pressure. The inlet fuel is injected into the cell stack with an initial pressure set at three times the internal operating pressure, corresponding to 3.24 atm, to account for pressure requirements for fuel delivery and recirculation. Throughout this study, a rated current density of 180 mA/cm2 is a principal input. The SOFC stack is configured with 1152 single cells connected in series. Considering that the direct output is DC power, a DC-to-AC conversion efficiency of 92% is incorporated for calculating net AC power output, where applicable. Consistent with the model’s simplifying assumptions, pressure drops across the SOFC unit are considered negligible during the simulation.

3. Results and Discussion

3.1. Simulation Results and Validation

3.1.1. Simulation Results

The detailed stream data from the SOFC simulation model are presented in Table 2. Based on the rated current density input, the required molar flow rate of the inlet fuel was calculated to be 1.07 kmol/h using Equation (2), which precisely matches the molar flow rate of stream 1 reported in Table 2. Furthermore, the constraint setting the temperatures of stream 5 (anode outlet) and stream 13 (cathode air outlet) to be equal was successfully implemented, as confirmed by the results in Table 2. Additionally, the heat exchange between stream 14 (hot exhaust post-afterburner) and stream 9 (inlet air) resulted in temperature changes from 1011.25 °C to 833.85 °C for stream 14, and from 630 °C to 822.37 °C for stream 9, respectively. All these outcomes are consistent with the model’s configuration requirements, thereby verifying the correct construction of the simulation model.

3.1.2. Simulation Verification

The SOFC power generation system model built in this paper is compared with the data released in some previous research for verification, as shown in Table 3. The model’s predictions and relevant operational results demonstrate good consistency with, and the anode outlet gas composition is quite similar to, findings covered in the literature: the output voltage’s prediction error is 5.8%, and the cell power generation efficiency’s prediction error is 0.4%. These minor deviations can be attributed to discrepancies between certain model assumptions and actual experimental conditions. For example, suppose that the net heat thermal load of the reformer is 0, and the only gas of the anode involved in the electrochemical reaction is H2; this voltage calculation has ignored the minute differences in the components of gas. Overall, the assumptions and error accuracy of the model are acceptable, which proves that the established model can conduct the following sensitivity studies.

3.2. Sensitivity Analysis of SOFC Unit Parameters

3.2.1. Fuel Utilization

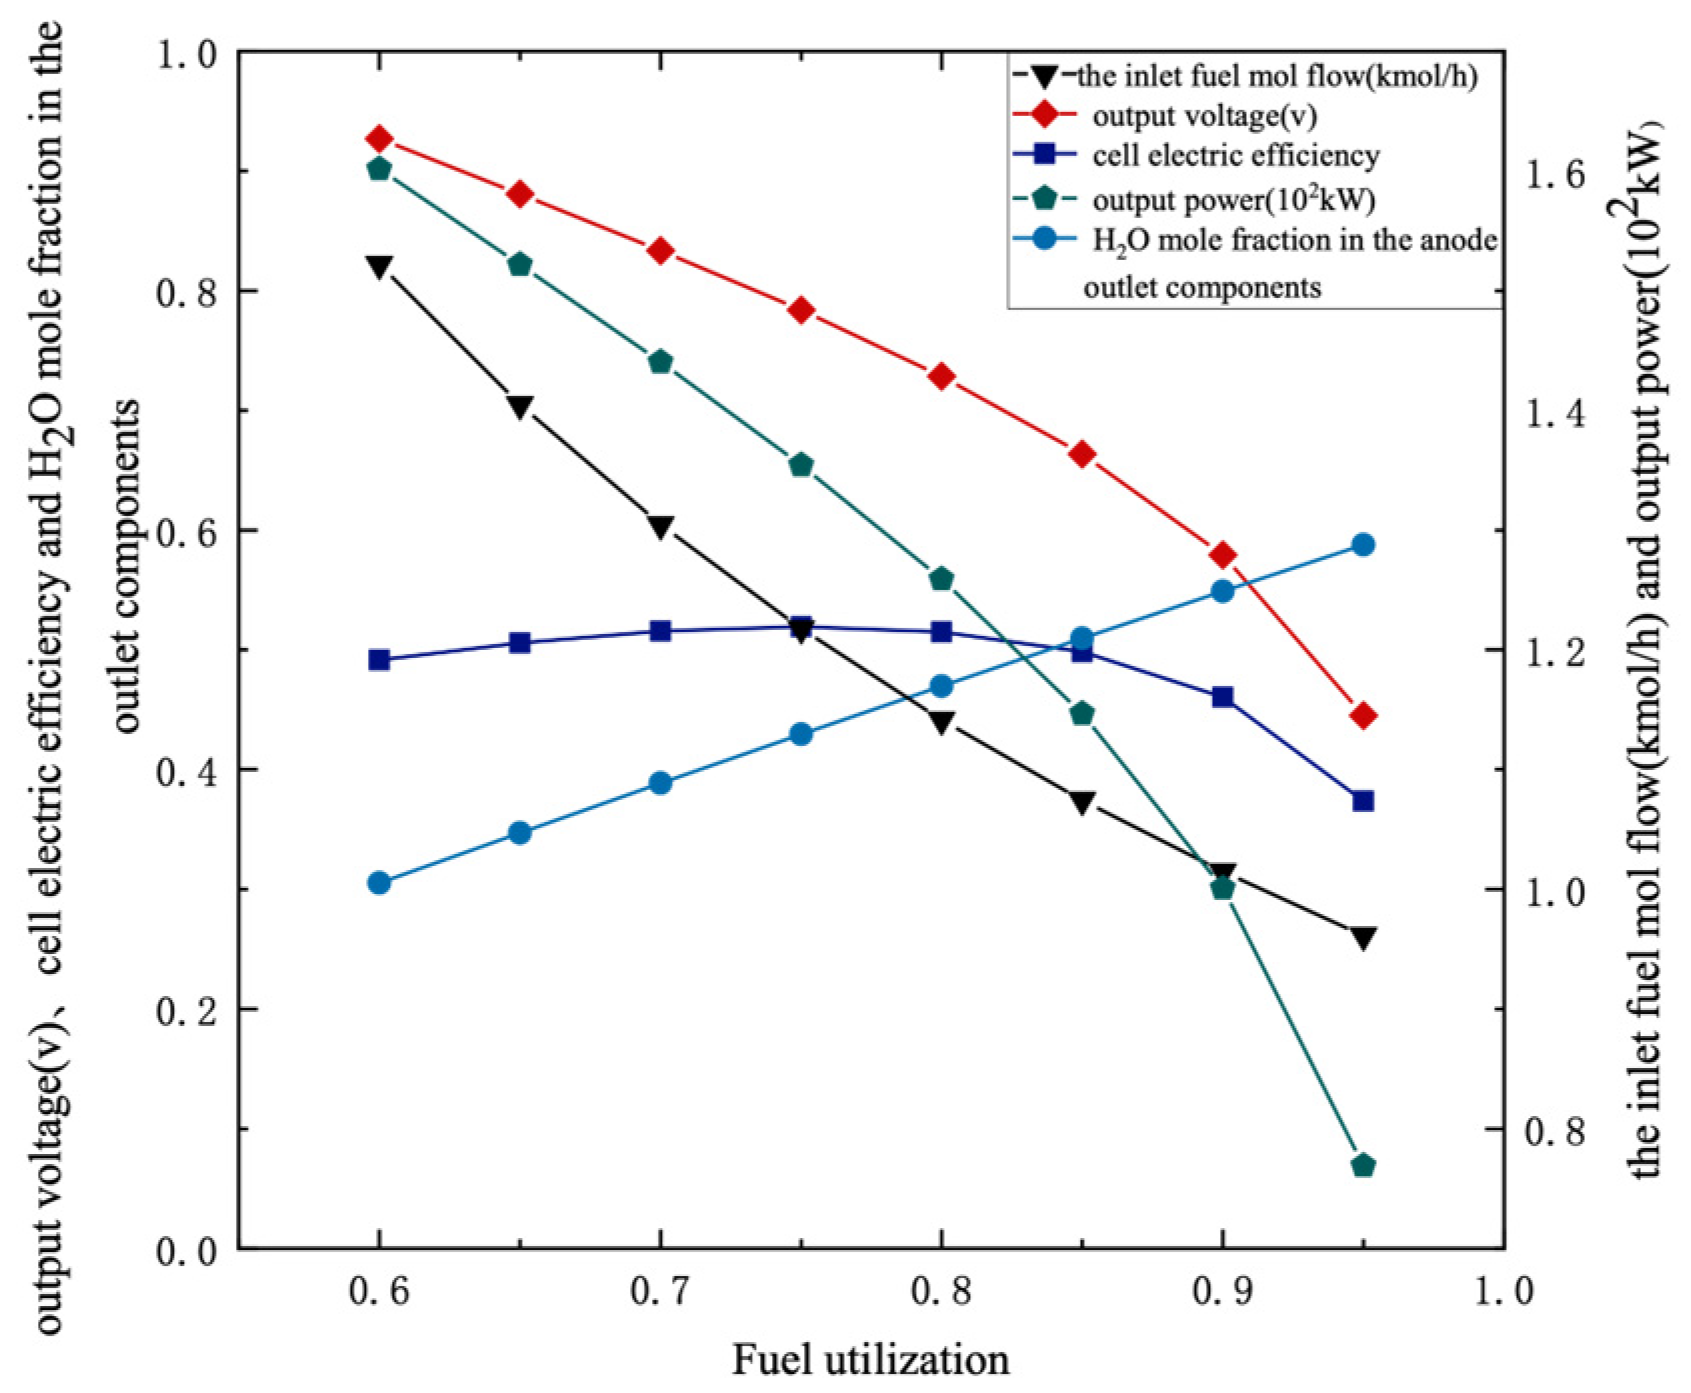
Fuel utilization ( U f ) refers to the rate of the amount of hydrogen involved in the electrochemical reaction within the electric stack to the total hydrogen amount at the anode, is a critical operational parameter that profoundly influences SOFC performance characteristics [15,17]. Figure 2 illustrates the law when the fuel utilization changes, how the five factors: inlet fuel mol flow, output voltage, output power, H2O mole fraction in the anode outlet components, and cell electric efficiency will be affected at the rated current input (j = 180 mA/cm2).
The simulations demonstrate an inverse relationship between U f and the requisite inlet fuel molar flow rate: as U f is increased from 0.6 to 0.95, the inlet fuel molar flow rate decreases substantially from 1.52 kmol/h to 0.96 kmol/h. This is a direct consequence of improved fuel conversion efficiency per unit of fuel input at higher U f values [17]. Concurrently, the H2O mole fraction in the anode outlet stream, a key indicator of fuel conversion and steam availability for reforming, exhibits a positive correlation with U f , signifying a greater extent of reaction and thus a reduced quantity of unreacted fuel available for potential recirculation or downstream processes [15].
The SOFC’s output voltage and power respond dynamically to changes in U f . When U f increases from 0.6 to 0.85, both voltage and power show a relatively gradual decline. This initial phase is characterized by moderate hydrogen demand at the anode under the specified current density, where concentration polarization losses are not yet the dominant factor limiting performance [17]. However, as U f is further increased beyond 0.85, a more pronounced reduction in both output voltage and power is observed. This accelerated decline is primarily attributed to the significant increase in concentration polarization losses within the cell, which become increasingly severe as the fuel at the anode becomes highly depleted [15,25].
Consequently, the net stack-level electrical efficiency follows an “increase-before-drop” trajectory with rising U f . The efficiency initially improves, reaching a peak value of 54% at a U f of 0.75, corresponding to an output power of 135.43 kW. This optimal point reflects a balance between maximizing fuel conversion and managing the onset of significant polarization losses, a well-recognized characteristic in SOFC operation and modeling [13,26]. Beyond this U f , the adverse impact of escalating concentration losses on cell voltage outweighs the benefits of further fuel conversion, leading to a decrease in overall electrical efficiency. It is also important to consider that prolonged operation at very high U f levels might pose risks to SOFC durability and long-term stability due to potential local fuel starvation or increased degradation rates, though a detailed analysis of these effects is beyond the scope of the present 0D model [18].
The composition of the anode off-gas, crucial for the design and operation of integrated SOFC systems (e.g., with heat recovery, off-gas combustion, or further processing in SOEC systems [21,22]), is directly dictated by U f , as shown in Figure 3. It shows that the higher the fuel utilization is, the higher the anode outlet stream H2O and CO2 mole fractions will be, and the lower the combustible components CO and H2 mole fractions will be. If the anode tail gas directly gets into the combustion chamber, when the fuel utilization increases, the concentration of combustible gas components will decrease, and the system’s economic efficiency will decrease gradually. This has direct implications for the thermal management and overall efficiency of systems utilizing this off-gas, for instance, in combined heat and power (CHP) configurations where the off-gas is combusted to provide heat [23,27].
While the general trends of U f impact on SOFCs are documented [15,17], the novelty of this study stems from its systematic evaluation of these sensitivities under the specific constraint of a rated current density input. This approach, differing from traditional analyses based on rated power output, offers a direct insight into how varying fuel conversion levels affect the cell’s intrinsic electrochemical state when the overall electrochemical reaction rate is maintained.

3.2.2. Water-Carbon Ratio

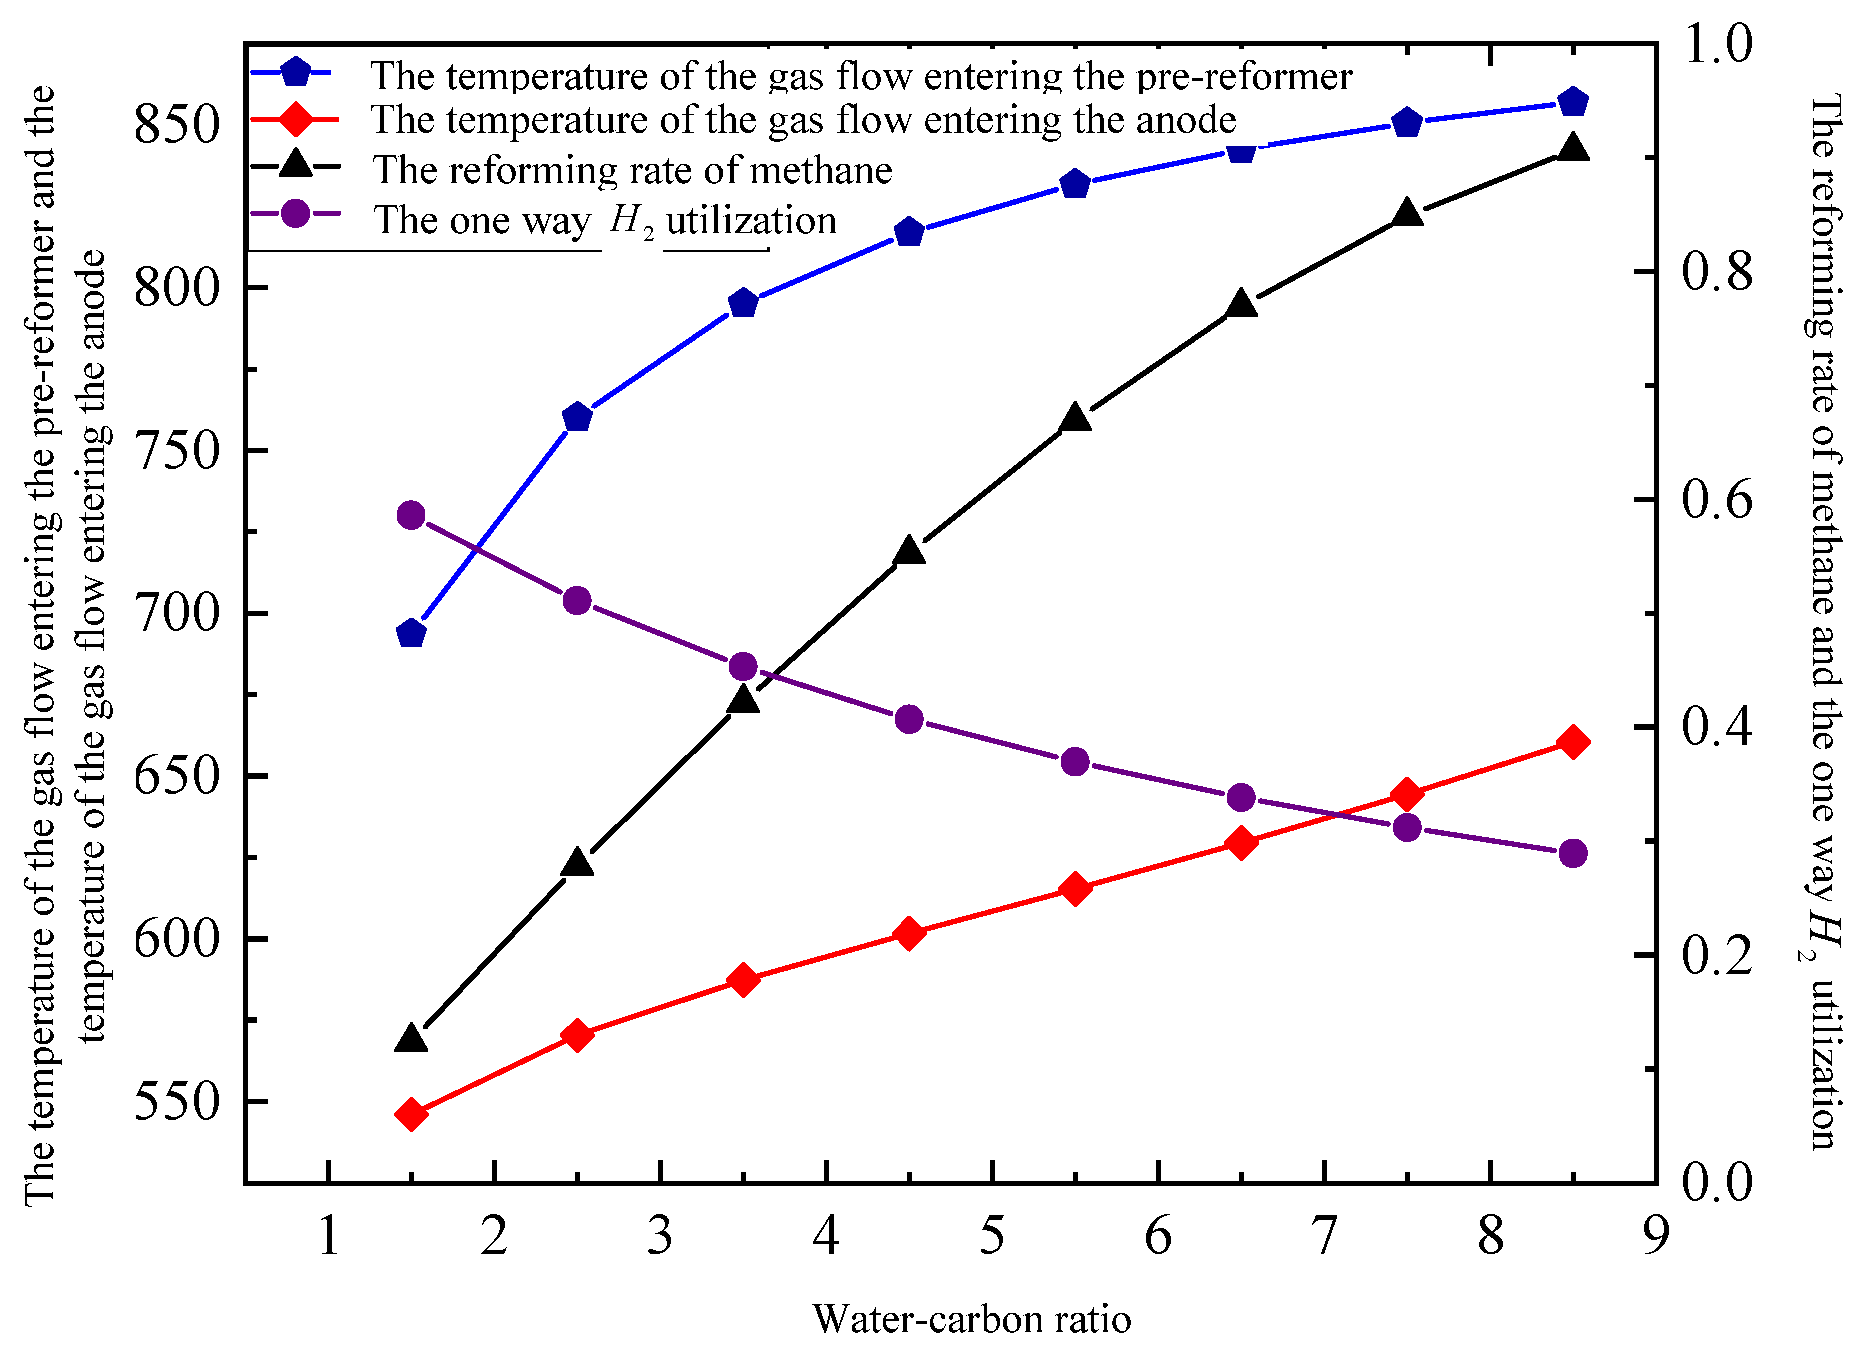
The water-carbon ratio refers to the ratio of water molecules in the gas mixture to the carbon number in the combustible components. It primarily aims to prevent carbon deposition on the anode and enhance the quality of the gas participating in electrochemical reactions, a principle widely acknowledged in SOFC literature [6,28] While the specific S/C threshold for avoiding coking varies, maintaining a ratio above stoichiometric levels, often greater than 1.5, is generally recommended, especially for internal reforming, to ensure sufficient steam for reforming reactions and minimize deleterious carbon formation [28]. For instance, Soleimanpour and Ebrahimi [29] noted that under their studied external reforming conditions with biogas, the probability of certain carbon-forming reactions like vapor formation was negligible, underscoring the role of steam or CO2 in managing deposition. Here, the water-carbon ratio research range is [1.5, 8.5]. The simulation studies the fuel utilization of 0.75, and when other input conditions remain unchanged, the water-carbon ratio will increase from 1.5 to 8.5, and we can know its impact on the pre-reformer operation, electrochemical reaction, and the whole system circulation efficiency. Figure 4 illustrates that when the water-carbon ratio increases from 1.5 to 8.5, the temperature of the gas flow entering the pre-reformer, the reforming rate of methane inside the reformer, and the temperature of the gas flow entering the anode all increase accordingly, but the one-way H2 utilization will drop as well. This is because that when the water-carbon ratio grows from 1.5 to 8.5, the proportion of the spent fuel from the anode outlet will bypass into circulation will get higher and higher, and it will bring about more high heat vapor for the pre-reformer, which then experiences reforming reaction and endothermic reaction, and high heat vapor will enhance the reaction’s positive shift, making the methane pre-reforming rate to increase from 0.124 to 0.906.
However, the increase in the temperature of the stream into the pre-reformer and the temperature of the stream into the anode leads to the change of temperature gradient inside the cell, i.e., the water-carbon ratio grows from 1.5 to 5.5, and the temperature difference between the two increases from 147.7 °C to 216.4 °C. When the water-carbon ratio continues to grow to 8.5, and temperature difference drops down to 196.5 °C. An excessively high temperature gradient inside the fuel cell will arouse thermal stress and lead to PEN component damage inside the cell, shortening the SOFC service life [28]. To avoid this phenomenon, within the research range, the minimum temperature value of 147.7 °C can be chosen. The one-way H2 utilization is defined as the ratio of the amount of H2 involved in the electrochemical reaction during one circulation in the whole steady-state process to the total amount of H2 inside the anode. Figure 4 shows that when the water-carbon ratio increases from 1.5 to 8.5, the one-way H2 utilization drops from 0.586 to 0.289. This means that we need to increase the number of circulations to reach the total fuel utilization of 0.75 in the steady state process. Meanwhile, it also makes the mole flow of the stream inside the pre-reformer via the one-way circulation increase. This actually increases the actual input and operation costs of the pre-reformer and fuel cell stack. To sum up, the water-carbon ratio selected in this case will be 1.5, the lower limit of the research range. This value provides a sufficient safety margin against coking, as thermodynamic equilibrium studies [30] confirm that carbon deposition is unfavorable under the high operating temperatures of SOFCs.
This study explores an S/C ratio as low as 1.5, relying on internal anode reforming capabilities, which offers a unique perspective compared to some systems where higher S/C ratios are commonly used. For example, ratios of 2.0–3.0 have been explored in biomass co-gasification [31], while ratios around 2.0–2.5 are often optimal for electrical efficiency in oxyfuel systems [28]. The novelty of this study lies in assessing the system’s performance and thermal management under steam-lean conditions, which could be particularly relevant for fuel compositions or system designs that aim to minimize external steam supply, in contrast to systems that focus on external reforming [29].

3.2.3. Current Density

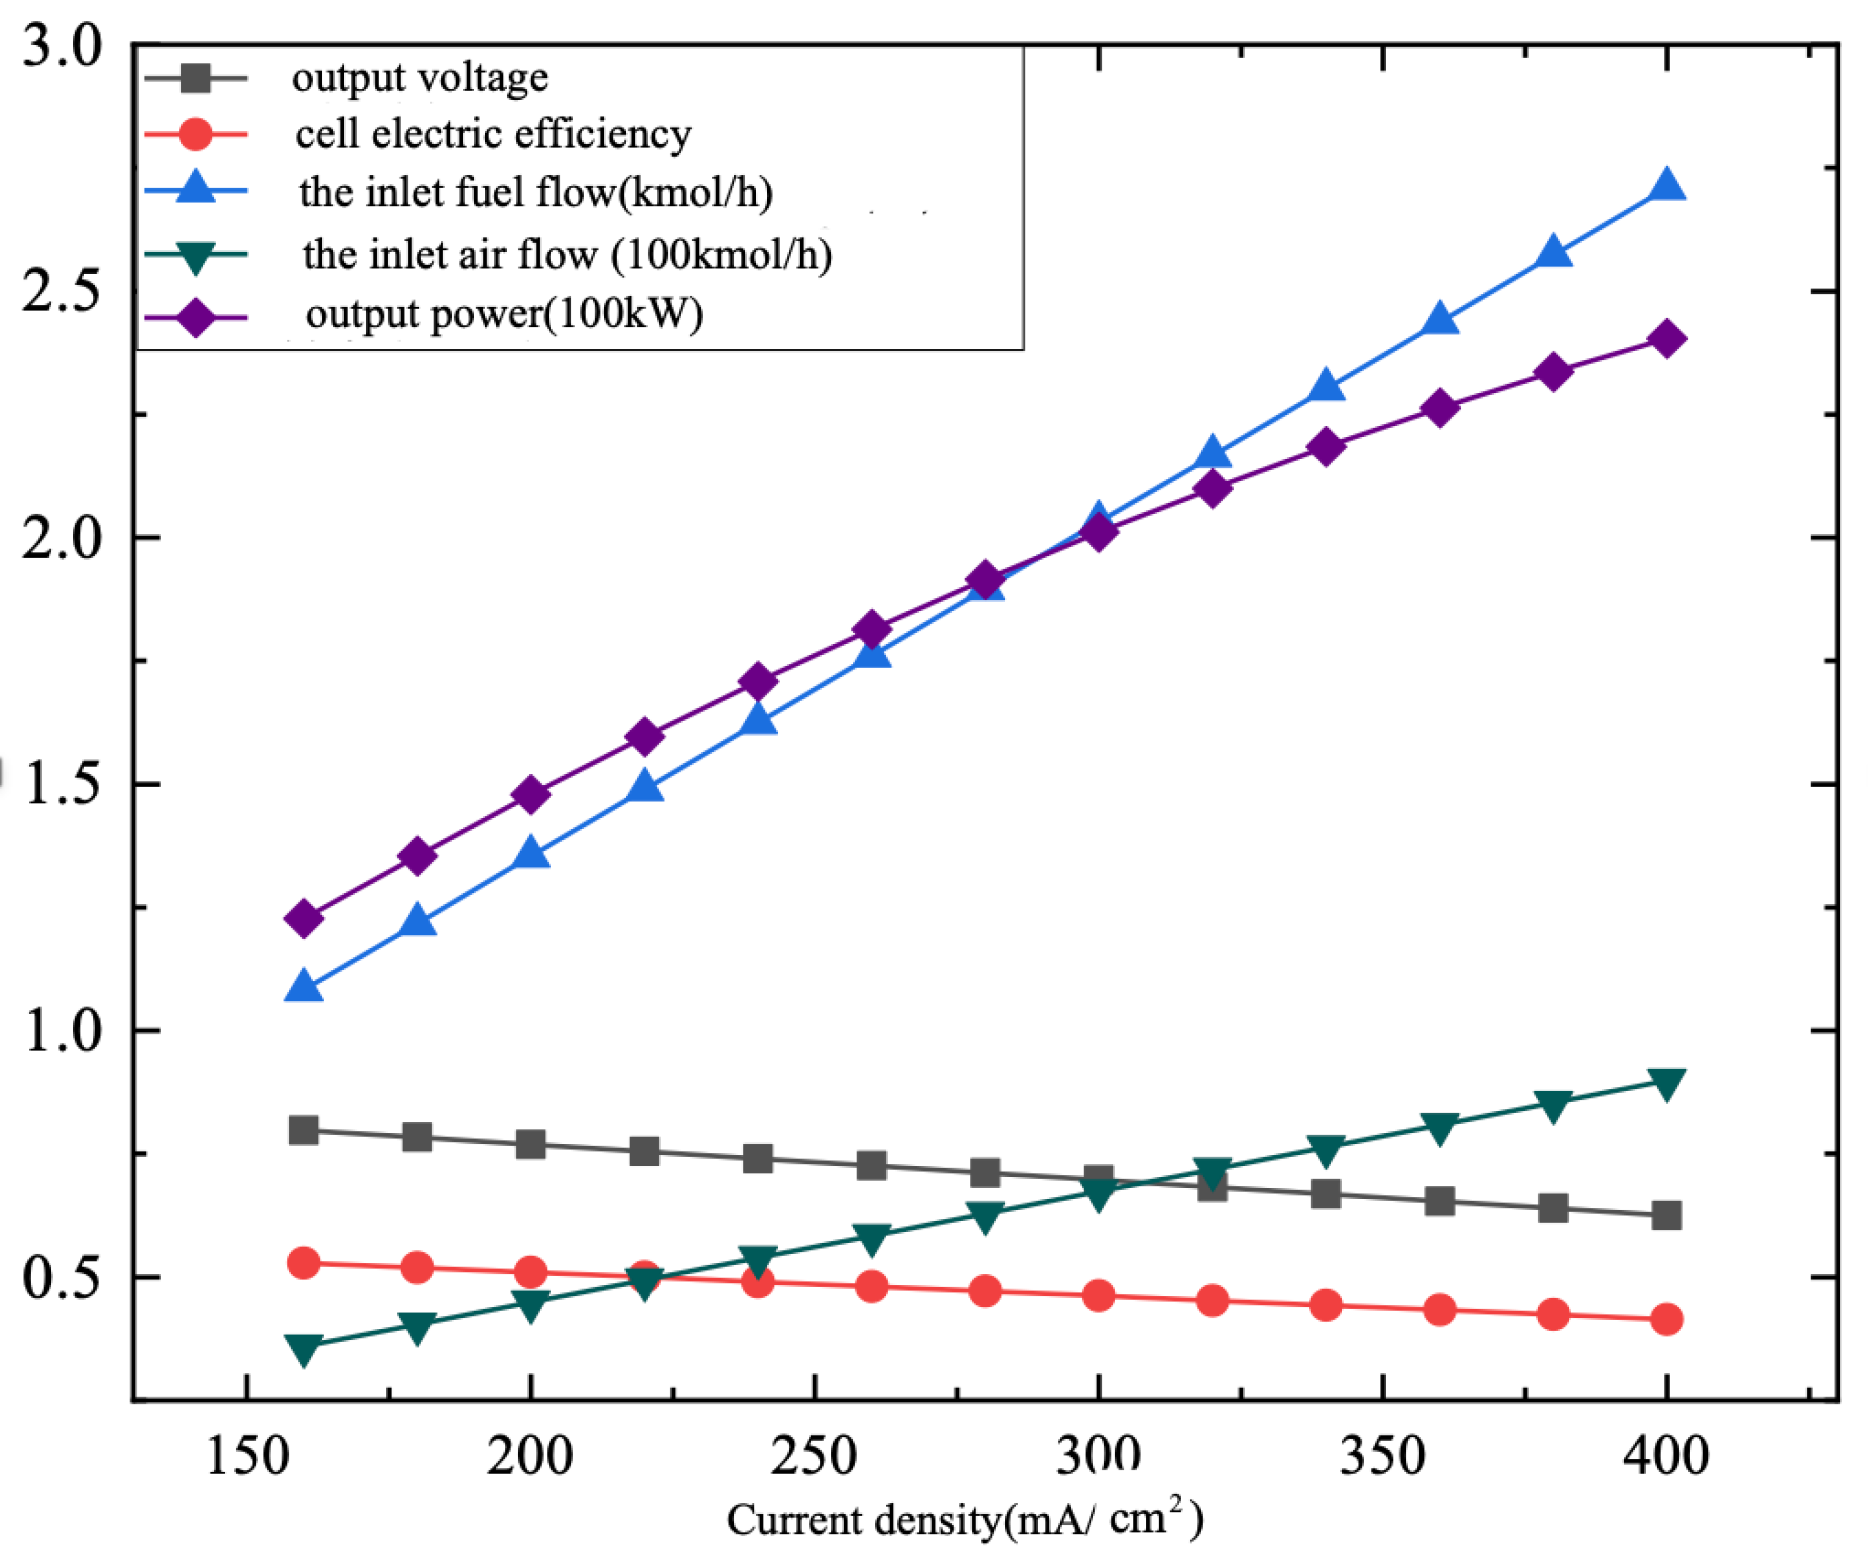
This section analyzes the impact of different current densities on the cell’s main performance under the conditions of 0.75 fuel utilization and 1.5 water-carbon ratio. Figure 5 illustrates the impact of the current density change on output voltage, power, electrical efficiency, inlet air flow, and inlet fuel flow. When the current density increases from 160 mA/cm2 to 400 mA/cm2, the inlet fuel and inlet air mole flow will increase, respectively, from 1.08 kmol/h to 2.71 kmol/h and from 35.95 kmol/h to 89.87 kmol/h. This shows that when the fuel utilization stays unchanged, the current density increases, which makes the H2 and O2 mole flow needed for electrochemical reaction at the anode increase, and the inlet fuel mole flow and inlet air mole flow will increase accordingly. This is a fundamental principle in fuel cell system modeling, which is also commonly applied in various energy system simulations using Aspen Plus, as evidenced by Doherty et al. [13], Zhao et al. [22], and Niu et al. [21].
The cell voltage and cell power generation efficiency start to drop gradually along with the increase in current density. This phenomenon is primarily attributed to increased overpotentials, including activation losses, which are dependent on exchange current density [32], and ohmic losses, which scale with current [15,17]. The two losses combined will cause the cell voltage to drop, and thanks to the constant fuel utilization, the cell power generation efficiency and cell voltage will have a synergetic change, so the cell power generation also drops. In contrast, the cell output power will increase along with the growth of current density. Therefore, in actual design, the fuel utilization stays unchanged; when the current density increases, we need to consider both of the two changing factors of cell output power and cell power generation efficiency.
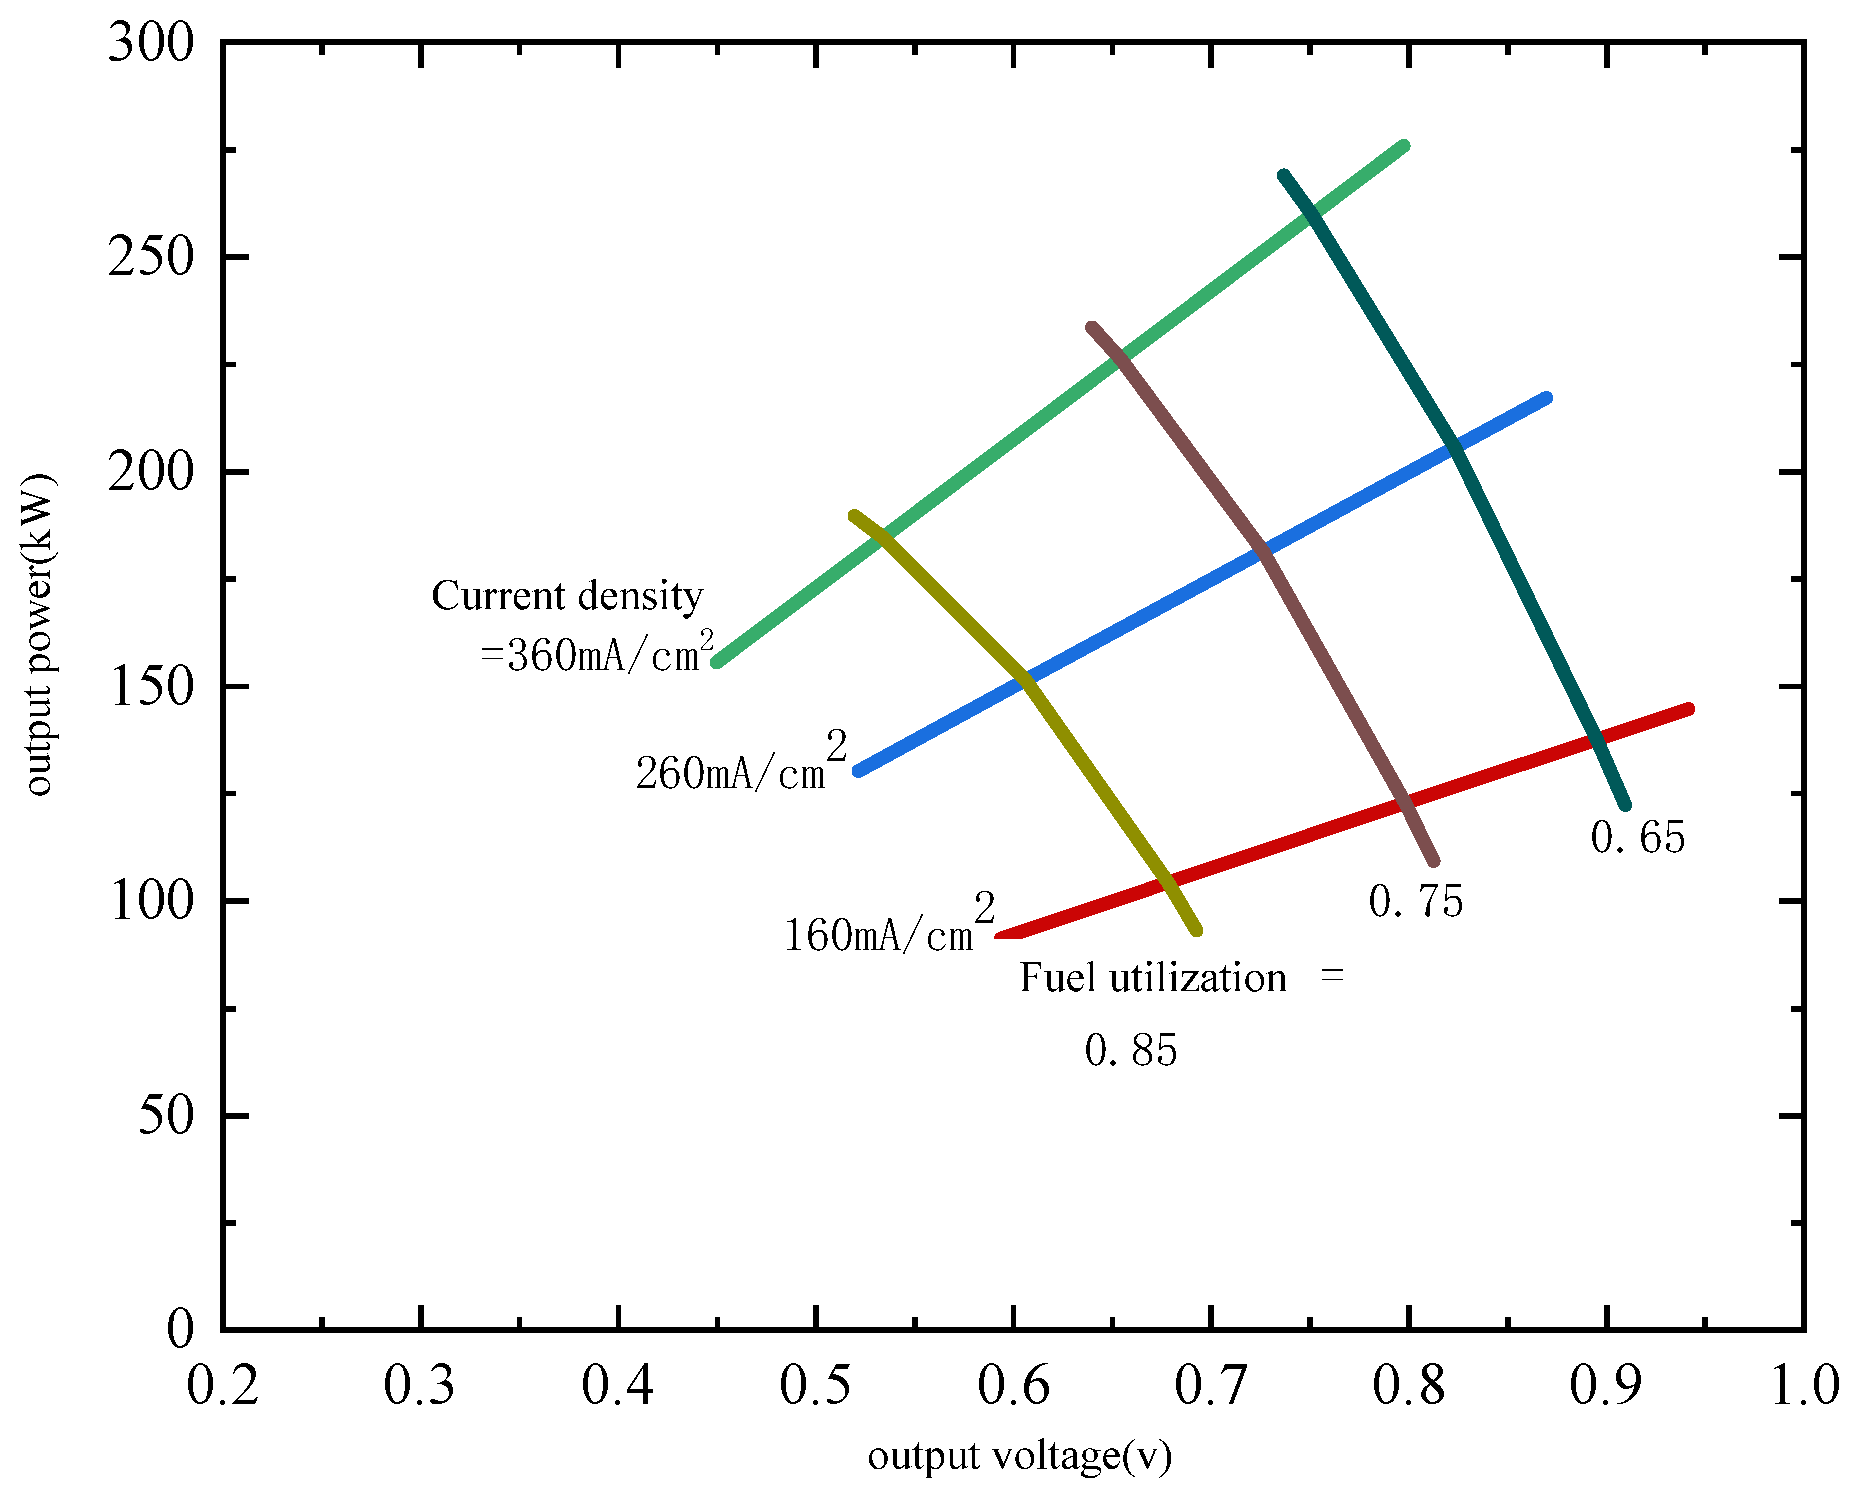
Figure 6 further shows the impact of multiple parameters on the SOFC performance. As shown in the figure, there are two approaches to enhancing cell power output: First, lower cell fuel utilization at rated current; second, increase cell current density at constant fuel utilization. Within the research range, when the first approach is employed, and the current density is 160 mA/cm2, the fuel utilization decreases from 0.9 to 0.6, and the cell output power can increase to 53.47 kW. As for the second approach, when the current density increases from 160 mA/cm2 to 360 mA/cm2, the cell output power can go up to 103.55 kW. To sum up, the current density has more impact on power than fuel utilization, and during actual operation, it is more feasible to change the current density, which means that research based on an assumed current density rate can also meet demand for SOFC simulation analysis research.
This study differs from previous research, which often focuses on the influence of operational conditions on electrochemical parameters like exchange current density [32] or evaluates performance based on fixed power output or variable fuel utilization [13,15,17]. The novelty lies in the systematic analysis of SOFC unit performance with rated current density as a primary input. This approach is also relevant for broader energy system simulations, which can be useful for designing control strategies based on current modulation or applications where current is the primary controlled variable.

3.3. Multi-Unit SOFC Configuration Optimization

Building upon the insights from the parametric sensitivity analysis, which detailed the influence of key operational parameters on single SOFC unit performance, the present work now addresses the problem of configuring multiple units to achieve a significant power output. This study targets an SOFC module output power of approximately 400 kW, analyzing it as a representative medium-scale power unit. Notably, the chosen power level not only aligns with the achievable scale for modular SOFC applications as suggested by Córdova et al. [33], but also echoes the research direction highlighted by Chen et al. [34] regarding the construction of high-power systems through the optimization of fundamental planar modular short SOFC stacks. As previously established, a single SOFC unit can achieve a peak output power of approximately 135.73 kW under a rated current density of 180 mA/cm2 and a fuel utilization of 0.75. This section will explore series-parallel combination strategies for multiple SOFC units, with each unit having a power capability of 100–135 kW to achieve the aforementioned 400 kW module power target. Considering that the preceding sensitivity analysis of fuel utilization revealed its impact on anode off-gas composition, this section, building upon the single-cell research findings, aims to identify novel and optimized SOFC module configurations, superior to traditional pure parallel arrangements, by strategically adjusting the fuel utilization of individual SOFC units.
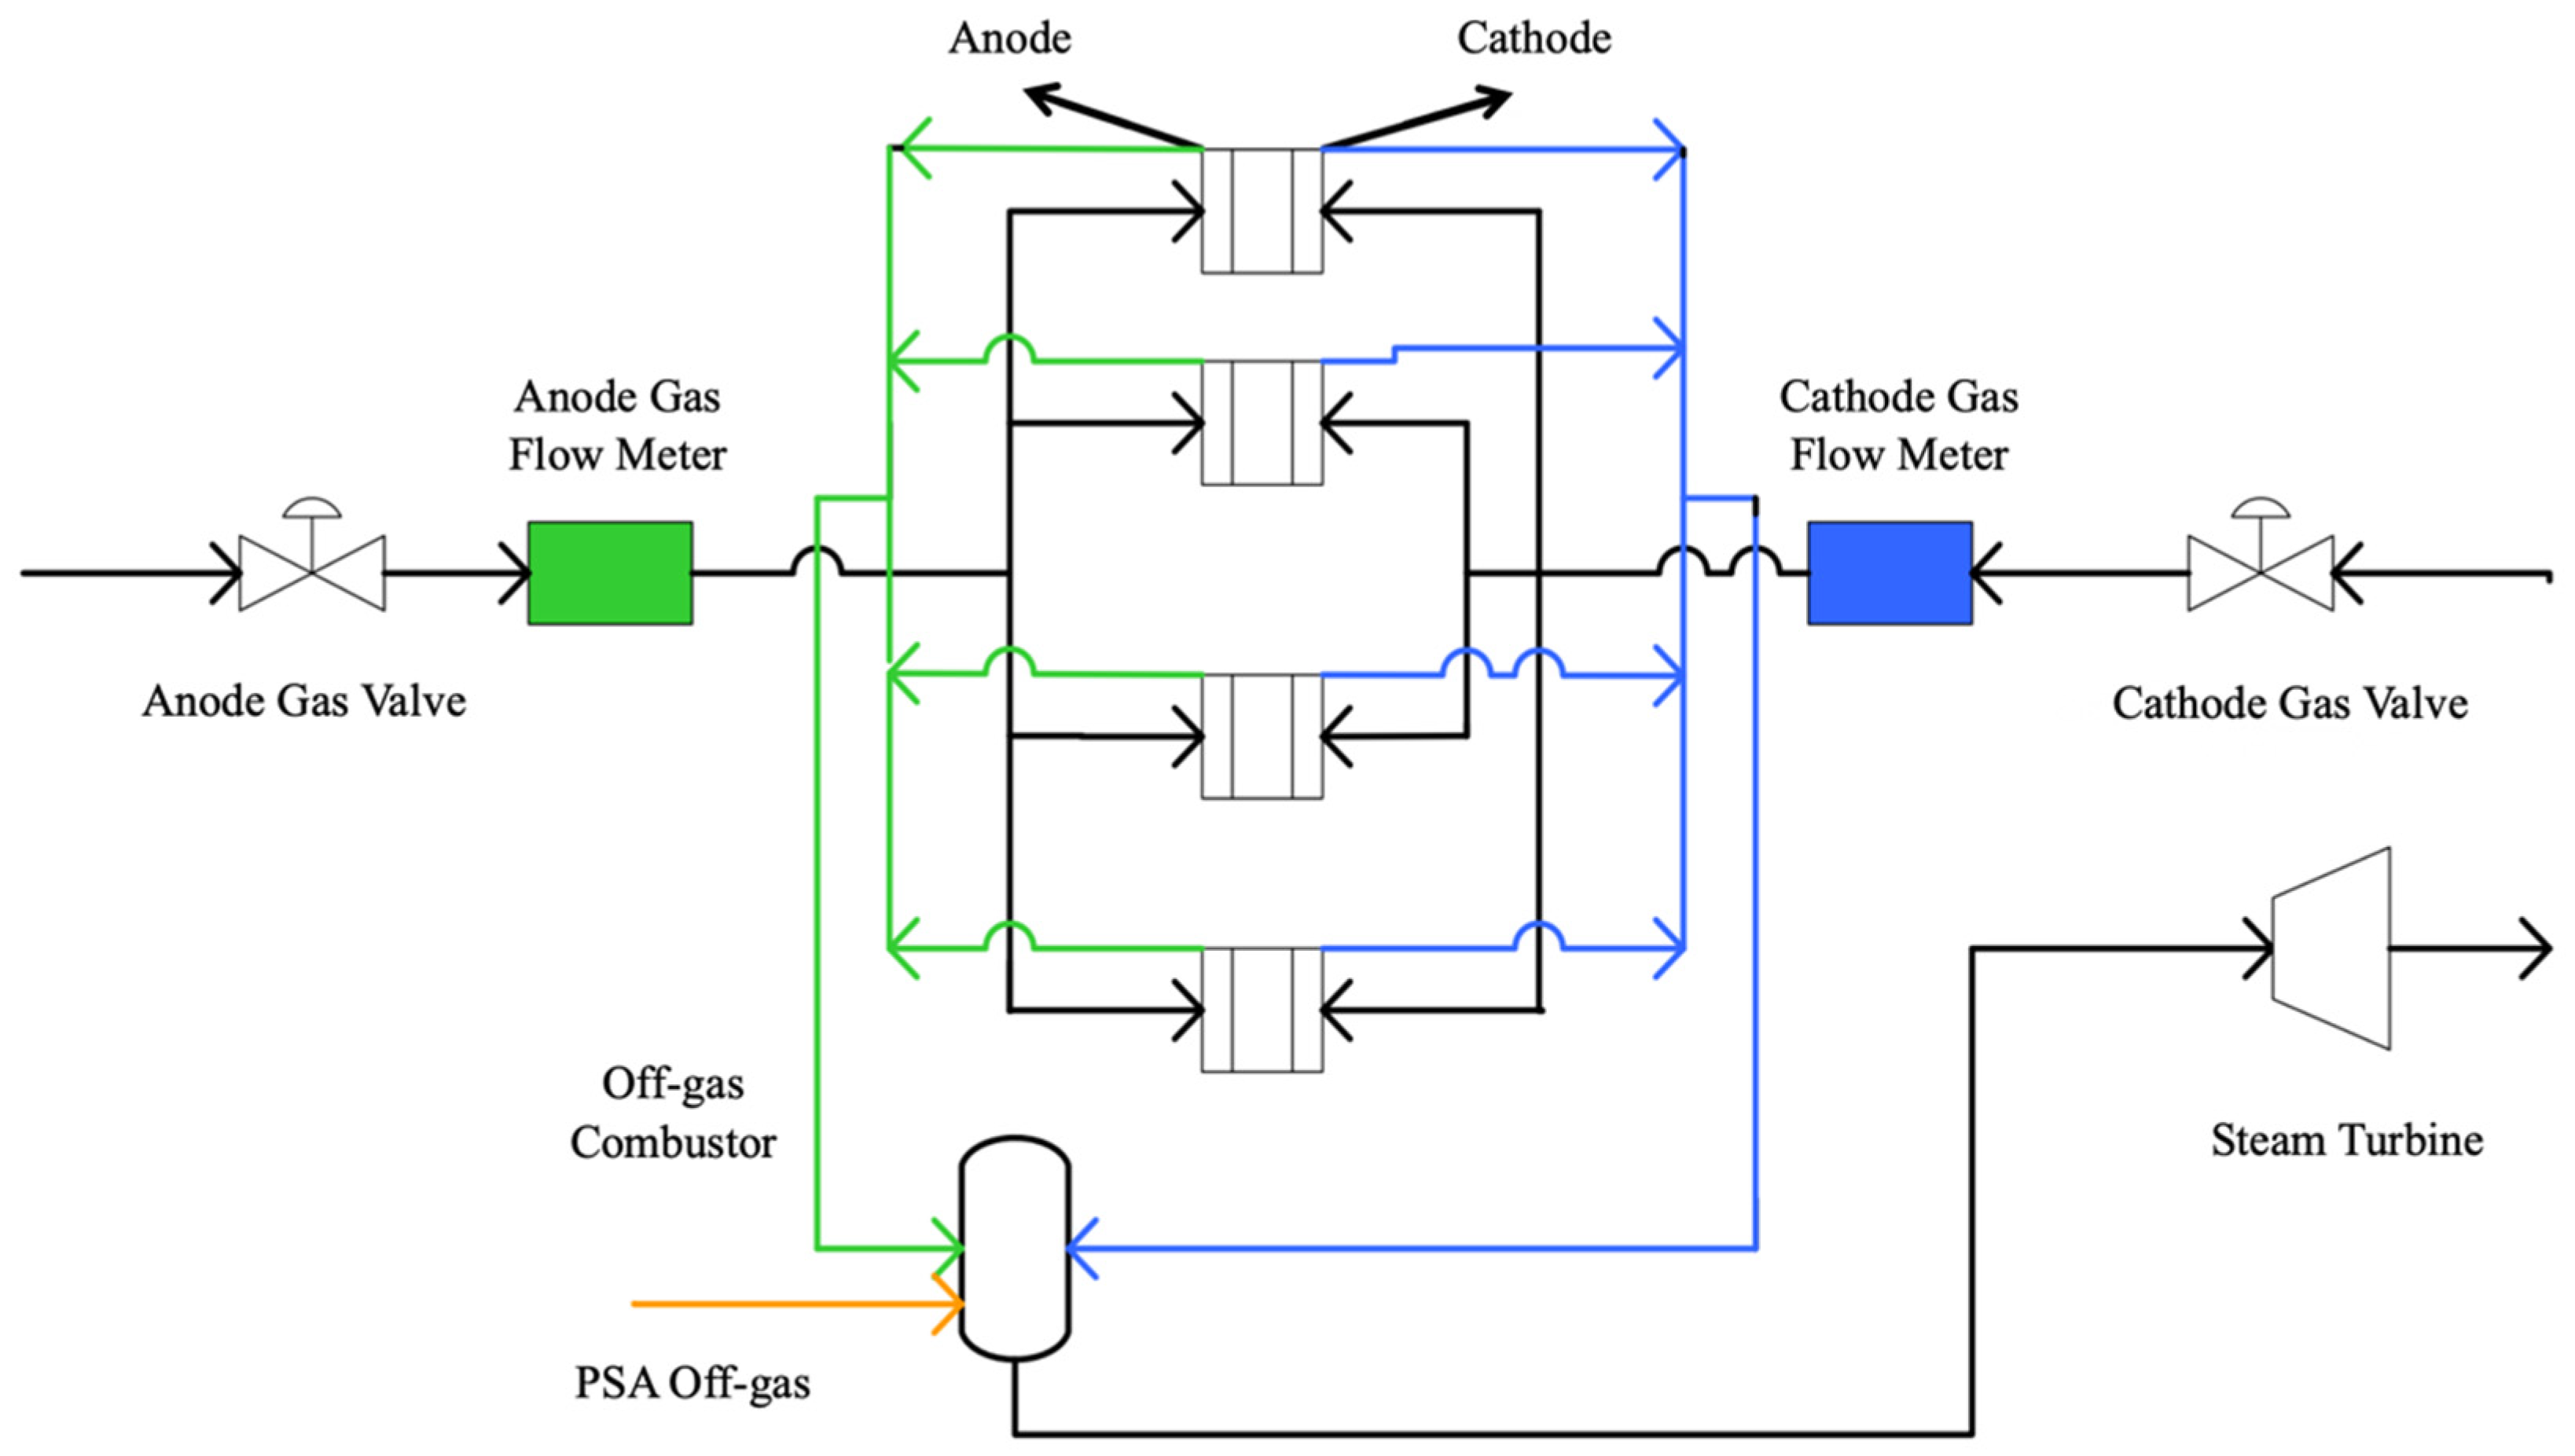
To achieve the research objective output, the traditional SOFC configuration method involves connecting 4 SOFC units in parallel, with the specific model structure design shown in Figure 7. In this traditional setup, a gas flow meter controls the anode inlet fuel, aiming to input the same amount of fuel into the anode of the fuel cell, where it undergoes an electrochemical reaction with oxygen from the cathode. Afterward, the spent fuel from the 4 SOFC units is mixed with the PSA tail gas, and the mixed stream is directed into the exhaust combustion unit, where it burns fully with oxygen to produce high-heat steam. This high-heat steam is then passed into the steam turbine to conduct mechanical work and generate electricity. In this configuration, pure hydrogen fuel treated by PSA is equally fed into the 4 SOFC units. Referring to the SOFC structural parameters from the previous studies and using a rated current density of 180 mA/cm2, when the fuel utilization of the SOFC module is 0.75, the output power is highest. In this case, the total maximum output power from the 4 SOFC units is 498.38 kW. Based on the calculation from Equation (1), the required inlet fuel, or H2 molar flow rate, is 18.64 kmol/h.
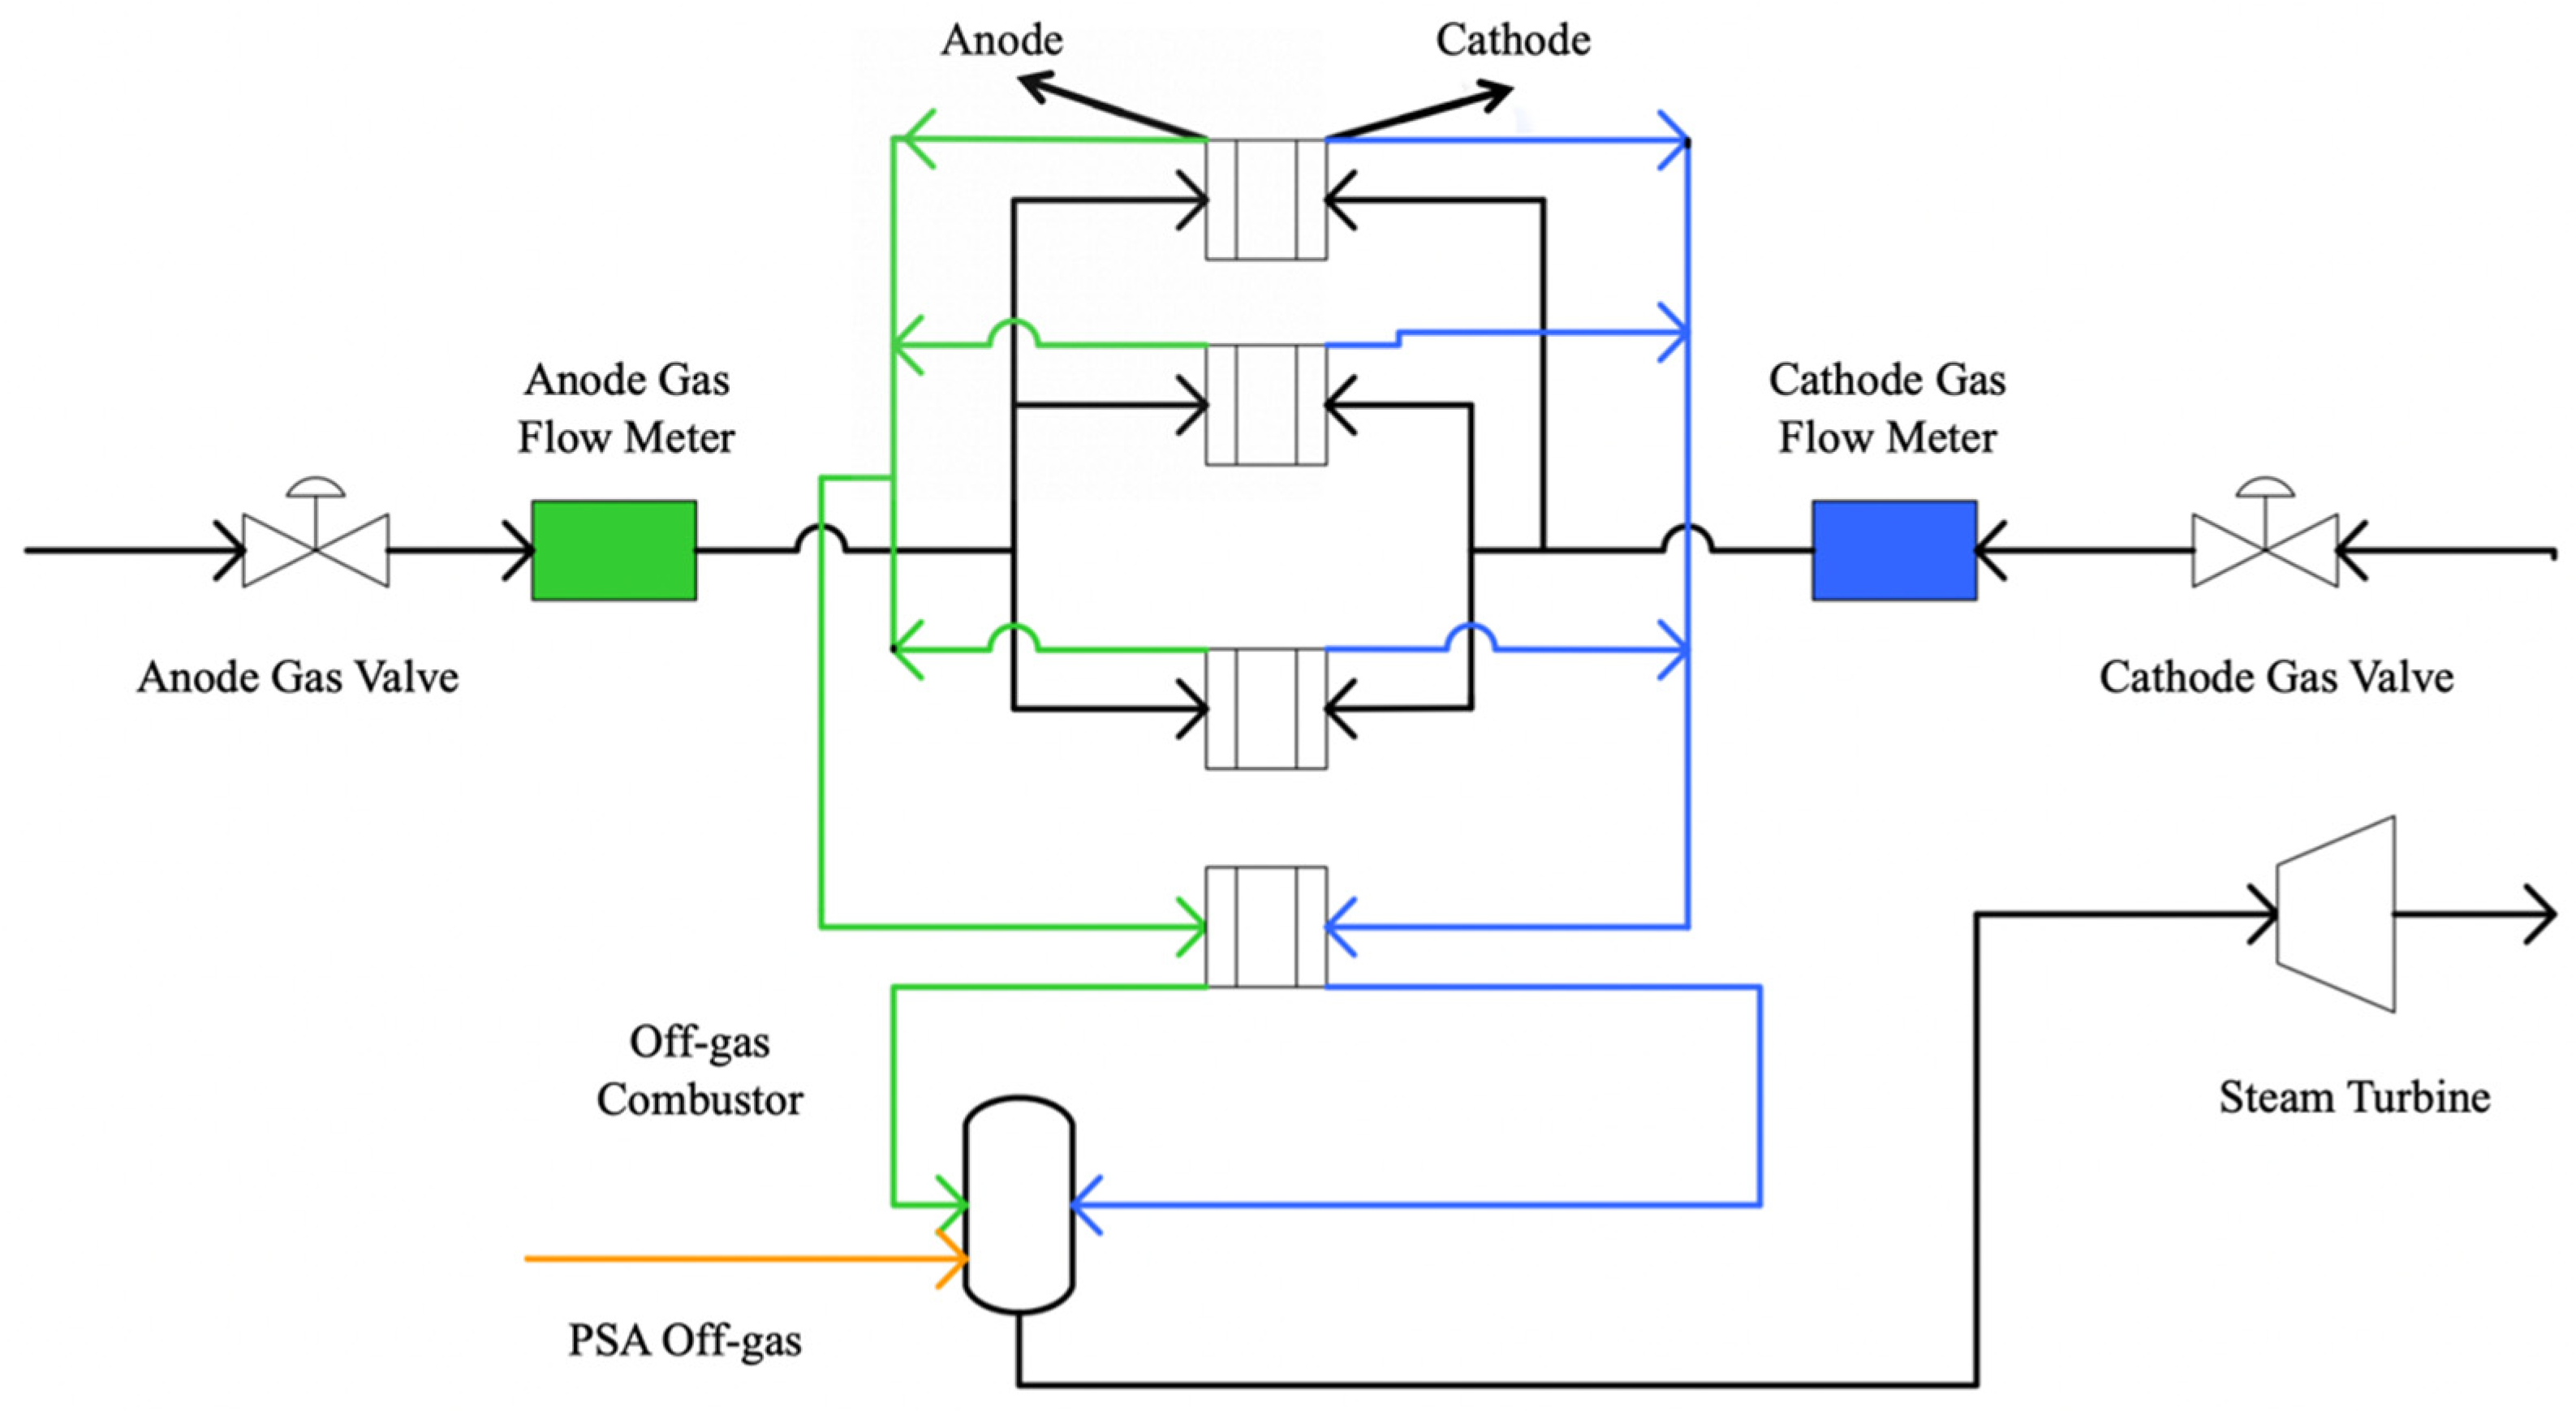
In contrast to the traditional configuration in Figure 7, this section designs a combined series and parallel configuration to optimize the SOFC system, as shown in Figure 8. Firstly, 3 SOFC units are connected in parallel, and an anode gas flow meter is used to control the inlet fuel, ensuring equal fuel input to the anode. The fuel then enters the fuel cell and undergoes an electrochemical reaction with oxygen at a certain fuel utilization rate. The spent anode fuel is passed into the remaining SOFC units after drying, where it reacts again with oxygen from the cathode. Finally, the spent anode fuel is mixed with the PSA tail gas and directed into the exhaust combustion unit to burn fully with oxygen. The resulting high-heat steam is passed into the steam turbine for mechanical work and electricity generation. The hybrid SOFC unit configuration fully utilizes the fuel utilization parameter, improving the overall energy efficiency of the power generation unit.
In the second configuration, the SOFC structural parameters from earlier studies are also referenced, with a rated current density of 180 mA/cm2 used as input. Unlike the first configuration, the second setup requires determining the fuel utilization rates for the series and parallel fuel cells. Based on the earlier research, the fuel utilization rate is within the range of 0.6 to 0.75, and the fuel cell electrical efficiency increases. Therefore, the parallel cell fuel utilization is set within this range, and the discussion is implemented in the sensitivity analysis module of the Aspen Plus software. The results show that when the fuel utilization rate in the parallel SOFC units is 0.65, and the fuel utilization rate in the series SOFC units is 0.75, the total output power of the entire SOFC system is 471.21 kW, with an overall net system-level electrical efficiency of 0.59. This represents the optimal electrical performance of the cell. According to Equations (1) and (2), the required molar flow rate of H2 in this case is 15.05 kmol/h. The simulation design controls the fuel utilization rate in each solid oxide fuel cell unit in the series and parallel configurations to achieve the optimal output power of the system.
The output results of the SOFC electrochemical model for the two configuration methods are presented in Table 4. It is important to note that the System Net Electrical Efficiency listed therein includes power generated from both the SOFC stacks and the exhaust heat recovery cycle. A key trade-off is observed: while the traditional parallel configuration (Method 1) yields a slightly higher total output power by 27.17 kW, the proposed series-parallel configuration (Method 2) demonstrates a substantially superior overall net system-level electrical efficiency, outperforming the traditional setup by a significant five percentage points.
This seemingly counterintuitive result, where the overall system efficiency surpasses the stack-level efficiency, is physically grounded in the system’s architecture, which includes waste heat recovery. The principle of utilizing high-temperature exhaust from a primary power unit to drive a secondary thermal cycle is analogous to modern combined-cycle power plants and has been successfully applied in advanced SOFC-hybrid system designs, as investigated in studies by Perna et al. [3] and Chen et al. [26]. Crucially, the stack-level efficiency (54%) represents only the direct electrochemical conversion, whereas the system-level efficiency (59%) accounts for both the stack’s power output and the additional electricity generated by the bottoming steam cycle. This recovery and conversion of waste heat is the direct physical cause of the enhanced overall system performance.
This efficiency improvement is not merely a numerical outcome but is physically rooted in a strategy of fuel staging. In the conventional parallel configuration, every SOFC unit is responsible for the entire fuel conversion process. This means that a significant portion of each anode operates under fuel-lean conditions, which inevitably leads to increased concentration polarization losses and thus a lower average cell voltage across the system.
In contrast, the proposed series-parallel configuration allows for a more strategic division of labor. The first-stage parallel units operate at a lower, more efficient fuel utilization of 0.65. In this regime, the fuel concentration at the anode remains high, minimizing concentration polarization losses and allowing these three units to operate in a more favorable, high-voltage region. The fuel-rich anode off-gas from this first stage is then fed to the second-stage series unit, which is responsible for the final, more demanding stage of fuel conversion. By ensuring that the majority of the stacks operate consistently in their high-efficiency spot, the average operating voltage of the entire system is significantly elevated. This increase in average system voltage directly translates to the superior net electrical efficiency, confirming that the observed gain is physically explainable. This enhancement in energy utilization suggests that the optimized configuration is a more sustainable and economically viable option for long-term operation.

4. Conclusions

This paper addressed the optimization of natural gas-fueled SOFC systems from a novel modeling perspective. The primary methodological novelty was the adoption of a rated current density framework. Traditional power-based models are well-suited for steady-state design but are less effective for simulating dynamic scenarios where the electrochemical load itself is the key variable. Current density is the direct measure of electrochemical reaction rates. By establishing it as the primary input, our framework provides a more fundamental and mechanistic tool for the field. This approach is not just an alternative, but a necessary one for tackling critical future challenges. For instance, simulating flexible load following to meet dynamic grid demands, a key research topic highlighted by Gandiglio et al. [35], fundamentally requires modeling the system’s response to fluctuating current. Similarly, predicting long-term degradation, a central challenge addressed by Lai and Adams [5], necessitates studying the cell’s behavior under consistent, controlled electrochemical stress. Our framework is precisely tailored for these advanced, model-based tasks; here, the primary controlled or investigated variable is current, not power.
The most significant outcomes of this study provide clear guidelines for performance enhancement at both the unit and system levels. At the single-unit level, our findings demonstrate that an optimized efficiency of 54% is achievable, surpassing typical theoretical maximum efficiencies of approximately 52% reported in the literature for similar tubular SOFC systems under comparable conditions, as analyzed in studies such as those by Campanari [17], Zhang et al. [15], and Doherty et al. [13]. More importantly, at the system level, we revealed that strategically configuring modules in a series-parallel arrangement significantly boosts the net electrical efficiency to 59%, a 5-percentage-point improvement over conventional parallel setups. This provides a clear guideline for the field that optimizing the internal module topology is a highly effective strategy for maximizing system performance.
Looking forward, translating these findings into practice presents several challenges, which in turn suggest clear avenues for future research.
First, to account for spatial effects not captured by the current 0D model, future work should incorporate multi-dimensional models to investigate potential local hotspots or fuel starvation issues.
Second, the operational complexity of the proposed series-parallel configuration warrants further study. Follow-up research is needed to design robust control strategies and conduct detailed techno-economic analyses to evaluate the trade-off between higher efficiency and increased system complexity.
Finally, integrating long-term degradation models into the framework is crucial to assess the lifetime performance and reliability of the optimized configurations, providing a more holistic view for practical applications.

Author Contributions

Conceptualization, W.H. and X.S.; methodology, W.H.; software, W.H. and Y.Q.; validation, W.H. and Y.Q.; formal analysis, W.H.; investigation, W.H.; data curation, Y.Q.; writing—original draft preparation, W.H. and Y.Q.; writing—reviewing and editing, W.H., X.S. and Y.Q.; visualization, W.H. and Y.Q.; supervision, X.S.; project administration, X.S.; funding acquisition, X.S. All authors have read and agreed to the published version of the manuscript.

Funding

This research was funded by the Fundamental Research Funds for the Central Universities, China University of Mining and Technology (Beijing), grant number 2023SKPYGL03; the Innovation Fund of the Engineering Research Center of Integration and Application of Digital Learning Technology, Ministry of Education, grant number 1221022; and the National Key R&D Program of China, grant number 2017YFB0601900.

Data Availability Statement

The original contributions presented in this study are included in the article. Further inquiries can be directed to the corresponding author.

Acknowledgments

We appreciate the School of Management, China University of Mining and Technology (Beijing), for its supportive academic environment and the necessary research facilities.

Conflicts of Interest

The authors declare no conflicts of interest.

References

  1. Laky, D.J.; Cortes, N.P.; Eslick, J.C.; Noring, A.A.; Susarla, N.; Okoli, C.; Zamarripa, M.A.; Allan, D.A.; Brewer, J.H.; Iyengar, A.K.S.; et al. Market Optimization and Technoeconomic Analysis of Hydrogen-Electricity Coproduction Systems. Energy Environ. Sci. 2024, 17, 9509–9525. [Google Scholar] [CrossRef]
  2. Chitgar, N.; Hemmati, A.; Sadrzadeh, M. A Comparative Performance Analysis, Working Fluid Selection, and Machine Learning Optimization of ORC Systems Driven by Geothermal Energy. Energy Convers. Manag. 2023, 286, 117072. [Google Scholar] [CrossRef]
  3. Perna, A.; Minutillo, M.; Jannelli, E.; Cigolotti, V.; Nam, S.W.; Yoon, K.J. Performance Assessment of a Hybrid SOFC/MGT Cogeneration Power Plant Fed by Syngas from a Biomass down-Draft Gasifier. Appl. Energy 2018, 227, 80–91. [Google Scholar] [CrossRef]
  4. Chitgar, N.; Emadi, M.A. Development and Exergoeconomic Evaluation of a SOFC-GT Driven Multi-Generation System to Supply Residential Demands: Electricity, Fresh Water and Hydrogen. Int. J. Hydrogen Energy 2021, 46, 17932–17954. [Google Scholar] [CrossRef]
  5. Lai, H.; Adams, T.A. Eco-Technoeconomic Analyses of Natural Gas-Powered SOFC/GT Hybrid Plants Accounting for Long-Term Degradation Effects via Pseudo-Steady-State Model Simulations. J. Electrochem. Energy Convers. Storage 2024, 21, 021004. [Google Scholar] [CrossRef]
  6. Yang, B.; Hao, X.; Shen, X.; Shi, W.; Xie, Y.; Li, L. Design and Performance Analysis of a Coupled Burner for the Solid Oxide Fuel Cell System. Energy Convers. Manag. 2024, 322, 119181. [Google Scholar] [CrossRef]
  7. Ali, S.; Sørensen, K.; Nielsen, M.P. Modeling a Novel Combined Solid Oxide Electrolysis Cell (SOEC)-Biomass Gasification Renewable Methanol Production System. Renew. Energy 2020, 154, 1025–1034. [Google Scholar] [CrossRef]
  8. Saebea, D.; Arpornwichanop, A.; Patcharavorachot, Y. Thermodynamic Analysis of a Proton Conducting SOFC Integrated System Fuelled by Different Renewable Fuels. Int. J. Hydrogen Energy 2021, 46, 11445–11457. [Google Scholar] [CrossRef]
  9. Kumuk, B.; Atak, N.N.; Dogan, B.; Ozer, S.; Demircioglu, P.; Bogrekci, I. Numerical and Thermodynamic Analysis of the Effect of Operating Temperature in Methane-Fueled SOFC. Energies 2024, 17, 2603. [Google Scholar] [CrossRef]
  10. Zhu, P.; Yao, J.; Qian, C.; Yang, F.; Porpatham, E.; Zhang, Z.; Wu, Z. High-Efficiency Conversion of Natural Gas Fuel to Power by an Integrated System of SOFC, HCCI Engine, and Waste Heat Recovery: Thermodynamic and Thermo-Economic Analyses. Fuel 2020, 275, 117883. [Google Scholar] [CrossRef]
  11. Iliev, I.K.; Filimonova, A.A.; Chichirov, A.A.; Chichirova, N.D.; Kangalov, P.G. Computational and Experimental Research on the Influence of Supplied Gas Fuel Mixture on High-Temperature Fuel Cell Performance Characteristics. Energies 2024, 17, 2452. [Google Scholar] [CrossRef]
  12. Marcantonio, V.; Monarca, D.; Villarini, M.; Di Carlo, A.; Del Zotto, L.; Bocci, E. Biomass Steam Gasification, High-Temperature Gas Cleaning, and SOFC Model: A Parametric Analysis. Energies 2020, 13, 5936. [Google Scholar] [CrossRef]
  13. Doherty, W.; Reynolds, A.; Kennedy, D. Computer Simulation of a Biomass Gasification-Solid Oxide Fuel Cell Power System Using Aspen Plus. Energy 2010, 35, 4545–4555. [Google Scholar] [CrossRef]
  14. Han, W.; Jin, H.; Lin, R. A Novel Power Generation System Based on Moderate Conversion of Chemical Energy of Coal and Natural Gas. Fuel 2011, 90, 263–271. [Google Scholar] [CrossRef]
  15. Zhang, W.; Croiset, E.; Douglas, P.L.; Fowler, M.W.; Entchev, E. Simulation of a Tubular Solid Oxide Fuel Cell Stack Using AspenPlusTM Unit Operation Models. Energy Convers. Manag. 2005, 46, 181–196. [Google Scholar] [CrossRef]
  16. Batista, C.-T.N.; Mohammed, K.A.; Amiri, A.; Azimi, N.; Steinberger-Wilckens, R. Comparison of Equilibrium-Based and Kinetics-Based Models for Evaluating the Impact of Hydrogen Carrier Reforming on SOFC System. Energy Convers. Manag. 2025, 332, 119733. [Google Scholar] [CrossRef]
  17. Campanari, S. Thermodynamic Model and Parametric Analysis of a Tubular SOFC Module. J. Power Sources 2001, 92, 26–34. [Google Scholar] [CrossRef]
  18. Koo, T.; Kim, Y.S.; Lee, D.; Yu, S.; Lee, Y.D. System Simulation and Exergetic Analysis of Solid Oxide Fuel Cell Power Generation System with Cascade Configuration. Energy 2021, 214, 119087. [Google Scholar] [CrossRef]
  19. Zhuang, Q.; Geddis, P.; Runstedtler, A.; Clements, B. An Integrated Natural Gas Power Cycle Using Hydrogen and Carbon Fuel Cells. Fuel 2017, 209, 76–84. [Google Scholar] [CrossRef]
  20. Yang, L.; Fan, S.; Liu, P.; Han, X.; Liu, Y.; Jin, Z. Effect of Gas Flow Configurations on the Performance of MOLB-Type SOFC. Int. J. Electrochem. Sci. 2022, 17, 220538. [Google Scholar] [CrossRef]
  21. Niu, B.; Han, X.; Ding, J.; Yan, B.; Chen, G.; Yao, J. Energy, Efficiency, Economy, Environmental Assessment of Hydrogen Production via Solar-Driven Steam Gasification of Fresh Cow Manure Using Aspen plus Simulation Model. Int. J. Hydrogen Energy 2025, 98, 308–320. [Google Scholar] [CrossRef]
  22. Zhao, Y.; Yao, J.; Chen, G.; Liu, J.; Cheng, Z.; Wang, L.; Yi, W.; Xu, S. Energy, Efficiency, and Environmental Analysis of Hydrogen Generation via Plasma Co-Gasification of Biomass and Plastics Based on Parameter Simulation Using Aspen Plus. Energy Convers. Manag. 2023, 295, 117623. [Google Scholar] [CrossRef]
  23. Barelli, L.; Bidini, G.; Gallorini, F.; Ottaviano, A. An Energetic–Exergetic Comparison between PEMFC and SOFC-Based Micro-CHP Systems. Int. J. Hydrogen Energy 2011, 36, 3206–3214. [Google Scholar] [CrossRef]
  24. Yan, L.; He, B.; Pei, X.; Song, W.; Chen, Q.; Song, J. Simulation Research of Solid Oxide Fuel Cell Integrated in Zero-Emission Coal Systems. Zhongguo Dianji Gongcheng Xuebao/Proc. Chin. Soc. Electr. Eng. 2012, 32, 94–103. [Google Scholar]
  25. Su, X.; Zhang, F.; Yin, Y.; Tu, B.; Cheng, M. Thermodynamic Analysis and Fuel Processing Strategies for Propane-Fueled Solid Oxide Fuel Cell. Energy Convers. Manag. 2020, 204, 112279. [Google Scholar] [CrossRef]
  26. Chen, H.; Yang, C.; Zhou, N.; Farida Harun, N.; Oryshchyn, D.; Tucker, D. High Efficiencies with Low Fuel Utilization and Thermally Integrated Fuel Reforming in a Hybrid Solid Oxide Fuel Cell Gas Turbine System. Appl. Energy 2020, 272, 115160. [Google Scholar] [CrossRef]
  27. Li, M.; Brouwer, J.; Rao, A.D.; Samuelsen, G.S. Application of a Detailed Dimensional Solid Oxide Fuel Cell Model in Integrated Gasification Fuel Cell System Design and Analysis. J. Power Sources 2011, 196, 5903–5912. [Google Scholar] [CrossRef]
  28. Mahisanana, C.; Authayanun, S.; Patcharavorachot, Y.; Arpornwichanop, A. Design of SOFC Based Oxyfuel Combustion Systems with Anode Recycling and Steam Recycling Options. Energy Convers. Manag. 2017, 151, 723–736. [Google Scholar] [CrossRef]
  29. Soleimanpour, M.; Ebrahimi, M. Energy and Exergy Analysis of Dry and Steam External Reformers for a Power Cycle Based on Biogas-Fueled Solid Oxide Fuel Cell. Energy 2024, 305, 132382. [Google Scholar] [CrossRef]
  30. Li, K.; Zou, Q.; Zhang, J.; Jiang, C.; Liang, Z. Mixed Reforming of Methane with CO2 and H2O: Thermodynamic Analysis and ReaxFF Molecular Dynamics Simulation. J. Energy Inst. 2025, 121, 102188. [Google Scholar] [CrossRef]
  31. Yang, S.; Wang, G.; Liu, Z.; Deng, C.; Xie, N. Energy, Exergy and Exergo-Economic Analysis of a Novel SOFC Based CHP System Integrated with Organic Rankine Cycle and Biomass Co-Gasification. Int. J. Hydrogen Energy 2024, 53, 1155–1169. [Google Scholar] [CrossRef]
  32. Yonekura, T.; Tachikawa, Y.; Yoshizumi, T.; Shiratori, Y.; Ito, K.; Sasaki, K. Exchange Current Density of Solid Oxide Fuel Cell Electrodes. ECS Trans. 2011, 35, 1007–1014. [Google Scholar] [CrossRef]
  33. Cordova, J.L.; Heshmat, H. Development of a Ceramic Heat Exchanger for Application as Solid Oxide Fuel Cell Cathode Air Preheater. In Proceedings of the ASME Power Conference, Charlotte, NC, USA, 26–30 June 2016; Amer Soc Mechanical Engineers: New York, NY, USA, 2016; p. UNSP V001T04A006. [Google Scholar]
  34. Chen, D.; Zeng, Q.; Su, S.; Bi, W.; Ren, Z. Geometric Optimization of a 10-Cell Modular Planar Solid Oxide Fuel Cell Stack Manifold. Appl. Energy 2013, 112, 1100–1107. [Google Scholar] [CrossRef]
  35. Gandiglio, M.; Marocco, P.; Nieminen, A.; Santarelli, M.; Kiviaho, J. Energy and Environmental Performance from Field Operation of Commercial-Scale SOFC Systems. Int. J. Hydrogen Energy 2024, 85, 997–1009. [Google Scholar] [CrossRef]
Figure 1. Schematic of the single-unit natural gas-fueled tubular SOFC (T-SOFC) system modeled in Aspen Plus.
Energies 18 04456 g001
Figure 2. Simulation of the influence of fuel utilization key performance metrics at a constant rated current density.
Energies 18 04456 g002
Figure 3. Simulation of the effect of fuel utilization on the mole fraction of main gas in the anode outlet stream at a constant rated current density.
Energies 18 04456 g003
Figure 4. Influence of water-carbon ratio on entering pre-reforming and anode temperature and methane pre-reforming rate.
Energies 18 04456 g004
Figure 5. Influence of different current densities on the output voltage, output power, electrical efficiency of the battery, the amount of fuel inlet, and the amount of oxygen inlet to the anode.
Energies 18 04456 g005
Figure 6. Performance map of a single SOFC unit as a function of current density and fuel utilization.
Energies 18 04456 g006
Figure 7. Schematic of the conventional multi-unit SOFC configuration with a pure parallel arrangement (Mode 1).
Energies 18 04456 g007
Figure 8. Schematic of the proposed multi-unit SOFC configuration with a series-parallel hybrid arrangement (Mode 2).
Energies 18 04456 g008
Table 1. Key input parameters and operational assumptions for the baseline single-unit SOFC simulation model.
Assumed Input ParametersInput Parameter Value
Inlet fuel components81.3%CH4, 2.9%C2H6, 0.4%C3H8, 0.2%C4H10, 14.3%N2, 0.9%CO
Cell operation temperature910 °C
Cell operation pressure1.08 atm
Input current density180 mA/cm2
Activating reaction area96.1 m2 (1152 sets of mono-cells)
Cell outlet temperature910 °C
Inlet air temperature630 °C
Inlet fuel temperature200 °C
Afterburner reaction rate100%
Air use ratio19%
DC-AC conversion efficiency92%
Overall fuel utilization85%
Water-carbon ratio2.5
Commingler fresh fuel-pressure ratio3
SOFC internal pressure drop0
SOFC heat loss2%
Table 2. Detailed stream data from the baseline single-unit SOFC simulation.
StreamTemperature
(℃)
Pressure
(atm)
Mol FlowMole Fraction (%)
(kmol/h)H2CH4H2OCOCO2O2N2
1200.003.281.07-81.30-0.90--14.30
2745.291.095.829.4215.0141.556.1520.39-6.83
3536.251.095.829.4215.0141.556.1520.39-6.83
4537.271.096.4527.199.9427.875.6823.17-6.16
5910.001.097.7311.55-50.967.3425.01-5.14
6910.001.094.7411.55-50.967.3425.01-5.14
7910.001.092.9911.55-50.967.3425.01-5.14
8910.001.0941.19--4.50-2.3315.8877.29
9630.001.0940.10-----21.0079.00
10822.371.0940.10-----21.0079.00
11822.371.091.61-----1.0000-
12822.371.0938.78-----17.7282.28
13910.001.0938.78-----17.7282.28
141011.251.0941.49--4.50-2.3315.8877.29
15833.851.0941.49--4.50-2.3315.8877.29
Table 3. Comparison of model simulation results with literature data for validation.
IndicatorsLab DataReference [24]
Simulation Results
Simulation ResultsSimulation Errors
Cell power--119.059 kW-
Cell voltage-0.685 V0.689 V5.8%
Current density180 mA/cm2179.5 mA/cm2--
Anode gas output component48%H2O/28%CO2/
14%H2/5%CO/5.0%N2
50.8%H2O/25%CO2/
11.7%H2/7.3%CO/5.0%N2
51.0%H2O/25.0%CO2/
11.5%H2/7.3%CO/5.1%N2
-
Fuel cell electric efficiency50%50%49.8%0.4%
Table 4. Performance comparison of the two multi-unit SOFC configurations.
System OutputMethod 1 Output ValueMethod 2 Output Value
SOFC Anode Inlet Total Fuel Flow Rate (kmol/h)18.6415.05
SOFC Cathode Inlet Total Oxygen Flow Rate (kmol/h)6.405.80
SOFC Maximum Power Output (kW) (DC)498.38471.21
SOFC Maximum Power Output (kW) (AC)458.51433.51
SOFC Single Cell Voltage (V)0.700.64/0.73
System Net Electrical Efficiency (%)5459
Disclaimer/Publisher’s Note: The statements, opinions and data contained in all publications are solely those of the individual author(s) and contributor(s) and not of MDPI and/or the editor(s). MDPI and/or the editor(s) disclaim responsibility for any injury to people or property resulting from any ideas, methods, instructions or products referred to in the content.