1. Introduction
The rapid growth of clean energy technologies such as new energy vehicles (NEVs) [
1,
2,
3], wind power [
4,
5], and solar energy [
6] has brought increasing demand for high-performance power electronic systems. In NEVs, wind turbines, and photovoltaic inverters, the insulated gate bipolar transistor (IGBT) is a core component for energy conversion and control due to its high power density and switching efficiency [
7,
8,
9]. However, during operation, IGBT modules generate substantial heat through switching and conduction losses, leading to rapid rises in junction temperature. This thermal stress not only increases system power consumption and reduces device reliability but can also trigger thermal runaway, causing permanent failure and posing safety risks [
9,
10,
11,
12]. Therefore, effective thermal management is essential to ensure the operational stability, efficiency, and lifespan of IGBT modules in high-power clean energy applications [
13,
14].
Various cooling strategies have been proposed for IGBT modules, including air cooling, liquid cooling, heat pipes, microchannel cooling, and phase-change cooling [
15,
16,
17]. Among these, microchannel liquid cooling has emerged as a promising solution due to its high heat transfer efficiency, low noise, and compact structure [
12,
18,
19]. Introducing flow disturbances within microchannels can enhance heat transfer by increasing the surface area and promoting turbulence in the coolant flow. Jin et al. proposed an inclined-fin microchannel cooling plate as an improvement for traditional straight-fin structures. By optimizing the fin angle and width, improved heat transfer performance was accompanied by reduced pressure drop [
20]. Li et al. [
21] compared the field synergy and heat transfer characteristics of three vortex cavity microchannel designs using three-dimensional conjugate heat transfer simulations. The results revealed that synergy angles aligned well with Nusselt number trends. Under laminar flow, a sparse-front and dense-rear cavity configuration yielded optimal thermal performance without increasing pressure drop. Darbari et al. [
22] compared pin-fin and parallel-channel microchannel designs under identical conditions and found that the pin-fin configuration significantly reduced peak temperatures and thermal non-uniformity.
In addition to introducing turbulence enhancers, recent research has also focused on modifying the overall geometry of microchannel cooling plates to improve thermal performance. Through integrated numerical and experimental investigations, Naga Ramesh et al. [
23] demonstrates the paramount influence of microchannel geometry on both flow characteristics and heat transfer performance. Optimization of the channel structure was emphasized as the critical factor for reducing pressure drop and enhancing thermal efficiency. Ning et al. [
24] conducted numerical simulations to study the heat transfer characteristics of liquid-cooled plates and identified coolant flow rate and fluid properties as decisive factors. To improve thermal performance, Kuppusamy [
25] proposed a novel structure with secondary flow channels. This design guided coolant into secondary paths, leveraging induced turbulence and periodic boundary layer renewal to enhance heat transfer while minimizing flow resistance. Shi et al. [
26] investigated the effect of coolant flow direction in rectangular microchannels arranged transversely on copper IGBT substrates. The results demonstrated counter-flow arrangements outperformed parallel flow in terms of heat transfer, pressure drop, and temperature uniformity. Jing et al. [
27] conducted numerical studies on microchannels with various cross-sectional shapes, finding that both flow resistance and convective heat transfer coefficients decreased with increasing hydraulic diameter. DD et al. [
28] performed experimental studies on periodic jet and throttling microchannels and revealed that, despite higher pressure drops, throttling designs improved heat transfer. Abdoli et al. [
29] investigated a 90° rotated stacked dual-layer microchannel system and demonstrated excellent cooling performance for high heat flux devices. Wang et al. [
30] applied topology optimization in designing liquid-cooled plates for IGBT modules, yielding reduced thermal resistance and improved average heat transfer coefficients by minimizing flow resistance while maximizing thermal performance.
Notwithstanding considerable advances in microchannel liquid cooling research, the investigation of honeycomb-structured microchannel for thermal management of IGBT modules remains limited. The effects of honeycomb-structured geometric parameters and operating conditions on junction temperature, thermal uniformity, and pressure drop are not yet well understood. This study employs numerical simulations to investigate the thermal performance of honeycomb-structured microchannel cooling plates designed for IGBT modules. Critical geometrical and operational parameters, including cell size, arrangement, number of inlets/outlets, inlet mass flow rate, and coolant temperature, are systematically analyzed. Based on the evaluation of maximum temperature, temperature uniformity, and pressure drop, optimal configurations are proposed. The findings provide valuable insights for the structural design and performance optimization of microchannel cooling plates in high-power electronic applications.
2. Numerical Method
2.1. Physical Model
The geometric model consists of the IGBT, copper baseplate, and liquid cooling plate, as shown in
Figure 1a. In this work, the IGBT modules transfer heat to the copper baseplate, which subsequently conducts it to the liquid cooling plate, where the coolant removes the heat via convection. Three IGBT modules are arranged in parallel, each with identical heat generation. The thicknesses of IGBT, copper substrate and cooling plate are 3 mm, 1 mm and 11 mm, respectively.
Figure 1b shows the dimensional parameters of the honeycomb-structured microchannels. Due to the structural complexity of the honeycomb-structured microchannel cooling plate, castability is an important factor in the die-casting process. Therefore, aluminum alloy ADC12 is selected as the material for the cooling plate. The thermophysical properties of the coolant, cooling plate, and other relevant materials are listed in
Table 1 [
31]. In
Figure 1b, a denotes the channel width, and a
m denotes the honeycomb-structured cell size, which correspond to the parameters listed in
Table 2.
To facilitate the subsequent numerical simulation and analysis, the following assumptions are made [
31,
32,
33]:
- (1)
The coolant is considered incompressible, and its thermophysical properties are isotropic.
- (2)
Natural convection heat transfer is considered on the external surfaces of the cooling plate, except for the contact areas with the IGBT modules. The convective heat transfer coefficient is set to 5 W/(m2·K).
- (3)
A no-slip boundary condition is applied at the interface between the coolant and the wall.
- (4)
The heat generation within each IGBT module is assumed to be uniformly distributed.
Table 1.
Thermophysical properties of components and coolant [
31].
Table 1.
Thermophysical properties of components and coolant [
31].
| Material | Density (kg/m3) | Specific Heat (J/kg·K) | Thermal Conductivity (W/m·K) | Viscosity (Pa·s) |
|---|
| Silicon (IGBT) | 2330 | 700 | 148 | - |
| Copper (Substrate) | 8978 | 381 | 387.6 | - |
| Cooling plate | 2700 | 880 | 96.2 | - |
| Coolant | 1048.83 | 3455 | 0.406 | 0.00129 |
Table 2.
Parameter combinations of different honeycomb-structured sizes and channel widths.
Table 2.
Parameter combinations of different honeycomb-structured sizes and channel widths.
| Structure | Channel Width (mm) | Honeycomb-Structured Size (mm) |
|---|
| Case 1 | 7 | 3 |
| Case 2 | 5 | 5 |
| Case 3 | 5 | 7 |
| Case 4 | 3 | 6 |
2.2. Governing Equations
The thermal-fluid behavior in the honeycomb-structured microchannel cooling plate is governed by the fundamental conservation laws of mass, momentum, and energy. These equations are solved under steady-state conditions and assume incompressible, single-phase flow with constant thermophysical properties.
Momentum equation:
where
is the velocity vector,
is the fluid density,
is pressure,
is the dynamic viscosity, and
represents the Reynolds stress tensor introduced by turbulence.
Energy equations:
For the coolant:
where
is the specific heat capacity,
T is the temperature, and
,
are the thermal conductivities of the coolant and solid domain, respectively.
To determine the appropriate flow regime and turbulence model, the Reynolds number is computed as:
where
,
, and
are the density, velocity, and dynamic viscosity of the coolant, respectively;
is the cross-sectional flow area, and
X is the wetted perimeter of the microchannel. The hydraulic diameter
characterizes the flow geometry.
In this study, the calculated Reynolds number is approximately 4521, which exceeds the laminar-to-turbulent transition threshold (typically around 2300), indicating a fully turbulent flow regime within the microchannels.
As a result, the standard k-ε turbulence model is adopted to resolve the turbulent characteristics. This model is widely used in engineering applications due to its robustness, computational efficiency, and reasonable accuracy in predicting recirculating flows, boundary layer behavior, and heat transfer. The turbulence closure equations are integrated into the solver using default model constants and enhanced wall treatment near solid boundaries to accurately capture the near-wall heat transfer.
2.3. Boundary Conditions and Evaluation Criteria
In the present simulation, boundary conditions are specified to closely reflect the actual operating environment of high-power IGBT modules. Each IGBT module dissipates a thermal power of 666.7 W, which is applied to the interface between the module and the copper substrate in the form of a uniform surface heat flux. This simplification is widely adopted in thermal modeling of power electronics due to its computational efficiency and ability to approximate localized heating effects. The surface heat flux is calculated using the relation:
where
Q is the heat generation rate of the IGBT module and
A is the contact area between the module and the baseplate.
The coolant enters the cooling plate through a mass flow inlet at 2.5 L/min, with an inlet temperature fixed at 40 °C (313.15 K). The outlet is defined as a pressure outlet with gauge pressure of 0 Pa. Natural convection (5 W/m2·K) is applied to the outer walls of the cooling plate, excluding the IGBT contact surfaces.
All internal solid–fluid interfaces adopt no-slip boundary conditions, ensuring that the coolant velocity is zero at the walls. The thermal interfaces between the IGBT modules, copper baseplate, and cooling plate are assumed to be perfectly bonded, allowing continuous heat transfer without thermal contact resistance.
To comprehensively evaluate the thermal and hydraulic performance of the cooling system, three performance metrics are introduced. The first is the maximum temperature (
Tmax) of the cooling plate surface, which serves as a proxy for the peak junction temperature within the IGBT modules. Since excessive junction temperatures significantly reduce device reliability and operating life,
Tmax is a critical safety and performance indicator. The second metric is the temperature difference (Δ
T) between the three IGBT modules. A lower Δ
T indicates more uniform temperature distribution and reduced thermal stress, which is beneficial for system stability, synchronized module performance, and prolonged component life. The third metric is the pressure drop (Δ
P) between the inlet and outlet of the cooling plate, calculated as:
These criteria are employed in subsequent analysis of geometric and operational optimization.
2.4. Mesh Generation and Grid Independence Verification
Numerical simulations were performed using ANSYS Fluent 2024. The governing equations for energy and momentum were discretized using second-order upwind schemes, while pressure–velocity coupling was handled via the SIMPLE algorithm.
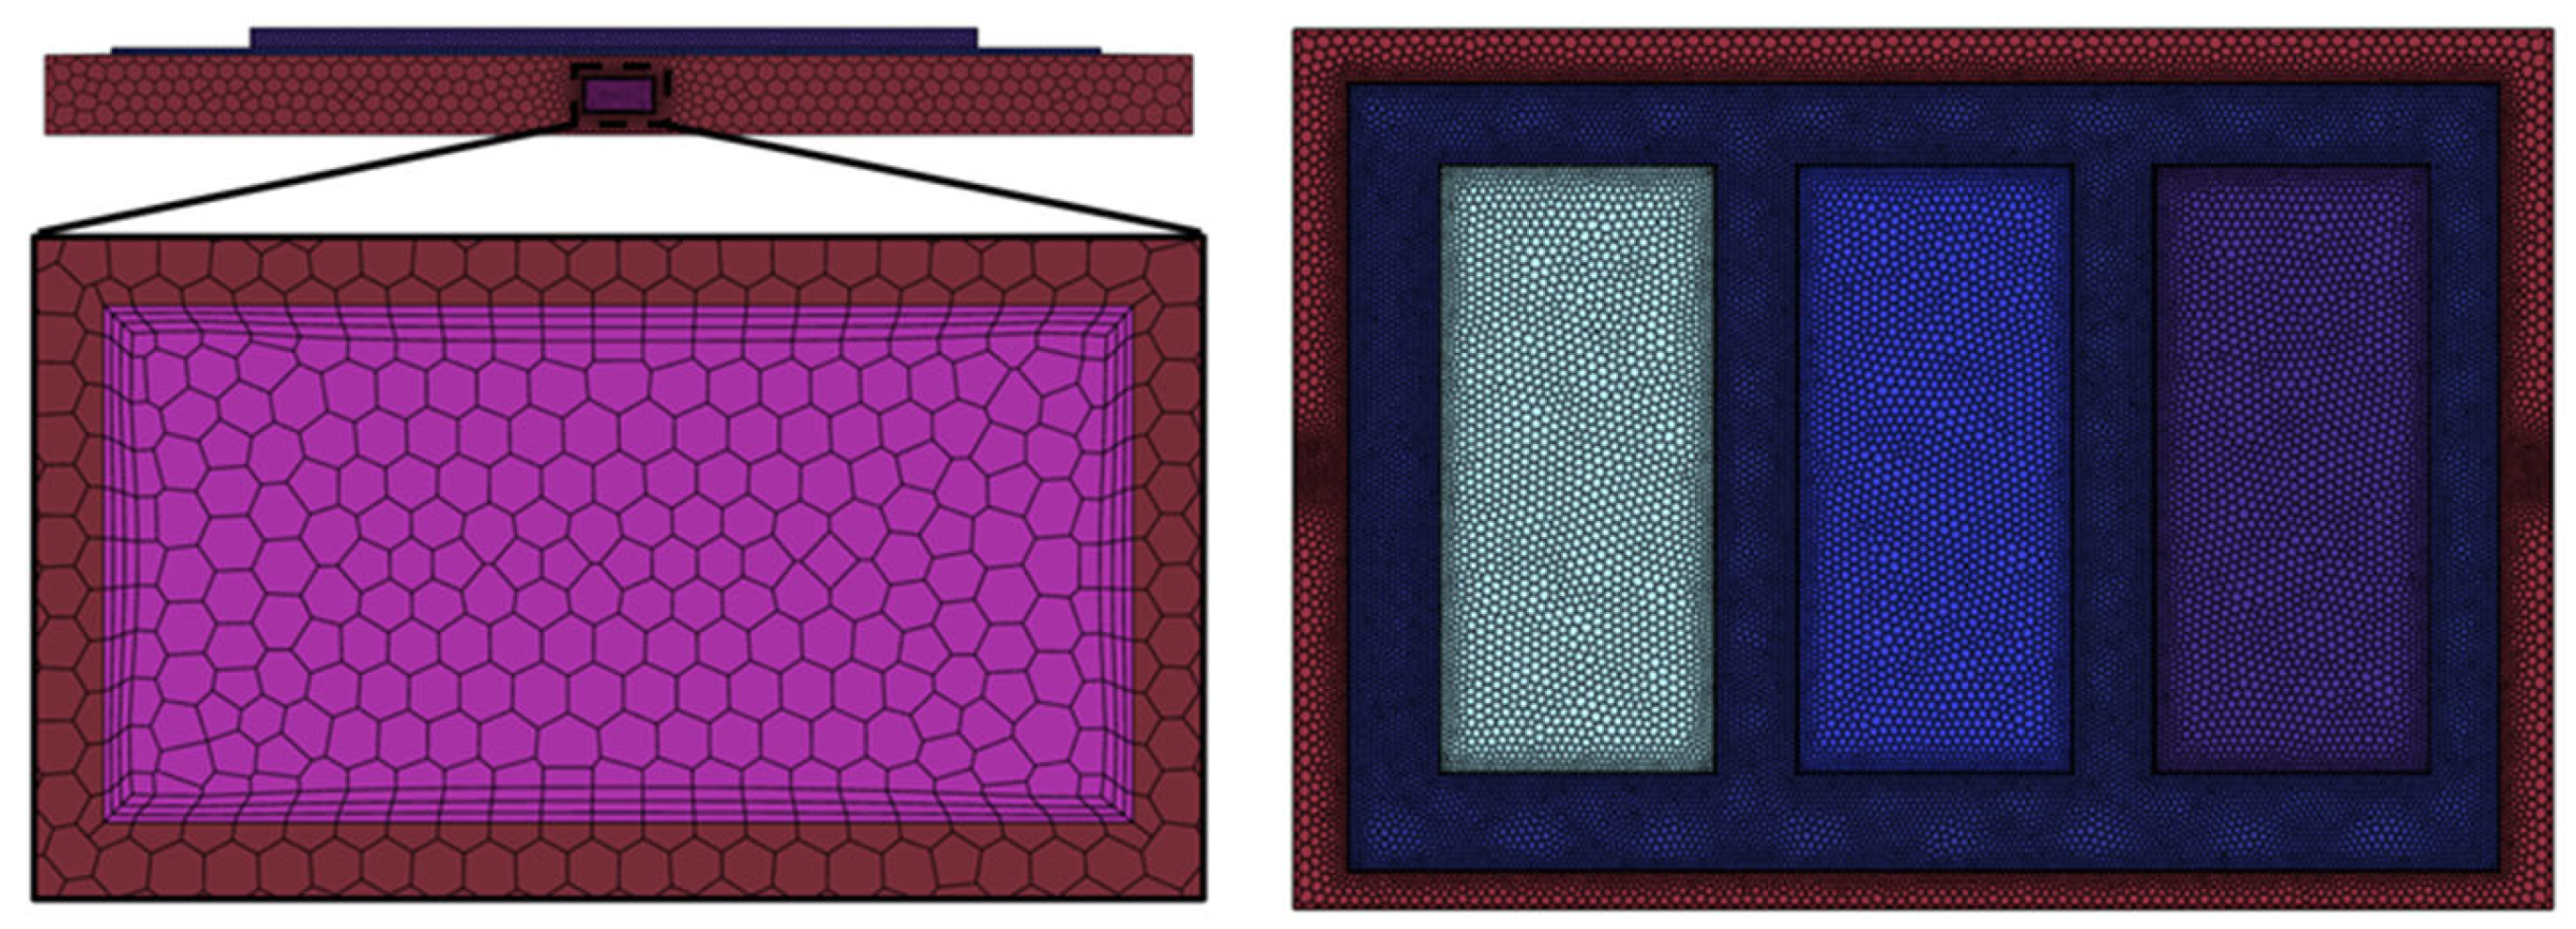
To ensure the accuracy and reliability of the simulation results, an appropriate meshing strategy and a comprehensive grid independence study were conducted. The computational domain was discretized using unstructured meshes generated in ANSYS Meshing. To accurately capture the heat–fluid interaction at the solid–fluid interface, three layers of boundary layer grids were applied along the interface region. The mesh topology is illustrated in
Figure 2.
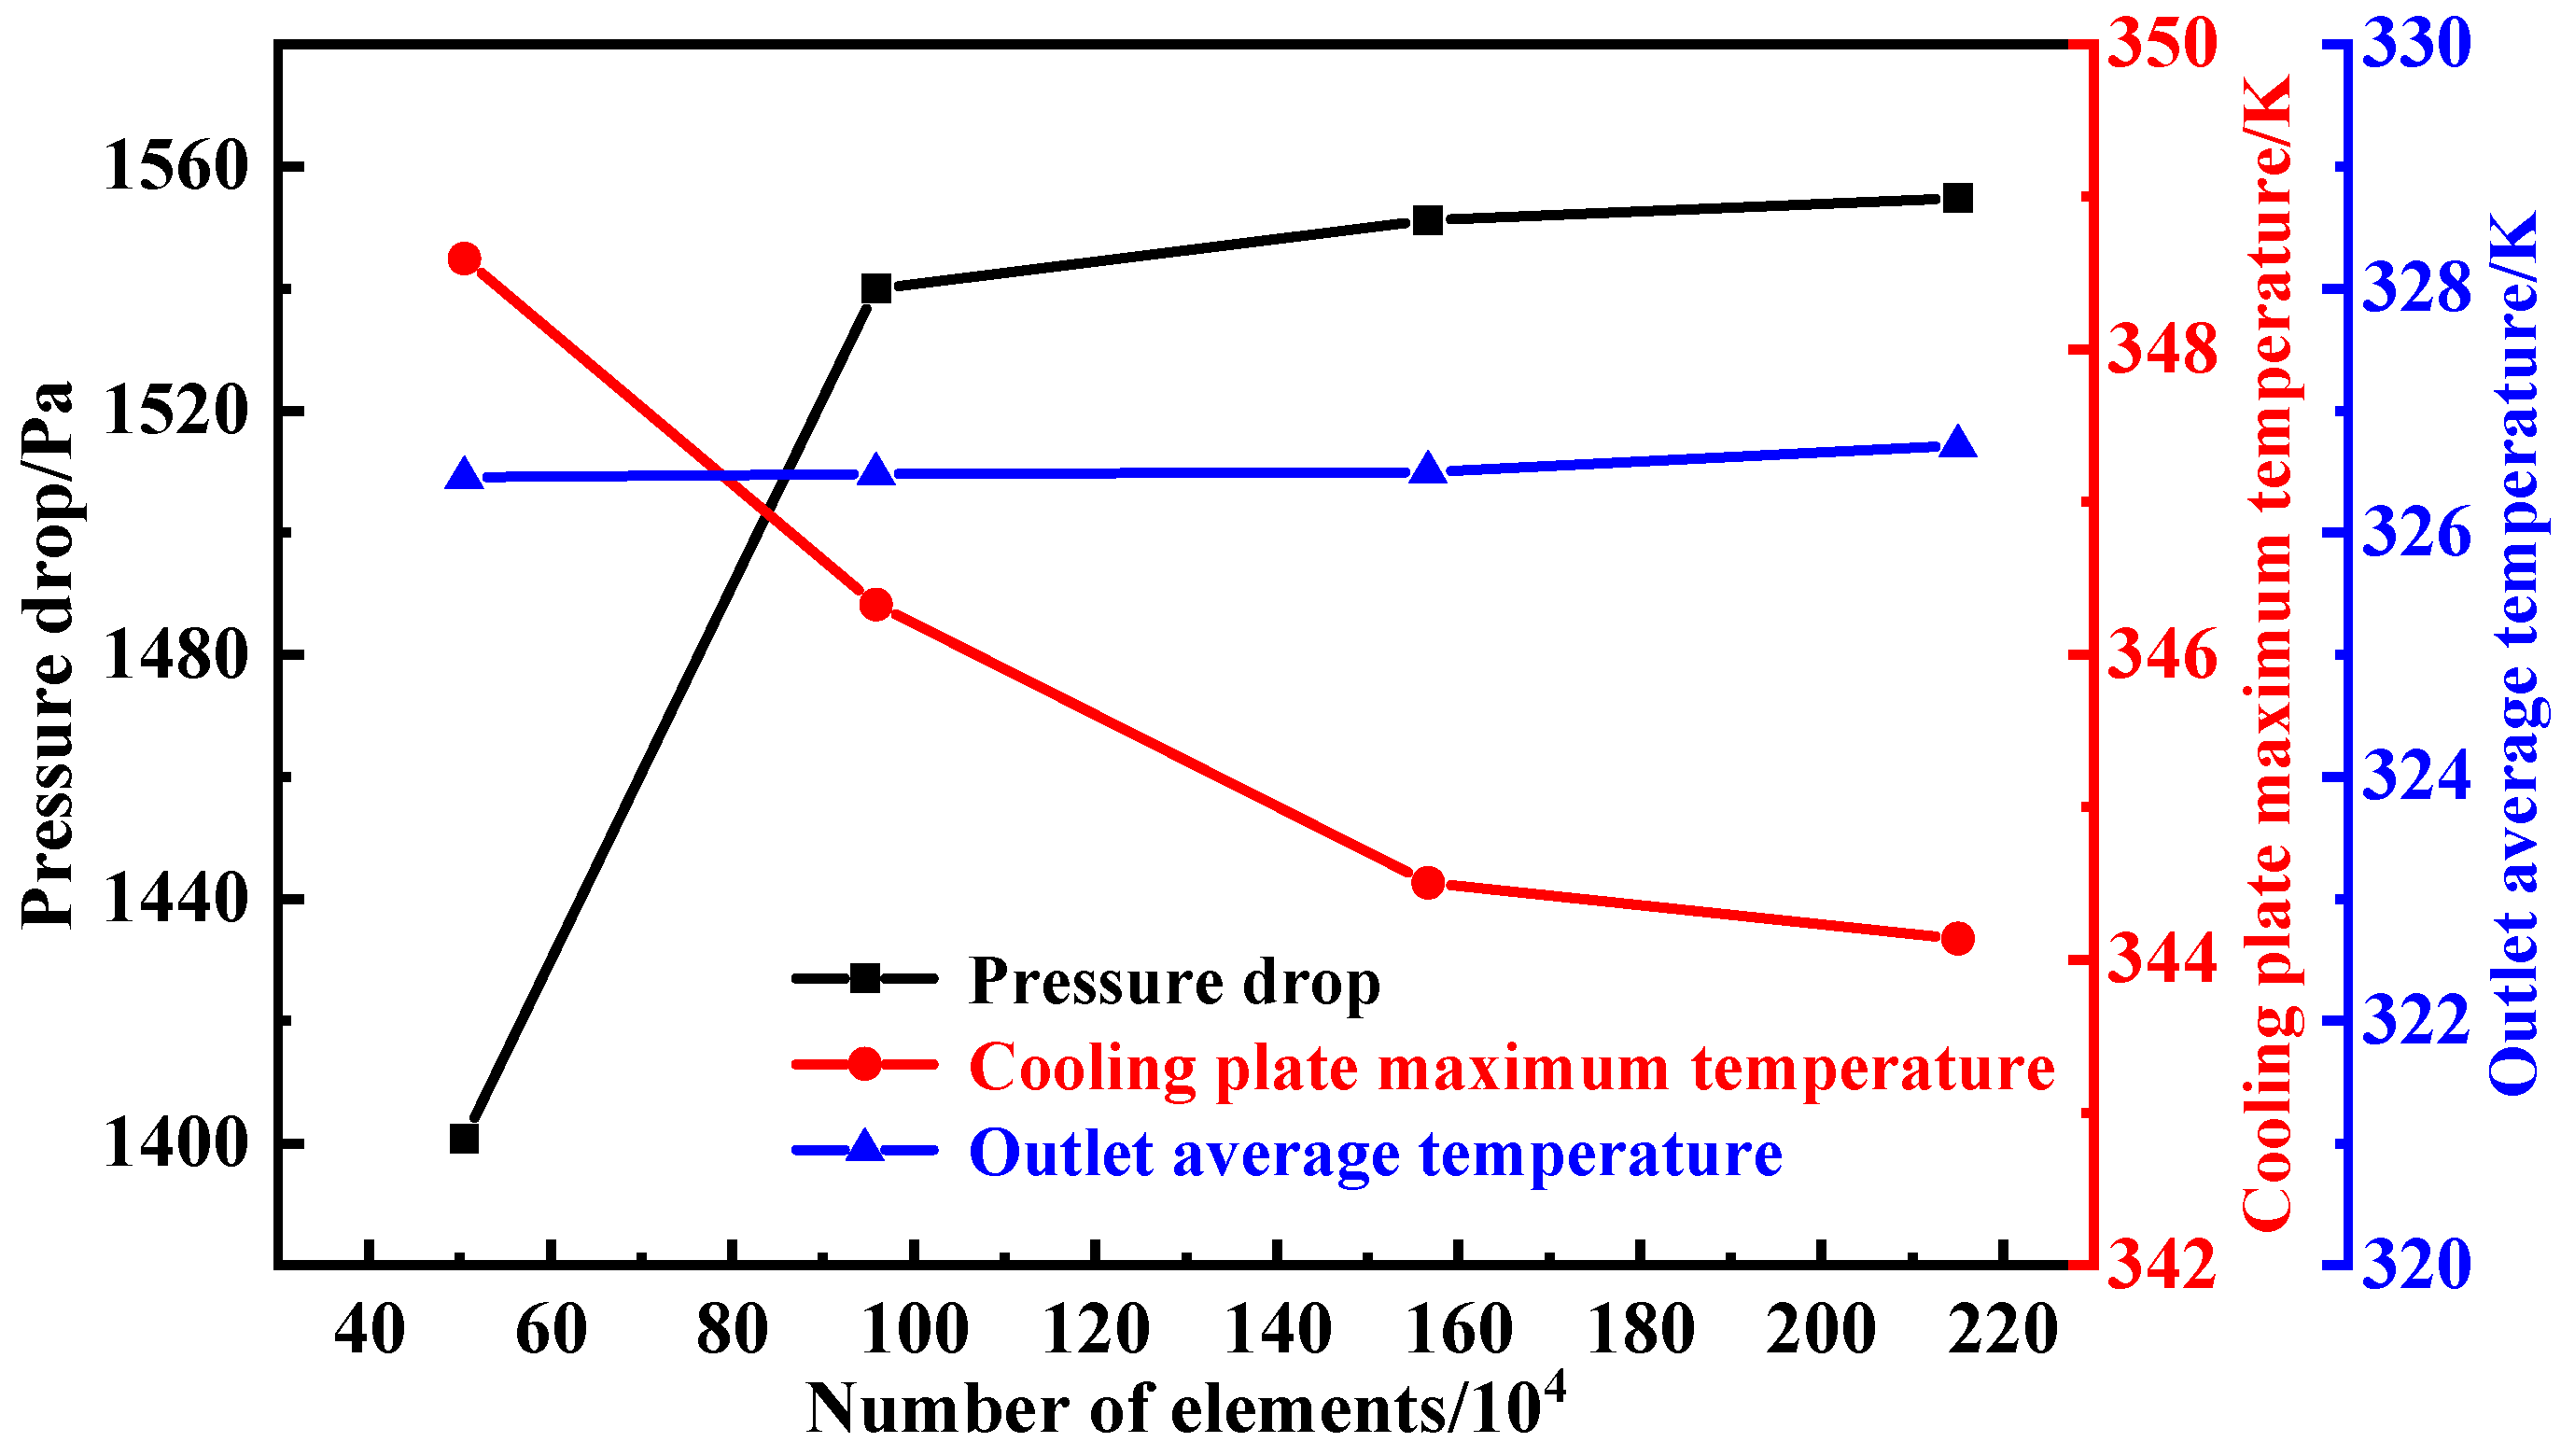
To assess the influence of mesh resolution on the numerical results, four mesh schemes with varying element counts (ranging from 0.5 million to 2 million) were tested. For each case, three key output parameters were monitored: the maximum temperature on the cooling plate, the average coolant outlet temperature, and the pressure drop between inlet and outlet. As shown in
Figure 3, when the total number of elements exceeded approximately 1,566,849, variations in these parameters became negligible, indicating grid independence. Therefore, the mesh with 1,566,849 elements was selected for all subsequent simulations, offering a good balance between computational cost and solution accuracy.
2.5. Numerical Validation
To validate the accuracy of the numerical model developed in this study, comparative analysis was conducted using experimental data published by Gao et al. [
31]. Under identical geometric configurations and thermal boundary conditions, the liquid cooling plate model from the reference was reconstructed, and independent simulations were carried out using a self-developed numerical framework. Key conditions include a total heating power of 4 kW with non-uniform heat source distribution, an inlet coolant temperature of 318.15 K, and a mass flow rate of 0.2 kg/s—all consistent with the experimental setup. The geometric model in this section was constructed based on the experimental model reported in Reference [
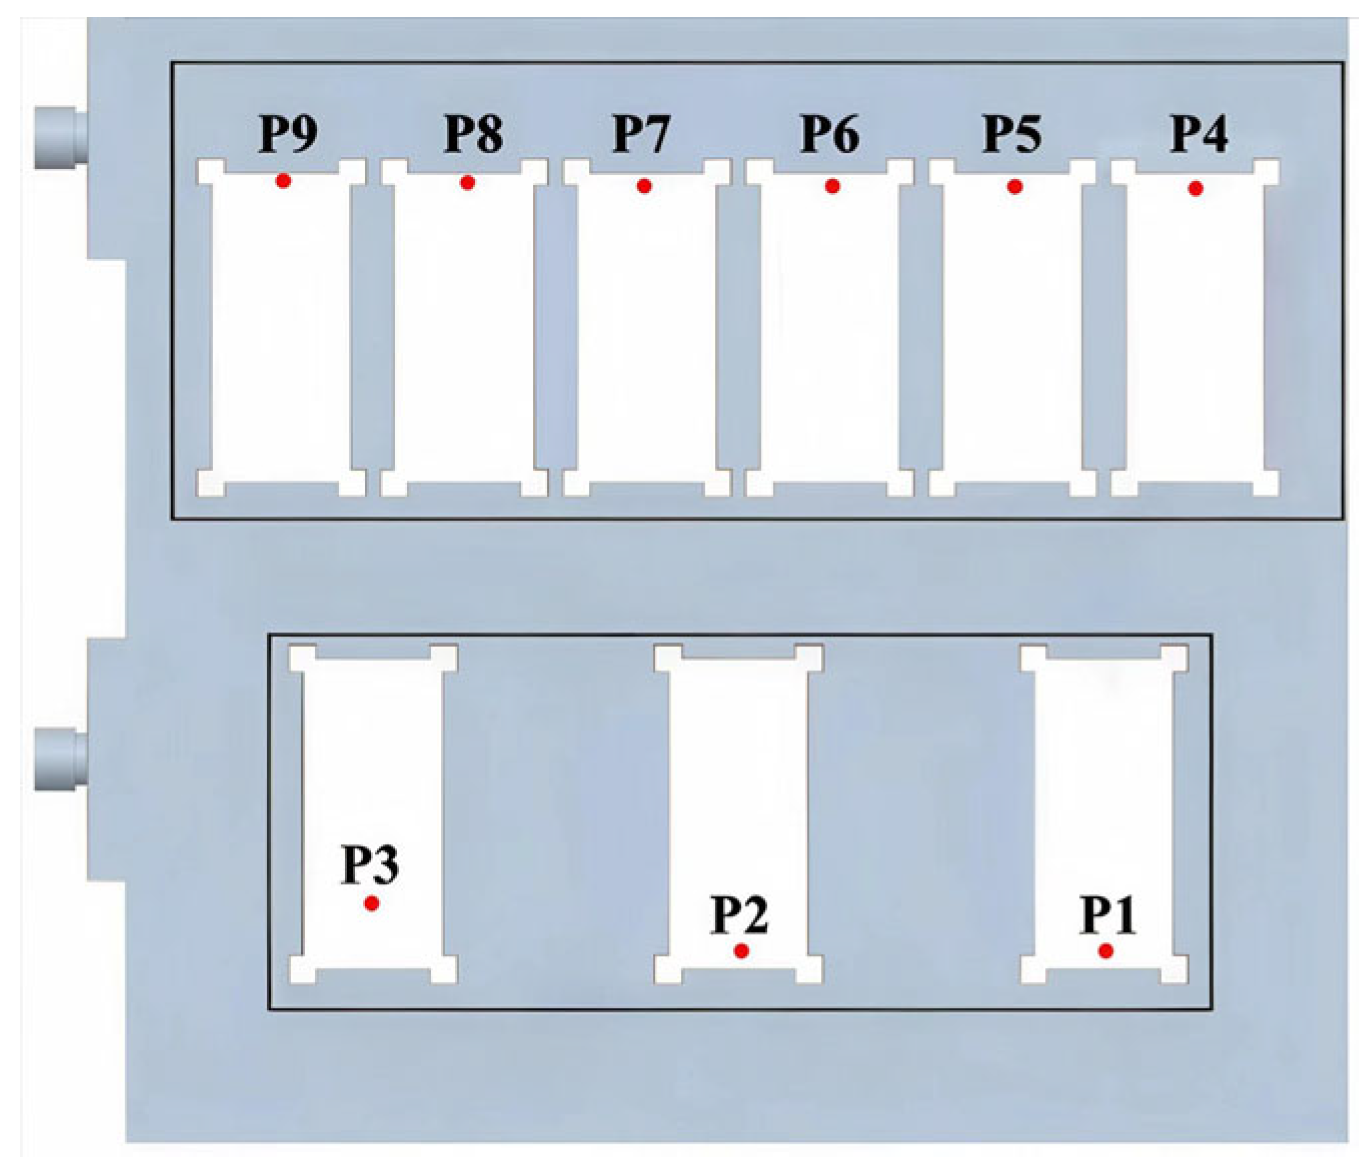
31]. To enable comparison with the experimental results, nine measurement points from the experimental model were selected as the analysis points for the numerical simulation.
Figure 4 shows the schematic of the model and the locations of these six points, ensuring the comparability of the numerical simulation results with the experimental data.
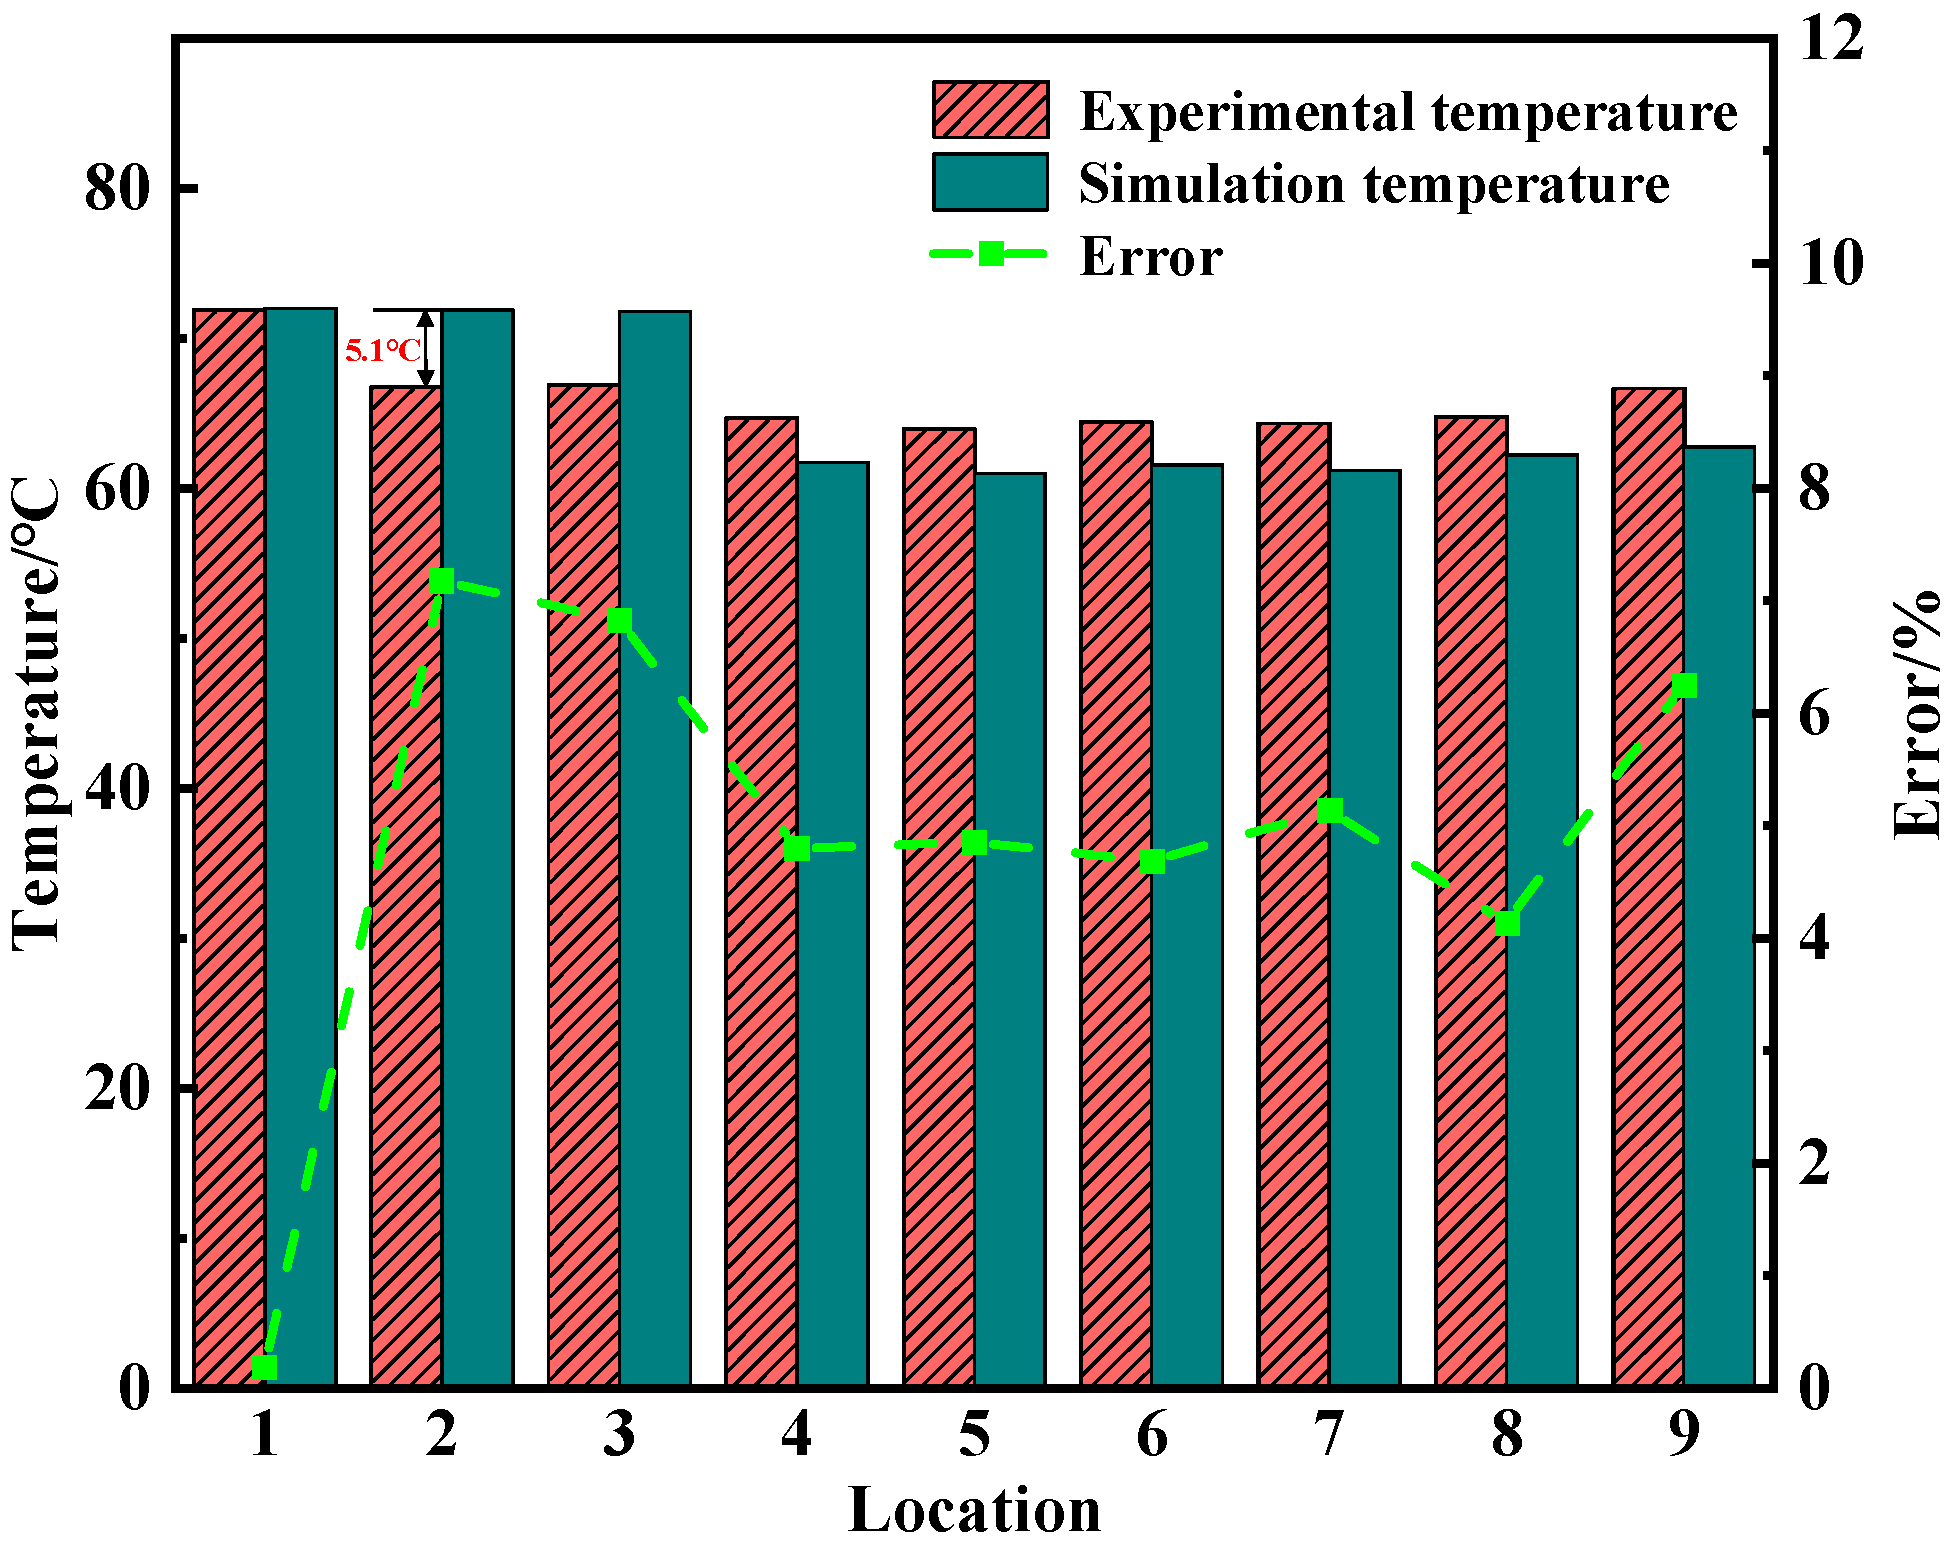
As shown in
Figure 5, the simulated temperatures at the same position of each IGBT module are compared with experimental measurements. The results demonstrate strong agreement, with relative errors at all measurement points remaining below 7%. The largest deviation occurred at the second module, with a maximum absolute error of 5.1 °C. This discrepancy is consistent with the observations reported in the reference and may be attributed to local contact thermal resistance or uncertainty in sensor placement.
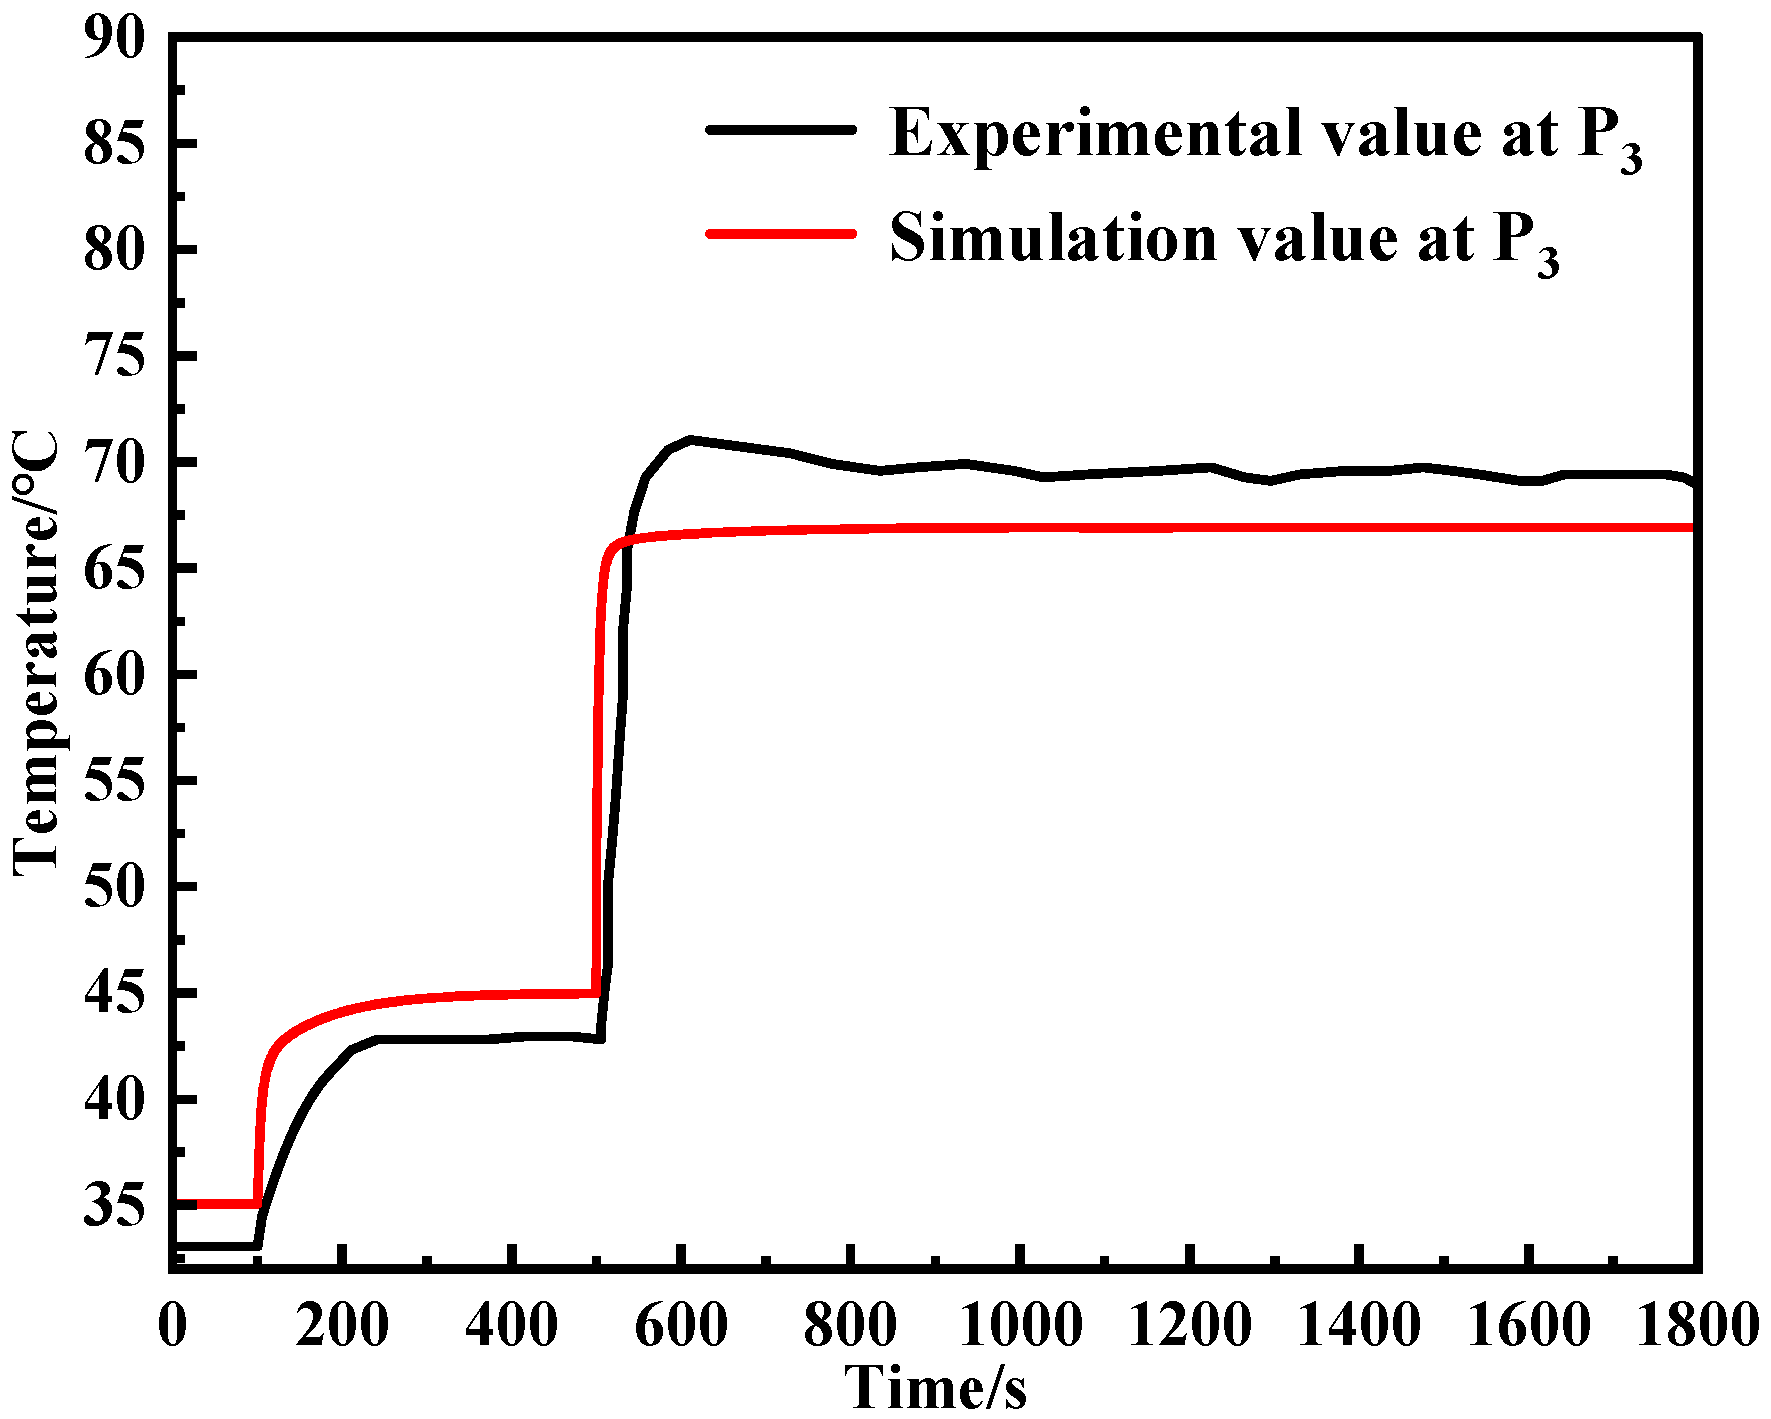
Figure 6 further compares the transient temperature evolution at the monitoring point of the third module. The simulation accurately captures both the initial heating trend and the final steady-state behavior. Although the peak temperature is slightly underestimated, the overall thermal response—including the heating rate and stabilization characteristics—shows good agreement with experimental data, indicating that the model also performs reliably under transient conditions.
3. Results and Discussion
3.1. Effects of Honeycomb-Structured Arrangement and Structural Parameters on Thermal and Flow Performance
To enhance the overall thermal management performance of microchannel cooling plates for high-power electronic devices, this study investigates the influence of honeycomb-structured unit arrangements—based on a bionic honeycomb-structured—on thermo-fluid characteristics. Two typical structural configurations were designed: a conventional staggered honeycomb-structured layout and an aligned arrangement. The specific geometries are illustrated in
Figure 7. The inlet coolant flow rate was set to 2.5 L/min with a temperature of 313.15 K, and each IGBT module was assigned a heat dissipation power of 666.76 W.
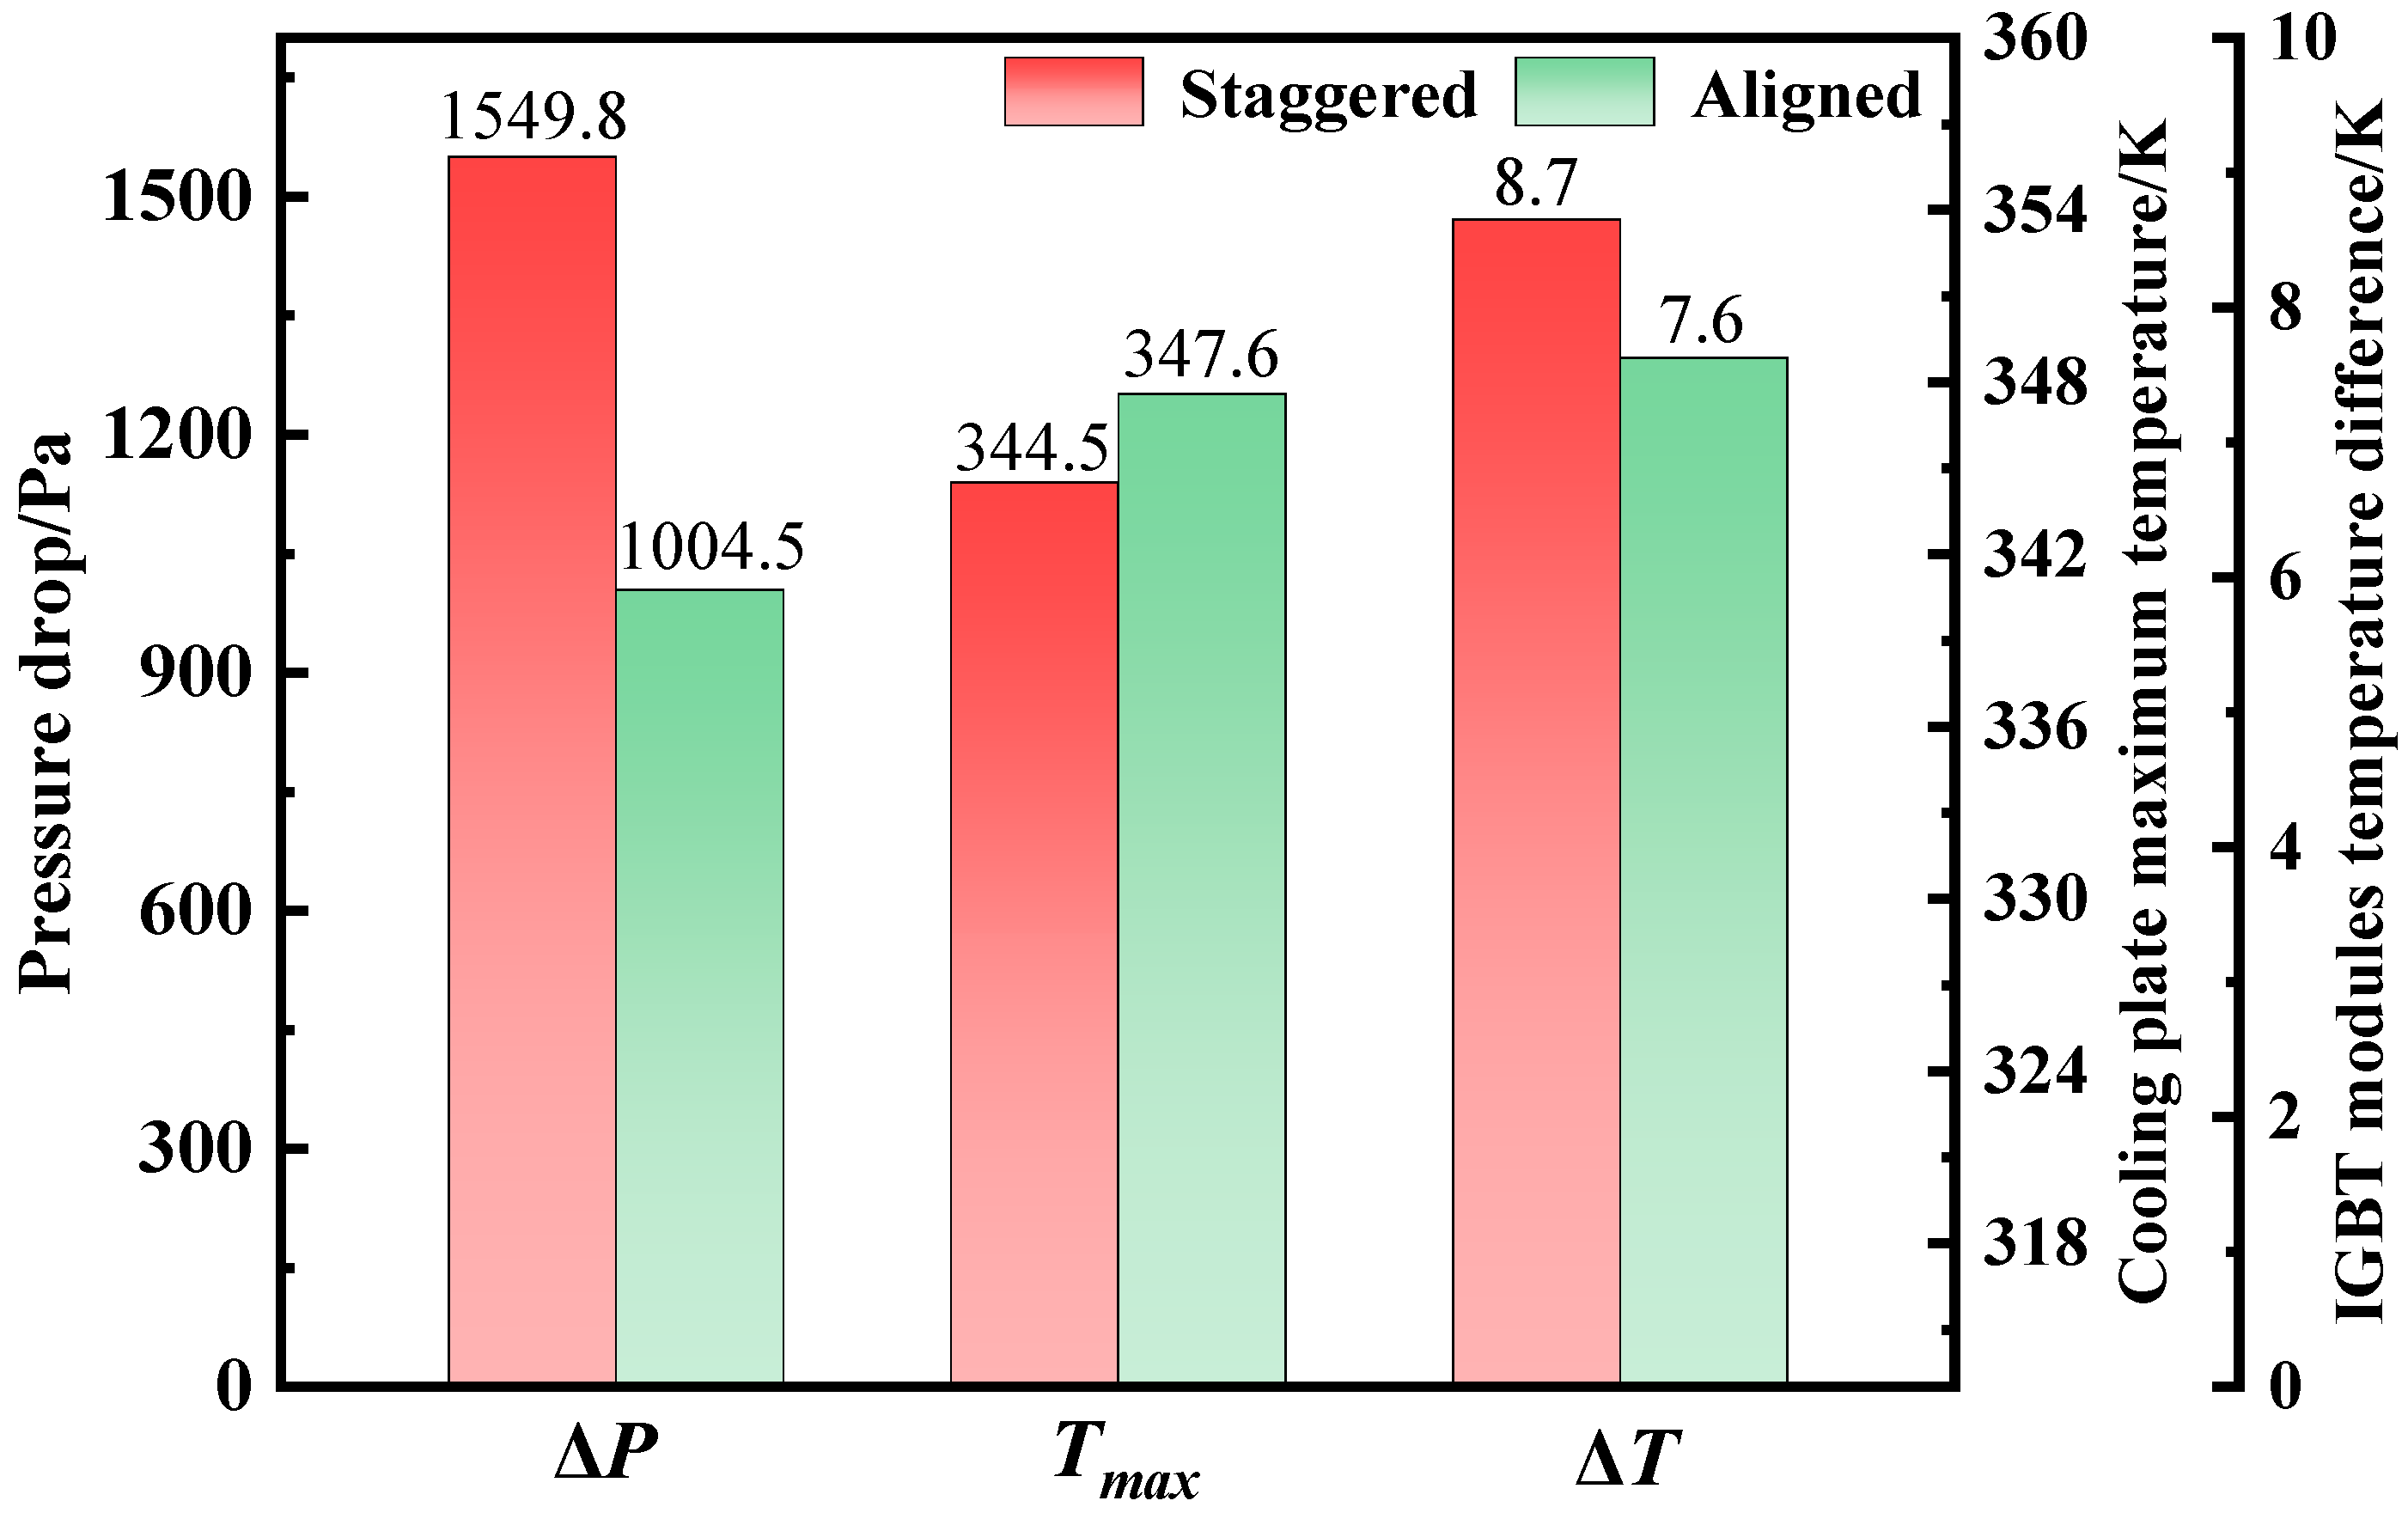
Figure 8 presents a comparison of the pressure drop, maximum interface temperature between the IGBT and the cooling plate, and the temperature difference under the two arrangements. Temperature difference refers to the maximum temperature variation among the three IGBT modules. It is evident that the staggered configuration achieves a 3.1 K lower peak temperature compared to the aligned layout, albeit at the expense of a 545.3 Pa increase in pressure drop. The temperature difference between modules is relatively small, with only a 1.1 K difference. Overall, considering both heat dissipation effectiveness and temperature uniformity, the staggered structure demonstrates superior performance.
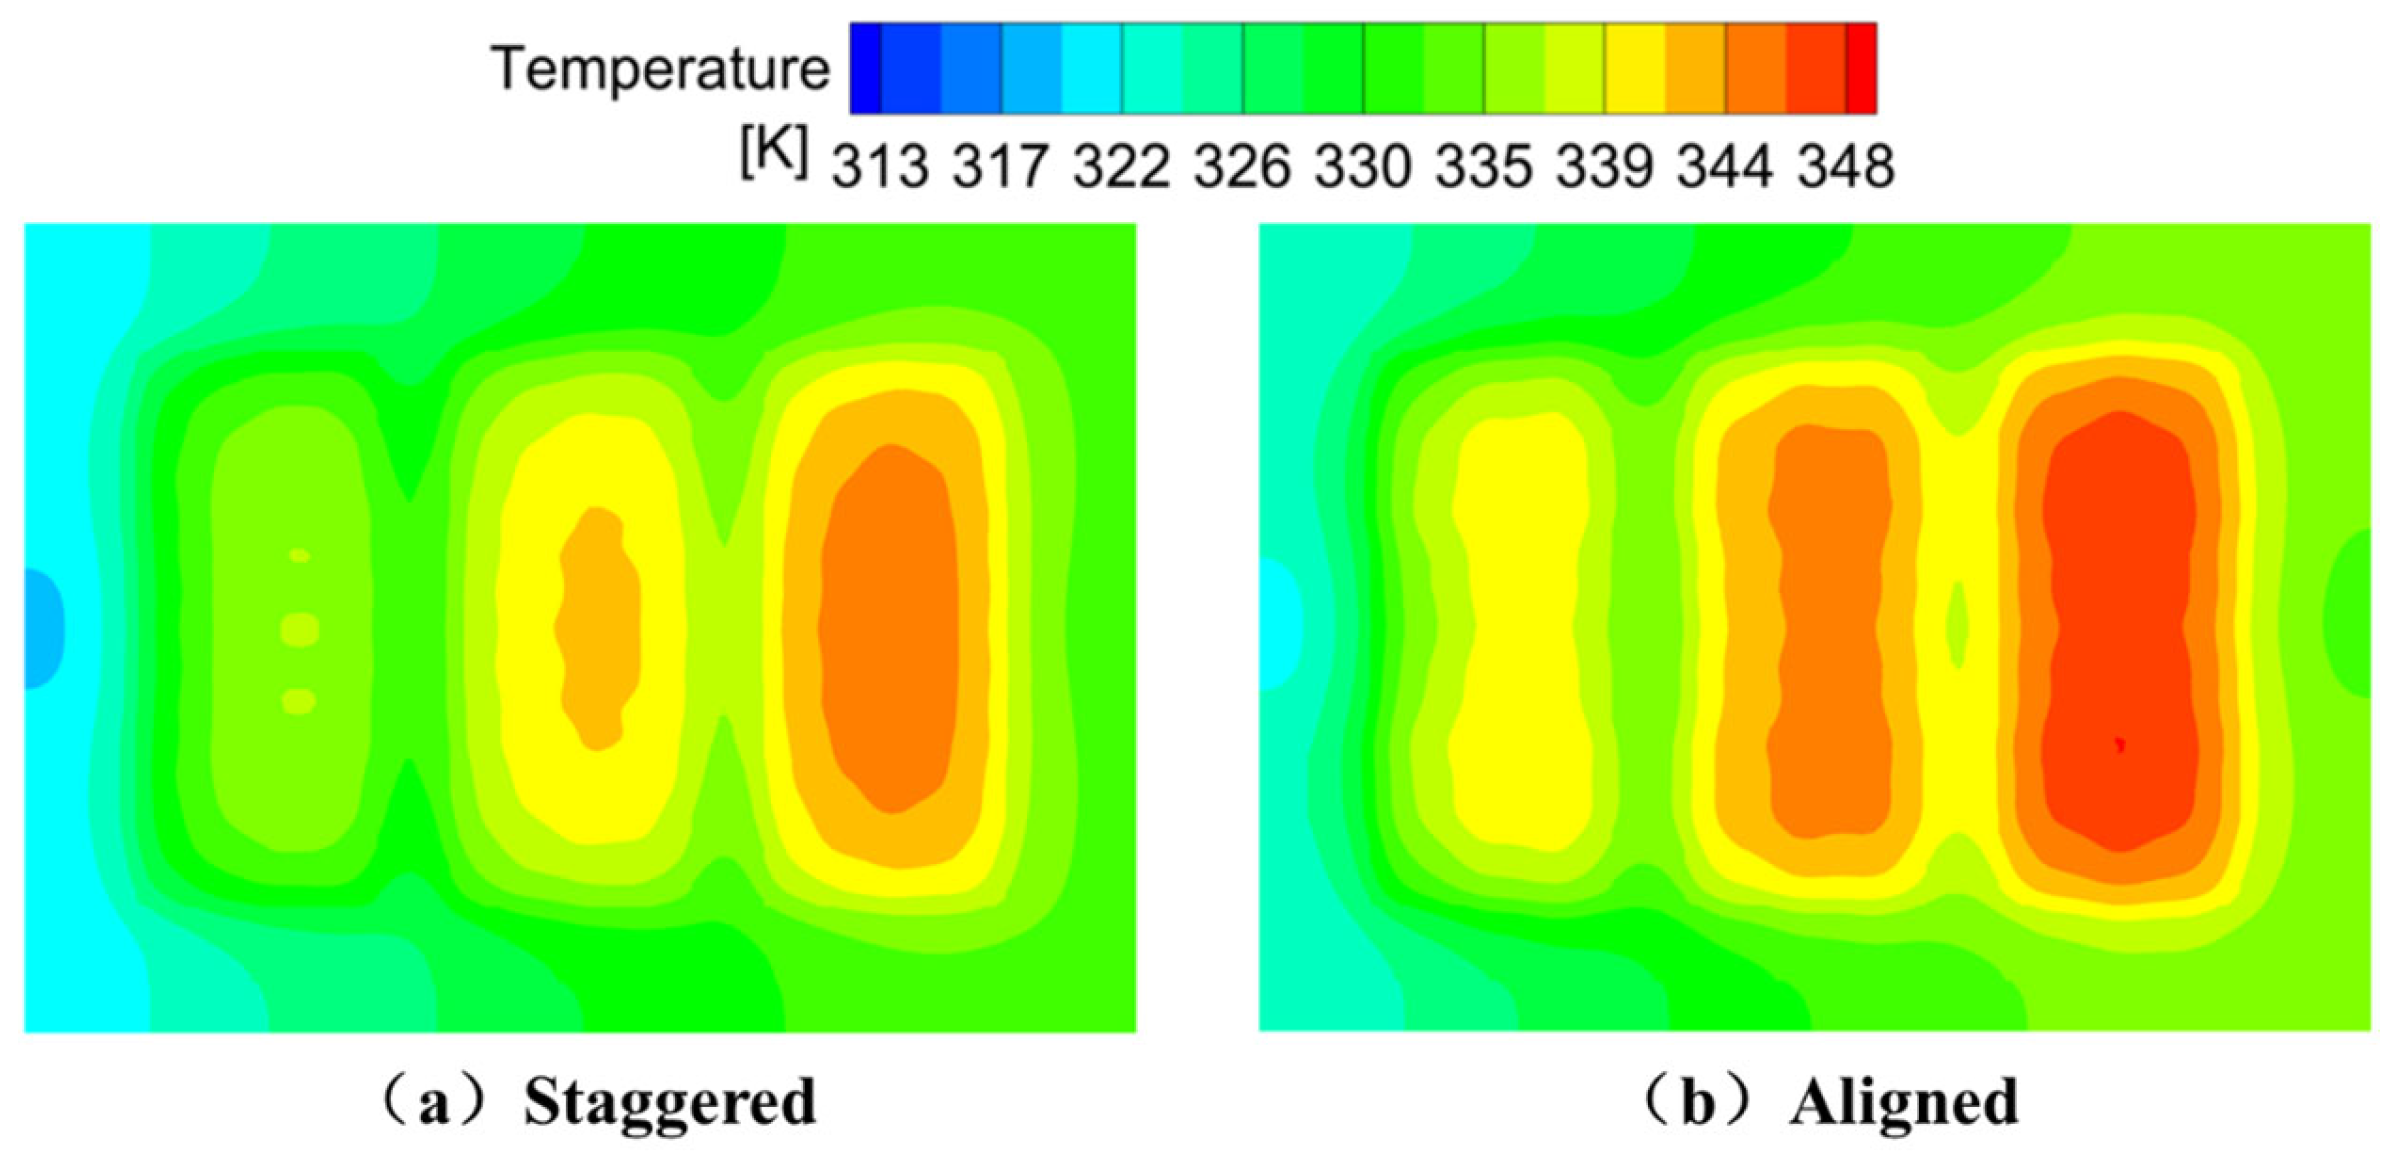
Figure 9 illustrates the surface temperature contour plots of the cooling plate under the two structural layouts. The staggered configuration exhibits a generally lower surface temperature. Although the overall temperature difference is slightly larger, the temperature distribution is more uniform compared to that of the aligned configuration.
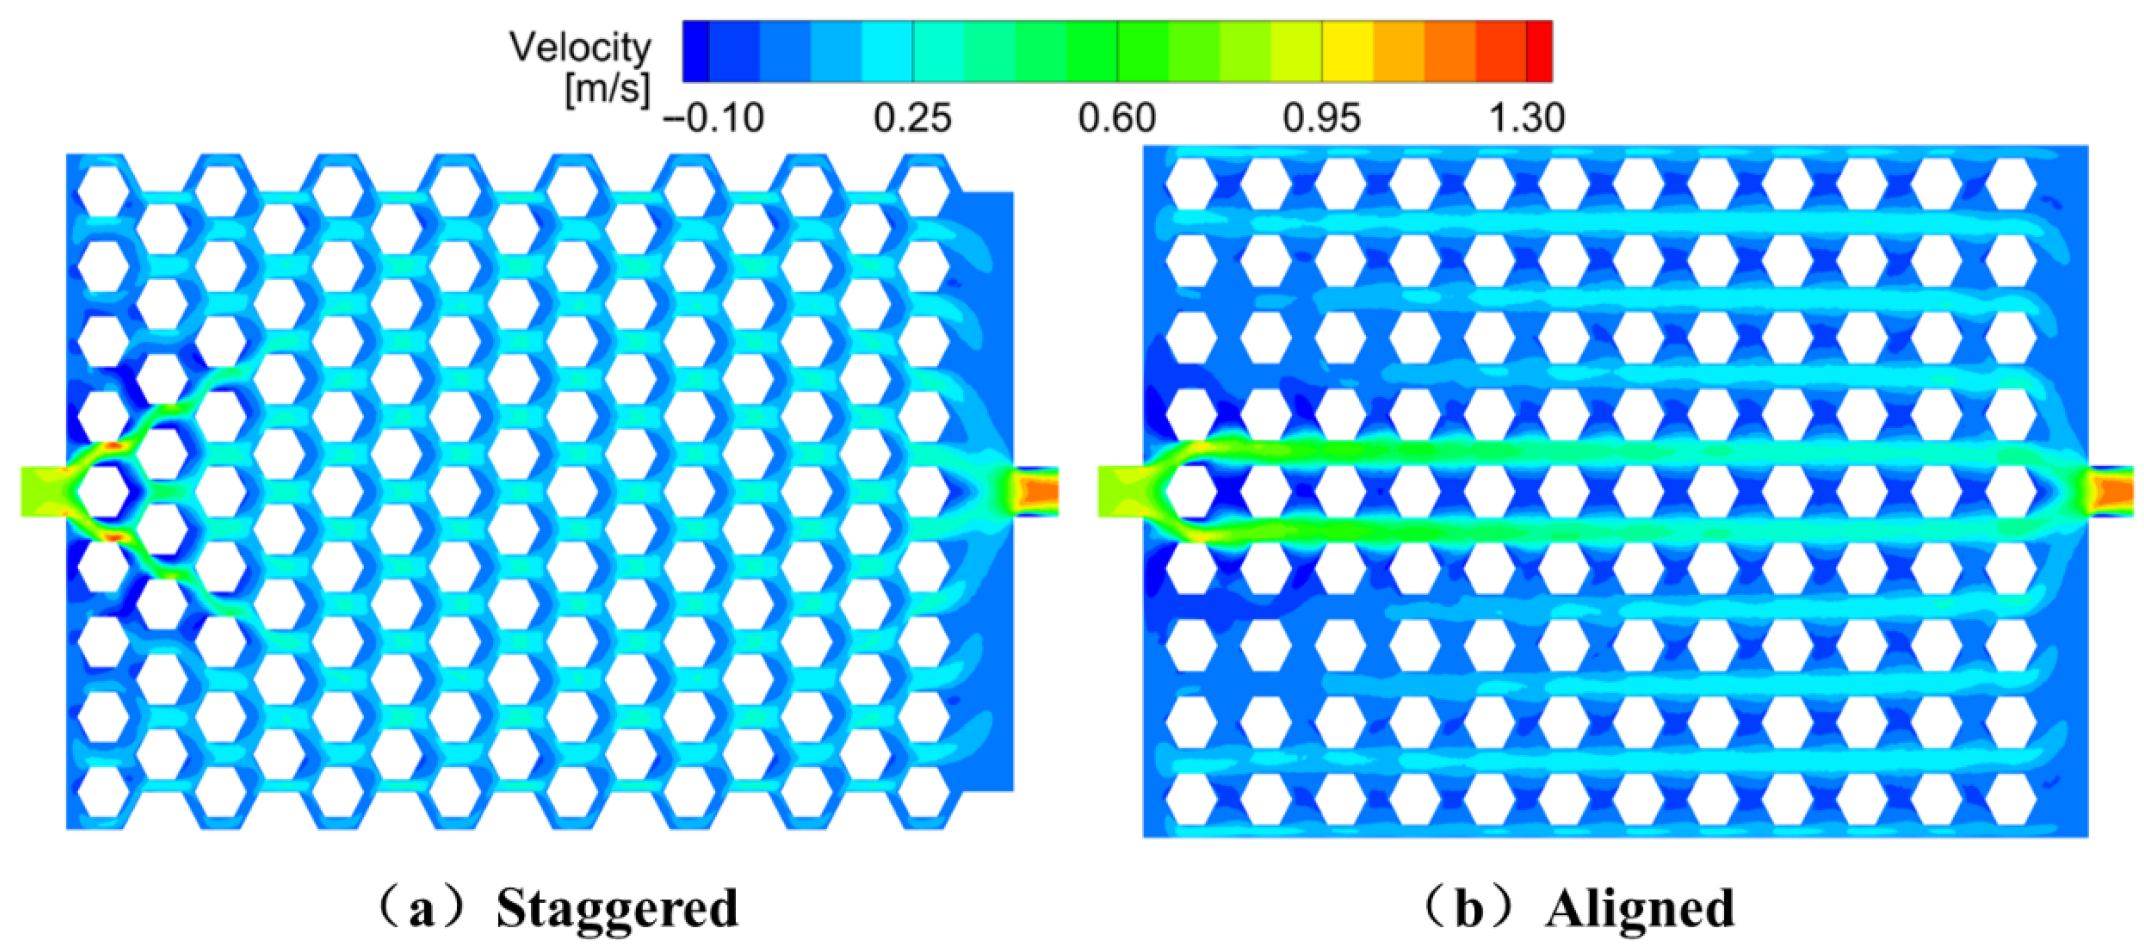
Figure 10 displays the velocity contour plots for both configurations. In the aligned layout, the coolant primarily flows along the main inlet-to-outlet path, resulting in the highest velocity near the inlet and significantly reduced flow in the lateral regions. In contrast, the staggered design facilitates lateral fluid diffusion, leading to a more uniform velocity distribution. The uneven flow in the aligned layout tends to produce localized hotspots.
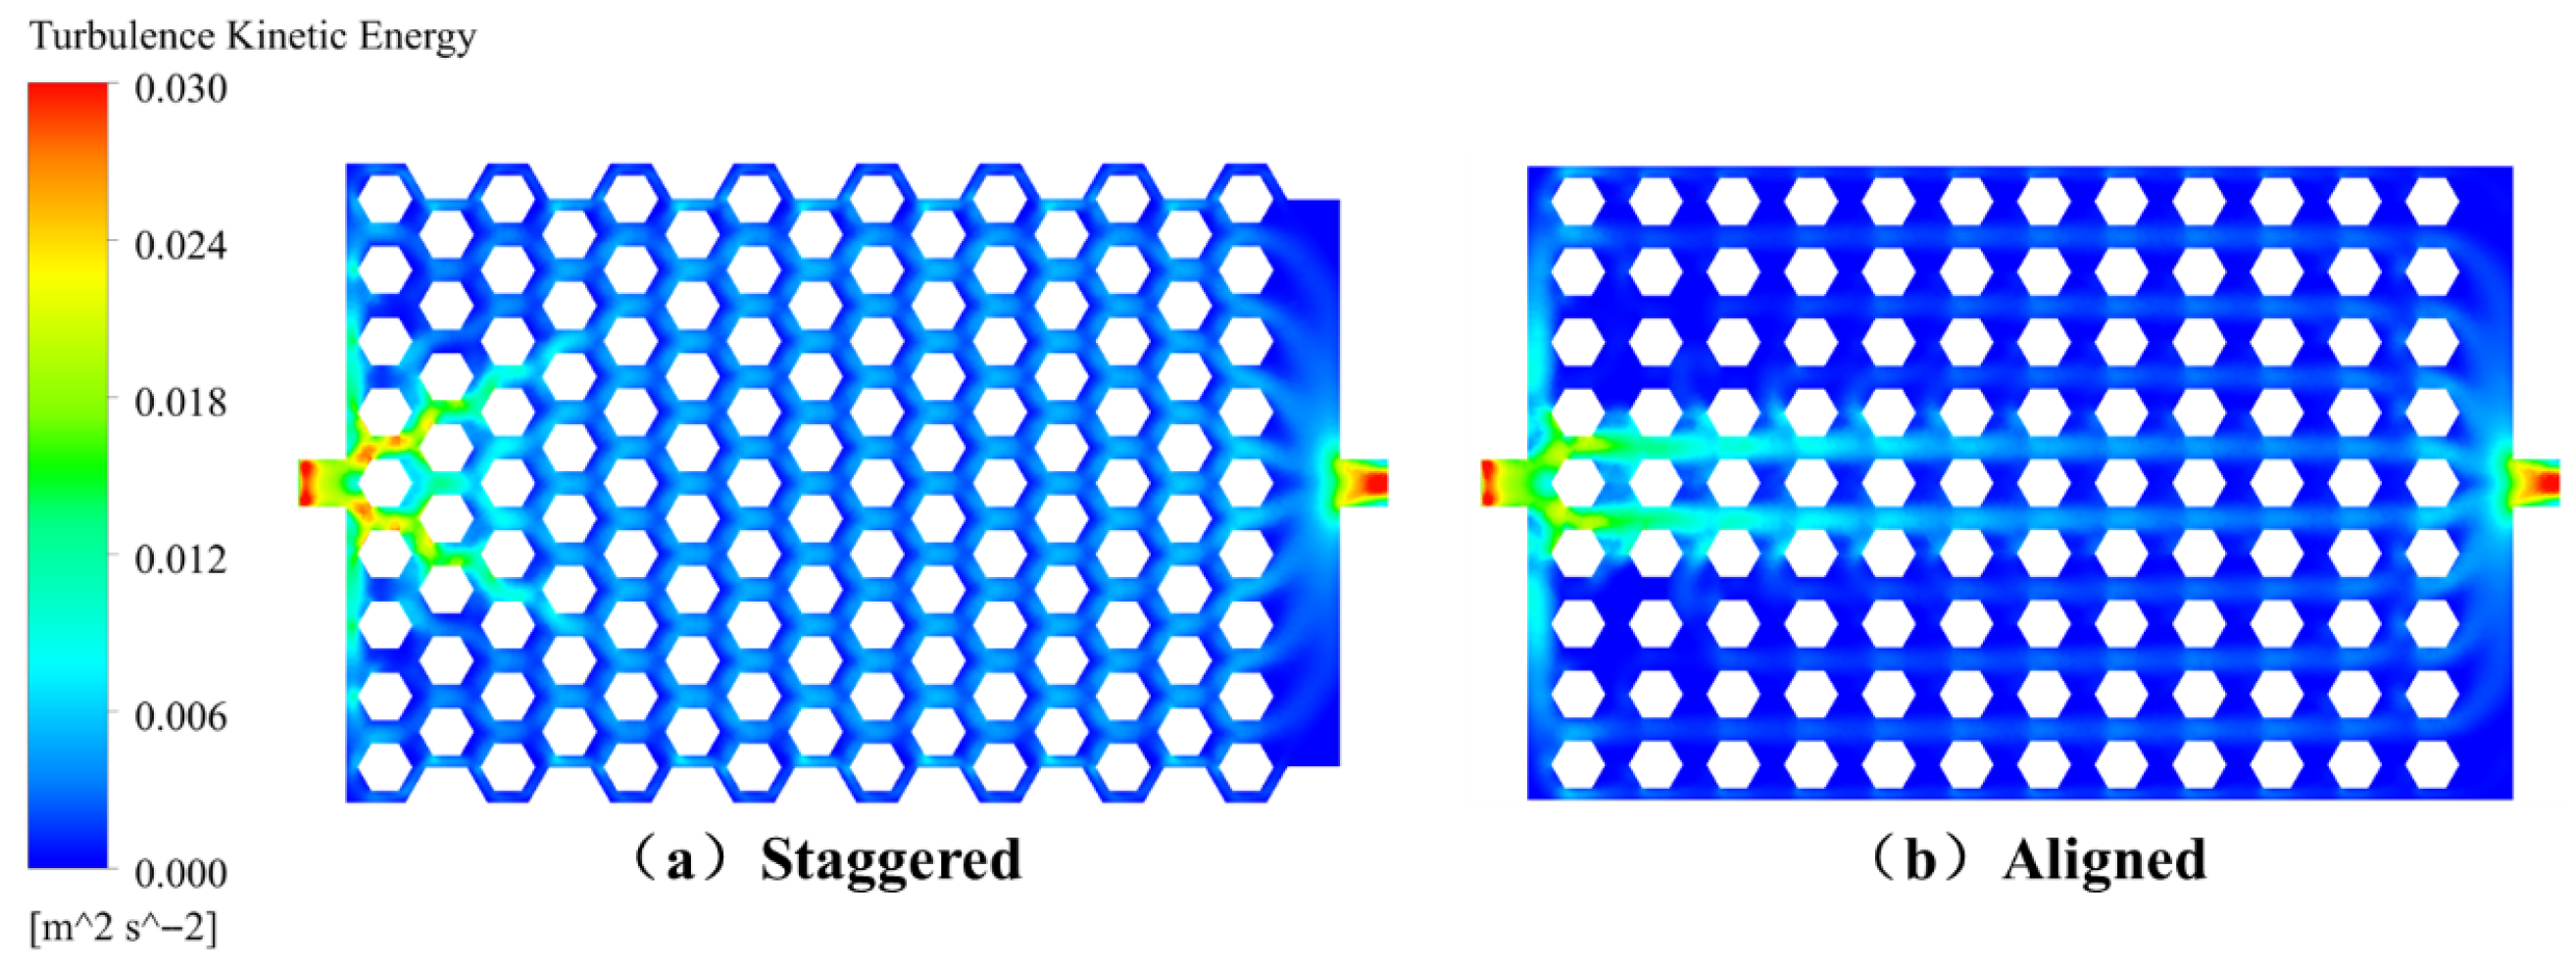
Figure 11 shows the turbulent kinetic energy (TKE) contours for the two designs. In the aligned configuration, TKE is concentrated along the high-speed mainstream path. Conversely, the staggered arrangement induces broader turbulence distribution through lateral flow, with a generally higher TKE level. These flow patterns explain the observed temperature distribution: areas with low TKE and weak flow coincide with surface hotspots, whereas regions with stronger turbulence remain cooler. The staggered configuration enhances lateral mixing and flow uniformity, thereby reducing the overall peak temperature. However, due to variations in local cooling intensity, certain modules experience faster cooling, which can lead to slightly larger temperature differences between modules. This observation underscores the thermal enhancement capability of the staggered design while also indicating the need for further flow path optimization to achieve uniform temperature distribution across all modules.
3.2. Effect of Honeycomb-Structured Size and Channel Width on Thermal and Flow Performance
To investigate the influence of honeycomb-structured cell size and channel width on the cooling performance of the liquid-cooled plate, four structural configurations (Case 1 to Case 4) with symmetric layouts were designed. The detailed geometric parameters are listed in
Table 2. Case 2 serves as the baseline, featuring honeycomb-structured units and flow channels of equal width. Case 1 employs wider channels and smaller honeycomb-structured cells, which increases the number of vortex-inducing posts and enhances heat exchange surface area. Case 3 adopts larger honeycomb-structured cells, while Case 4 narrows the channel width with the intent of accelerating coolant flow and improving flow uniformity. All other boundary conditions remain unchanged.
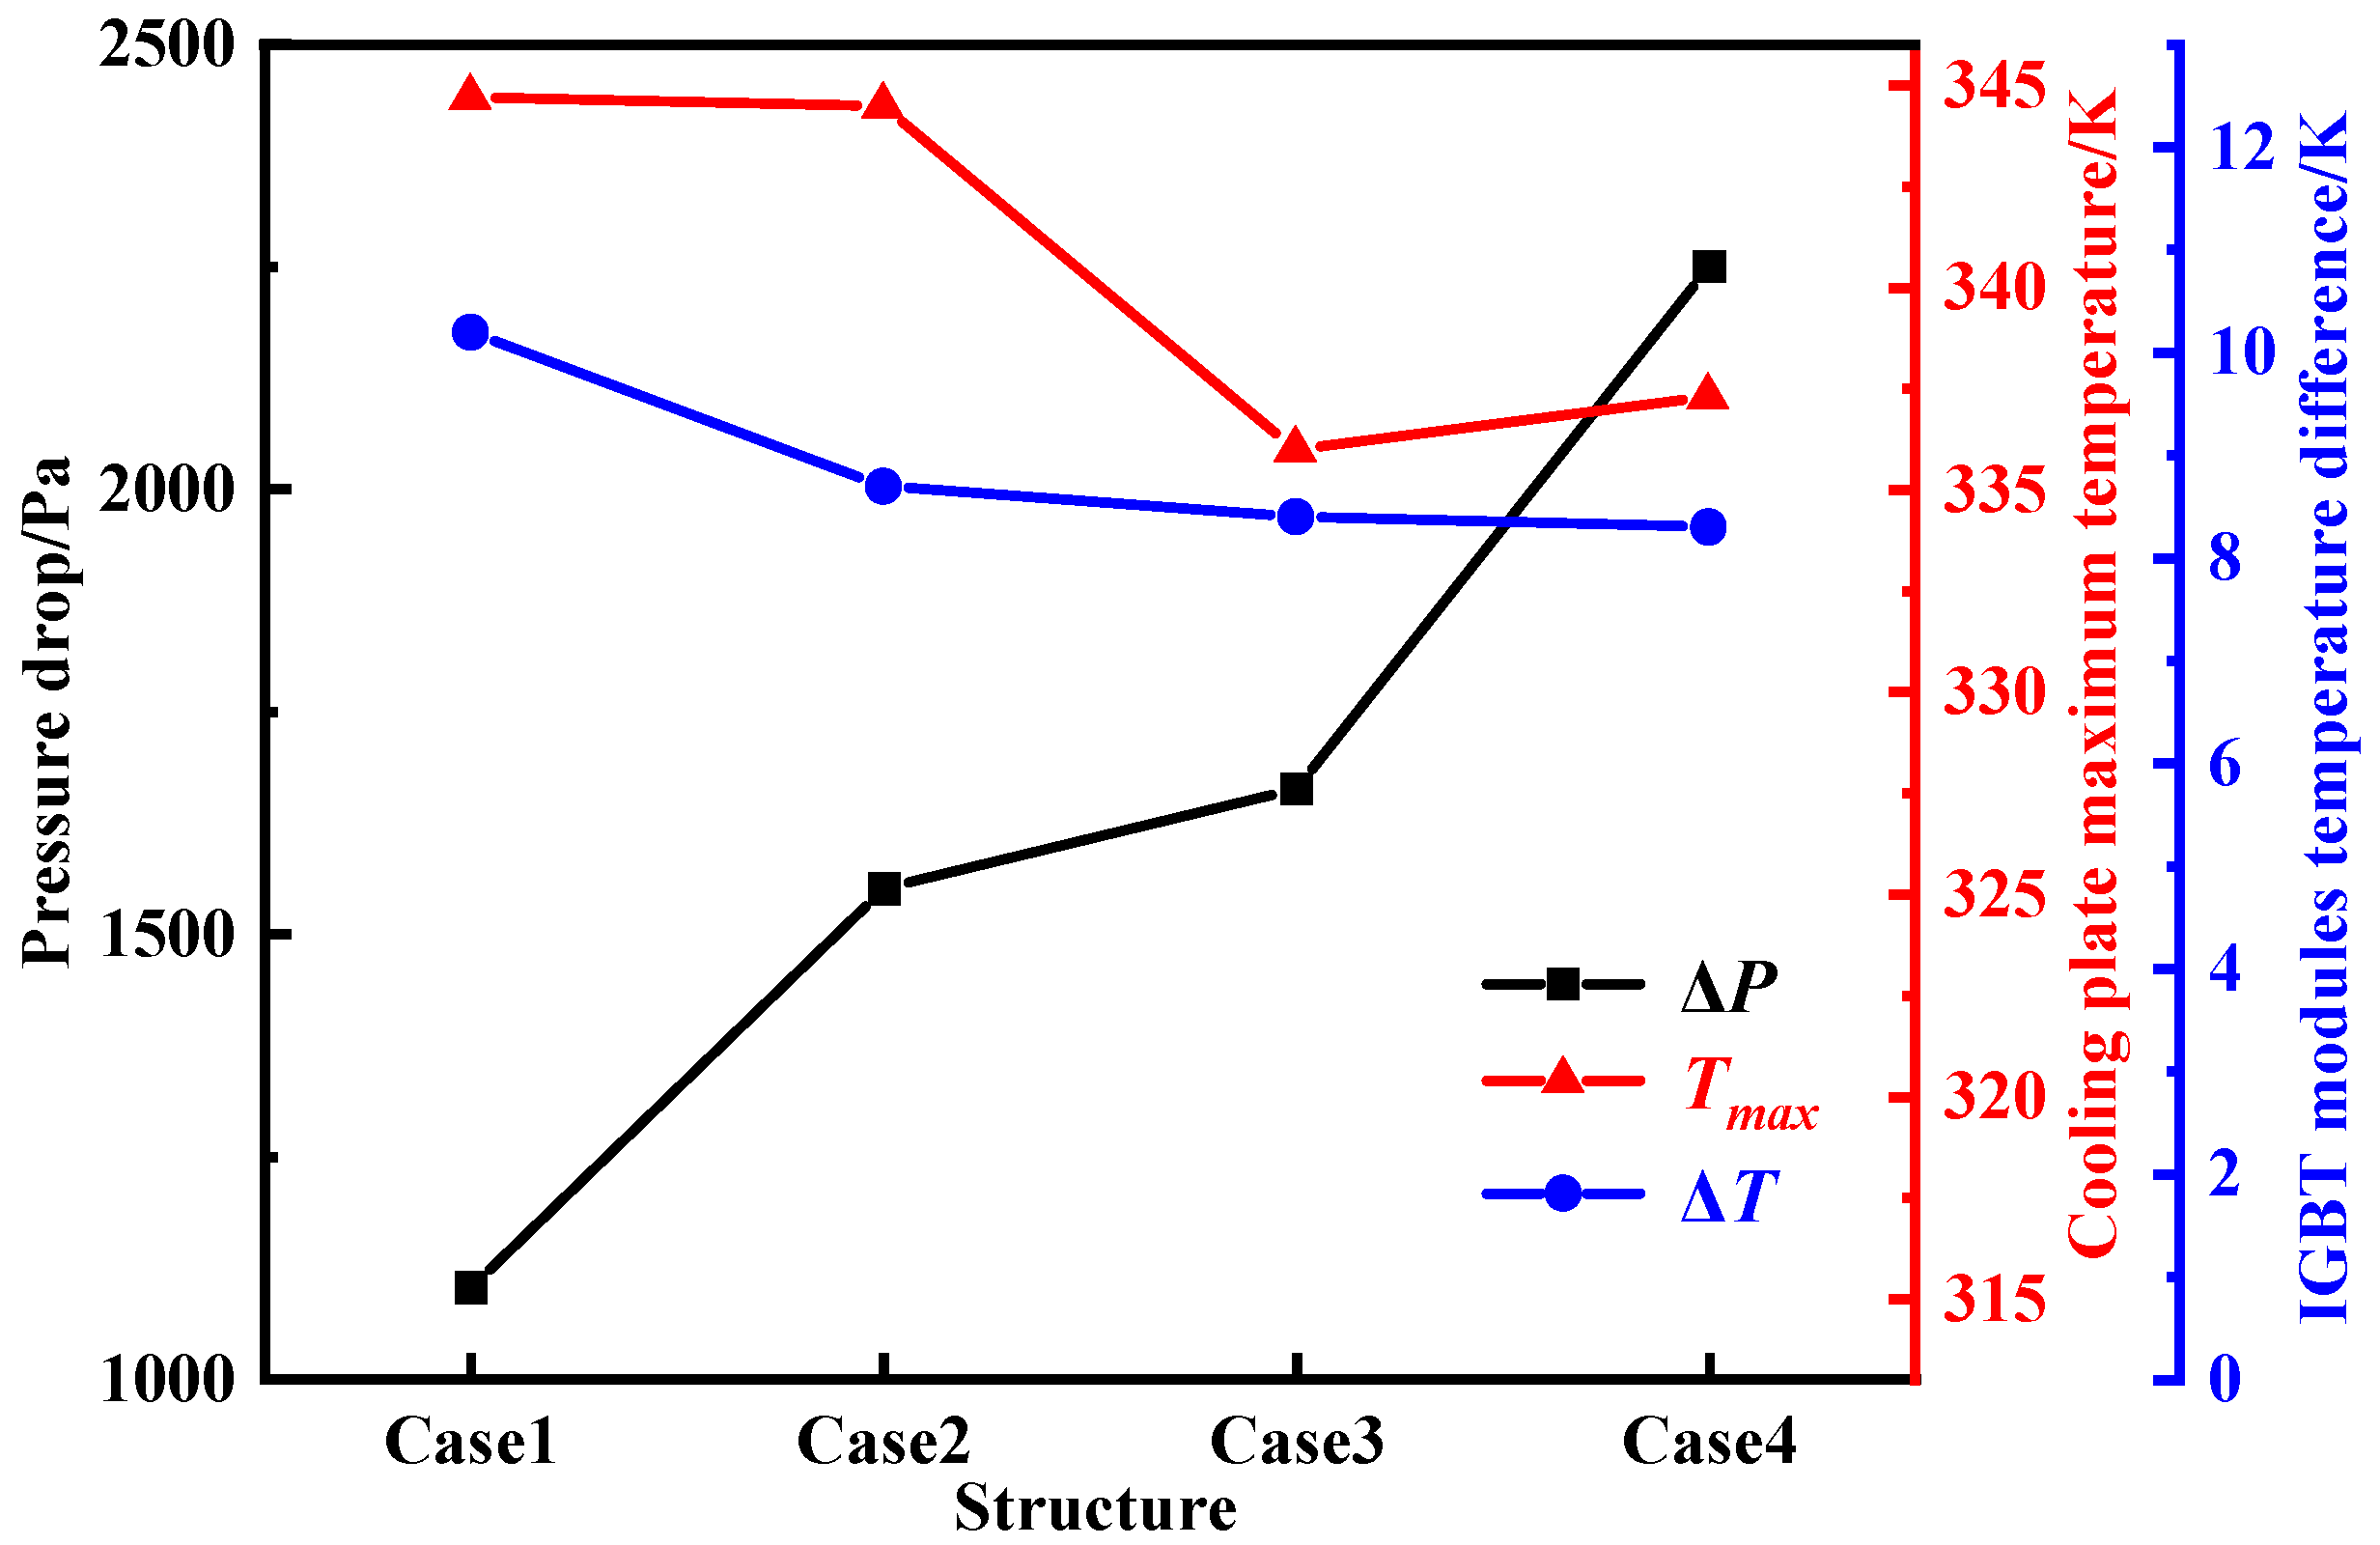
Figure 12 illustrates the thermal performance comparison among the four cases. Narrowing the channel width significantly improves cooling performance. For instance, the maximum temperature in Case 3 is reduced by 8.7 K compared to Case 1 (from 344.7 K to 336 K). In terms of temperature uniformity, Case 4 performs best, reducing the IGBT temperature difference from 10.2 K (Case 1) to 8.3 K, indicating more uniform heat dissipation. However, Case 4 also shows a markedly increased pressure drop—over twice that of Case 1—highlighting the trade-off between enhanced heat transfer and increased flow resistance.
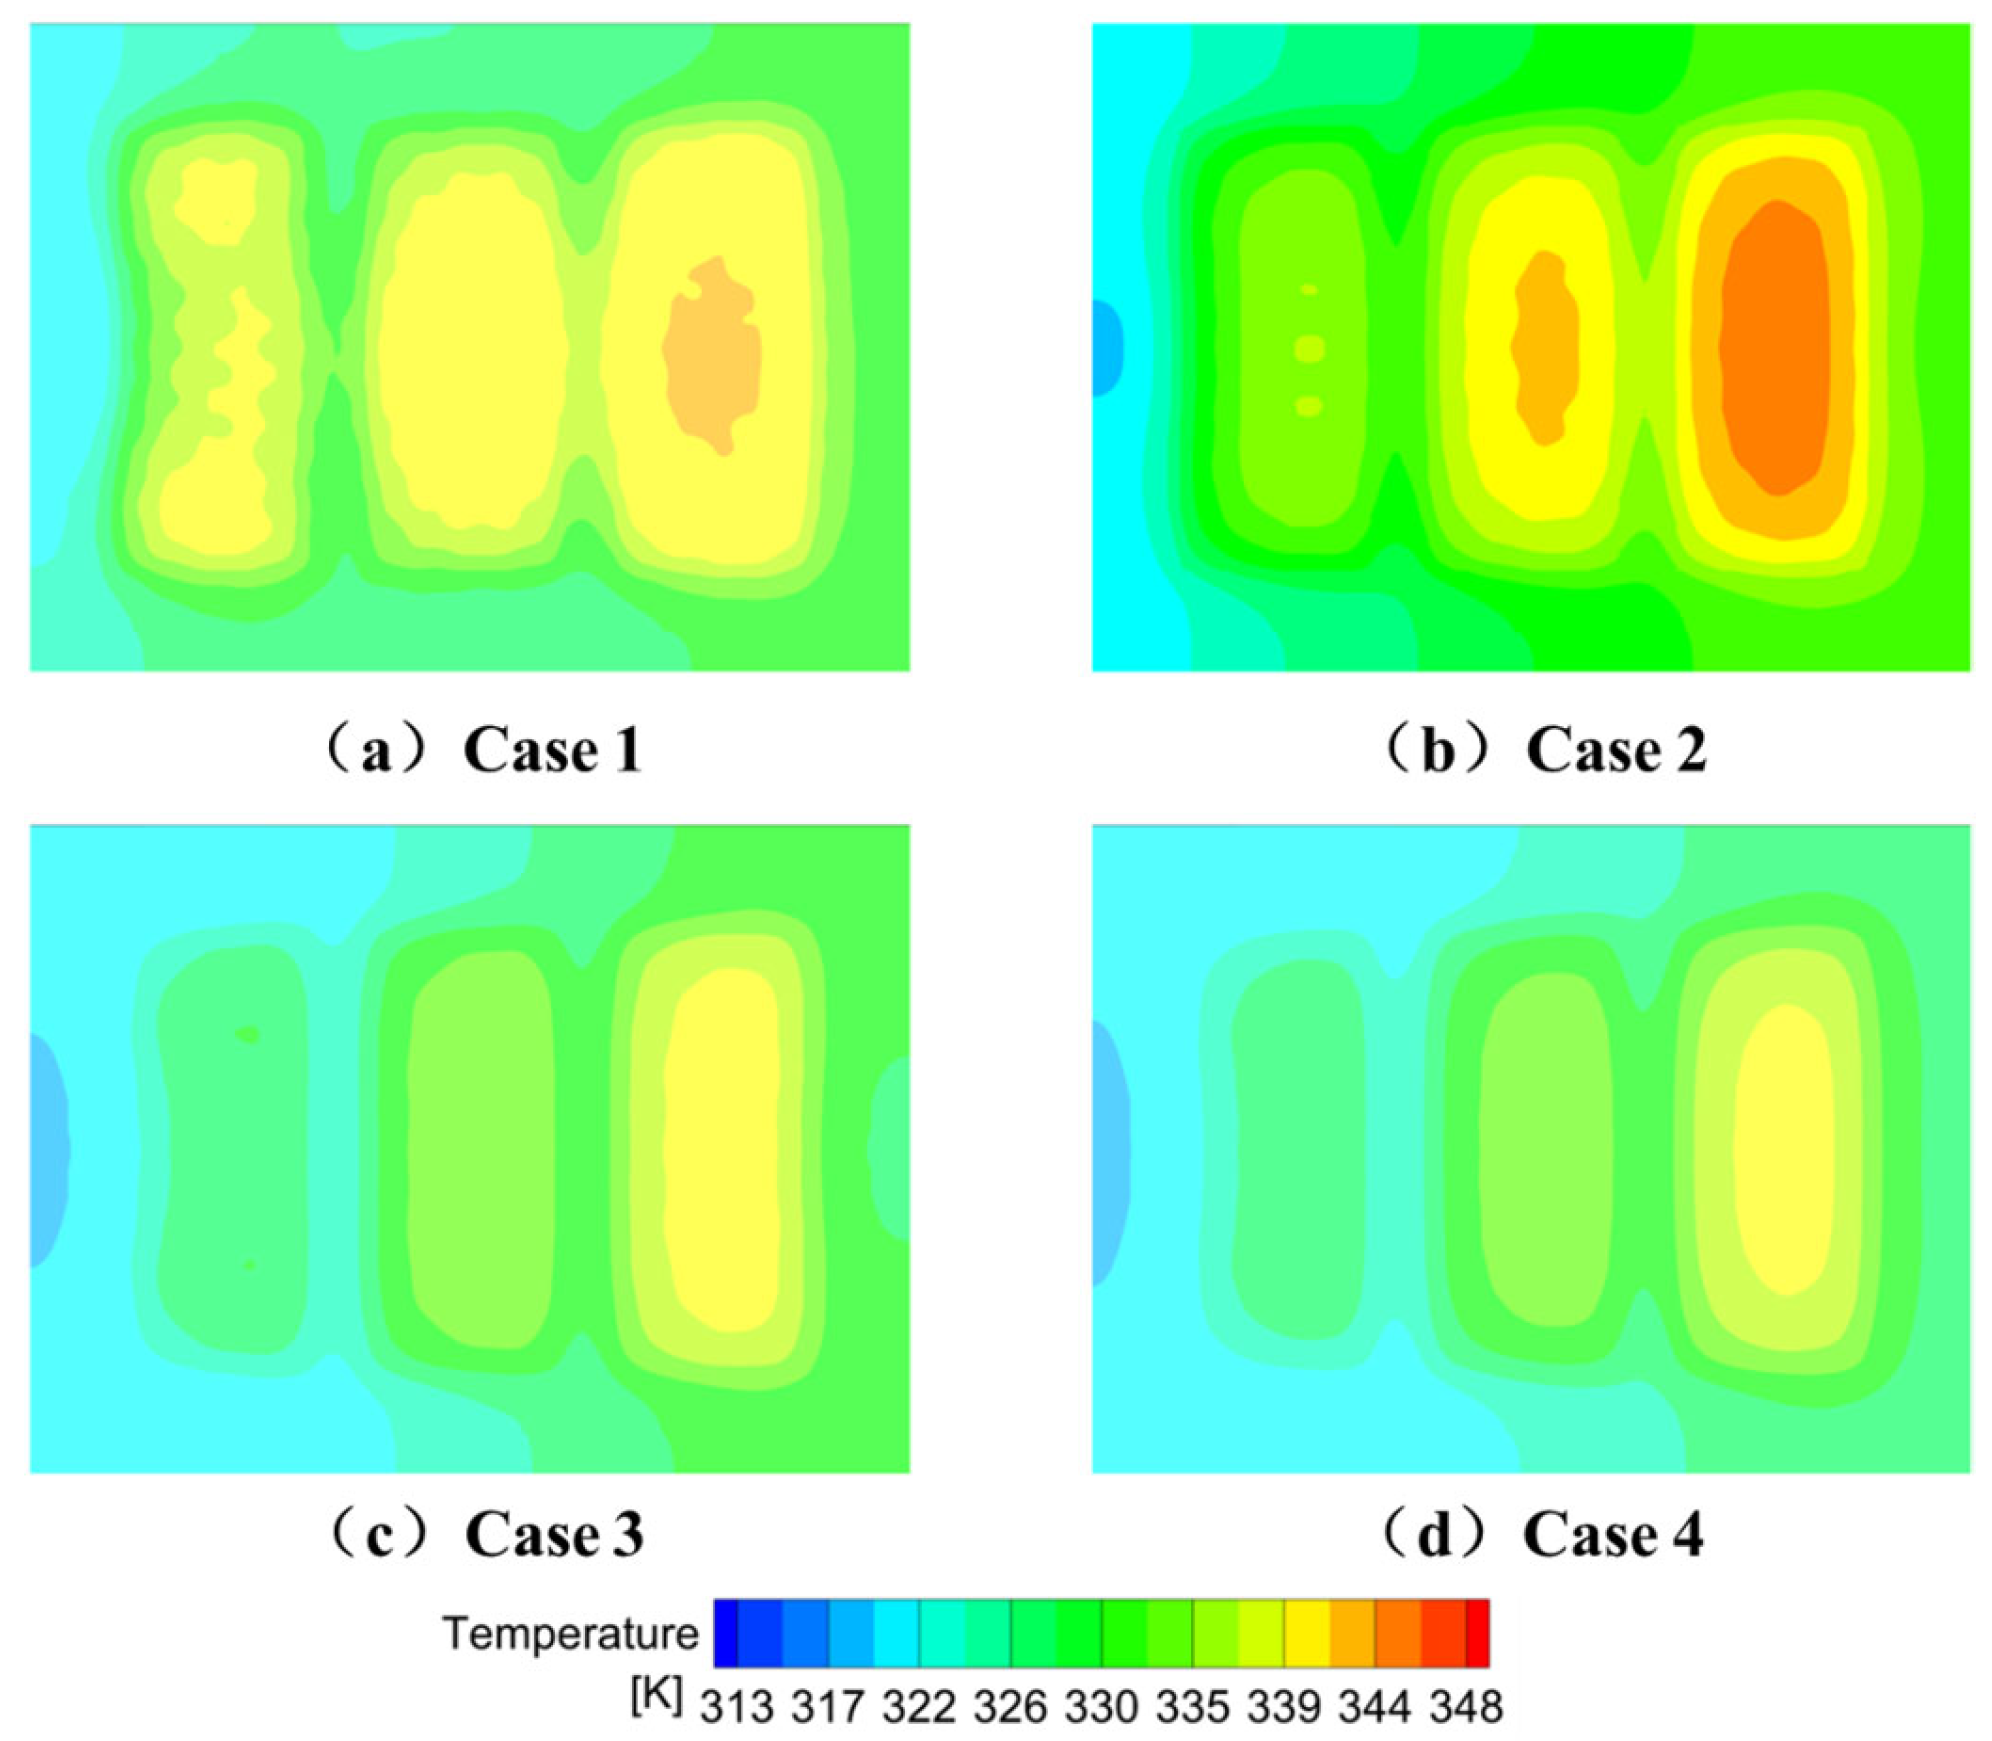
Figure 13 presents the temperature contours of the cooling plate surface. While Case 1 shows relatively better heat dissipation near the outlet compared to Case 2, it offers limited improvement for IGBT modules near the inlet. In contrast, both Case 3 and Case 4 exhibit lower overall temperatures and improved thermal uniformity, suggesting that the combination of large honeycomb-structured cells and narrow channels is effective in enhancing cooling performance.
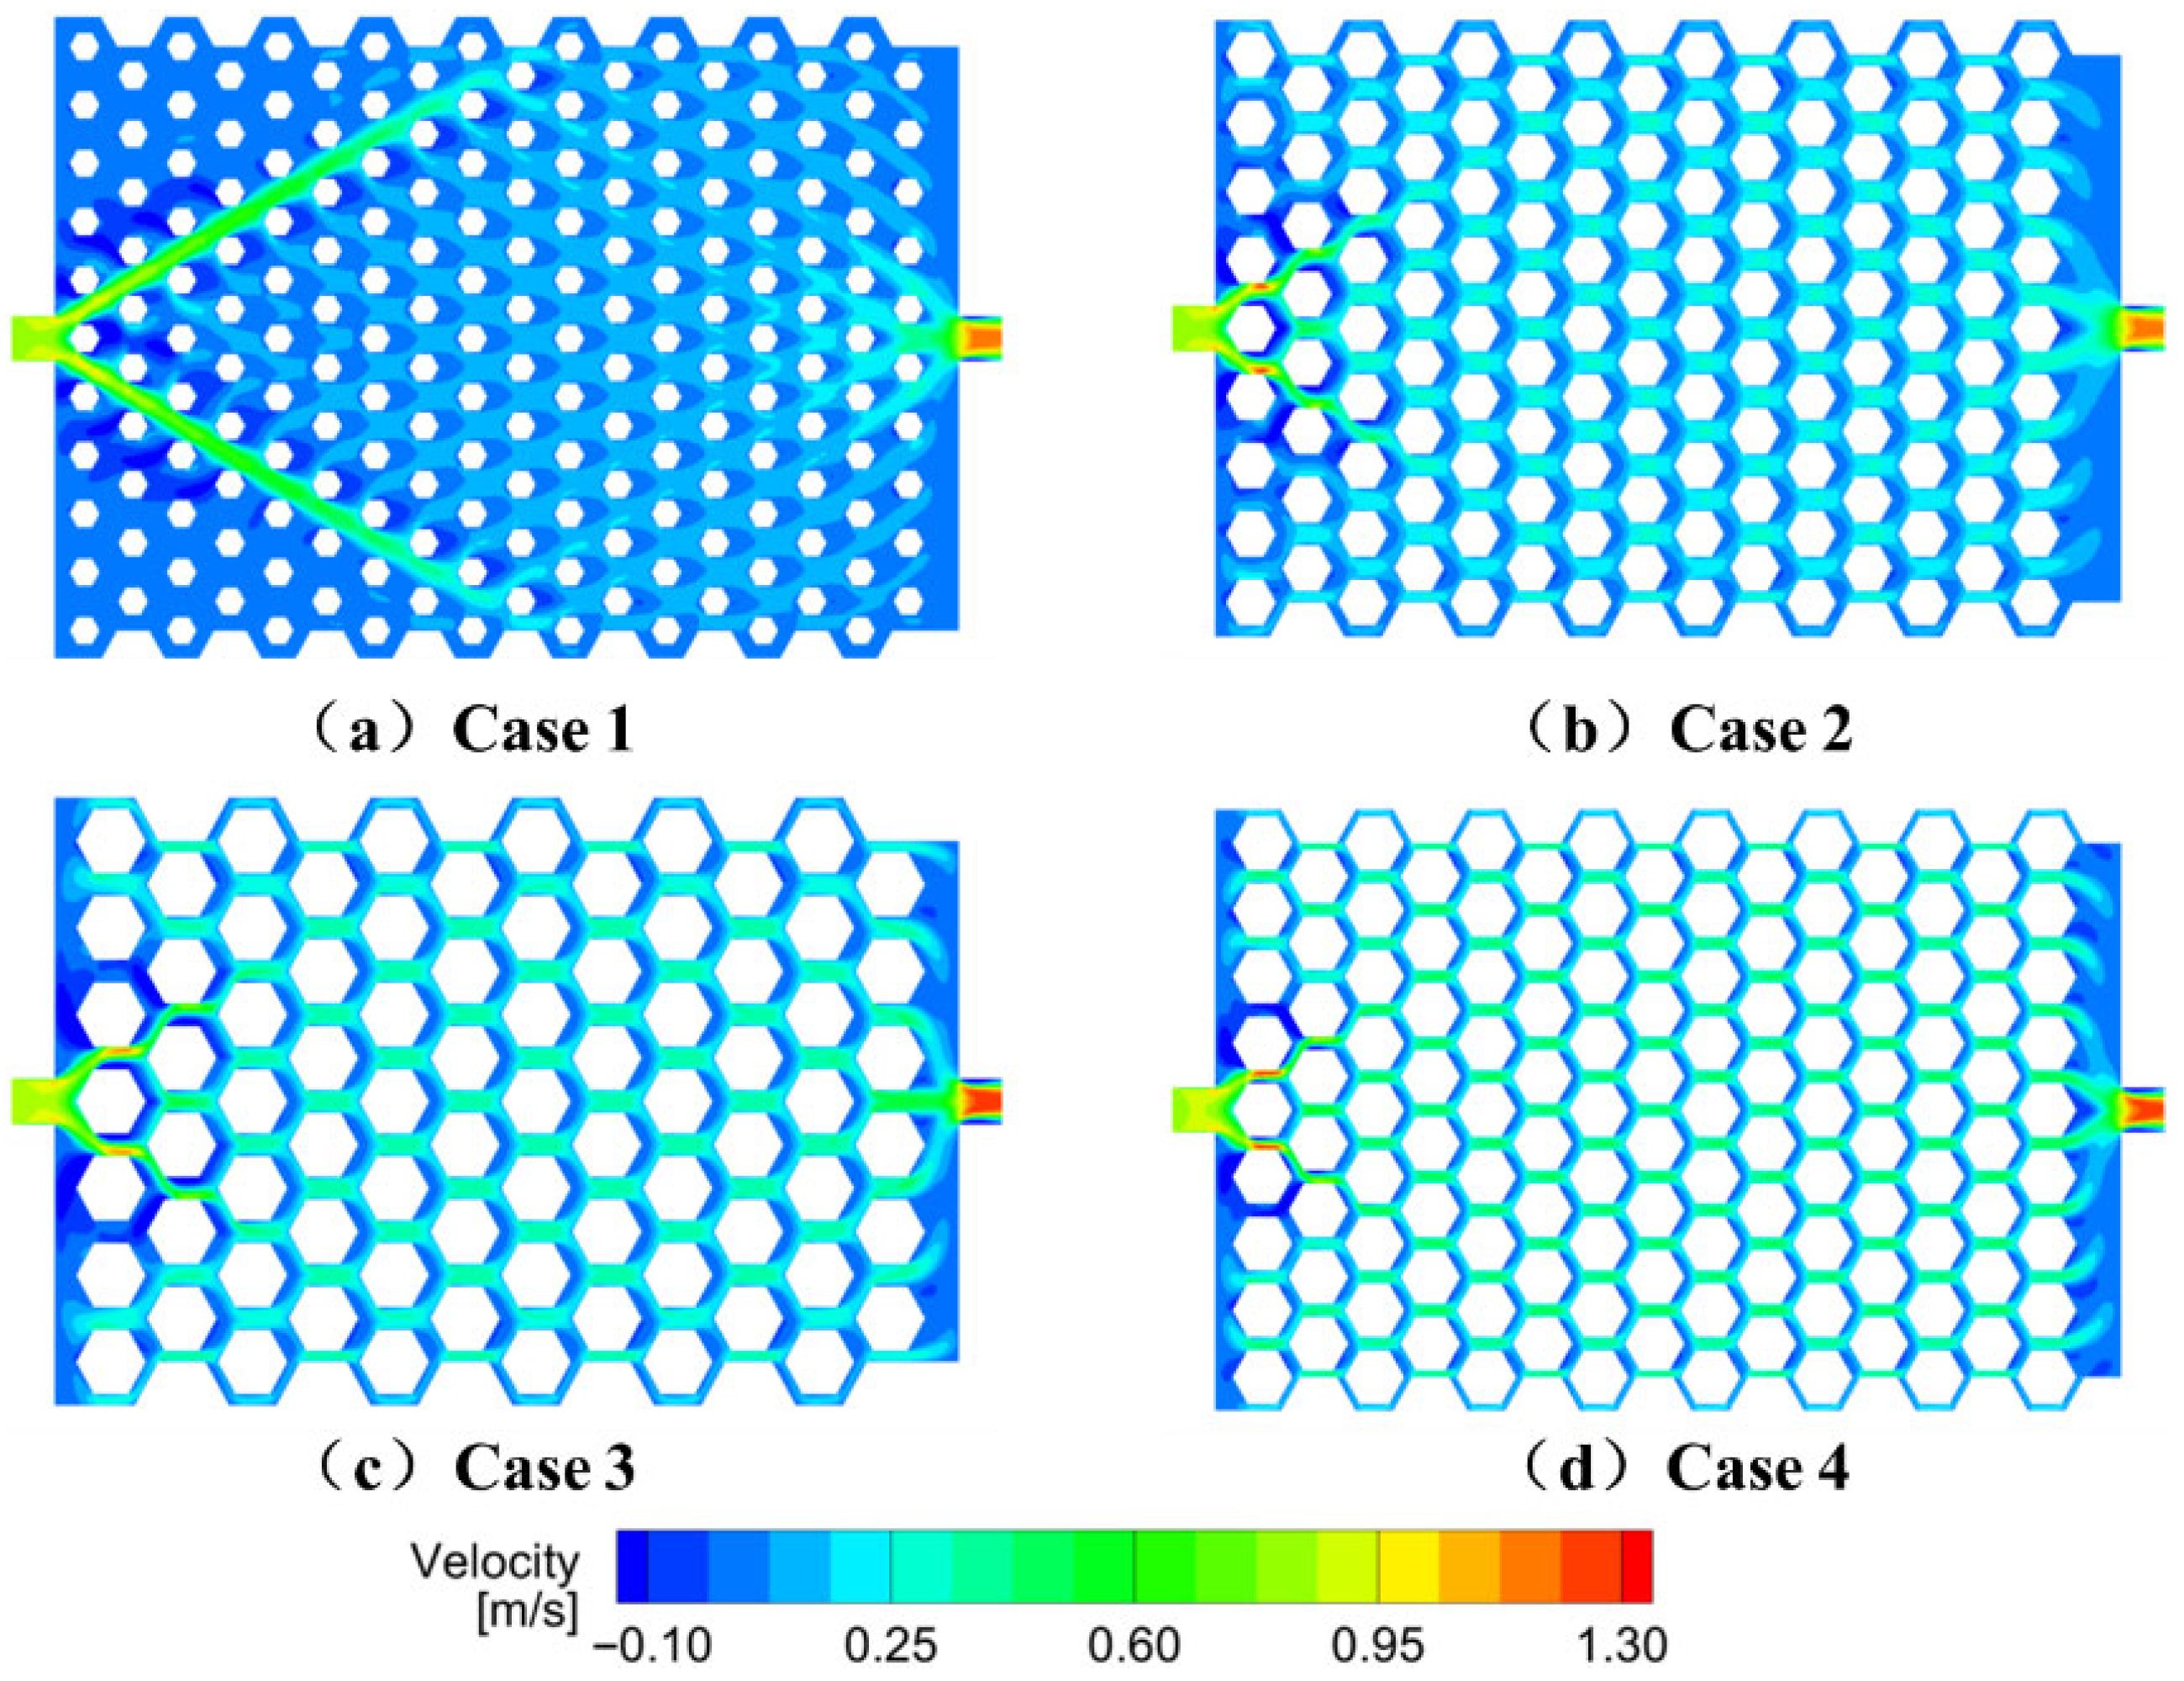
Figure 14 shows the velocity distribution for each configuration. As the channel narrows, the coolant velocity increases significantly. Cases 3 and 4 demonstrate favorable flow characteristics in both central and peripheral channels, with improved velocity uniformity and reduced flow separation in regions of geometric transition. The larger honey-comb structures reduce flow obstruction due to fewer posts, helping suppress vortex formation. Although all designs exhibit some flow stagnation at the inlet and outlet regions, Case 3 and Case 4 show significantly smaller recirculation zones. In contrast, Case 1 dis-plays a pronounced backflow region near the inlet, leading to uneven coolant distribution and reduced cooling efficiency.
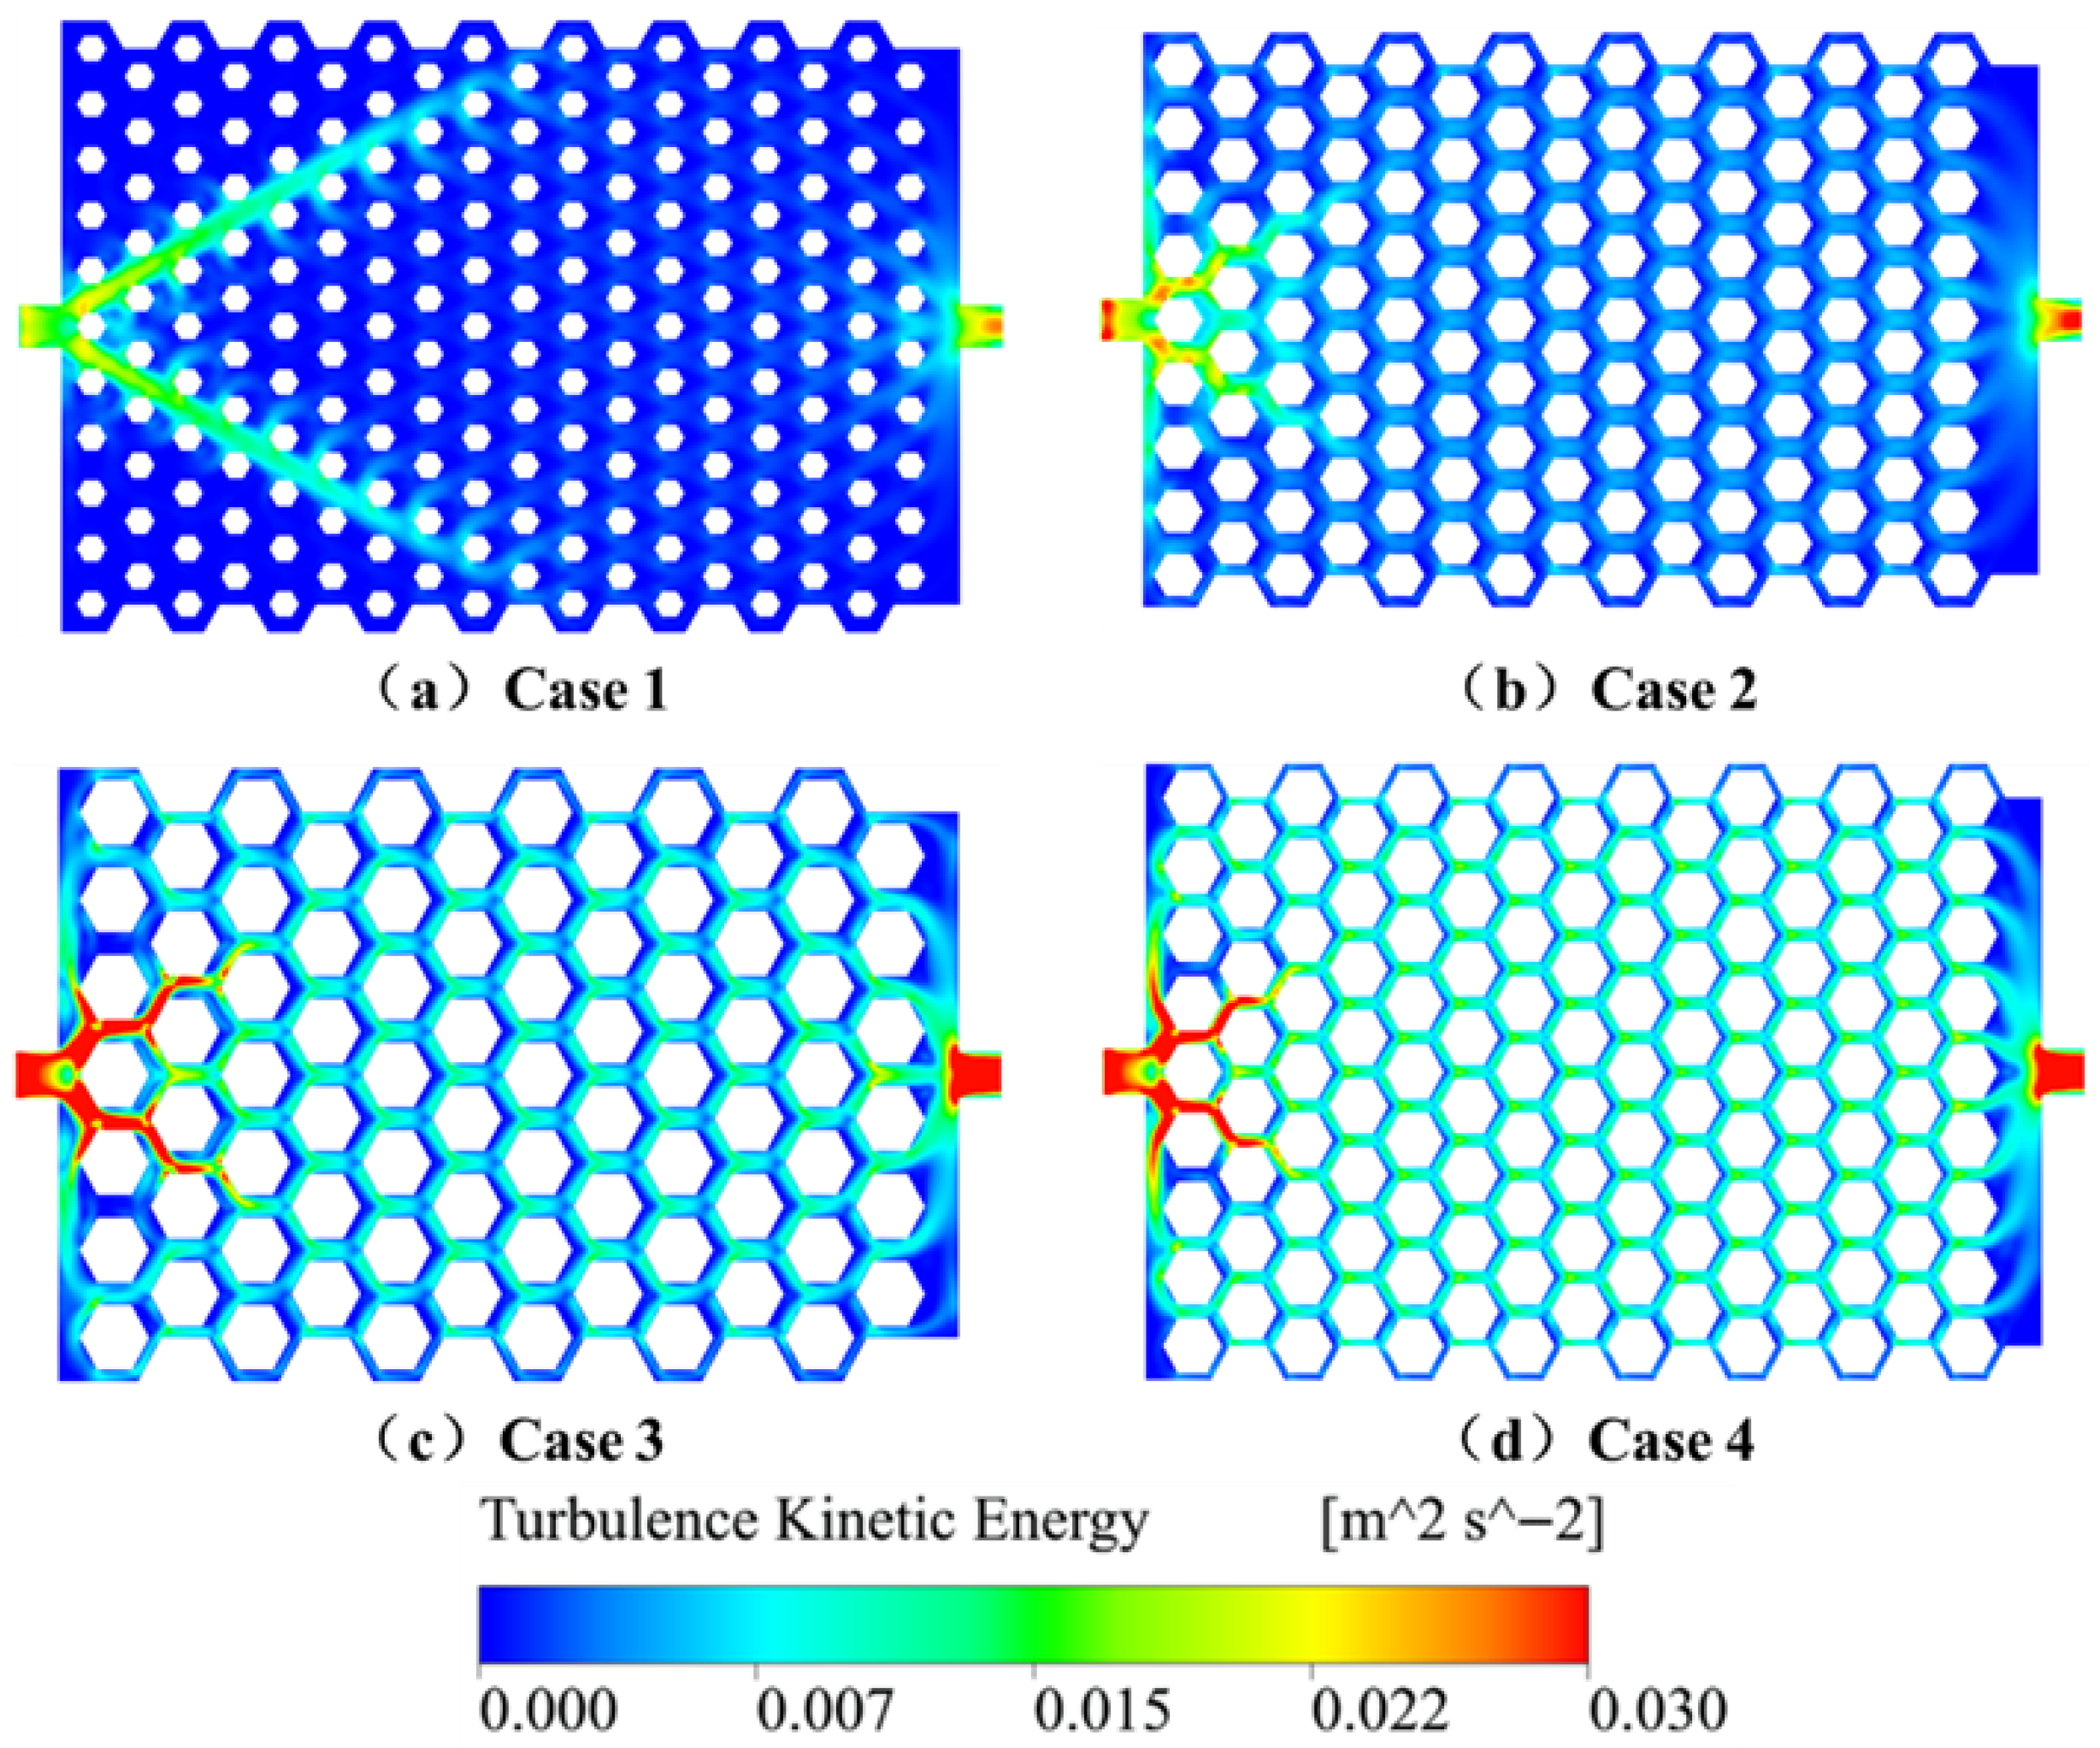
Figure 15 illustrates the TKE distribution across the different cases. In Case 1, TKE is predominantly concentrated near the inlet, with weak turbulence downstream, resulting in poor coolant mixing and local heat accumulation. Case 2 offers more balanced TKE distribution but with limited intensity, which restricts thermal diffusion. In comparison, Cases 3 and 4 exhibit significantly stronger and more widespread turbulence, particularly in Case 4, where intense mixing occurs near the inlet and in transverse channels. This leads to more efficient fluid mixing and heat transport, producing a more uniform temperature field. These results confirm that combining large honeycomb-structured units with narrow flow channels enhances turbulence intensity and heat transfer uniformity, although the associated increase in pressure drop must be carefully considered in practical designs.
3.3. Effect of Inlet and Outlet Arrangement on Thermal and Flow Performance
The inlet and outlet configuration of a liquid-cooled plate plays a crucial role in determining both the coolant flow distribution and overall thermal performance. Conventional single-inlet and single-outlet designs often suffer from abrupt changes in flow cross-section, leading to excessively high or low local flow velocities. This results in the formation of high-turbulence regions and stagnant zones, which negatively impact heat dissipation efficiency. To improve flow uniformity and temperature distribution, four symmetric inlet/outlet configurations were investigated in this study: single-inlet/single-outlet (1in_1out), dual-inlet/single-outlet (2in_1out), dual-inlet/dual-outlet (2in_2out), and triple-inlet/triple-outlet (3in_3out). The total mass flow rate was kept constant across all configurations to ensure a fair comparison.
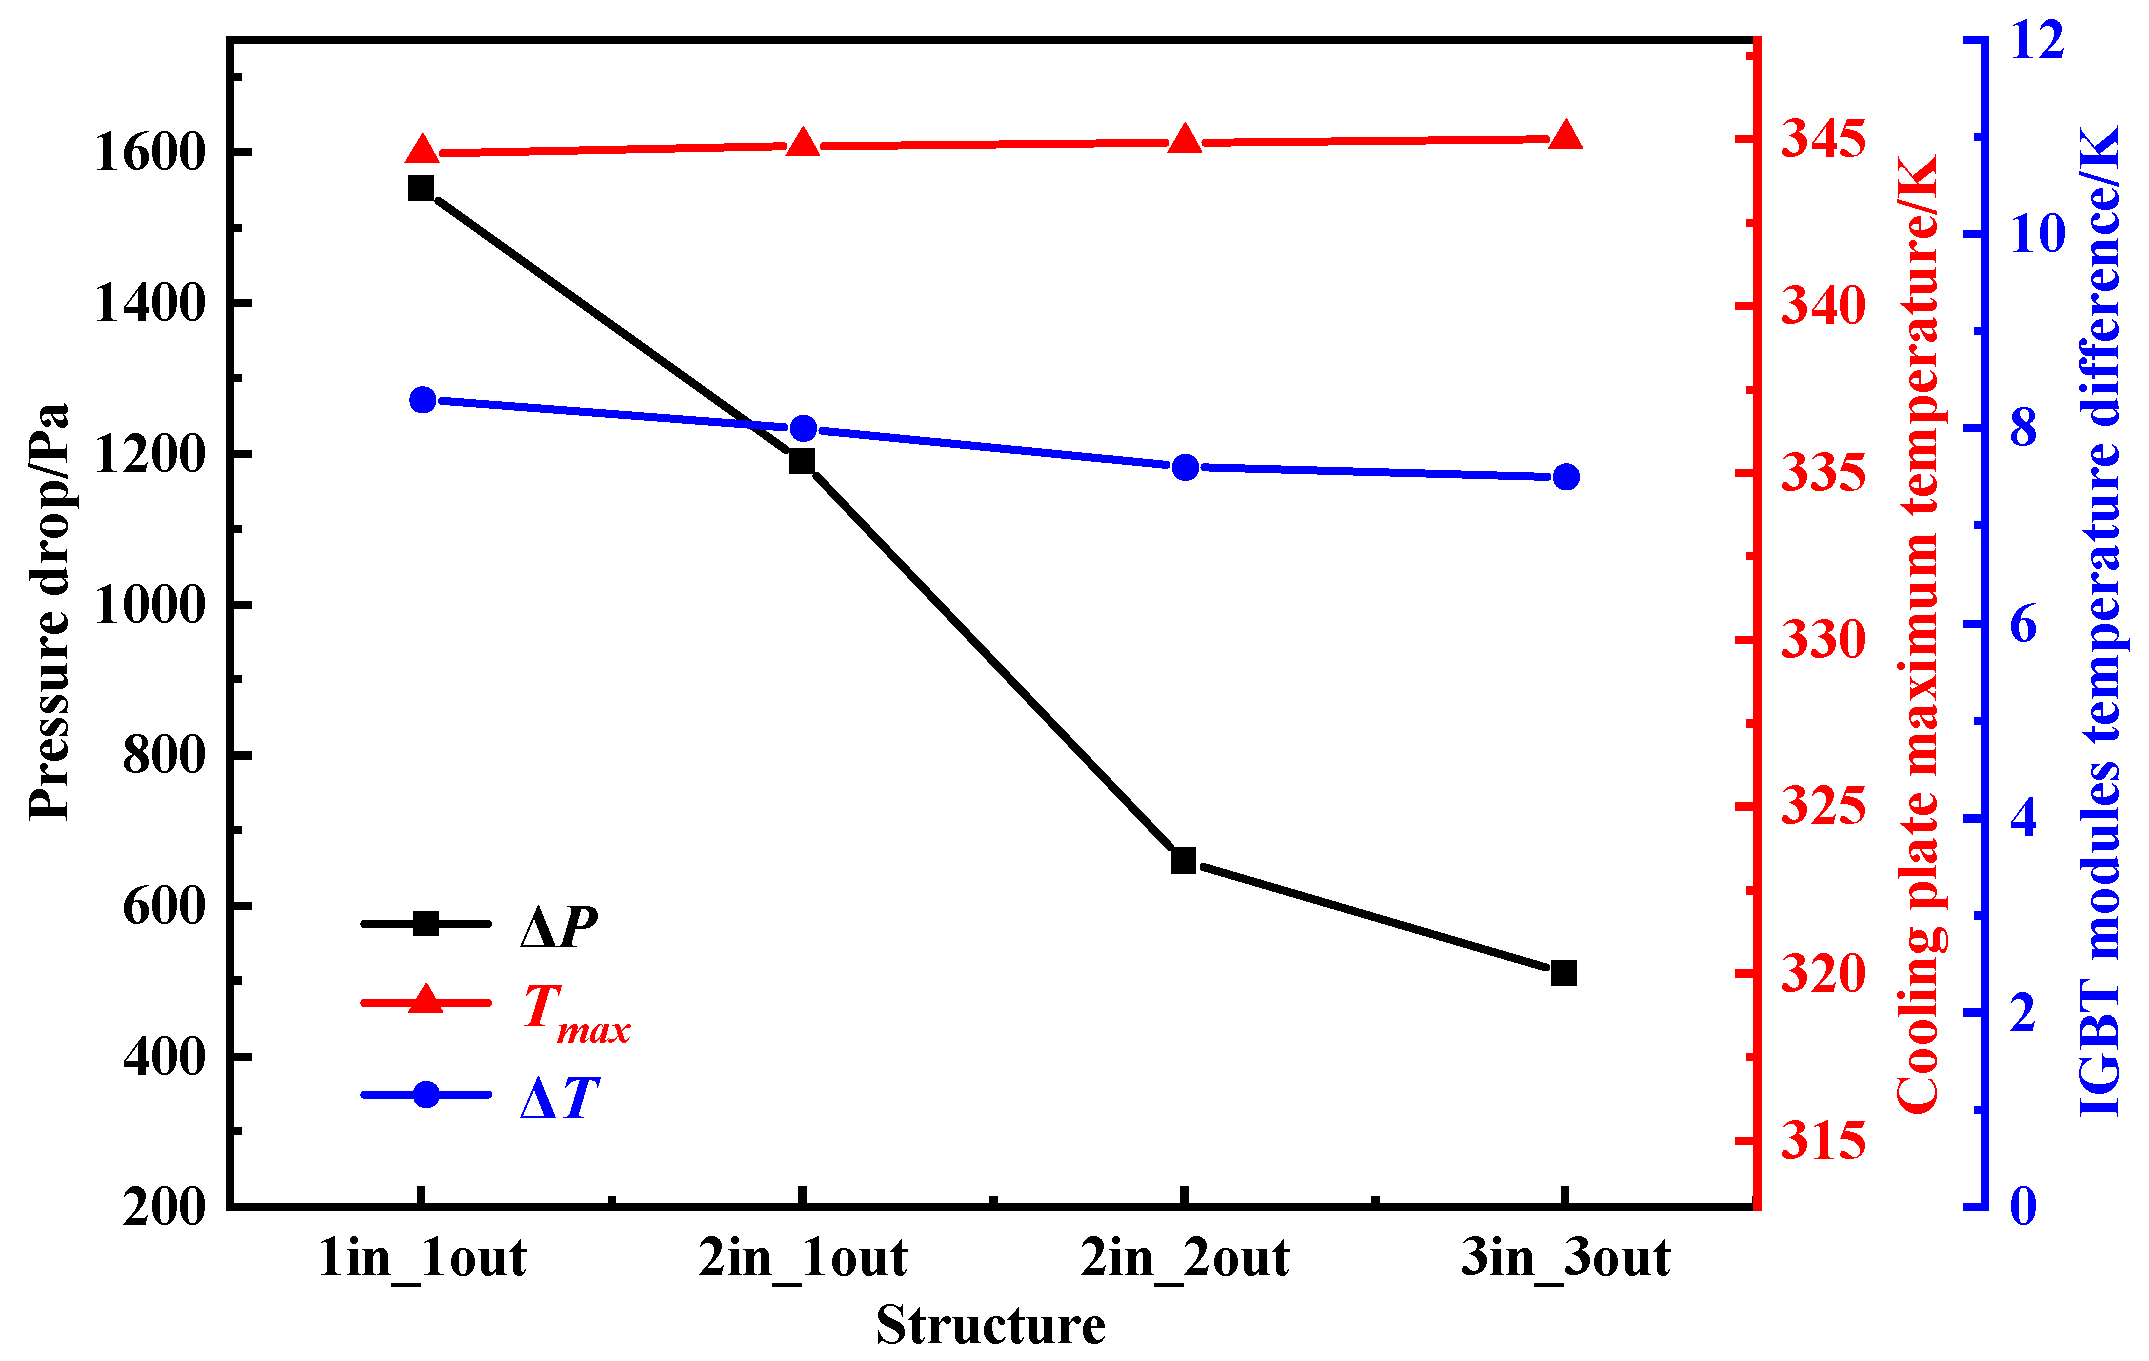
Figure 16 presents the variations in key thermal and hydraulic performance metrics—including pressure drop, maximum temperature, and temperature difference—under different inlet/outlet arrangements. As the number of inlets and outlets increases, the system pressure drop decreases significantly: from approximately 1600 Pa in the 1-in-1-out case to about 400 Pa in the 3in_3out configuration. This clearly demonstrates the ability of multi-inlet/multi-outlet designs to reduce flow resistance. Meanwhile,
Tmax increases only slightly (from 344.6 K to 345.1 K), indicating that the effect of inlet/outlet design on peak temperature is minimal. The temperature difference Δ
T shows a slight downward trend, dropping from 8.7 K to 8.5 K, suggesting improved temperature uniformity across the cooling plate. Overall, increasing the number of inlets and outlets is beneficial in reducing both pressure drop and temperature gradients, while exerting limited influence on maximum temperature. These results support the design strategy of optimizing inlet/outlet configurations to enhance the overall cooling efficiency of liquid-cooled systems.
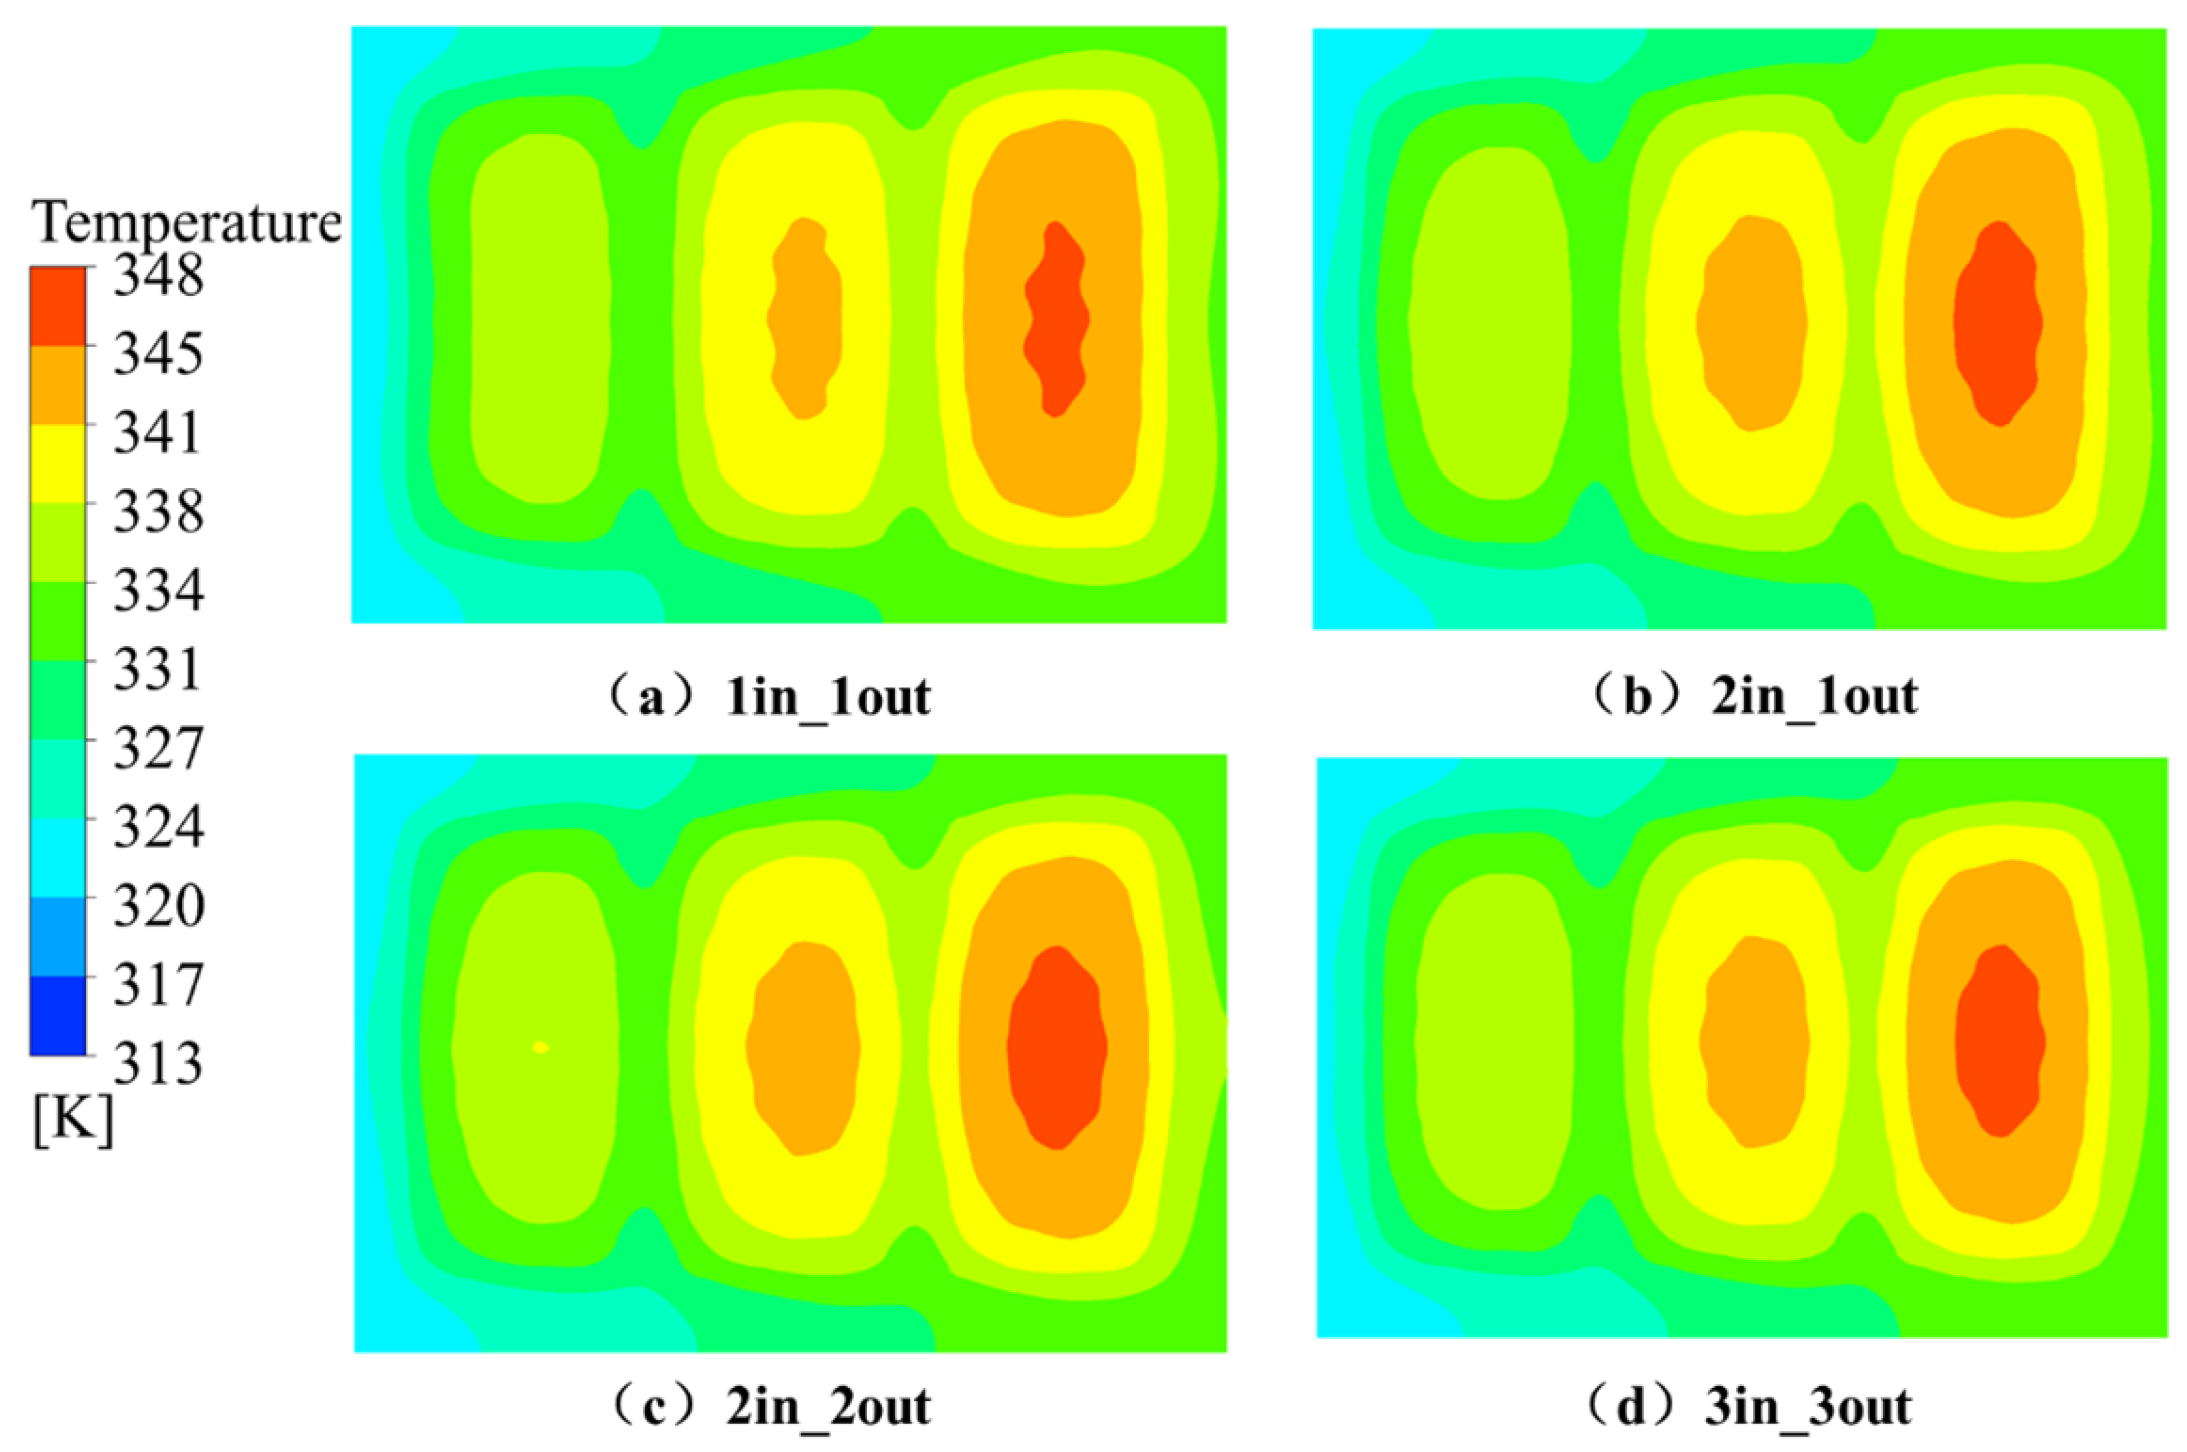
Figure 17 illustrates the steady-state temperature distribution on the top surface of the cooling plate for different inlet/outlet arrangements. It can be observed that while the area of high-temperature zones slightly increases with more inlets and outlets, the overall temperature field becomes more uniform. This indicates that a multi-inlet/multi-outlet layout helps alleviate local hot spots and improves thermal consistency.
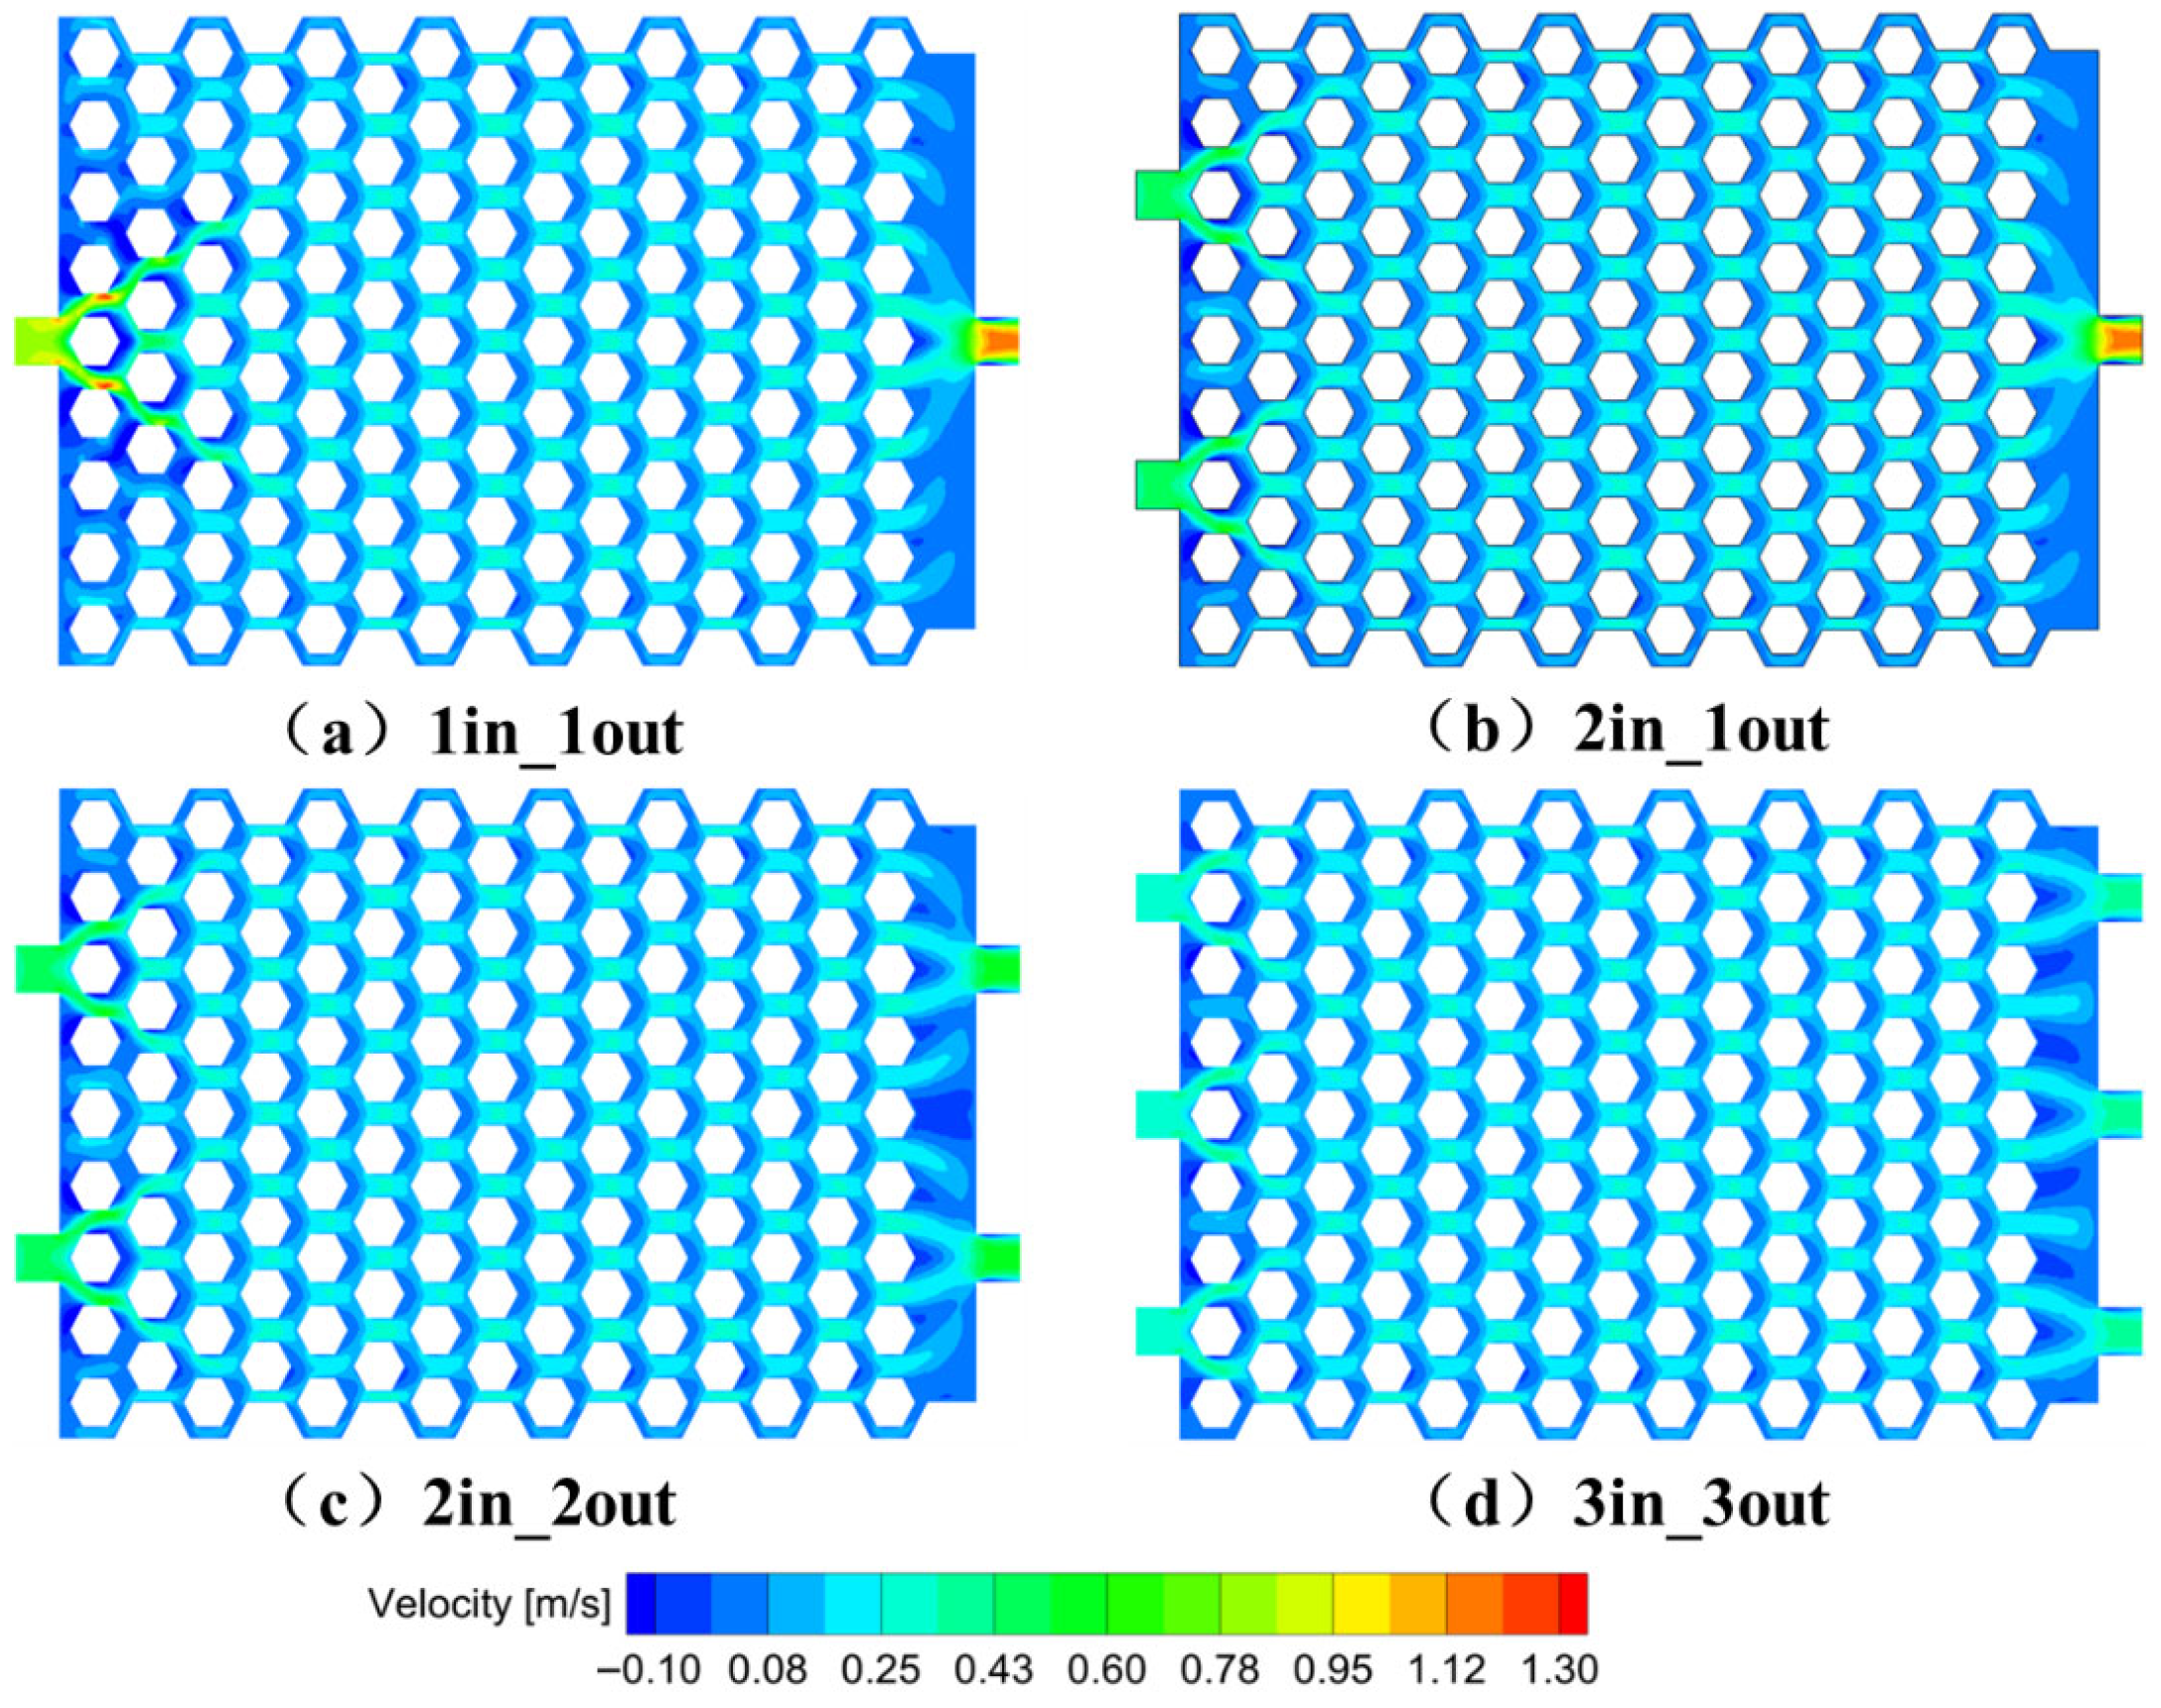
Figure 18 shows the corresponding velocity distributions inside the cooling plate. Compared with the 1in_1out structure, the 2in_1out configuration achieves better overall flow uniformity, albeit with a slightly lower peak velocity. The 2in_2out and 3in_3out cases show similar flow patterns, both offering well-distributed velocity fields. This behavior is consistent with the observed thermal distributions, confirming that improved flow uniformity contributes directly to enhanced thermal uniformity.
3.4. Effect of Coolant Mass Flow Rate on Thermal and Flow Performance
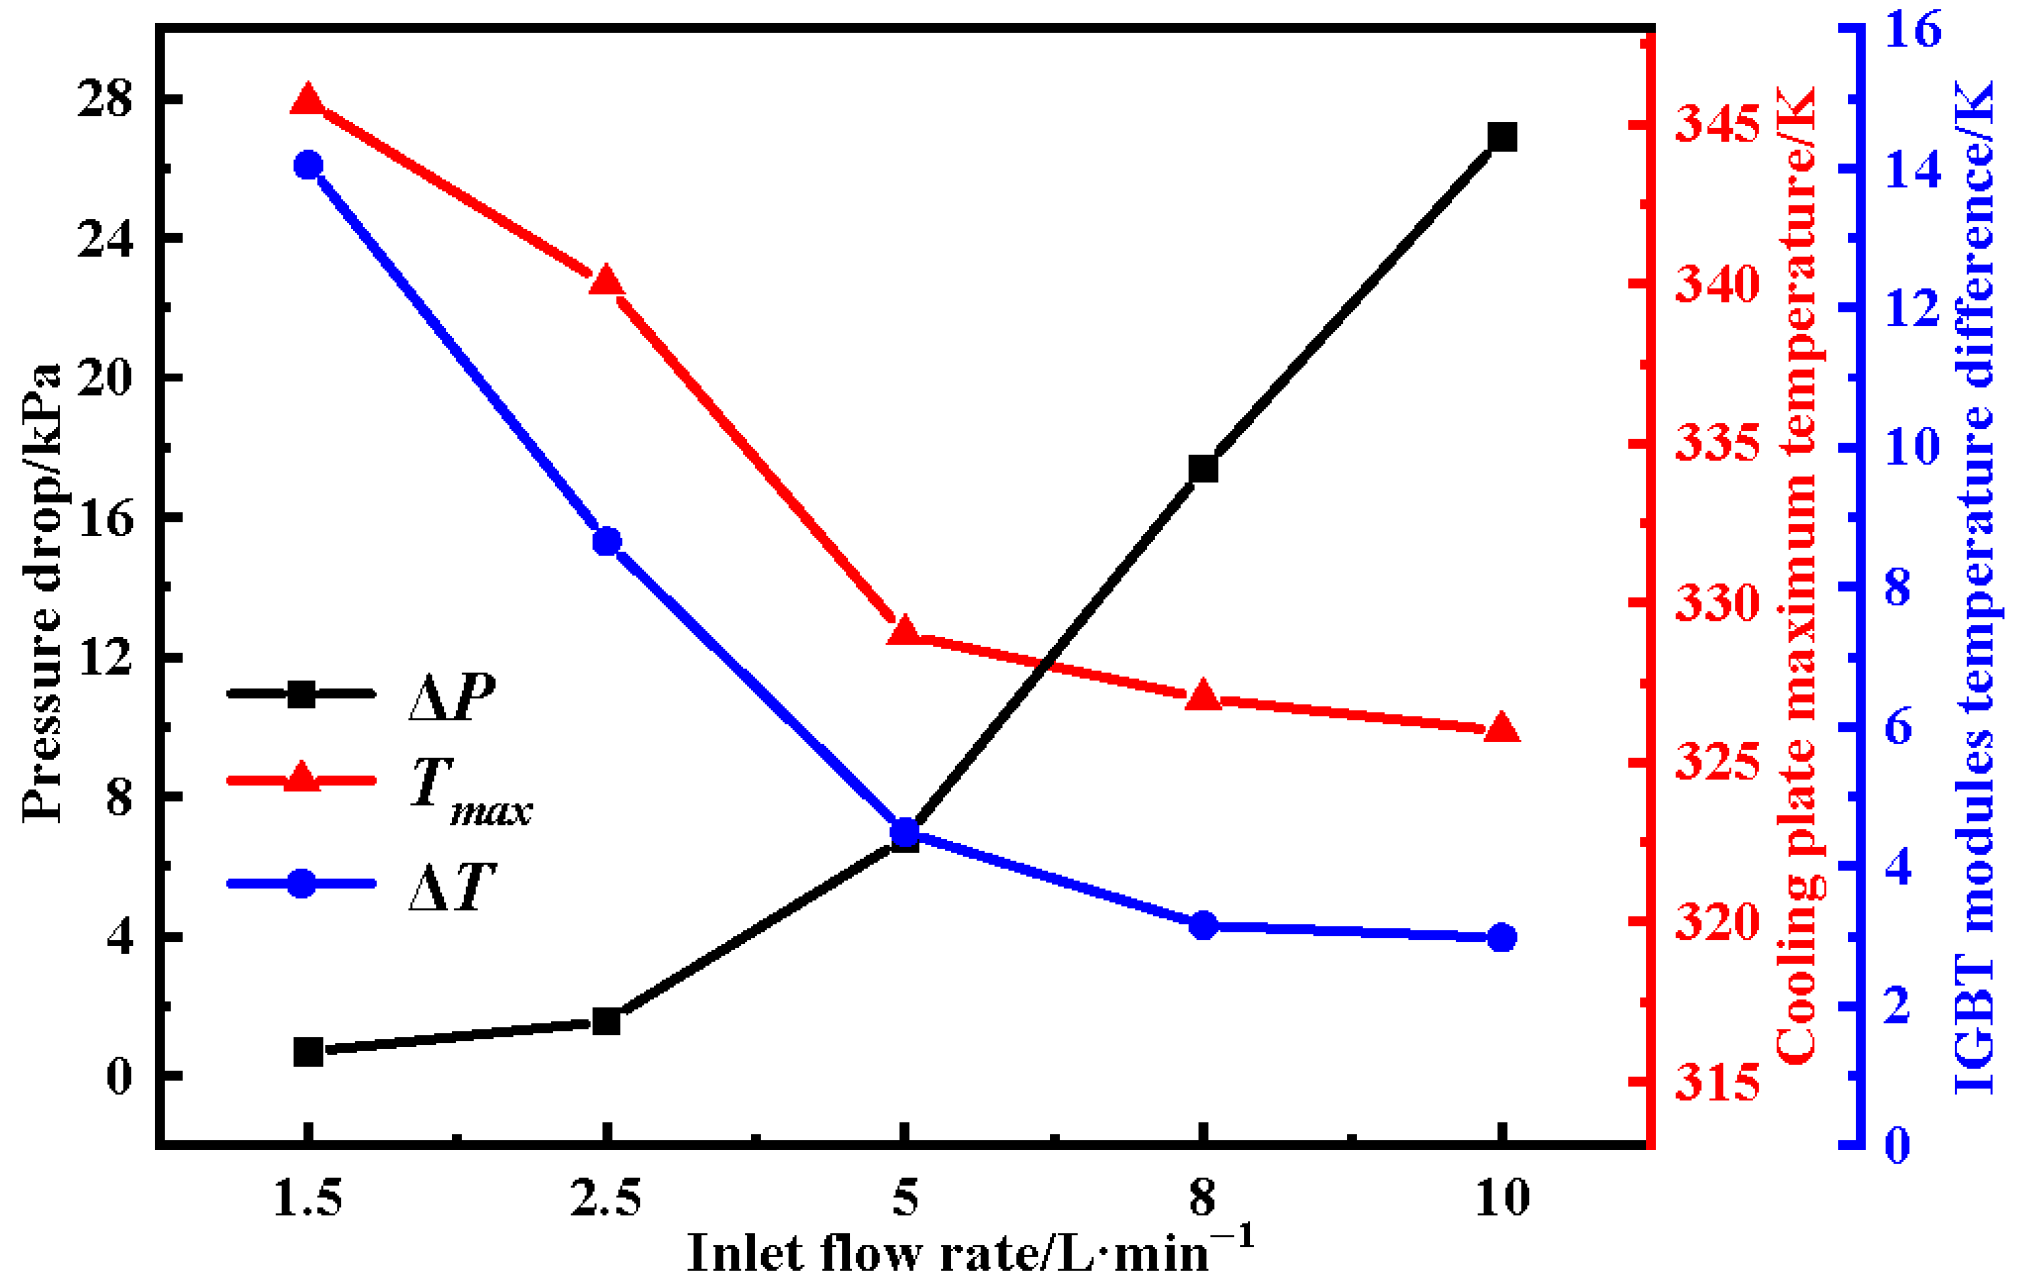
The coolant mass flow rate plays a vital role in determining the overall thermal and hydraulic performance of a liquid-cooled plate. At low flow rates, insufficient heat removal may occur, leading to elevated peak temperatures and reduced cooling uniformity. Conversely, excessively high flow rates can result in significantly increased pressure drops and pumping power consumption, without proportionate enhancement in heat dissipation performance. To investigate this trade-off, five different flow rates ranging from 1.5 L/min to 10 L/min were studied under the same inlet/outlet configuration. The impact of coolant flow rate on temperature distribution, pressure drop, and flow uniformity was analyzed to identify the optimal operating condition that balances thermal performance and energy efficiency.
Figure 19 illustrates the variation in pressure drop, maximum IGBT module temperature, and temperature difference across the module array under different flow rates. As the flow rate increases from 1.5 L/min to 10 L/min, the maximum temperature of the IGBT modules drops significantly—from 345.7 K to 326 K. Similarly, the temperature difference decreases from 14 K to 3 K, indicating enhanced cooling uniformity. However, this improvement comes at the cost of a rapidly rising pressure drop, which increases exponentially from 670 Pa to 26,900 Pa. These results suggest that while higher flow rates enhance thermal performance, the associated increase in pumping power must be carefully considered in thermal system design.
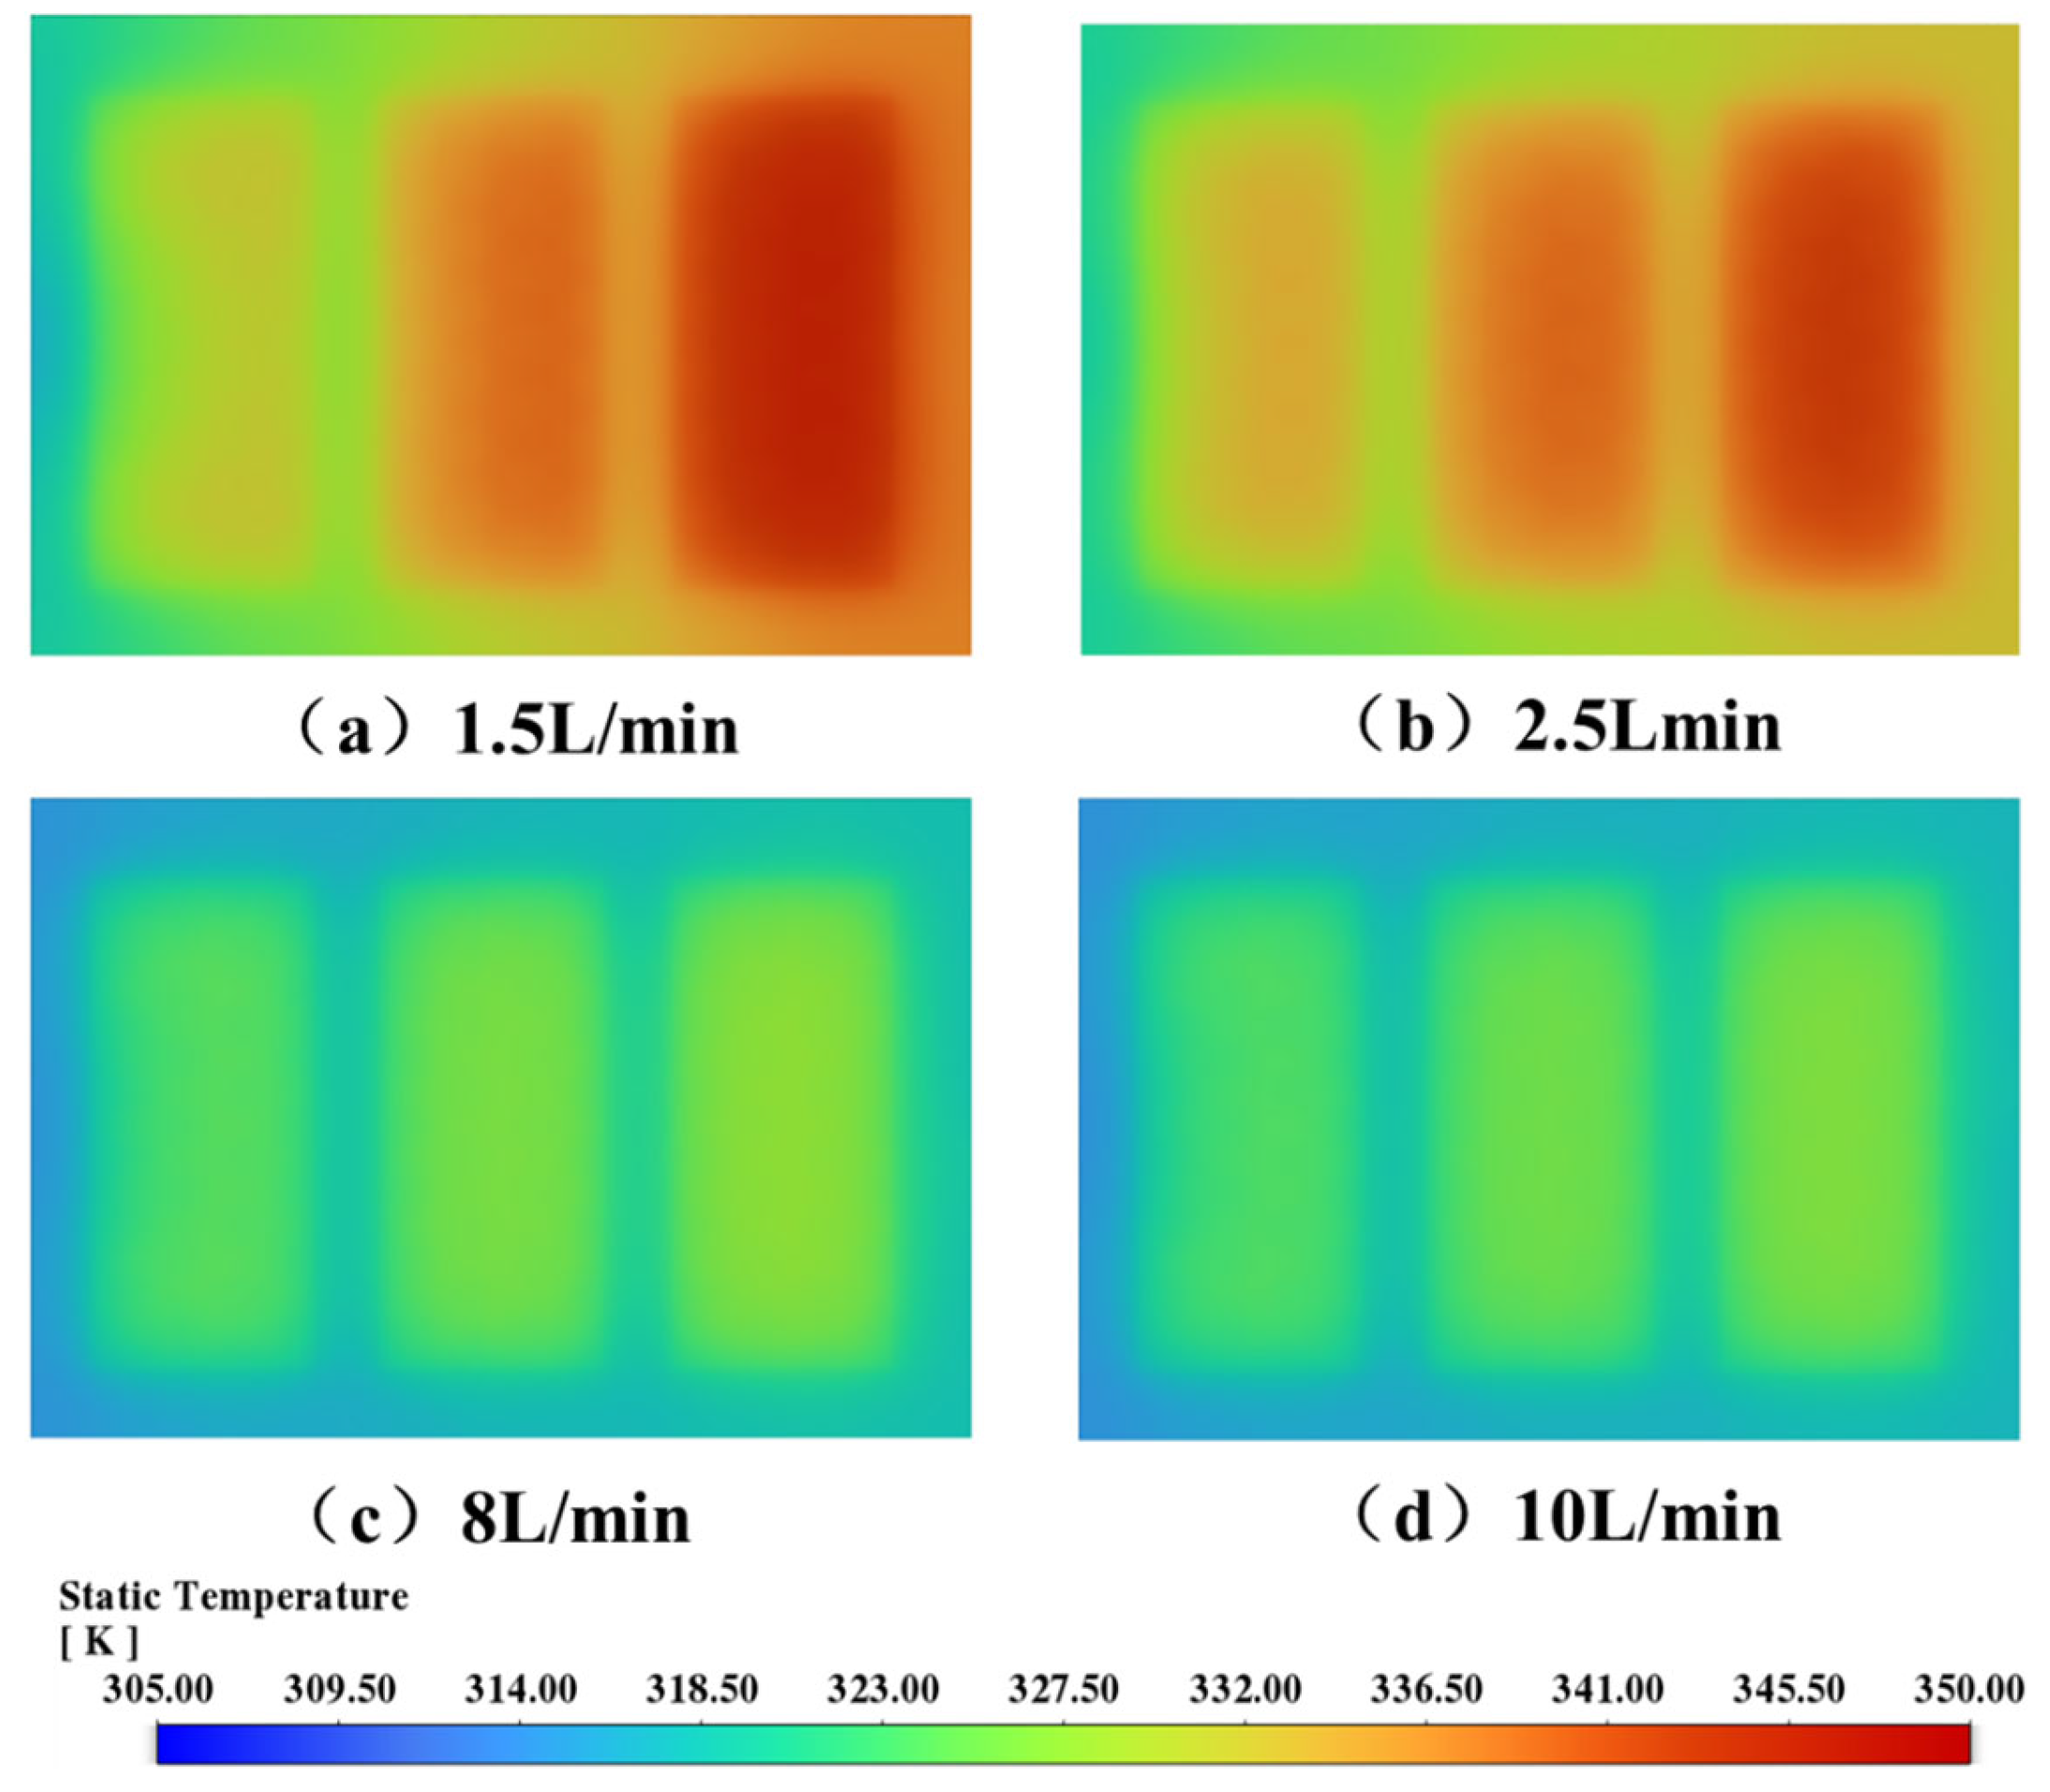
Figure 20 presents the temperature distributions on the top surface of the cooling plate under various coolant flow rates. At a low flow rate of 1.5 L/min, significant hot spots are observed, particularly in the central and right regions of the cooling plate, indicating poor heat dispersion. When the flow rate is increased to 2.5 L/min, the high-temperature zones are partially alleviated, although thermal accumulation remains evident. At higher flow rates of 8 L/min and 10 L/min, the temperature field becomes more uniform and hot spots are virtually eliminated, demonstrating the effectiveness of increased flow rates in improving cooling performance. In general, increasing the coolant flow rate helps enhance thermal uniformity and reduce peak temperatures, but must be optimized against the cost of higher pressure drop and energy consumption.
3.5. Effect of Coolant Inlet Temperature on Thermal and Flow Performance
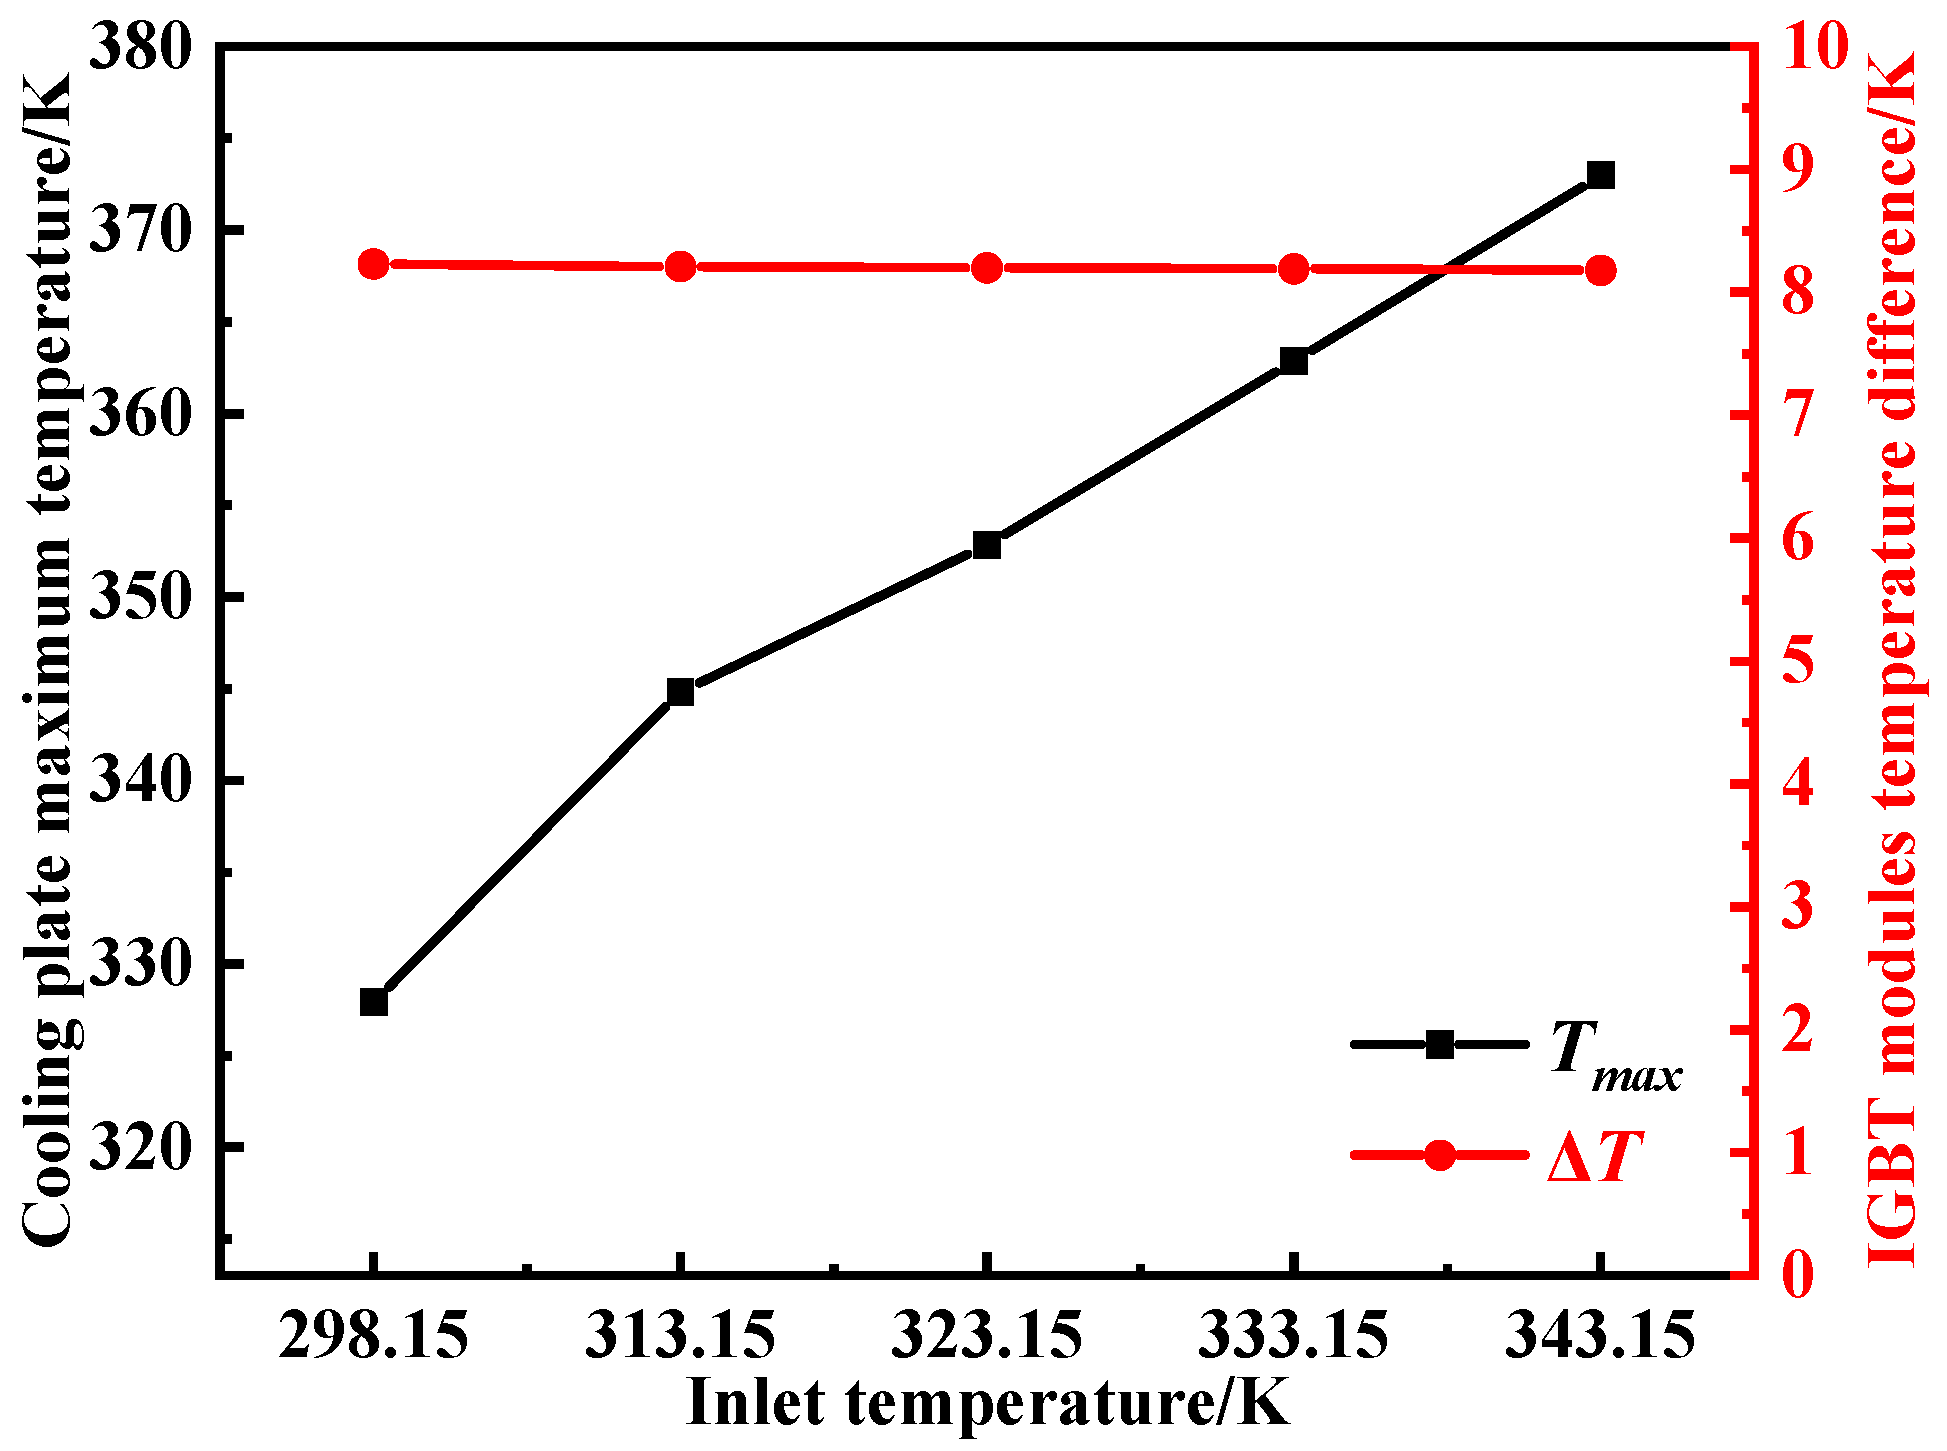
The inlet temperature of the coolant is a critical parameter influencing the overall heat dissipation capability of liquid cooling systems. To systematically investigate the impact of coolant inlet temperature on the thermal-hydraulic performance of the cooling plate, five representative inlet temperatures ranging from 298.15 K to 343.15 K were selected for comparative analysis under otherwise identical operating conditions. The analysis focuses on the variation in maximum module temperature, temperature difference, and pressure drop, aiming to provide theoretical guidance for coolant temperature control strategies in practical thermal management applications.
From
Figure 21, it can be observed that as the inlet coolant temperature increases, the maximum cooling plate temperature rises almost linearly, increasing from 328 K to 373 K when the coolant temperature changes from 298.15 K to 343.15 K. In contrast, the inter-module temperature difference decreases slightly from 8.23 K to 8.18 K, a relative change of only about 0.6%, indicating that the thermal uniformity remains essentially unchanged.
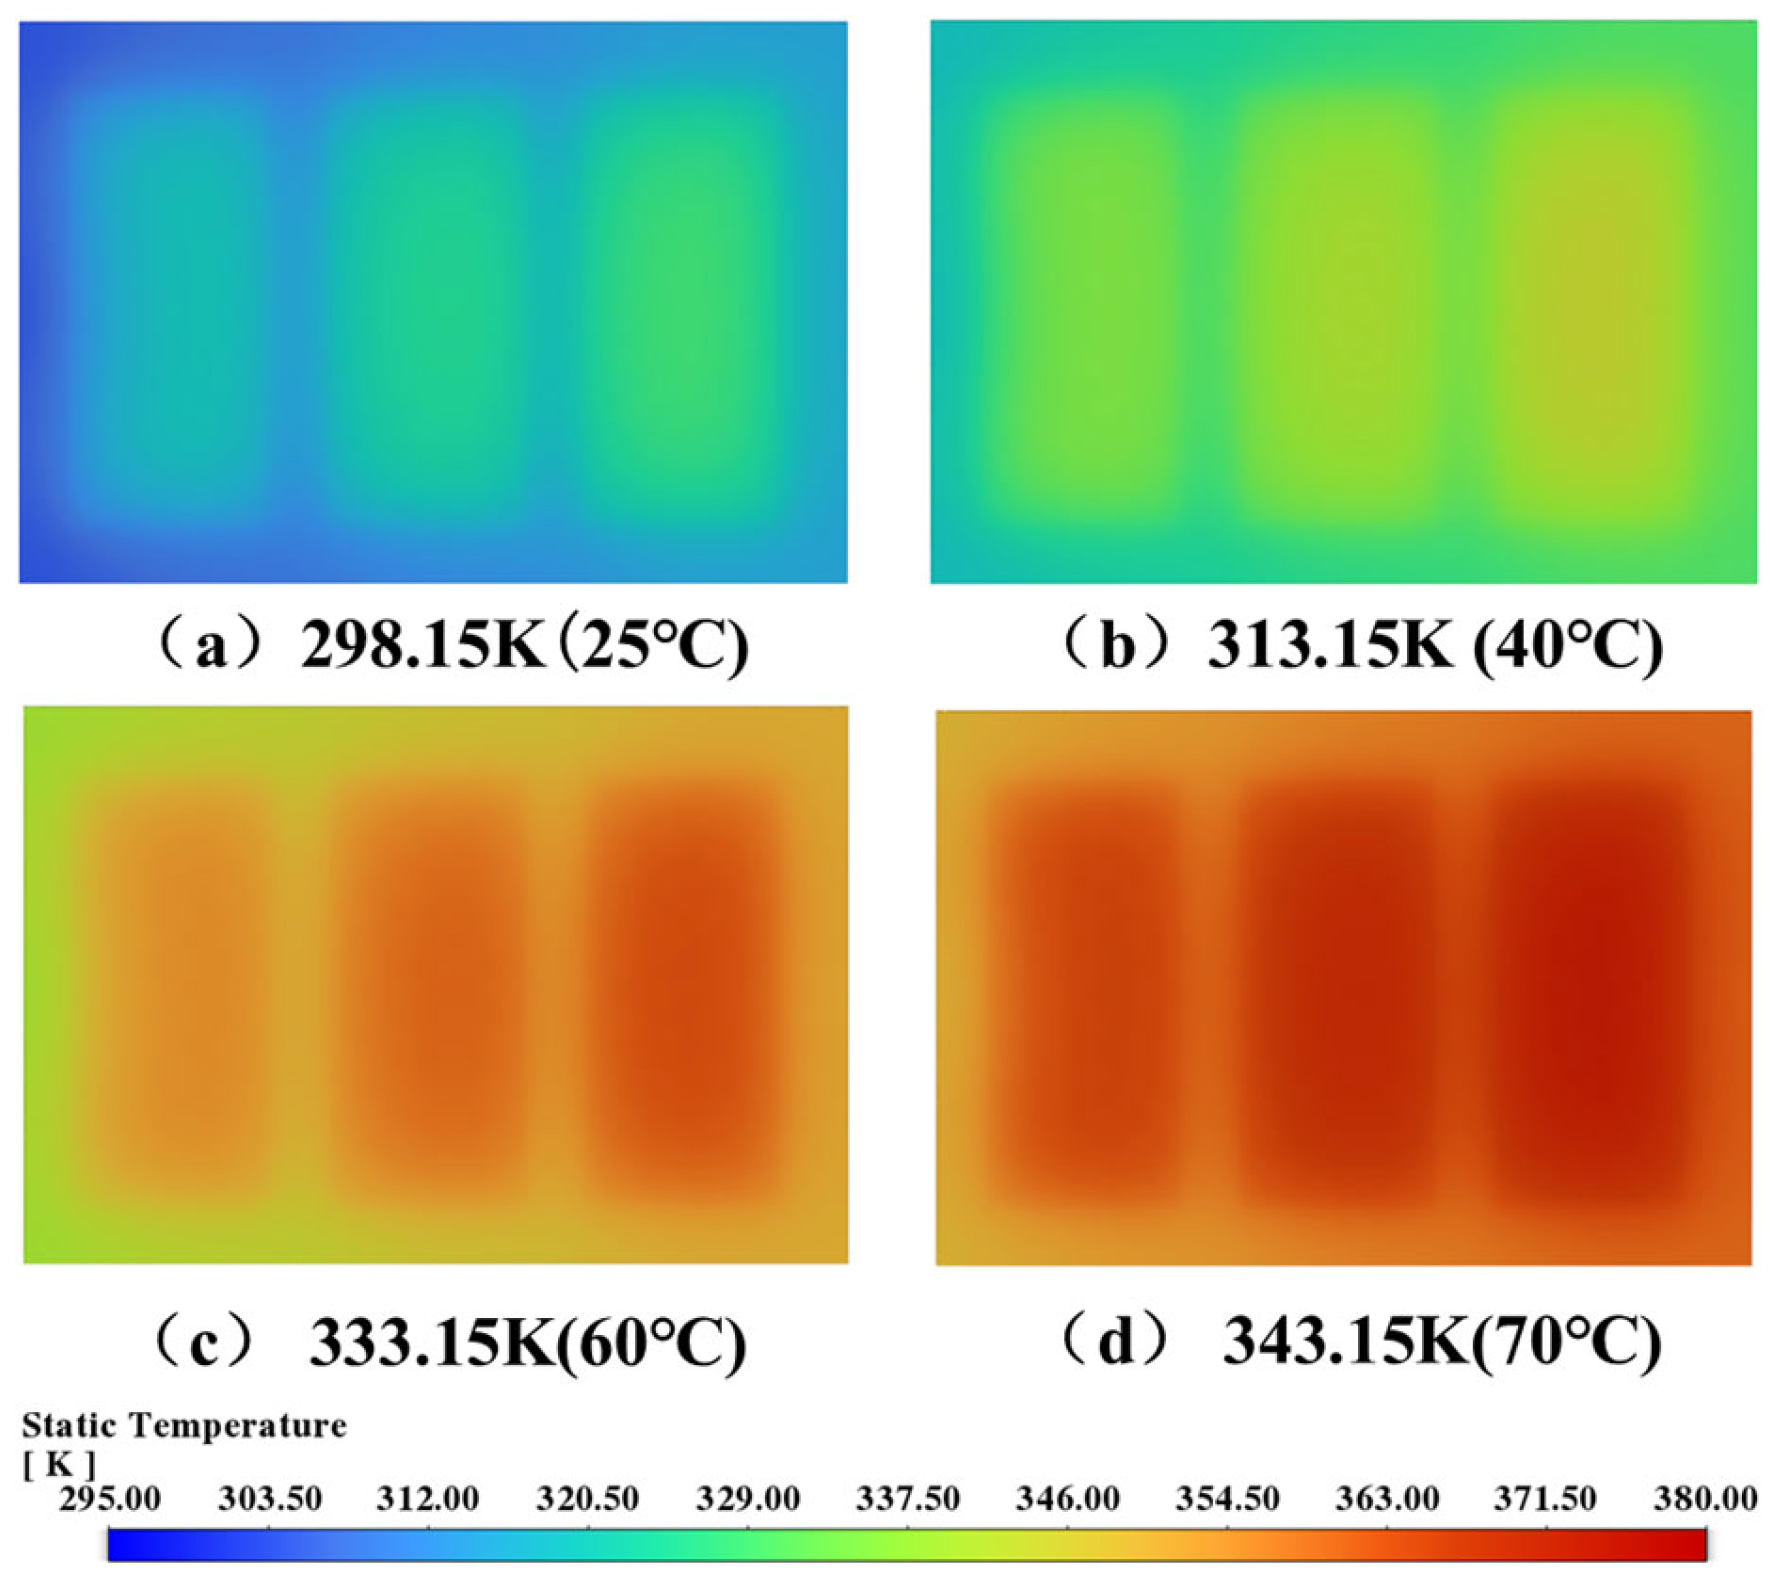
Figure 22 shows the steady-state temperature distributions on the top surface of the cooling plate for different inlet coolant temperatures. To ensure a fair visual comparison, all contour plots are presented using the same color scale. As the inlet temperature increases from 298.15 K to 343.15 K, the overall temperature field shifts upward, and the absolute temperature levels rise across the entire surface. Localized high-temperature regions can be observed in each case, with their positions remaining consistent, while the size and intensity of these regions increase in line with the overall temperature elevation.
In summary, within the investigated range and assuming temperature-independent fluid and material properties, increasing the coolant inlet temperature raises absolute temperature levels but does not significantly alter the cooling plate’s thermal uniformity.

