Article

Interactive Optimization of Electric Bus Scheduling and Overnight Charging

Faculty of Mechanical Engineering and Naval Architecture, University of Zagreb, 10002 Zagreb, Croatia
*
Author to whom correspondence should be addressed.
Energies 2025, 18(16), 4440; https://doi.org/10.3390/en18164440
Submission received: 15 July 2025 / Revised: 6 August 2025 / Accepted: 14 August 2025 / Published: 21 August 2025

Abstract

The transition to fully electric bus (EB) fleets introduces new challenges in coordinating daily operations and managing charging energy needs, while accounting for infrastructure constraints. The paper proposes a three-stage optimization framework that integrates EB scheduling with overnight charging under realistic depot layout constraints. In the first stage, a mixed-integer linear program (MILP) determines the minimum number of EBs with ample batteries and related schedules to complete all timetabled trips. With the fleet size fixed, the second stage minimizes the EB battery capacity by optimizing trip assignments. In the third stage, charging schedules are iteratively optimized for different numbers of chargers to minimize charger power capacity and charging cost, while ensuring each EB is fully recharged before its first trip on the following day. The matrix-shape depot layout imposes spatial and operational constraints that restrict the charging and movement of EBs based on their parking positions, with EBs remaining stationary overnight. The entire process is repeated by incrementing the fleet size until a saturation point is reached, beyond which no further reduction in battery capacity is observed. This results in a Pareto frontier showing trade-offs between required battery capacity, number of chargers, charger power capacity, and charging cost. The proposed method is applied to a real-world airport parking shuttle service, demonstrating its potential to reduce the battery size and charging infrastructure demands while maintaining full operational feasibility.

1. Introduction

Cities worldwide are increasingly transitioning from diesel to battery-electric buses (EBs) to reduce greenhouse gas and noise emissions, improve air quality, and promote sustainable urban mobility [1]. Supported by environmental regulations, public policies, and advancements in vehicle technology, EBs have become central to electrification strategies in public transport. Compared to diesel buses, they offer advantages such as zero tailpipe emissions, quieter operation, and lower energy and maintenance costs [2].
Despite these benefits, large-scale adoption of EBs imposes operational and infrastructural challenges [3]. Unlike diesel buses, which refuel quickly and operate continuously, EBs require longer charging times and have limited driving ranges. These constraints necessitate proper, preferably optimal scheduling and energy planning, particularly in high-frequency services such as airport shuttles and urban transits, where reliability and punctuality are critical. While cities like Shenzhen, Tel Aviv, and Los Angeles have already demonstrated successful EB deployment [4], broader implementation requires coordinated planning of vehicle operations, energy usage, and depot infrastructure. Recent research has proposed various tools and models to support this transition. Simulation platforms now incorporate charging strategies and electric powertrain behavior [5], while data-driven approaches can estimate energy consumption using trip-level rather than high-frequency driving data [6]. Markov chain-based methods have also been used to generate realistic driving cycles from low-resolution tracking data [7]. Advances in multi-objective optimization and search space reduction techniques have further improved infrastructure planning, including charger siting and sizing [8]. To support high-fidelity simulations of bus operations, the CARLA simulator has been extended with a large-size physical bus model [9], enabling realistic evaluation of autonomous bus dynamics and interactions within complex traffic environments.
One of the most critical challenges in EB operations is the Electric Bus Scheduling Problem (EBSP), an extension of the classic Vehicle Scheduling Problem (VSP) that accounts for electric vehicle constraints [10]. The EBSP involves assigning scheduled trips to a fleet of EBs while minimizing operational and capital costs [11]. It must consider factors such as limited battery capacity, charging station availability, and the time required to recharge. Since EB ranges typically fall between 100–300 km per charge [12], mid-day charging is often necessary, directly impacting scheduling and service continuity. Closely related is the Charging Scheduling Problem (CSP), which determines when, where, and how much each bus should charge. Solving CSP requires alignment with trip schedules, dwell times, and depot constraints. Unlike binary (on/off) charging models, modern approaches increasingly adopt variable charging strategies that dynamically adjust power levels. This enables reduced peak loads, improved energy cost efficiency, and better battery health [13]. EB operations commonly follow one of two strategies: fast opportunity charging or overnight depot charging [14]. Opportunity charging enables smaller, lighter batteries by allowing frequent recharging during the day, but it demands dense, high-power charger networks and complex, tightly synchronized schedules. Here, trip assignment and charging must be co-optimized [15]. In contrast, overnight charging simplifies operations by centralizing all charging at the depot, typically using off-peak electricity rates. While this reduces operational complexity, it requires larger batteries to support full-day operation [16], allowing for sequential optimization of scheduling and charging.
However, most existing literature on EB operations focuses on individual aspects such as EBSP, CSP, or infrastructure planning, while only a smaller number of studies address integrated solutions that jointly consider the EBSP and CSP. In [17], a Mixed-Integer Linear Program (MILP) is formulated to dispatch a mixed fleet from a multi-line terminal, accounting for schedule adherence and charging dynamics. While the model captures realistic operational interactions and is validated on a Luxembourg case, it lacks scalability and does not support variable charging rates, time-of-use (ToU) pricing, or demand/capacity charges. A computationally efficient hierarchical charging strategy is proposed in [18], which combines a predictive, dynamic programming-based aggregate control layer with a fast heuristic allocation of charging power to individual vehicles. While the method enables charging cost reduction and better utilization of renewable sources, it focuses on charging scheduling only. In [19], an MILP is used to jointly optimize route assignment and charging based on solar forecasts, aiming to maximize renewable integration and minimize energy costs. Although it incorporates ToU rates and infrastructure limitations, it overlooks demand charges, battery degradation, and infrastructure deployment. A bi-level, multi-objective model is proposed in [20] for scheduling a mixed fleet under a single depot, minimizing fuel costs, energy charges, and emissions. However, it does not consider peak charging demand, charger quantity limits, or battery degradation and lacks scalability due to its reliance on problem-specific heuristics. Study [21] introduces a bi-objective, multi-depot model to minimize ToU charges and peak load using a lexicographic optimization framework. While it performs well in a Guangzhou case, it does not consider limited charger availability, battery degradation, or energy consumption uncertainties. In [22], a fast-charging network optimization model is developed using adaptive large neighborhood searching and branch and bound (ALNS–BB) heuristics. It considers limited charger availability and reduces electricity costs in a Shenzhen case but is specific to fast-charging systems and does not address battery degradation, variable charging rates, or infrastructure deployment. Work in [23] presents a two-stage optimization framework that integrates flexible charging and timetable shifting. Though effective in reducing costs and peak power demand, it relies on relaxed scheduling assumptions and does not consider variable charging rates, charger constraints, or battery aging. Finally, work [24] proposes a comprehensive three-module framework for strategic, tactical, and operational planning, including vehicle scheduling, charger deployment, and battery degradation modeling. While it achieves lifecycle cost savings in a university campus case, it demands extensive data and model complexity, limiting its practical use to some extent. In addition to fleet sizing and charging optimization, crew scheduling has also been recognized as relevant, since reduced fleet sizes may lead to more intensive driver duty allocations [25].
In summary, most of the existing studies address EBSP, CSP, or infrastructure planning in isolation, often relying on simplified depot assumptions or data-intensive models. In contrast, this work proposes a scalable and integrated framework that optimizes trip scheduling and overnight charging in a unified process under realistic spatial, temporal, and infrastructure constraints. The main contributions are as follows: (i) a sequential optimization framework that first determines the minimum fleet size and then minimizes total battery capacity, number of chargers, charging power, and charging cost through incrementing fleet size, thereby formulating a Pareto frontier that captures the trade-offs among these objectives, (ii) an MILP-based trip assignment approach that minimizes the maximum daily battery capacity required per bus while ensuring complete trip coverage under energy feasibility constraints, and (iii) a novel MILP-based overnight charging scheduling formulation that accounts for a matrix-shaped depot layout with temporal, spatial, and blocking constraints.
The remainder of this paper is structured as follows. Section 2 defines the problem and provides the formal mathematical formulation. Section 3 details the proposed methodology, including EB trip assignment and charging scheduling. Section 4 presents a real-world case study based on the parking shuttle bus system operating at Paris–Charles de Gaulle Airport. Section 5 discusses the numerical results. Finally, Section 6 concludes the paper and outlines directions for future work.

2. Problem Definition

2.1. Electric City Bus Scheduling and Overnight Charging Framework

This study addresses the Electric Bus Scheduling Problem (EBSP) under fixed timetables and overnight depot charging. At the end of each day, all electric buses (EBs) are required to return to the depot, park in assigned positions, and start the following day with fully recharged batteries. The goal is to ensure complete trip coverage, efficient fleet utilization, and cost-effective charging, while accounting for infrastructural and operational constraints. A trip is defined as a single scheduled service operated by an EB, characterized by a known departure time, expected duration, origin stop, and destination stop. The optimization framework relies on several input data sources (green input block in Figure 1): (i) a fixed trip timetable with defined start times, durations, and locations, (ii) the energy consumption characteristics of EBs (e.g., kWh per trip), (iii) parameters of the charging infrastructure, including charger locations and time-of-use (ToU) electricity pricing, and (iv) spatial layout of the depot, including parking positions and charger assignments. Since the model operates on predefined timetables, the optimization does not affect the passenger service quality (including service punctuality and waiting times).
In the first stage (Block 1 in Figure 1), the minimum number of EBs B m i n required to cover the full timetable is determined. A Mixed-Integer Linear Program (MILP) is formulated to assign trips to EBs such that as follows: (i) each trip is covered without overlap, (ii) operational feasibility is ensured, and (iii) the total number of EBs is minimized. To focus solely on determining the fleet size, energy constraints are intentionally omitted by leaving the battery capacity unconstrained in this stage.
Once B m i n is determined, the second stage (Block 2) is performed to assign trips in an energy-feasible manner and identify the maximum daily energy consumption C m a x B among all EBs for the fixed fleet size B (obtained as B m i n in the initial step). Determined through a MILP formulation, this value defines the minimum required battery capacity, which is then applied uniformly across the entire (homogeneous) fleet. It is assumed that once EBs complete their daily operation, they remain stationary at the depot until the next day and require no further driver interaction. Therefore, each EB’s parking interval is defined as the time between the end of its last trip (including return to depot) and the start of its first trip on the following day (which is assumed to be the same as the first trip of the current day), ensuring a repeatable daily schedule.
The overnight parking intervals, derived in the previous stage (when determining schedules), serve as inputs to the third stage of the optimization process (Block 3), where an MILP is formulated to determine the optimal overnight charging schedule while satisfying both temporal and infrastructural constraints. For a particular number of buses B, the objective is to minimize the following: (i) the required number of chargers n R B considering parking constraints such as charger layout and slot availability, (ii) the charging power capacity P * B , and (iii) the total charging cost Π t o t a l B under a ToU electricity pricing scheme. It is assumed that all chargers have the same charging power capacity P * B , determined via a binary search as the minimal rating that allows every EB to complete overnight charging within its parking interval. The chargers are controlled in an on/off manner, i.e., the current charging power equals the charger power capacity, while the charging interval duration is optimized.
The entire scheduling and charging optimization procedure (Blocks 1–3 in Figure 1) is then repeated for increasing fleet sizes B = B m i n + 1 ,   B m i n + 2 ,   (Block 4), until a saturation point is reached, beyond which no noticeable improvement in the required battery capacity is observed between consecutive fleet sizes ( C m a x B C m a x B 1 0 ). The resulting set of solutions is post-processed to construct a Pareto frontier that captures the trade-offs between number of EBs B , battery size C m a x B , number of chargers n r B , charging power P * B , and total daily charging cost Π t o t a l B , from which a final solution is selected by the designer/operator (see bottom plots of Figure 1).
Although the proposed optimization framework does not guarantee global optimality due to its sequential procedure, it offers several important advantages over a fully integrated approach. By decomposing the problem into successive stages, the framework improves computational efficiency, enhances scalability to large problem instances, increases the interpretability of individual subproblems, and allows greater flexibility in incorporating real-world constraints (e.g., parking layout of the charging infrastructure or policy-based scheduling rules). Moreover, each stage is of reduced scale so that it can be formulated as an MILP, enabling globally optimal solutions on local stages to be obtained. Furthermore, despite its sequential structure, the overall framework can be considered near-optimal. The key idea is that minimizing the required battery capacity C m a x B in Stage 2 naturally leads to lower total energy consumption across the fleet. This, in turn, indirectly reduces both peak charging power P * B and total charging cost Π t o t a l in Stage 3, since charging less energy typically decreases cost under ToU pricing. The main limitation to global optimality comes from Stage 2, where trip assignment optimization determines the first and last trip of each EB, independently of the subsequent charging schedule optimization. This defines the available overnight parking interval and thus limits flexibility in Stage 3, where charging optimization is performed. In theory, reassigning these trips across EBs could extend certain charging windows and potentially reduce peak power demands P * B . However, since the required battery capacities are already minimized and EB utilization is well balanced, such improvements are expected to have only a marginal impact on the overall solution.

2.2. Problem Formulation

2.2.1. Input Parameters and Feasibility Constraints

Let N denote the set of service trips to be scheduled, and K the set of available EBs. Each EB k K is associated with an energy requirement e k , representing the minimum battery capacity needed to complete its assigned trips under energy constraints. A homogeneous fleet is assumed by sizing all batteries according to the highest daily consumption across the fleet, given as C m a x = max e k ;   k K . Two auxiliary nodes, representing the same physical depot where the charging occurs, are defined to support the optimization formulation: the source node D 0 where all EBs begin their service and the sink node D n , where they return after completing their trips. Each service trip i N is defined by the following attributes:
  • start time: s i (in minutes from midnight);
  • duration: t i (in minutes);
  • energy consumption: c i (in kWh);
  • start location: S i ;
  • end location: E i .
Travel time t i j and energy c i j between trips i and j represent a deadhead travel (movement of EBs without passengers between the final station of trip i and the start station of trip j ). Furthermore, to capture only time-feasible transitions in the optimization problem, two auxiliary sets are defined:
  F W i { j N | s j s i + t i + t i j } ;   i N ,
B W i { j N | s i s j + t j + t i j } ;   i N ,
where the set F W ( i ) contains all trips j that can feasibly follow trip i in a vehicle schedule, while B W i contains all trips j that can feasibly precede trip i .
When scheduling EBs, standard operational constraints must first be satisfied before incorporating EB-specific considerations [26]. First, the trip assignment constraint requires that each service trip is assigned to exactly one EB:
  k K a i k = 1 ,   i N ,
where a i k is a binary variable equal to 1 if trip i is assigned to k th EB, and 0 otherwise. This prevents both unassigned trips and duplicate assignments. Second, each EB must follow an operationally feasible sequence of trips, ensuring that the next trip starts only after the previous one finishes and travel time is accounted for:
  s j s i + t i + t i j ; ( i , j ) N k ,
where N k N is the set of consecutive trip pairs that can be assigned to k th EB. This constraint ensures temporal feasibility by preventing overlapping trips and enforcing sufficient transition time between consecutive services. In addition to standard scheduling constraints (1) and (2), EB operations are subject to several EB-specific requirements [27]. First, each EB must maintain its battery energy within predefined bounds throughout its operational period:
  e m i n k e k ( t ) e m a x k ; t T ,
where e k ( t ) is the energy level of k th EB at time t and T represents the set of all discrete time steps during which the EB is in operation, including both driving periods (trip execution) and times between trips (deadhead movements or idle periods). The parameters e m i n k and e m a x k define the minimum and maximum allowable battery energy levels, respectively. Finally, a charge-sustaining condition is enforced [15] where every EB must begin the next day with a fully charged battery. This requires the battery energy at the start of the next day’s first trip to match the battery’s maximum capacity and, therefore, ensures that the solution remains applicable across consecutive days, even though the optimization is performed for a single day:
  e k s f i r s t , n e x t k = e m a x k ; k K ,
where s f i r s t , n e x t k = s f i r s t k + 1440 denotes the scheduled start of the k th EB’s first trip on the following day (i.e., 1440 min = 24 h after the first trip of the current day).
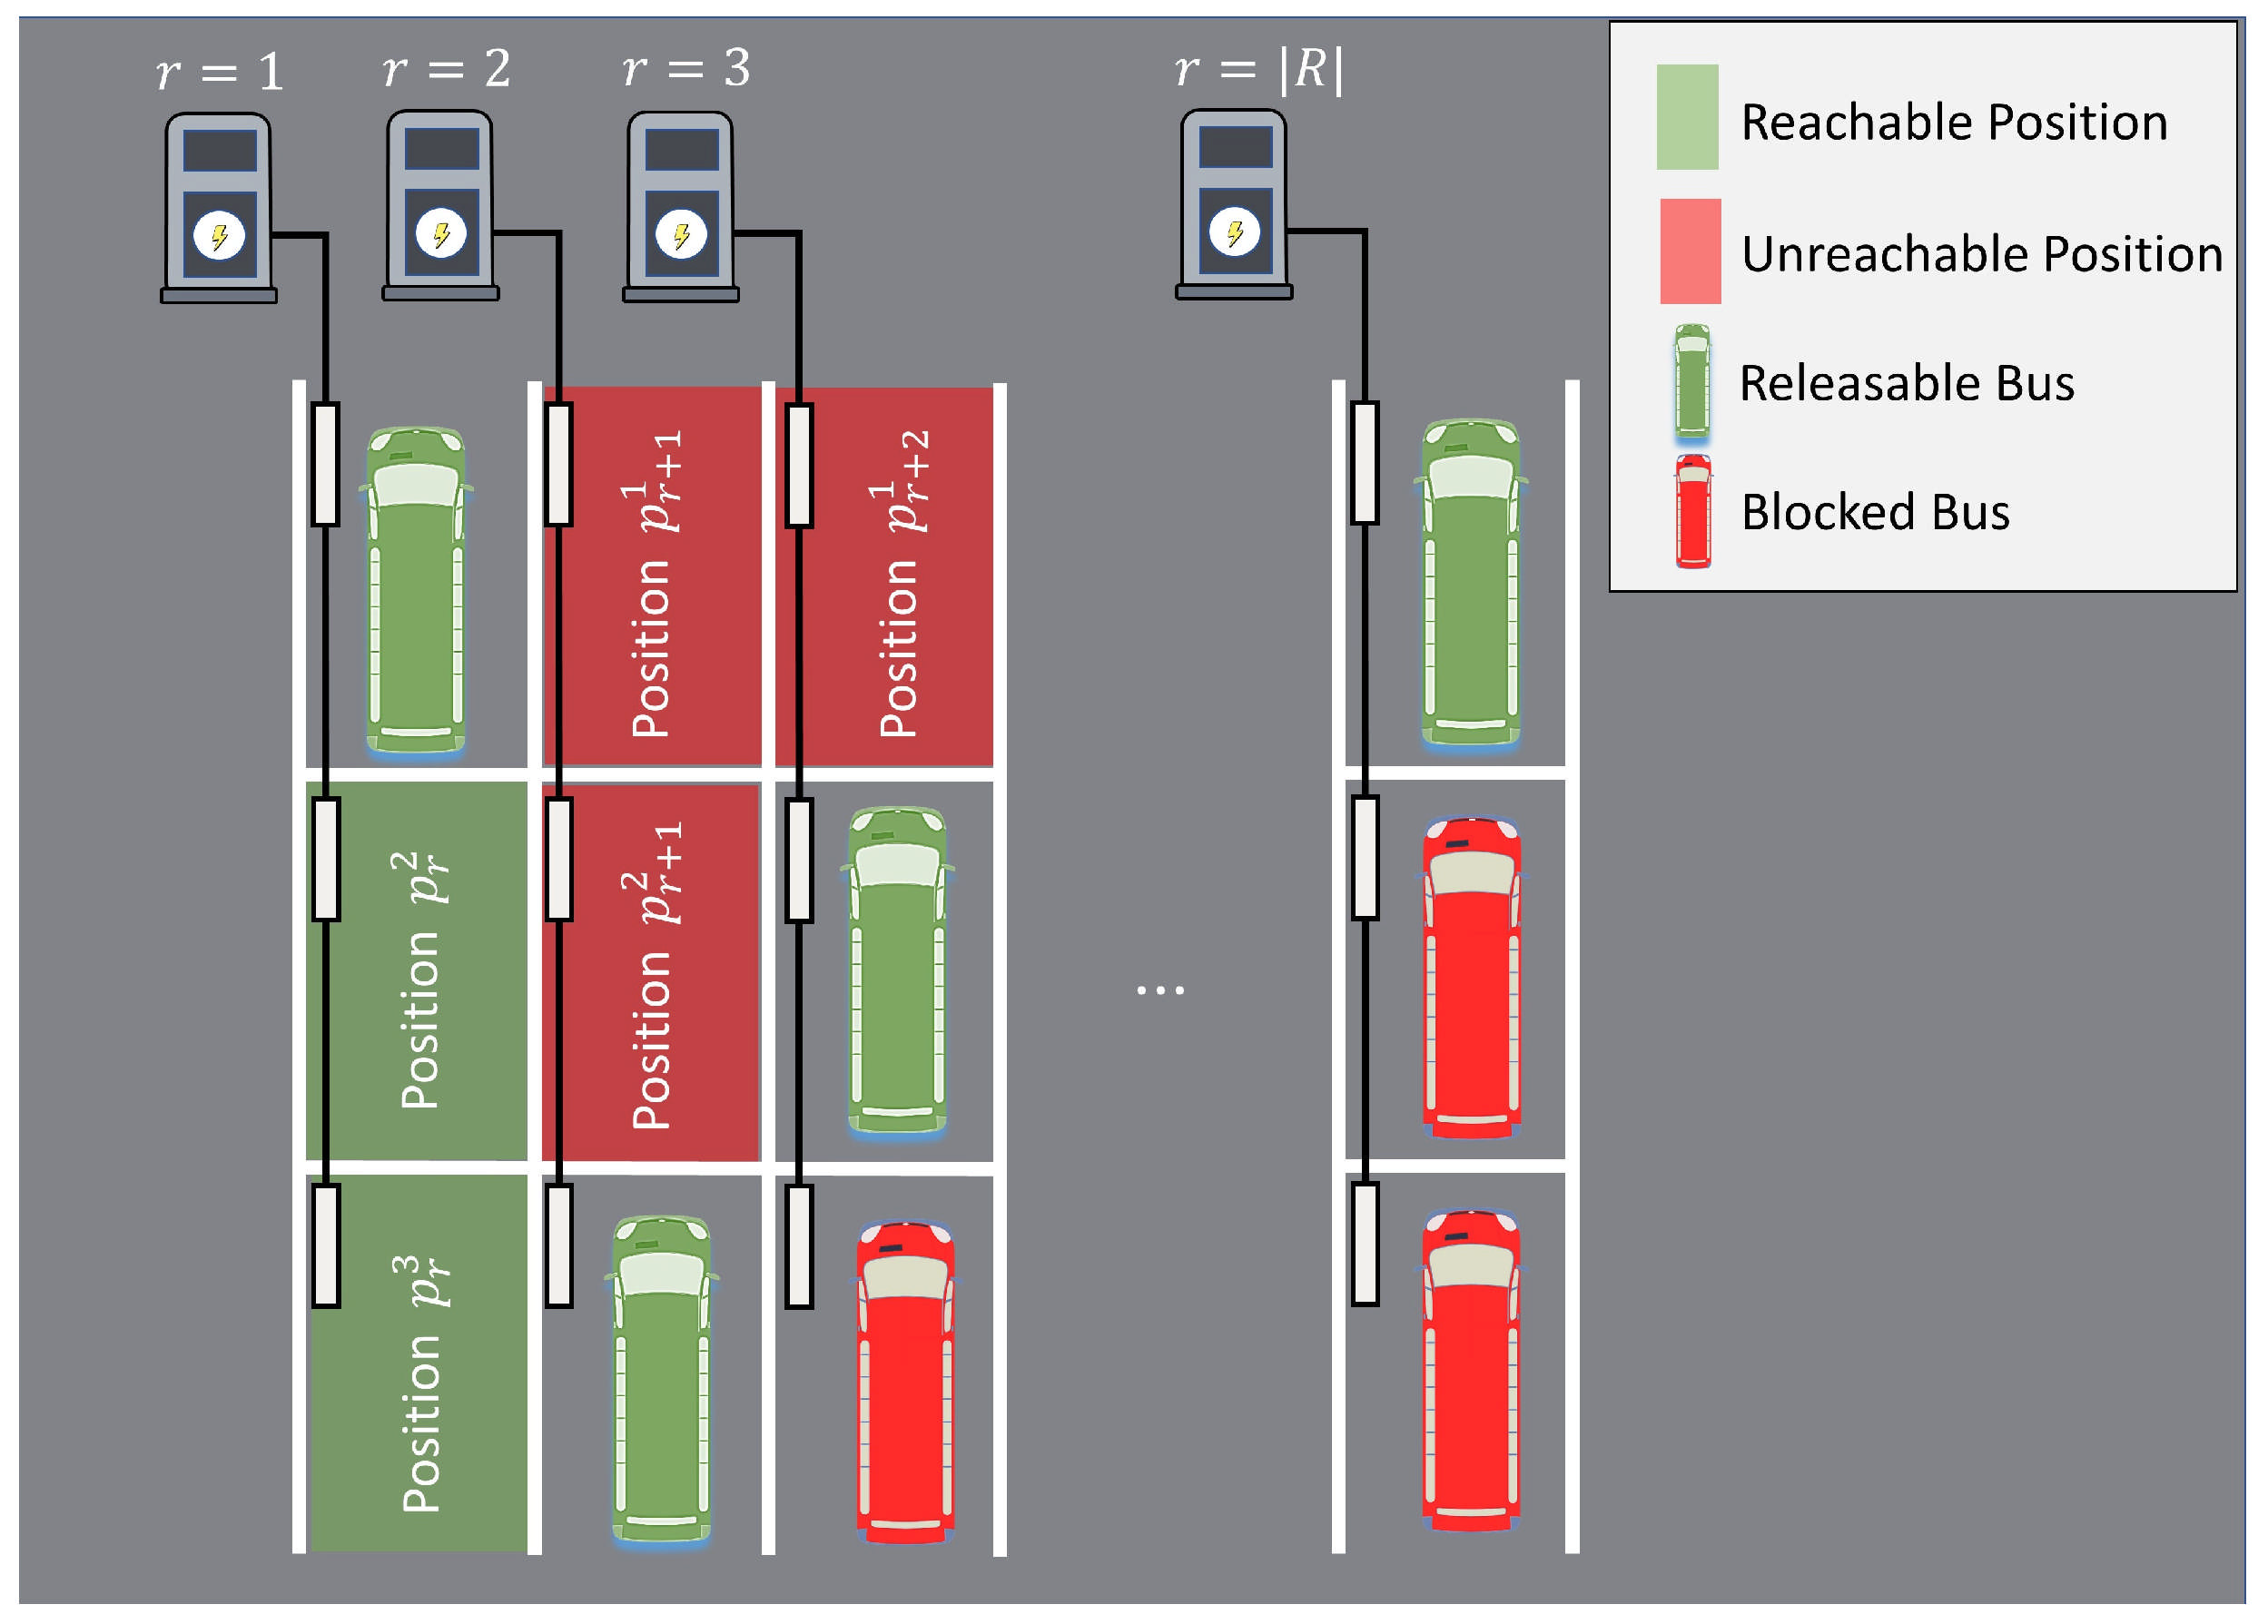
In this study, the charging infrastructure is based on ABB’s HVC-Overnight Charging system, which enables sequential charging using modular power cabinets [28]. Each charger r R can serve up to three charging positions p r 1 ,   p r 2 , p r 3 , forming a matrix layout 3 × n r , as shown in Figure 2. The charging power is assumed to be constant and equal to the maximum rated power P * , uniformly applied across all chargers and EBs. Charging within a single charger is performed sequentially, beginning with the first assigned position p r 1 , followed by p r 2 , and finally p r 3 , meaning that only a single EB is actively charged at a time per charger. The assignment of EBs to parking positions prioritizes upper rows first (top-down), ensuring a consistent order and facilitating charging throughput. The chargers in different columns operate independently, allowing the total delivered power to scale proportionally with the number of chargers, up to a multiple of P * .
However, overall charging station capacity must still be respected, as it limits the total number of vehicles that can be charged simultaneously:
  u r t 1 ; r R ,   t T ,
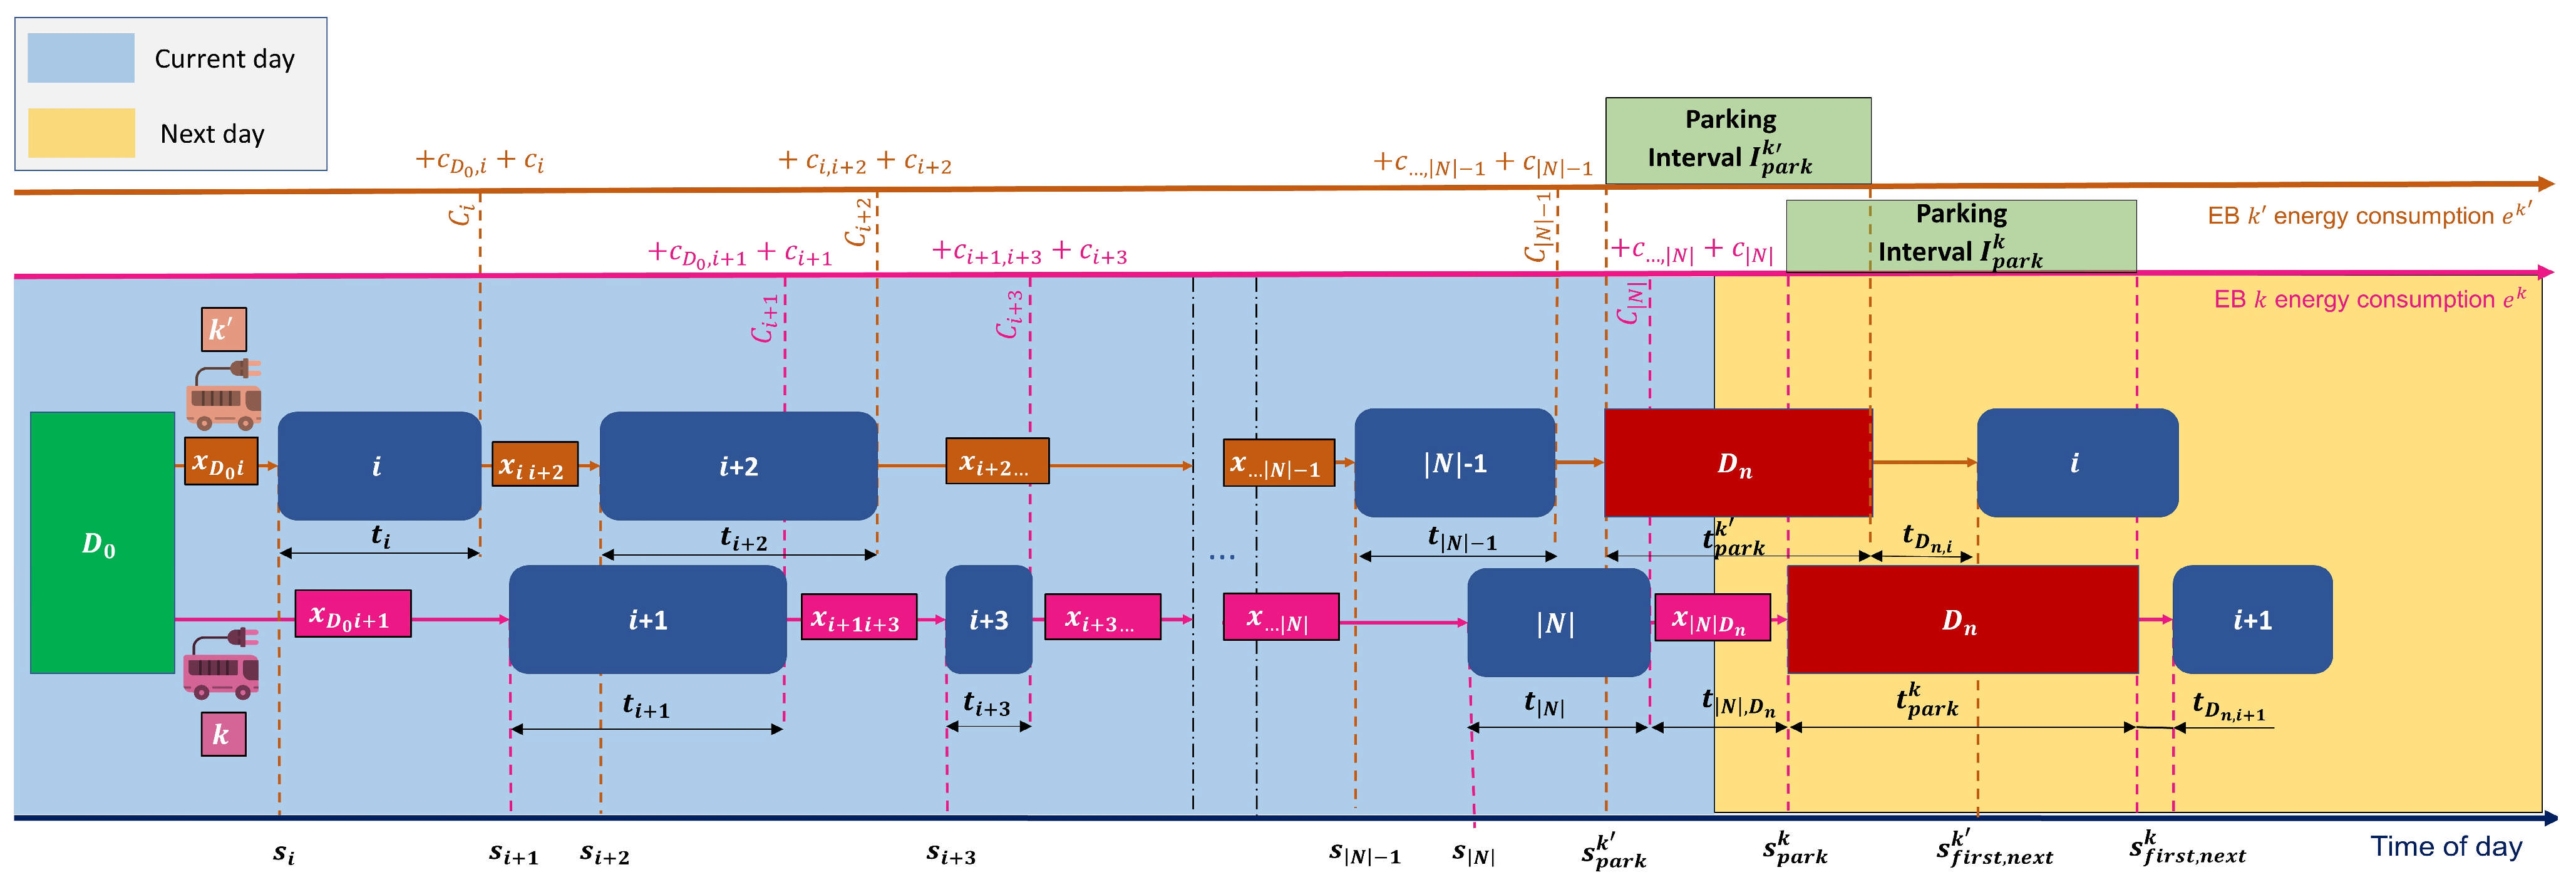
where u r t is the number of EBs charging at charger r at time t , meaning that only a single EB can be charged at a time per charger. It is assumed that, once an EB completes its final scheduled trip, it proceeds to the depot for overnight charging and remains parked until the start of its first trip the following day. In this way, there is no need to repark the EB during the night, i.e., the drivers’ engagement is minimized (the driver is logged out on the EB arrival, and another driver is logged in on the EB departure). Therefore, the available parking/charging interval I p a r k k for k th EB is defined by its start time s p a r k k and duration t p a r k k as follows:
  I p a r k k = s p a r k k ,   s p a r k k + t p a r k k ; k K .
s p a r k k = s l a s t k + t l a s t k + t l a s t , D n k ; k K ,
t p a r k k = s f i r s t , n e x t k t D 0 , f i r s t k s p a r k k ; k K ,
where t l a s t , D n k denotes the deadhead travel time from the final stop of l a s t trip to the overnight depot D n and t D 0 , f i r s t k is the time required to reach the starting location of the first trip on the following day from the depot D 0 = D n .
Once an EB completes its final trip and proceeds to the depot, it must occupy a parking position that is both available and physically accessible. Due to the sequential parking layout (see Figure 2), each parking column is accessed from the outermost position (e.g., p r 3 ) inward (see green arrows in Figure 2 for parking entrance direction). Therefore, an EB cannot park in a position p r m (e.g., top or middle row) if that or any upper position p r m (where m m ) is already occupied (see unreachable positions in Figure 3):
  z r k , m 1   k K s p a r k k < s p a r k k s p a r k k < s p a r k k + t p a r k k z r k , m ;   k K , r R ,   m m ,
where z r k , m = 1 if k th EB is assigned to position m at charger r . This ensures that EBs are only assigned to accessible positions, preserving the feasibility of the sequential layout and avoiding blockages during parking and departure. Similarly, an EB cannot exit its assigned parking position (it is blocked; see Figure 3) if another EB is still parked in any front (lower-numbered) position within the same column (charger). Specifically, an EB assigned to position p r m cannot depart at the end of its parking period if an EB remains in any position p r m where m < m (i.e., closer to the exit path):
  z r k , m 1   k K s p a r k k < s p a r k k + t p a r k k s p a r k k + t p a r k k < s p a r k k + t p a r k k z r k , m ; k K , r R ,   m < m .
This condition implies that the feasibility of EB departure is predetermined by its initial parking assignment, meaning that whether an EB is free for departure has already been defined on its arrival. To model temporal and spatial feasibility within the depot layout, two auxiliary sets are introduced for EB-level charging assignments:
  T C k { k K   \   { k } | s p a r k k + t p a r k k s p a r k k s p a r k k + t p a r k k s p a r k k } ,
P C k { k K   \   { k } | s p a r k k + t p a r k k < s p a r k k s p a r k k s p a r k k s p a r k k + t p a r k k s p a r k k + t p a r k k } ,
where T C k (Time-Compatible) is the set of EBs k K \ { k } whose parking intervals do not overlap with that of k th EB. These EBs can share the same depot slot (charger) without causing a time conflict, as their charging periods are disjoint. P C k (Position-Compatible) is the set of EBs k K \ { k } that can be parked in front of k th EB in the same charging column r , without blocking access. This set ensures spatial feasibility, by verifying that either k th EB departs before k th EB arrives ( s p a r k k + t p a r k k < s p a r k k ), or that the parking window of k th EB starts no earlier than that of k th EB and ends no earlier than k th EB window ( s p a r k k s p a r k k s p a r k k + t p a r k k s p a r k k + t p a r k k ), thereby ensuring that k th EB does not block the departure of k th EB and that the correct sequence in the column layout is maintained.

2.2.2. Fleet Size Minimization Formulation

The scheduling procedure begins with a fleet size pre-optimization, corresponding to Block 1 in Figure 1. The EBSP is formulated as an arc-flow optimization model [29], where the objective is to determine a set of feasible paths, each representing a valid sequence of service trips for each EB using the minimal number of EBs.
The problem is defined on a directed graph in which each node represents a service trip, and arcs connect trips that can be performed consecutively by the same kth EB, as illustrated in Figure 4. A binary decision variable x i j is introduced to capture the structure of feasible bus schedules. Specifically, x i j = 1 if service trip j N is scheduled immediately after trip i N and 0 otherwise. This variable is defined only for time-feasible trip pairs, i.e., where j F W ( i ) , with F W ( i ) defined by Equation (1a). Each path extends from the source depot node D 0 to the sink node D n , defining the daily schedule for a single EB, as illustrated in Figure 4 for two EBs denoted as k and k . The objective is to minimize the number of EBs required to cover the full timetable. This is equivalent to minimizing the number of departure arcs from the source depot D 0 [30], formulated as follows:
  B m i n = m i n j N x D 0 j ,
where x D 0 j is a binary decision variable equal to 1 if trip j is the first trip assigned to an EB, i.e., if it directly follows a departure from D 0 . In this formulation, energy consumption is not yet considered, and each EB is assumed to have sufficient battery capacity to perform any feasible trip sequence assigned to it, regardless of the cumulative energy required. The MILP formulation for this stage is presented in Section 3, detailing how trip assignments and timing feasibility are ensured within the arc-flow model.

2.2.3. Required Battery Capacity Minimization Formulation

In the second optimization stage (Block 2 in Figure 1), energy constraints are incorporated into the scheduling formulation. For each trip node i N , a continuous variable C i is introduced and assigned to each trip node i N to represent the cumulative battery energy consumption (in kWh) consumed from the start of the k th EB’s daily operation up to the end of trip i . The value C i is dynamically updated along each EB’s path (see Figure 4), by using linear energy-balance constraints, and is optimized along with the binary decision variables x i j . The initial energy for all trip sequences is set to zero at the source depot D 0 (i.e., C D 0 = 0 ) and is iteratively updated along each path until reaching its maximum value at the final node preceding the sink depot D n . Therefore, for a k th EB the cumulative battery energy consumption at the end of trip i N is given by the following:
  C i = c i + ( i * , j * ) N i k ( c i * + c i * j * ) ,
where N i k denotes the ordered set of all trip pairs ( i * , j * ) performed by k th EB from the start of its daily operation at depot D 0 up to and including trip i , c i * is the energy required to perform trip i * , and c i * j * is the deadhead energy required to transition from trip i * to trip j * , if it exists.
The battery energy values C i should be bounded from above by the battery capacity. Since the goal is to determine the minimal required battery capacity across a homogeneous fleet containing B EBs, the optimization minimizes the peak energy value across all trips (nodes):
  min C m a x B ,
where
  C m a x B = max i N   C i .
Hence, C m a x B defines the minimum battery size needed for all the EBs from the fleet of size B to complete their assigned schedules. Minimizing the peak energy across all nodes not only reduces the battery capacity but also promotes balanced energy distribution among EBs. In other words, minimizing the peak energy value encourages equitable scheduling and avoids overloading individual buses. The corresponding optimization problem is solved by using an arc-flow MILP formulation, as detailed in Section 3.

2.2.4. Overnight Charging Scheduling Formulation

The final stage of the scheduling process focuses on optimizing overnight charging, corresponding to Block 3 in Figure 1. In this step, the parking interval I p a r k k within which each EB must complete all required charging events is already defined by using the assigned trip schedules from Section 2.2.3 and calculated according to Equation (7).
Although the parking interval I p a r k k is known, the exact start time of charging is not fixed and is determined through optimization. To model this decision, a discrete set of start charging time candidates, h H k , is defined for each k th EB as shown in Figure 5. These candidates are generated on a uniform time grid with the step size Δ t , which is set to 30 min in this study to balance model fidelity and MILP complexity, with charging allowed to start only at these discrete time points. Therefore, the set H k is defined as follows:
  H k h Z 0 s p a r k k + h t + t c h k s p a r k k + t p a r k k ,
where the corresponding start charging time s h k for each h H k equals the following:
s h k = s p a r k k + h t ; h H k ,
and the charging duration t c h k is defined as follows:
  t c h k = e m a x k P * B ,
with e m a x k and P * B denoting the total energy consumed by k th EB across its scheduled trips and the charging power, respectively. The inequality in (15a) ensures that each start time candidate leaves sufficient room to complete the charging event before departure.
To enable the model to select exactly one valid charging start time within the interval I p a r k k , a binary decision variable y h k is introduced for each charging start time candidate h H k . Specifically, y h k = 1 if k th EB begins charging at the candidate time s h k , and y h k = 0 otherwise. Furthermore, for each candidate h H k , the monetary cost of the corresponding charging session Π h k is precomputed and stored as a constant in the optimization model. Assuming a constant charging power P * B (in kW), the cost of charging event h is computed by summing the per-minute charging cost:
  Π h k = P * B 60 τ = 0 t c h k 1 π s h k + τ .
The goal is to select the optimal charging start times s h k that minimize the total charging cost (in EUR) across the fleet:
  min k K h H k Π h k y h k .
Figure 4 and Figure 5 illustrate the coupling between trip scheduling and charging optimization. While solved sequentially, the two problems are inherently linked through shared constraints on time and energy.
In addition to determining charging times, the model also assigns each EB to a specific parking position equipped with a charger, subject to the spatial constraints defined in Equations (8) and (9). To optimize this assignment (see Figure 2 and Figure 3), a binary decision variable z r p k is introduced. This variable equals 1 if EB k K is assigned to parking position p P r at charger r R , and 0 otherwise.
The full MILP formulation of the overnight charging optimization problem is presented in the following section.

3. Methodology

This section presents a three-stage MILP-based optimization framework developed to address the EBSP introduced in Section 2. All stages are formulated using MILP, enabling systematic modeling of operational constraints and direct use of existing MILP solvers.

3.1. General MILP Formulation

The general form of an MILP optimization problem can be expressed as the following [31]:
  min x , y   c T x + d T y ,
subject to the following:
A x + B y b , D x + E y = e , x R n ,   y Z m ,
where x represents a vector of continuous decision variables, y includes integer (or binary) decision variables, c and d are vectors containing cost function coefficients, and A , B , D , and E define the constraint matrices, while b and e are constraint limits. Thus, the problem defined in Section 2 should be rearranged into the forms (18) and (19) to be solvable by an MILP solver. MILP solvers offer robust capabilities, including guaranteed global optimality, convergence to feasible solutions, and automatic termination if the constraints cannot be satisfied [31]. In this study, the Gurobi solver [32], accessed through the PuLP library in Python 3.13, is utilized to solve the MILP formulation.

3.2. Fleet Size Optimization

The first stage of the proposed methodology aims to determine the minimum number of EBs ( B m i n ) required to cover the entire set of timetabled trips (Block 1 in Figure 1). As described in Section 2.2.2, this is achieved by solving an arc-flow optimization problem given by Equation (11), which minimizes the number of departure arcs from the source depot node D 0 , while no explicit upper bound is imposed on the battery capacity C m a x .
Each service trip i N must be assigned to exactly one EB, as required by the trip assignment constraint (2), and placed within an operationally feasible sequence that respects the trip timing, as enforced by the compatibility constraint (3). In the arc-flow formulation (see Figure 4), these conditions are jointly satisfied by imposing the following flow conservation constraints at each trip node:
  j B W ( i ) x i j = 1 ;   i N ,
j F W ( i ) x i j = 1 ; i N .
These constraints ensure that each trip node i N has exactly one incoming and one outgoing arc, meaning that every trip is assigned to exactly one EB. Furthermore, the binary variable x i j equals 1 if trip j follows trip i in the same EB’s schedule. The sets F W ( i ) and B W i define only those trips that can feasibly follow or precede trip i . By limiting x i j to valid pairs from these sets, the sequence feasibility condition in Equation (3) is also satisfied.

3.3. Required Battery Capacity Minimization

Once the minimal number of EBs B m i n is determined, the second stage of the proposed methodology minimizes the required battery capacity to cover all timetabled trips. This step corresponds to Block 2 in Figure 1 and is formally defined in Section 2.2.3.
The problem is again formulated as an arc-flow model but now with the objective function (13) seeking to minimize the peak energy consumption across all trip nodes.
The trip coverage and sequence feasibility constraints (2) and (3) remain valid and are enforced through the flow conservation constraints (20). However, in this stage, two key differences when compared to the previous fleet size minimization problem apply: (i) fleet size is fixed to a specified value B rather than minimized, and (ii) the required battery capacity C m a x B is then minimized. The following condition is imposed to ensure that exactly B number of EBs are dispatched from the depot D 0 (see arcs in Figure 4 for illustration):
  j N x D 0 j = B .
Furthermore, to minimize the required battery capacity C m a x B , it is necessary to enforce energy conservation along each EB’s assigned trip sequence. Specifically, for every pair of time-feasible consecutive trips i and j , the energy balance must follow the relationship (12), which is enforced through the following inequality:
  C j C i + c j + c i j M 1 1 x i j ; i N D 0 , j F W i .
This constraint is only active when the trip j is scheduled directly after the trip i (i.e., x i j = 1 ). In this case, the inequality becomes binding and ensures that C j properly reflects the energy accumulated from C i , the energy to drive from i to j ( c i j ), and the energy needed to perform trip j ( c j ). When x i j = 0 , the large constant M 1 (big-M) relaxes the constraint, making it non-binding [33]. No corresponding upper-bound constraint (i.e., C j …) is required, since the optimization objective is to minimize the peak energy consumption (see Equation (13)), and the solver will naturally avoid overestimating C j to reduce the objective value.
Finally, to minimize the battery capacity, an auxiliary variable C m a x B is introduced, which represents the maximum allowable energy consumption along any EB’s trip sequence (see Equation (14)). To ensure that no EB exceeds this capacity, the following constraint is imposed:
  C j C m a x B ; j N .
By minimizing C m a x B in accordance with Equation (13), the optimization seeks the smallest battery size that satisfies all energy demands across the fleet.

3.4. Overnight Charging Scheduling

To determine the infrastructure required for overnight charging, the third stage of the methodology simultaneously addresses (i) the minimum number of required chargers n R B , (ii) the minimum total charging cost Π t o t a l B , (iii) and the minimum required charger power capacity P * B for each fixed fleet size B from the previous optimization step (see Block 3 in Figure 1 and Section 2.2.4). Each EB must be charged within its assigned parking window while respecting all temporal, spatial, and operational constraints (see Equations (8)–(10)).
To ensure a linear MILP formulation (18) and (19), the optimization is performed in two nested loops. First, the number of available chargers m r is incremented, starting from a small value (e.g., m r = 1 ) , until a feasible charging schedule is found. In this step, the charging power P * B is fixed to its maximum allowed value P h i g h to provide maximum scheduling flexibility, thereby enabling the determination of the minimum required charger count n R B . For each candidate m r , the optimization problem is solved with constraints that enforce charger access, non-blocking parking, and sequential usage (see Equations (6)–(10)).
Once the minimum number of chargers n R B is found and fixed, the goal becomes to determine the lowest possible charging power P * B that still results in a feasible solution. However, the relationship between charging power and charging duration is inherently nonlinear, as the charging duration is inversely proportional to the selected power level. To avoid introducing nonlinearity, i.e., to keep the problem linear as required by MILP, the problem formulation is modified as follows [31]: (i) the charging power P * B is decoupled from the optimization by treating it as an external parameter, and (ii) a binary search procedure is superimposed to iteratively refine the charging power P * B value until the minimum feasible level is found. The binary search is performed over an interval [ P l o w , P h i g h ] using the following logic defined by Algorithm 1 and described in what follows. For a given midpoint value P , an MILP is constructed and solved. If a feasible charging assignment exists (Equations (4)–(8)), the upper bound P h i g h is updated to P ; otherwise, the lower bound P l o w is set to P , effectively narrowing the search interval. The process terminates when the interval width is below a small tolerance ε , yielding the minimum required power P * B . This approach leverages the monotonic nature of charging feasibility with respect to power: if a charging schedule is feasible at a certain power level, it remains feasible at any higher power level [33]. Therefore, by progressively narrowing the interval through bisection, the algorithm reliably converges to the lowest power value P * B (the global minimum) for which a feasible solution exists.
Algorithm 1. Joint optimization of charger count and charger power via nested search
PROCEDURE Find_Minimum_Chargers_and_Power (
                      P l o w ,   // smallest power level to test (kW)
                      P h i g h ,     // largest power level to test (kW)
                      ε     // convergence tolerance (kW)
                      m r , m a x ):  // maximum number of chargers to try
  FOR   m r       1   m r , m a x               // outer loop: grow charger pool
l o     P l o w              // current lower power bound
h i     P h i g h            // current upper power bound
   found ← FALSE          // flag: feasibility for this r?
WHILE   ( h i l o > ε )         // inner loop: bisection on power
    P     ( l o + h i ) / 2           // midpoint candidate power
    IF   Solve _ MILP ( R ,   P ) = FEASIBLE THEN
    h i     P              // current upper power bound
        found ← TRUE
       ELSE
    l o     P              // infeasibleraise lower bound
      END IF
END WHILE

IF   found   =   TRUE   THEN / /   first   m r = R that works → global answer
    RETURN   ( m r ,   h i )       / /   hi     minimal   P * B for this m r
    END IF
   END FOR
  RETURN “No feasible configuration within given limits”
END PROCEDURE
Since the charging power P * B is determined externally through the binary search algorithm and held fixed within the MILP charging optimization, only the charging start times s h k within each EB’s eligibility window are optimized. Each k th EB is associated with exactly one charging event h H k (see Equation (15a,b)). For the optimal constant power level P * B , the corresponding charging duration t c h k is precomputed according to Equation (15c). The objective of the model is to minimize the total charging cost (Equation (17)) across the fleet by selecting optimal start times, while respecting all spatial and temporal constraints.
To ensure that each EB initiates charging at exactly one feasible time within its assigned parking window, the following constraint is imposed:
  h H k y h k = 1 ; k K .
Here, the binary decision variable y h k activates the chosen charging event for k th EB from its predefined set of start time candidates H k , which are derived based on available parking durations (see Section 2.2.4 and Figure 3).
Additionally, to manage overnight depot operations and avoid spatial conflicts, each EB must be assigned to exactly one charger (i.e., column of positions in Figure 2) and one specific parking slot within that charger (i.e., rows of positions). This is enforced by the following constraint:
  r R p P r z r p k = 1 ; k K .
Here, z r p k is equal to 1 if k th EB is assigned to parking position p at charger r , and 0 otherwise.
To ensure that each EB completes its charging session entirely within its assigned parking interval I p a r k k according to Equation (7), the following two constraints are imposed:
  s p a r k k h H k s h k y h k ;   k K ,
h H k ( s h k + t c h k ) y h k s p a r k k + t p a r k k ; k K .
Constraint (26a) defines that the selected charging start time s h k cannot begin before the EB arrives at the depot s p a r k k , while constraint (26b) guarantees that the entire charging session ( s h k + t c h k ) is completed before the EB’s scheduled departure ( s p a r k k + t p a r k k ).
To prevent charging conflicts at the same charger r , the following constraint enforces temporal separation between EBs that are assigned to consecutive parking positions within the same column (charger):
  h H k s h k y h k h H k s h k + t c h k y h k M 2 2 z r q k z r p k ; r R , p , q P r × P r | p < q , k , k K × K | k k .
Specifically, if k th EB is parked in front of k th EB (i.e., at a lower-numbered position p < q on charger r ), then k th EB must complete its charging before k th EB can begin. This is necessary because, in a linear parking layout (see Figure 3), EBs positioned behind others cannot move until the front EBs are finished and cleared.
Similarly, k th EB must not be assigned to a forward (lower-numbered) position p while k is assigned to a rear (higher-numbered) position q in the same charger column r R according to Equations (8) and (9):
  z r p k + z r q k 1 ; r R , p , q P r × P r p < q , k , k K × K k P C k .
Finally, if two EBs k and k of the same charging column r R have overlapping charging intervals (i.e., they are not temporally compatible according to Equation (10a)), they cannot be assigned to the same parking position p P r :
  z r p k + z r p k 1 ; r R , p P r , k , k K × K | k T C k .

4. Case Study

This section applies the proposed three-stage overnight charging optimization framework to a real-world landside shuttle bus system at Paris–Charles de Gaulle (CDG) Airport. The current system, based on Hybrid Electric Buses (HEB), has been virtually converted to a fully electric configuration to evaluate the charging strategy. This includes acquisition and processing of all necessary input data for the optimization model (green block in Figure 1).
To support the optimization of EB operations, two primary data sources are used: (i) a nominal dataset that describes the planned structure of the shuttle service and (ii) an operational and ambient dataset that captures real-world operating conditions. The nominal data define the static structure of the shuttle system. They include the line timetable with scheduled departure times s i for each trip i N , predefined trip identifiers, ordered stop sequences for each line, and detailed information on station locations and inter-station distances. The operational and ambient data are collected dynamically and include time-resolved records from four primary sources: (i) Shuttle Operation Dataset containing actual arrivals of each shuttle at all designated stops along the lines, (ii) Passenger Counting Dataset comprising boarding and alighting records, (iii) Ambient Condition Dataset providing hourly measurements of air temperature and solar irradiance, and (iv) Electricity Price Dataset containing hourly electricity prices for Paris from open-source records [34].

4.1. Nominal Service Data

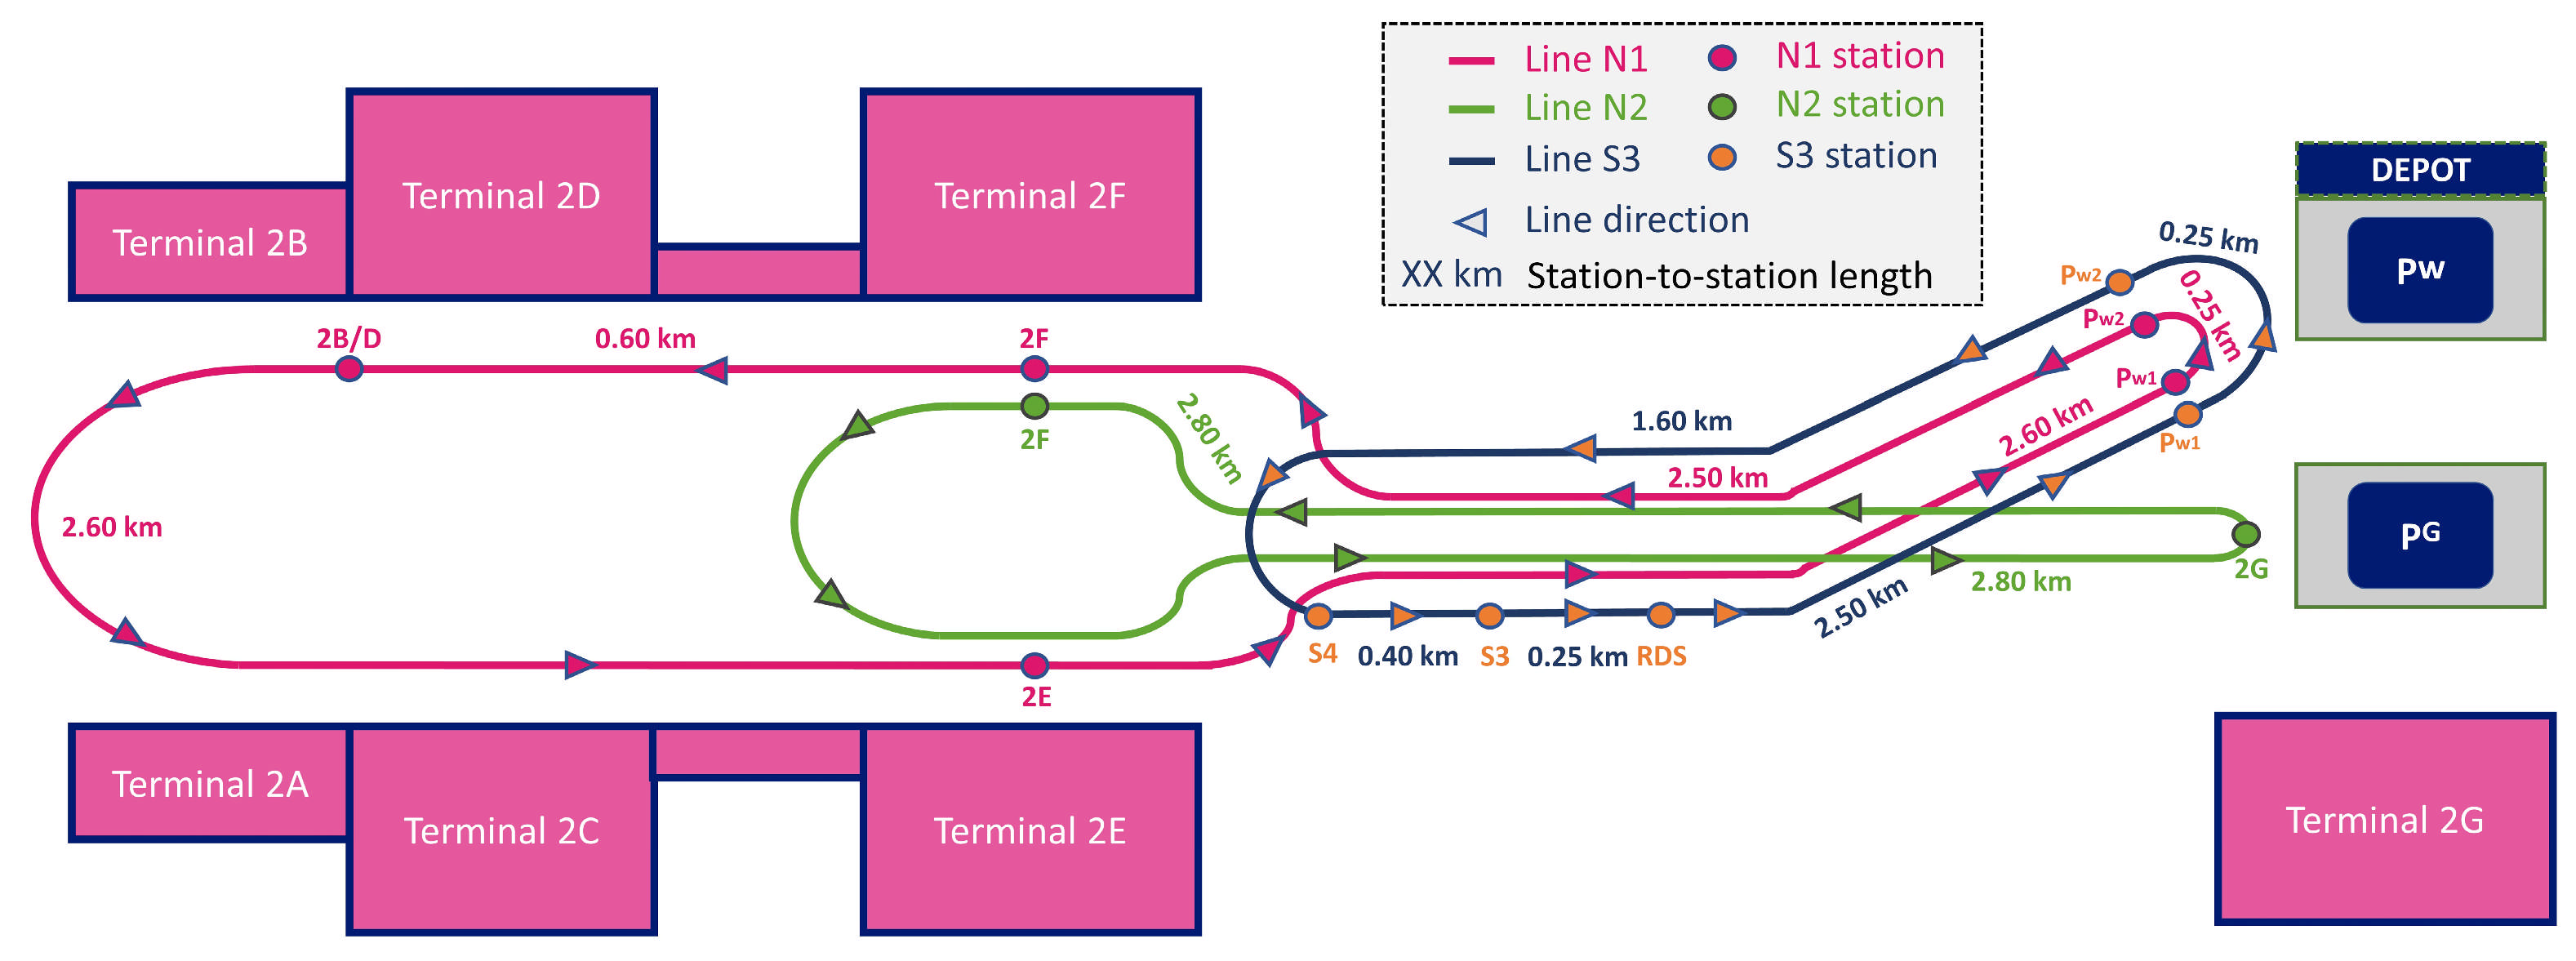
The landside shuttle service at Paris–Charles de Gaulle (CDG) Airport operates 11 12 m HEBs on fixed routes. The shuttle network consists of three dedicated loop lines: N1, N2, and S3, serving different sections of the airport terminal and parking infrastructure as shown in Figure 6. Each line follows a predefined looped route, as illustrated in Figure 6. The detailed information on connected stations, total distance, and other operational statistics is summarized in Table 1. A total of 458 trips are scheduled daily across all lines. Based on the nominal timetable illustrated in Figure 7 and route definitions, each trip i N is associated with an origin S i , and destination E i station and a scheduled departure time s i . In the current scheduling, buses rotate sequentially within each line, with each bus dedicated to a single line. This configuration serves as the baseline for comparison with the optimized scheduling in the next section. The transition from HEBs to EBs is modeled without altering the existing service patterns. A single charging depot D 0 = D n is assumed to be located at the parking area Pw, because (i) it lies adjacent to the shared segment of Lines N1 and S3, allowing for use of joint chargers, (ii) Line N2’s terminal stop (2G) is located close to Pw, enabling detour-based charging with a relatively short deadhead distance, and (iii) the area around Pw would offer sufficient space for installing multiple charging columns and bus parking slots.

4.2. Operational and Ambient Data

This section describes data processing of the multiple sources of raw data described above and outlines the EB energy demand model adopted from [6].

4.2.1. Data Processing

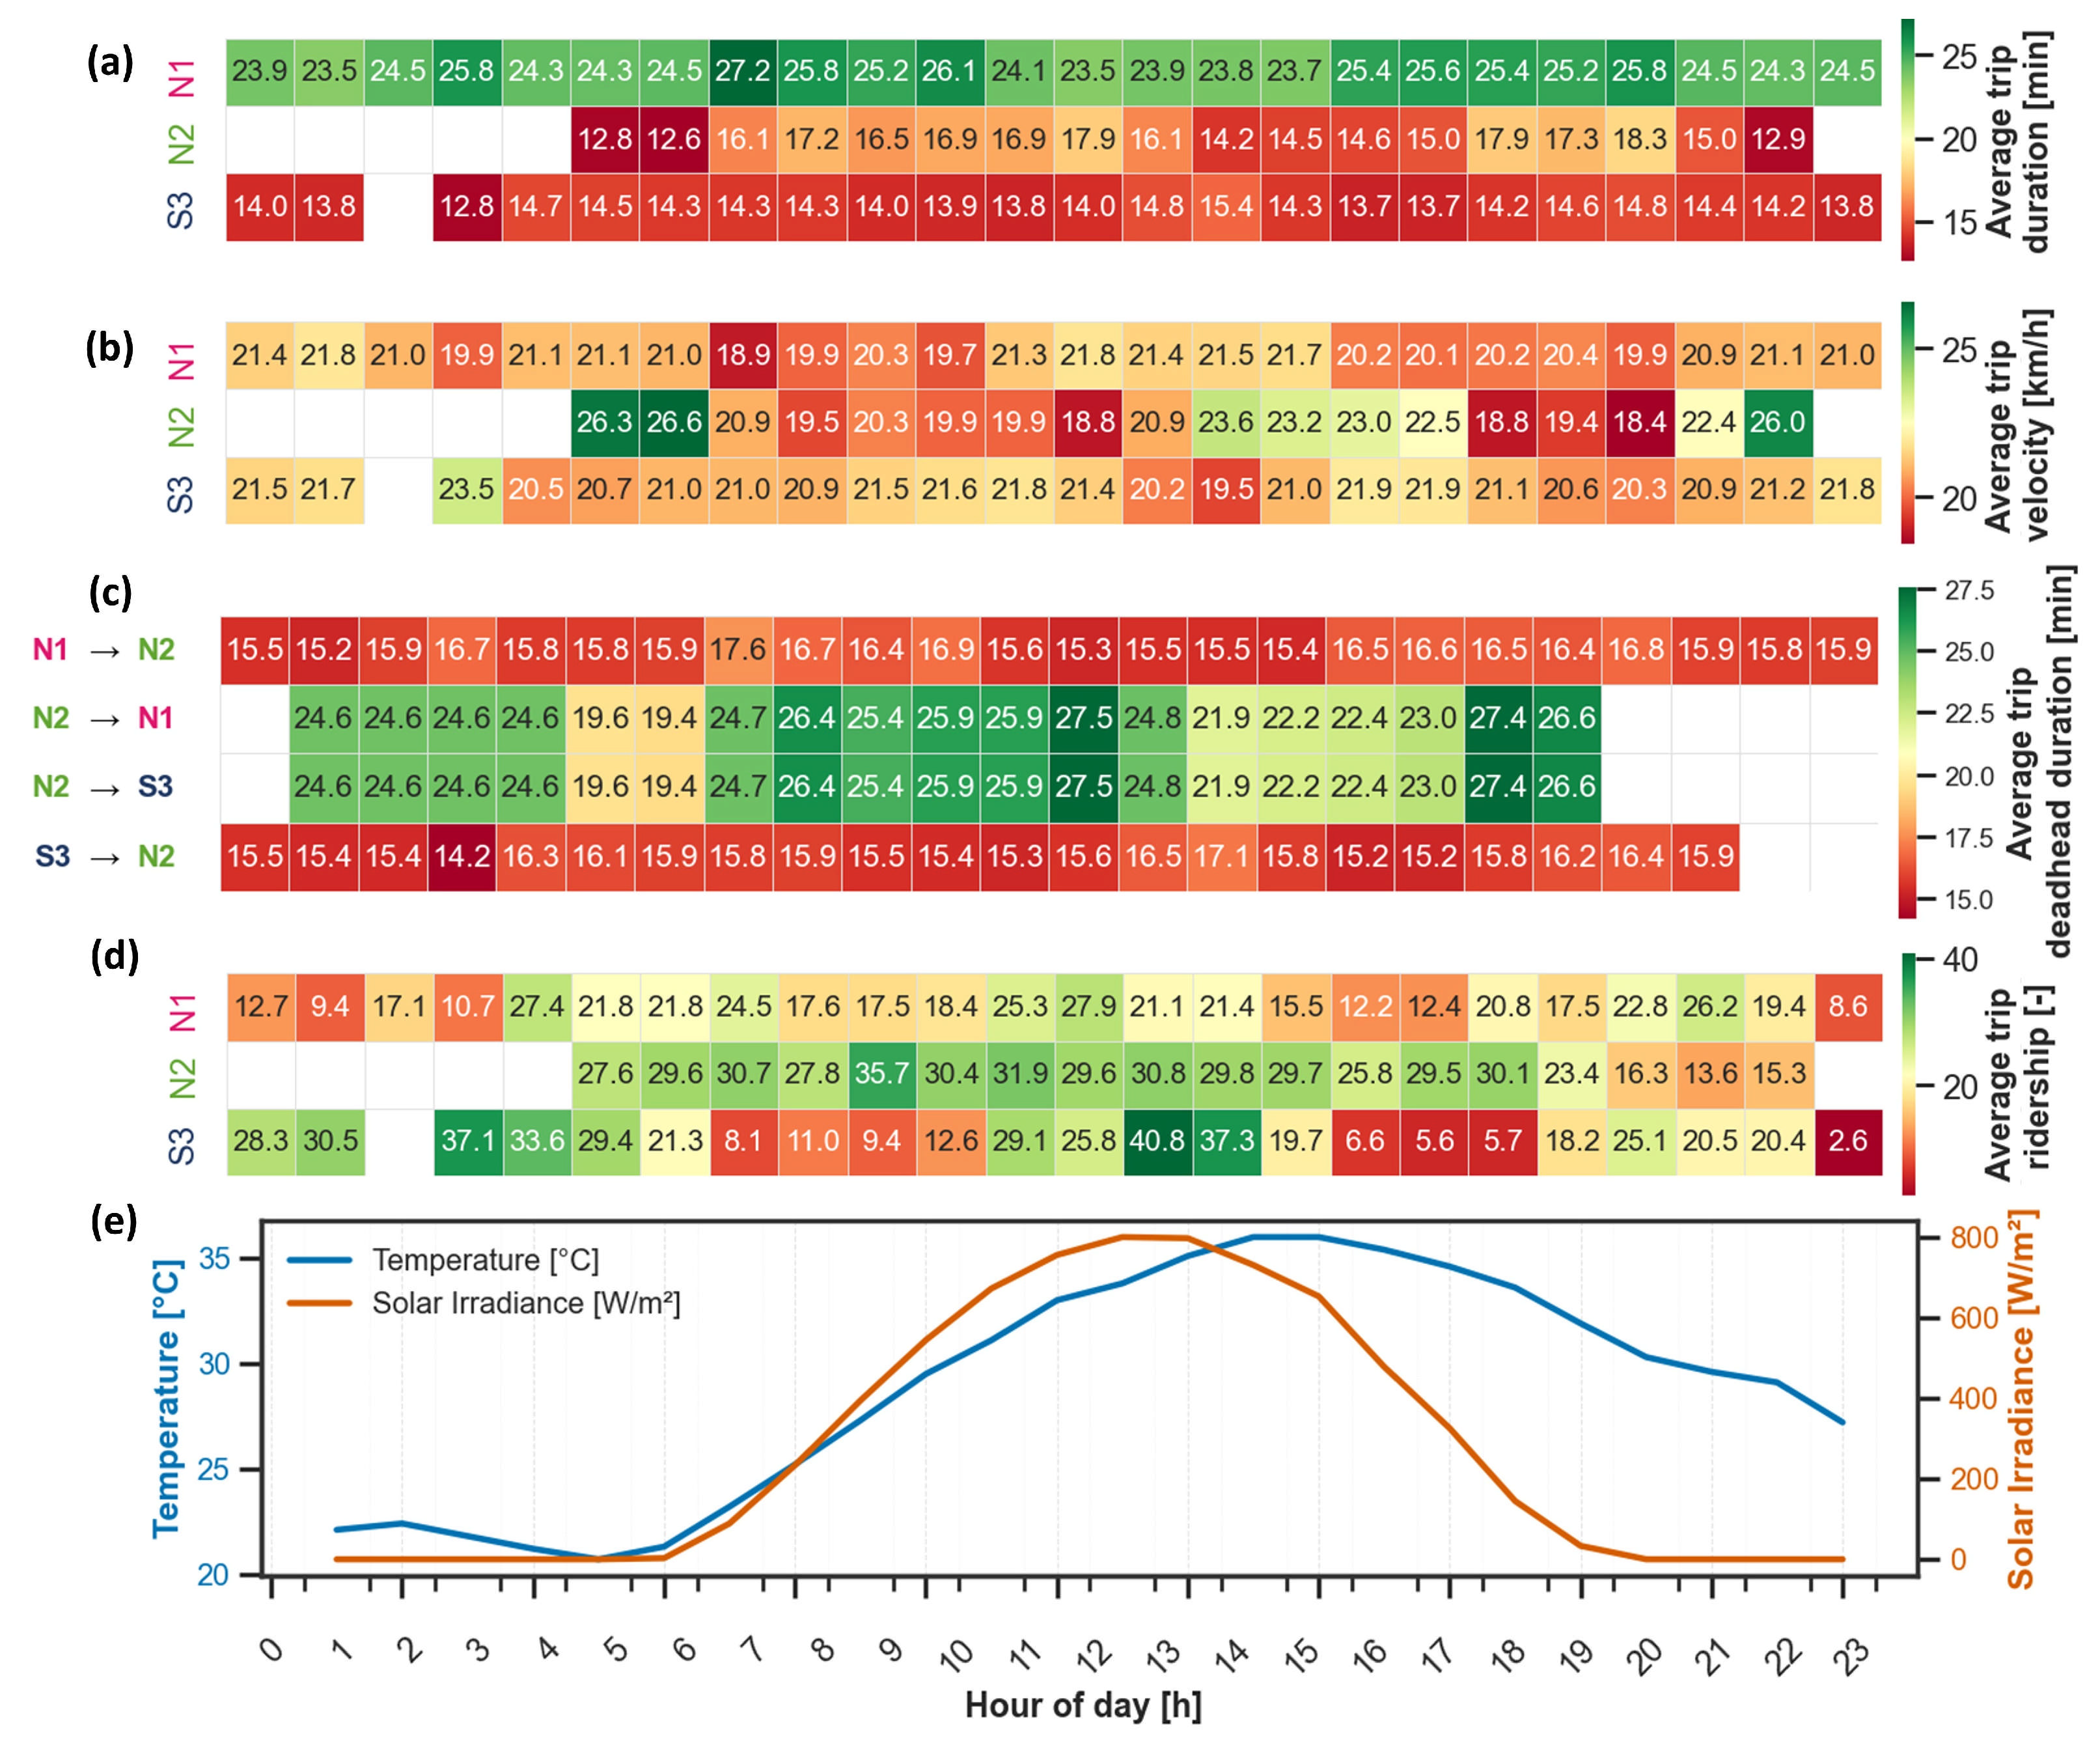
From the Shuttle Operation Dataset, each trip i N is reconstructed as a complete loop along its respective shuttle line by combining the recorded arrival ( s i + t i ) and departure s i times at all stations, including terminals. For every reconstructed trip i N , the travel duration t i is calculated as the time difference between the first S i and last E i recorded stop. The average velocity is then estimated by dividing the total route length by the trip duration t i . These values are aggregated by hour of day and averaged across all operational days within the nine-month observation period. As shown in Figure 8a,b, average trip velocities range from 18 to 27 km/h, with noticeable slowdowns between 7:00–13:00 and 18:00–20:00, indicating peak traffic and/or longer dwell times. Furthermore, deadhead travel times t i j are estimated from the distances of all transitions between the final stop of one line and the starting stop of subsequent line (see Figure 6) and average hourly velocities from Figure 8a. The resulting average deadhead durations are shown in Figure 8c. Using the nominal departure times s i from the timetable (Figure 7), along with the estimated trip durations t i (Figure 8a) and deadhead durations t i j (Figure 8c), the feasible sets of preceding B W i and succeeding F W i trips for each trip i N are determined following the compatibility conditions defined in Equation (1).
The trip-level ridership is determined from the Passenger Counting Dataset by summing net boarding and alighting events and then averaging them on an hourly basis. As shown in Figure 8d, the ridership ranges from 2 to over 40 passengers per trip, with peak loads occurring during morning hours. An inverse correlation with velocity (Figure 8b) is observed, particularly on Line N2, suggesting that high passenger activity contributes to slower travel.
The Ambient Temperature Dataset is first analyzed to identify a representative peak ambient day in terms of EB heating, ventilation, and air conditioning (HVAC) system energy consumption (based on the model presented in the next subsection). The hourly temperature and irradiance values, for the peak day of 30 July 2024, are then extracted, and the resulting ambient profiles are shown in Figure 8e.
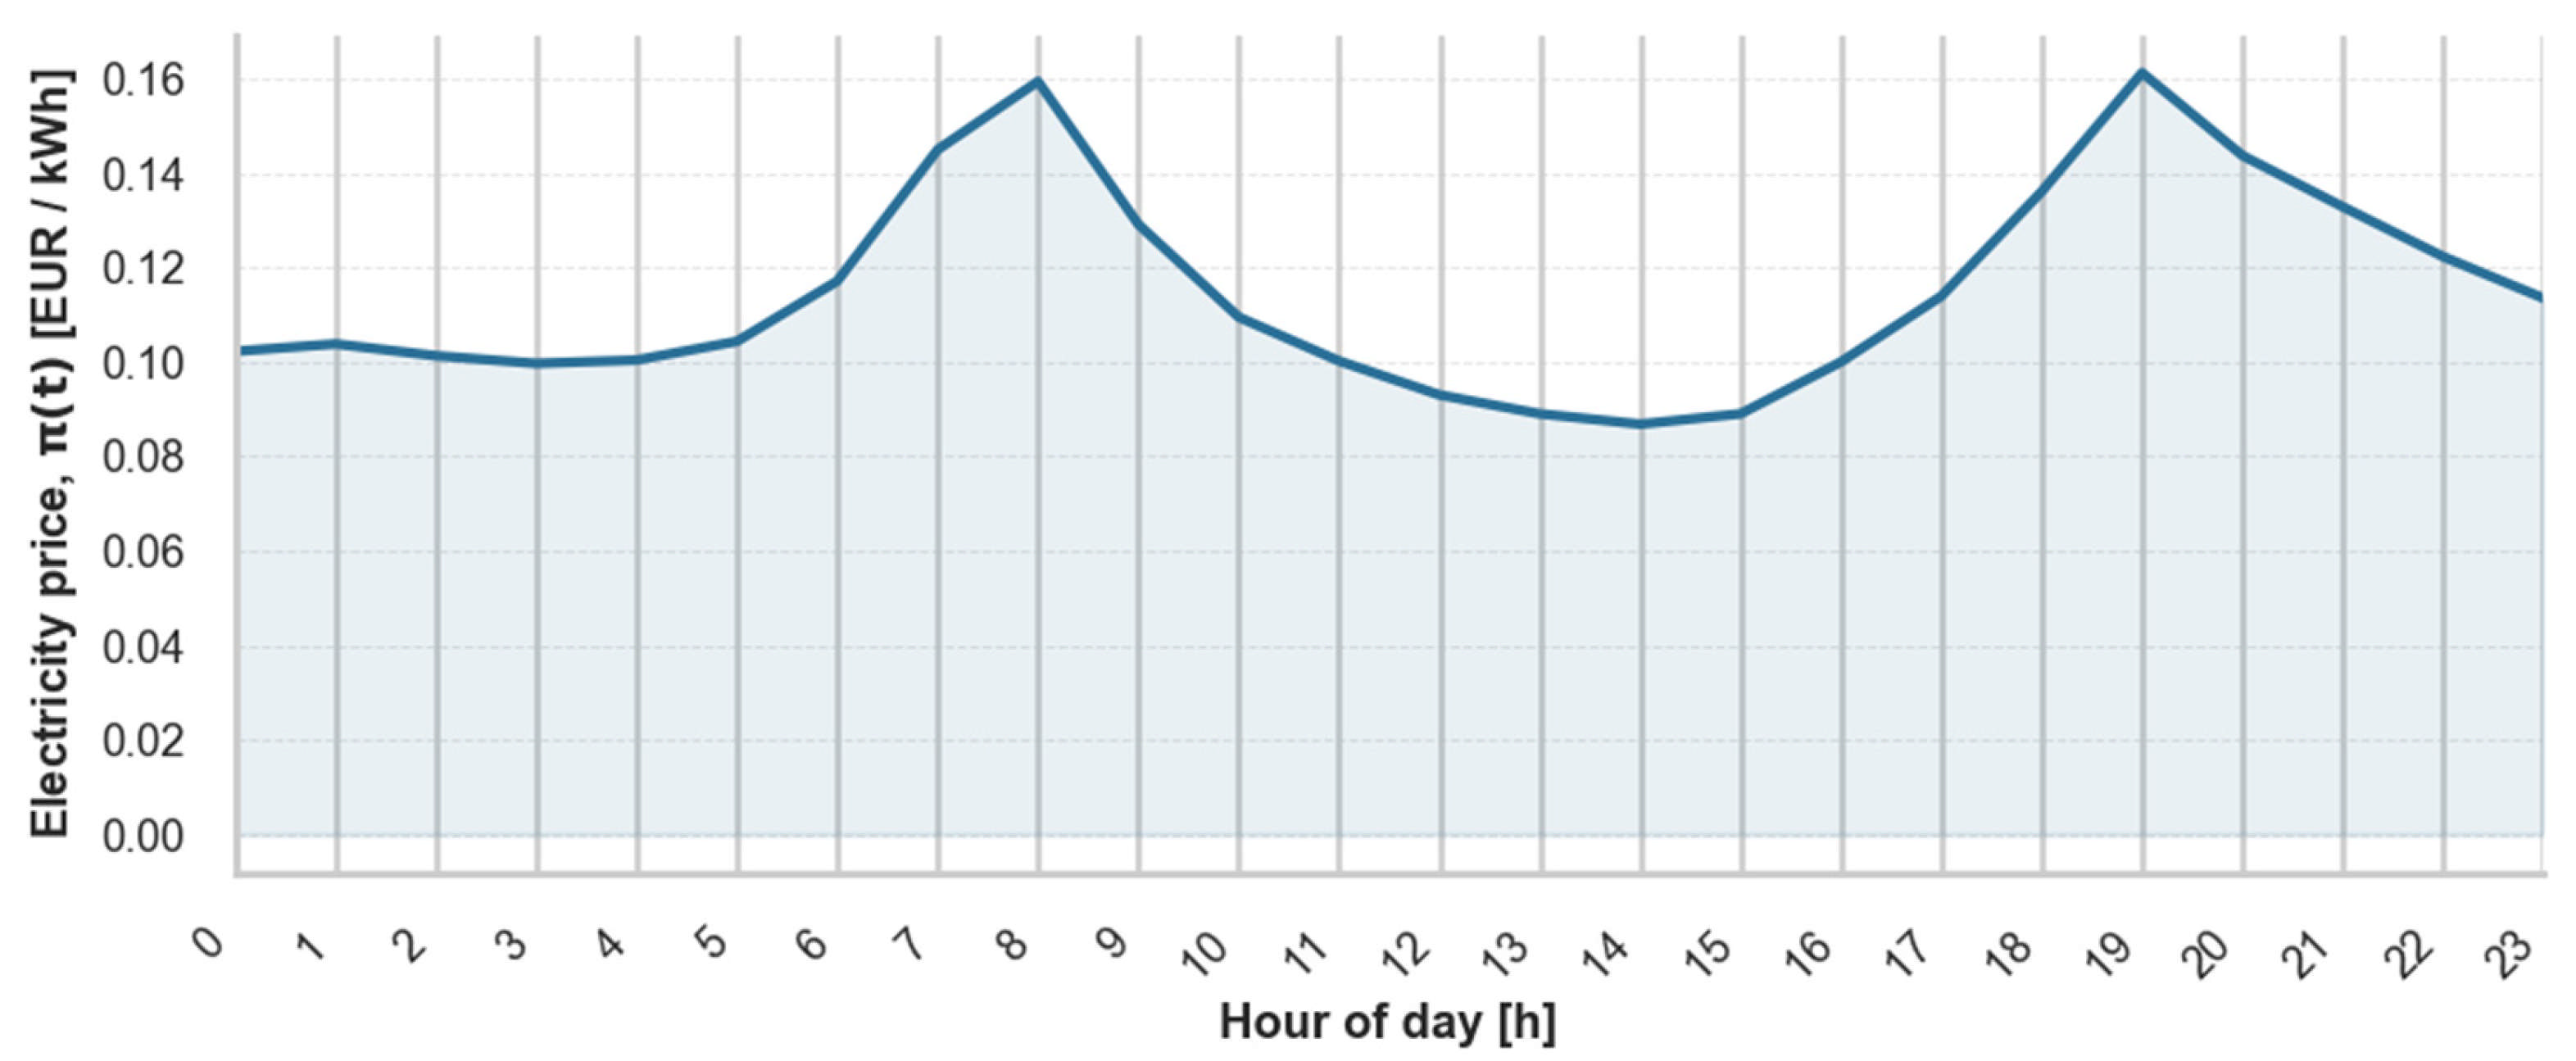
The electricity price profile π ( t ) required by Equation (16) is retrieved from an open-source dataset for France [34]. The selected pricing profile, shown in Figure 9, corresponds to a typical weekday (5 March 2025) that exhibits noticeable price fluctuations in the early morning and evening hours.

4.2.2. Energy Demand Model

To estimate EB energy demand for each trip, a data-driven regression model is adopted from [6]. It is based on a large-scale EB simulation that combines powertrain and HVAC submodels and relies only on trip-level average inputs, making it well suited for large-scale analysis and optimization. In [6], the model was validated against a physical EB simulation previously verified with experimentally recorded energy consumption data. Its extrapolation ability and applicability under varying operating conditions were also demonstrated, further confirming its robustness. The model achieved a coefficient of determination (R2) value of 0.981 on unseen data while running nearly two million times faster than the physical model, thereby offering both accuracy and computational efficiency.
The EB battery energy consumption c i for each trip i N is modeled as follows:
  c i = β 0 + β 1   μ r g + β 2   μ r g 2 + β 3   σ r g 2 + β 4   μ v n ¯ p a s s d i + ( β 5 + β 6 T ¯ a + β 7 Q ˙ ¯ s o l + β 8 n ¯ p a s s + β 9 μ v ) t i ,
where d i is the trip distance, μ v is the average trip velocity, n ¯ p a s s is the average trip ridership, t i is trip duration, T ¯ a is the average trip ambient temperature, Q ˙ ¯ s o l is the average trip solar irradiance, and μ r g and σ r g are the mean and standard deviation of trip road slope, respectively.
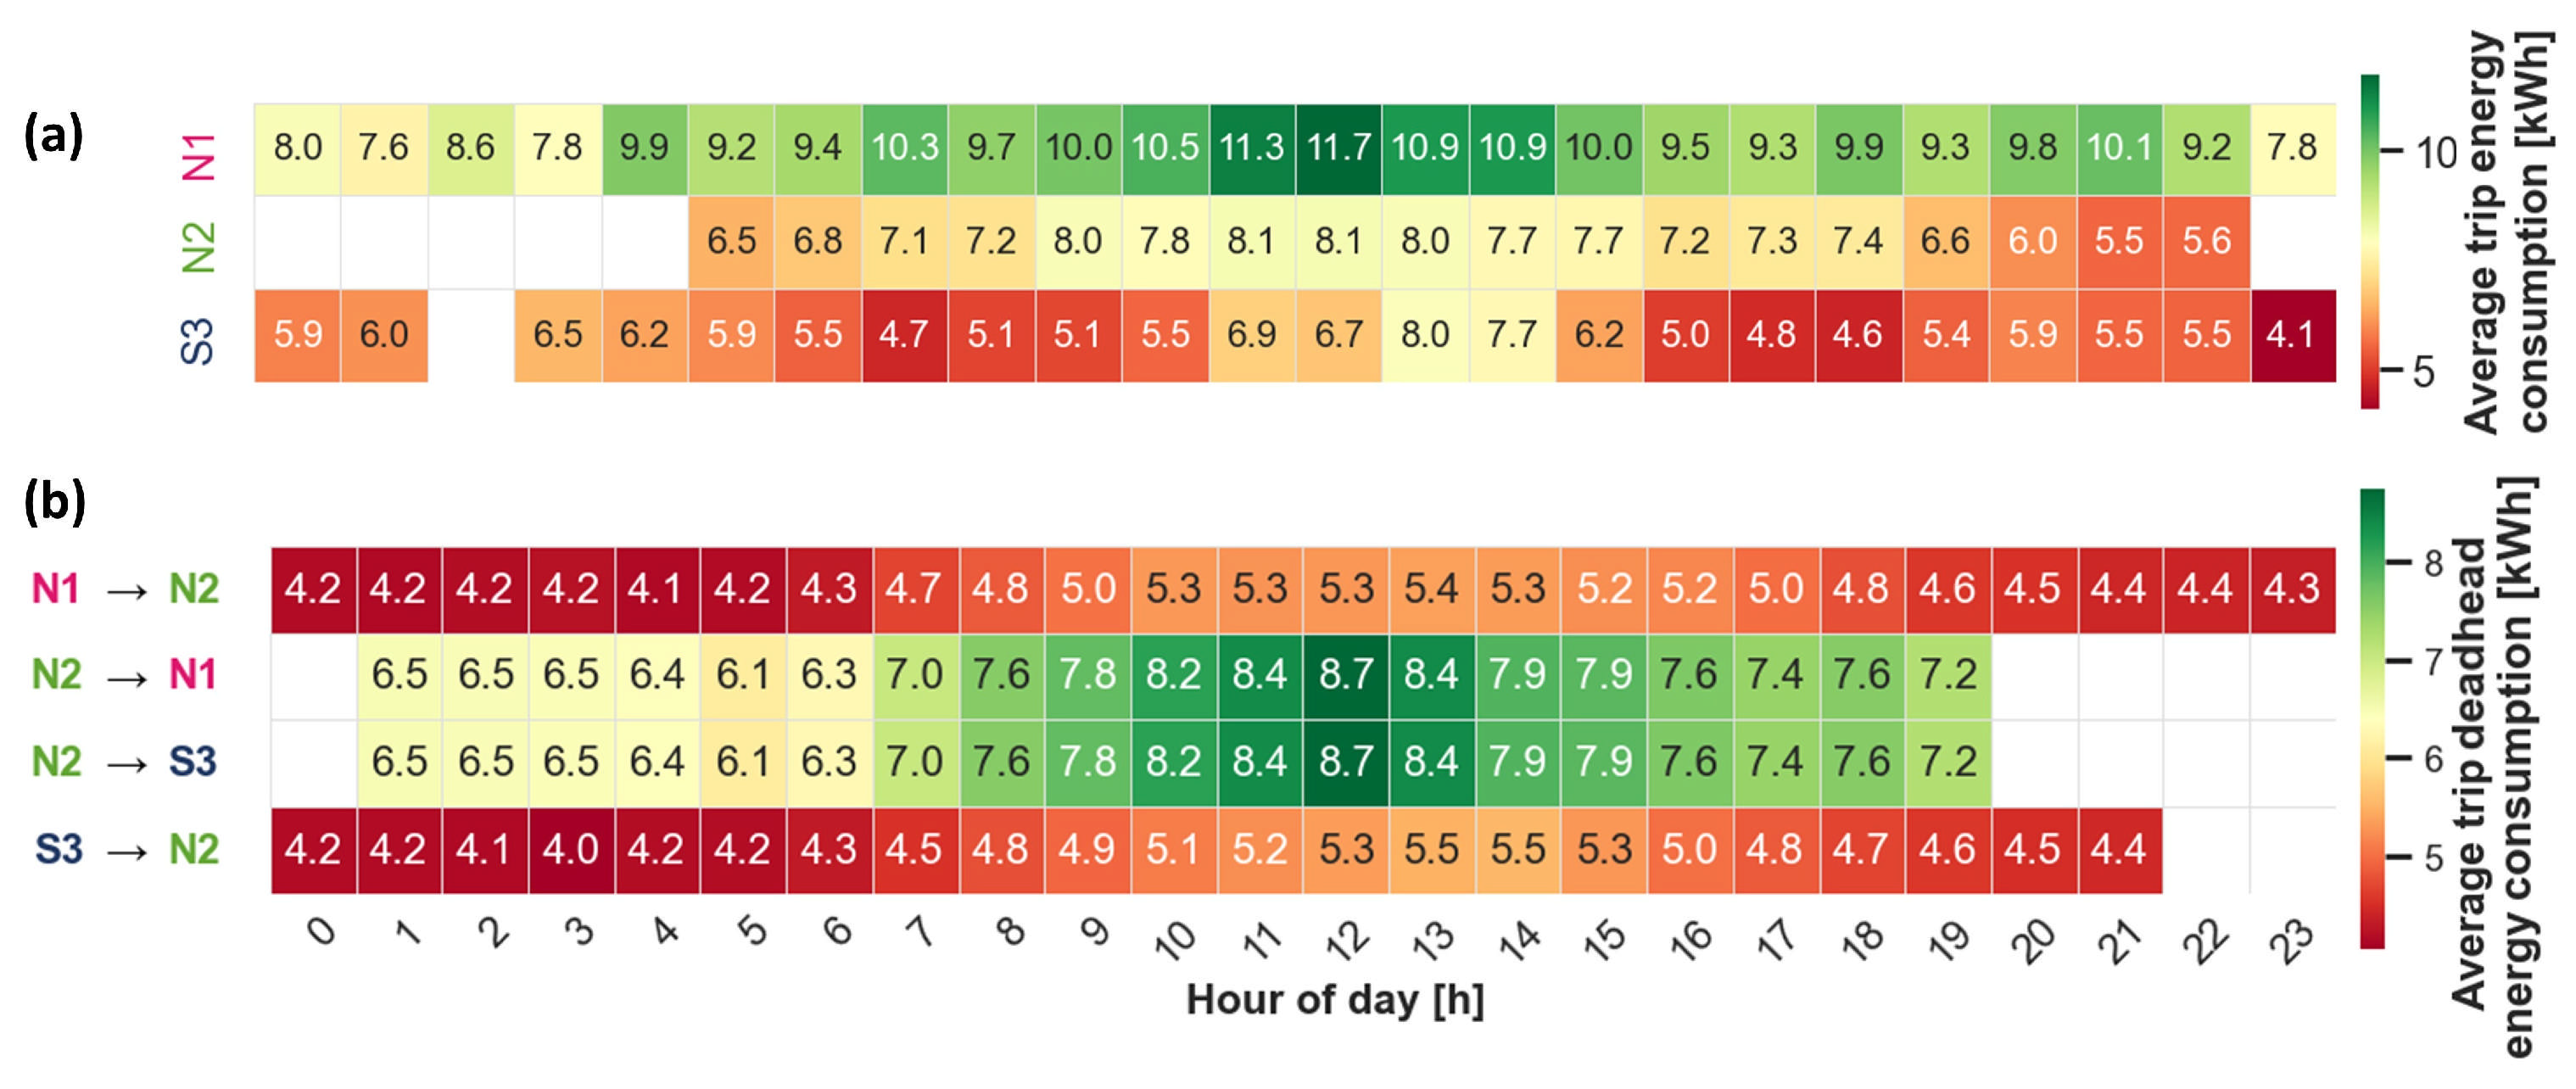
Since the airport road network is flat, the slope-related terms are omitted by setting μ r g = σ r g = 0 . All other model inputs are extracted from the processed transport and ambient data from Figure 8. The resulting hourly estimates of trip-level EB energy demand are presented in Figure 10a.
The deadhead energy demand c i j values are also estimated by using the model (30) but by assuming zero ridership ( n ¯ p a s s = 0 ; no passengers for deadhead transitions). The resulting hourly deadhead energy consumption values are shown in Figure 10b. Notably, no deadhead travel is required between Lines S3 and N1, as they share the terminal/depot station.

5. Results

This section presents the results of applying the methodology outlined in Section 2 and Section 3 to the real-world case study introduced in Section 4, thus demonstrating its effectiveness in optimizing fleet size, battery capacity, and charging infrastructure under realistic constraints.
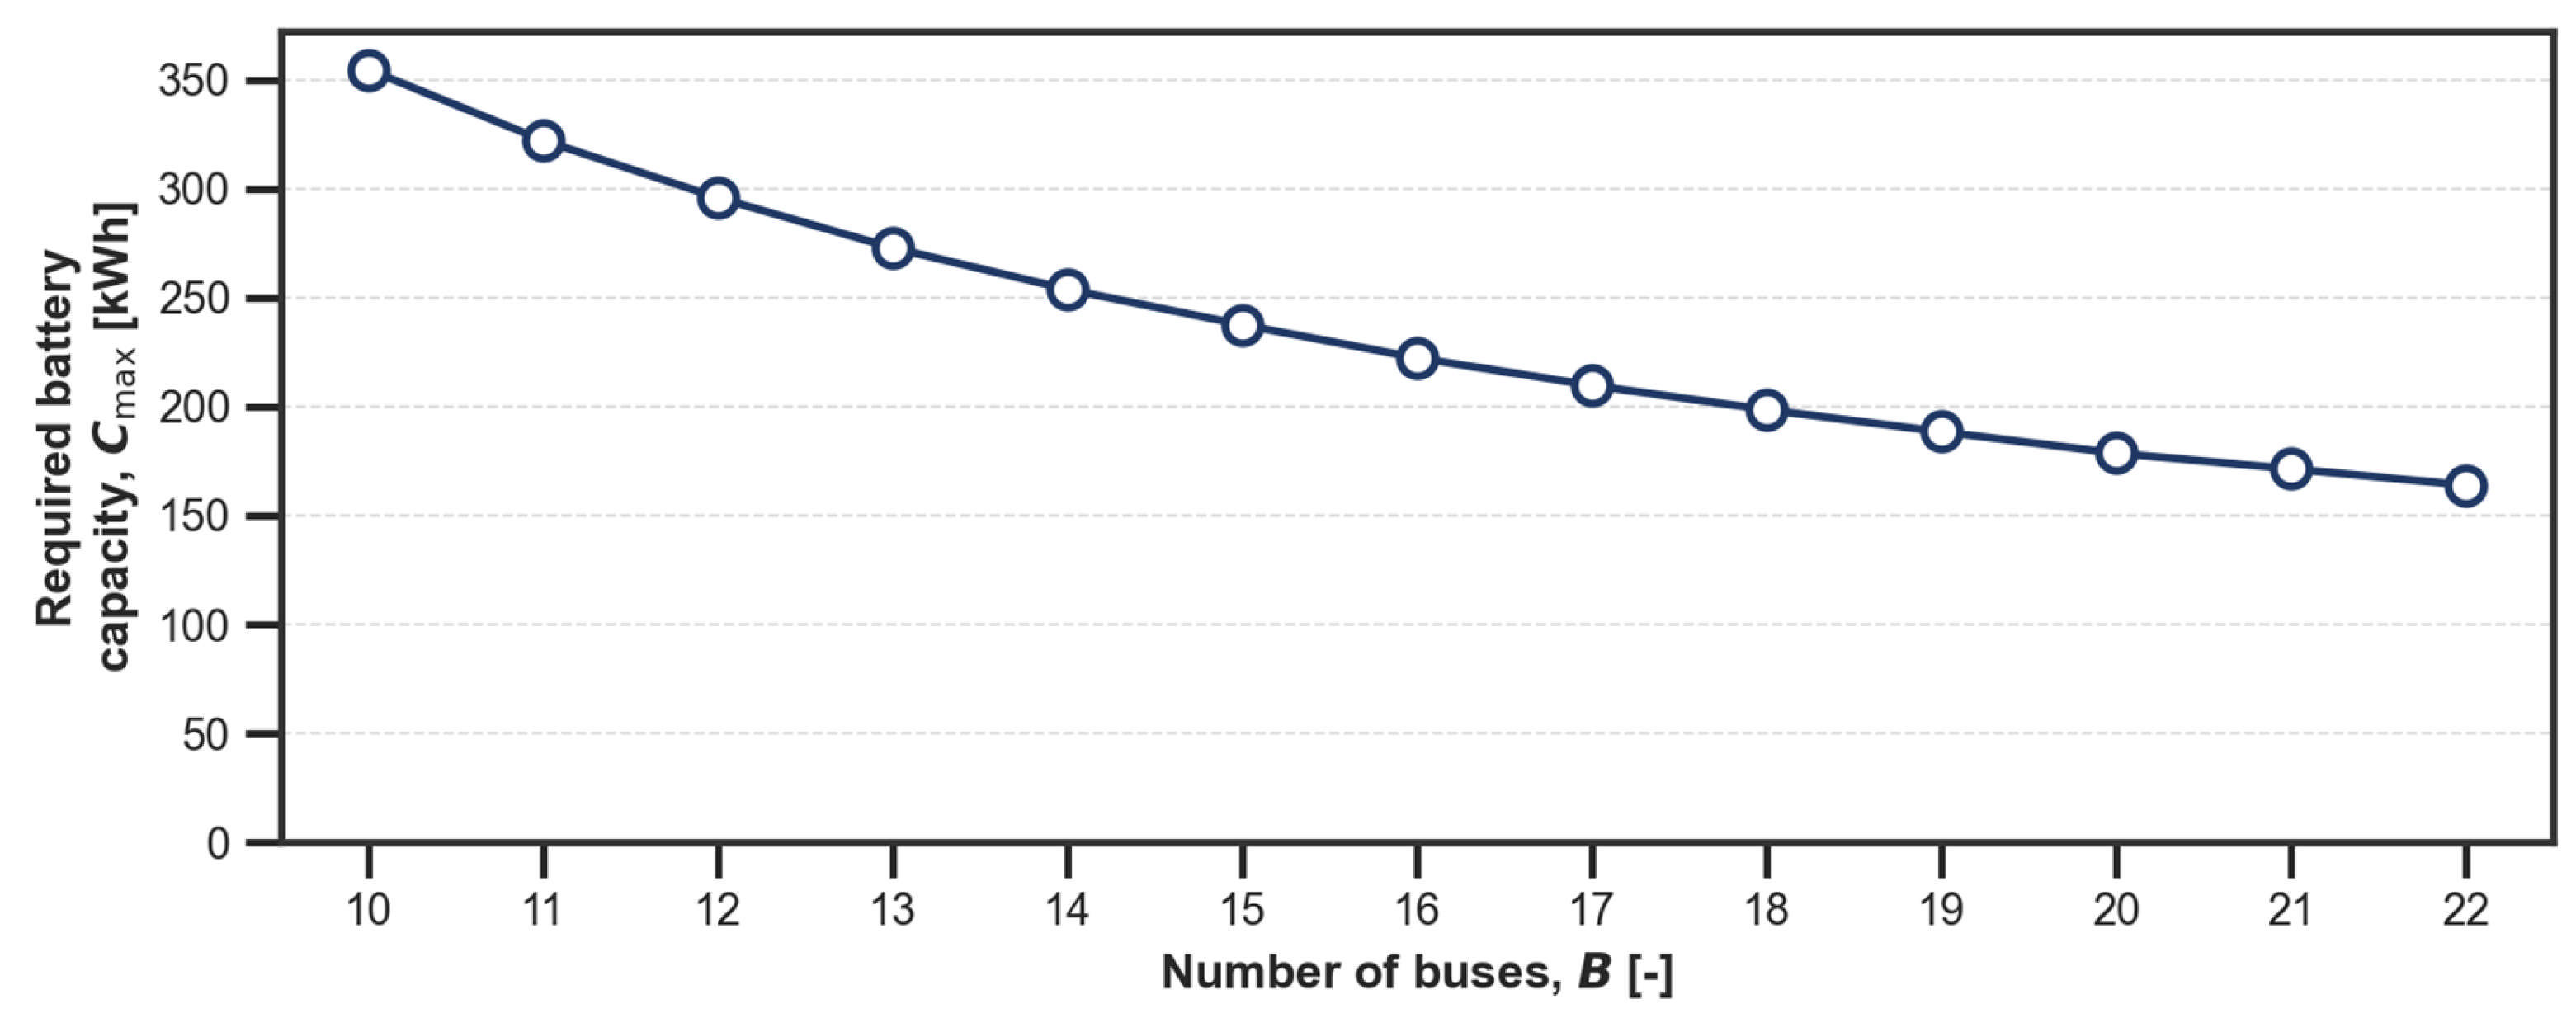
Based on the workflow illustrated in Figure 1, the optimization process first identifies the minimum number of EBs required to fully cover the daily timetable while satisfying all operational and technical constraints (except for the battery capacity). This minimum fleet size is determined to be B m i n = 10 EBs, as indicated in Figure 11.
Once the minimum feasible number of EBs is established, the optimization model is executed for incrementally increasing fleet sizes ( B 10 ), aiming to minimize the maximum battery capacity C m a x B required per EB. As depicted in Figure 11, the required capacity decreases with each additional EB, indicating that distributing trip schedules across more EBs effectively reduces the energy burden on individual EBs. This effect is particularly notable up to around 16 deployed EBs, where each additional bus reduces the required capacity by roughly 25 kWh. Beyond this point, the battery capacity rate reduction gradually diminishes, and the curve tends to saturate for B 21 .
To demonstrate the benefits of the proposed scheduling, the optimized results are compared against the baseline scheduling of the existing HEB fleet (see Section 4.1) transformed to a fully EB operation. The comparative results shown in Table 2 indicate that the maximum required EB battery capacity is reduced by nearly 20% under the optimized approach compared to the baseline for the same fleet size. Even for the minimum fleet of 10 buses, the optimized scheduling requires a lower battery capacity (by around 10%) than in the baseline case.
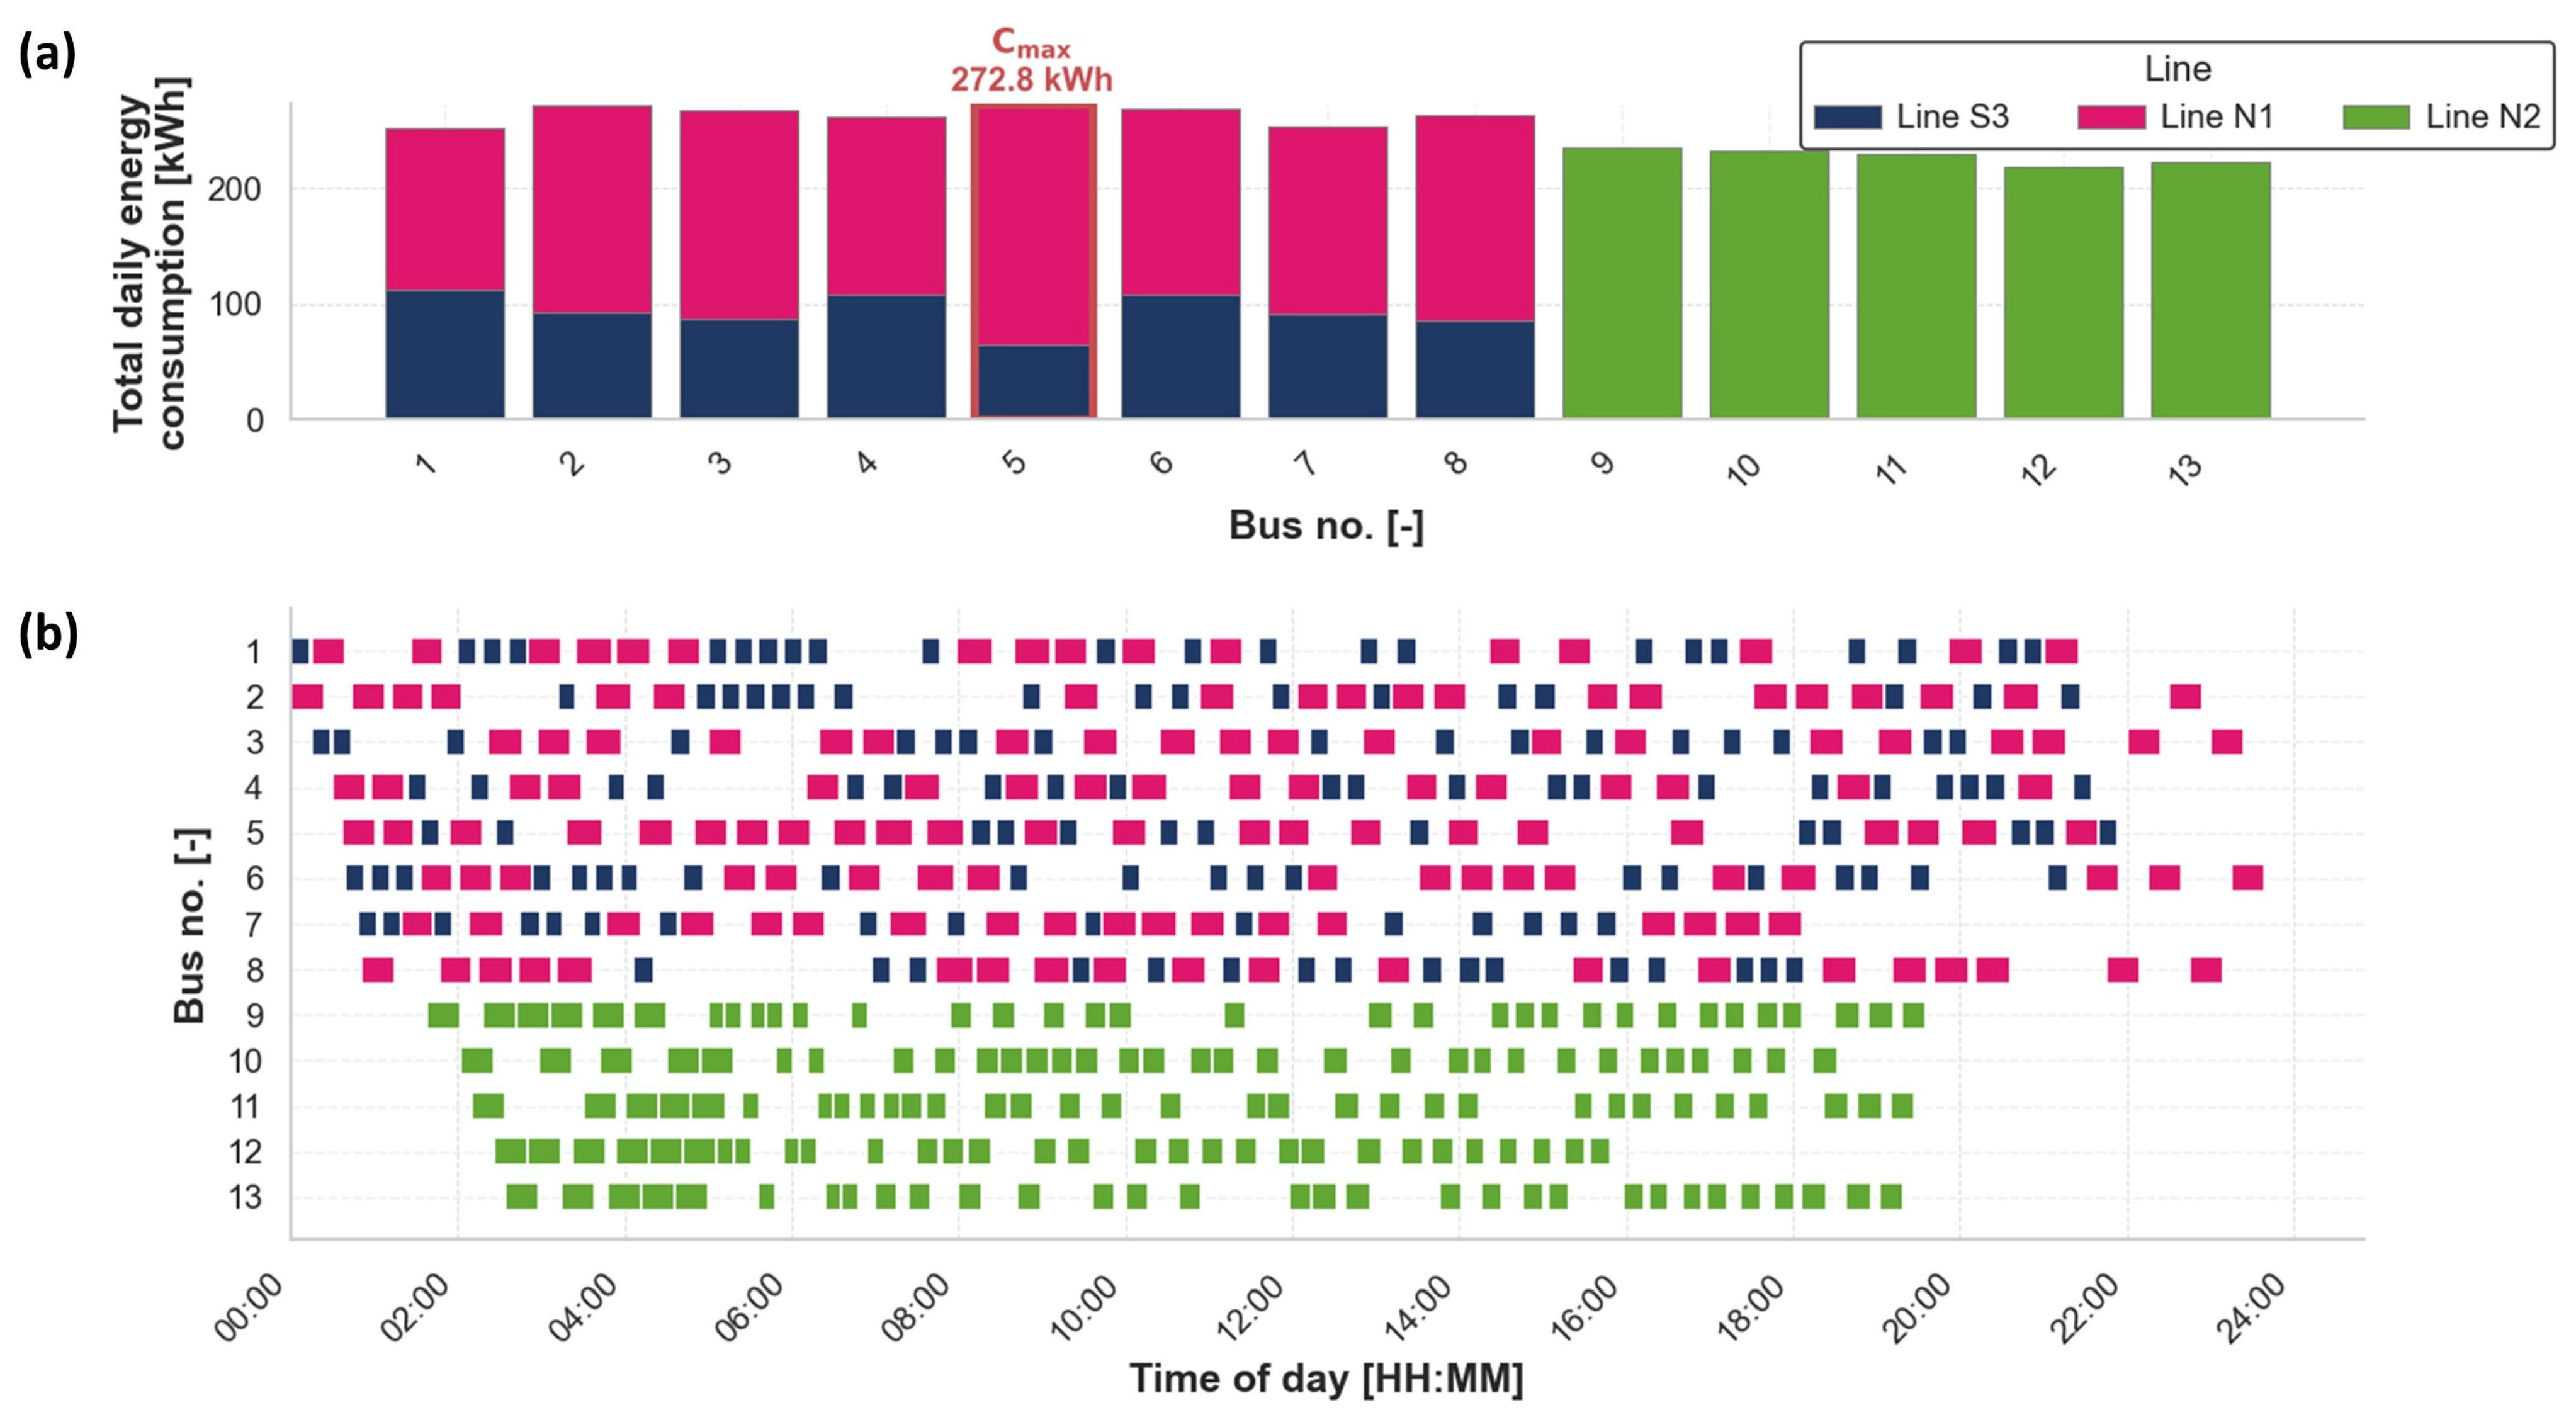
Figure 12 presents the optimized trip assignment and daily energy consumption for the fleet configuration of B = 13 EBs. Figure 12a confirms that daily energy consumption turns out to be well balanced across the fleet. The 5th EB exhibits the highest energy consumption of 272.8 kWh, which sets the minimum required battery capacity for the fleet ( C m a x 13 = 272.8 k W h ; see Figure 11). Figure 12b illustrates the trip assignments, revealing exclusive transitions between Lines S3 and N1, thus avoiding the deadhead transfers involving Line N2 and reducing the energy consumption. Consequently, Line N2 is serviced independently by five dedicated EBs (EBs 9 to 13).
After the optimal trip schedule is determined, the corresponding charging schedule is computed (Step 3 in Figure 1). For every fleet size configuration B shown in Figure 10, the charging scheduling problem is solved to determine three key outcomes: the minimum number of chargers required to satisfy spatial and sequential parking constraints n R B , the maximum charger power needed to ensure charge-sustaining operation of all EBs P * B , and the associated minimum total charging cost Π t o t a l B .
Figure 13 shows the resulting trade-offs across the varying fleet sizes. Although the binary search in Section 3.4 may yield multiple Pareto optimal values for each fleet size B (e.g., higher charger capacity P * B at lower cost Π t o t a l B ), Figure 13 reports only the minimal required charging capacity with its corresponding cost, which is a configuration typically favored by transport providers to reduce infrastructural expenses. As the fleet size increases, more chargers (and correspondingly parking lots) are required due to higher vehicle inflow. Specifically, four chargers (and, thus, 4 × 3 = 12 parking lots; see Figure 2) are sufficient for fleet sizes of 10 and 11 EBs, which gradually grow to seven chargers (and 21 parking lots) for 21 and 22 EBs. Furthermore, as the fleet size increases, the required maximum charger power per EB decreases. This is expected, as the total energy demand is distributed across more EBs that can be charged in parallel. Additionally, each EB is assigned fewer trips, which increases the time between its last ( s l a s t k + t l a s t k ) and first s f i r s t k scheduled trip, thereby widening the parking/charging interval I p a r k k and allowing for more flexible, lower-power charging. However, despite the reduced charger power P * B , the total charging cost Π t o t a l B increases. This is because of more EBs returning from route N2 to the depot for charging, thereby raising deadhead energy. The slower charging rates also reduce the flexibility in selecting favorable electricity price intervals, leading to higher average tariffs across the fleet.
Selection of the optimal design from the Pareto frontier in Figure 13 can be based on the designer’s experience and heuristic rules, or a broader techno-economic analysis (TEA) framework. As described in [5], the total cost of ownership (TCO) assessment would incorporate not only charging costs, but also capital investments in EB, chargers, and battery capacity, along with financing, maintenance, and energy costs over the EB fleet service life.
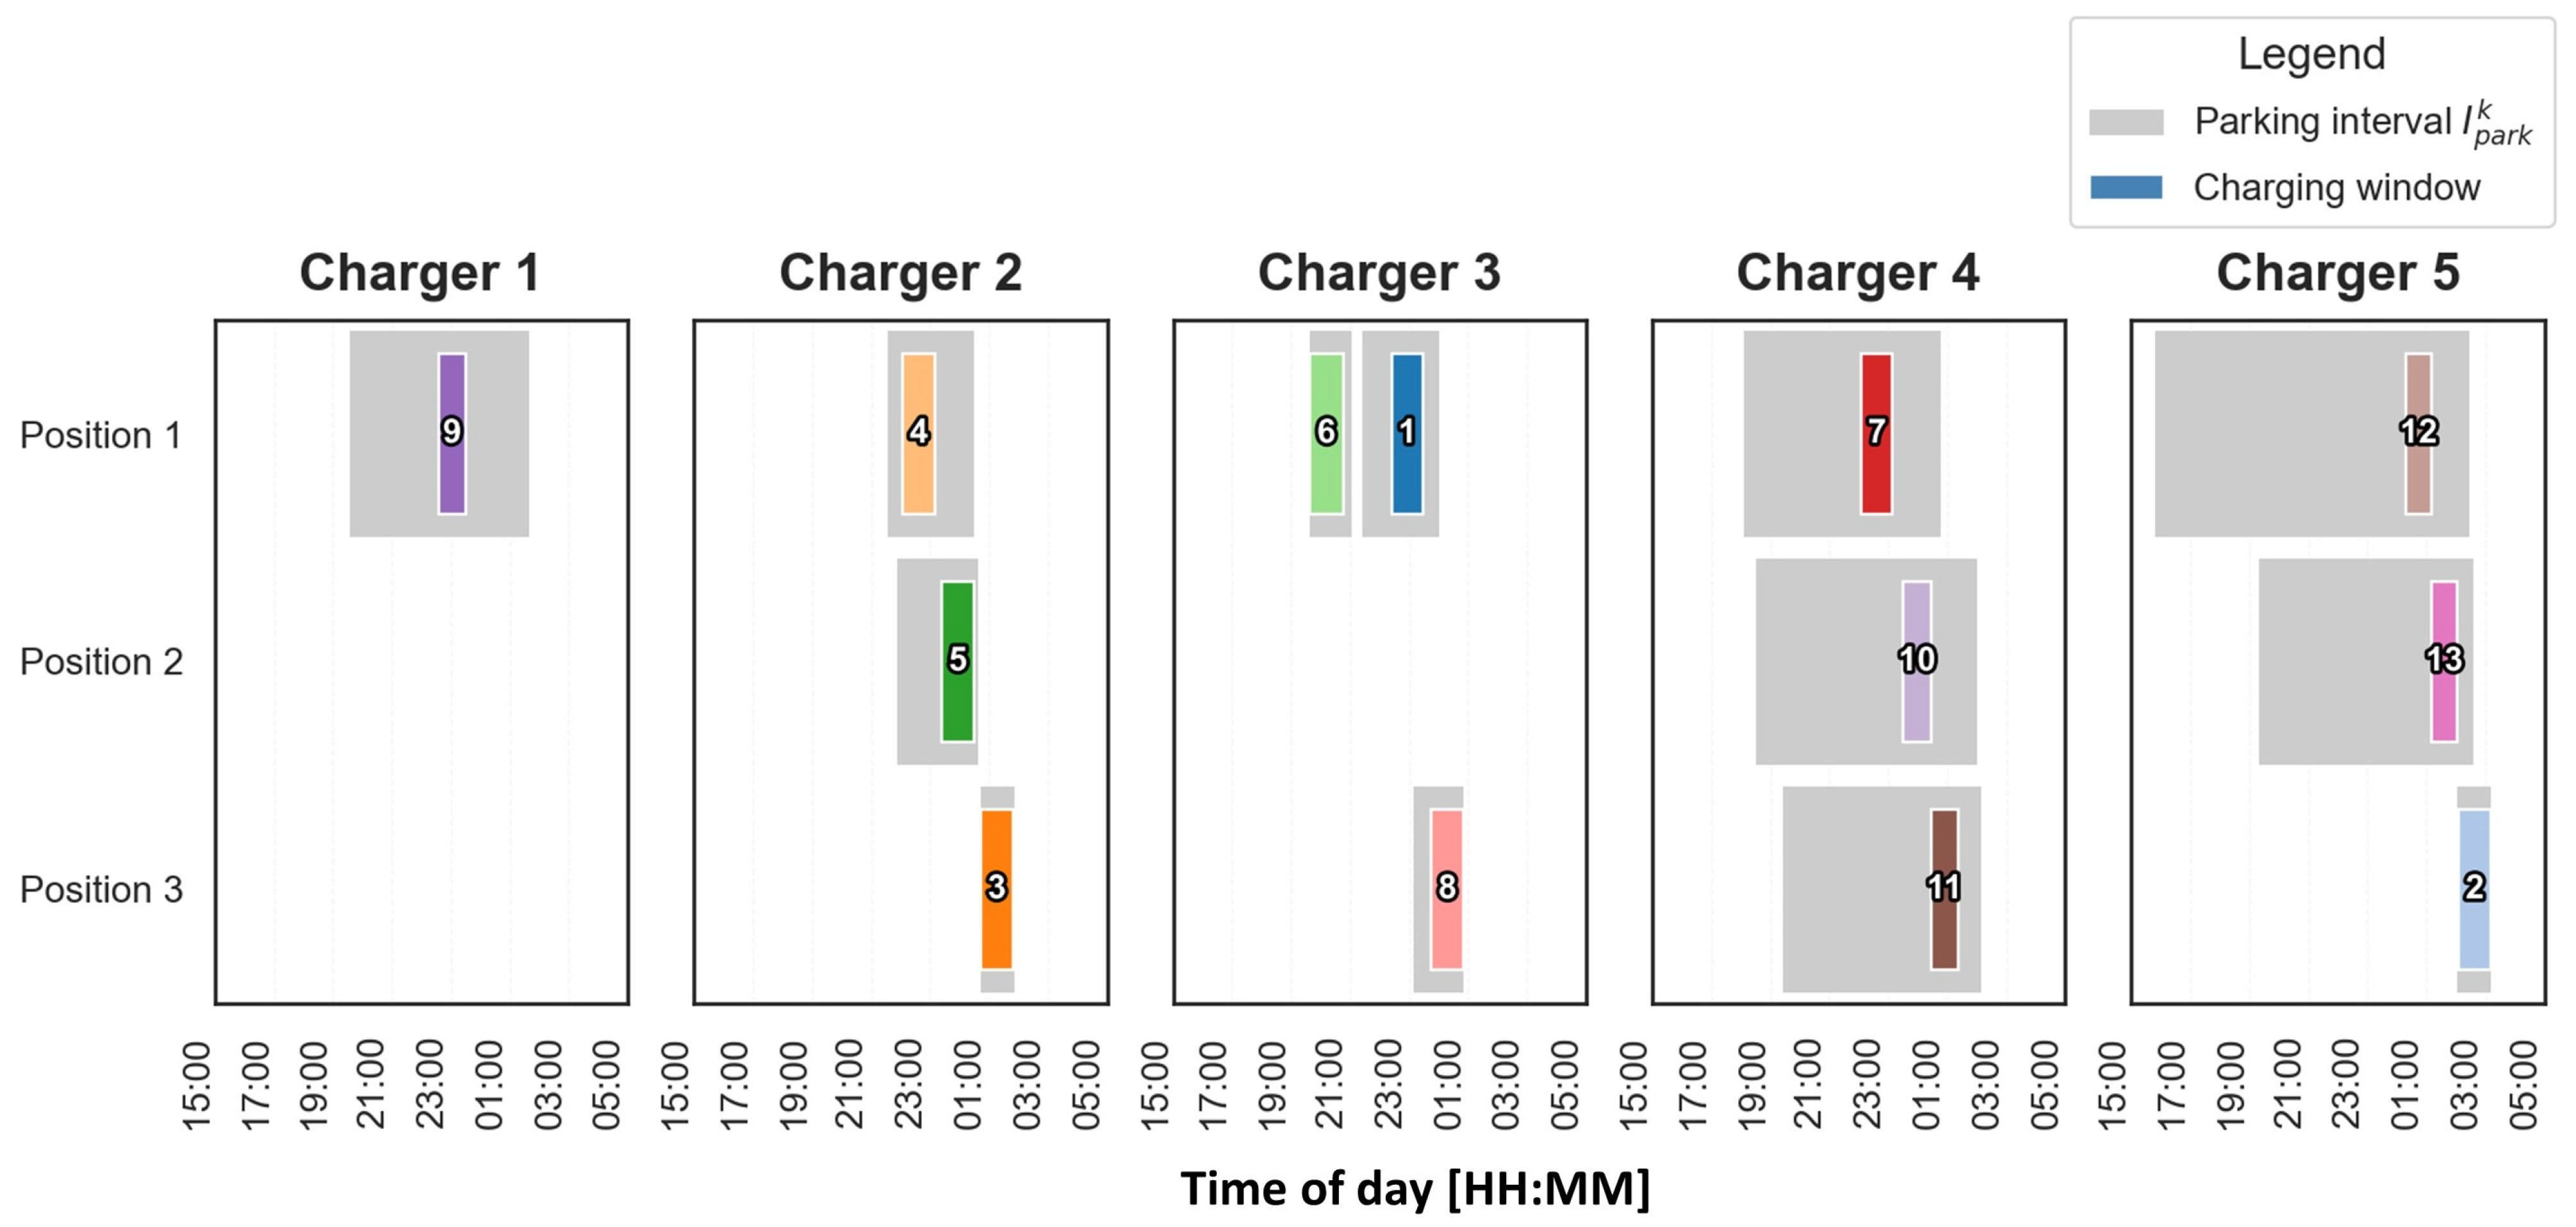
Figure 14 shows the optimized overnight charging schedule for the 13-EB configuration analyzed in Figure 12. A total of five chargers are required to satisfy the depot constraints, with a maximum charger power of P * 13 = 257   k W (Figure 13). This peak power requirement is driven by the tightly constrained charging windows of EBs 2 and 3, whose first and last trips are closely scheduled. The presumably constant charging power P * is determined based on the most demanding EB. In practice, this enables the identification of optimal charging regions, after which the charging power could be locally adjusted downward in a post-processing step for each individual charger or EB, yielding a charging solution that is cheaper and less demanding (e.g., in terms of battery degradation).
The optimal schedule from Figure 14 fully respects the spatial constraints of the depot layout. For instance, on Charger 4, EB 7 is assigned to Position 1 and completes charging before starting charging EBs 10 and 11, which occupy the downstream positions 2 and 3. Departure and arrival times of these three EBs are coordinated to prevent any EB blocking. Additionally, the schedule takes the opportunity of consecutive charging at the same position. For example, on Charger 3 at Position 1, EB 1 begins charging only after EB 6 has departed.
Charging intervals are optimized to minimize the total charging costs by exploiting the variability in electricity prices throughout the night. This strategy is exemplified by EB 12, which arrives at the depot around 16:00 and remains eligible for charging until 03:00, but its actual charging is delayed until after 01:00 to take advantage of the lowest electricity price window (cf. Figure 10).

6. Conclusions

This paper presents a three-stage MILP-based optimization framework for electric bus (EB) fleet scheduling and charging management under realistic operational and infrastructural constraints. The first stage minimizes the number of EBs needed to cover the full timetable under relaxed battery capacity constraints. The second stage determines the minimum required EB battery capacity based on energy-feasible trip assignments. The third stage optimizes overnight charging to minimize the number of chargers, the total charging energy cost, and the rated charger power, subject to spatial and sequential parking constraints. To maintain linearity for the feasible MILP, charging power is treated as a fixed parameter, and a binary search is used to identify its minimum feasible value for each charger count.
The methodology is demonstrated through a real-world case study of Paris–Charles de Gaulle (CDG) Airport’s landside bus shuttle lines with heterogeneous operational profiles. High-resolution recorded data, including vehicle tracking, passenger count, and ambient conditions, are used to accurately model EB energy demand across trips and deadhead transitions based on a previously established trip-based data-driven model. The scheduling optimization results show that the model successfully minimizes fleet size and required battery capacity while ensuring full service coverage. As fleet size increases, the trip assignments become more evenly distributed, reducing the peak energy demand per EB (i.e., the EB battery capacity). However, beyond a certain number of EBs, further increases in fleet size offer limited benefits, indicating a saturation-like point in minimum required battery capacity. The charging optimization results reveal that, while a larger fleet allows for lower charger power due to increased flexibility and parallelization, it also increases infrastructure needs. Moreover, slower charging extends the duration of charging sessions, reducing flexibility in aligning energy use with the lowest electricity tariff periods, which can lead to higher overall charging costs.
Overall, the proposed framework enables systematic assessment of trade-offs between fleet sizing, battery dimensioning, infrastructure investment, and energy cost efficiency. These insights support data-driven decision making for fleet operators and transport planners.
Future work can be directed towards extending the framework to include the optimization of charging station placement, bus timetables, and bus crew scheduling, as well as incorporating dynamic charging pricing and stochastic transport system inputs such as ridership and departure/arrival times. Further extensions could focus on enriching the EB energy consumption model, for example by accounting for the impact of battery capacity on EB mass and, consequently, on overall energy demand. Moreover, techno-economic analyses should be conducted to identify cost-optimal fleet configurations under total cost of ownership (TCO) considerations, where battery degradation and replacement costs should also be considered. To enhance scalability for large-scale systems, metaheuristic methods such as genetic algorithms could be explored, particularly for incorporating fast and opportunity charging at multiple charging locations.

Author Contributions

Conceptualization, Z.D. and J.D.; methodology, Z.D. and J.D.; software, Z.D.; validation, Z.D.; formal analysis, Z.D. and J.D.; investigation, Z.D.; resources, J.D.; data curation, Z.D.; writing—original draft preparation, Z.D.; writing—review and editing, J.D.; visualization, Z.D.; supervision, J.D.; project administration, J.D.; funding acquisition, J.D. All authors have read and agreed to the published version of the manuscript.

Funding

It is gratefully acknowledged that this work has been supported by the European Commission through Horizon 2020 Innovation action project OLGA (“hOListic Green Airport”) under Grant Agreement No. 101036871.

Data Availability Statement

The data are not publicly available due to privacy restrictions of related transport companies.

Acknowledgments

The authors are grateful to Transdev Group, Issy-les-Moulineaux, France, and Groupe Aéroports de Paris, Tremblay-en-France, France, for their technical and data support. The authors’ appreciation goes to Branimir Škugor for detailed proofreading of the manuscript and providing helpful suggestions.

Conflicts of Interest

The authors declare no conflict of interest.

Abbreviations

The following abbreviations are used in this manuscript:
ALNS–BBAdaptive Large Neighborhood Search and Branch and Bound
CDGCharles de Gaulle
CSPCharging Scheduling Problem
EBElectric Bus
EBSPElectric Bus Scheduling Problem
HEBHybrid Electric Buses
HVACHeating, Ventilation, and Air Conditioning
MILPMixed-Integer Linear Program
TEATechno-Economic Analysis
TCOTotal Cost of Ownership
ToUTime-of-Use
VSPVehicle Scheduling Problem

References

  1. Braun, A.; Rid, W. Energy consumption of an electric and an internal combustion passenger car: A comparative case study from real-world data on the Erfurt circuit in Germany. Transp. Res. Procedia 2017, 27, 468–475. [Google Scholar] [CrossRef]
  2. Kalghatgi, G. Is it really the end of internal combustion engines and petroleum in transport? Appl. Energy 2018, 225, 965–974. [Google Scholar] [CrossRef]
  3. Paul, T.; Yamada, H. Operation and charging scheduling of electric buses in a city bus route network. In Proceedings of the 17th International IEEE Conference on Intelligent Transportation Systems (ITSC), Qingdao, China, 8–11 October 2014; pp. 2780–2786. [Google Scholar]
  4. Li, J.Q. Battery-electric transit bus developments and operations: A review. Int. J. Sustain. Transp. 2014, 10, 157–169. [Google Scholar] [CrossRef]
  5. Topić, J.; Soldo, J.; Maletić, F.; Škugor, B.; Deur, J. Virtual simulation of electric bus fleets for city bus transport electrification planning. Energies 2020, 13, 23. [Google Scholar] [CrossRef]
  6. Dabčević, Z.; Škugor, B.; Cvok, I.; Deur, J. A trip-based data-driven model for predicting battery energy consumption of electric city buses. Energies 2024, 17, 911. [Google Scholar] [CrossRef]
  7. Dabčević, Z.; Škugor, B.; Topić, J.; Deur, J. Synthesis of driving cycles based on low-sampling-rate vehicle-tracking data and Markov chain methodology. Energies 2022, 15, 4108. [Google Scholar] [CrossRef]
  8. Matković, D.; Topić, J.; Škugor, B.; Deur, J. Search space reduction-supported multi-objective optimization of charging system configuration for electrified city bus transport system. In Proceedings of the 17th Conference on Sustainable Development of Energy, Water and Environment Systems (SDEWES), Paphos, Cyprus, 6–10 November 2022. [Google Scholar]
  9. Xiang, Y.; Wang, S.; Su, T.; Li, J.; Mao, S.S.; Geimer, M. KIT Bus: A Shuttle Model for CARLA Simulator. In Proceedings of the 2021 IEEE Industrial Electronics and Applications Conference (IEACon), Penang, Malaysia, 21–22 November 2021; pp. 7–12. [Google Scholar]
  10. Solomon, M.M. Algorithms for the vehicle routing and scheduling problems with time window constraints. Oper. Res. 1987, 35, 254–265. [Google Scholar] [CrossRef]
  11. Sung, Y.W.; Chu, J.C.; Chang, Y.J.; Yeh, J.C.; Chou, Y.H. Optimizing mix of heterogeneous buses and chargers in electric bus scheduling problems. Simul. Model. Pract. Theory 2022, 119, 102584. [Google Scholar] [CrossRef]
  12. Jiang, M.; Zhang, Y.; Zhang, Y. Multi-depot electric bus scheduling considering operational constraints and partial charging: A case study in Shenzhen, China. Sustainability 2022, 14, 255. [Google Scholar] [CrossRef]
  13. Brinkel, N.; Zijlstra, M.; van Bezu, R.; van Twuijver, T.; Lampropoulos, I.; van Sark, W. A comparative analysis of charging strategies for battery electric buses in wholesale electricity and ancillary services markets. Transp. Res. Part E Logist. Transp. Rev. 2023, 172, 103085. [Google Scholar] [CrossRef]
  14. Behnia, F.; Schuelke-Leech, B.A.; Mirhassani, M. Optimizing sustainable urban mobility: A comprehensive review of electric bus scheduling strategies and future directions. Sustain. Cities Soc. 2024, 108, 104297. [Google Scholar] [CrossRef]
  15. Dabčević, Z.; Škugor, B.; Deur, J. Pareto optimization of electric city bus scheduling. In Proceedings of the 18th Conference on Sustainable Development of Energy, Water and Environment Systems (SDEWES), Dubrovnik, Croatia, 24–29 September 2023. [Google Scholar]
  16. Sobhani, E.; Yassine, A.; Ameli, A.; Riahinia, S. Overnight Charging Mechanism of Battery Electric Buses for a Transit Network in Smart Cities. In Proceedings of the 2024 5th Technology Innovation Management and Engineering Science International Conference (TIMES-iCON), Bangkok, Thailand, 19–21 January 2024; pp. 1–5. [Google Scholar]
  17. Rinaldi, M.; Parisi, F.; Laskaris, G.; D’Ariano, A.; Viti, F. Optimal dispatching of electric and hybrid buses subject to scheduling and charging constraints. In Proceedings of the 21st International Conference on Intelligent Transportation Systems (ITSC), Maui, HI, USA, 4–7 November 2018; pp. 41–46. [Google Scholar]
  18. Škugor, B.; Grden, L.; Deur, J. Hierarchical model predictive control-based electric vehicle fleet charging management. Energy Convers. Manag. 2025, 342, 120119. [Google Scholar] [CrossRef]
  19. Moradipari, A.; Tucker, N.; Zhang, T.; Cezar, G.; Alizadeh, M. Mobility-aware smart charging of electric bus fleets. In Proceedings of the IEEE Power & Energy Society General Meeting (PESGM), Montreal, QC, Canada, 2–6 August 2020; pp. 1–5. [Google Scholar]
  20. Zhou, G.-J.; Xie, D.-F.; Zhao, X.-M.; Lu, C. Collaborative optimization of vehicle and charging scheduling for a bus fleet mixed with electric and traditional buses. IEEE Access 2020, 8, 8056–8072. [Google Scholar] [CrossRef]
  21. Wu, W.; Lin, Y.; Liu, R.; Jin, W. The multi-depot electric vehicle scheduling problem with power grid characteristics. Transp. Res. Part B Methodol. 2022, 155, 322–347. [Google Scholar] [CrossRef]
  22. Li, P.; Jiang, M.; Zhang, Y.; Zhang, Y. Cooperative optimization of bus service and charging schedules for a fast-charging battery electric bus network. IEEE Trans. Intell. Transp. Syst. 2023, 24, 5362–5375. [Google Scholar] [CrossRef]
  23. Duan, M.; Liao, F.; Qi, G.; Guan, W. Integrated optimization of electric bus scheduling and charging planning incorporating flexible charging and timetable shifting strategies. Transp. Res. Part C Emerg. Technol. 2023, 152, 104175. [Google Scholar] [CrossRef]
  24. Li, X.; Wang, T.; Li, L.; Feng, F.; Wang, W.; Cheng, C. Joint optimization of regular charging electric bus transit network schedule and stationary charger deployment considering partial charging policy and time-of-use electricity prices. J. Adv. Transp. 2020, 2020, 8863905. [Google Scholar] [CrossRef]
  25. Perumal, S.S.G.; Dollevoet, T.; Huisman, D.; Lusby, R.M.; Larsen, J.; Riis, M. Solution approaches for integrated vehicle and crew scheduling with electric buses. Comput. Oper. Res. 2021, 132, 105268. [Google Scholar] [CrossRef]
  26. Perumal, S.S.G.; Lusby, R.M.; Larsen, J. Electric bus planning and scheduling: A review of related problems and methodologies. Eur. J. Oper. Res. 2022, 301, 395–413. [Google Scholar] [CrossRef]
  27. Garcia-Valle, R.; Lopes, J.A.P. Electric Vehicle Integration into Modern Power Networks; Springer: New York, NY, USA, 2012. [Google Scholar] [CrossRef]
  28. ABB Group. HVC-Overnight Charging—Electric Vehicle Infrastructure; Product Leaflet; ABB: Zurich, Switzerland, 2018. [Google Scholar]
  29. Gkiotsalitis, K.; Iliopoulou, C.; Kepaptsoglou, K. An exact approach for the multi-depot electric bus scheduling problem with time windows. Eur. J. Oper. Res. 2023, 306, 189–206. [Google Scholar] [CrossRef]
  30. Ceder, A. Public Transit Planning and Operation: Theory, Modeling and Practice; CRC Press: Boca Raton, FL, USA, 2007. [Google Scholar]
  31. Nemhauser, G.L.; Wolsey, L.A. Integer and Combinatorial Optimization; Wiley: Hoboken, NJ, USA, 1988. [Google Scholar]
  32. Gurobi Optimization LLC. Gurobi Optimizer Reference Manual. 2024. Available online: https://www.gurobi.com (accessed on 5 March 2025).
  33. Williams, H.P. Model Building in Mathematical Programming, 5th ed.; Wiley: Chichester, UK, 2013. [Google Scholar]
  34. RTE France Spot Electricity Exchange. Available online: https://www.services-rte.com/en/view-data-published-by-rte/france-spot-electricity-exchange.html (accessed on 5 March 2025).
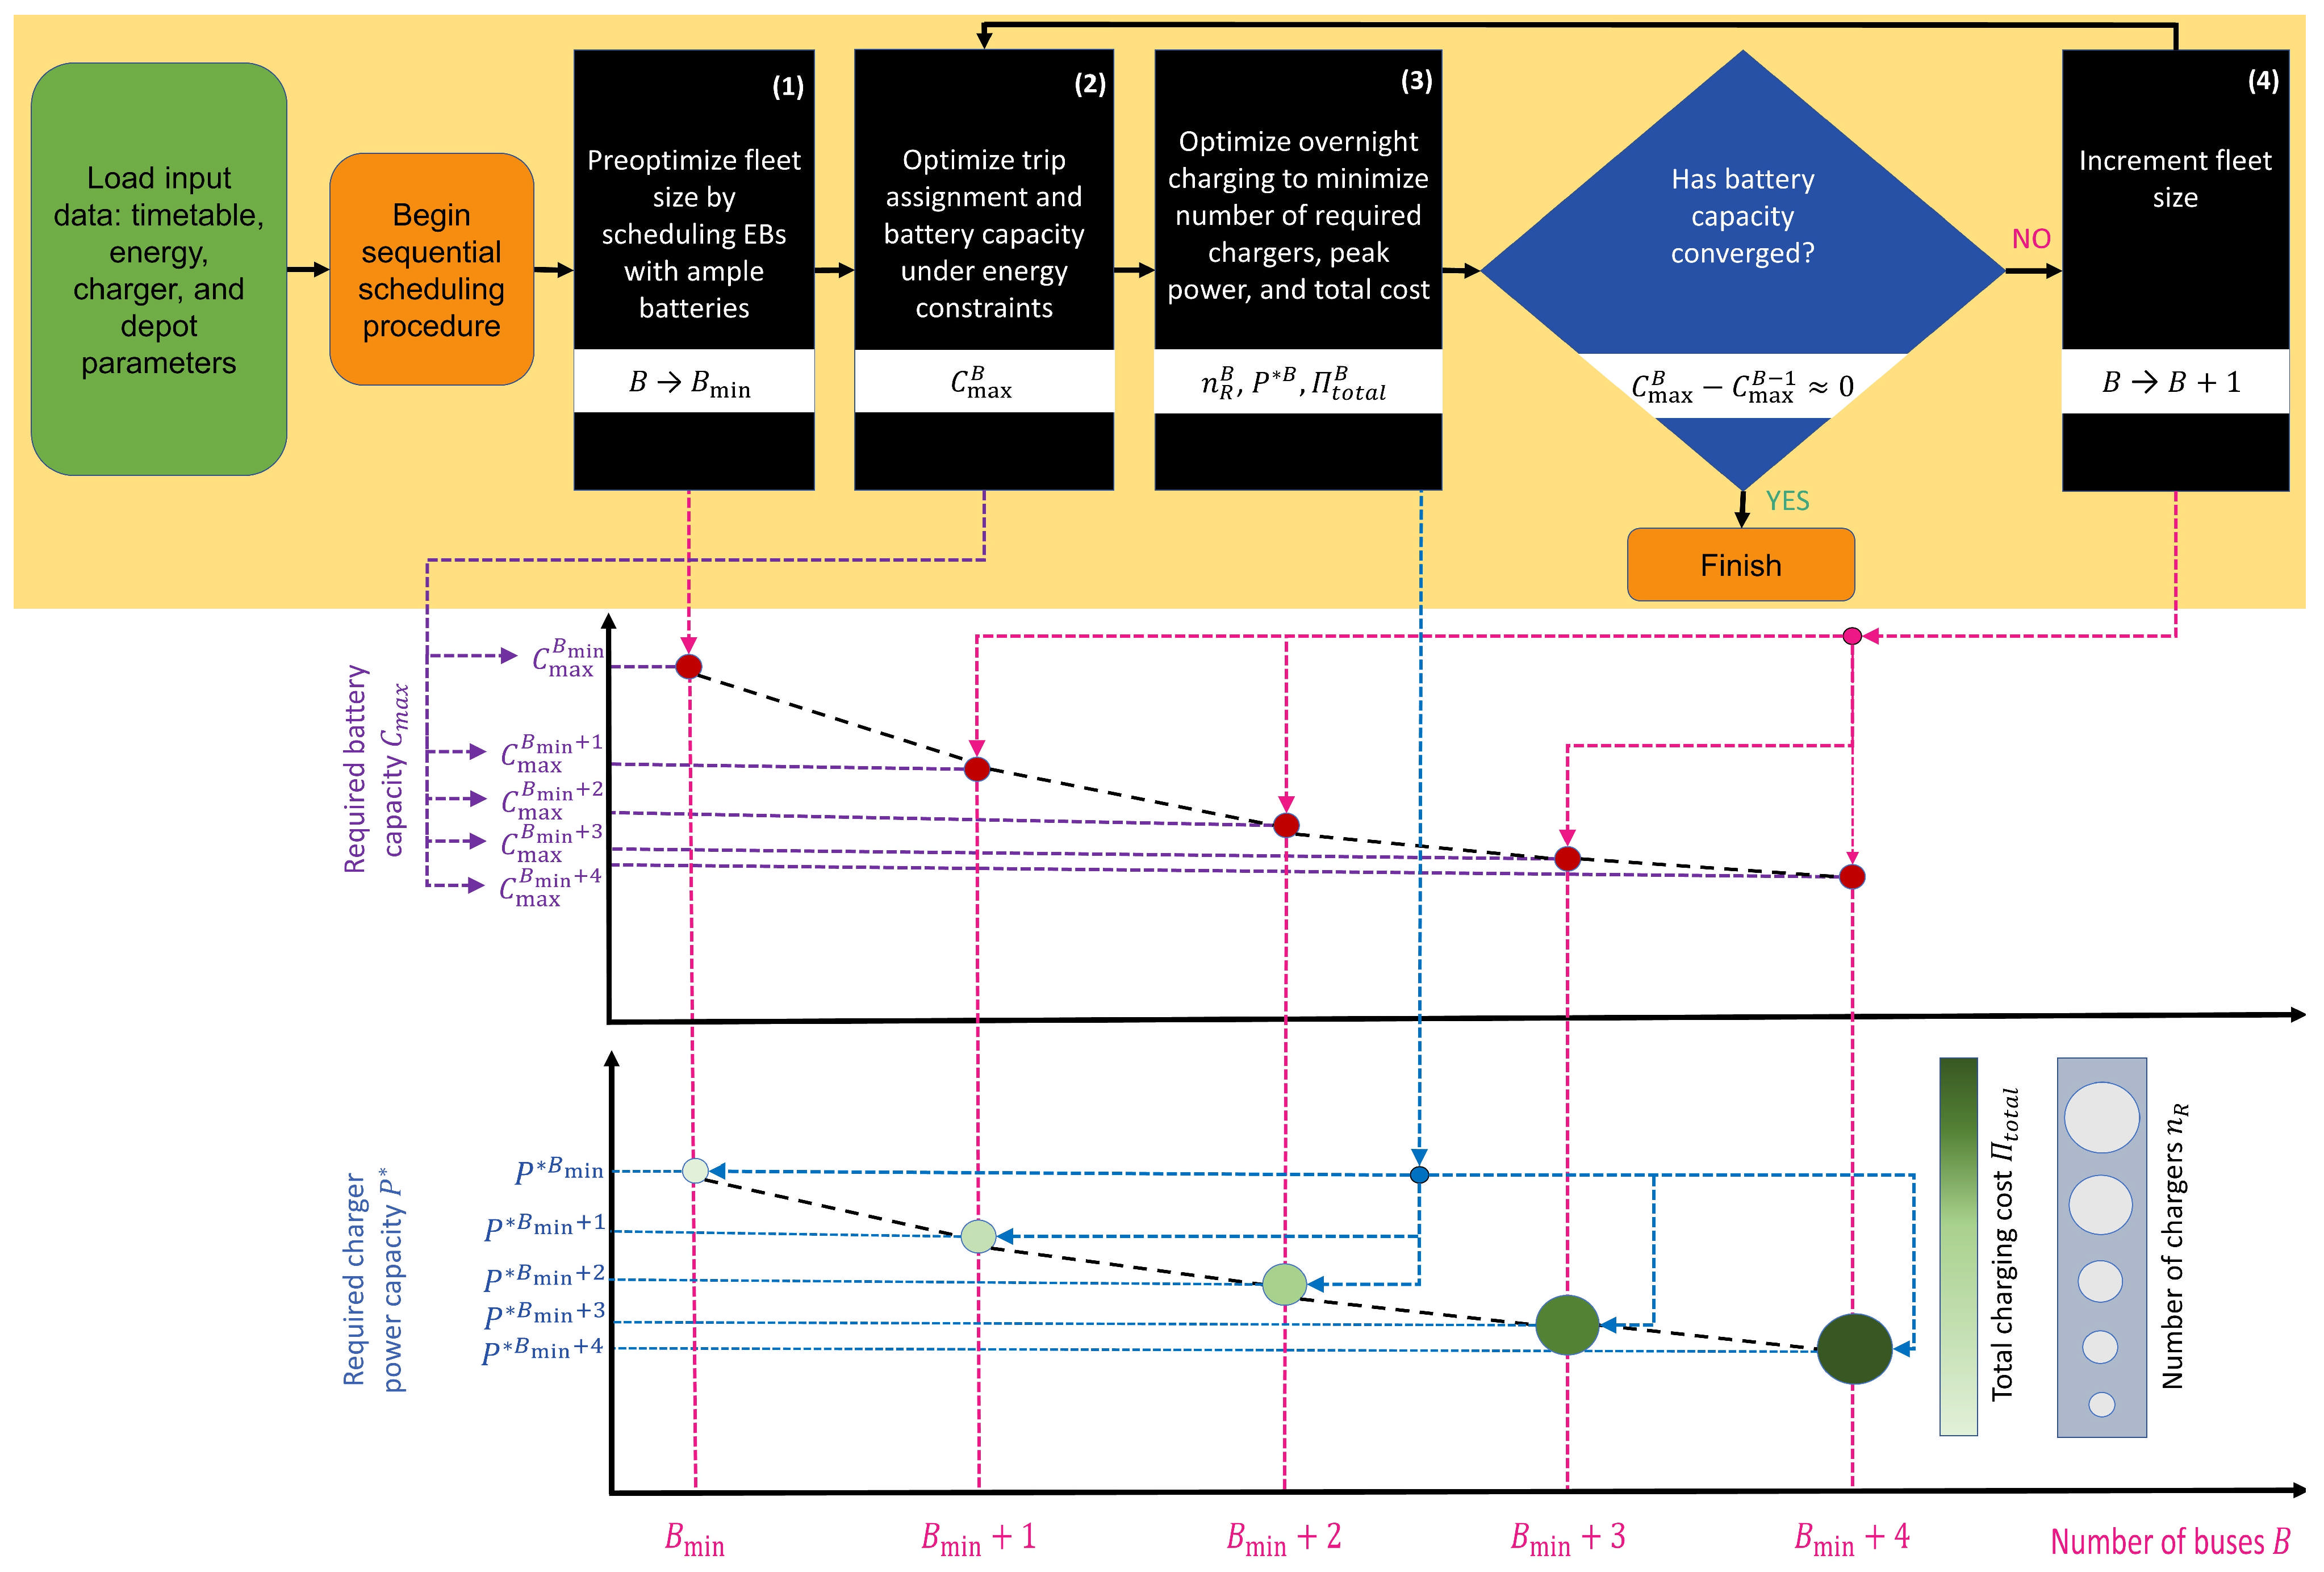
Figure 1. Sequential optimization framework for EB scheduling and overnight charging.
Energies 18 04440 g001
Figure 2. Sequential charging configuration with matrix layout of depot chargers and EB positions.
Energies 18 04440 g002
Figure 3. Illustration of parking accessibility and blocking behavior in a matrix-structured depot during EB arrivals and departures.
Energies 18 04440 g003
Figure 4. Illustration of arc-flow representation of EB scheduling with feasible trip transitions and corresponding parking intervals for overnight charging at depot D 0 = D n
Energies 18 04440 g004
Figure 5. Illustration of candidate overnight charging events for single k th EB within its parking interval I p a r k k with discrete start times s h k , fixed charging durations t c h k , and corresponding costs Π h k .
Energies 18 04440 g005
Figure 6. Schematic of Paris–Charles de Gaulle Airport landside shuttle bus network.
Energies 18 04440 g006
Figure 7. Daily timetables for shuttle bus lines.
Energies 18 04440 g007
Figure 8. Average values of trip duration (a), bus velocity (b), deadhead travel duration (c), and ridership (d), and ambient conditions over peak summer day (e).
Energies 18 04440 g008
Figure 9. Hourly electricity price profile for Paris, France, on 5 March 2025 according to [34].
Energies 18 04440 g009
Figure 10. Average values of trip (a) and deadhead EB energy consumption (b).
Energies 18 04440 g010
Figure 11. Required EB battery capacity for different fleet sizes.
Energies 18 04440 g011
Figure 12. Total daily energy consumption of each EB for fleet of 13 EBs (a) and corresponding optimized trip assignment timeline (b).
Energies 18 04440 g012
Figure 13. Total charging cost, required charger power, and number of chargers for each fleet size configuration from Figure 11.
Energies 18 04440 g013
Figure 14. Optimized overnight charging schedule for fleet with 13 EBs and five chargers.
Energies 18 04440 g014
Table 1. Operational characteristics of shuttle bus network.
LineConnected Terminals/StationsRoute TypeTotal Line Distance (km)Avg.
Distance Between Stations (km)
No. of StationsNo. of Trips per DayDeparture
Frequency
No. of Buses
N1Pw1–Pw2–T2F–T2B/D–T2E–Pw1Circular, counterclockwise8.551.715157~7 min
(before 16:00),
~10 min (after)
5
N2T2G–T2F–T2GCircular, counterclockwise5.602.802158~6–8 min3
S3Pw1–Pw2–S4–S3–RDS–Pw1Circular, counterclockwise5.001.005143~9 min3
Table 2. Comparison of optimized and baseline scheduling results.
Scheduling ApproachFleet Size B [-]Required Battery
Capacity [kWh]
Change vs.
Baseline [%]
Baseline113980%
Optimized11322−19%
Optimized (minimum fleet)10355−11%
Disclaimer/Publisher’s Note: The statements, opinions and data contained in all publications are solely those of the individual author(s) and contributor(s) and not of MDPI and/or the editor(s). MDPI and/or the editor(s) disclaim responsibility for any injury to people or property resulting from any ideas, methods, instructions or products referred to in the content.