1. Introduction
The energy transition towards a decarbonized future is fundamentally based on renewable energy sources (RES), with solar photovoltaic (PV) energy standing out for its scalability and low maintenance [
1,
2]. In the last decade, the PV market has experienced remarkable growth, adding over 500 GW of capacity in 2024 [
3]. This increase is attributed to the continuous reduction in costs per installed kilowatt, which decreased from 5310 USD/kWp in 2010 to 758 USD/kWp in 2023 [
4]. Furthermore, support policies such as RePowerEU [
5], government incentives, and feed-in tariffs have driven the implementation of these systems, promoting local projects and energy self-sufficiency [
6,
7].
Since these sources have low or zero marginal costs, their production is prioritized in electricity generation, a phenomenon known as the “merit order effect” [
8,
9]. As their contribution to the grid increases, they displace power plants with higher marginal costs, leading to a general reduction in wholesale electricity prices and lower greenhouse gas (GHG) emissions [
10]. However, this dynamic results in a sharp drop in net grid demand at midday, when solar generation peaks, followed by a rapid increase in late afternoon. This hourly fluctuation, known as the “duck curve” [
11,
12], poses significant challenges for power system regulation, including reduced generation control, increased grid congestion, and decreased system inertia [
13,
14]. Additionally, the concentration of PV generation during peak daylight hours diminishes the economic value of generated electricity, thereby impacting the profitability of these systems [
15,
16]. This situation demands solutions that not only increase renewable generation capacity but also help flatten the duck curve, distributing energy production more uniformly throughout the day [
17,
18].
In this context, building-integrated photovoltaic (BIPV) and building-applied photovoltaic (BAPV) systems emerge as a strategic solution. These systems offer PV configurations with unconventional orientations while simultaneously overcoming space limitations in urban environments [
19,
20]. In buildings, roof space is often restricted due to heating, ventilation, and air conditioning (HVAC) systems, and shading is a critical factor [
21]. BIPVs differ from BAPVs by their direct integration into the building envelope, replacing conventional construction materials such as tiles or facades [
20]. Facade-applied photovoltaic (FAPV) systems offer similar advantages to BIPVs in terms of urban space utilization and are simpler to implement in existing buildings [
22]. Both types contribute significantly to the creation of Zero Energy Buildings (ZEBs), thus decarbonizing the urban environment [
23].
A distinctive feature of BIPV and FAPV systems is that the orientation and tilt of the solar panels are constrained by the building’s location and topology, leading to unconventional PV system configurations [
24,
25]. Although these configurations do not maximize annual energy production, they offer crucial benefits such as lower grid curtailment and a better match between generation and the building’s energy demand [
26]. Furthermore, the continuous improvement in the efficiency of PV modules contributes to an increase in generation per square meter, compensating for the lack of optimal radiation in non-optimal orientations [
27,
28]. The development of BIPV systems has advanced considerably, encompassing modeling, simulation, and the design of new optimization methodologies.
Table 1 summarizes the main characteristics of previous work in the BIPV–BAPV field.
In terms of modeling, simulation tools such as EnergyPlus, TRNSYS, and PVsyst are extensively used to analyze the energy performance of these systems [
29,
39]. These programs provide detailed models to accurately predict BIPV module behavior, considering their thermal, optical, and electrical aspects. The operating temperature of the modules is a critical factor, and specific models like the SANDIA model and the Faiman model have been developed for its accurate prediction [
40]. Advanced techniques such as machine learning (ML) [
31], neural networks [
41] and gradient boosting methods [
42] have also been applied to BIPV modeling to improve prediction accuracy.
Another important factor in BIPV–BAPV systems is the impact of shading, addressed through 3D building and even city-wide model simulations using tools such as PVsyst or Rhinoceros 3D [
30,
43]. Among the different types of optical losses, the Incidence Angle Modifier (IAM), which quantifies reflection losses of radiation on the PV module surface, is calculated in only a few studies [
44].
In the realm of design optimization, frameworks have been developed that employ genetic algorithms (GA) [
45] and multi-objective optimization (MOO) [
30,
46] to balance architectural integration, economic viability, and environmental impact. These frameworks enable automated BIPV design, identifying the most suitable facade surfaces for installation. Other works integrate thermal aspects and external factors to improve the resilience of these urban energy systems. Work in [
47] proposes a collaborative modeling of electrothermal systems that combines building cooling and heating loads with photovoltaic production. This will enable its subsequent integration with optimized district heating network reconstruction strategies. In [
48], a coordinated restoration model is developed that integrates the thermal dynamics of building envelopes with the route planning of electric buses. This model aims to exploit the natural cooling flexibility of air conditioning systems by leveraging the thermal inertia of buildings and the spatiotemporal flexibility of E-Buses to maximize the energy supply time to critical loads and minimize the travel distance of E-Buses. In the context of BIPV–BAPV photovoltaic systems, the energy generated could be managed in a coordinated manner as a supply resource during interruption events, contributing to energy restoration along with other distributed resources. The analyzed performance parameters include final yield, performance ratio, and economic terms such as net present value or investment payback period [
24].
Despite these significant advances, the complex interaction between architectural design, energy performance, and environmental factors in BIPV–BAPV systems still presents challenges. Polyvalent methodologies applicable to a wide variety of designs are required. There is a clear need for approaches that not only evaluate energy production but also explicitly relate it to the efficiency of occupied surface use.
In response to this need, the present research proposes a polyvalent methodology for sizing PV systems in buildings with diverse distributions. Our main contribution lies in the introduction of new parameters that quantitatively and comprehensively relate the system’s performance to the occupied surface area. These parameters aim to go beyond conventional metrics, providing a more nuanced evaluation of energy generation density and the spatial efficiency of BIPV–BAPV configurations. Furthermore, a quantitative analysis of shading, IAM, and temperature losses is carried out to identify how they affect different BIPV–BAPV systems. This will not only allow for a deeper understanding of how different BIPV–BAPV designs utilize available space but also provide a robust basis for comparing and selecting optimal solutions in urban decarbonization projects. The results of this study aim, therefore, to contribute to the achievement of zero-energy buildings and more sustainable cities.
2. Methodology
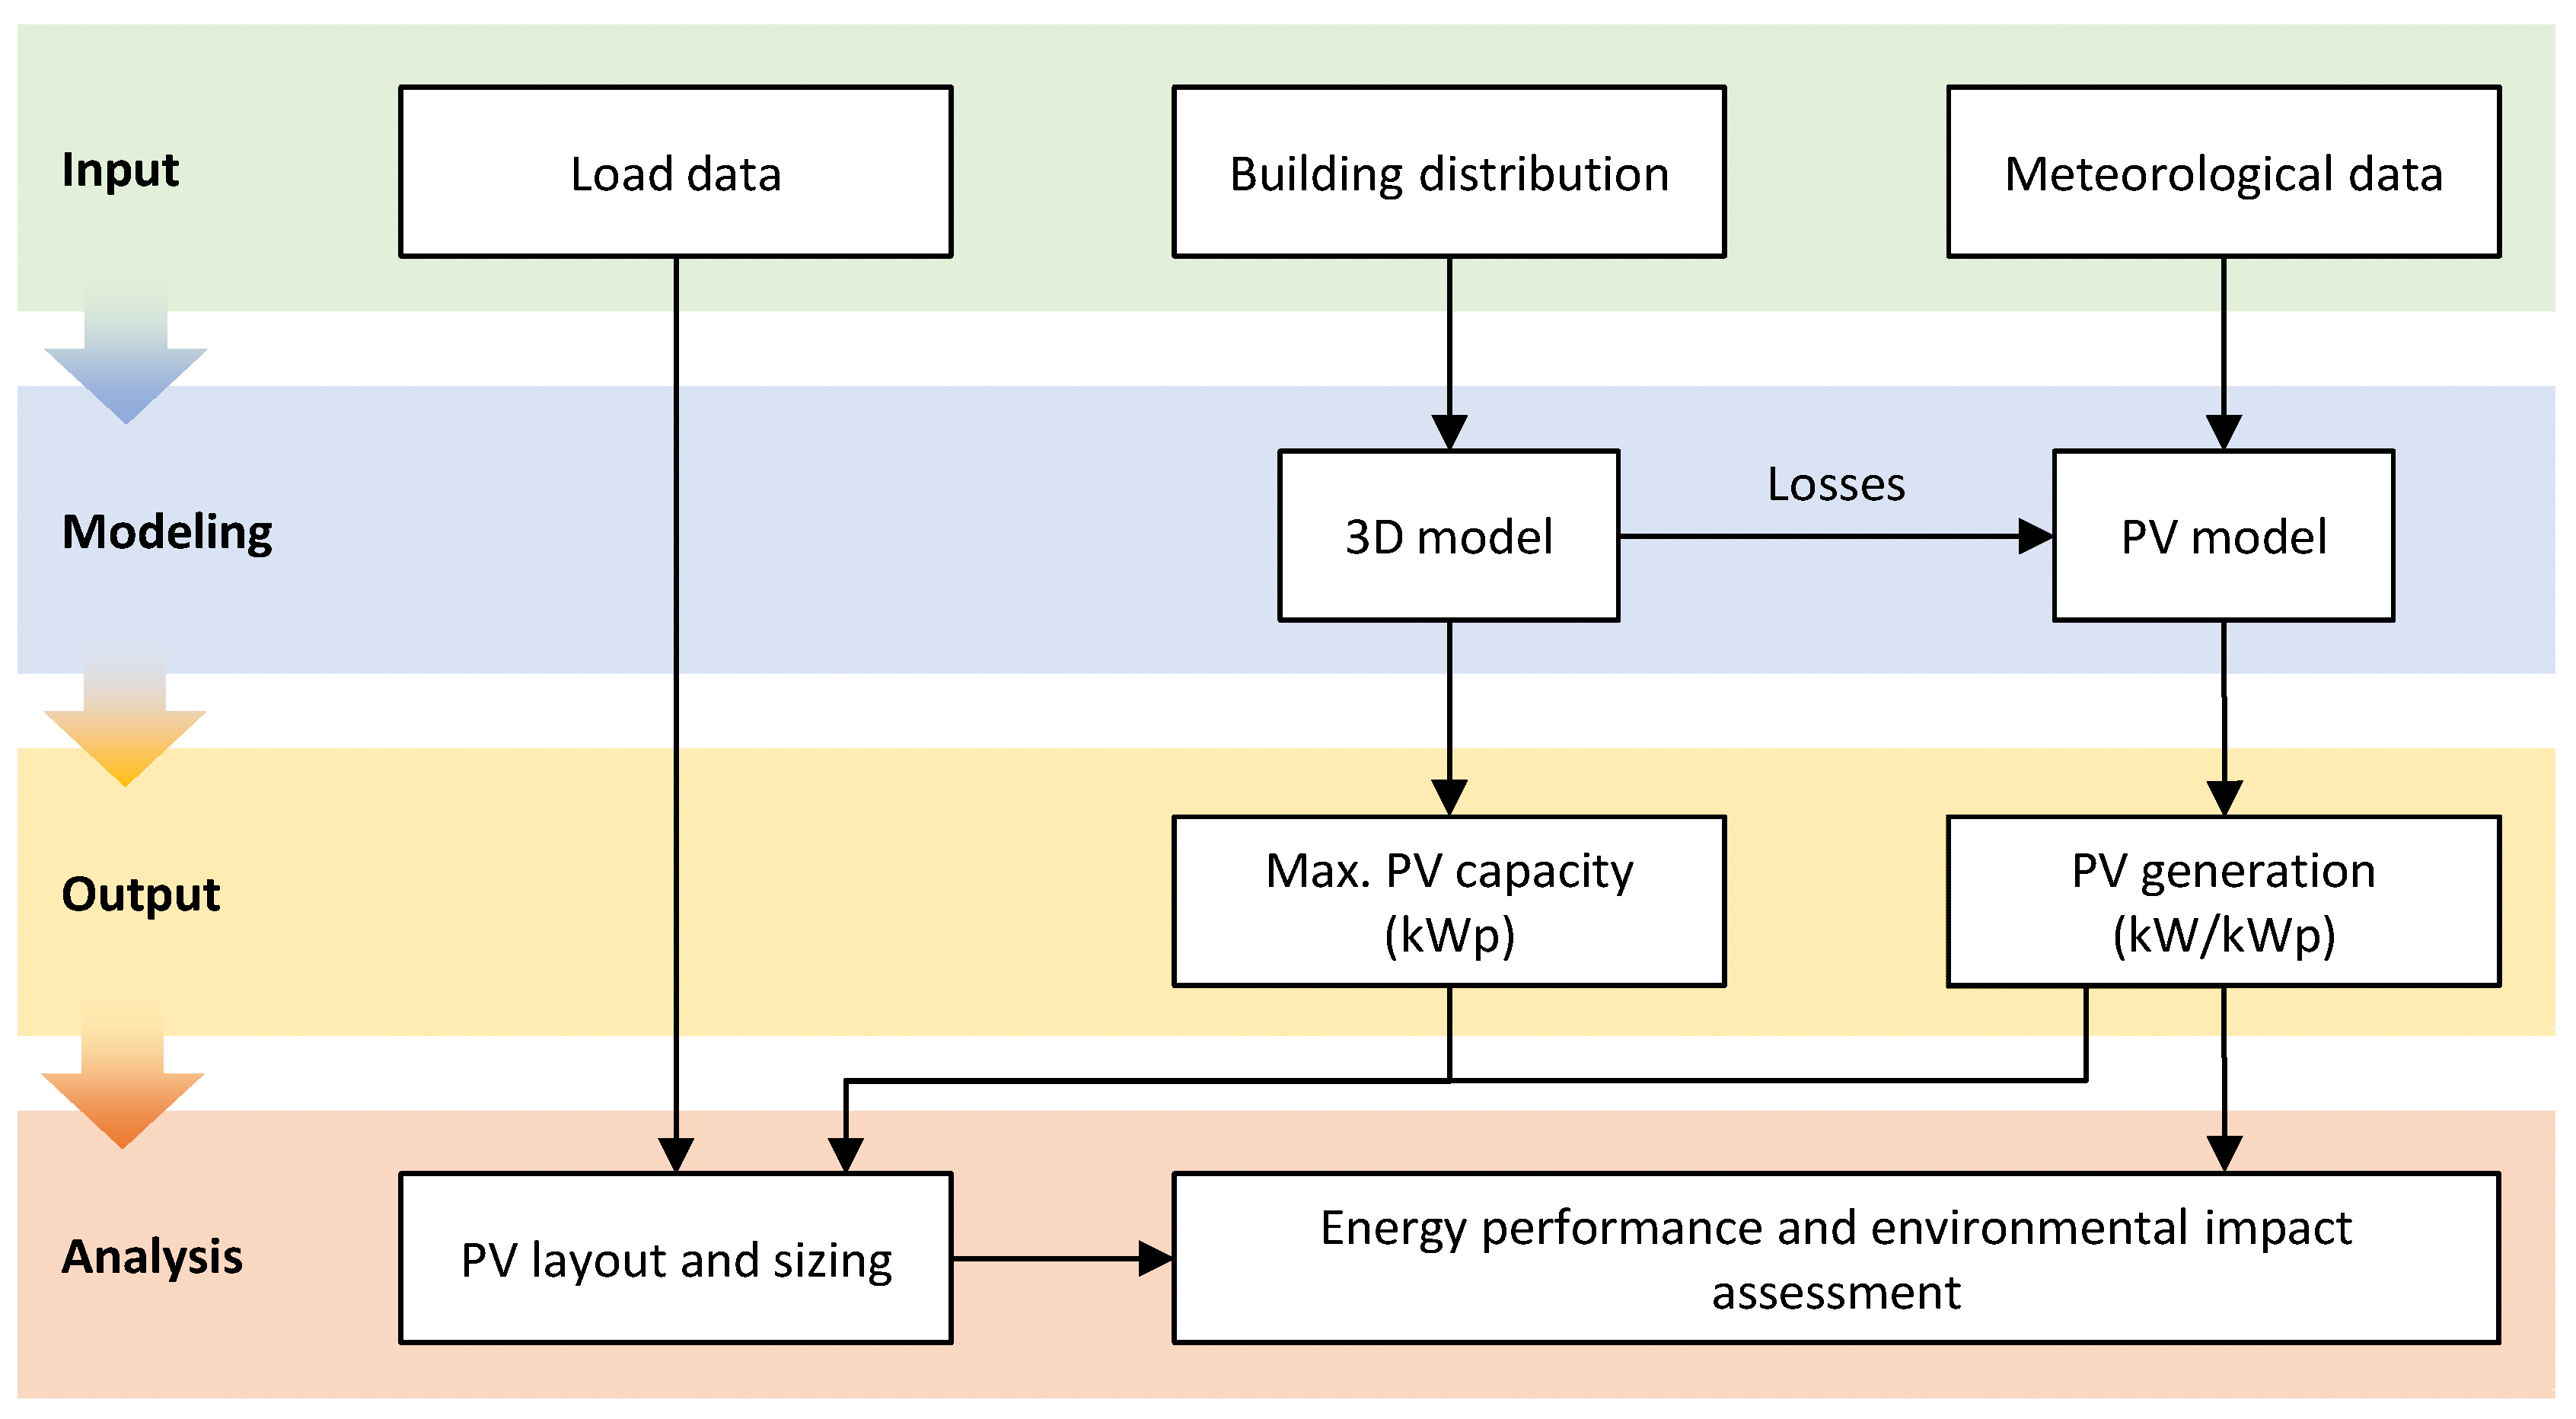
Figure 1 illustrates the phases of the methodology applied in this study. The inputs for this methodology consist of building consumption data, building layout, and meteorological data for the study area. Next, a 3D model of the building and its surroundings is created to determine the maximum installable PV capacity. Two PV system alternatives are considered based on their arrangement and orientation: a conventional BAPV system on the rooftop with optimal orientation (RTPV) and a BAPV system integrated into the facade with an unconventional orientation (FAPV). The 3D model also allows for the calculation of shading losses and IAM losses, essential factors for estimating the system’s PV generation. Additionally, the PV system model estimates its generation using relevant meteorological data, such as plane-of-array irradiance, ambient temperature, and wind speed.
The subsequent step involves evaluating the performance of the PV system and its subsystems to identify those offering better results. The PV system sizing is based on maximizing self-sufficiency (SSR), with the constraint of keeping the installed power within the linear region of the SSR-installed capacity curve [
49]. This ensures maximum utilization of the system per kWp installed, in addition to maximizing the building’s sustainability by reducing grid energy consumption and the associated CO2 emissions.
Finally, an energy and environmental analysis of the proposed PV system alternatives is performed. In the energy domain, parameters defined by standard IEC 61724-1 [
50] are considered, such as reference yield, array yield, final yield, and performance ratio. In the environmental domain, parameters like Hourly Emission Factor (HEF) and Total Emission Reduction (TER), widely used in the literature, are considered [
22,
51]. Additionally, complementary energy and environmental parameters are defined to compare the performance of PV systems based on their footprint area, which represents an advancement for comparing different PV configurations in urban environments.
2.1. System 3D Modeling
Building topology and facade orientation significantly influence their capacity to efficiently integrate PV systems. Moreover, shading is a critical factor, especially in cities where adjacent buildings and elements are common. Therefore, 3D modeling of the building and its surroundings is essential to determine the maximum installable PV power and characterize shading losses.
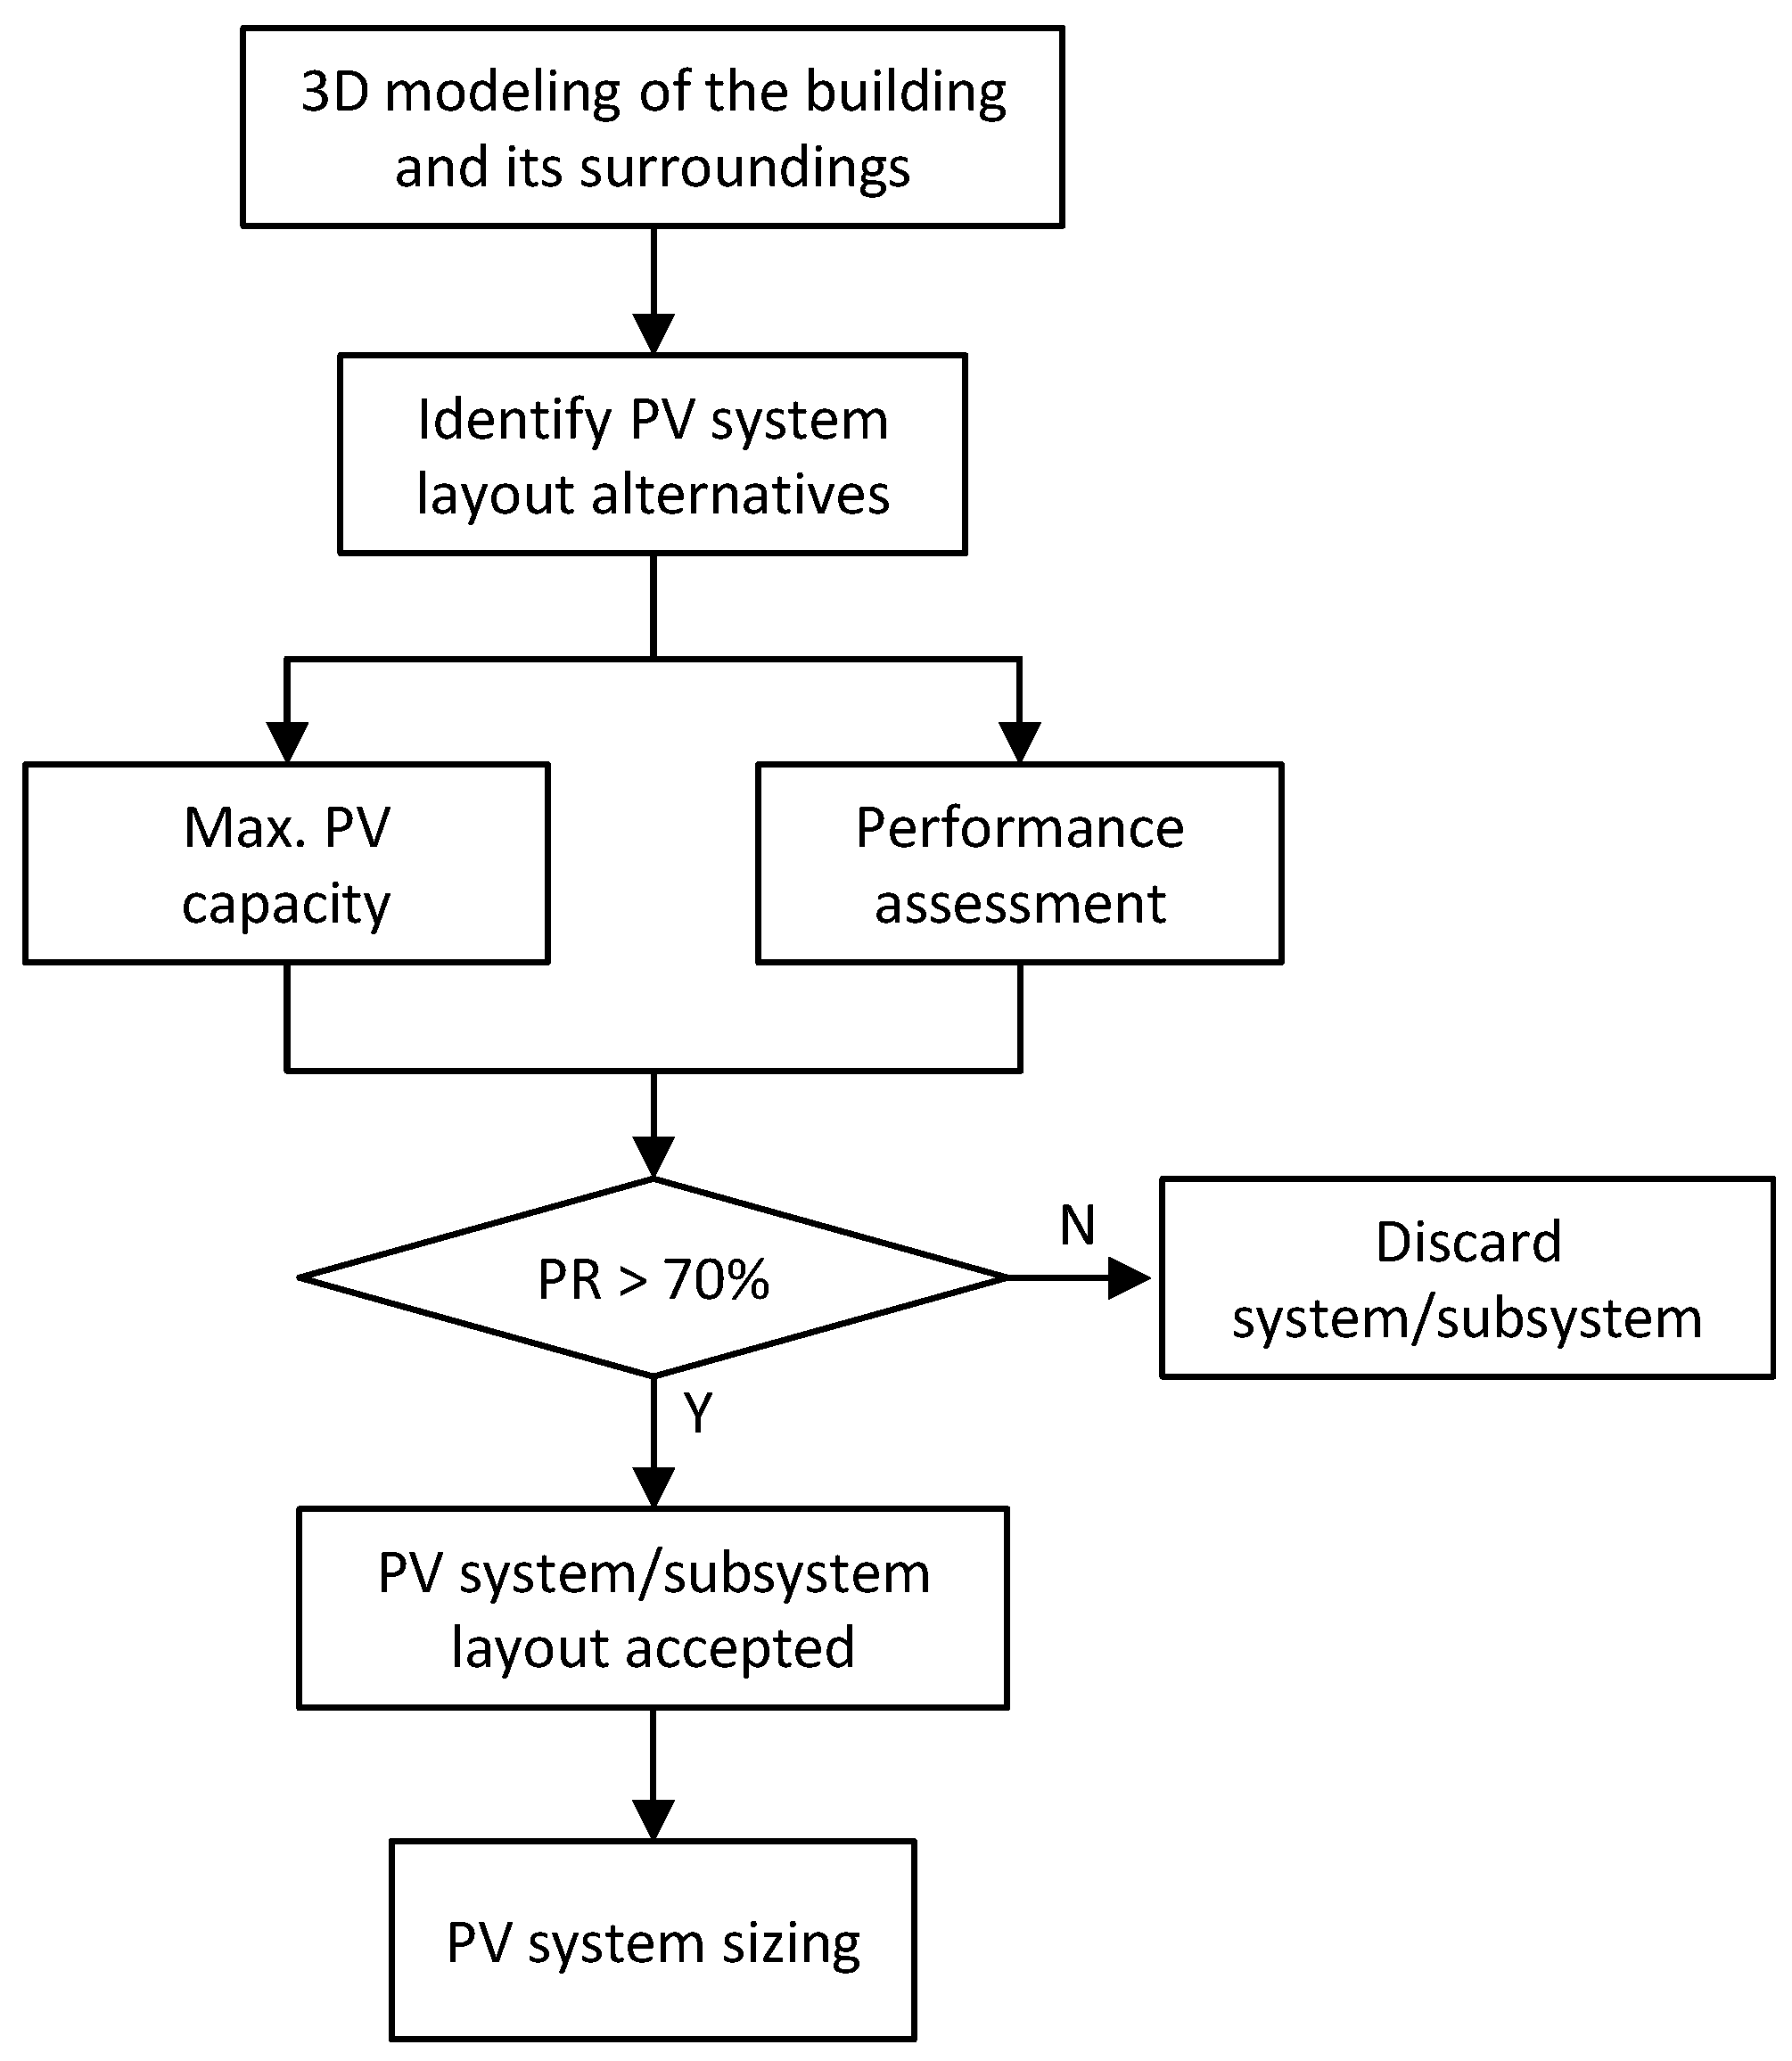
Figure 2 illustrates the PV generator design and sizing process.
The tool used for this purpose is the specialized software PVsyst v8.0 [
52], which also allows for the electrical design calculations of the PV system. Given the wide variety of integration cases for PV systems in buildings, this work considers two PV design alternatives:
Rooftop PV System (RTPV): With an orientation that maximizes generation (optimal or conventional). The maximum number of modules the roof can accommodate is determined, respecting the separation between racks to reduce self-shading [
53].
Facade-applied PV System (FAPV): With its own supporting structure and a 90° inclination, allowing ventilation on its rear side. As a design criterion, facades with an E-S-W orientation in the northern hemisphere and W-N-E in the southern hemisphere are considered, as this maximizes the received irradiance [
54]. The separation of modules from each other and from the building affects their ventilation level and, consequently, temperature losses. To minimize this impact, a vertical and horizontal separation between modules of 0.1 m and 0.5 m, respectively, and a separation from the building of 0.25 cm was chosen, adhering to recommended design parameters [
55].
2.2. PV System Modeling
The generation of the PV systems was calculated using Equation (1), following the recommendations of the standard IEC 61724-2 [
38].
where
is the DC power generated,
is the installed PV power,
is the solar radiation in the plane of the array,
is the radiation under standard test conditions, and
,
,
,
,
and
are, respectively, the correction factors for cell temperature, soiling, module mismatch, wiring, incidence angle, and shading
Facade-integrated PV systems face an additional challenge due to shading losses and the incidence angle effect. Both effects require a complex analysis considering the relative position between the PV system, its surroundings, and the sun throughout the year. In this work, PVsyst v8.0 was chosen to estimate and , which are obtained with an hourly temporal resolution.
The heat transfer model used in this work to estimate the temperature of PV cells is that recommended by standard IEC 61724-2 [
38], detailed in Equations (2) and (3). This model considers ambient temperature (
), plane-of-array irradiance and wind speed (
), as well as two experimental coefficients (
and
), allowing the estimation of module temperature (
).
Cell temperature (
) is then estimated from the module temperature, irradiance relative to standard conditions, and the temperature difference between the module surface and the PV cell (
). Parameters
,
and
, whose values are shown in
Table 2, depend on the module type and its mounting.
The correction factor for the system’s power output due to cell temperature is calculated according to Equation (4), where
is the maximum power variation coefficient due to temperature and
is the cell temperature under standard conditions.
The AC capacity of the inverter is sized according to the selected inverter loading ratio (ILR), as shown in Equation (5). The inverter model used to estimate AC generation is the one proposed by NREL in [
56], whose efficiency is calculated according to Equation (6) as a function of the inverter’s nominal efficiency
, its reference efficiency
and the loading index
. Loading index is calculated as the ratio between DC input power (
) and the maximum DC input power of the inverter (
). In turn,
is calculated as the ratio between the inverter’s maximum AC operating power (
and
.
Finally, the AC power at the inverter output
is calculated according to Equation (7), which considers a minimum loading index
below which no power is delivered.
This models the actual behavior of the inverter, as at very low loading indices, the inverter exhibits significant losses and instability [
57].
2.3. PV System Layout Design
As a preliminary step to PV system sizing, it is important to analyze the performance of each subsystem, especially in systems with multiple inclinations or orientations. The parameters considered are the reference yield (
), array yield (
), final yield (
) and performance ratio (
), as defined in standard IEC 61724-1. These parameters are calculated using Equations (8)–(11).
Furthermore, PV system losses are grouped into capture losses (
) and balance of system losses (
), calculated according to Equations (12) and (13), respectively. As a general criterion, the PR of a PV installation is between 70% and 90% [
58,
59]. PR values below 70% indicate excessive losses due to deficient designs or shading. Therefore, among the subsystems proposed in the 3D design of the photovoltaic installation, only those with a PR greater than 70% will be considered valid.
2.4. PV System Sizing
The PV system sizing is carried out using the method described in [
49], which calculates the self-consumption ratio (SCR) and self-sufficiency ratio parameters for a range of PV generator powers. SCR, calculated according to Equation (14), represents the fraction of PV generation consumed within the building.
The self-sufficiency ratio (SSR), calculated according to Equation (15), represents the fraction of consumed energy that is covered by PV generation.
When representing the SSR as a function of the installed PV capacity, a linear region with a constant slope is observed. At the end of this linear region, the increase in SSR with respect to gradually decreases due to the increase in PV surpluses. Therefore, it is favorable for the PV system capacity to be within the linear region to ensure its maximum utilization. A higher SSR implies less grid dependence and greater sustainability of consumed energy. Consequently, the PV system sizing criterion consists of maximizing the SSR, bounded by the linear region of this curve.
2.5. Analysis Criteria
The energy analysis of systems with different topologies is based on the reference yield, array yield, final yield, capture losses, balance of system losses, and performance ratio parameters, as defined in
Section 2.3. Additionally, self-consumption and self-sufficiency ratios are calculated according to Equations (14) and (15). The self-sufficiency ratio during solar hours (
), defined in Equation (16), is used to evaluate the self-consumption of PV energy relative to consumption during daylight hours [
60].
To evaluate the environmental impact of the installation, the Total GHG Emission Reduction (TER) index was chosen, calculated according to Equation (17) based on self-consumed PV energy and the hourly emission factor (
).
The HEF represents the equivalent amount of CO2 emissions per unit of energy extracted from the grid and was calculated according to Equation (18). This is determined from the average emission factor of non-renewable energies on a given day
(
), provided by the Transmission System Operator (TSO) [
61], and multiplied by the hourly fraction of non-renewable generation relative to total generation in an hour
(
), whose data are published by the European Network of Transmission System Operators for Electricity (ENTSO-E) [
62].
In the economic domain, the Levelized Cost of Energy (LCOE) was chosen to economically evaluate the different PV generator options. This metric, widely used in the literature [
63,
64], is calculated according to Equation (19) and represents the average cost of energy generated by the PV system over its lifetime.
where
is the initial installation cost,
is the annual operation and maintenance cost of the PV system,
is the energy produced by the system without degradation,
is the degradation rate of the PV system,
is the discount rate,
is the number of years of system operation and
is the number of years of the system’s useful life.
Although the above parameters are necessary and important, they do not quantify the space occupied by PV systems, which is a crucial factor in urban installations. Therefore, this work proposes new metrics to evaluate the performance of the PV generator considering the ground footprint occupied by it and its supporting structure (
), based on those defined by IEC 61724-1. Thus, the calculation of reference yield, array yield, and final yield per unit of occupied ground area by the generator is proposed, as shown in Equations (20), (21) and (22), respectively.
Additionally, the calculation of an emission reduction index based on the installed PV capacity and the area occupied by the PV system is proposed, which is presented in Equation (23). These indices will help incorporate the factor of available space when evaluating and comparing various PV system distribution options.
3. Case Study
3.1. Location and Layout of the Building
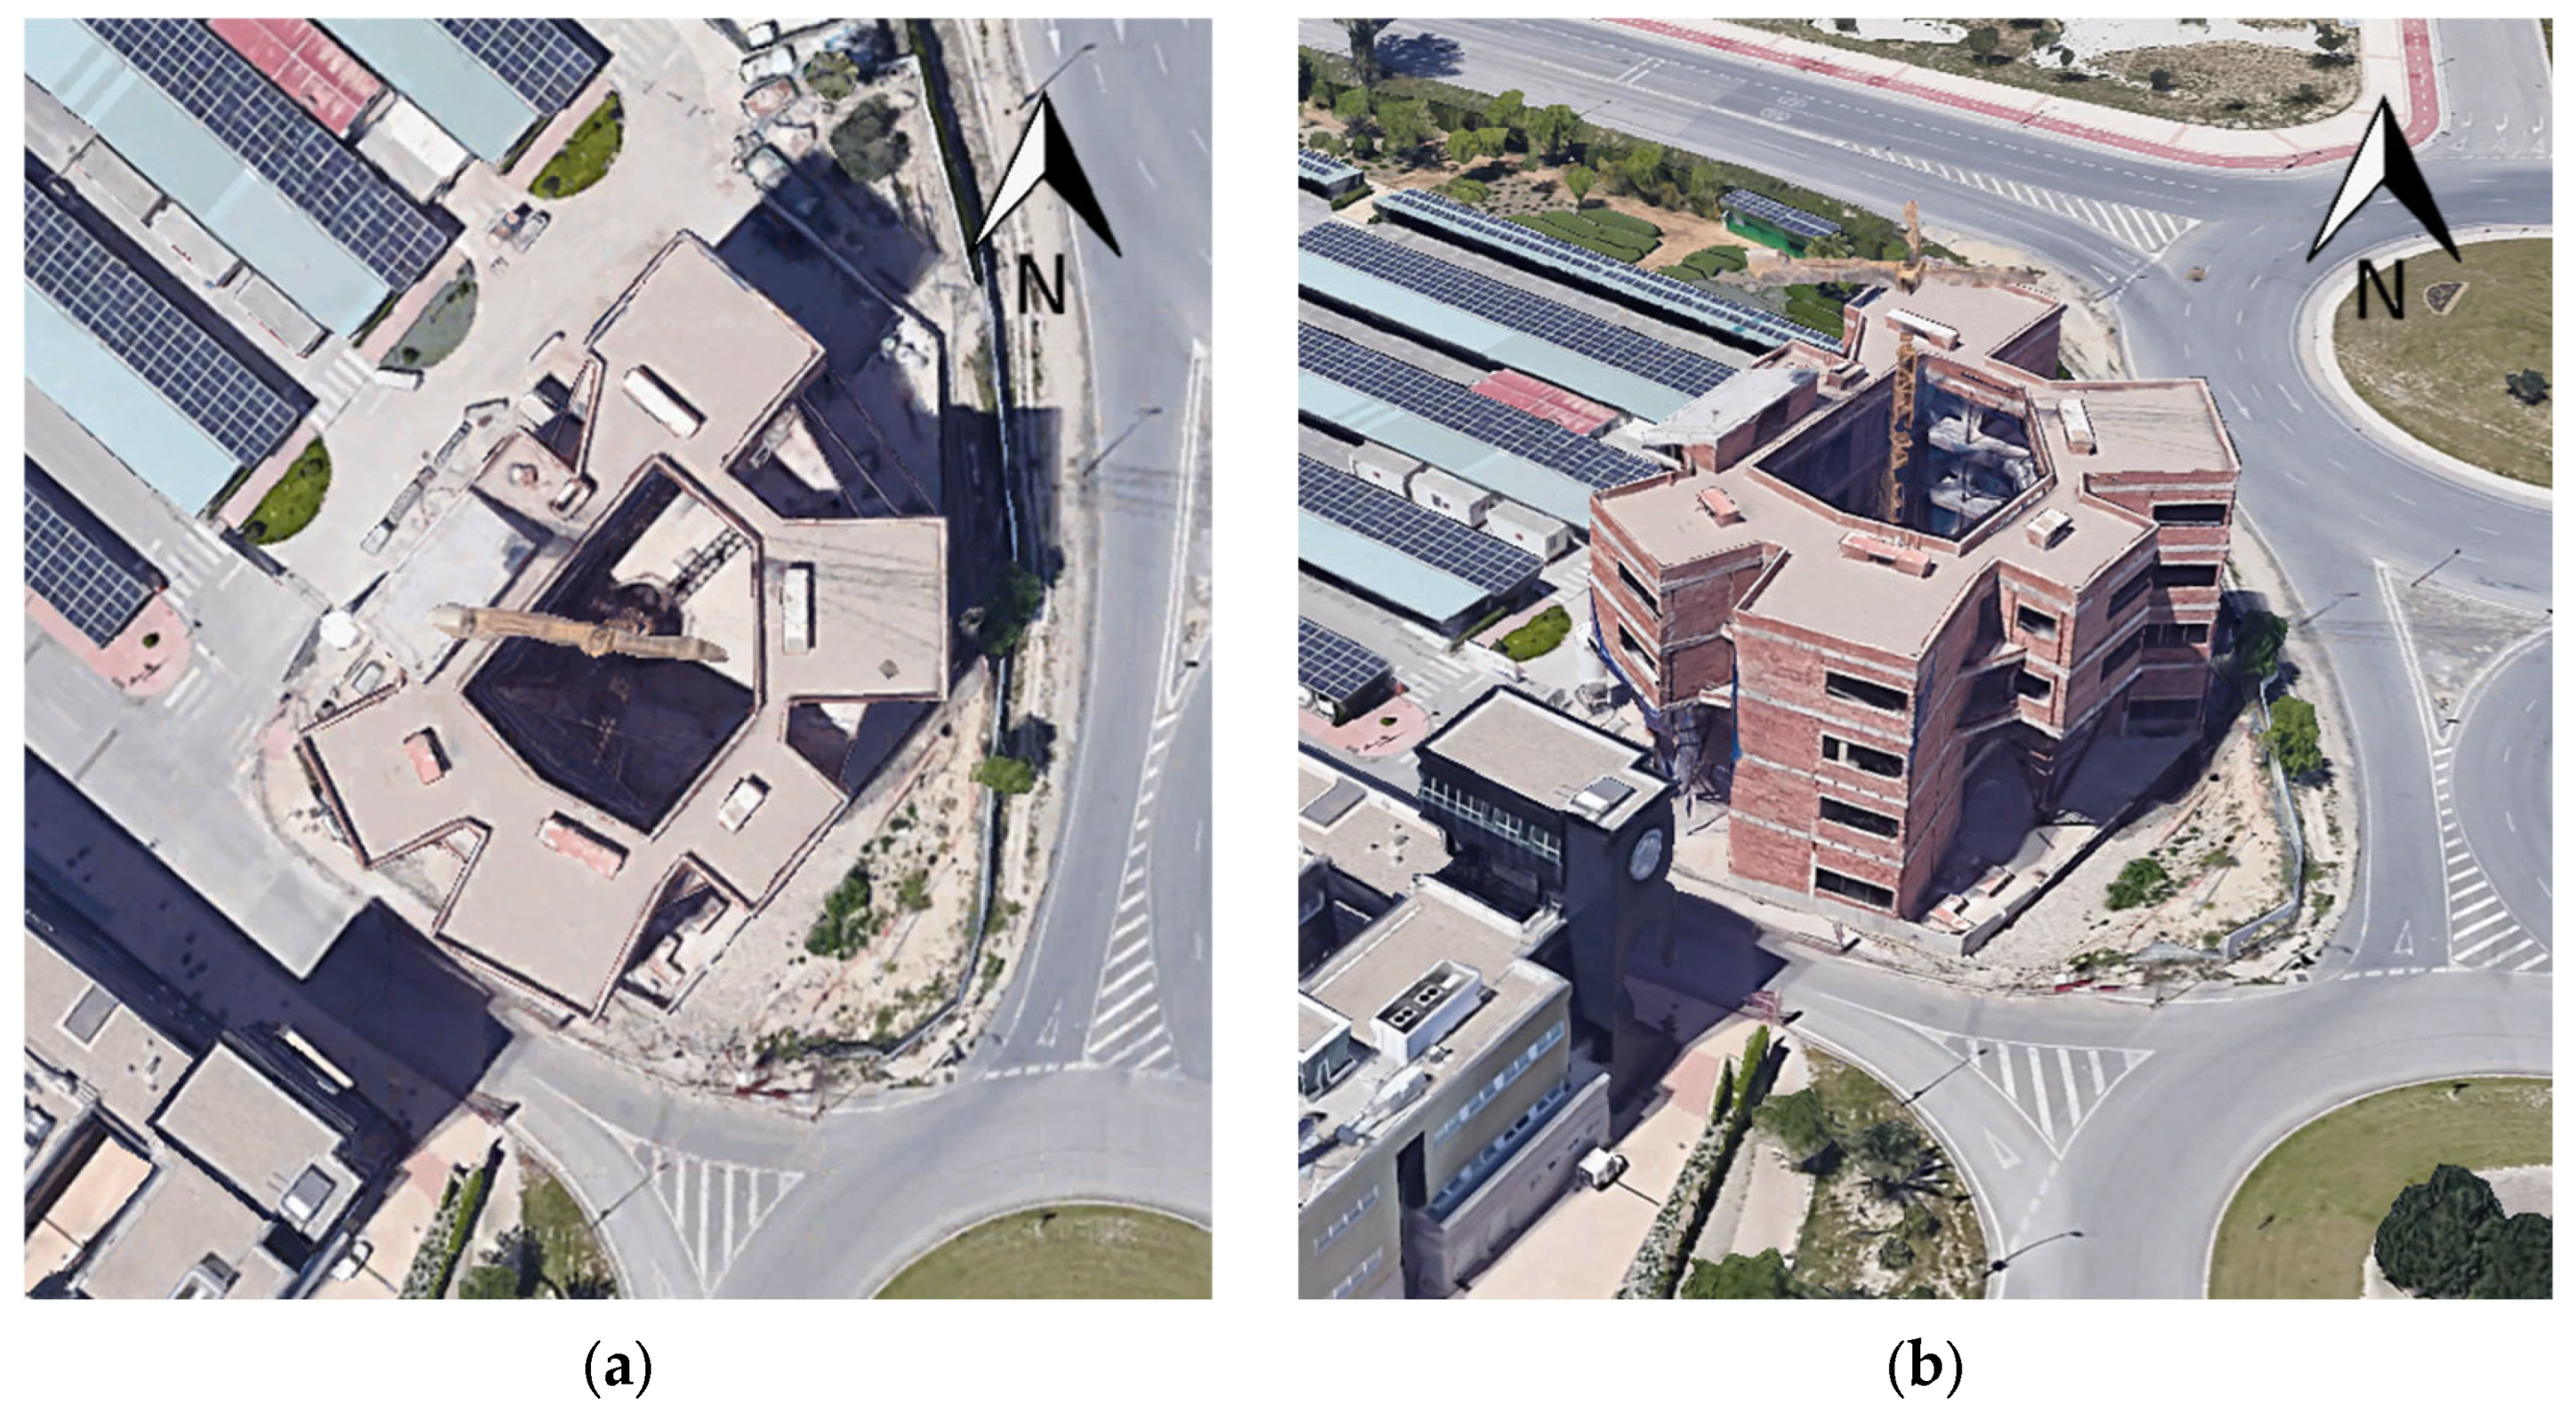
This study focuses on a four-story research building at the University of Jaén, located at coordinates (37.7875°, −3.7736°).
Figure 3 illustrates its surroundings and layout.
As a research laboratory building, its irregular distribution and facades with multiple orientations present challenges for optimizing PV system design. However, these characteristics also provide an opportunity to implement a facade-integrated PV system due to the variety of orientations and a predominantly shade-free environment.
3.2. Load and Meteorological Data
To characterize the building’s energy consumption, measurements were conducted with an ABB M4M30 (Zürich, Switzerland) [
65] grid analyzer throughout 2024. This meter, with Class 0.5S accuracy conforming to key measurement standards (IEC 62053-22 [
66] and IEC 61557-12 [
67]), provided consumption data with a 5 min resolution. The total annual consumption was 116.7 MWh, with a daily average of 389 kWh.
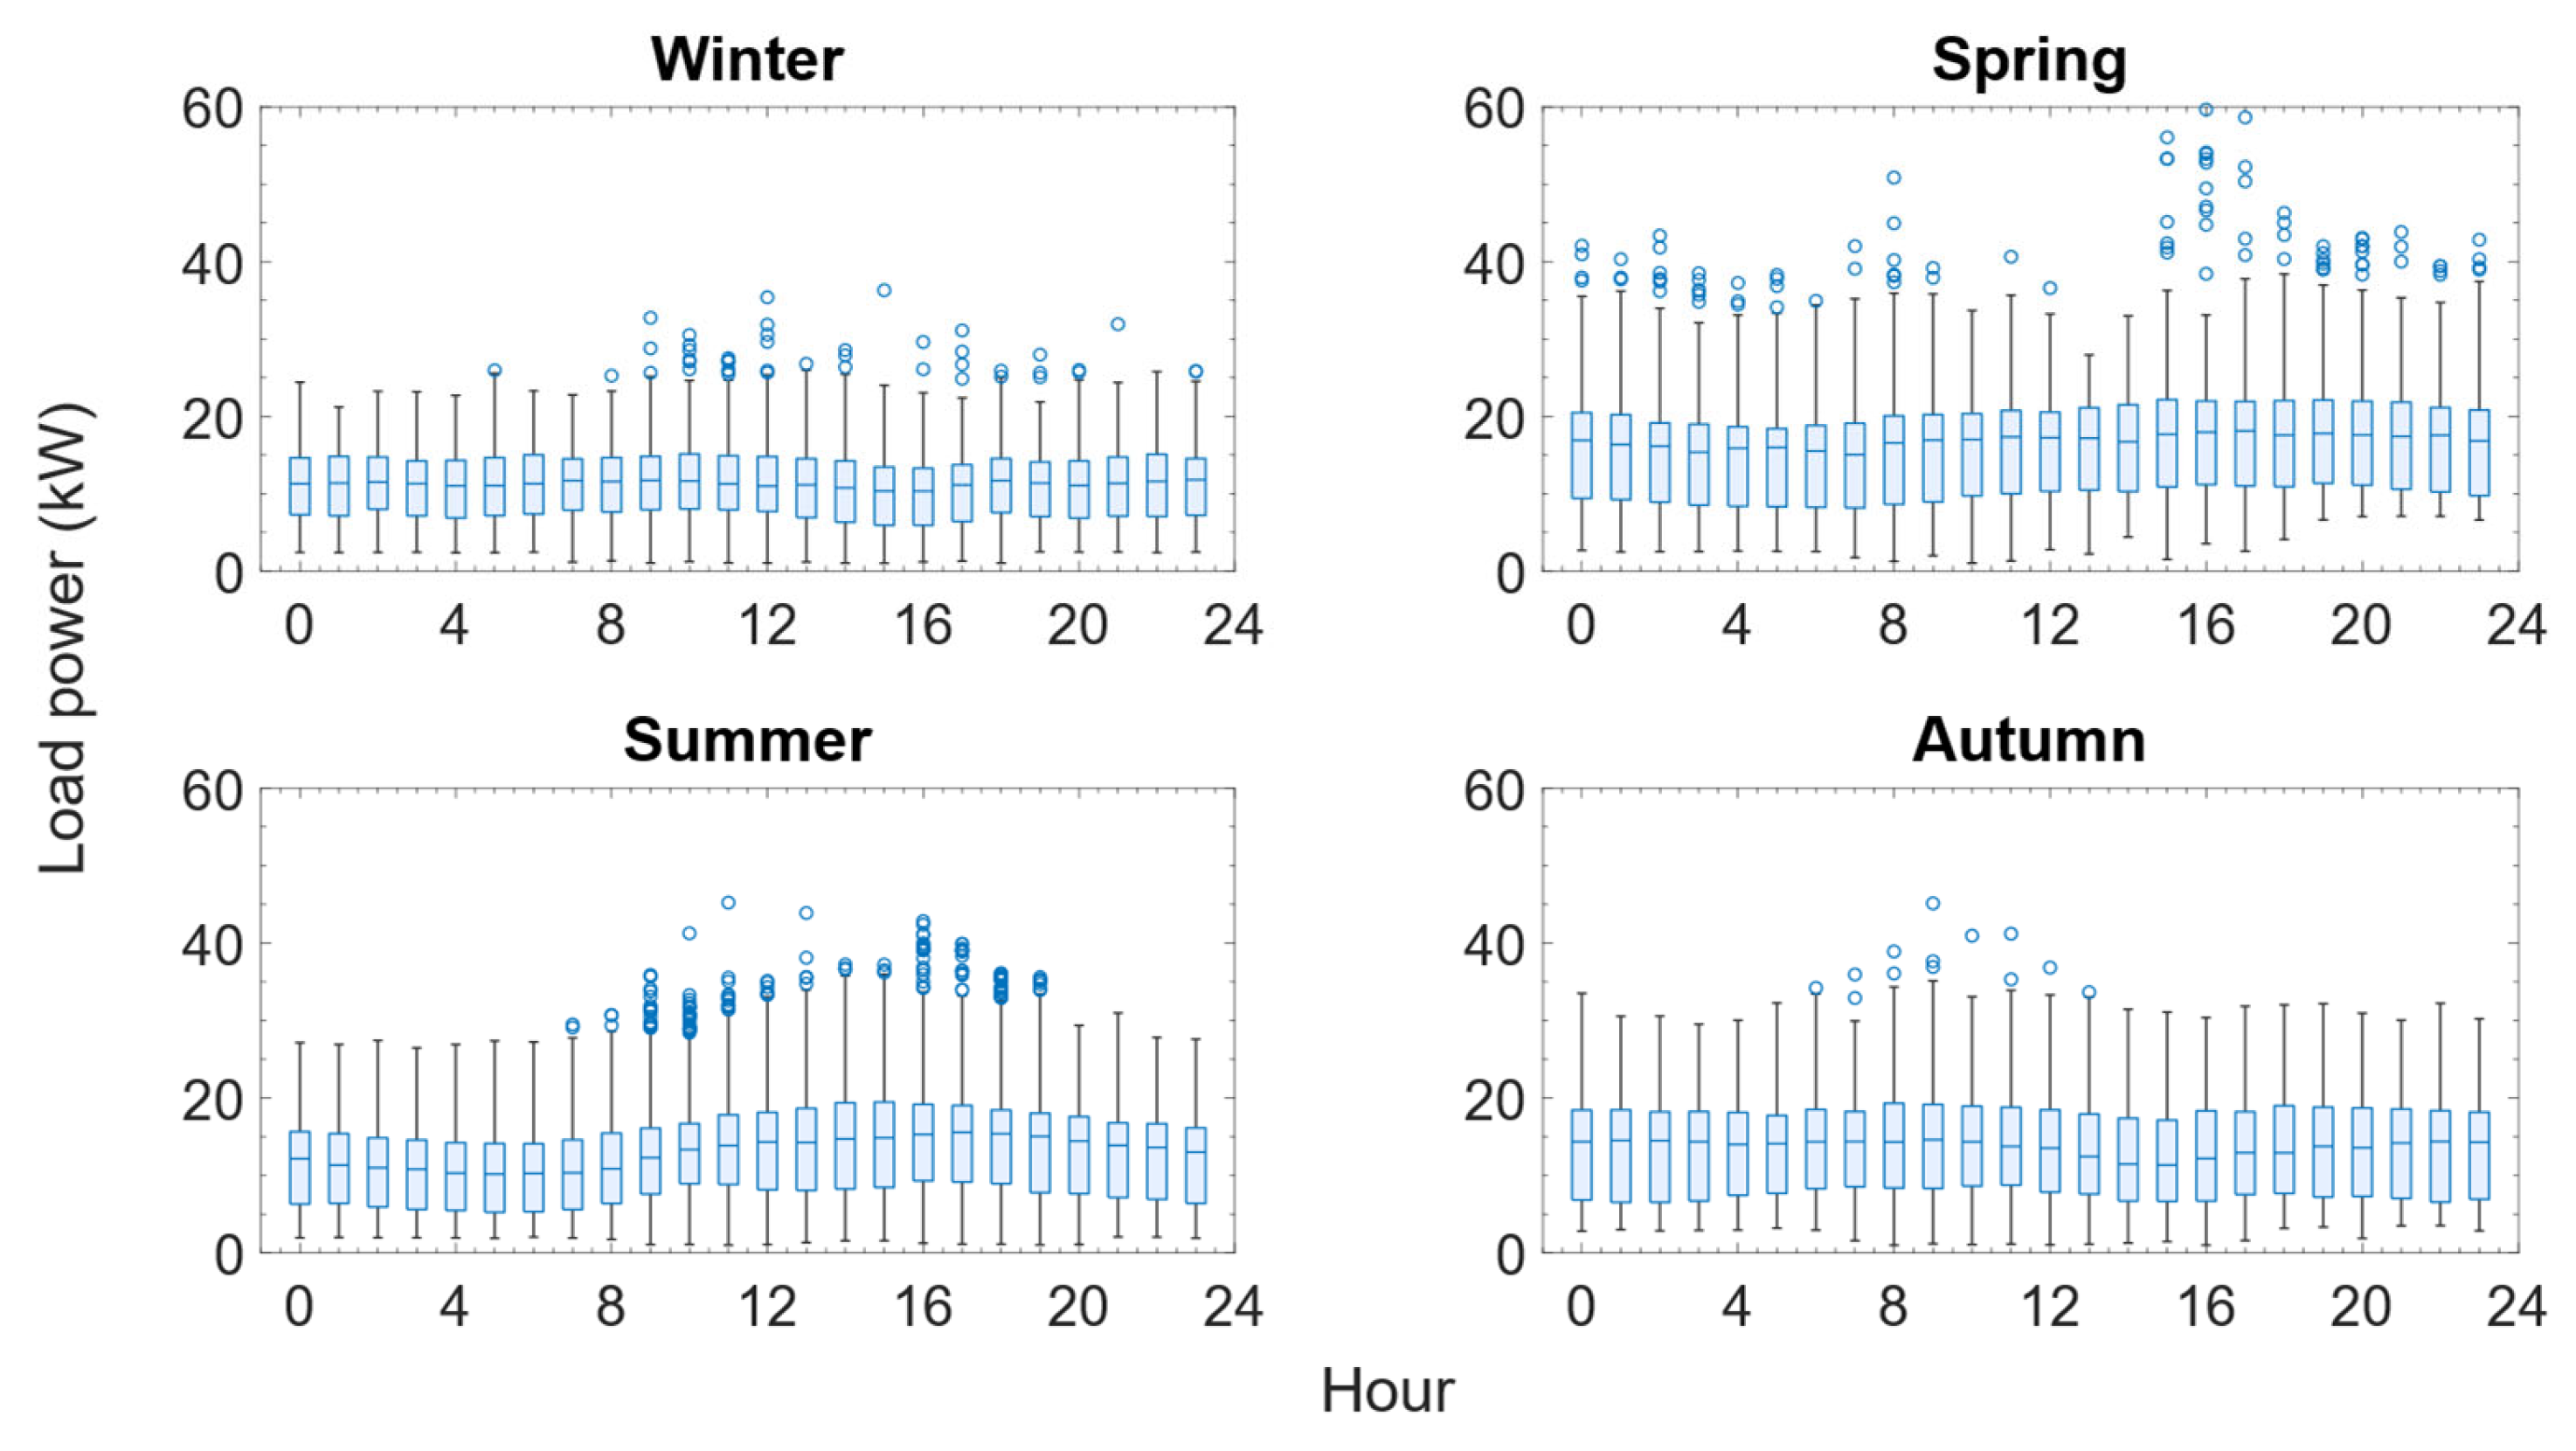
Figure 4 presents the building’s monthly and hourly consumption profile. Daily power consumption remained relatively constant throughout the year, with average values of 11.1 kW in winter, 15.7 kW in spring, 12.9 kW in summer, and 13.4 kW in autumn.
A 22% increase in consumption was observed during the warmer academic period (spring) compared to the non-academic period (summer), which suggests higher use of air conditioning systems, consistent with the building’s function.
Meteorological data, including plane-of-array (POA) radiation, ambient temperature, and wind speed, were obtained with a 5 min resolution from the Meteonorm 8.2 software [
68], which utilizes the Pérez diffuse radiation and tilted irradiance model [
69].
3.3. Three-Dimensional Modeling
The building features irregular roof and facade configurations. For both scenarios, the CanadianSolar CS1U-400 monocrystalline module (Guelph, ON, Canada) [
70] was selected. Following the design rules outlined in
Section 2.1, the distributions for RTPV and FAPV systems were derived and illustrated in
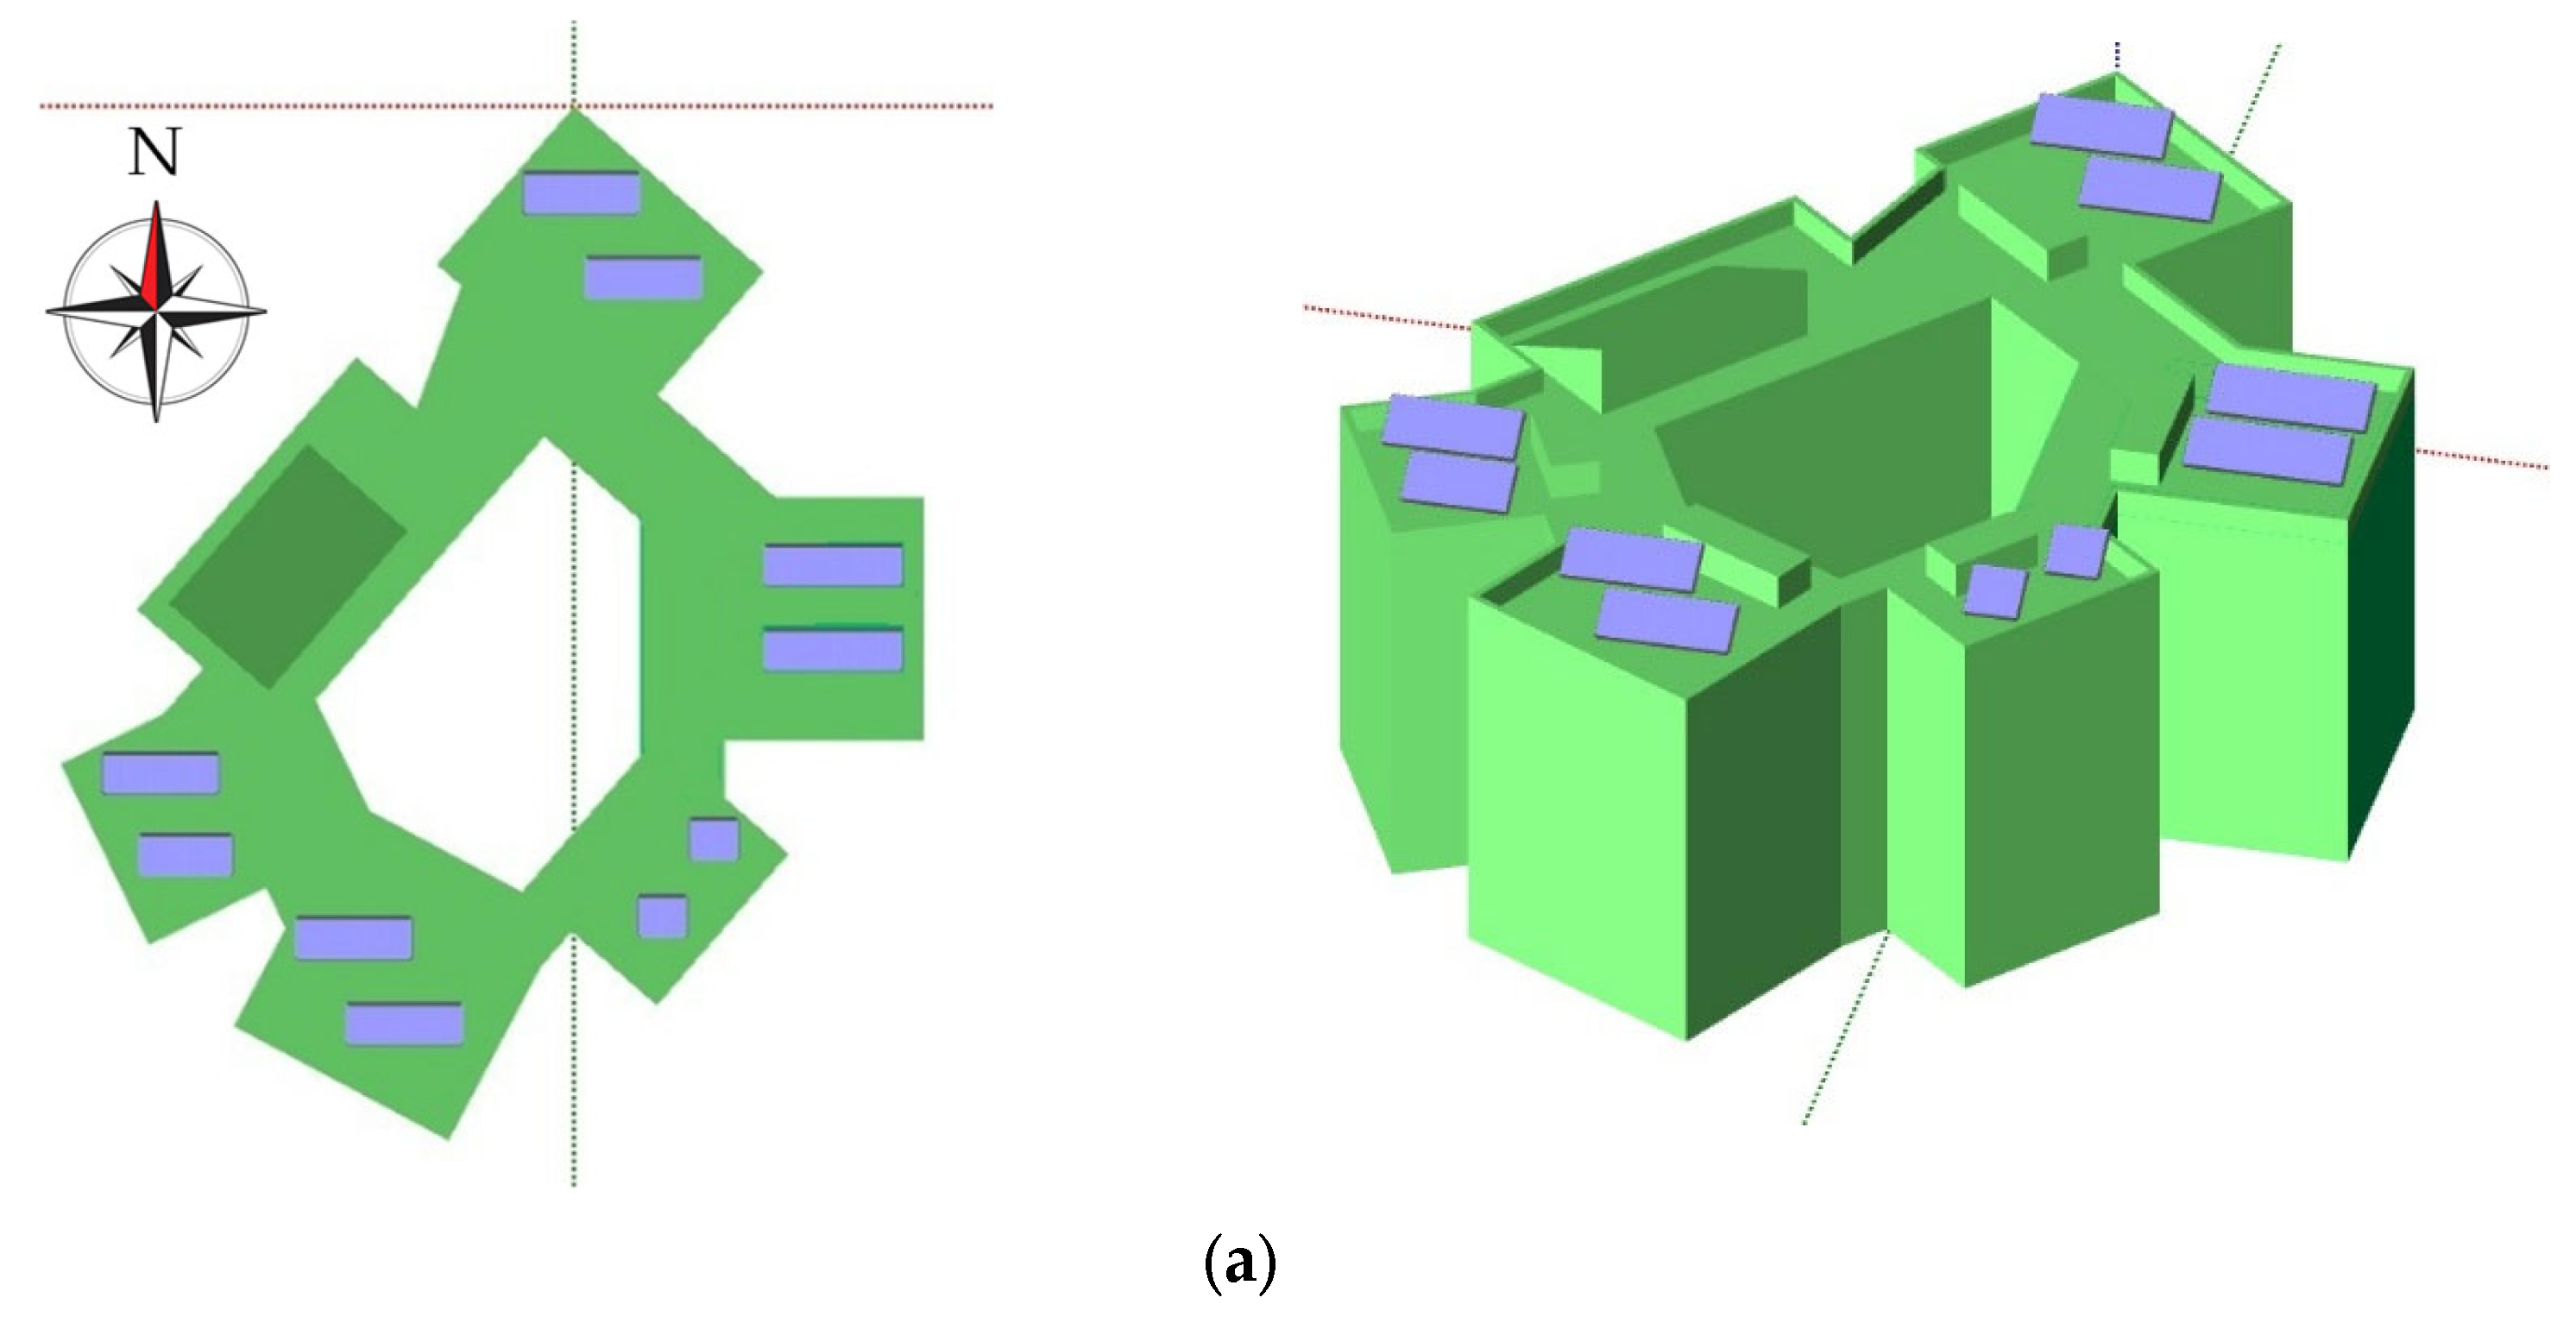
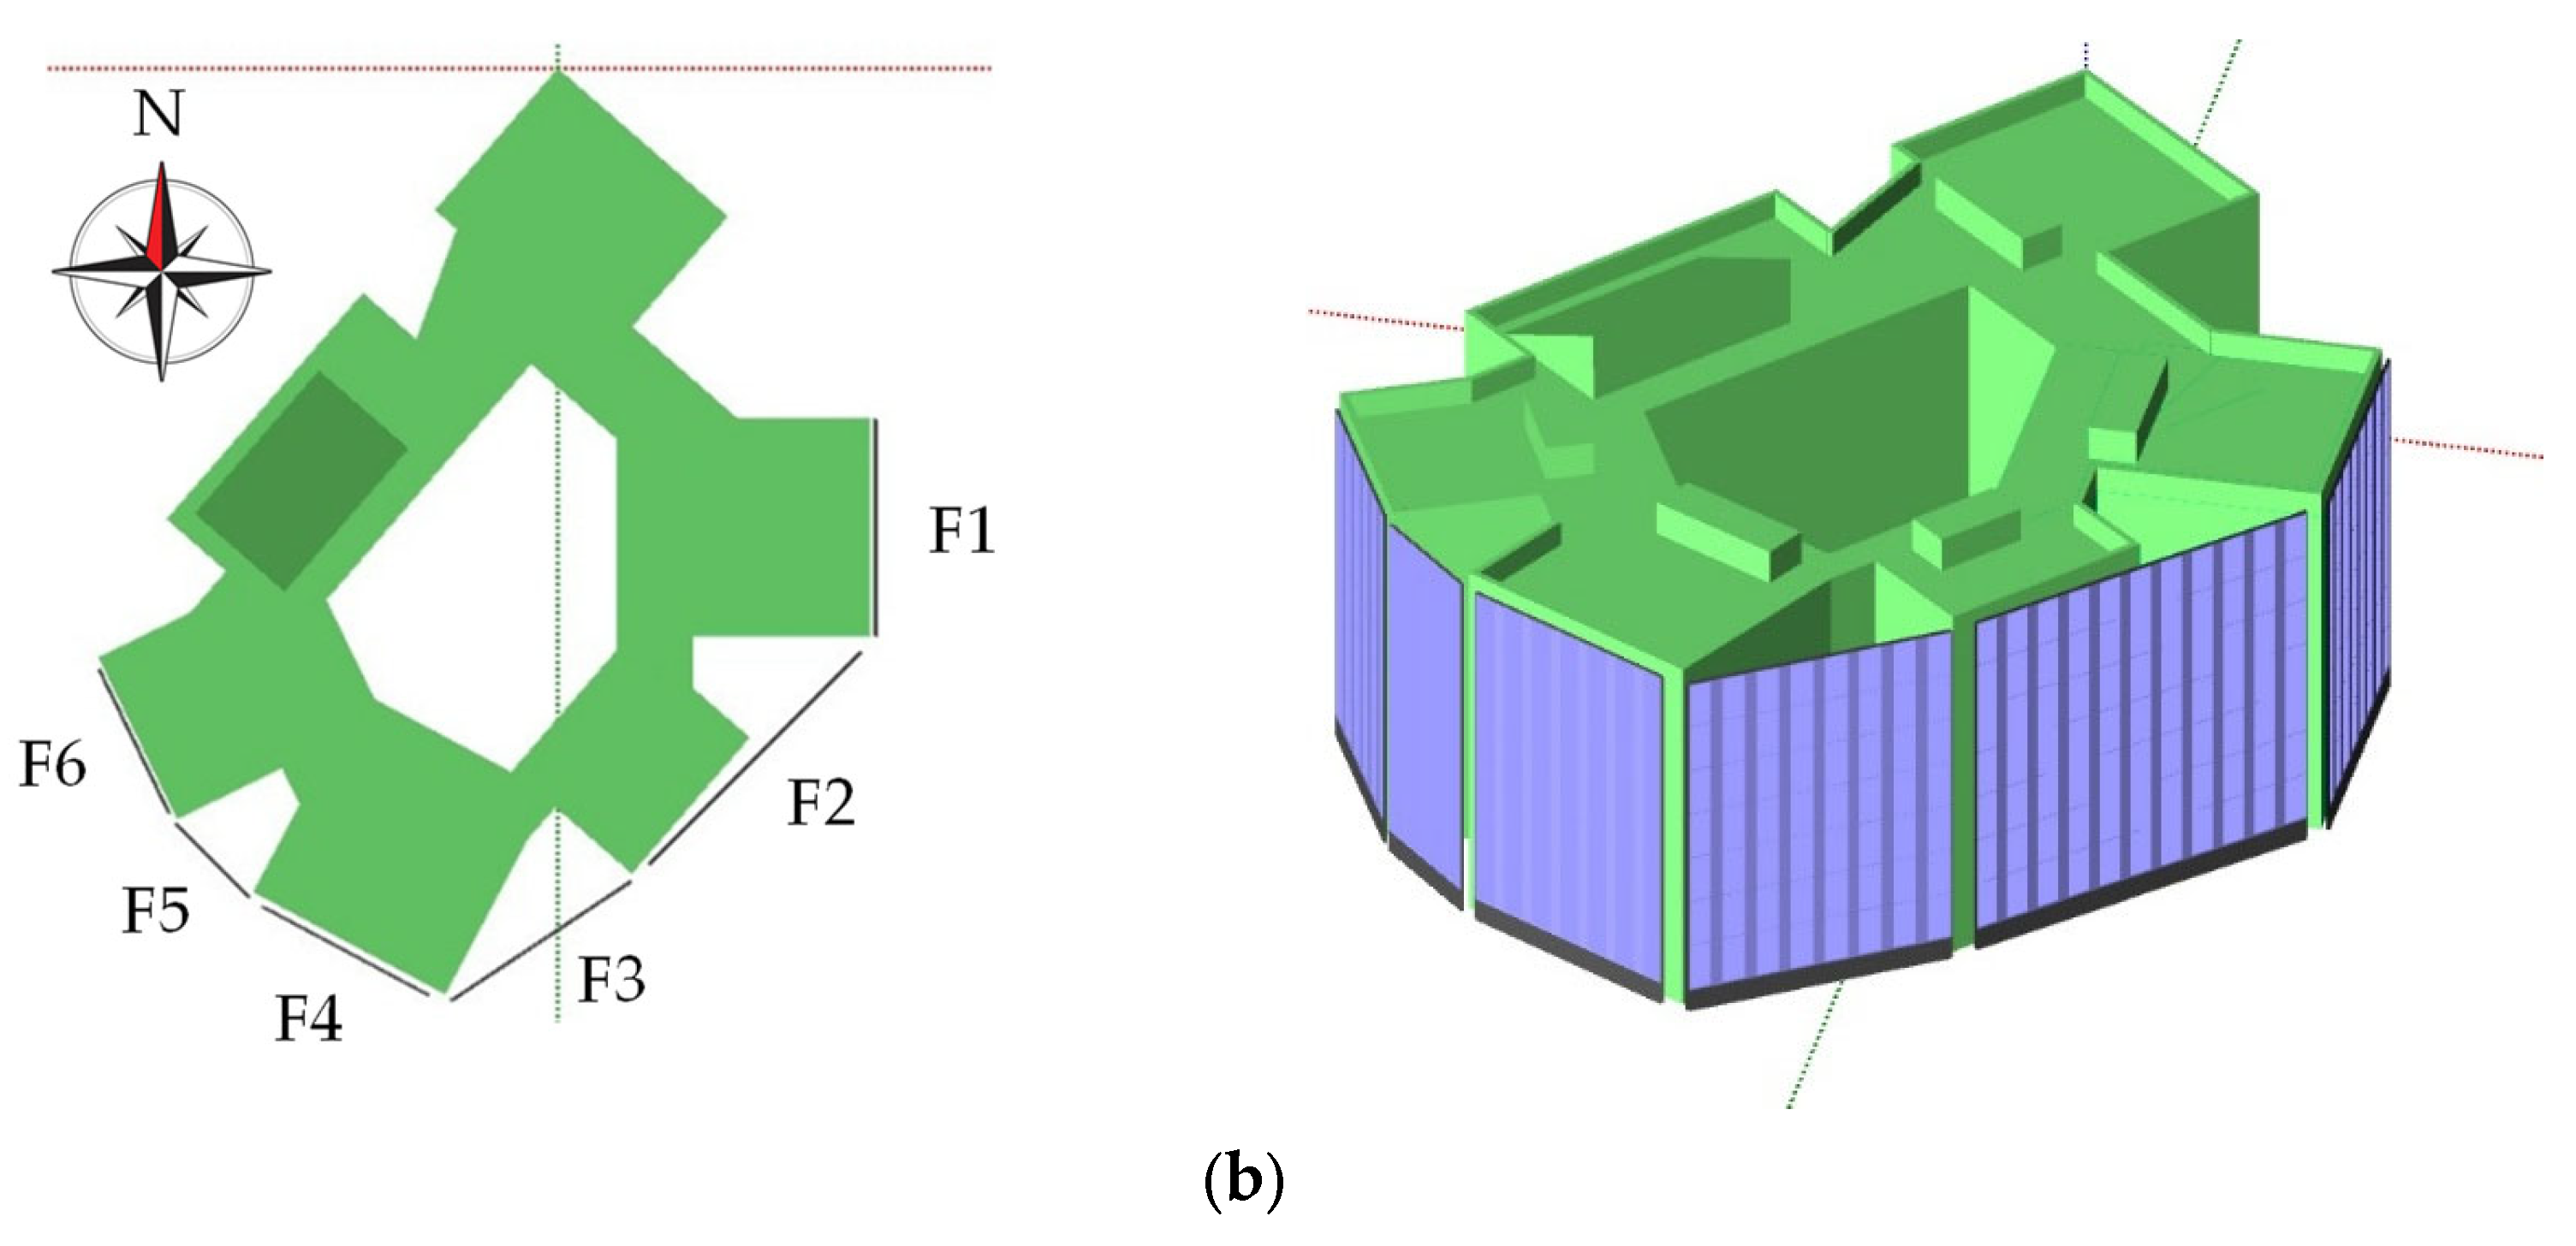
Figure 5. In the RTPV configuration, modules were oriented south with a 30° tilt in non-trafficable roof areas. A minimum separation of 2 m between module racks was maintained to minimize self-shading.
Conversely, the FAPV system integrates modules on an independent support structure, offering greater design flexibility and improved rear ventilation. The proposed solution comprises six subsystems with orientations of −90°, −45°, −33.5°, 28°, 45°, and 64°.
Table 3 summarizes the main characteristics of both solutions.
Table 3 clearly shows that the available facade area is significantly larger than the usable roof area. This results in an installable PV capacity of 122 kW on the facade, compared to 18 kW on the roof. The parameters used in the PV system model are presented in
Table 4.
Subsequently, the building’s surroundings were modeled to obtain the correction coefficients for shading and array incidence loss.
3.4. Shading and Array Incidence Loss
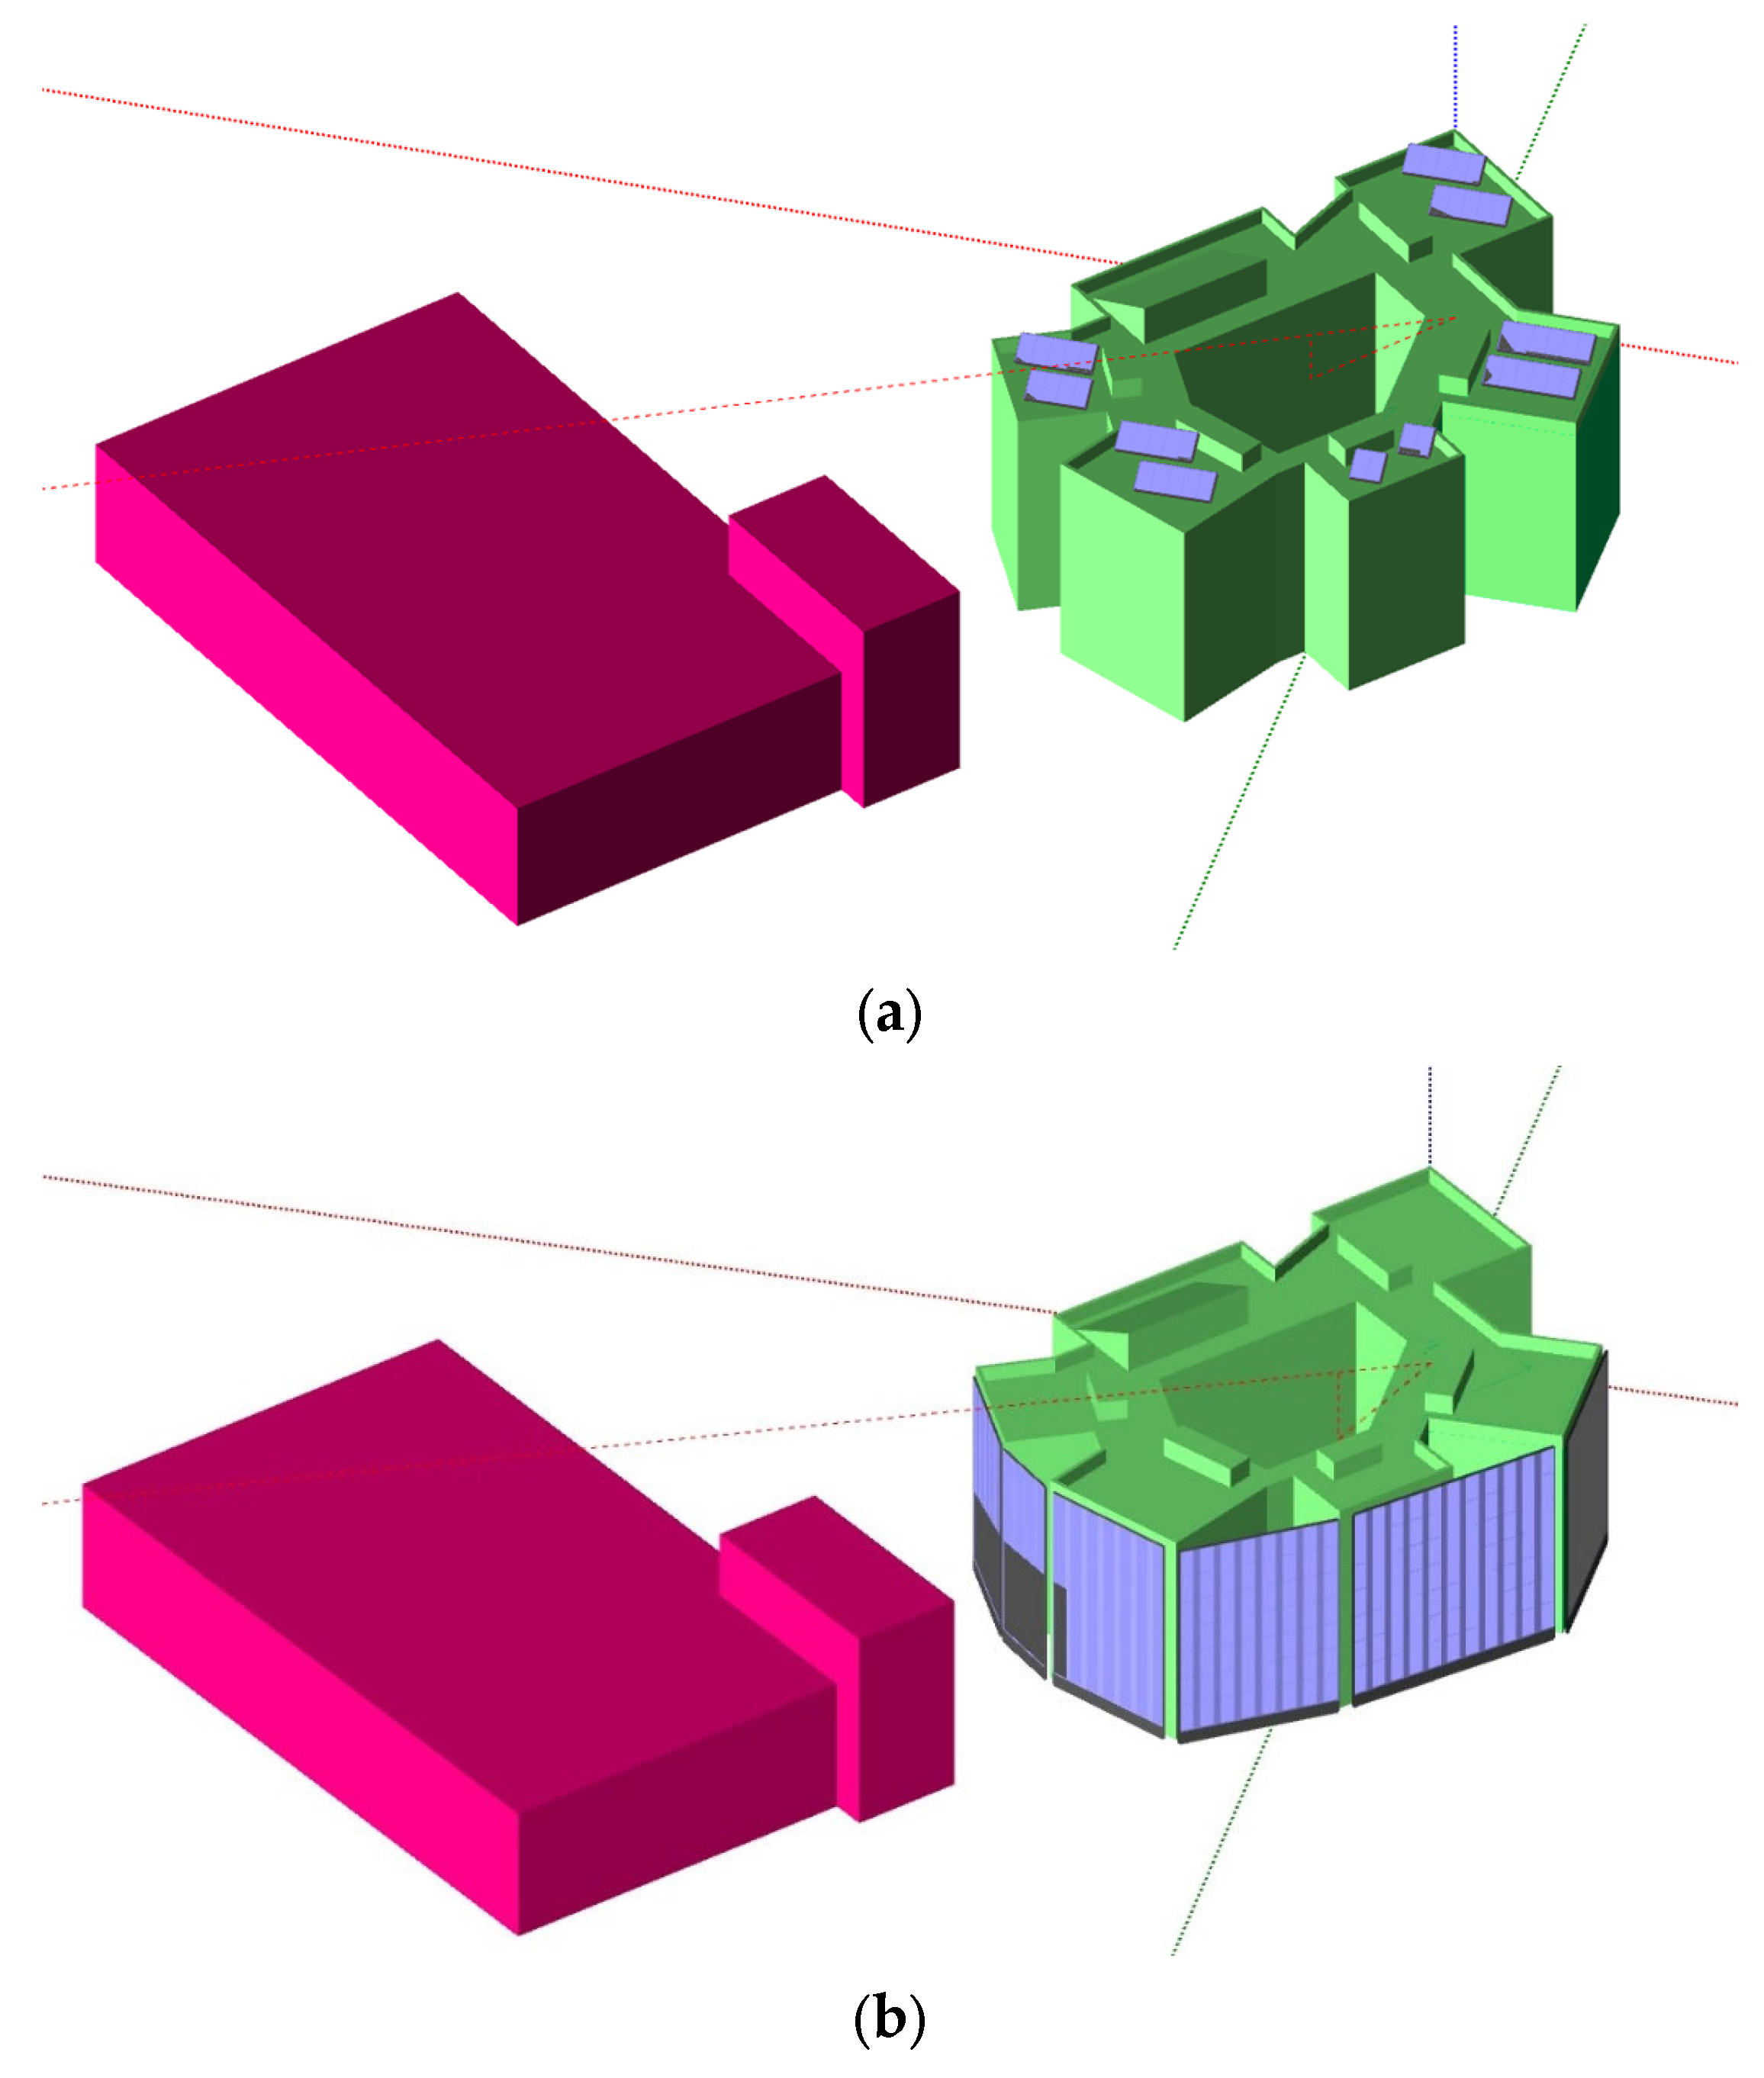
The surroundings of the case study were included in the 3D model to conduct a detailed evaluation of energy losses due to shading and IAM.
Figure 6 illustrates the 3D design environment implemented in PVsyst to simulate the sun’s path and obtain the IAM and shading correction factors.
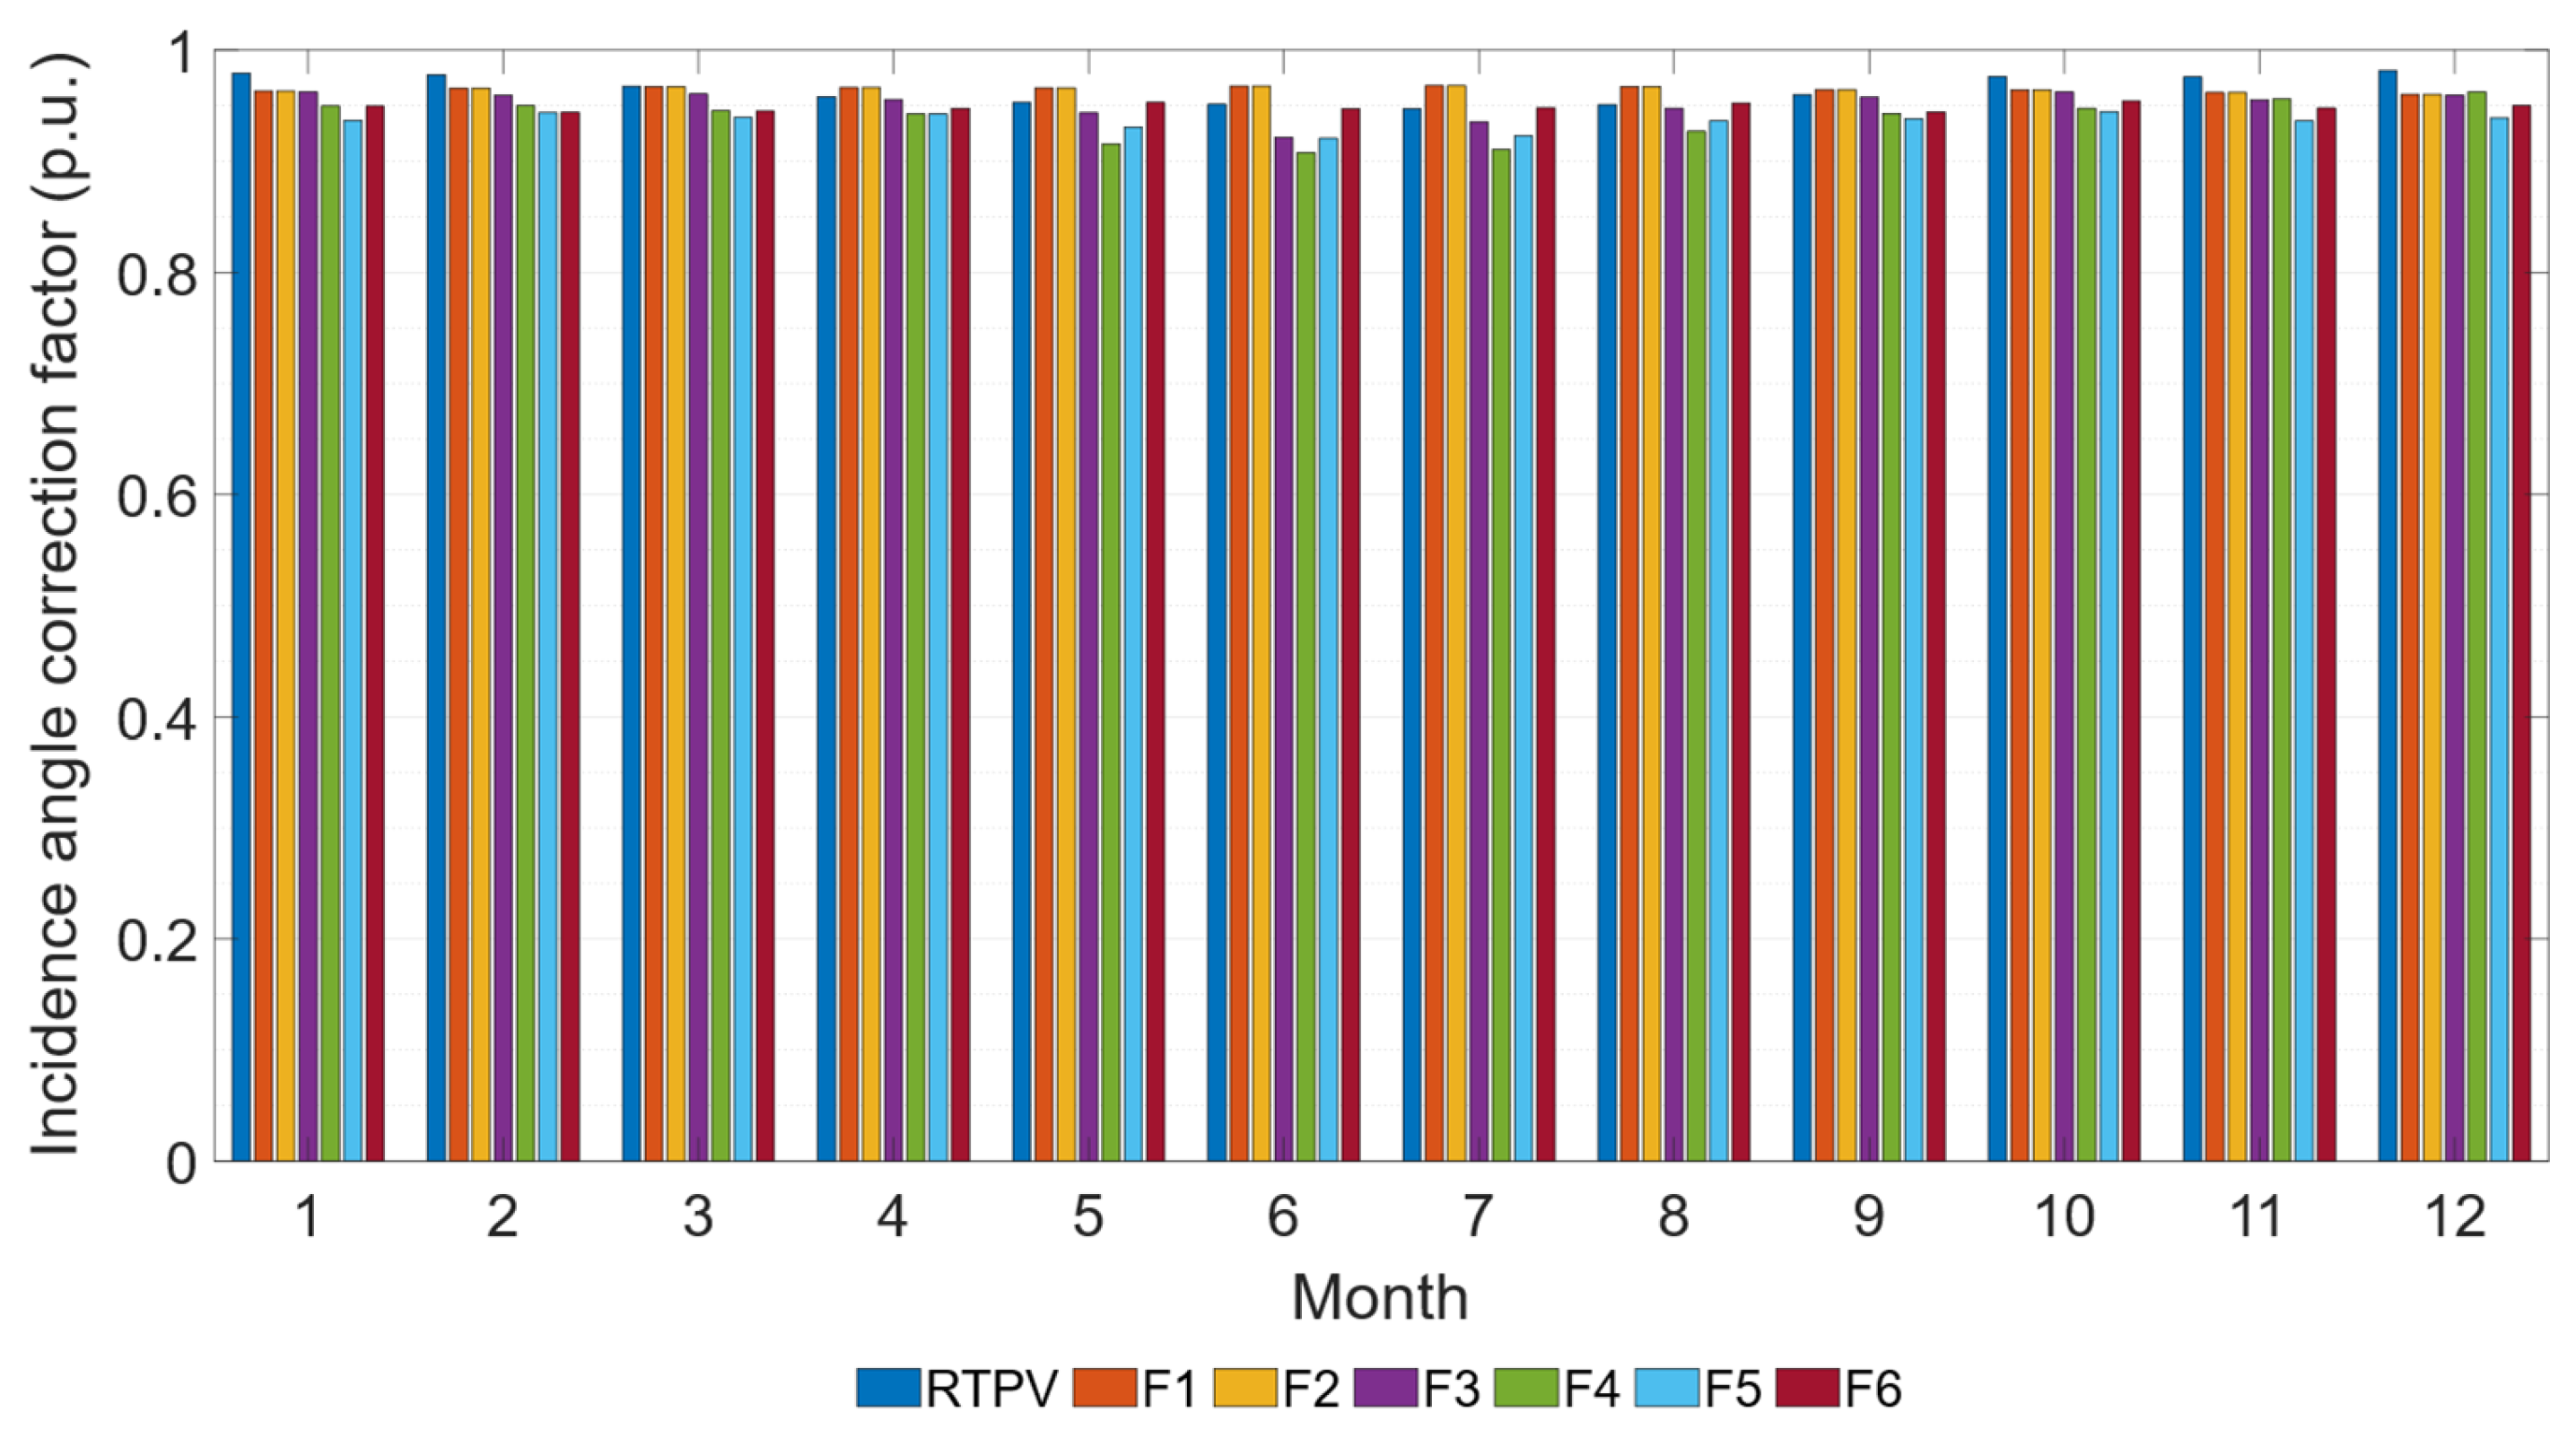
For the RTPV system, shadows are primarily caused by the building’s exterior wall and HVAC equipment. In contrast, facades 4, 5, and 6 of the facade system experience partial shading due to the adjacent building. The values obtained for the incidence angle correction factor are shown in
Figure 7, aggregated by month and subsystem. The RTPV system exhibited the lowest annual IAM losses (3%), compared to the facade subsystems (4%, 5%, 5%, 7%, 7%, and 6%, respectively).
IAM losses in the facade system range from 33% to 133% higher than those of the conventional system, highlighting the greater susceptibility of facade installations to this type of loss.
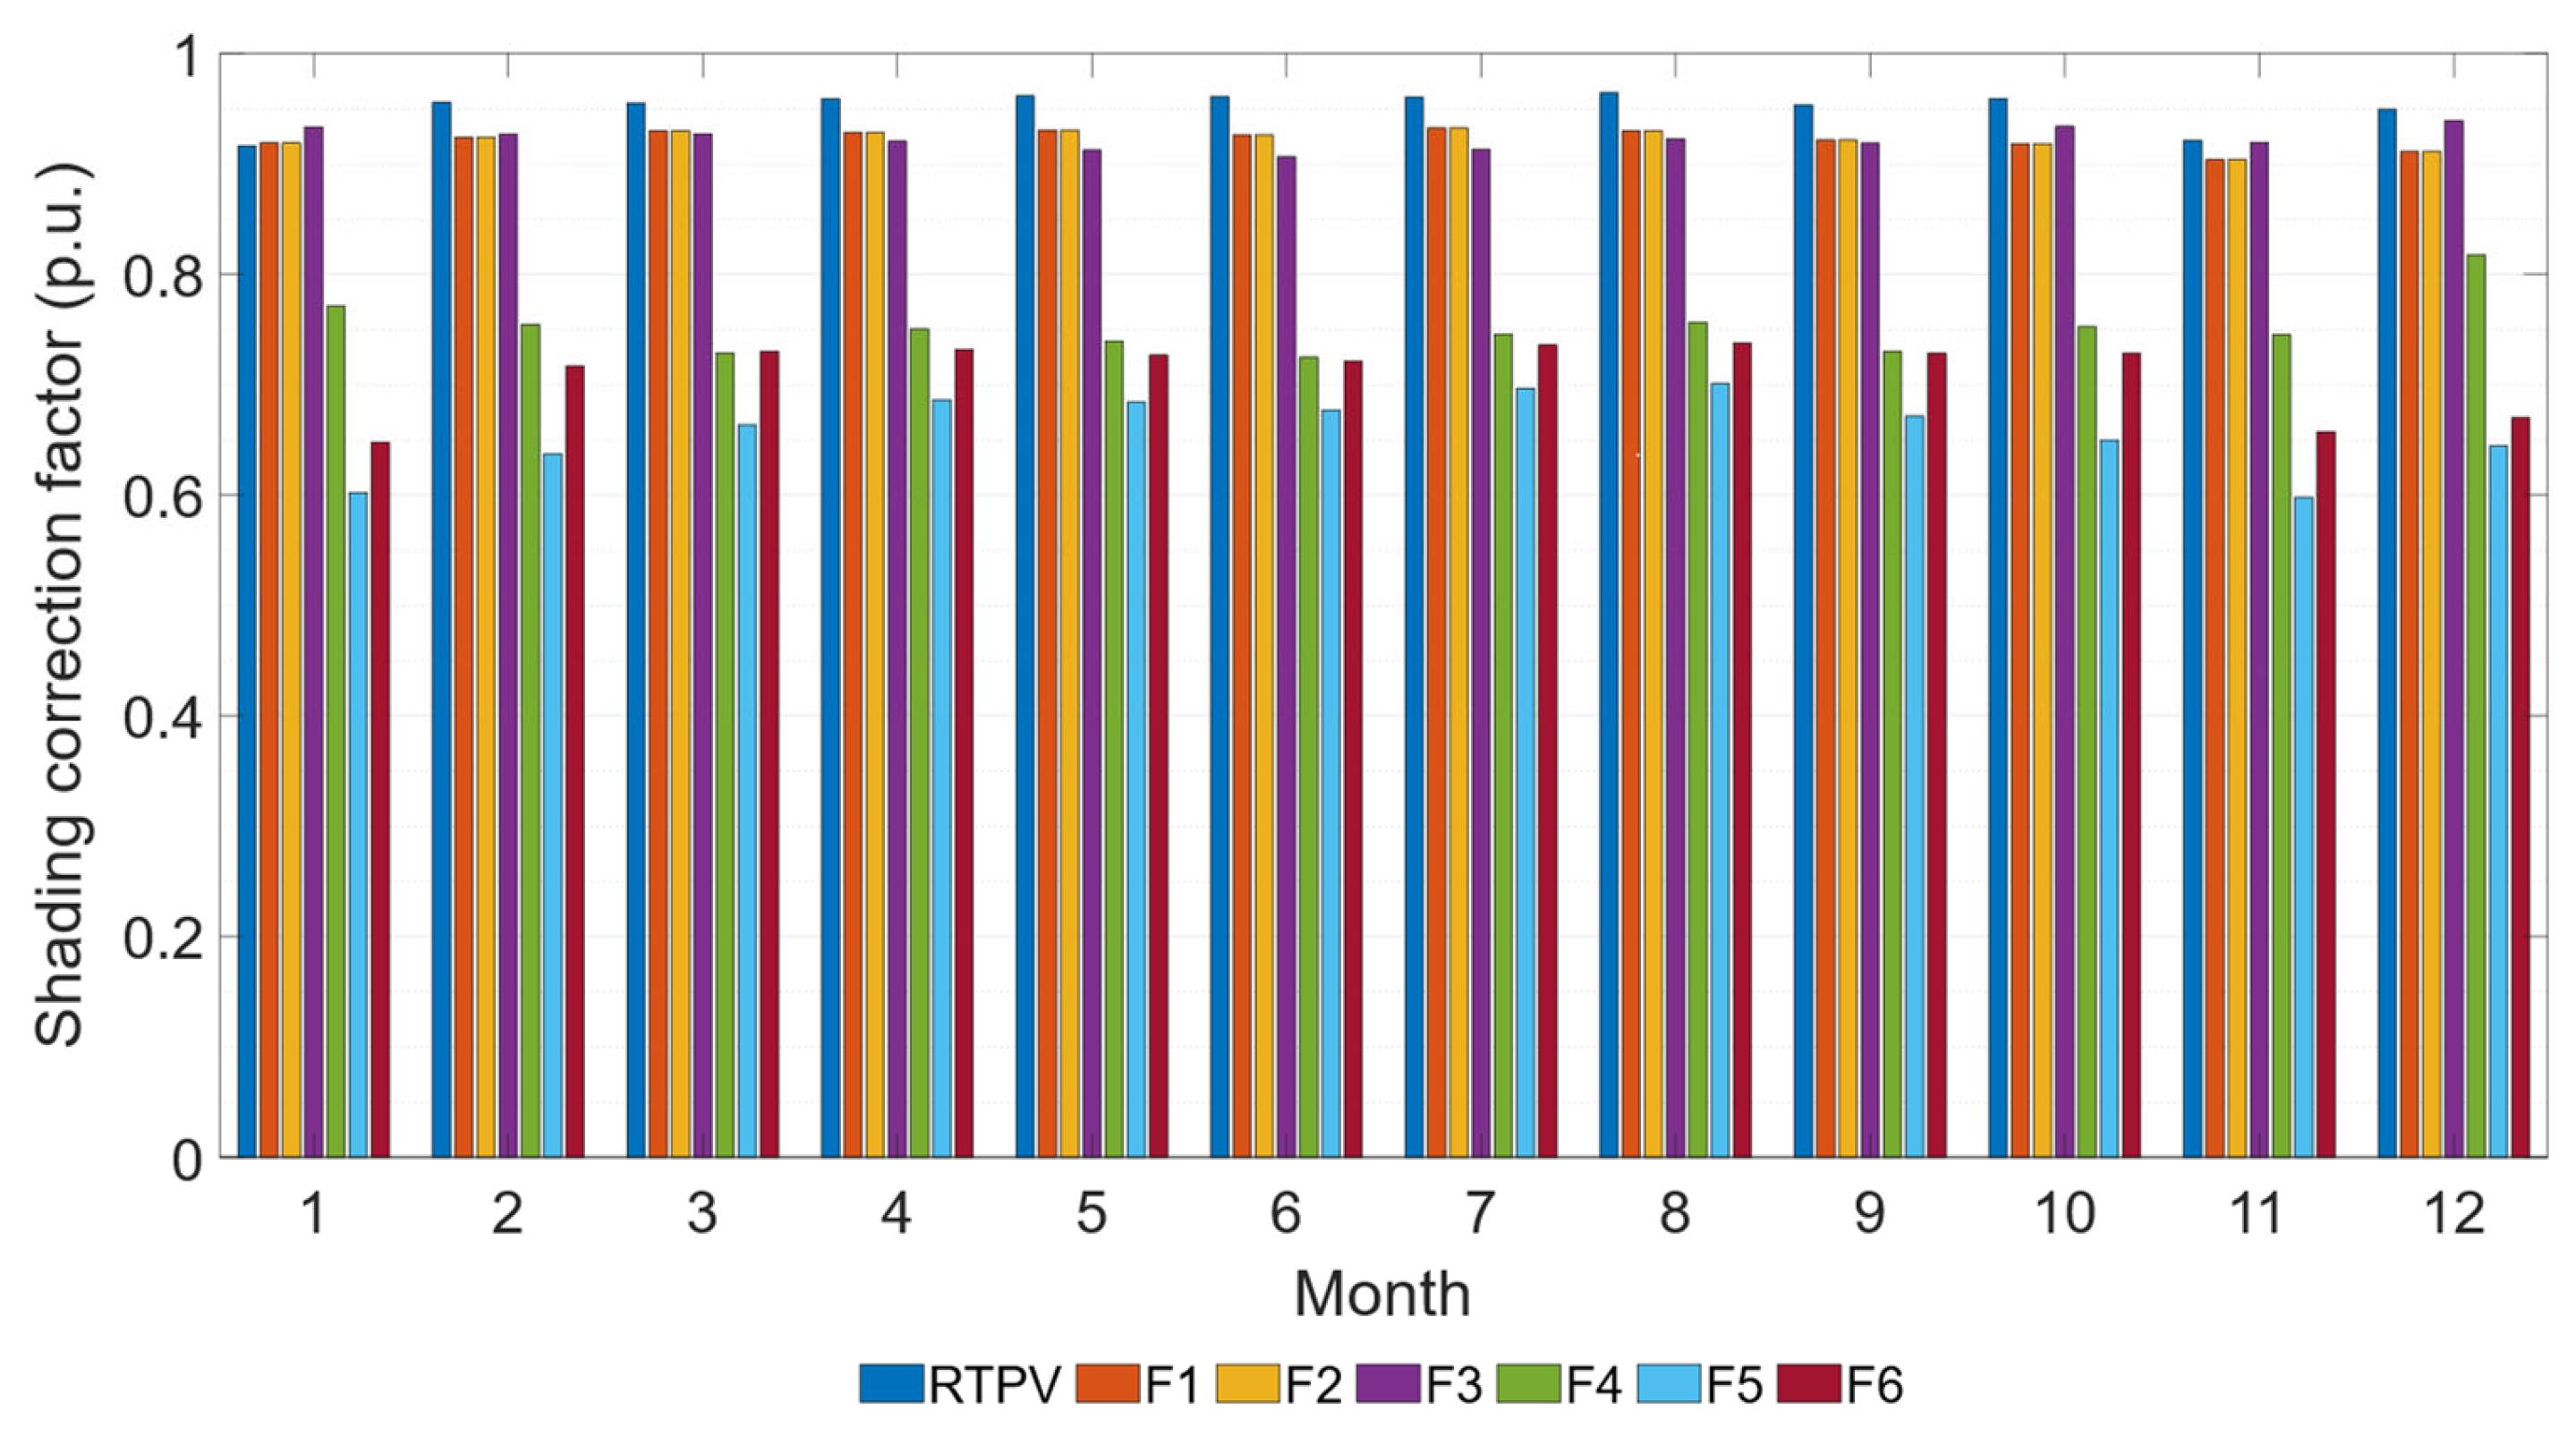
Figure 8 presents the monthly average value of the shading correction factor for each subsystem.
Facades F4, F5, and F6 exhibit annual average shading losses of 24%, 35%, and 29%, respectively. These values contrast with the 8% average annual losses in facade subsystems F1, F2, and F3, which are closer to the 5% observed in the conventional system. Electric shading losses in subsystems F4, F5, and F6 reduce their energy output, resulting in a lower performance ratio, as shown in the following section. These findings underscore the importance of considering shading losses for each subsystem, particularly in facade PV installations, as this can be a decisive factor in system design.
3.5. PV System Layout and Sizing Assessment
In this phase, the potential of each subsystem is assessed.
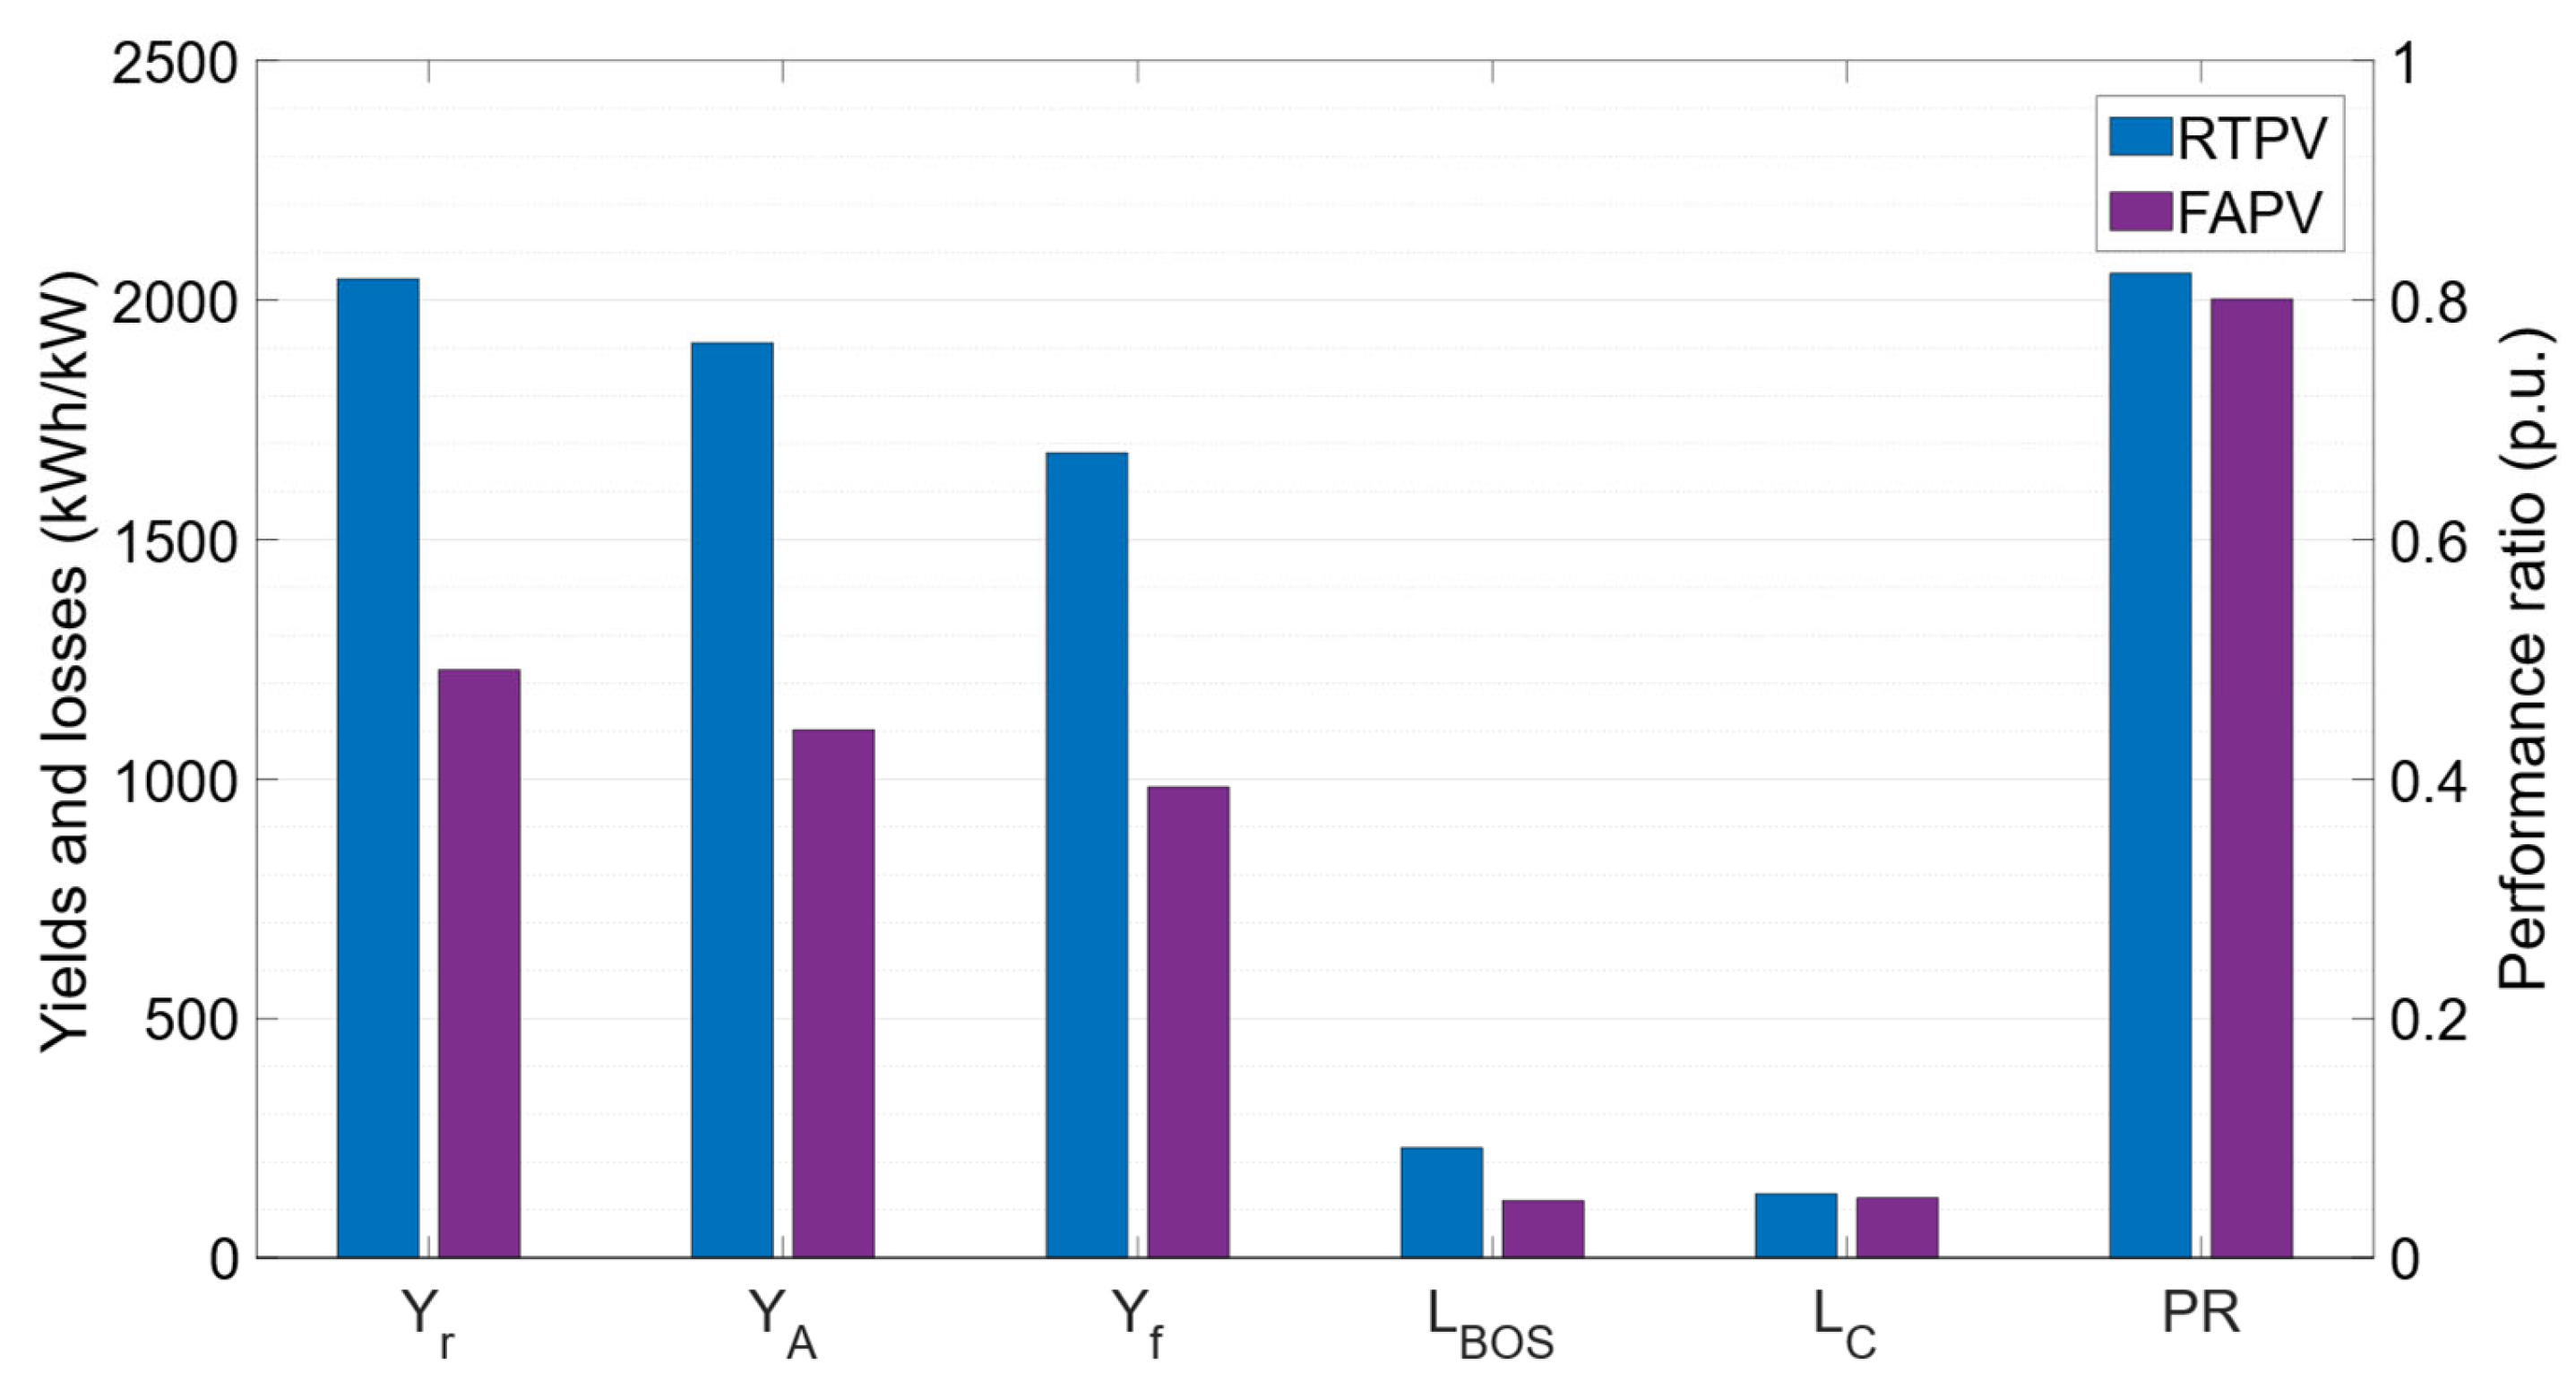
Figure 9 illustrates the final yield, BOS losses, and capture losses for each PV subsystem. The RTPV system stands out with the highest final yield (1681 kWh/kW) and performance ratio (82%).
Conversely, facade subsystems F4, F5, and F6 show lower performance, with PR values below 65%. This low PR is attributed to significant capture losses in these facades, caused by shading at 67%, 75%, and 68%, respectively. Consequently, the implementation of FAPV subsystems on facades 4, 5, and 6 was discarded due to their PR falling below 70%.
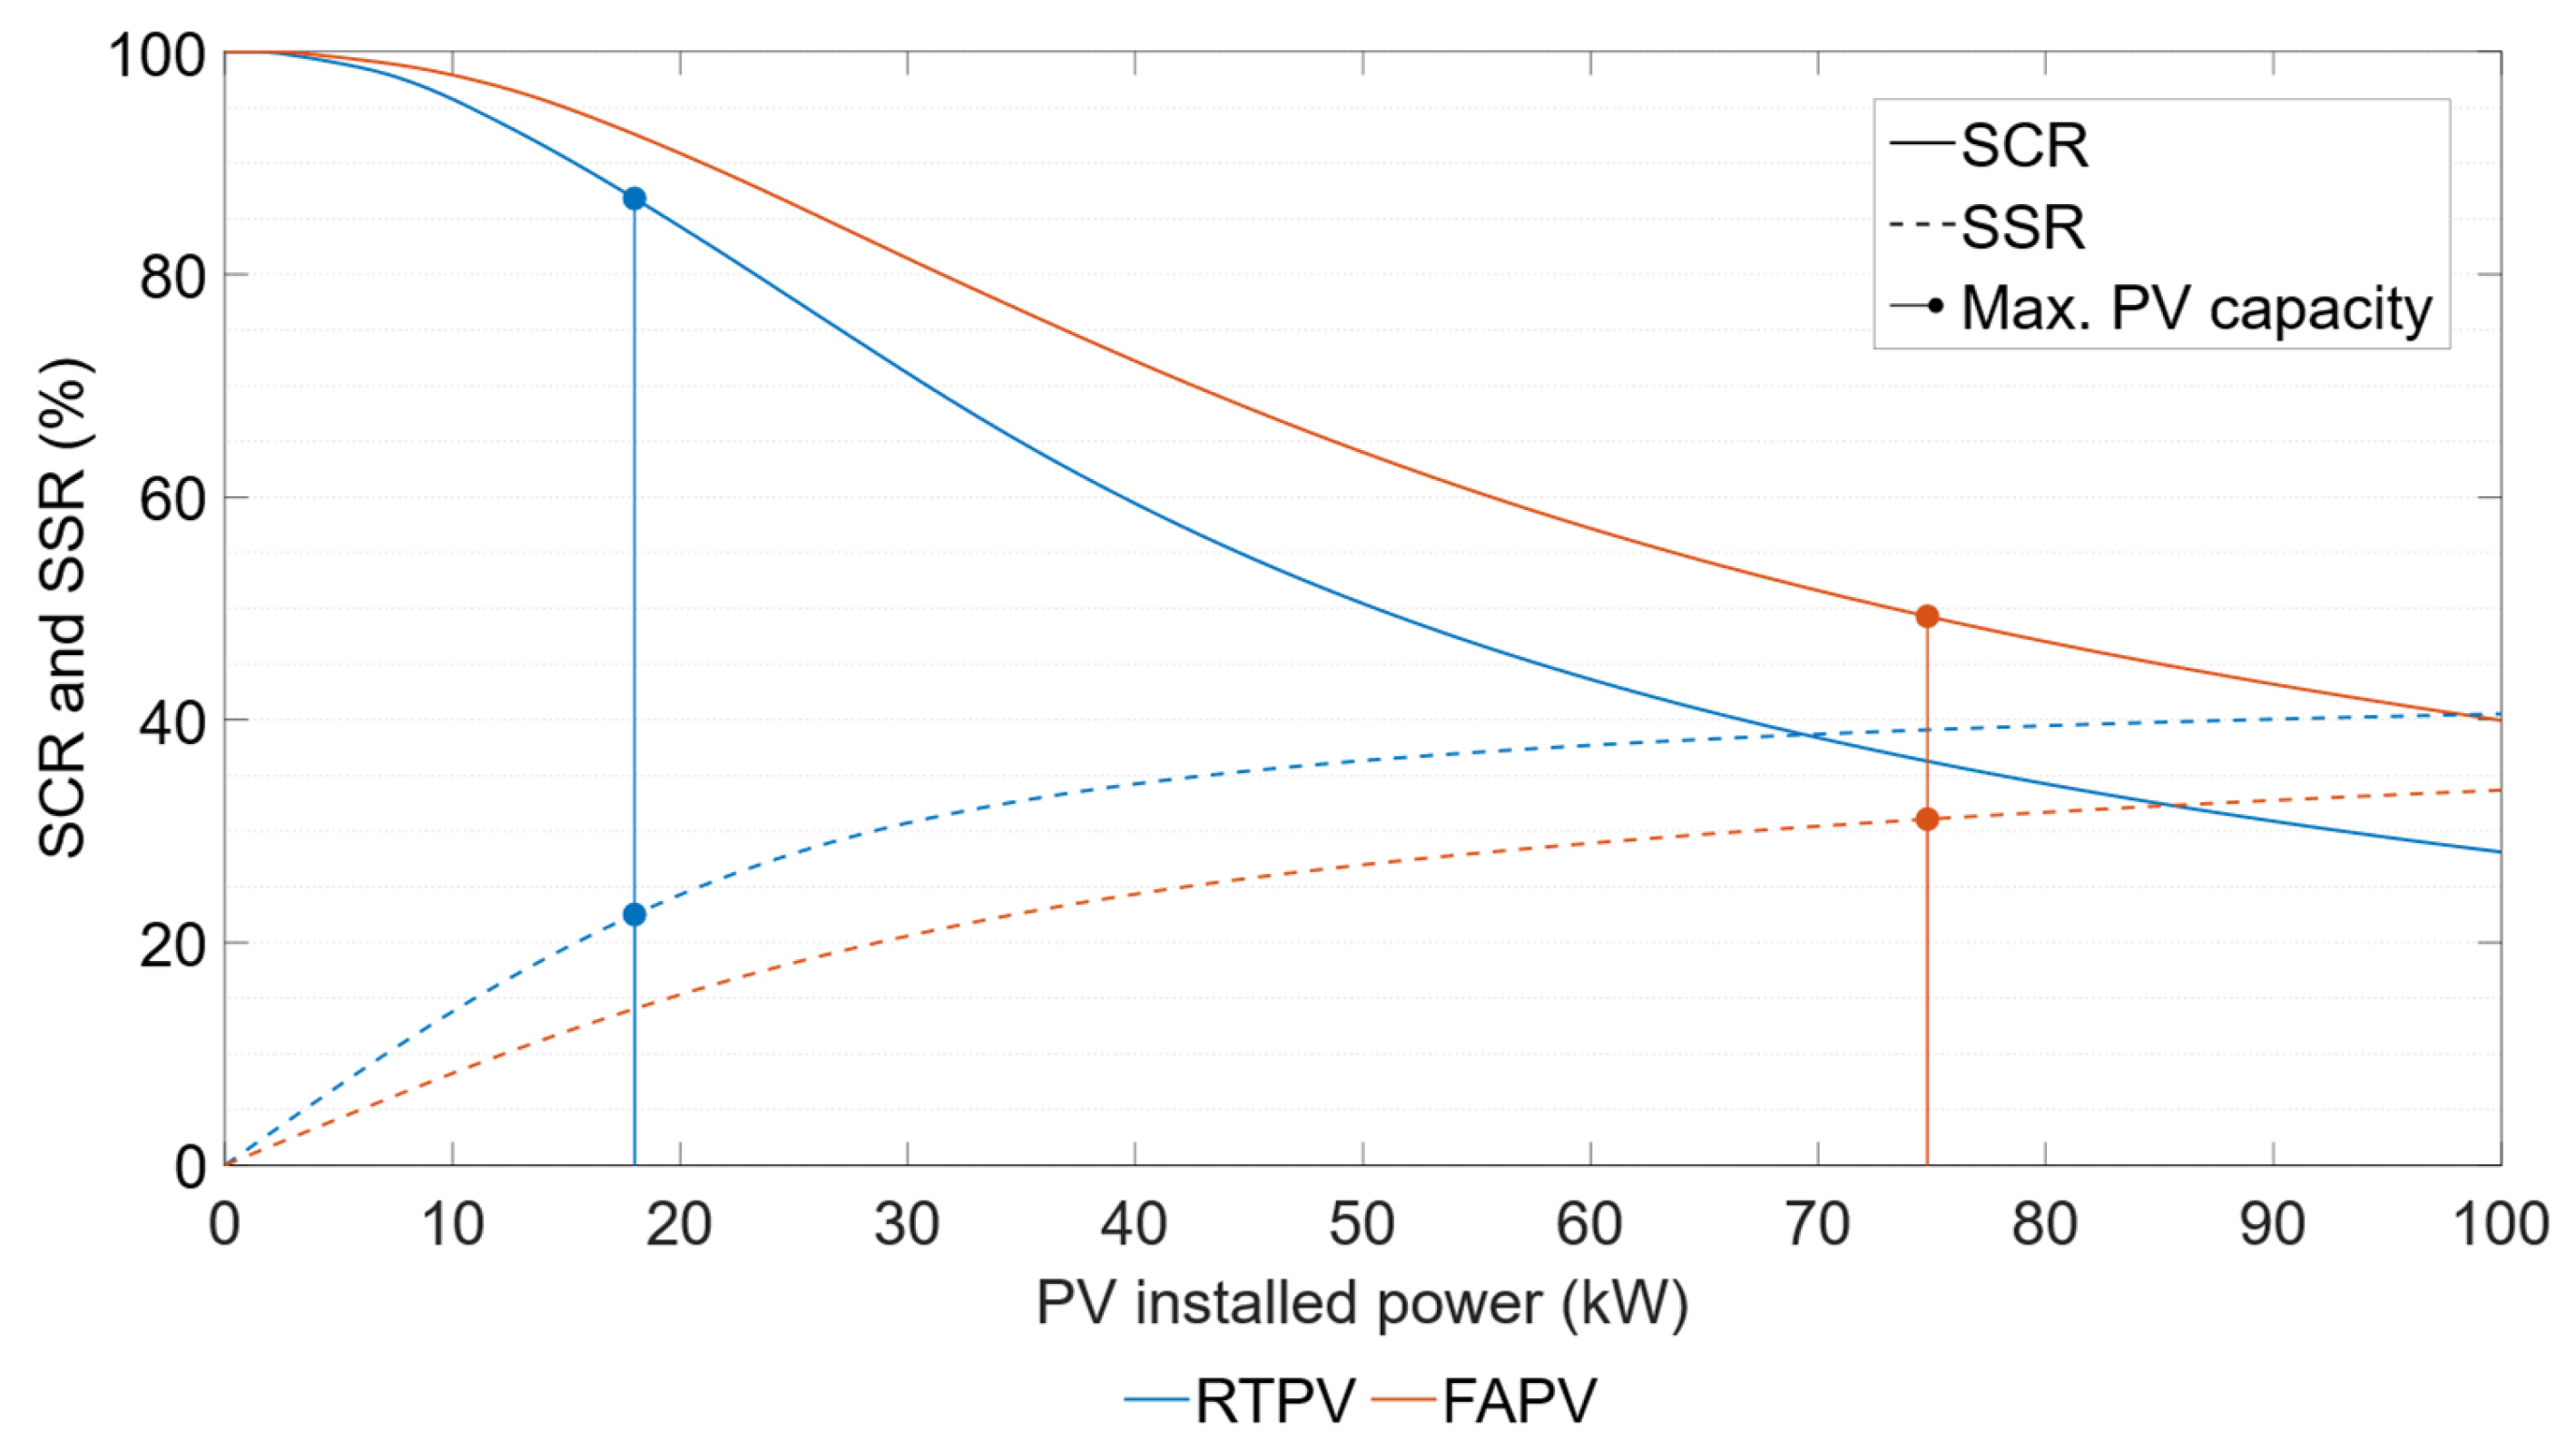
The sizing of the RTPV system and the FAPV system (limited to facades 1, 2, and 3) was based on the SSR–P
0 curve, shown alongside the SCR in
Figure 10. Although the RTPV system maximizes energy generation, its installable capacity is limited. Conversely, the facade system, which generates less PV energy per installed kW, offers greater design flexibility due to its significantly larger usable area. The rooftop system achieved a maximum SSR of 22.5%, while the facade system reached 31.1%.
The sizing criterion was to maximize the system’s self-sufficiency while keeping the PV capacity within the linear region of the SSR–P
0 curve, which represents the design zone yielding the highest SSR per installed kW. For the rooftop installation, the maximum installable PV capacity of 18 kW falls within this linear region; thus, it was selected as the optimal generator size. For the FAPV system, however, the linear region of the SSR–P
0 curve extends to a capacity between 30 and 35 kW. Therefore, a facade generator size of 32 kW, equivalent to 80 modules, was chosen.
Table 5 summarizes the details of the studied PV system alternatives.
The ground footprint of the rooftop modules was calculated as their horizontal projection, while the area occupied by the facade system was determined by multiplying the length and width of the supporting structure. Subsequently, the results of both designs were analyzed to compare these alternatives.
4. Results and Discussion
The operation of both photovoltaic system designs (RTPV and FAPV) was simulated using meteorological data as input to the PV model. The analysis was structured in three phases: first, the quantification of PV system losses and the calculation of their performance parameters; second, the analysis of the generated PV energy’s use and its contribution to the building’s consumption; and third, the economic and environmental impact and proposed metrics were evaluated.
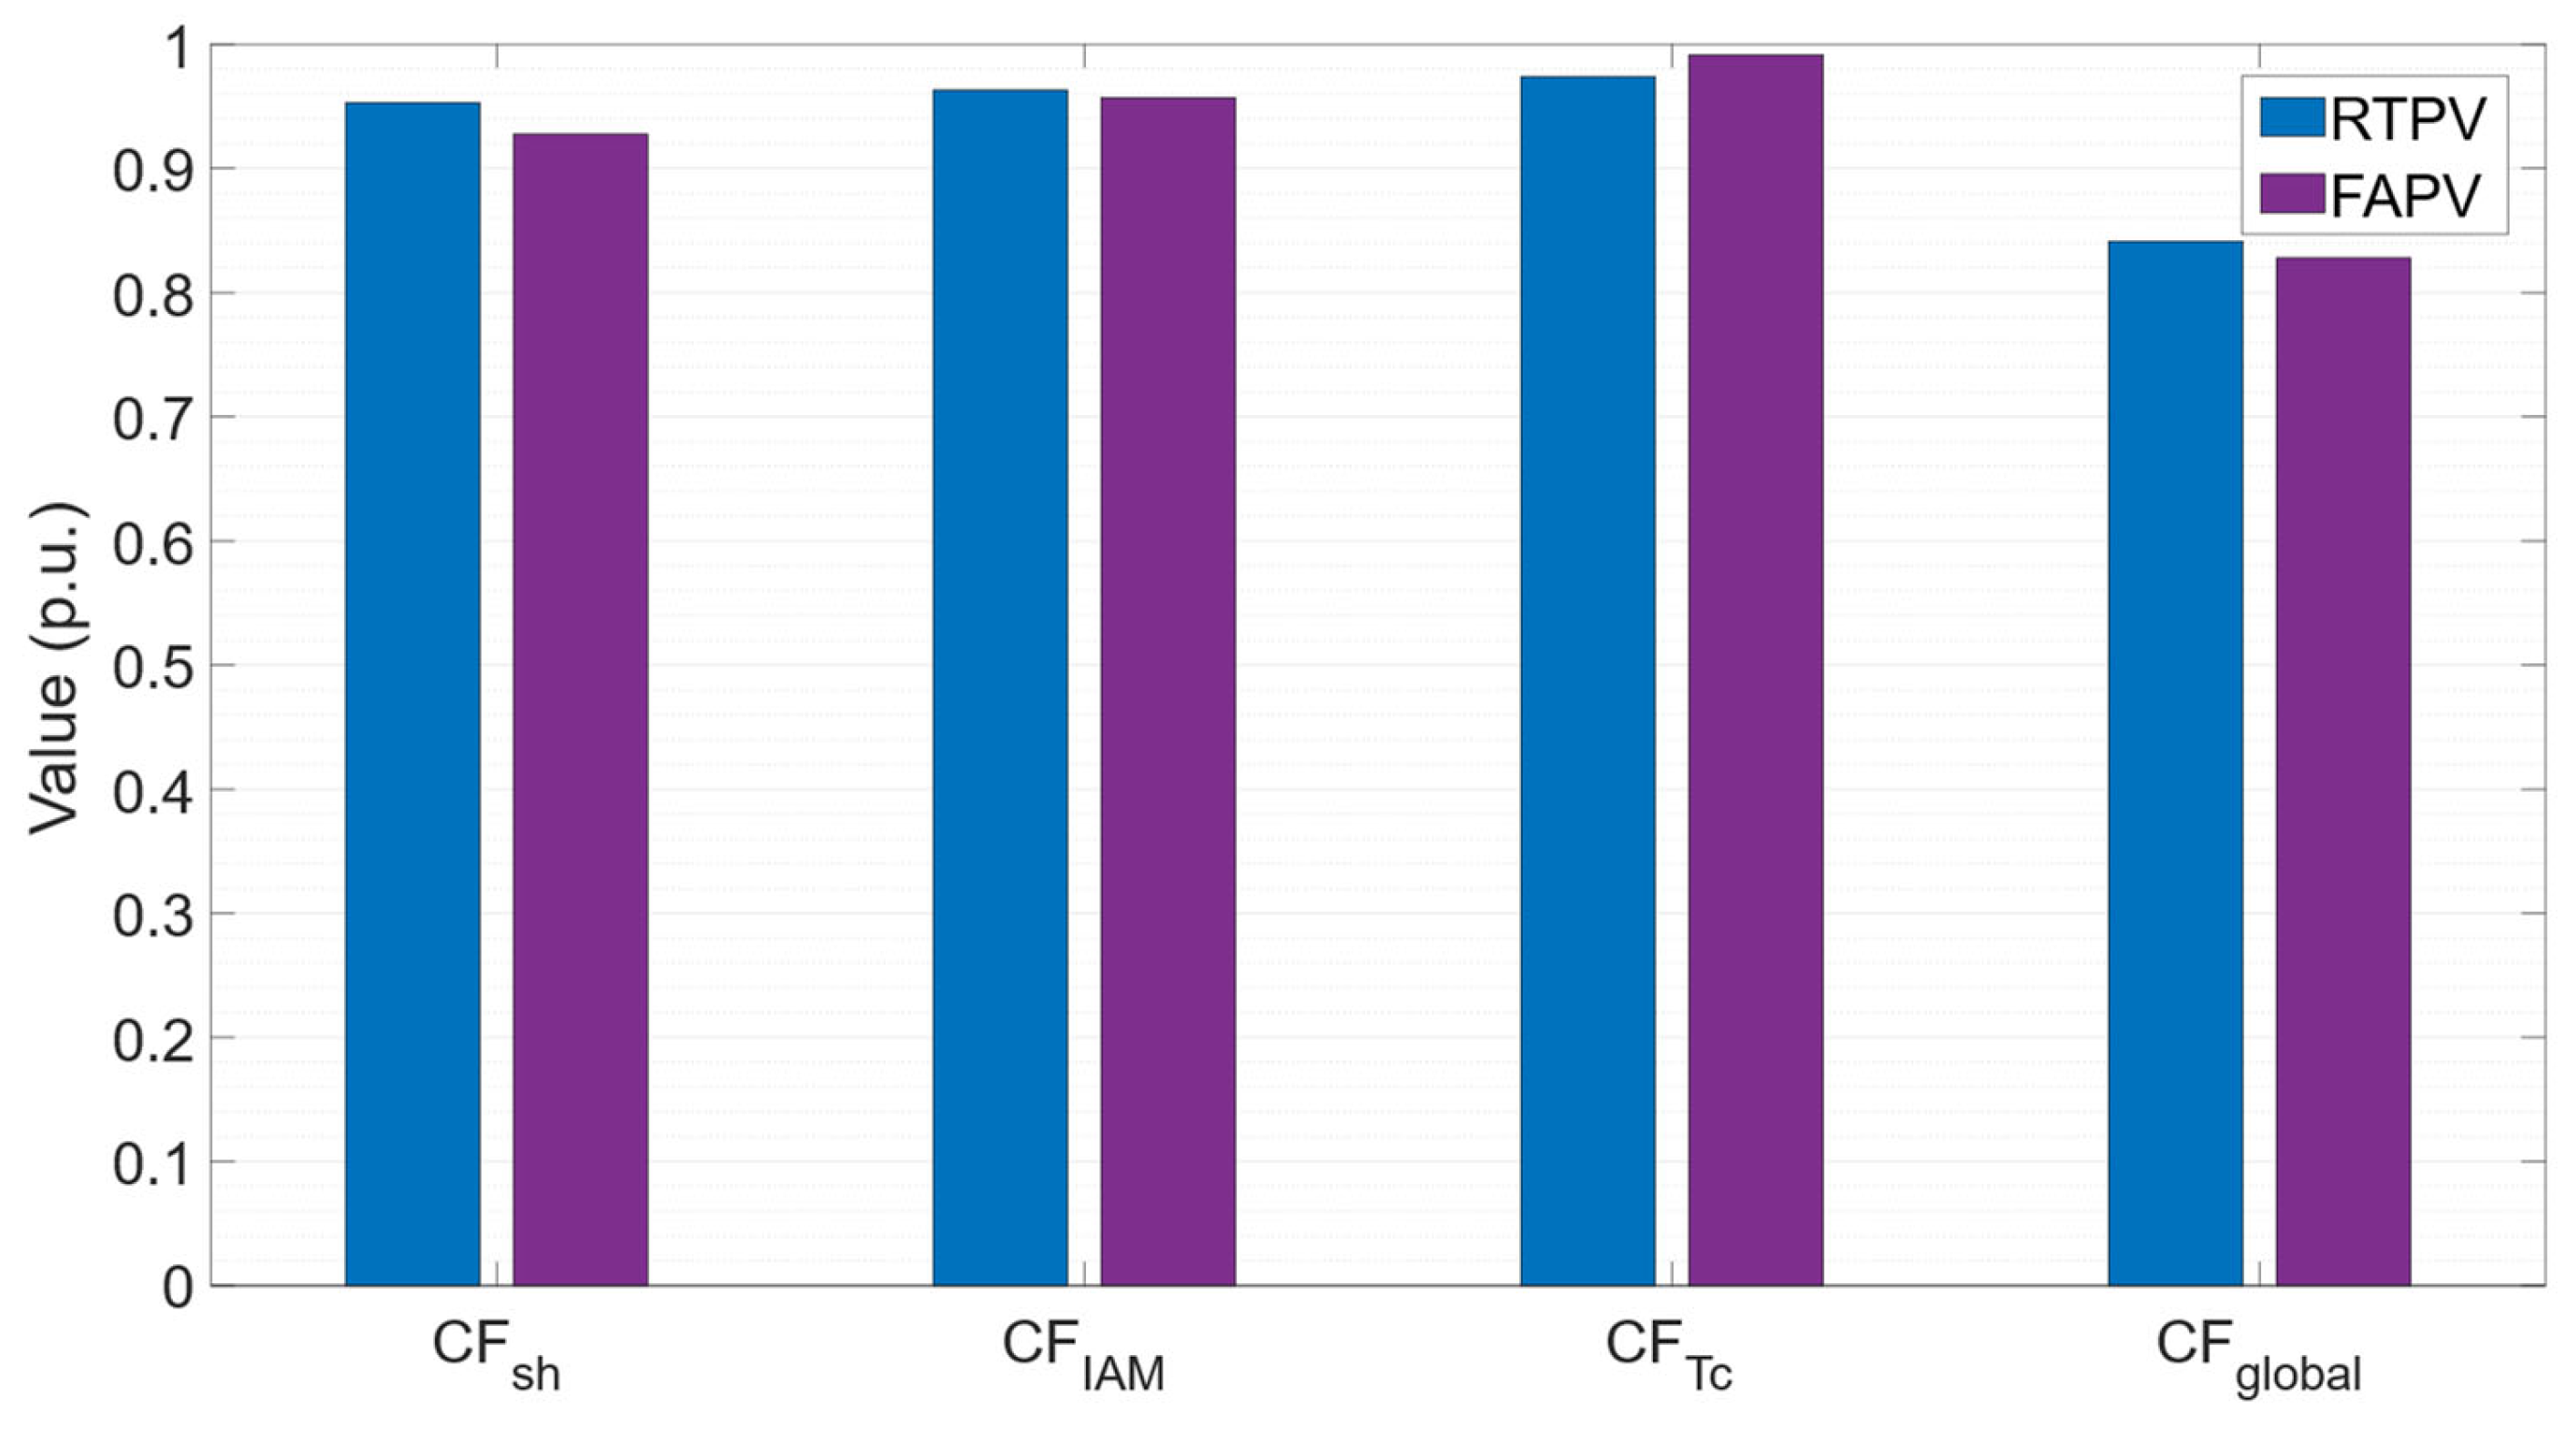
To identify the main causes of losses in both designs, correction factors were obtained, as shown in
Figure 11. Shading and incidence angle losses were 55% and 17% higher in the facade system compared to the rooftop system, respectively, which highlights the facade system’s greater susceptibility to these types of losses.
Previous studies indicate that shading losses caused by architectural elements of the building and its surroundings are typically 5% to 6% [
34,
43]. A 10% loss is commonly used as a threshold in PV system design [
46]. In this study, the shading correction factors for both PV designs are above 92%, indicating that the losses are contained and consistent with previous results.
The data indicate that the cell temperature correction factor is 2% higher for the facade system compared to the rooftop system. This translates to 66% lower losses for the facade design compared to the conventional one. This difference is attributed to two factors: the lower ambient temperature in the morning, when the generation of the southeast-oriented FAPV peaks, and lower radiation incidence on the FAPV compared to the RTPV, which leads to lower cell temperatures and, consequently, reduced losses. Globally, considering wiring, mismatch, and soiling losses, the correction coefficient is 84.1% for the RTPV system and 82.8% for the FAPV system, indicating comparable performance between the two distributions. These values, representing losses of 16% and 17%, respectively, are close to the 18–20% range obtained in other studies [
24,
34].
To evaluate the energy performance of the installation, the reference yield, PV array yield, final yield, capture losses, BOS losses, and performance ratio parameters were calculated, as specified in the IEC 61724-1 standard.
Figure 12 illustrates the annual values obtained for these metrics in both PV configurations. The data demonstrate that the RTPV system generates more PV energy per unit of installed power compared to the FAPV system, with increases of 67% in
, 73% in
, and 71% in
. These results are due to the optimized orientation and inclination of the RTPV modules for maximizing received irradiance, while the FAPV system aims to adapt to the available space.
Consistent with the higher PV generation, the RTPV system also exhibits 7% higher capture losses and 92% higher BOS losses than the FAPV system. This difference arises because the FAPV system excels in
(resulting in lower
) but performs less favorably in
and
(resulting in higher
) compared to the RTPV design. Consequently, the PR of RTPV is higher than that of FAPV (82% vs. 80%), but both systems achieve acceptable PR values within the 74% to 90% range reported in previous studies [
71].
While the RTPV system exhibits better performance per unit of installed power, the FAPV system holds greater potential due to its larger available surface area.
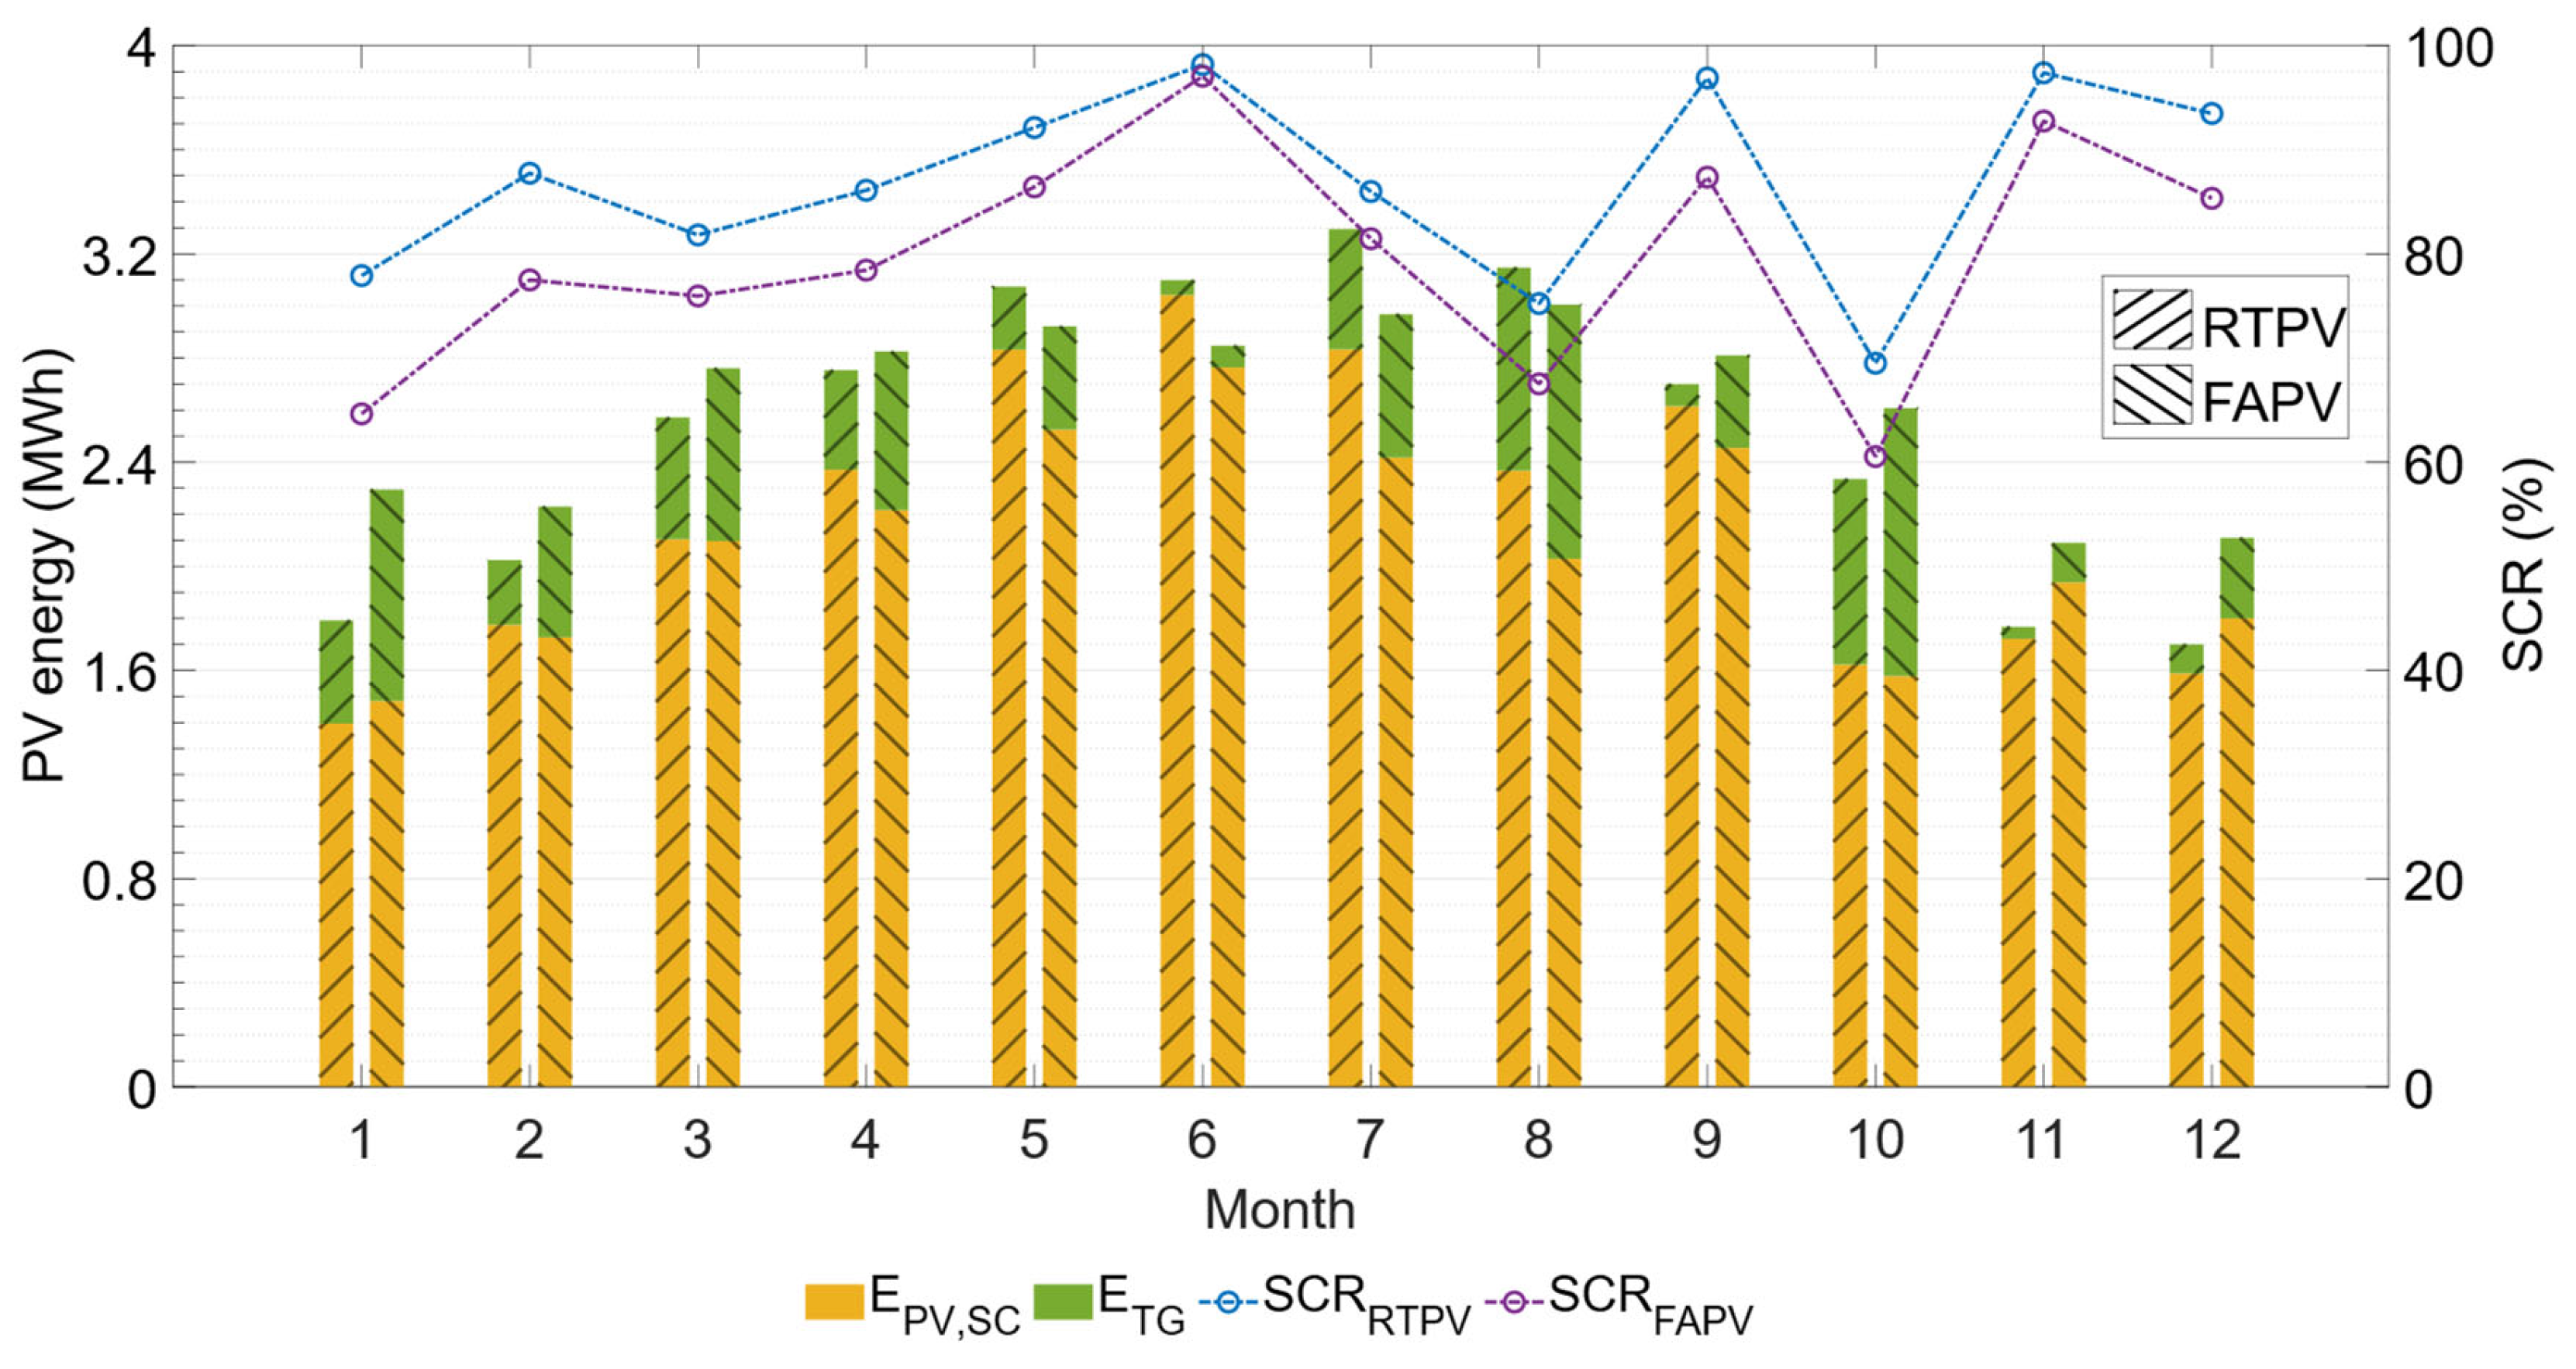
Figure 13 displays the monthly generation and self-consumption ratios for both rooftop and facade PV systems. The PV generation of the FAPV system surpasses that of the RTPV system during autumn and winter months, resulting in annual values of 31.5 MWh compared to 30.3 MWh for the RTPV system. This is because, during autumn and winter months, when solar elevation is lower, the vertical orientation of the FAPV modules allows for more perpendicular incidence of solar radiation. However, despite generating less energy, the RTPV system achieves self-consumption of 26.3 MWh compared to 25 MWh for the facade system.
These results demonstrate that, for this building, the RTPV system’s generation curve aligns better with its consumption curve than that of the FAPV system. This effect is observed in
Figure 13, where the self-consumption ratio is, on average, 7% higher throughout the year for the RTPV design compared to the FAPV design. The photovoltaic generation of the FAPV system varies less throughout the year compared to the RTPV system, producing more energy in autumn and winter months and less in spring and summer months. This effect is beneficial because a more consistent PV generation profile throughout the year simplifies the planning and sizing of distribution network systems. The SCR values for RTPV (87%) and FAPV (79%) are higher than those reported in the literature for these systems (30% and 46%, respectively). This result is due to the sizing criterion applied in this study, which aims to balance maximizing self-sufficiency with minimizing PV energy surpluses.
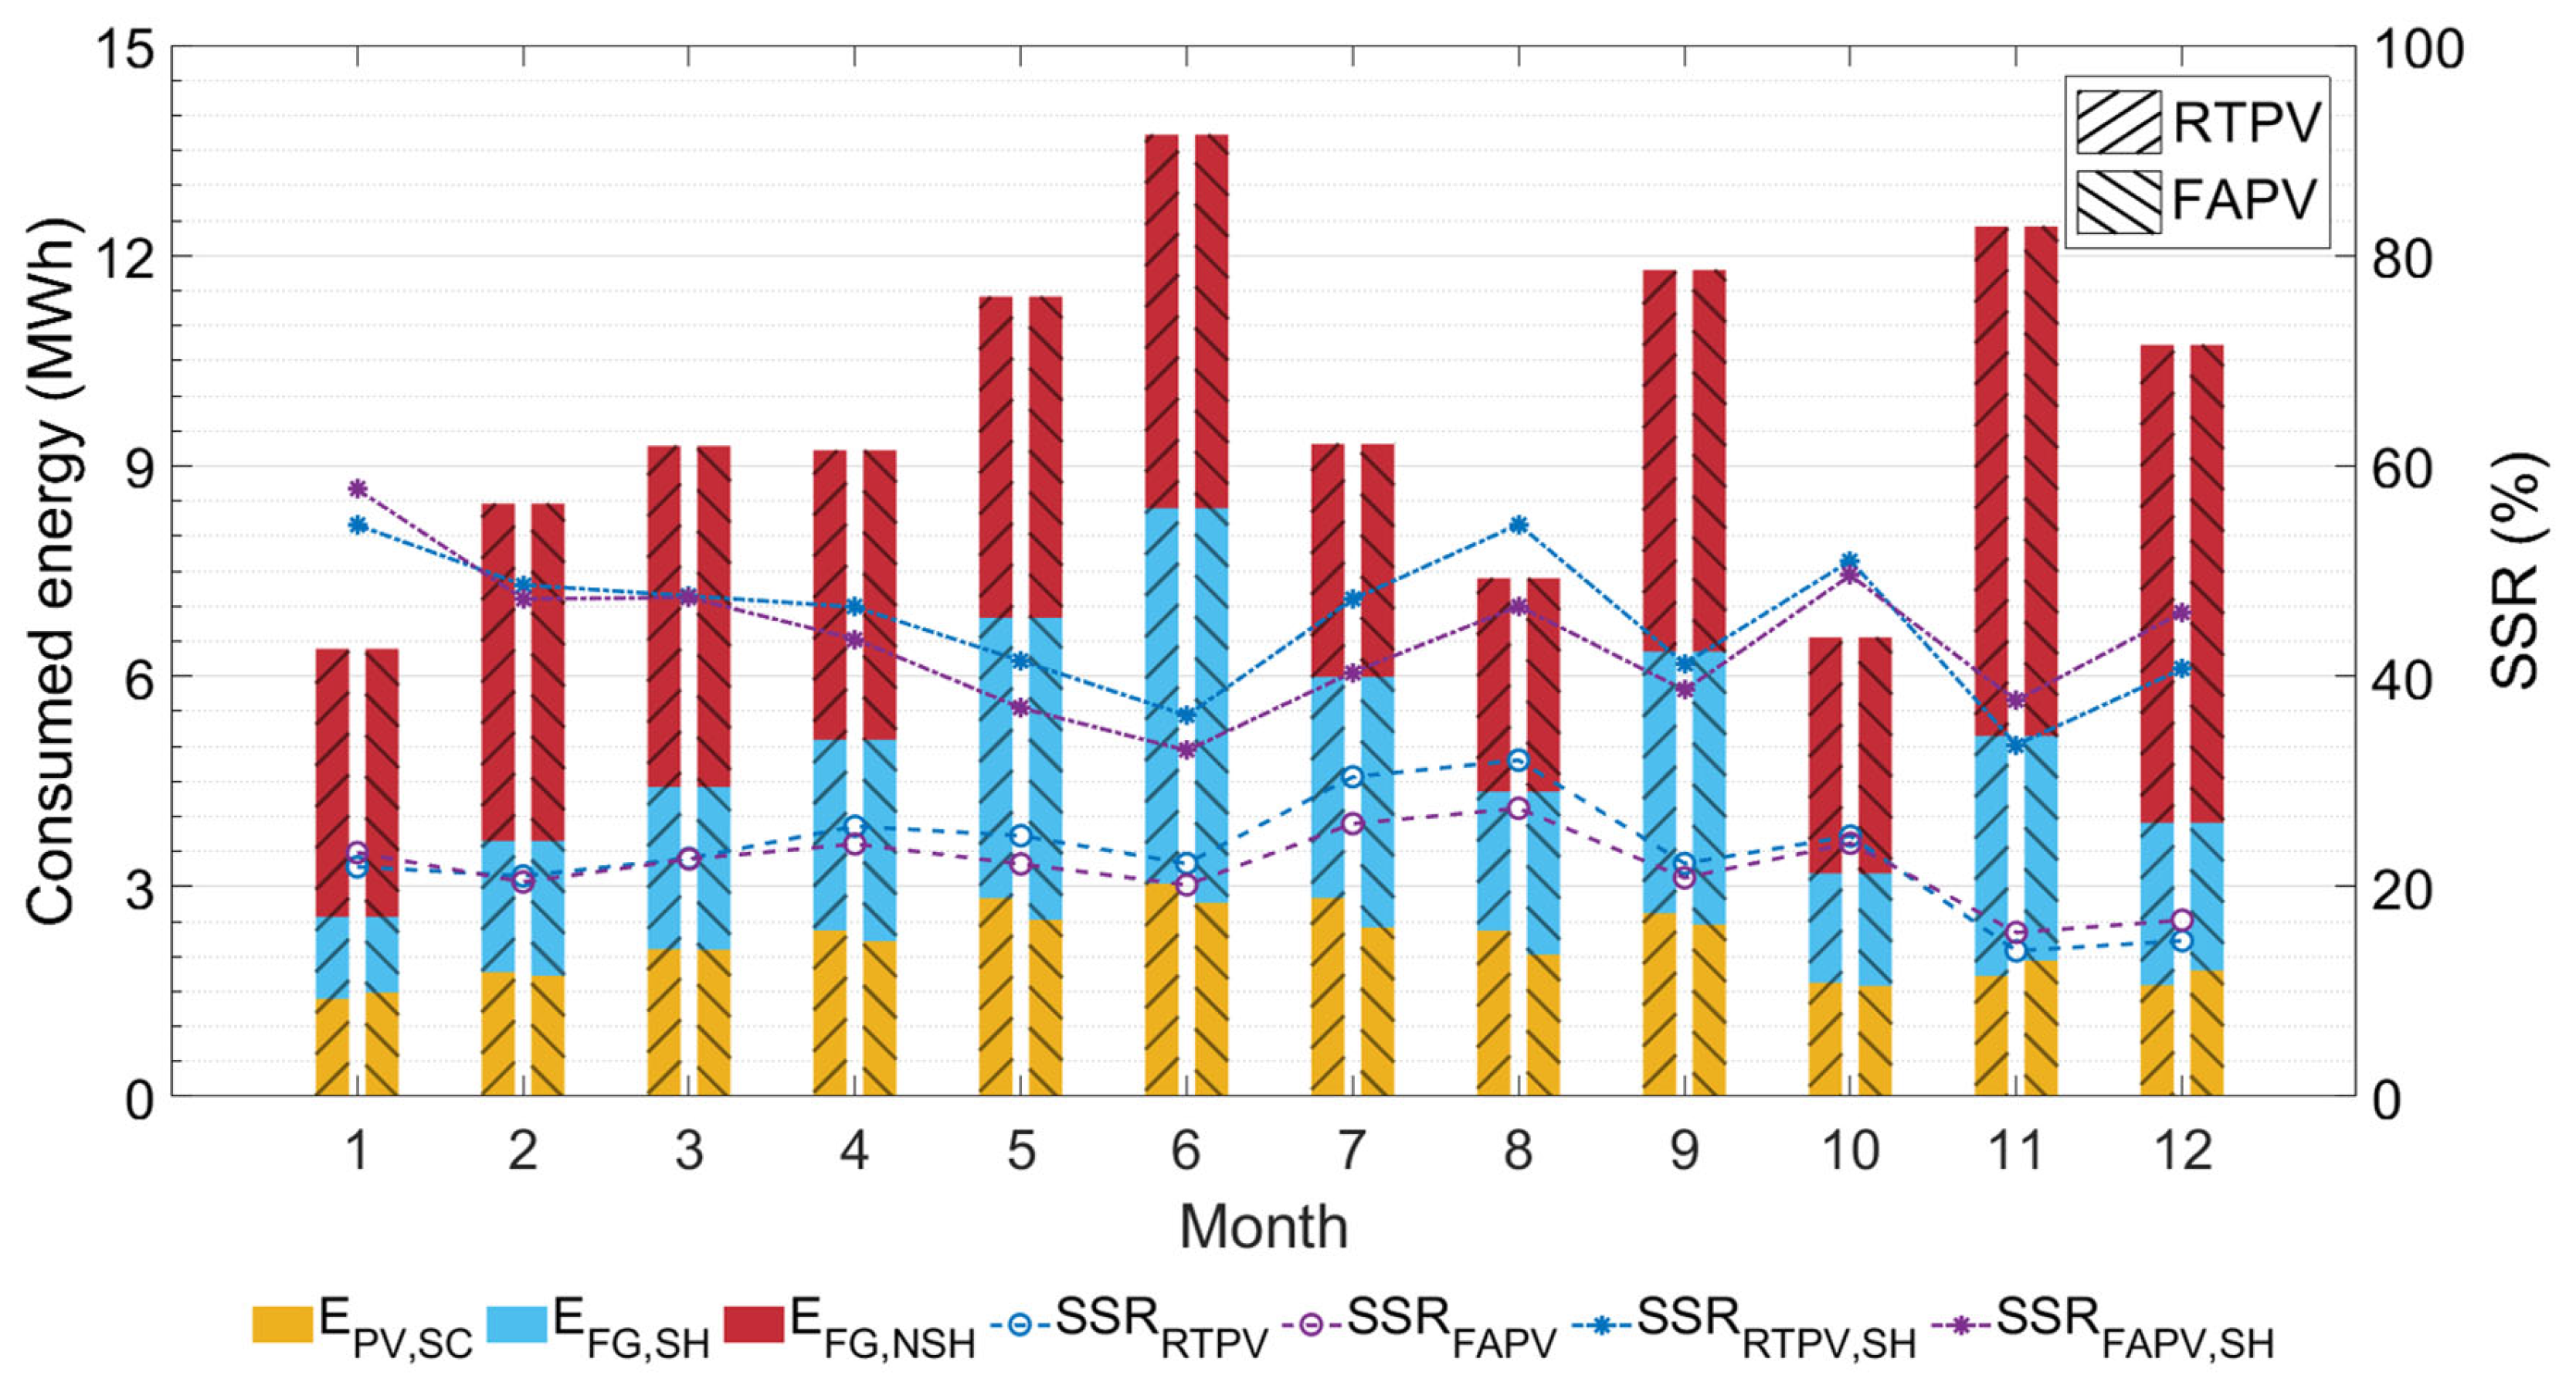
The monthly energy consumed by the building is presented in
Figure 14, disaggregated into self-consumed PV energy and energy imported from the grid during solar and non-solar hours. SSR ranges from 14% to 32% for RTPV and 16% to 27% for FAPV. From November to January, the FAPV system achieves an SSR that is, on average, 2% higher, while for the rest of the year, the RTPV system shows a 2% higher SSR compared to FAPV.
These results show that FAPV and RTPV systems offer self-sufficiency values (21% vs. 22%, respectively) slightly lower than those reported in the literature for FAPV (13–36%) and RTPV (24–38%) [
22]. Considering only the energy consumed during the day, the self-sufficiency during solar hours averages 44% for RTPV and 42% for FAPV, indicating that both systems are capable of covering almost half of the energy demanded during the day.
The Levelized Cost of Energy (LCOE) for both systems was calculated using the economic parameters for commercial PV systems recommended by NREL [
72], which are presented in
Table A1 of the
Appendix A. The RTPV system achieved an LCOE of 88.2 EUR/MWh, compared to 138.7 EUR/MWh for the FAPV system. This 36% difference is attributed to the lower energy generation per unit of installed power of the FAPV system compared to the RTPV, which reduces the return on investment.
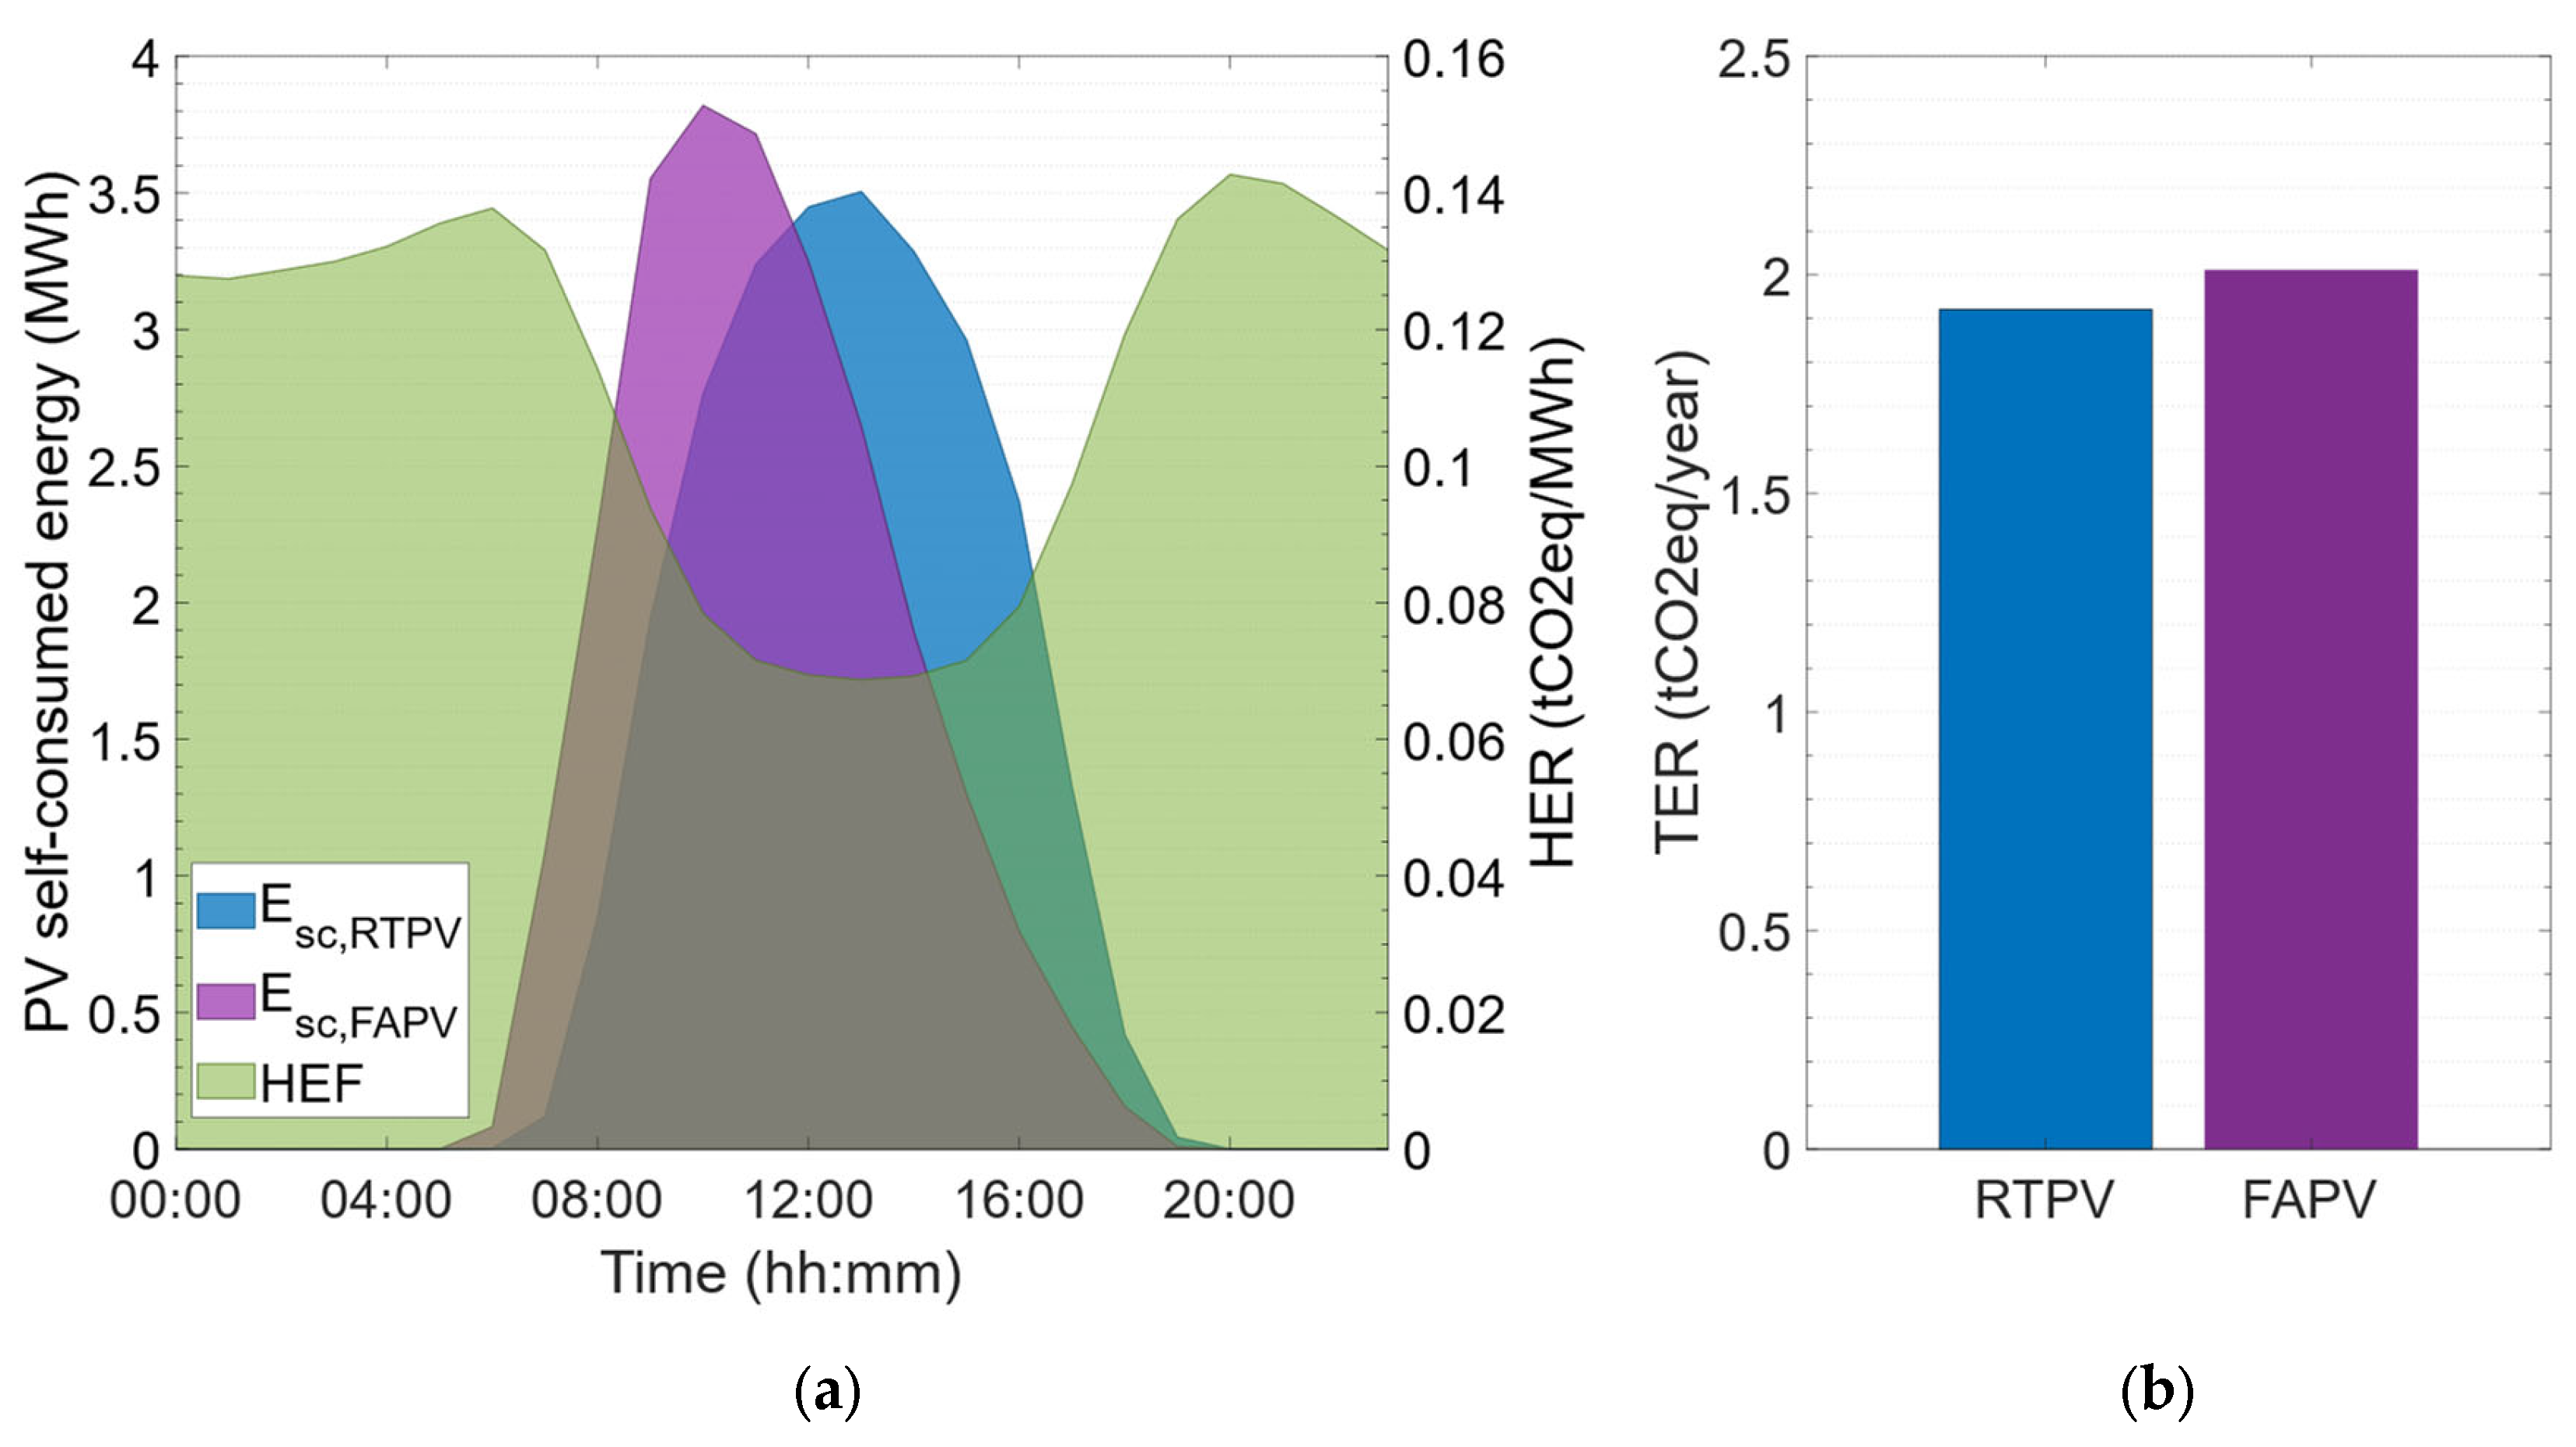
Figure 15 displays the hourly profile of self-consumed energy for both PV designs, the annual average profile of the hourly emission factor and the total annual CO
2 emissions reduction. The average hourly generation profile of the FAPV system shows a higher self-consumed energy peak, which is shifted 3 h earlier than the RTPV system’s energy peak. This aligns with its east–southeast orientation, which maximizes solar radiation incidence in the early hours of the day. On the other hand, the RTPV system generates a typical bell-shaped curve for optimally oriented systems, which is perfectly synchronized with the hourly emission factor: when the RTPV system generation is at its maximum, the HEF value is minimal due to the significant contribution of solar PV energy to the energy mix. As solar generation decreases, the HEF increases, reaching its maximum values during the initial and final solar hours.
The results demonstrate that the total emissions reduction is 5% higher for the FAPV system compared to the RTPV. This is because the FAPV system, despite producing 5.2% less self-consumed PV energy, does so during hours with a higher average emission factor than the RTPV system (80 vs. 73 kgCO2eq/MWh). This result demonstrates that PV systems with non-optimal orientations are becoming increasingly interesting, as they can reduce their contribution to the duck curve and avoid higher CO
2 emissions by providing generation curves that do not coincide with the peak generation hours of conventional PV systems. The total GHG reduction per kW installed for RTPV (107 kgCO2eq/kWp) and FAPV (63 kgCO2eq/kWp) is lower than that obtained in [
22] (451 and 281 kgCO2eq/kWp, respectively). This is due to the HEF of the German grid in 2023 having a median of 450 kgCO2eq/MWh compared to 100 kgCO2eq/MWh of the Spanish grid in 2024, leading to a lower impact on GHG emissions reduction from PV systems.
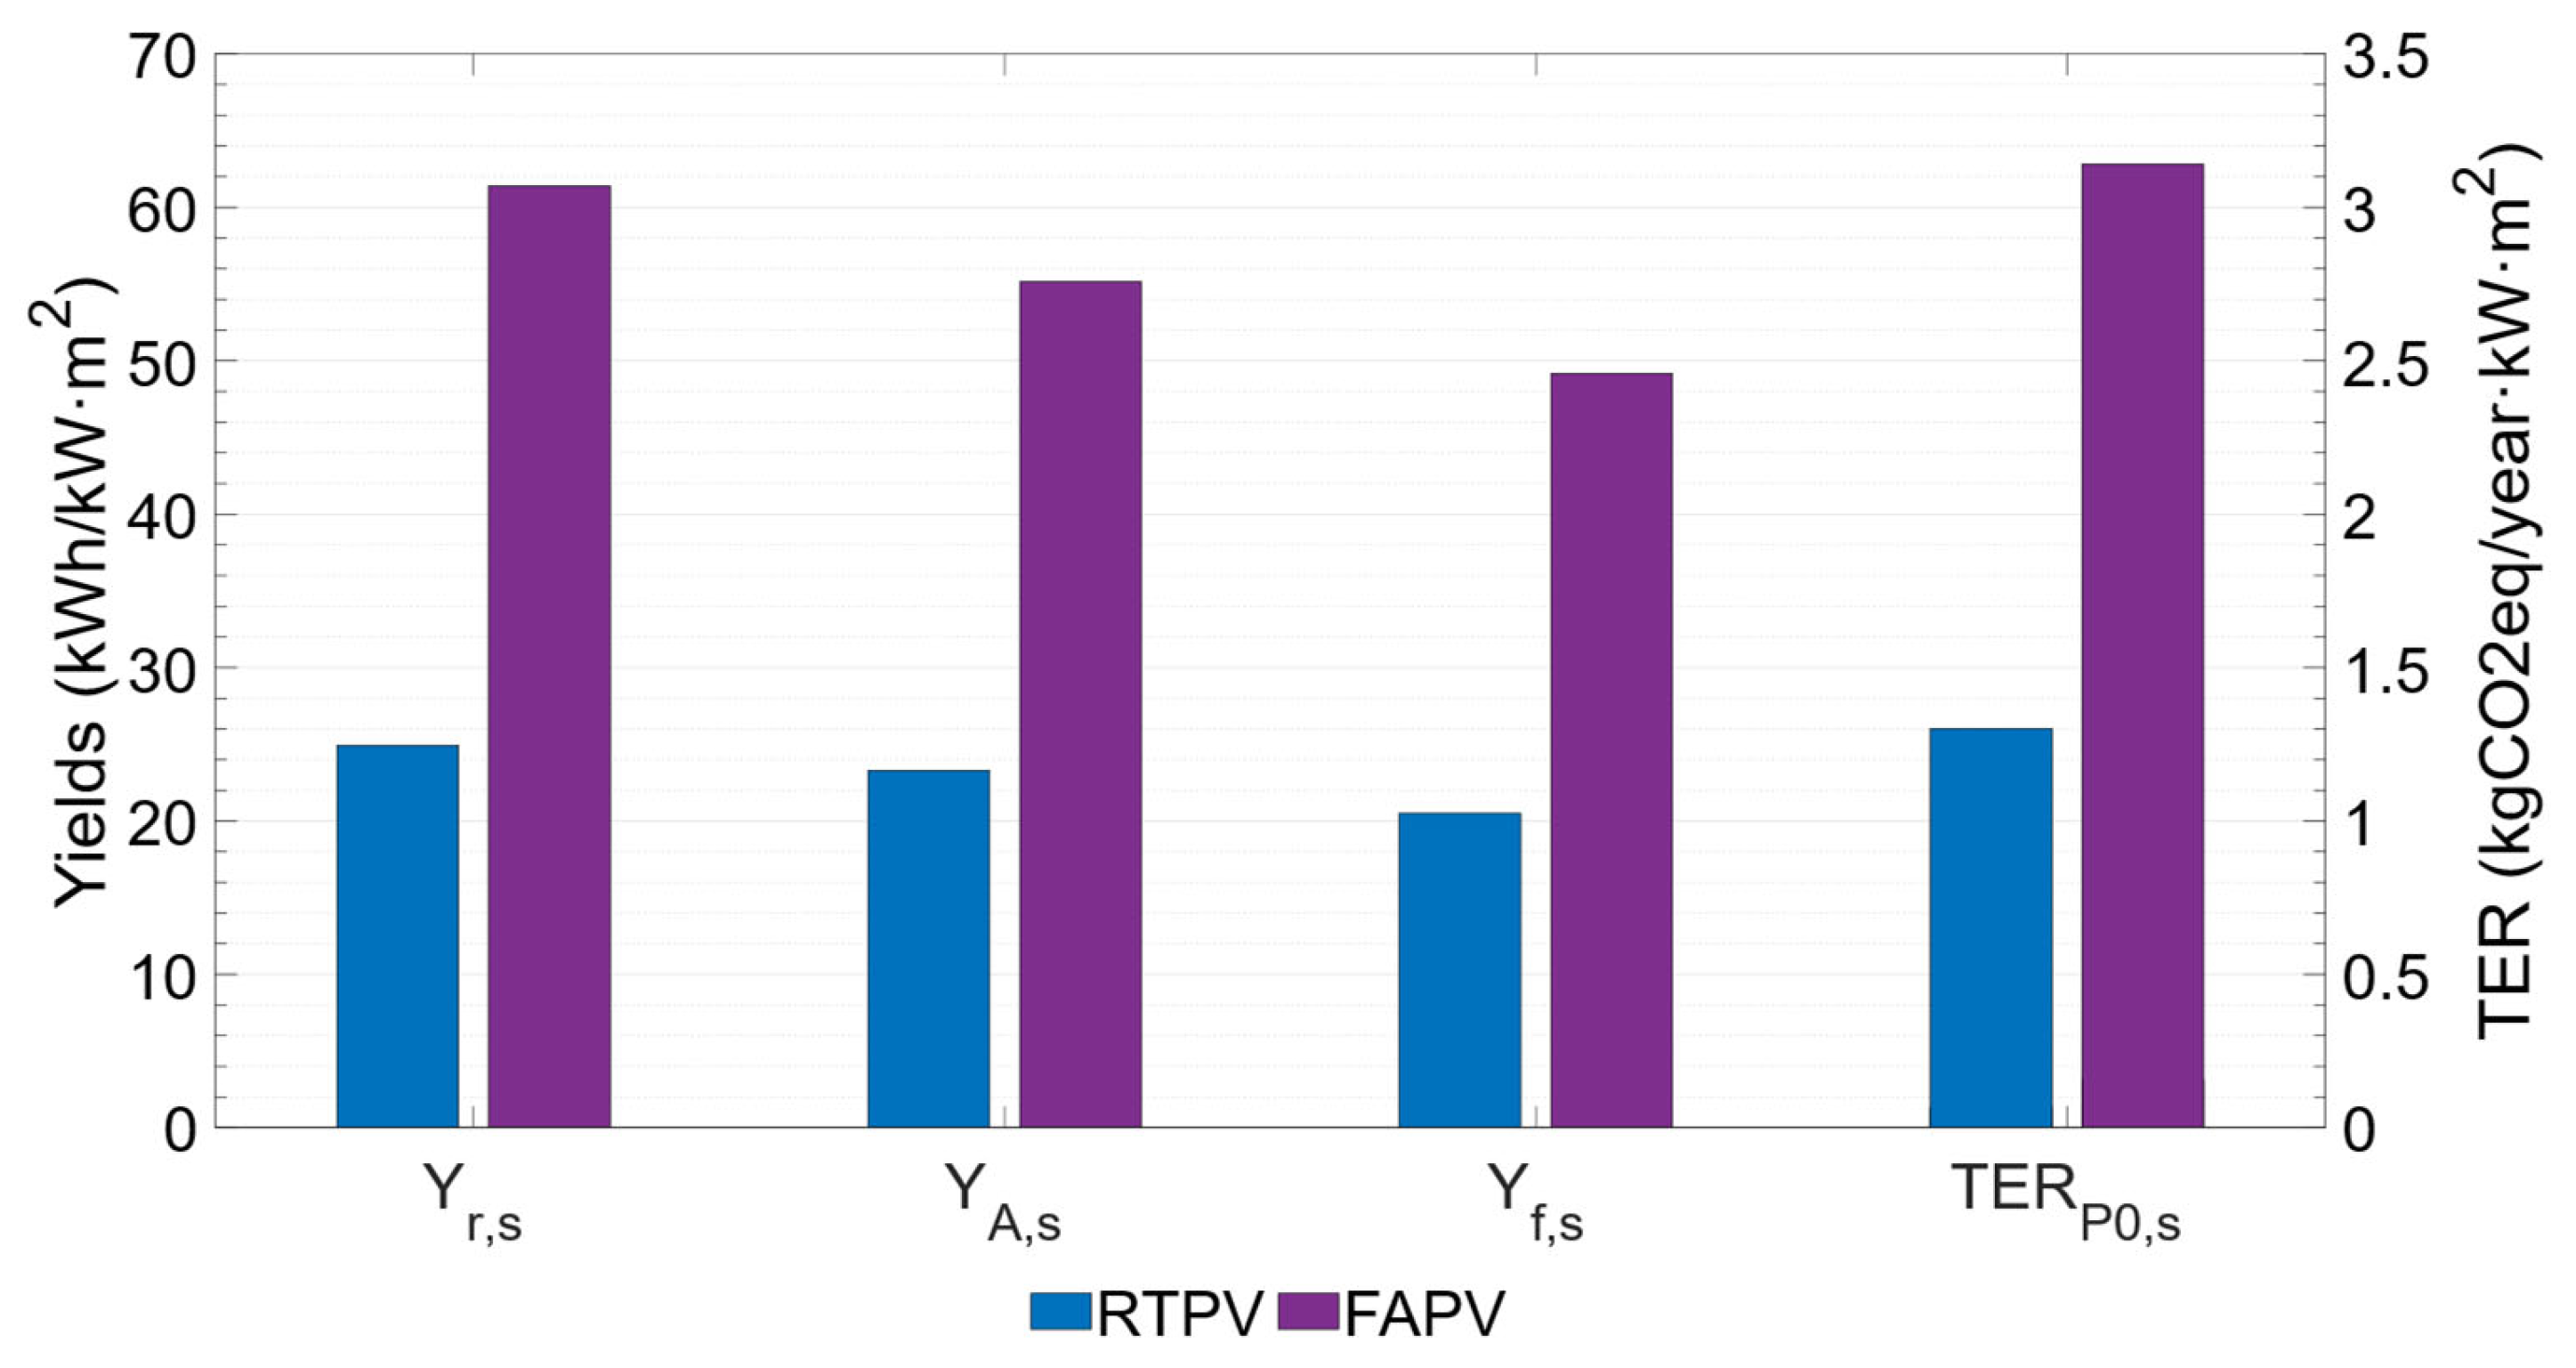
To assess the utilization of available land, which is scarce in cities, the reference yield, PV array yield, final yield, and TER parameters obtained by RTPV and FAPV systems per unit of occupied surface area were calculated, with their results shown in
Figure 16. FAPV outperforms RTPV in reference yield (61 vs. 25 kWh/kWp·m
2), array yield (55 vs. 23 kWh/kWp·m
2), final yield (49 vs. 21 kWh/kWp·m
2) and TER (3.1 vs. 1.3 kgCO2eq/kWp·m
2).
The data prove that the facade PV system achieves yields between 2.3 and 2.5 times higher than the RTPV system per unit of installed capacity and ground footprint, thus demonstrating its potential in buildings with limited available surface area for the installation of self-consumption PV systems. These indices are applicable to other types of BIPV–BAPV systems, such as those integrated into curtain walls, windows, and sunshades, and allow for performance comparison among them by referencing the ground footprint, which is a critical parameter in building-integrated self-consumption PV installations.
5. Conclusions
The increasing energy demand and the urgent need to decarbonize the global electricity sector drive the search for innovative renewable solutions, with solar photovoltaics emerging as a fundamental pillar. However, the integration of PV systems in urban environments presents inherent challenges, such as limited rooftop space availability and reduced savings due to falling energy prices, which decrease the profitability of conventional installations. In this context, BIPV and BAPV systems, particularly facade-applied PV, represent a strategic solution by leveraging unconventional surfaces and contributing to urban energy self-sufficiency.
This research addresses these limitations by proposing a versatile methodology that incorporates 3D modeling to account for shading and incidence angle losses. Design criteria, such as a PR above 70%, facilitate the identification of PV configurations that maximize self-sufficiency and urban space utilization. Our main contribution lies in introducing new complementary metrics: reference yield per unit area, array yield per unit area, final yield per unit area, and an emissions reduction index based on installed capacity and occupied area. These metrics extend beyond conventional energy and environmental parameters, offering a more nuanced evaluation of energy generation density and the spatial efficiency of BIPV–BAPV configurations.
The results of this study, obtained for a university building in southern Spain, demonstrate the significant potential of FAPV installations in buildings with irregular topologies. The self-sufficiency (21%) and self-consumption (79%) of FAPV systems achieve similar values to RTPV systems (22% and 87%, respectively). Additionally, the environmental impact assessment using the HEF, which considers the variability of grid emissions, shows that the FAPV system achieves a 5% higher GHG emissions reduction than the RTPV system, despite consuming 5.2% less PV energy. The proposed metrics in this article demonstrate that the FAPV system obtains final yields and a TER 2.4 times higher than the RTPV configuration per kWp and square meter, thus highlighting its effective contribution to the decarbonization of the built sector. While this methodology offers a robust framework for designing and comparing PV systems in buildings, it lacks the explicit integration of economic variables and aesthetic considerations within the proposed metrics. These aspects are proposed as potential future research directions.
