Article

Thermal Comfort and Energy Consumption in a Residential Building: An Experimental Comparison Between a Heat Pump and Gas Boiler Employing Low-Cost Microcontroller-Driven Sensors

by
Vincenzo Ballerini
1,
Eugenia Rossi di Schio
1,*,
Tawfiq Chekifi
2 and
Paolo Valdiserri
1
1
Department of Industrial Engineering (DIN), Alma Mater Studiorum—University of Bologna, Viale Risorgimento 2, 40136 Bologna, Italy
2
Unité de Recherche Appliqué en Energies Renouvelables, URAER, Centre de Développement des Energies Renouvelables, CDER, Ghardaïa 47133, Algeria
*
Author to whom correspondence should be addressed.
Energies 2025, 18(16), 4398; https://doi.org/10.3390/en18164398
Submission received: 2 July 2025 / Revised: 10 August 2025 / Accepted: 15 August 2025 / Published: 18 August 2025
(This article belongs to the Section G: Energy and Buildings)

Abstract

Many buildings in Southern European countries are equipped with both gas boilers and air source heat pumps. The present work concerns an experimental evaluation of indoor comfort in an apartment within a residential building, comparing a gas boiler with cast-iron radiators to an air-to-air heat pump. The comfort conditions inside the apartment are assessed at set-point temperatures of 20 °C and 21 °C and with different water supply temperatures from the gas boiler. Energy consumption data for both heating systems are recorded during the tests. The measurements inside the apartment are conducted using inexpensive, widely accessible sensors and Arduino-like microcontrollers, calibrated before use. As a result, comfort indices for the heat pump are between those for the gas boiler at 20 °C and 21 °C. Additionally, to understand the impact of occupancy, an analysis of local discomfort and air quality was conducted by measuring CO2 levels, which rose significantly without air exchange. Lastly, the experimental results are compared with previous dynamic and Computational Fluid Dynamics (CFD) analyses, showing the limit of the computational approach. Indeed, the comfort indices derived from the experimental study are superior to those obtained from dynamic simulations and CFD.

1. Introduction

Heat pumps are considered a crucial technology for decarbonization and energy transition, and their spread in Europe and Italy, according to data from the EHPA [1], saw an annual increase of 38.9% and 35.2% in 2022 compared to the previous year. The rise in demand can be attributed to various factors, such as the imperative to transition towards renewable sources, their versatility across diverse climates, and the economic advantages stemming from economies of scale: the surge in unit sales contributes to a cost reduction effect. Indeed, heat pumps can operate even in harsh climates with temperatures of −25 °C and efficiently provide water at 65 °C [2]. In Italy, the main types installed are air-to-air and air-to-water heat pumps.
In the literature, attention has also been paid to control strategies related to heat pumps, and a review is presented in [3] focusing on temperature set-points (also concerning the mean radiant temperature) or on the power of the heat pump. The subject of control strategies in HVAC systems has been widely investigated [4,5]. Recent papers validate the control strategies with experimental measurements. In [6,7], occupancy sensors are employed to demonstrate energy savings when an occupancy-based control is performed, coupled with high costs for the occupancy sensors. Recently, Arduino-based microcontrollers have been used to control HVAC systems [8,9], pairing simplicity with cost-effectiveness. Pandey et al. [9] focus on a split conditioner, i.e., an air source heat pump used in cooling mode, while in [10], attention is paid to air quality.
Within the scientific literature, most analyses comparing heat pumps and boilers predominantly concentrate on either performance, efficiency, and environmental aspects [11,12,13] or economic considerations [14,15,16,17].
Also, thermal comfort is often a focal point in research due to its fundamental impact on human health, learning ability, and productivity [18]. In [19], Solano et al. discuss the role of thermal comfort in sustainable building evaluations. They apply Fanger’s method [20] and the adaptive comfort method, after gathering data for 112 days from a residential building. The findings reveal that activating the HVAC system satisfies over 80% of potential occupants with the indoor temperature for more than 90% of the time. In [21], Ma et al. explored personal thermal management (PTM) techniques to create a localized thermal envelope around occupants instead of cooling/heating the entire building space. This approach aims to reduce building energy consumption while maintaining thermal comfort for occupants. Moreover, in other studies [22,23], the authors analyzed thermal comfort prediction using instances based on transfer and machine learning methods. In the recent literature, the review by Yussuf & Asfour [24] focuses on applying artificial intelligence methods for reducing the thermal energy required by buildings. Specifically, the review categorizes the recent literature on AI-enabled energy monitoring and AI-enabled energy control. In [25], Boicu et al. optimize thermal comfort and energy efficiency in a room of a public building by applying a fuzzy logic method and considering two different thermal comfort models (Fanger’s model and the Van Zuilen model), using data acquired from a low-cost weather station. The study [26] examines building designs that enable effective air circulation without using mechanical systems. Furthermore, the effectiveness of the passive system of using solar energy with the Trombe wall as a ventilation device in modular houses has been experimentally confirmed. Regarding school air quality, a comprehensive analysis was discussed in [27]. To fill the gap in the literature, in our study, we evaluate various comfort indices at different points within a residential building, thus considering a more extensive dataset measured throughout the entire home and adding to the aspects related to thermal efficiency as well as those related to comfort.
Regarding comfort analyses, as far as the authors are concerned, the studies available in the literature focus on particular issues. For instance, Dong et al. [28] focus on the space heating of rural buildings, showing that ASHP combined with floor radiation heating is the best mode in cold areas of China. Moreover, in [29,30], attention is paid to hospital environments. Therefore, considering the analyses found in the literature, thermal comfort is a current key point to consider, especially in the design of new HVAC systems and in retrofitting existing systems.
The present paper investigates the implementation of a low-cost microcontroller system for determining the microclimate in closed environments. Utilizing an extensive dataset of experimental data relative to the residential building acquired through low-cost sensors, this study diverges from previous works by analyzing comfort by comparing two different heating systems. The microcontrollers and sensors are used to detect parameters that are useful for determining comfort conditions inside a small residential apartment (floor area of about 40 m2) located in the municipality of Bologna, in Northern Italy. Comfort parameters are analyzed during the heating season, alternating between the two different generators: the gas boiler coupled to cast-iron radiators and the air-to-air heat pump with a single indoor unit. The parameters useful for determining comfort and detected by the microcontrollers at intervals of about 1–2 min during the tests are air temperature, mean radiant temperature, and relative humidity. These data are also used to determine the index developed by Fanger [20], PMV (predicted mean vote), and PPD (predicted percentage of dissatisfied people). In addition, according to international standard ISO 7730 [31], the local discomfort due to vertical temperature difference is calculated as well. Finally, the analysis also focuses on determining the IAQ (indoor air quality) inside the residential apartment, measuring the CO2 concentration.
The analyses are conducted considering different heating system configurations and are carried out under various boundary conditions. Specifically, the studies are performed on different days of the heating season, characterized by different external temperatures, and some characteristics of the heating systems are varied, such as the supply water temperature from the boiler and the prescribed set-point temperature. The results are then compared with CFD and dynamic analyses presented by the authors in a previous study [32]. This comprehensive approach not only enhances the inclusivity of the study by integrating and corroborating with previous research but also provides a robust validation of the findings, bridging the gap between theoretical models and practical, real-world applications.

2. Materials and Methods

A set of sensors was placed within the apartment to determine the comfort and indoor air quality. Low-cost and easily available online sensors were used. The installed sensors included:
  • 10 kOhm negative temperature coefficients (NTC) at 25 °C with 1% accuracy [33];
  • Temperature and humidity sensors DHT11 and AHT10 [34,35];
  • CO2 sensor MHZ14A [36];
  • Voltage sensor ZMPT101B [37];
  • Current sensor ZMCT103C [38].
The readings from these sensors were taken by Wi-Fi microcontrollers based on ESP8266 [39]. Since the measurements were taken at various points in the house, the microcontrollers and sensors were assembled in different boxes, as shown in Figure 1a,b.
Before use, all the sensors were assembled and calibrated in the laboratory. To be precise, the NTC temperature sensors were calibrated using a thermostatic bath and a reference resistance temperature detector (RTD) connected to a Wheatstone bridge for resistance detection; the humidity sensors were calibrated in a climatic chamber (ARGOLab CH 250 [40]); the current and voltage sensor was calibrated employing as reference a power meter (Fluke 1735 three-phase power quality logger); and the CO2 sensor was calibrated using another commercial sensor (Sensirion SCD30 [41]), which is sold already calibrated by the manufacturer. According to the datasheet and calibration procedure, the uncertainties of the sensors are reported in Table 1.
These sensors allow for determining air temperature, relative humidity, CO2 concentration, and average radiant temperature. To obtain this last measure, some sensors were placed inside black spheres with a diameter of 0.15 m.
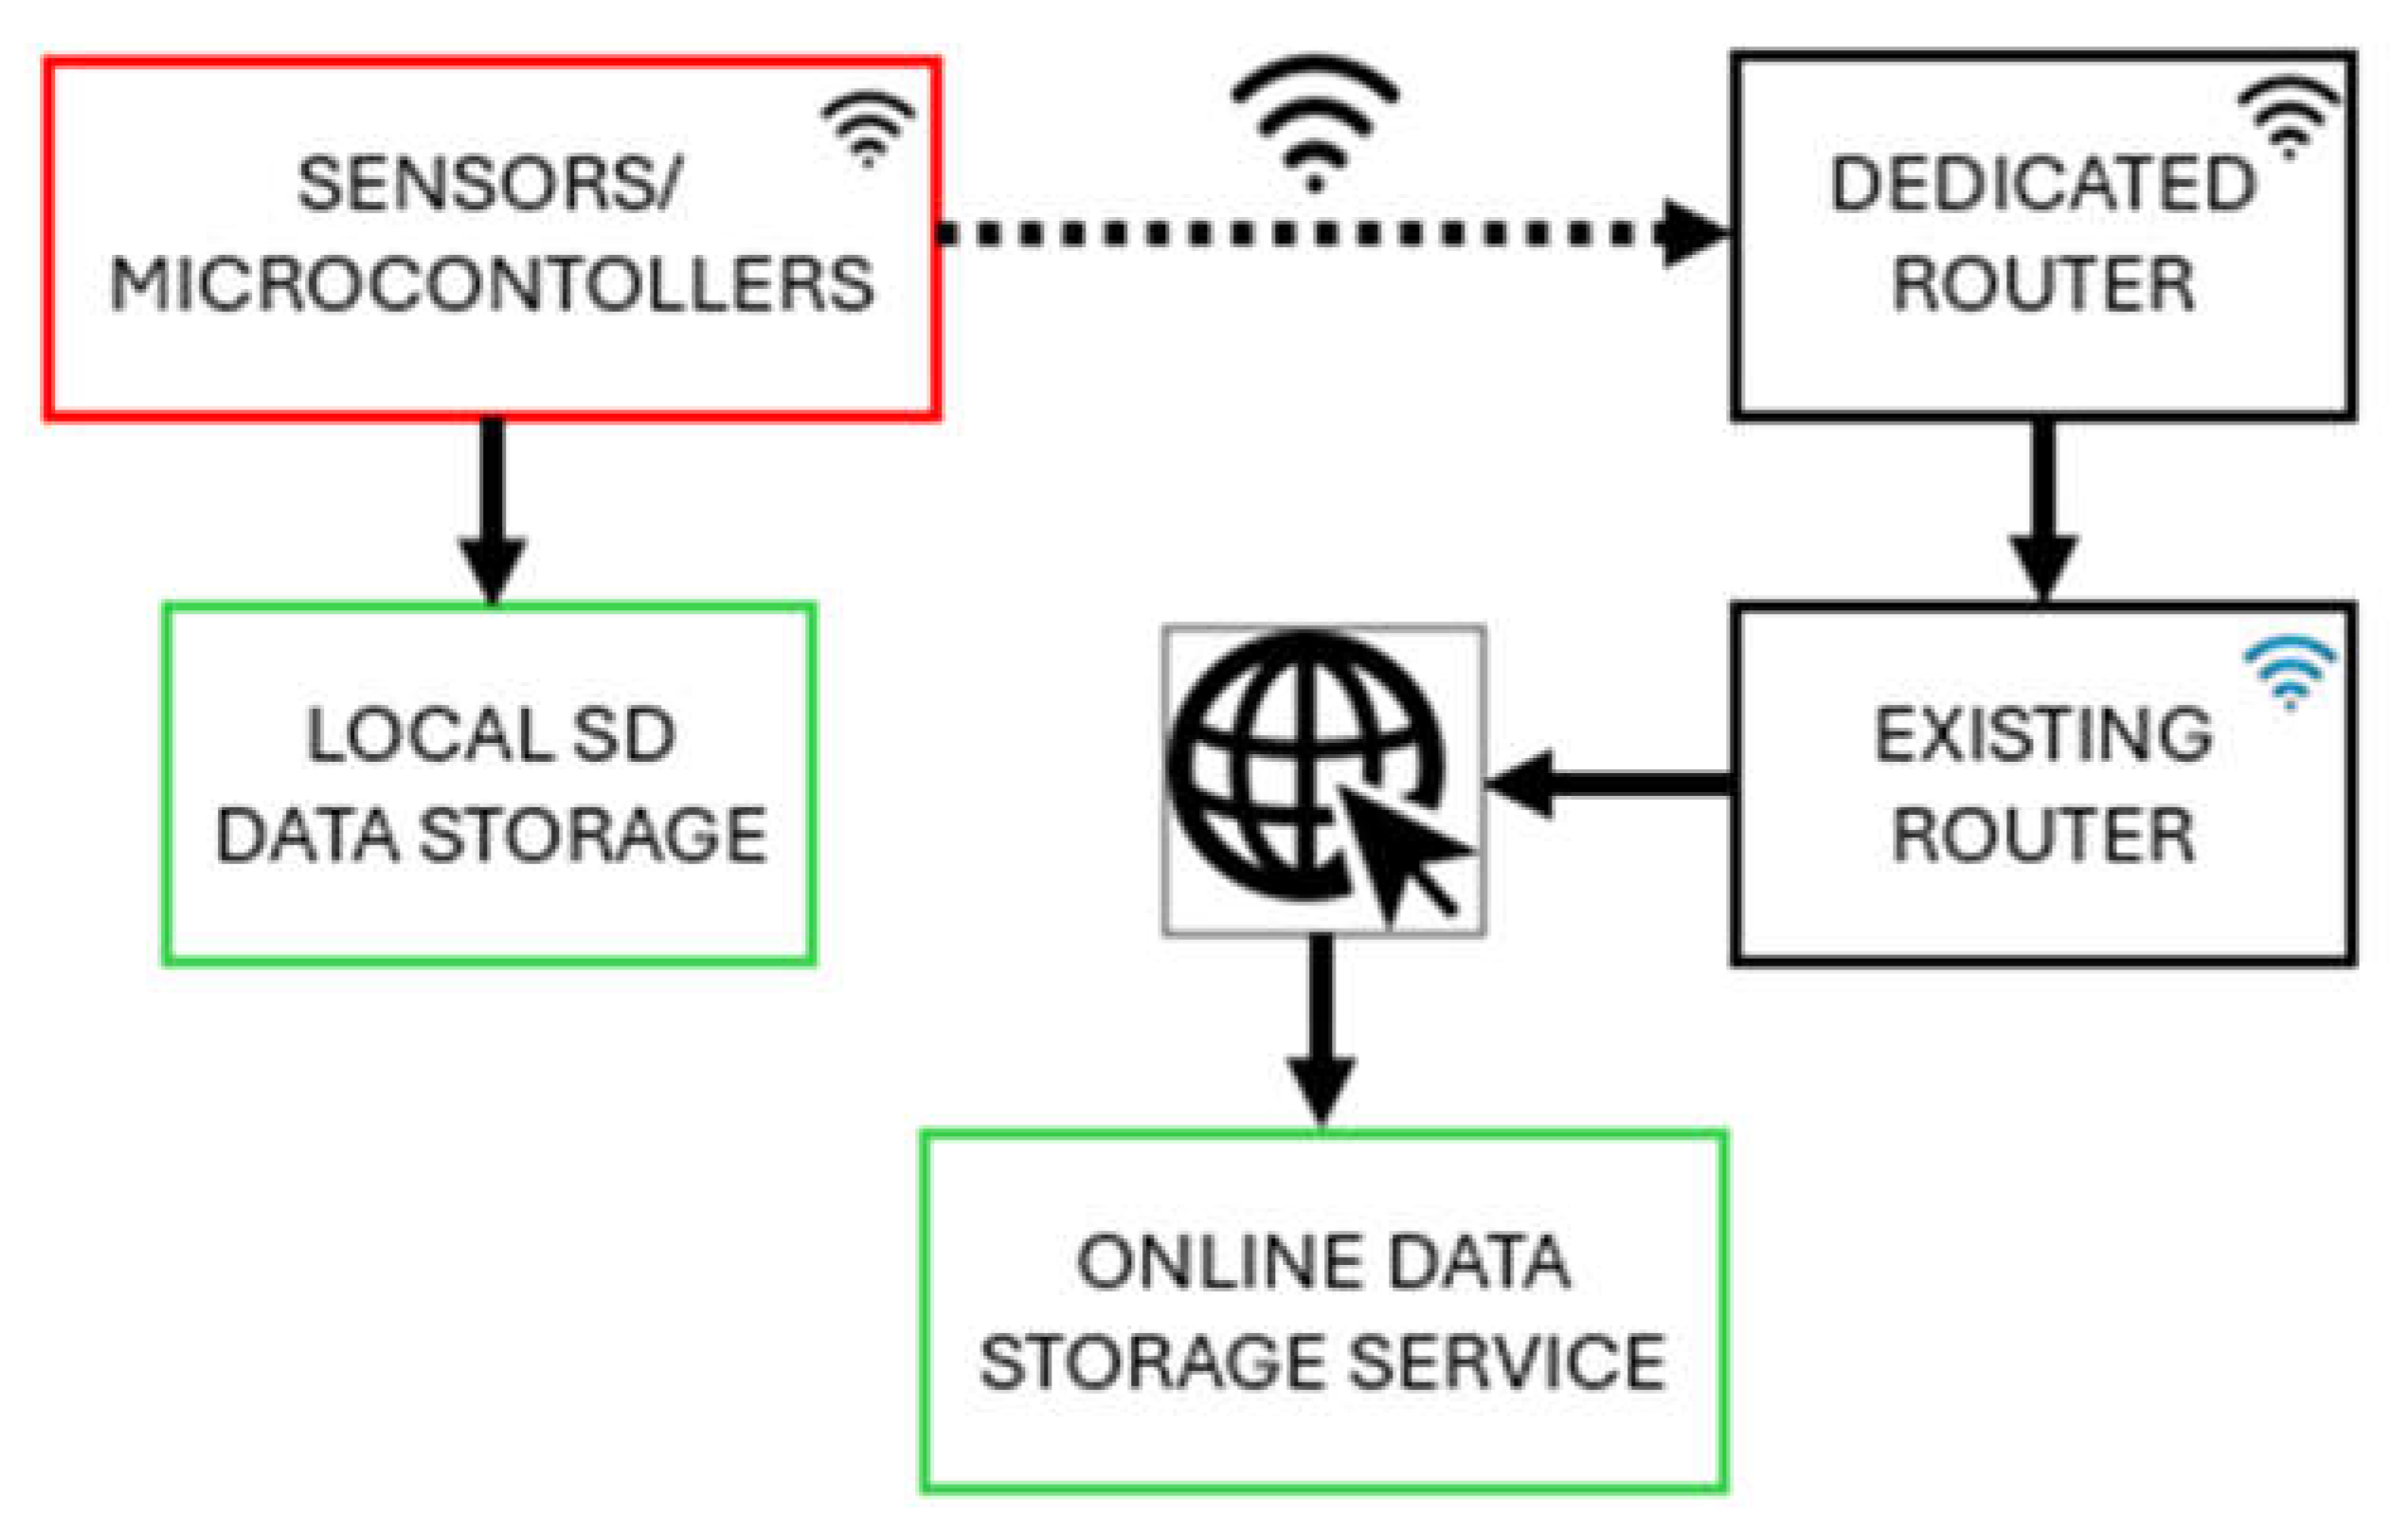
The data collected by the microcontrollers is saved locally on SD cards and sent to an online service (Google Sheet, [42]) at intervals ranging from 60 to 120 s. As shown in Figure 2, the microcontrollers are connected to a specially created Wi-Fi network using a router, which is connected to the existing local router via a wired connection.

3. Building and Heating System Characteristics

The building under investigation is a residential building located in a residential quarter of Bologna (lat. 44°29′38″, long. 11°20′34″), Northern Italy.
The apartment, whose plan and 3D view are shown in Figure 3a,b, is situated on the ground floor of a four-story condominium built in 1992. The apartment has an independent entrance, and the plan highlights the presence of three thermal zones: an unwindowed bathroom (7.0 m2 floor area), an entrance/living area (24.5 m2 area), and a bedroom (7.2 m2 floor area). The total floor area of the building is 38.7 m2, with a room height of 3.00 m, except for the entrance, where there is a false ceiling, resulting in a height of 2.70 m. The apartment is situated above garages, and above it there is another apartment (thus a heated thermal zone); it also has three external walls and one wall facing the unheated stairwell of the condominium.
The net heated volume is 112.4 m3 (the gross is 160.2 m3 (V)), and the gross dispersing surface, S (towards the outside and unheated rooms), is 140.5 m2, with an S/V ratio of 0.88. The characteristics of the main envelope elements are reported in Table 2. Table 2 shows that the building has poor insulation (in particular, the external walls have rock wool insulation of 0.04 m thickness). The window components (windows in the living room and bedroom, French door in the entrance) represent 14.4% of the area of the external vertical walls. Specifically, the entrance door is single-glazed with an aluminum frame (total window area of 2.43 m2 and total window transmittance estimated at 5.54 W/(m2K)). In comparison, the other two windows in the living room and bedroom are double-glazed with a transmittance of 1.69 W/(m2K) and areas of 5.94 m2 and 1.89 m2, respectively.
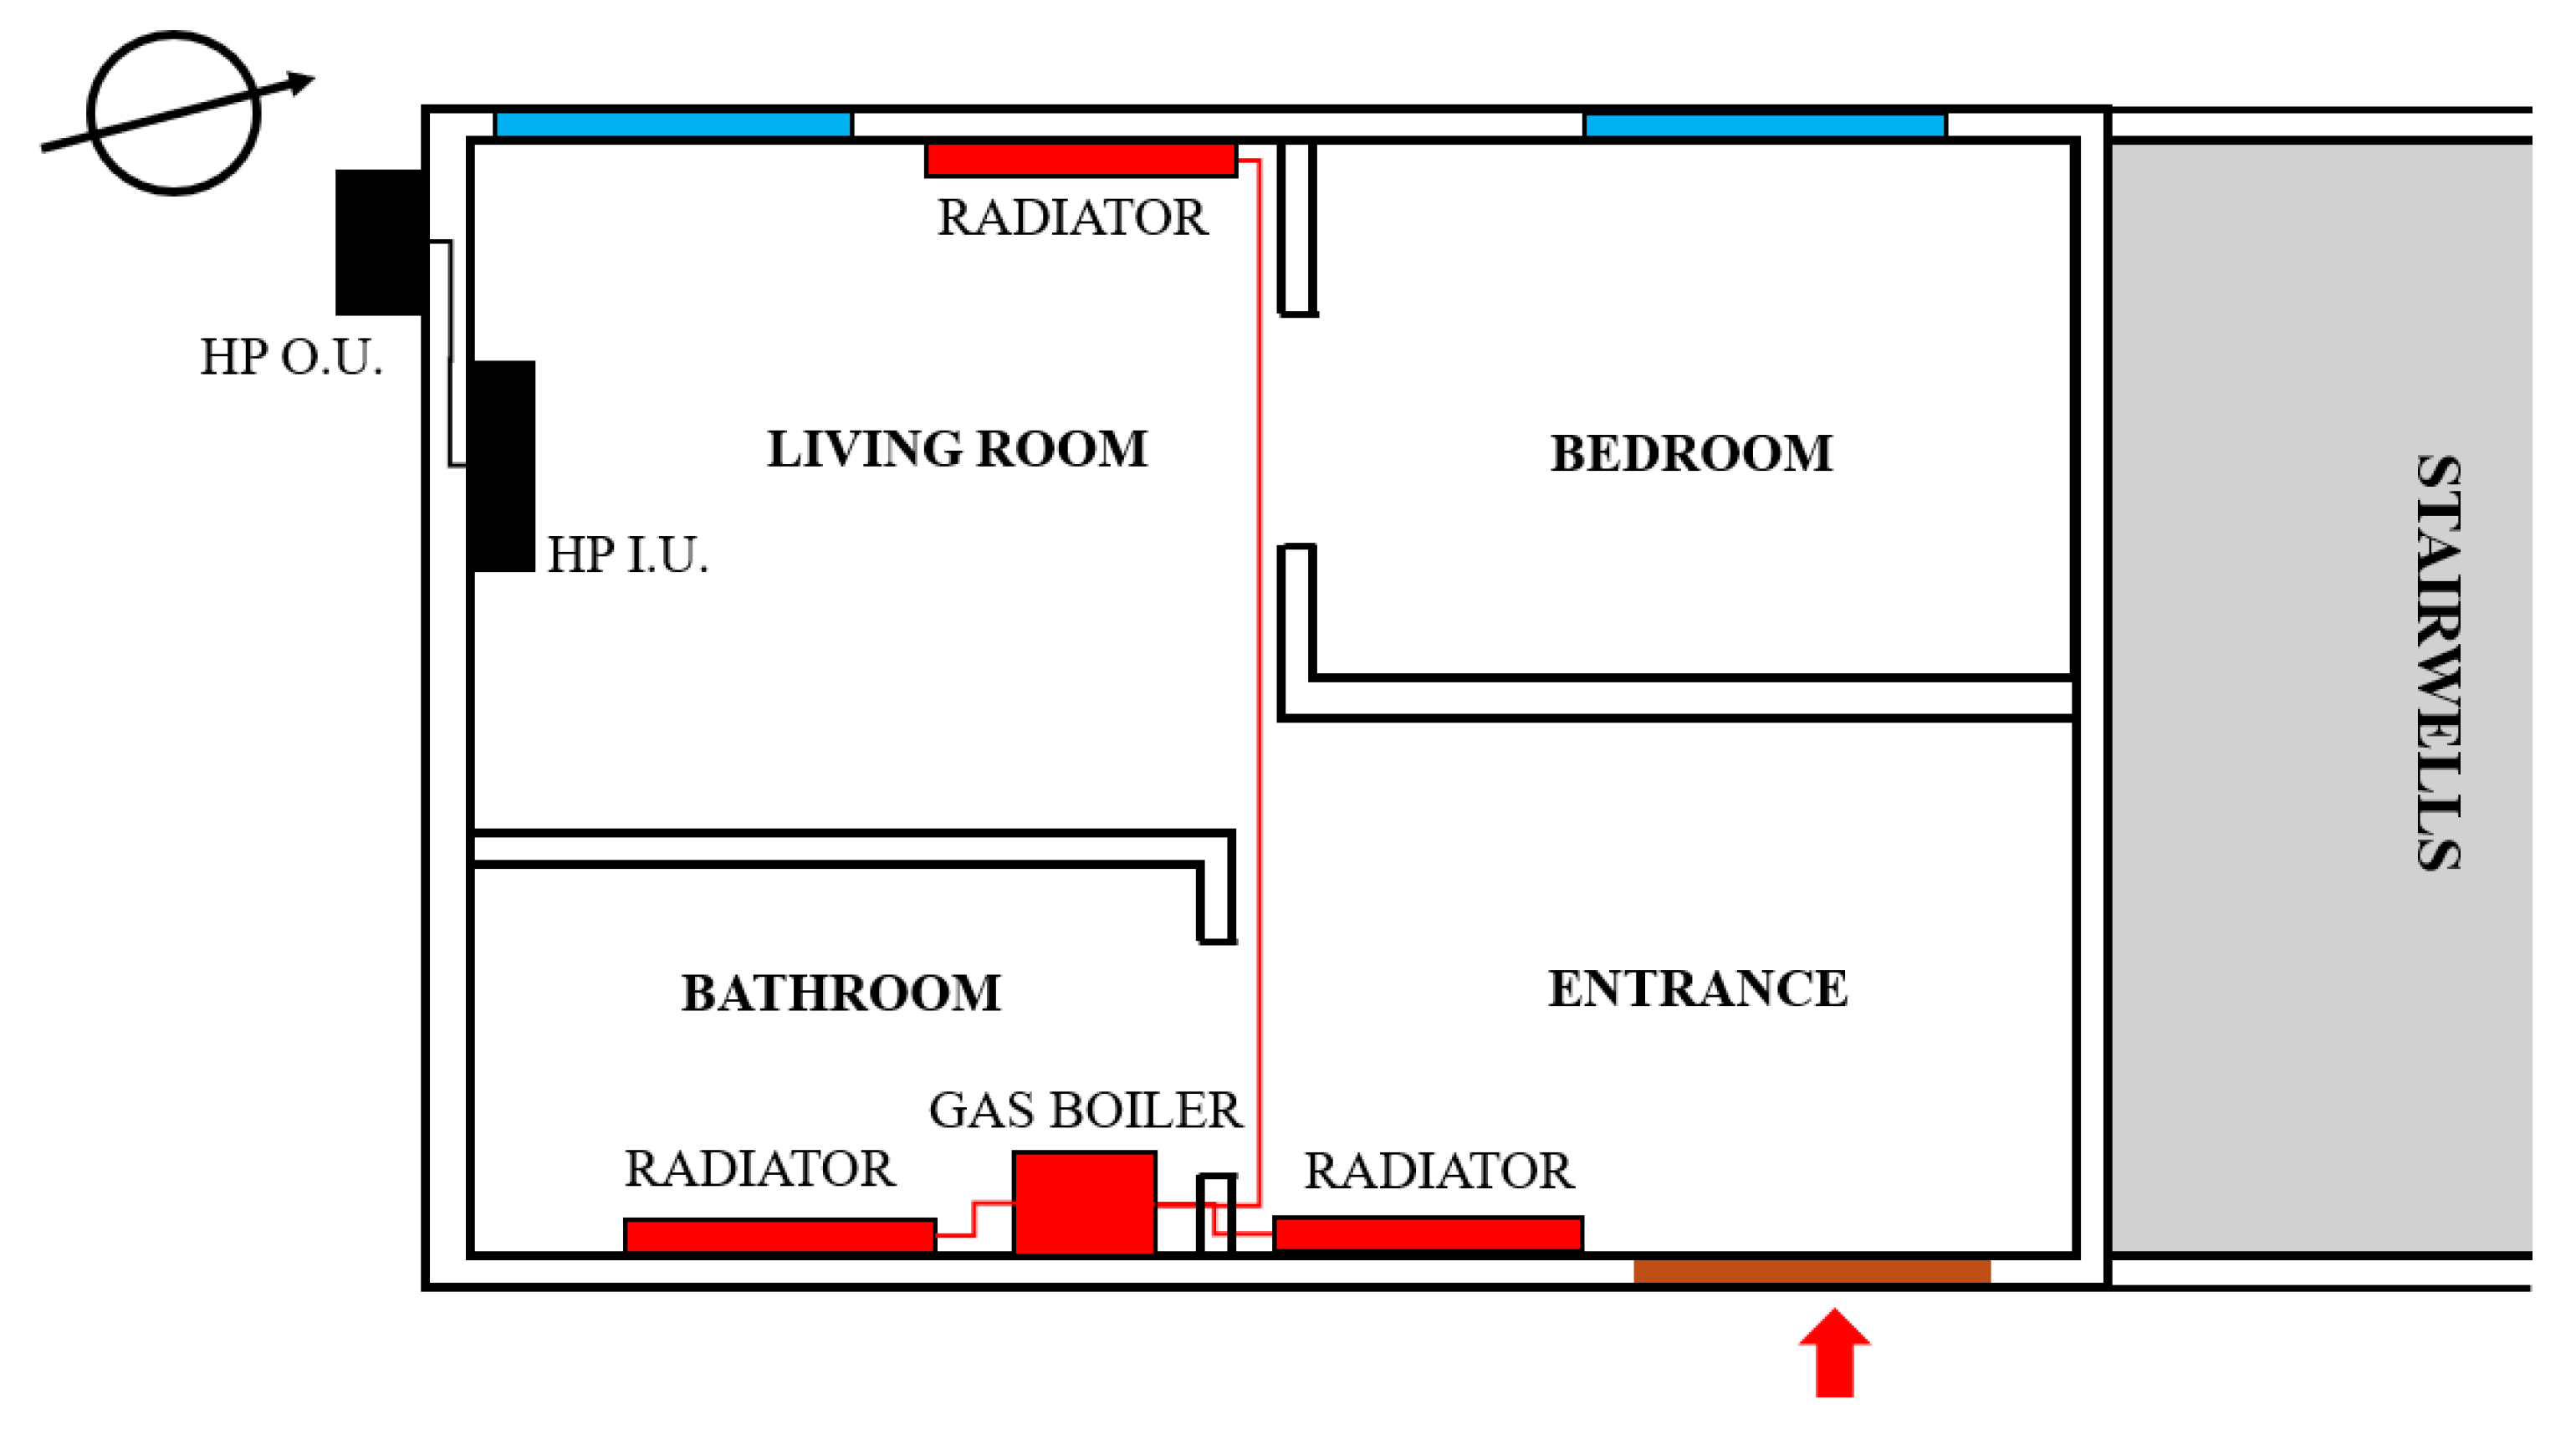
The apartment under analysis has the peculiarity of having two different heating systems: a gas condensing boiler paired with cast-iron radiators, which is also used for producing domestic hot water, and an inverter air-to-air heat pump, installed in the apartment in 2022 with a single internal unit placed in the living area. This type of system (i.e., gas boiler and reversible heat pump) is widely used in Italy. The gas boiler is typically used for heating and domestic hot water production, while the reversible air-to-air heat pump is used primarily during the cooling season. The thermal power of the gas boiler is 24 kW, with an average seasonal efficiency of 0.88 when considering combined production of domestic hot water and heating; moreover, the gas boiler is controlled by an on–off thermostat positioned in the entrance. According to UNI EN 14511-3 [43], the heat pump has a designed heating power of 2.7 kW and a seasonal performance coefficient (SCOP) of 4.0 in the average season; the onboard heat pump temperature controller controls the temperature set-point. Figure 4 shows the positions of the heating generators and the internal terminals, namely the cast-iron radiators and the heat pump internal unit.

4. Experimental Campaign

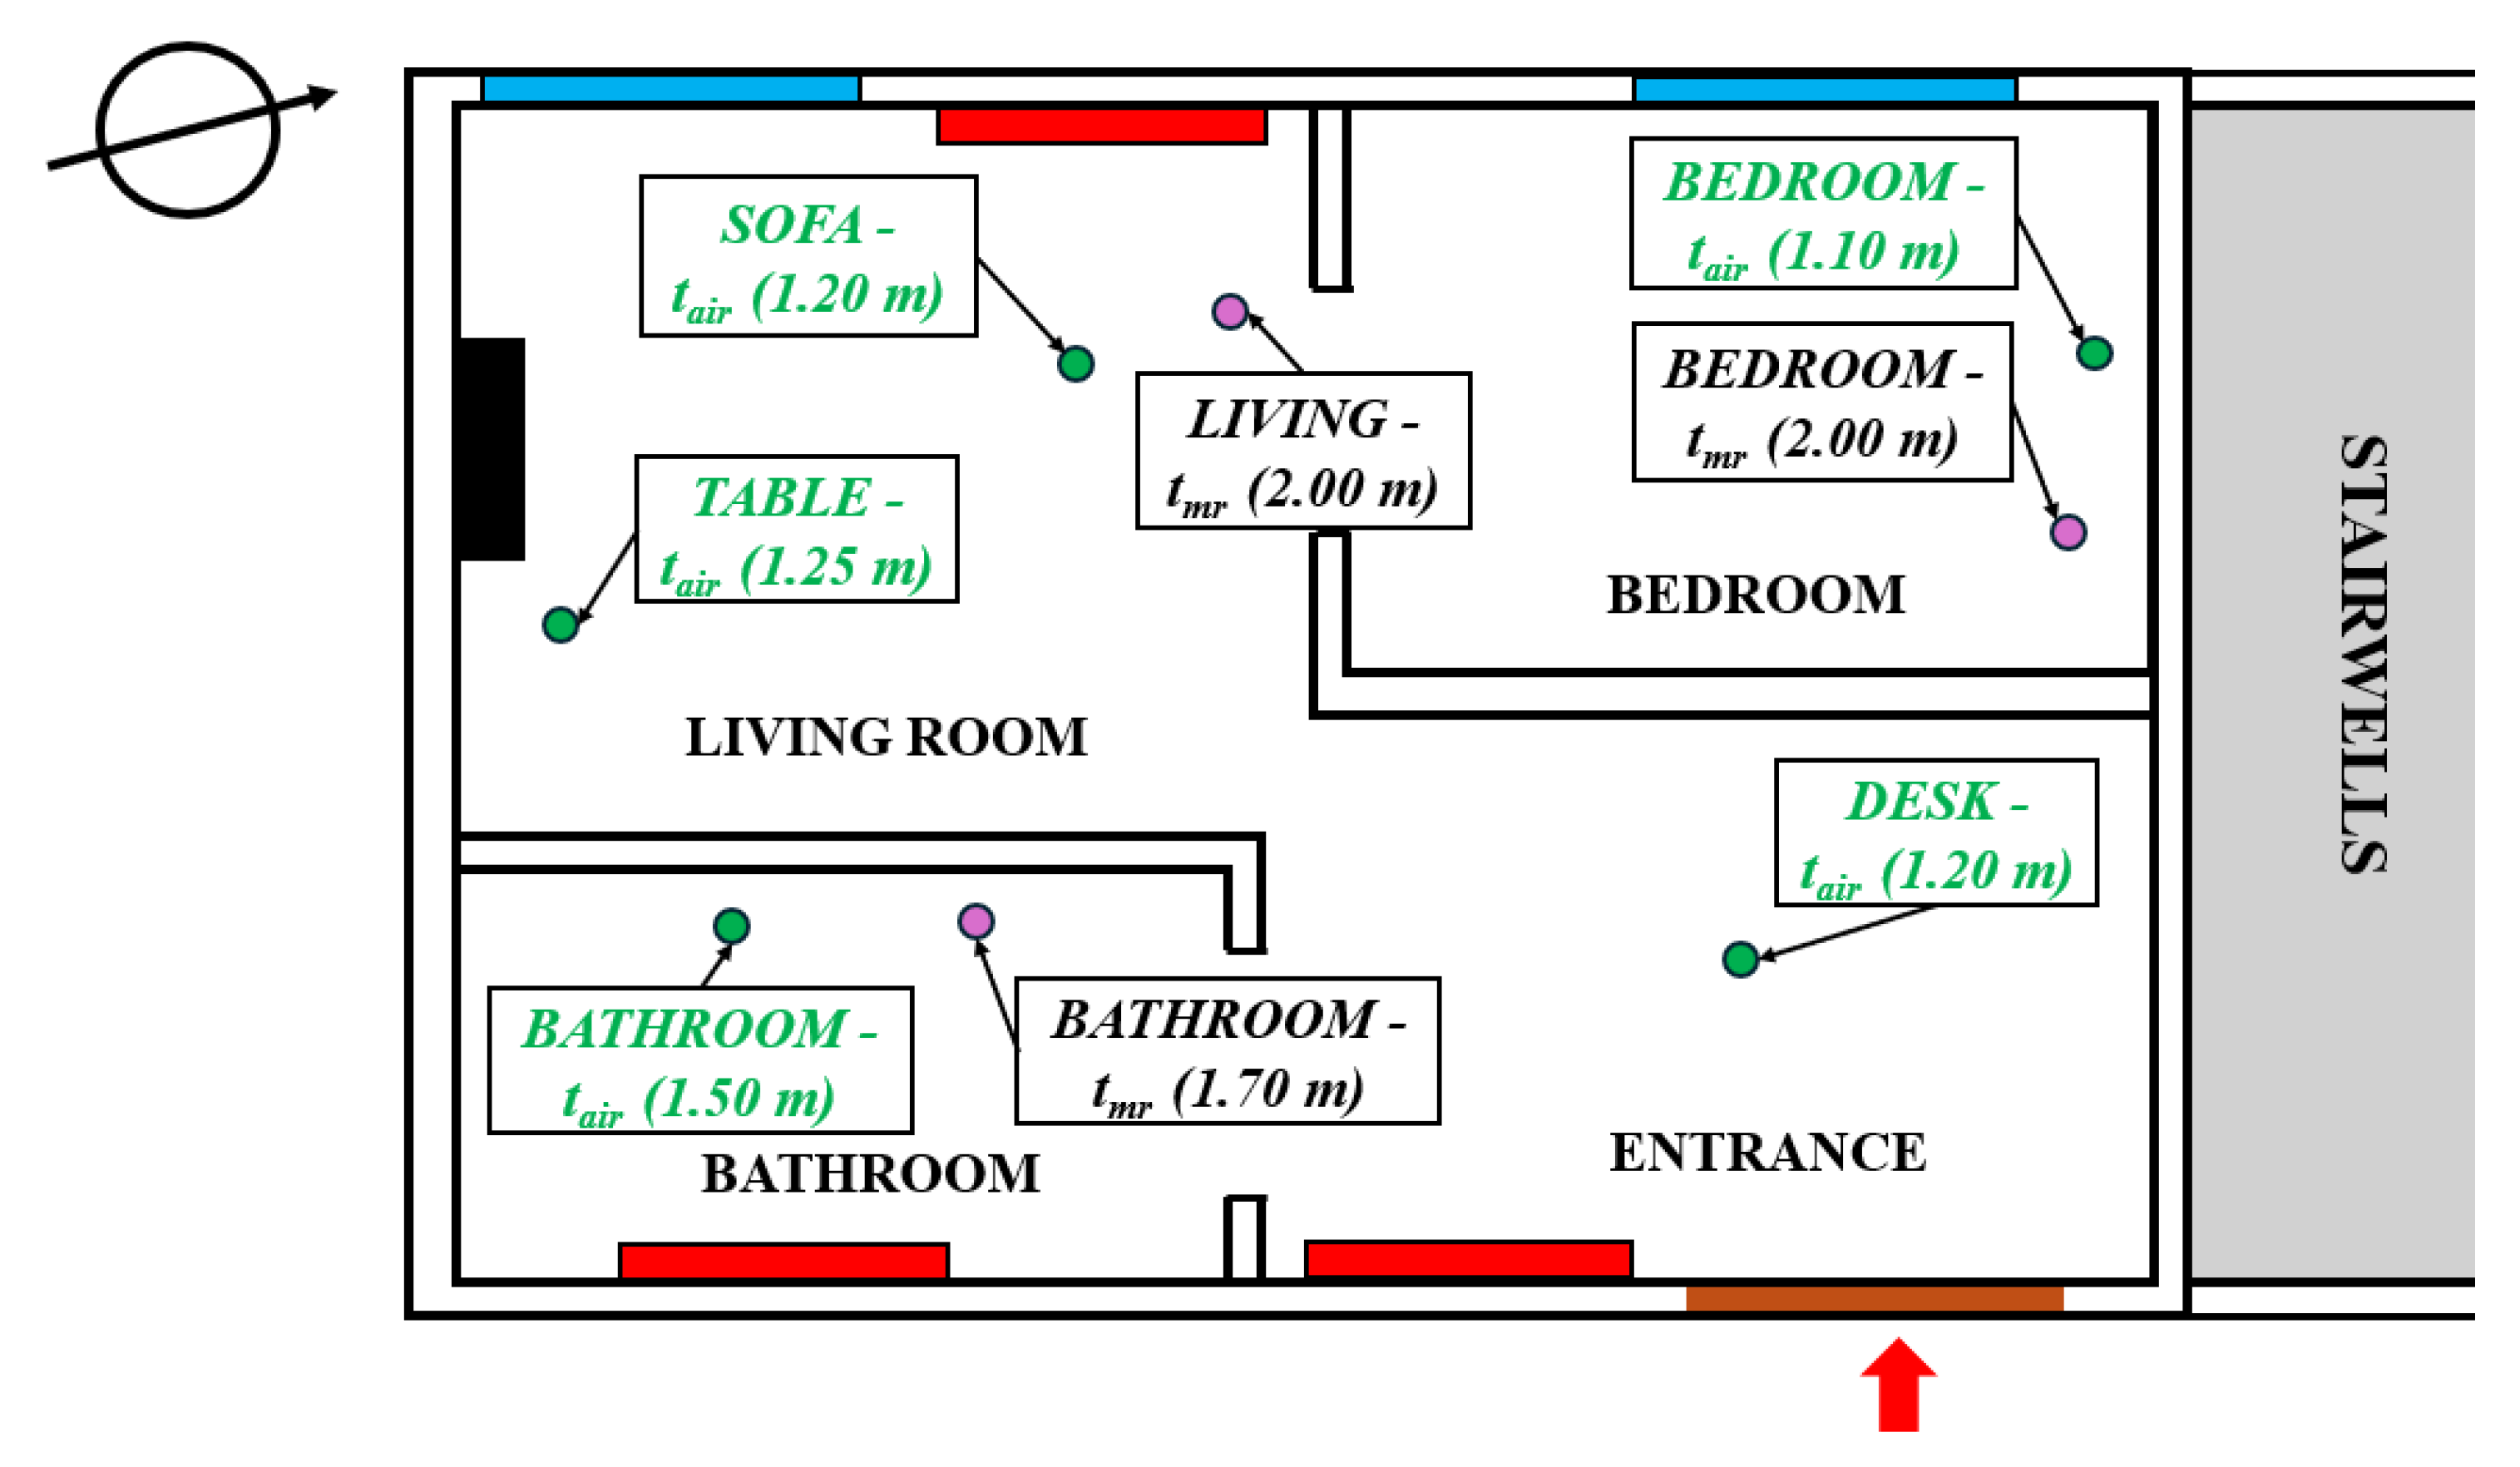
Within the apartment, eight different tests were conducted to determine the comfort conditions at strategic points of the house. Figure 5 displays the positions of sensors placed inside the apartment to evaluate comfort: comfort conditions were analyzed at points in the living/entrance area (near the sofa, table, and desk), in the bedroom near the bed, and in the bathroom near the sink. In each room, relative humidity values were also measured, and in the living room, the CO2 concentration was also measured.
Regarding the analysis of local discomfort [31], in addition, in the living room, the temperature was determined at 0.05 and 2.75 m from the floor. These additional sensors were not employed for the global comfort analysis, but only for the discomfort analysis, as reported in Section 5.2. Finally, temperature and humidity sensors were also placed outside the building to determine the external conditions. The global PMV and PPD indices developed by Fanger [20] were calculated considering the measured values of air temperature, mean radiant temperature, and humidity. In contrast, fixed values of clothing (1 clo), activity (1 Met), and airspeed (0.05 m/s) were considered (in Appendix A, the equations for PMV and PPD are reported). The mean radiant temperature (tmr (°C)) was calculated using the balance Equation (1), in the presence of natural convection:
t m r = t g + 273 4 + 0.25 10 8 ϵ t g t a i r D 0.25 t g t a i r 0.25 273 ,
where t a i r (°C) is the air temperature, and t g (°C) is the black globe temperature, i.e., the temperature reads from an NTC placed at the center of a black globe, which has emissivity ϵ = 0.95 and diameter, D, of 0.15 m. In Appendix B, the C++ code implemented for calculating the mean radiant temperature, and the PMV and PPD are also reported, employing ESP8266-based microcontroller board, Wemos D1 mini (Adafruit Industries, New York, NY, USA).
Table 3 summarizes the eight tests carried out. Each test lasted 15 h, corresponding to the daily heating system operation period (5:45 a.m.–9:45 p.m.). Table 3 shows that the first six tests used the heat pump with different water supply temperatures to the radiators (45, 55, and 65 °C), respectively, and with two different set-points for the room air (20 and 21 °C). The last two tests were conducted using the heat pump at 20 °C and 21 °C. In addition, the electrical absorptions and natural gas consumption were recorded every test day. The choice of the two indoor set-point temperatures was driven by different considerations: 20 °C reflects the standard winter heating limit defined by Italian regulations, representing a standard reference for residential buildings; 21 °C was introduced to assess how a modest increase in air temperature may affect both thermal comfort and energy use.
The water supply temperatures were selected to assess their potential influence on perceived comfort. In particular, changes in radiator surface temperature may affect the mean radiant temperature, which plays a key role in thermal comfort. Higher supply temperatures may increase the mean radiant temperature, enhancing comfort even when air temperature remains unchanged.

5. Results and Discussion

In this chapter, the comfort and energy analysis results are reported and discussed. The comfort analysis is presented in two separate sections: in the first, the global comfort parameters results are reported (i.e., the PMV and PPD), and in the second, a local discomfort analysis is reported. Then, the energy and IAQ analysis are reported in the last two sections of the chapter.

5.1. Comfort Analysis

In Table 4, the results obtained from the eight analyses in terms of PMV and PPD are reported. Reference is made to the air velocity of 0.05 m/s, 1 clo for clothing, and 1 Met for the activity. The tests were conducted during the first half of the winter month of February 2024. Concerning the humidity and temperature values, the location is characterized by a humid climate (average daily humidity between 74 and 92%) and by an external temperature higher than the typical values for that location: in Bologna, according to the UNI 10349 standard [44], the average monthly temperature is 4.6 °C, while from Table 4 it is observed that the external temperatures are much higher, with a 24 h highs of 14.8 °C in case C8 and a minimum of 5.9 °C in case C6.
In the table, the PMV values are negative, in the range between −0.04 and −1.06; thus, the temperature conditions in the analyzed rooms range from neutral to slightly cool. We highlight that these values are good, since an activity of 1 Met is assumed. Indeed, excluding the bedroom, the PPD displays values in the range of 5–17.5%. Moreover, the table shows that, in terms of absolute values, in all the cases where a set-point of 21 °C is prescribed for the boiler, an increase in the PMV index is observed in all the rooms under investigation compared to the use of the gas boiler with a set-point of 20 °C. Observing specifically the PMV calculated in the living area, near the table, sofa, and desk, it is close to 0 in tests C2–C3, while it is in the range of −0.54 to −0.42 when the set-point is set to 20 °C. In the same locations, moreover, when the heat pump is used with set-points of 20 °C and 21 °C, the PMV is between −0.38 and −0.35, with a corresponding PPD between 7.5% and 8.0%. The use of the heat pump in the living area thus leads to obtaining a comfort level intermediate between the cases where the boiler was used with set-points of 20 °C and 21 °C (average PPD with heat pump 7.7%, average PPD with gas boiler at 20 °C of 9.8% and 5.3% with gas boiler at 21 °C).
In the bathroom, a higher PMV is observed when the heat pump is used (average in cases C1–C6 of −0.52, average in cases C7–C8 of −0.82), and this is consistent with the fact that in the bathroom, the only emitter is a radiator.
Concerning the bedroom, the PMV value turns out to be significantly lower compared to the other considered locations in the apartment, due to the absence of emission terminals: the average PMV in cases C2–C3 is −0.74, in cases C5–C6 it is −0.99, while it is −0.92 if the heat pump is used (cases C7 and C8). Also in this case, from the comfort point of view, the heat pump is placed in an intermediate position relative to the boiler, with set-points of 20 °C and 21 °C.
Furthermore, in tests at different water supply temperatures and fixed set-points, no particular differences in PMV and PPD are noted.
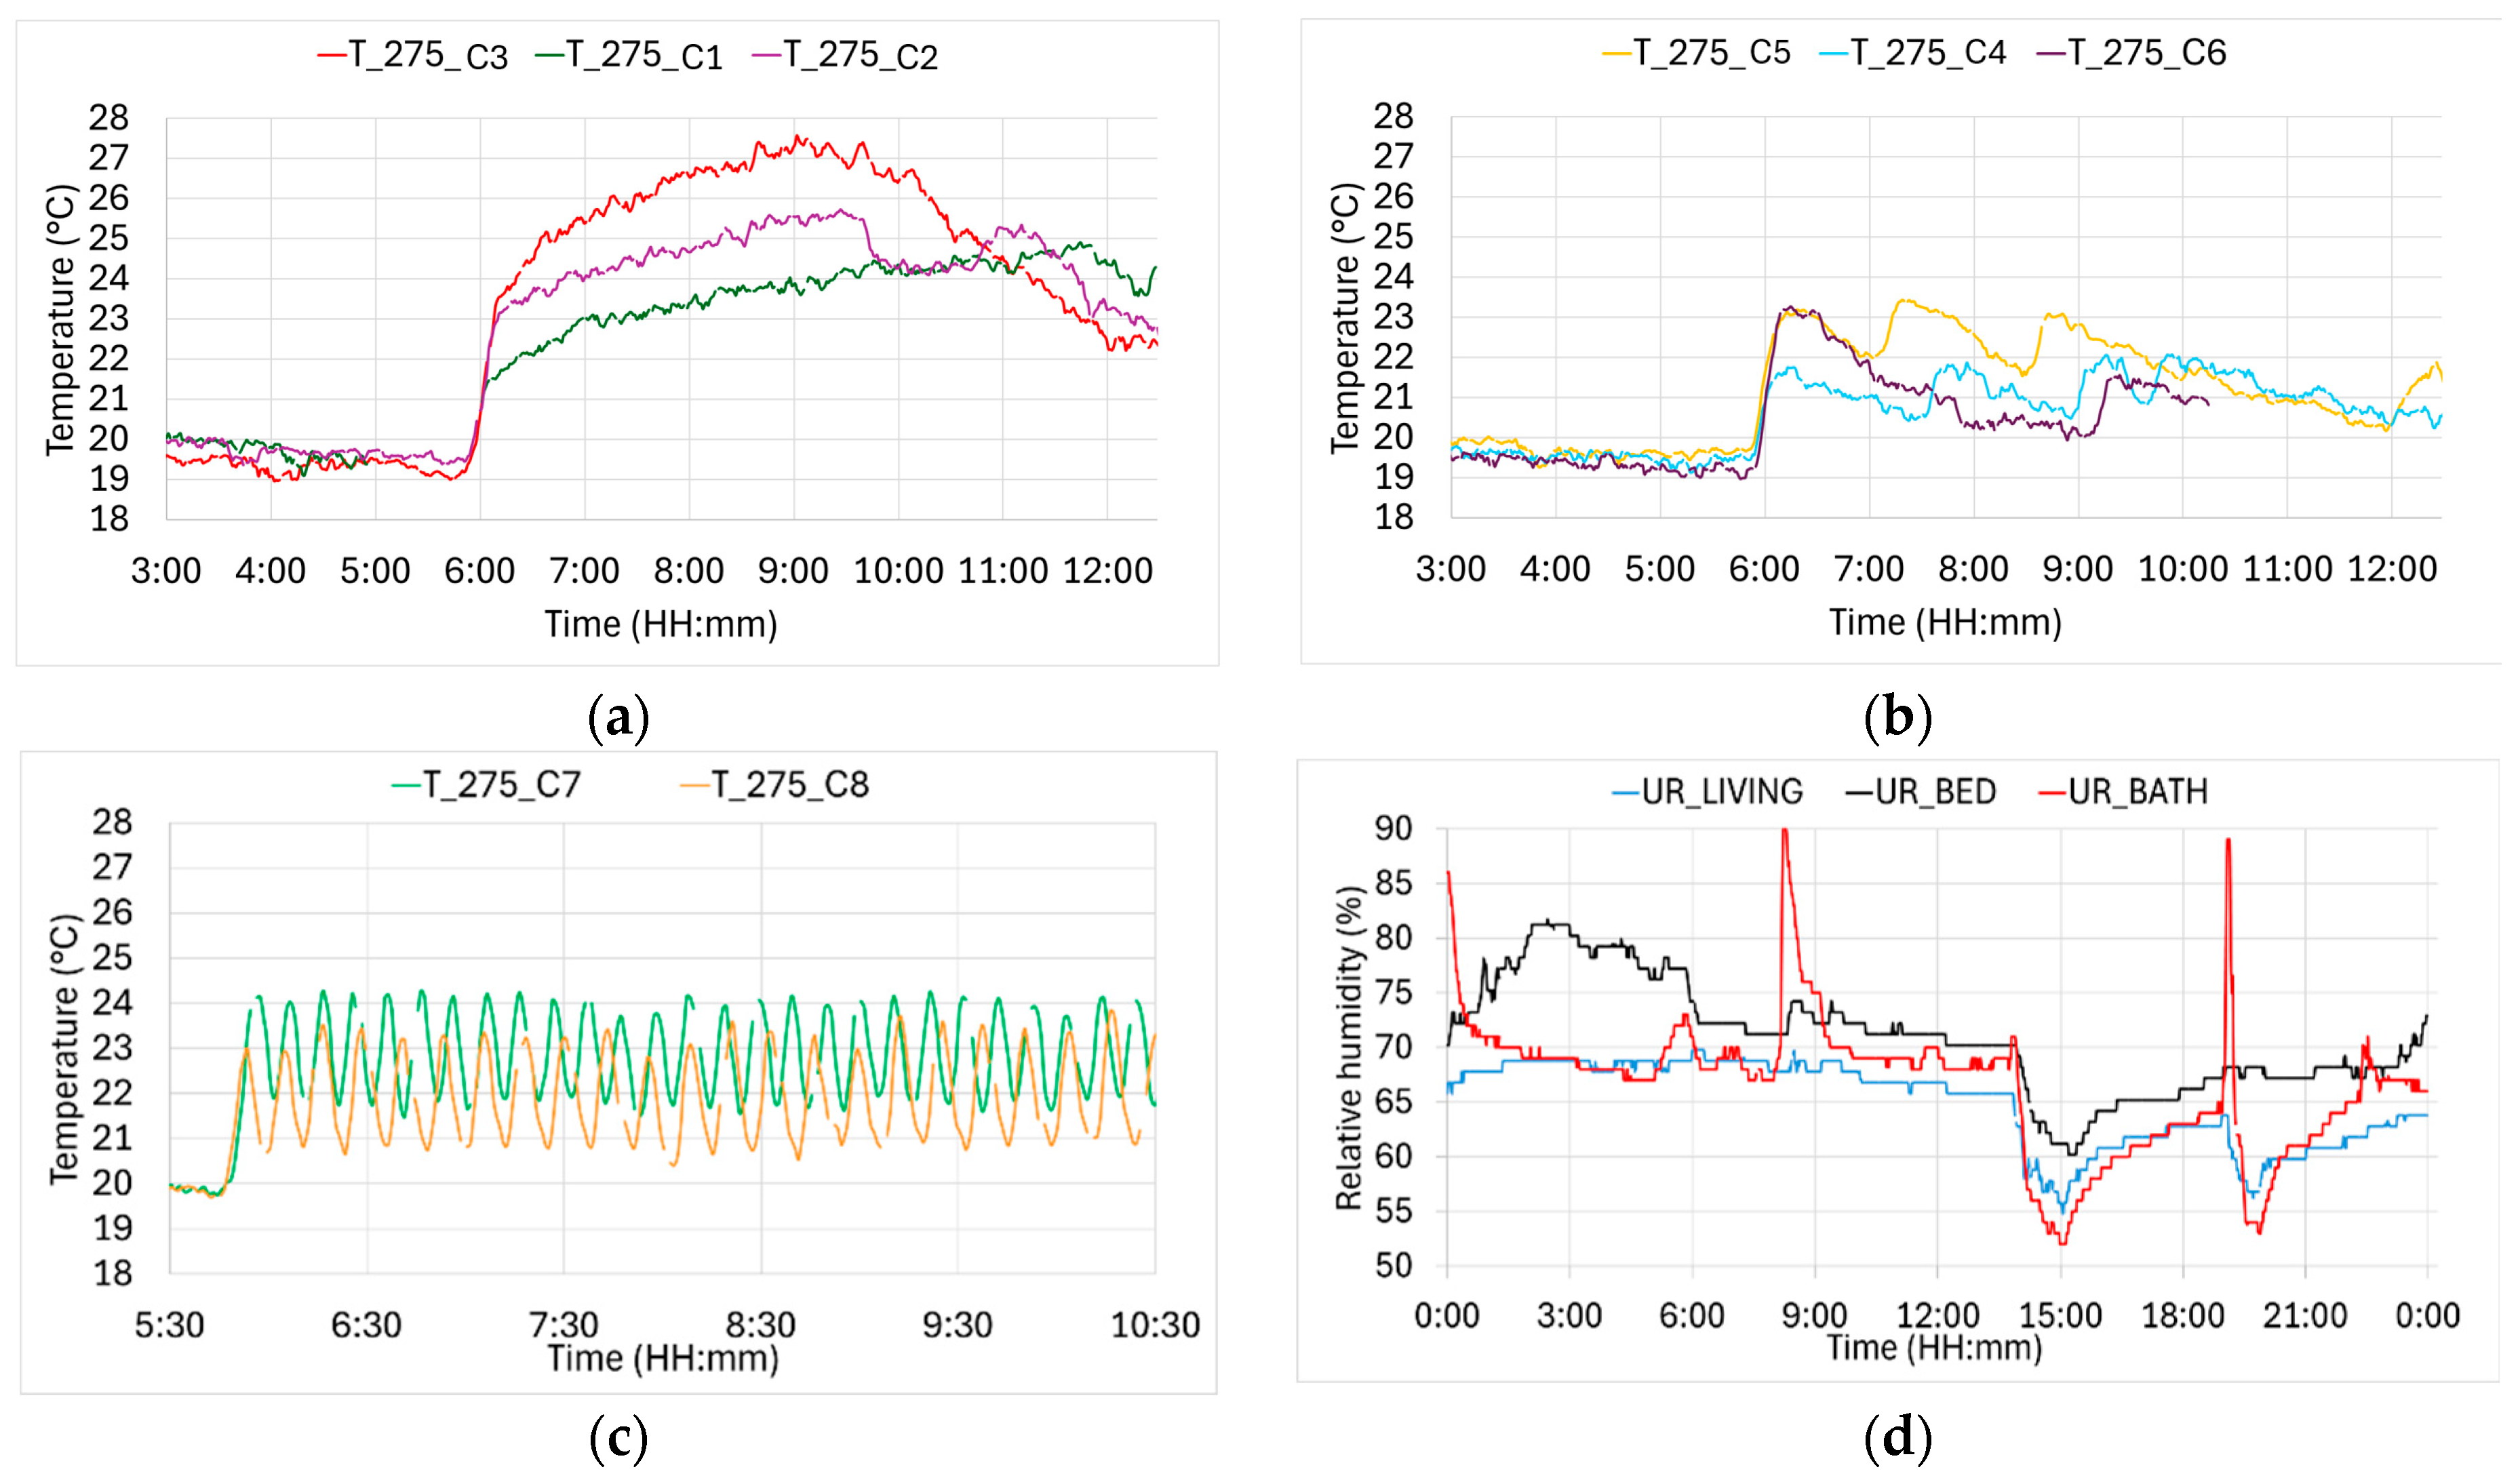
Focusing attention to other measured quantities, and particularly on the temperature at 2.75 m from the floor in the living room (temperature next to the ceiling) shown in Figure 6a,b, it is observed that the temperature, while using the boiler setting, the set-point to 21 °C reaches values above 27 °C (case C3), compared to the maximum of 23.5 °C (case C5) when the set-point is set to 20 °C. There is no strong direct correlation between the water supply temperature and the ceiling temperature. In fact, the correlation shows that the temperature near the ceiling increases as the water supply temperature from the boiler rises, but this is only noticeable in cases C2–C3 (Figure 6a) with an air set-point of 21 °C, whereas it is not that evident with a set-point of 20 °C (Figure 6b). Instead, looking at Figure 6c, which reports the ceiling temperature in cases C7 and C8, which is with the use of the heat pump at 21 °C and 20 °C, respectively, an oscillatory periodic trend is observed, with slightly different maximum and minimum values in the two cases (range 21.5–24.0 °C for C7 and 20.5–23.5 °C for C8); this is due to the control of the heat pump temperature, which is not able to keep the preset set-point temperature stable inside the room.
Moreover, Figure 6d reports the trend of relative humidity in the three thermal zones in case C5, from which peaks are observed corresponding to the opening of the windows (approximately at 3:00 p.m.), in the bathroom corresponding to showers (at 9:00 a.m. and 7:00 p.m.), and finally, a relative humidity increase in the bedroom during the night hours (between 0.00 a.m. and 6:00 p.m.) is also observed.
In Table 5, the values of air temperature, mean radiant temperature, and relative humidity across the eight cases, averaged over the 15 h of heating system operation, are reported. The table shows that the air temperature in the living room during tests C2–C3 always remains above 21 °C; in cases C5–C6, it ranges between 19.9 and 20.6 °C, whereas considering the cases with the heat pump, C7 and C8, the average temperature never reaches 21 °C. The mean radiant temperature is also particularly high (23.1–23.7 °C) in the living area in tests C2–C3 compared to all the other tests conducted. As for the bathroom, the lowest temperatures (19.6 and 19.9 °C) are observed in cases C7 and C8 (i.e., if the heat pump is employed as a heating system). Considering the bedroom, the lowest mean radiant temperature is found in cases that involve the heat pump and the gas boiler, with a set-point temperature of 20 °C (19.3 °C for case C4 and 19.8 °C for case C8). In all the cases, the humidity inside the apartment ranges between 59 and 82%, with generally higher values in the bathroom.
Finally, a comparison with simulations already available in the literature and related to the same residential building [32] allows us to infer that the results obtained from the experimental measurements are partially in agreement with those obtained from the dynamic and CFD analyses. The CFD analysis reported in [32] was conducted using the commercial software, STARCCM+ (version 2206). The Reynolds stress transport (RST) turbulence model and elliptic blending near-wall Reynolds stress turbulence closure were employed to capture turbulence anisotropy. For numerical discretization, a second-order upwind scheme was used, and the SIMPLE algorithm addressed the pressure–velocity coupling.
Mesh sensitivity analysis ensured computational efficiency and result accuracy, resulting in a final mesh of 9 × 10⁶ elements with a 4 cm base size and five boundary layers accounting for 5% of the base size. Surface refinements targeted the heat pump, radiators, and furniture.
Two steady-state simulations compared the heating systems on a typical winter day in Bologna with an external temperature of 6.9 °C. Boundary conditions set temperatures of 20 °C for the ceiling, 10 °C for the floor, and 12 °C for internal walls to compensate for the considered apartment facing two non-heated zones (garages downstairs and the stairwells) and a heated upper apartment. The heat pump featured a velocity inlet of 2.4 m/s at a 45° angle from the ceiling, according to measurements performed in the apartment during the heating season.
In detail, comparing results obtained from CFD analyses to the ones obtained from the experimental campaign, it is found that the bathroom and bedroom are the rooms presenting a lower PMV; however, the experimental measurements highlighted a better overall comfort level, mainly due to the higher radiant temperature present inside the various rooms of the apartment. This can be attributed to the different climatic conditions under which the experimental analyses and the dynamic and CFD analyses were conducted; in fact, these were carried out considering a lower average external air temperature (6.9 °C) and a possible underestimation of the mean radiant temperature obtained through the Trnsys version 18 software relative to the dynamic analysis. In fact, in [32], the dynamic analysis reveals that the mean radiant temperature in the thermal zones varies from 16 °C, in the bathroom when the heat pump is used, to 18.5 °C when the heating system considered is the gas boiler coupled to radiators, based on an indoor air set-point of 20 °C. This analysis was conducted for a typical day in the heating season with an average outdoor temperature of 6.9 °C. Notably, these values are lower than those obtained from the experimental results, as mentioned earlier in this section.

5.2. Local Discomfort Analysis

The analysis of local discomfort is limited to the calculation of the local discomfort index due to the temperature difference between ankles (at 0.10 m from the floor) and neck (1.50 m from the floor), according to the ISO 7730-2005 standard [31]:
P D = 100 1 + exp 5.76 0.856 Δ t n , a .
In Equation (2), PD (%) represents the percentage of dissatisfied people due to the temperature gradient between the neck and ankles, and Δtn,a (K) is the temperature difference between the neck and ankles.
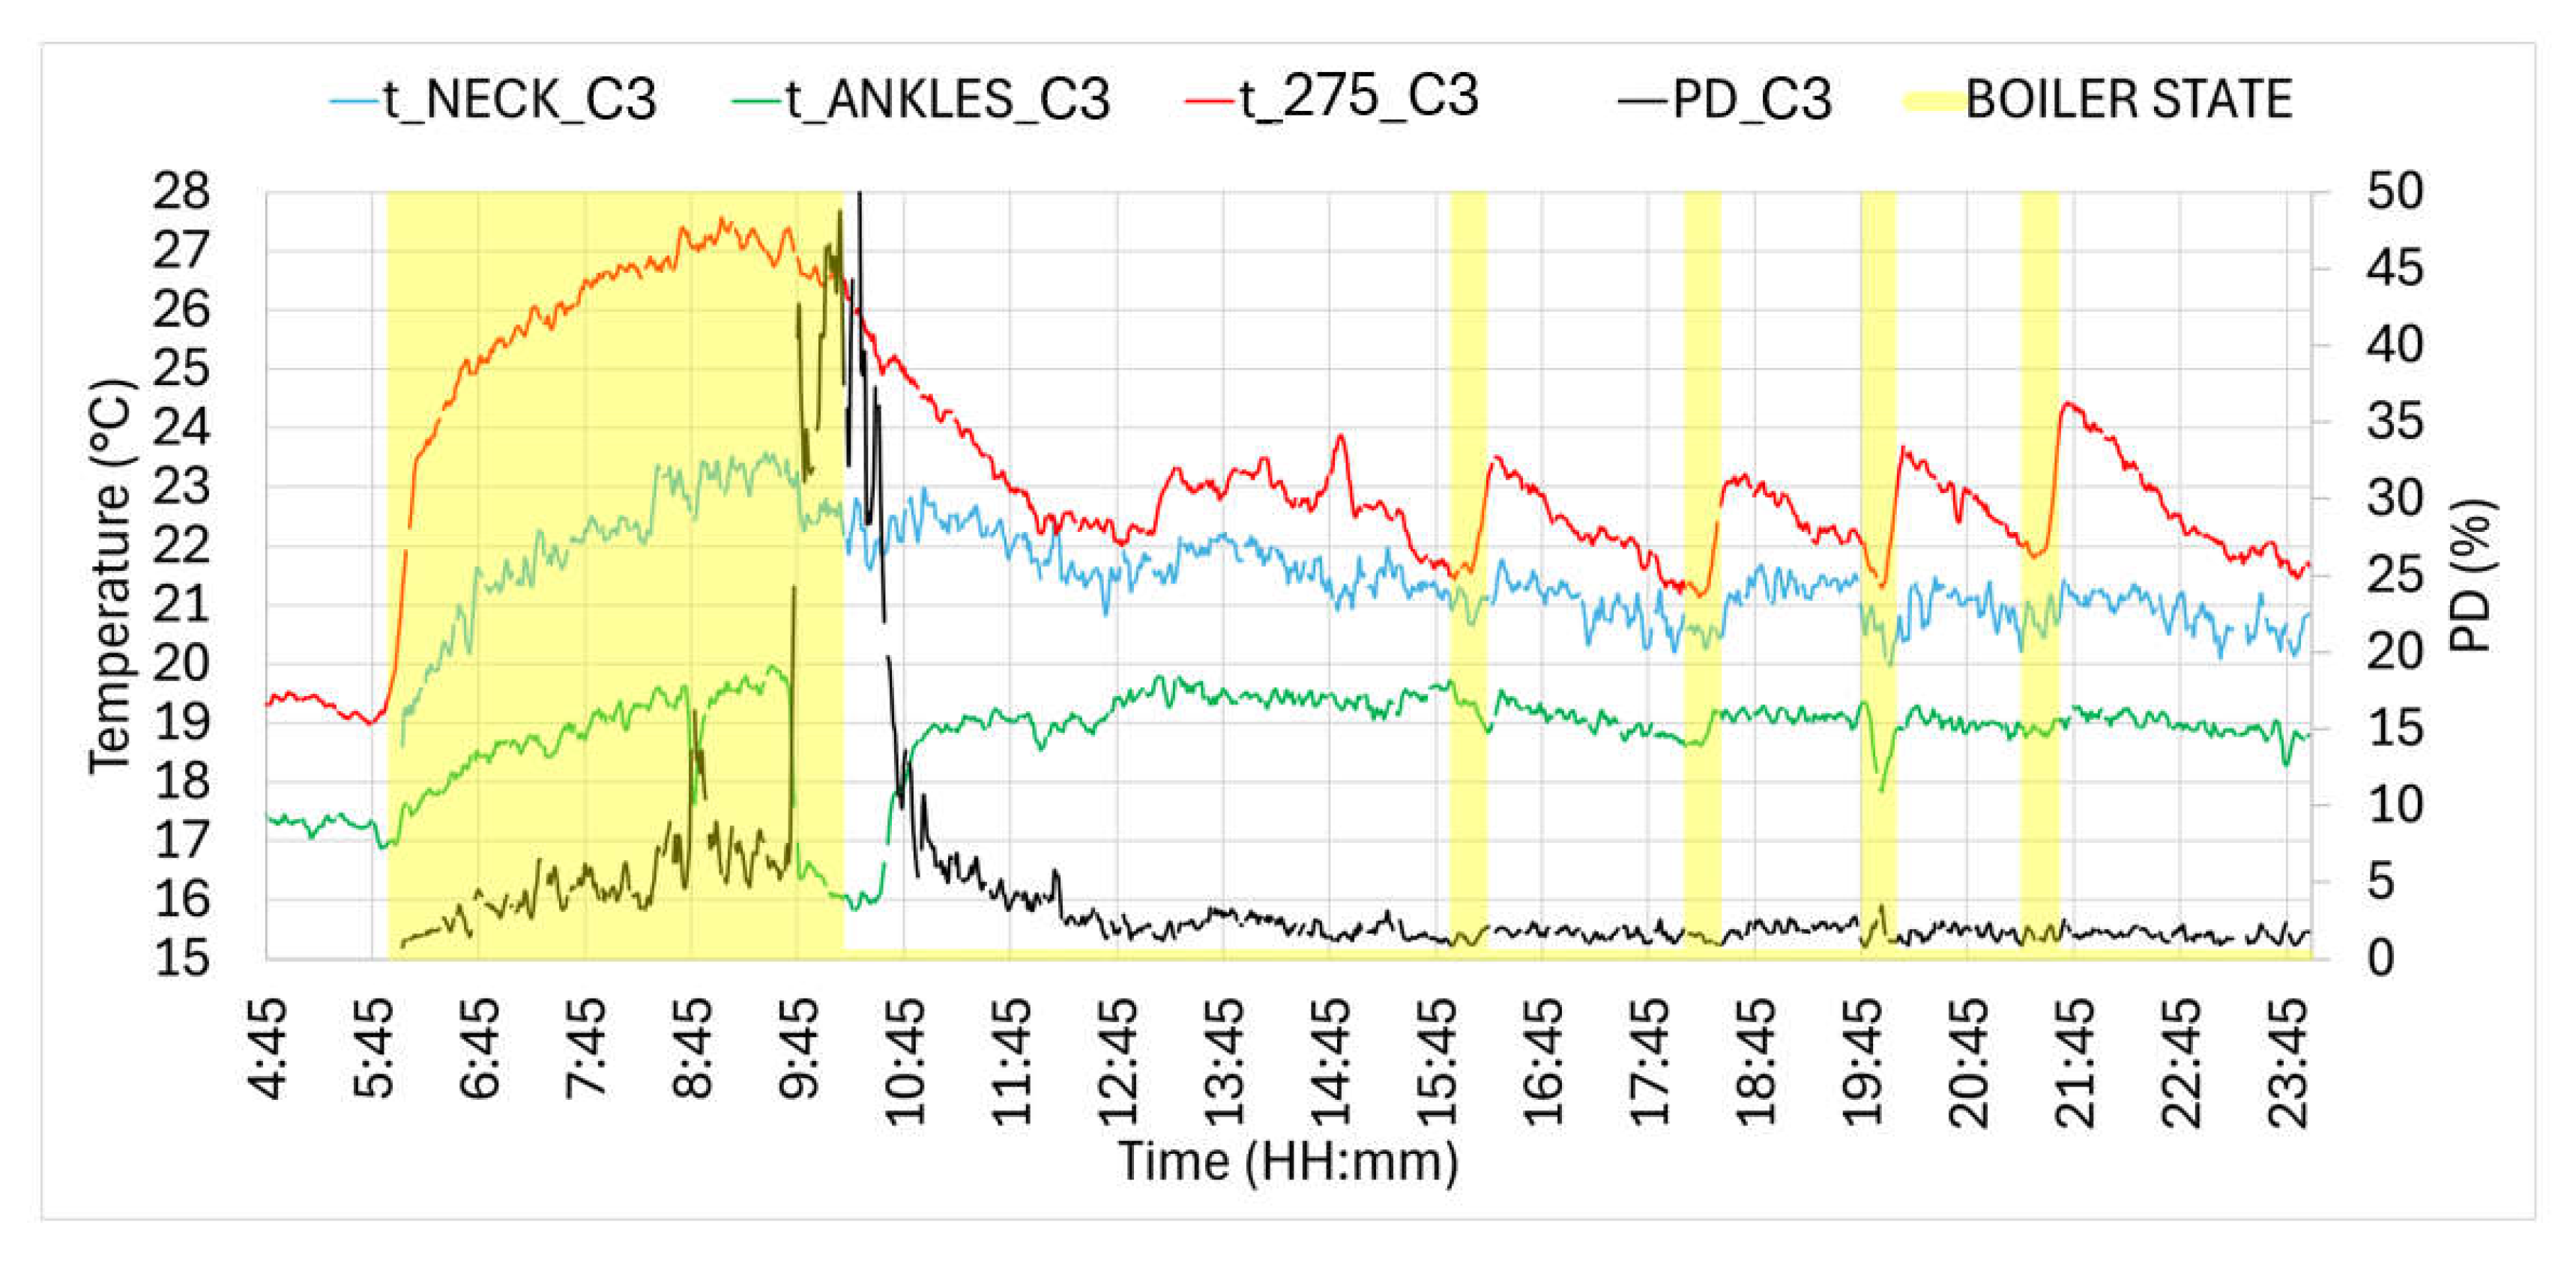
Table 6 lists the average temperature values during the heating system operation in tests C3–C8 at neck level, which is 1.50 m from the floor, at ankle level (0.10 m from the floor), and the calculated value of “dissatisfied” according to (2) in the living room. The table shows that the percentage of dissatisfied people is always below 5%, highlighting the absence of local discomfort in the living room. The only times characterized by a high value of discomfort (values reaching 50%) occur in the presence of prolonged window opening (the windows remained open for an extended period), as can be seen in Figure 7, where the values of dissatisfaction due to the presence of a significant temperature gradient between neck and ankles during test C3 are reported. Figure 7 also shows the temperature in the living area at ceiling level (2.75 m from the floor); it is observed that the prolonged opening of the windows (between 9:45 a.m. and 10:45 a.m.) has the effect of lowering the temperature mainly at floor level, with a consequent increase in the level of dissatisfaction (PD). The temperatures at 1.50 m from the ground and near the ceiling remain practically unchanged despite the window opening, also because the boiler remained on.

5.3. Energy Analysis

Table 3 shows the methane gas consumption of the gas boiler during the analyzed tests. In this case, the reported data refer to the total consumption of the gas boiler and cooktop, which also includes consumption for the production of domestic hot water and cooking, since there is a single meter for all three consumption centers (heating, production of domestic hot water, and cooking). The table also includes the electricity consumption related to the heat pump in cases C7 and C8, measured with the voltage and current sensors mentioned in Section 2. Considering the values related to the cases involving the use of the gas boiler, cases C2–C3, which presuppose a set-point at 21 °C, a corresponding gas consumption between 2.61 and 3.49 Sm3 is observed, compared to a lower consumption ranging between 2.49 and 1.87 Sm3 for the case with a set-point of 20 °C. Moreover, in general, at a fixed set-point temperature, a higher water supply temperature from the boiler corresponds to a higher natural gas consumption, except in the case of C4 (tw = 45 °C), which predicts a consumption higher than C6 (tw = 65 °C). This can still be explained considering that the meter reading also includes consumption for domestic hot water production and cooking. The electric meter of the heat pump instead shows an increase in electric energy consumption between the cases with a set-point of 20 °C to 21 °C of 74% (4.07 kWh for case C7 compared to 2.34 kWh for case C8).
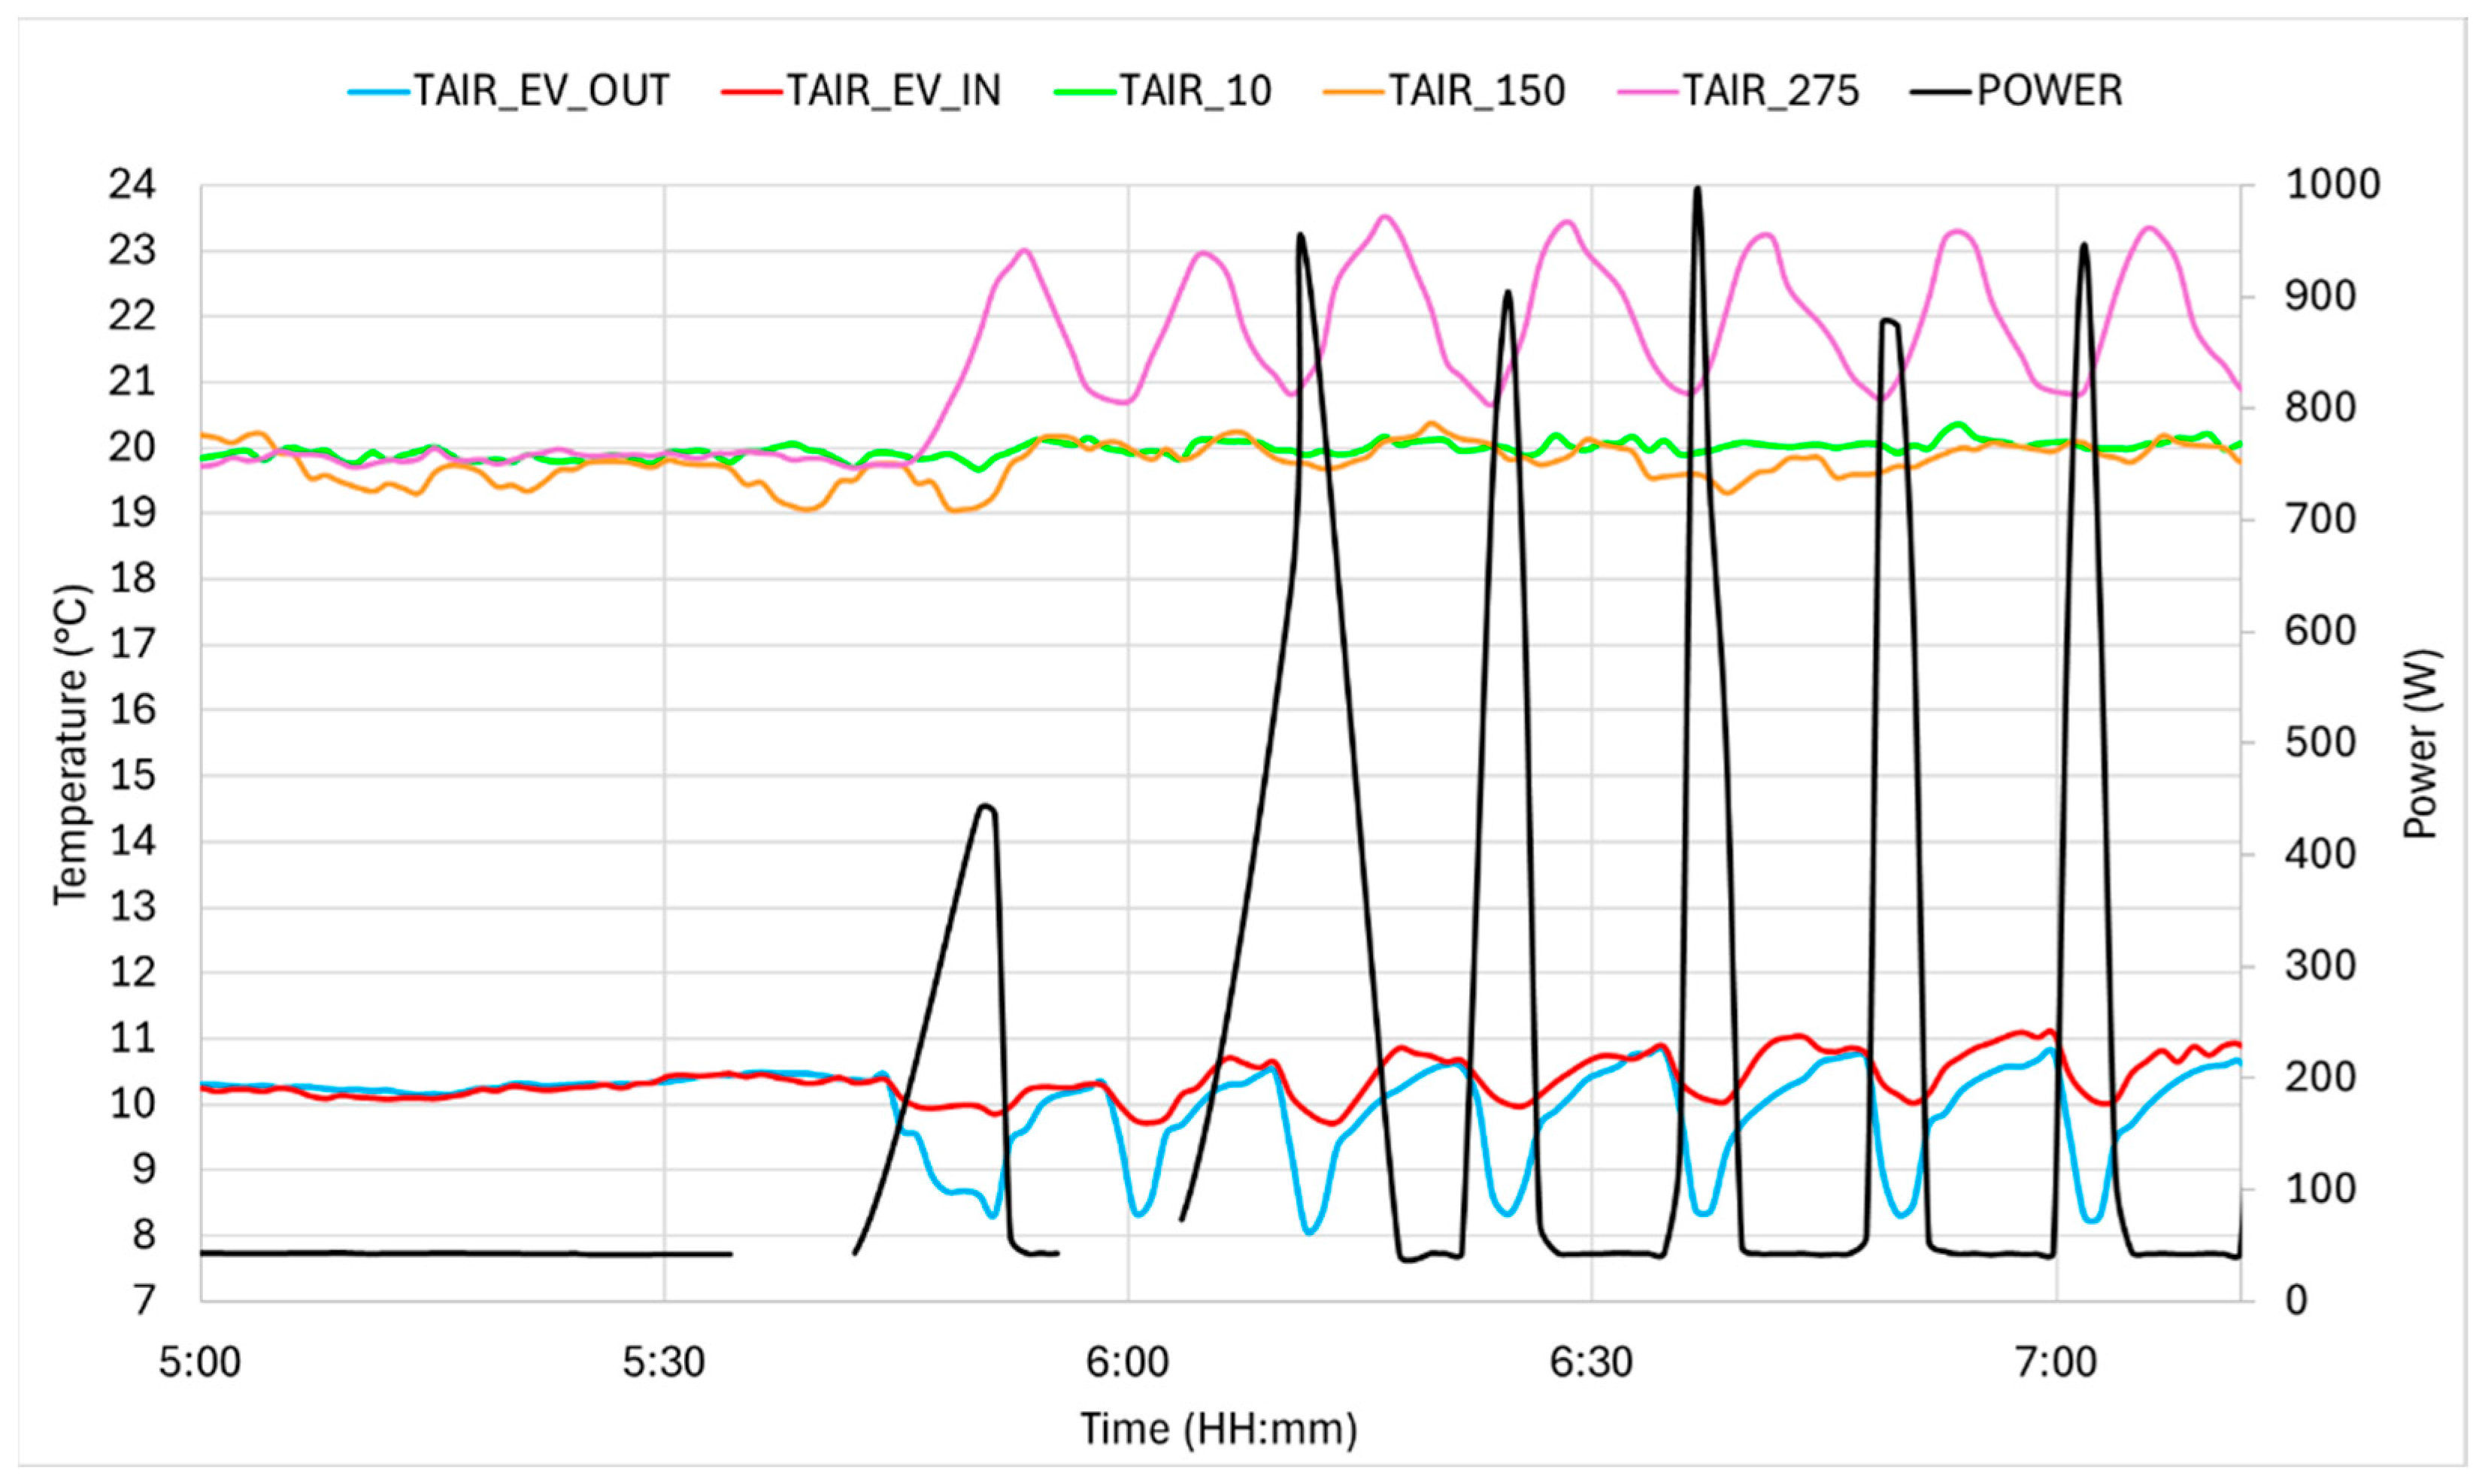
Furthermore, in Figure 8, the power trends of the heat pump in case C8 can be observed; in the same graph, the temperatures at the inlet and outlet of the heat pump evaporator and the temperatures at three different heights in the living area, where the internal unit of the heat pump is installed, are reported as well. It is observed that the power also has a periodic trend similar to the temperature 2.75 m from the floor. In particular, the maximum power of the heat pump corresponds to the minimum temperature at the evaporator’s outlet; moreover, the maximum power corresponds to the minimum temperature near the ceiling. It is also observed that the fluctuating trend in the heat pump cycles due to inadequate control has less impact on the temperature 1.50 m from the floor, and the influence at floor level is almost imperceptible.

5.4. Carbon Dioxide Concentration Analysis

In Table 7, the mean carbon dioxide concentration detected by the CO2 sensor located in the living room during the eight analyses is reported (the average was taken over the 24 h of the test day. The apartment is inhabited by two people, and the data in Table 7 show that during the 24 h, the CO2 levels were very high, ranging between 1360 and 1860 ppm. Furthermore, Figure 9 shows the CO2 concentration in the living room during test C3 and the temperatures in the room at three different heights from the ground: 0.10 m, 1.50 m, and 2.75 m. The figure shows that the CO2 concentration remains high throughout the day. A significant decrease is observed when the windows are opened at 9:00 a.m.; subsequently, the value returns to levels close to those experienced during the night (1600–1900 ppm). The only cases where the CO2 concentration is at acceptable levels, i.e., below 800–1000 ppm, are for short periods following the opening of windows for natural ventilation or in the absence of people. The values reported in Table 7 and Figure 9 indicate poor air quality and insufficient air exchange.

6. Conclusions

In the present paper, an experimental determination of comfort indices and air quality inside a residential apartment located in Southern Europe is presented. The HVAC control system is based on an Arduino-like microcontroller, pairing simplicity with cost-effectiveness. Moreover, since many existing buildings in European countries are equipped with both gas boilers and ASHP, as in the present case, an easy Arduino-like control system allows for switching between the two possible heating generators for optimization issues, such as, for instance, thermal comfort, energy consumption, and CO2 emission reduction.
The analysis leads to the following conclusions:
-
The comfort indices inside the apartment using the heat pump are intermediate between the indices determined when the gas boiler is used with set-points between 20 °C and 21 °C (for example, the heat pump in case C8 with a set-point of 21 °C leads to a PMV of −0.35 in the living room, next to the sofa, while when the gas boiler was employed, the PMV value was −0.11 and −0.53, for set-point 21 and 20 °C, respectively).
-
The supply water temperature to the radiators has little influence on comfort conditions for a fixed set-point temperature, but has an influence generally on the gas consumption of the gas boiler, as reported in Table 3.
-
The results from the experimental analysis were compared with those obtained from CFD and dynamic analyses [31], and the experimental results are partially in agreement with the dynamic ones. Both the experimental and dynamic and CFD analyses clearly show that some rooms (bedroom and bathroom) present situations of discomfort. However, the experimental results highlighted a higher mean radiant temperature, thus better comfort conditions.
-
The experimental analysis did not show any particular issues related to local discomfort due to the vertical temperature gradient (for all cases considered, the percentage of dissatisfied PD is in the range of 1.3–4.7%).
-
The analysis of air quality leads to the statement that it is poor in the apartment, with an average of over 24 h of CO2 values above 1360 ppm (range 1360–1860 ppm), suggesting a need to improve ventilation.
Future aspects of this work will focus on the analysis of comfort during the summer season and the analysis of the correct positioning of the thermostat (for the boiler and possibly the heat pump) to optimize comfort and minimize consumption. Moreover, optimization issues facilitated by the choice of Arduino will be further explored. Although the current implementation is limited to boiler control, using an Arduino-like microcontroller allows for the future development of an innovative switching system between the boiler and the air-source heat pump, aiming to enhance thermal comfort, reduce energy consumption, and lower CO2 emissions.

Author Contributions

Conceptualization and methodology, V.B., E.R.d.S., T.C. and P.V.; software, V.B. and P.V.; validation and investigation, V.B., E.R.d.S. and P.V.; data curation, V.B.; writing—original draft preparation V.B., E.R.d.S. and T.C.; writing—review and editing, V.B., E.R.d.S., T.C. and P.V.; supervision, E.R.d.S. and P.V.; funding acquisition, E.R.d.S. All authors have read and agreed to the published version of the manuscript.

Funding

The research leading to these results received funding from Italy: PNRR—Missione 4—Componente 2, Investimento 1.5 Creazione e rafforzamento di Ecosistemi dell’innovazione, costruzione di leader territoriali di R&S D.D. 3277 del 30/12/2021, under the research project ECO-SISTER-Ecosystem for Sustainable Transition in Emilia-Romagna, Code ECS00000033, CUP J33C12001240001.

Data Availability Statement

The raw data supporting the conclusions of this article will be made available by the authors on request.

Conflicts of Interest

The authors declare no conflicts of interest.

Appendix A

In this appendix, the equations for calculating the PMV and PPD according to Fanger’s model and the UNI 7730 norm are presented [21,31]. The PMV is an index ranging from −3 to +3, with 0 representing thermal comfort neutrality, statistically satisfying 95% of people. This index is a function of various parameters: air temperature (tair, °C), mean radiant temperature (tmr, °C), air velocity (vair, m/s), partial pressure of water vapor in the air (pa, Pa), thermal resistance of clothing (Icl, (m2K)/W), the ratio of skin surface covered by clothing to total exposed skin (fcl), clothing surface temperature (tcl, °C), convective heat transfer coefficient (hc, W/(m2K)), metabolic rate (M, W/m2), and activity level (W, W/m2). The equation for PMV derived from [31] is shown as Equation (A1), while Equations (A2)–(A4) detail the expressions that compose it. The PMV equation requires iterative solutions.
P M V = [ 0.33 exp 0.036 M + 0.2028 ]     { M W 3.05 10 3 5733 6.99 M W p a     0.42 M W 58.15 1.7 10 5 M 5867 p a     0.0014 M 34 t a i r 3.96 10 8 f c l     t c l + 273 4 t m r + 273 4 f c l h c t c l t a i r }
t c l = 35.7 0.028 M W   I c l { 3.96 10 8 f c l t c l + 273 4 t m r + 273 4 + f c l   + h c t c l t a i r }
h c = 2.38 t c l t a i r 0.25     f o r   2.38 t c l t a i r 0.25 > 12.1 v a i r h c = 12.1 v a i r     f o r   2.38 t c l t a i r 0.25 < 12.1 v a i r
f c l = 1.00 + 1.290 I c l   f o r   I c l 0.078   ( m 2 K ) / W f c l = 1.05 + 0.645 I c l   f o r   I c l > 0.078   ( m 2 K ) / W
The PPD is an index that statistically represents the percentage of thermally dissatisfied people and is a function of the PMV; its expression from [31] is presented in Equation (A5). This index indicates that at a PMV of 0, the percentage of dissatisfied individuals is 5%.
P P D = 100 95 exp 0.03353   P M V 4 0.2179   P M V 2

Appendix B

In this Appendix, the C++ codes implemented in the ESP8266 microcontrollers to calculate the mean radiant temperature from the values of air temperature and the temperature measured inside a hollow sphere (black globe temperature) according to Equation (1) is reported. Subsequently, the function in the C++ language for determining comfort indices with the Fanger model [20] is presented.
The function for determining the mean radiant temperature in C++ is as follows:
  • // MEAN RADIANT TEMPERATURE DETERMINATION, CONSIDERING THE AIR TEMPERATURE NTC1 AND BLACK GLOBE TEMPERATURE NTC0
  • Trad_calc_m = pow(pow(273 + T_m_NTC0, 4) + (T_m_NTC0 - T_m_NTC1) * (0.25 * pow(10, 8)) * (1 / 0.95) * pow(fabs(T_m_NTC0 - T_m_NTC1) / 0.15, 0.25), 0.25) - 273;
The function implemented in C++, which iteratively calculates the PMV index and subsequently the PPD, was developed following the procedure presented in the standard [31], where T_CL is the clothing surface temperature:
  // INPUTA DATA
ta = T_m_NTC1; //AIR TEMPERATURE (READINGS FROM NTC1)
tr = Trad_calc_m; // MEAN RADIANT TEMPERATURE
rh = RH_m_DHT11; // RELATIVE HUMIDITY (READING FROM DHT11 HUMIDITY SENSOR)
met = 1.0; // METABOLIC RATE
wme = 0.0; // EXTERNAL WORK
vel = 0.05; // AIR VELOCITY
clo = 1.0; // CLOTHING
// PARTIAL VAPOR PRESSURE APPROXIMATION
float pa = rh * 10 * exp(16.6536 - 4030.183 / (ta + 235));
  // CLOTHING RESISTANCE DETERMINATION IN m2K/W
float icl = 0.155 * clo;
  // METABOLIC RATE IN W/m2
float m = met * 58.15;
  // EXTERNAL WORK IN W/m2
float w = wme * 58.15;
// MW BALANCE
float mw = m - w;
  // CLOTHING FACTOR DETERMINATION
float fcl;
if (icl <= 0.078) {
  fcl = 1 + 1.29 * icl;
} else {
  fcl = 1.05 + 0.645 * icl;
}
  // hc COEFFICIENT DETERMINATION
float hcf = 12.1 * sqrt(vel);
float hc = -2000; // STARTING
float taa = ta + 273;
float tra = tr + 273;
float tcla = taa + (35.5 - ta) / (3.5 * icl + 0.1);
float p1 = icl * fcl;
float p2 = p1 * 3.96;
float p3 = p1 * 100;
float p4 = p1 * taa;
float p5 = 308.7 - 0.028 * mw + p2 * pow((tra / 100), 4);
float hcn = 0;
float xn = tcla / 100;
float xf = xn + 0.1;
float eps = 0.0015; // TOLERANCE
int n = 0;
while (fabs(xn - xf) > eps) {
  xf = (xf + xn) / 2;
  hcn = 2.38 * pow(fabs(100 * xf - taa), 0.25);
  hc = (hcf > hcn) ? hcf : hcn;
  xn = (p5 + p4 * hc - p2 * pow(xf, 4)) / (100 + p3 * hc);
  n++;
}
float tcl = 100 * xn - 273;
  // FINAL DETERMINATION OF PMV AND PPD
ts = 0.303 * exp(-0.036 * m) + 0.028;
  pmv = ts * (mw - (3.05 * 0.001 * (5733 - 6.99 * mw - pa)) - max(0.0, 0.42 * (mw - 58.15)) - (1.7 * 0.00001 * m * (5867 - pa)) - (0.0014 * m * (34 - ta)) - (3.96 * fcl * (pow(xn, 4) - pow(tra / 100, 4))) - (fcl * hc * (tcl - ta)));
ppd = 100 - 95 * exp(-0.03353 * pow(pmv, 4) - 0.2179 * pow(pmv, 2));
// END OF PMV AND PPD CALCULATION.

References

  1. European Heat Pump Association. Available online: https://www.ehpa.org (accessed on 23 June 2025).
  2. European Heat Pump Association. European Heat Pump Market and Statistics Report 2023. Available online: https://www.ehpa.org/news-and-resources/publications/european-heat-pump-market-and-statistics-report-2023 (accessed on 23 June 2025).
  3. Péan, T.Q.; Salom, J.; Costa-Castelló, R. Review of control strategies for improving the energy flexibility provided by heat pump systems in buildings. J. Process Control 2019, 74, 35–49. [Google Scholar] [CrossRef]
  4. Gholamzadehmir, M.; Del Pero, C.; Buffa, S.; Fedrizzi, R. Adaptive-predictive control strategy for HVAC systems in smart buildings–A review. Sustain. Cities Soc. 2020, 63, 102480. [Google Scholar] [CrossRef]
  5. Mathews, E.H.; Botha, C.P.; Arndt, D.C.; Malan, A. HVAC control strategies to enhance comfort and minimise energy usage. Energy Build. 2001, 33, 853–863. [Google Scholar] [CrossRef]
  6. Kong, M.; Dong, B.; Zhang, R.; O’Neill, Z. HVAC energy savings, thermal comfort and air quality for occupant-centric control through a side-by-side experimental study. Appl. Energy 2022, 306, 117987. [Google Scholar] [CrossRef]
  7. Goyal, S.; Barooah, P.; Middelkoop, T. Experimental study of occupancy-based control of HVAC zones. Appl. Energy 2015, 140, 75–84. [Google Scholar] [CrossRef]
  8. Ballerini, V.; Valdiserri, P.; Krawczyk, D.A.; Sadowska, B.; Lubowicka, B.; di Schio, E.R. Design, comparison and application of artificial intelligence predictive models based on experimental data for estimating carbon dioxide concentration inside a building. Appl. Therm. Eng. 2025, 261, 125122. [Google Scholar] [CrossRef]
  9. Pandey, B.; Bohara, B.; Pungaliya, R.; Patwardhan, S.C.; Banerjee, R. A thermal comfort-driven model predictive controller for residential split air conditioner. J. Build. Eng. 2021, 42, 102513. [Google Scholar] [CrossRef]
  10. Karami, M.; McMorrow, G.V.; Wang, L. Continuous monitoring of indoor environmental quality using an Arduino-based data acquisition system. J. Build. Eng. 2018, 19, 412–419. [Google Scholar] [CrossRef]
  11. Willem, H.; Lin, Y.; Lekov, A. Review of energy efficiency and system performance of residential heat pump water heaters. Energy Build. 2017, 143, 191–201. [Google Scholar] [CrossRef]
  12. Brenn, J.; Soltic, P.; Bach, C. Comparison of natural gas-driven heat pumps and electrically driven heat pumps with conventional systems for building heating purposes. Energy Build. 2010, 42, 904–908. [Google Scholar]
  13. Lin, H.; Clavreul, J.; Jeandaux, C.; Crawley, J.; Butnar, I. Environmental life cycle assessment of heating systems in the UK: Comparative assessment of hybrid heat pumps vs. condensing gas boilers. Energy Build. 2021, 240, 110865. [Google Scholar] [CrossRef]
  14. Nielsen, M.G.; Morales, J.M.; Zugno, M.; Pedersen, T.E.; Madsen, H. Economic valuation of heat pumps and electric boilers in the Danish energy system. Appl. Energy 2016, 167, 189–200. [Google Scholar] [CrossRef]
  15. Lu, Z.; Ziviani, D. Operating cost comparison of state-of-the-art heat pumps in residential buildings across the United States. Energy Build. 2022, 277, 112553. [Google Scholar]
  16. Gradziuk, B.; Gradziuk, P. Heat pumps versus biomass boilers: A comparative analysis of heating costs for public buildings. Ann. Pol. Assoc. Agric. Agrobusiness Econ. 2020, 22, 77–85. [Google Scholar] [CrossRef]
  17. Ballerini, V.; Rossi di Schio, E.; Valdiserri, P. How the energy price variability in Italy affects the cost of building heating: A Trnsys-guided comparison between air-source heat pumps and gas boilers. Buildings 2022, 12, 1936. [Google Scholar] [CrossRef]
  18. Mansi, S.A.; Barone, G.; Forzano, C.; Pigliautile, I.; Ferrara, M.; Pisello, A.L.; Arnesano, M. Measuring Human Physiological Indices for Thermal Comfort Assessment through Wearable Devices: A Review. Measurement 2021, 183, 109872. [Google Scholar] [CrossRef]
  19. Solano, J.C.; Caamaño-Martín, E.; Olivieri, L.; Almeida-Galárraga, D. HVAC systems and thermal comfort in buildings climate control: An experimental case study. Energy Rep. 2021, 7, 269–277. [Google Scholar] [CrossRef]
  20. Fanger, P.O. Thermal Comfort: Analysis and Applications in Environmental Engineering; Danish Technical Press: Copenhagen, Denmark, 1970; ISBN 978-87-571-0341-0. [Google Scholar]
  21. Ma, Z.; Zhao, D.; She, C.; Yang, Y.; Yang, R. Personal thermal management techniques for thermal comfort and building energy saving. Mater. Today Phys. 2021, 20, 100465. [Google Scholar] [CrossRef]
  22. Li, K.; Liu, Y.; Chen, L.; Xue, X. Data efficient indoor thermal comfort prediction using instance based transfer learning method. Energy Build. 2024, 306, 113920. [Google Scholar] [CrossRef]
  23. Boutahri, Y.; Tilioua, A. Machine learning-based predictive model for thermal comfort and energy optimization in smart buildings. Results Eng. 2024, 22, 102148. [Google Scholar] [CrossRef]
  24. Yussuf, R.O.; Asfour, O.S. Applications of artificial intelligence for energy efficiency throughout the building lifecycle: An overview. Energy Build. 2024, 305, 113903. [Google Scholar] [CrossRef]
  25. Boicu, M.G.; Stamatescu, G.; Făgărăşan, I.; Vasluianu, M.; Neculoiu, G.; Dobrea, M.A. Optimizing Occupant Comfort in a Room Using the Predictive Control Model as a Thermal Control Strategy. Sensors 2024, 24, 3857. [Google Scholar] [CrossRef] [PubMed]
  26. Myroniuk, K.; Furdas, Y.; Zhelykh, V.; Adamski, M.; Gumen, O.; Savin, V.; Mitoulis, S.-A. Passive Ventilation of Residential Buildings Using the Trombe Wall. Buildings 2024, 14, 3154. [Google Scholar] [CrossRef]
  27. Ballerini, V.; Coccagna, M.; Bisi, M.; Volta, A.; Droghetti, L.; Rossi di Schio, E.; Valdiserri, P.; Mazzacane, S. The Role of Mechanical Ventilation in Indoor Air Quality in Schools: An Experimental Comprehensive Analysis. Buildings 2025, 15, 869. [Google Scholar] [CrossRef]
  28. Dong, Z.; Boyi, Q.; Pengfei, L.; Zhoujian, A. Comprehensive evaluation and optimization of rural space heating modes in cold areas based on PMV-PPD. Energy Build. 2021, 246, 111120. [Google Scholar] [CrossRef]
  29. Pereira, P.F.D.C.; Broday, E.E.; Xavier, A.A.D.P. Thermal comfort applied in hospital environments: A literature review. Appl. Sci. 2020, 10, 7030. [Google Scholar] [CrossRef]
  30. Valdiserri, P.; Cesari, S.; Coccagna, M.; Romio, P.; Mazzacane, S. Experimental Data and Simulations of Performance and Thermal Comfort in a Patient Room Equipped with Radiant Ceiling Panels. Buildings 2020, 10, 235. [Google Scholar] [CrossRef]
  31. ISO 7730 2005-11-15; Ergonomics of the Thermal Environment: Analytical Determination and Interpretation of Thermal Comfort Using Calculation of the PMV and PPD Indices and Local Thermal Comfort Criteria. International Organization for Standardization: Geneva, Switzerland, 2005.
  32. Ballerini, V.; Volo, E.P.B.d.; Pulvirenti, B.; di Schio, E.R.; Valdiserri, P.; Guidorzi, P. Influence of Different Heating Systems on Thermal Comfort Perception: A Dynamic and CFD Analysis. J. Phys. Conf. Ser. 2024, 2685, 012021. [Google Scholar] [CrossRef]
  33. Conrad Electronic, TRU COMPONENTS 10kΩ NTC. Datasheet. Available online: https://asset.conrad.com/media10/add/160267/c1/-/en/001570951DS00/datasheet-1570951-tru-components-mjsts-103-3950-1-600-3d-temperature-sensor-30-up-to-105-c-10-k-3950-k.pdf (accessed on 16 August 2025).
  34. Mouser Electronics. DHT11 Humidity and Temperature Sensor. Available online: https://www.mouser.com/datasheet/2/758/DHT11-Technical-Data-Sheet-Translated-Version-1143054.pdf (accessed on 23 June 2025).
  35. ASAIR AHT10 Technical Manual. Available online: https://server4.eca.ir/eshop/AHT10/Aosong_AHT10_en_draft_0c.pdf (accessed on 23 June 2025).
  36. Winsen. Intelligent Infrared Carbon Dioxide Module (Model: MH-Z14A). Available online: https://www.winsen-sensor.com/d/files/MH-Z14A.pdf (accessed on 23 June 2025).
  37. Qingxian Zeming Langxi Electronic. ZMPT101BCurrent-Type Voltage Transformer. Available online: https://futuranet.it/futurashop/image/catalog/data/Download/1606-HR1232.pdf (accessed on 23 June 2025).
  38. Qingxian Zeming Langxi Electronic. ZMCT103C Current Transformer. Available online: https://5nrorwxhmqqijik.leadongcdn.com/ZMCT103C+specification-aidirBqoKomRilSjpimnokp.pdf (accessed on 23 June 2025).
  39. AZ-Delivery C1 Mini NodeMcu, Based on ESP8266. Available online: https://cdn.shopify.com/s/files/1/1509/1638/files/Betriebsanleitung-AZ-D1miniV1.2_2.pdf?v=1590603445 (accessed on 23 June 2025).
  40. Argolab CH250 Climatic Chamber, 250LT. Available online: https://www.argo-lab.com/Media/FileDocumenti/ENG/manuali/CLIMATEST.pdf (accessed on 23 June 2025).
  41. Sensirion. Datasheet Sensirion SCC30 Sensor Module CO2, Humidity, and Temperature Sensor. Available online: https://sensirion.com/media/documents/4EAF6AF8/61652C3C/Sensirion_CO2_Sensors_SCD30_Datasheet.pdf (accessed on 23 June 2025).
  42. Google docs Google, LLC. Available online: https://docs.google.com (accessed on 23 June 2025).
  43. UNI EN 14511-3; Air Conditioners, Liquid Chilling Packages and Heat Pumps for Space Heating and Cooling and Process Chillers, with Electrically Driven Compressors—Part 3: Test Methods. Ente Nazionale Italiano di Unificazione: Milano, Italy, 2018.
  44. UNI UNI 10349-1:2016; Heating and Cooling of Buildings—Climatic Data—Part 1: Monthly Averages for Italian Locations. Ente Nazionale Italiano di Unificazione: Milano, Italy, 2016.
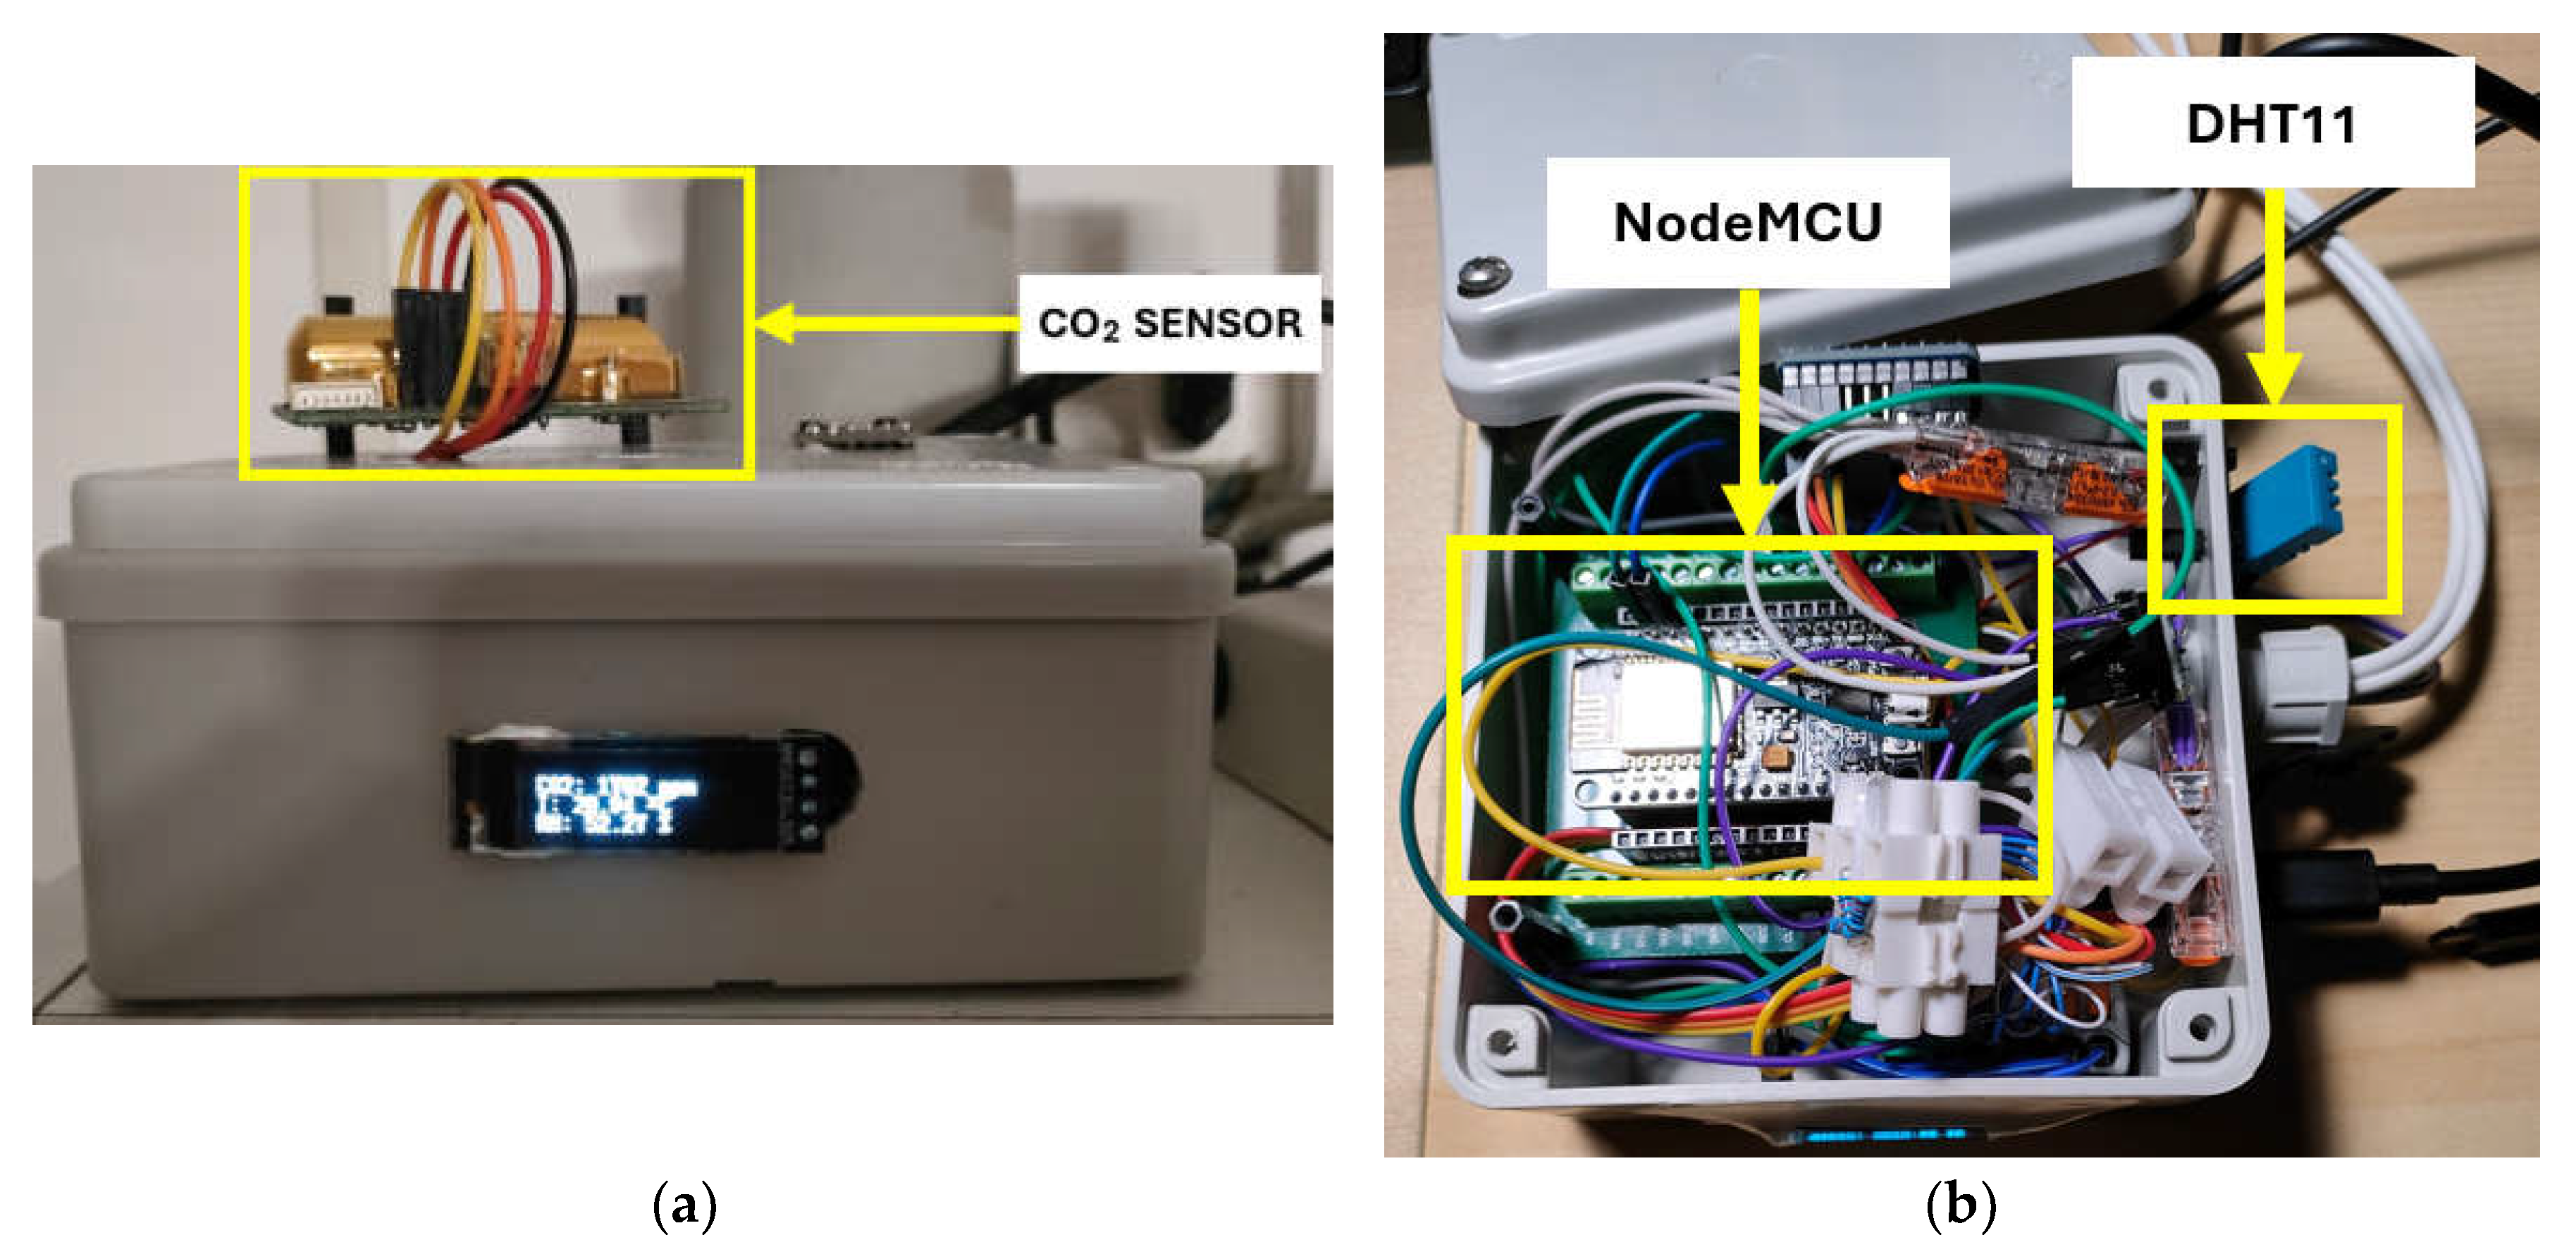
Figure 1. (a) Case containing the CO2 sensor; (b) view of the case with a microcontroller (NodeMCU) and temperature, humidity, and pressure DHT11.
Energies 18 04398 g001
Figure 2. Scheme of data storage and microcontroller connections.
Energies 18 04398 g002
Figure 3. (a) Layout of the apartment and (b) position of the apartment in the building block: the analyzed apartment is depicted in red while the gray construction represents the underground garages.
Energies 18 04398 g003
Figure 4. Position of the generators and terminal emitters in the apartment: the heat pump internal and external units (HP I.U. and HP O.U., respectively) are shown in black. In contrast, the gas boiler and the radiators are noted in red.
Energies 18 04398 g004
Figure 5. Positions of sensors in the apartment for the comfort analyses; the green dots indicate the positions of the air temperature sensors, while the purple dots indicate the positions of the black globe sensors; for each sensor, the height above the floor is also shown.
Energies 18 04398 g005
Figure 6. Temperature at 2.75 m from the floor in the living room for cases (a) C1–C3, (b) C4–C6, and (c) C7–C8; (d) relative humidity in the bedroom, bathroom, and living room in case C5.
Energies 18 04398 g006
Figure 7. Temperatures at ankle level (0.10 m, green line), at neck level (1.50 m, azure line), and at 2.75 m (red line) from the floor in case C3. The figure also shows the PD (%) due to the vertical gradient and the state of the boiler (the yellow area indicates when the boiler is on).
Energies 18 04398 g007
Figure 8. Trends in power (black line) and temperatures in case C8: TAIR_EV_OUT and TAIR_EV_IN are the air temperatures at the outlet and inlet of the external evaporator, while the other three are the temperatures in the living room at three different heights (0.10, 1.50, and 2.75 m from the floor).
Energies 18 04398 g008
Figure 9. CO2 concentration and temperature at three different heights during case C3.
Energies 18 04398 g009
Table 1. Uncertainties of the sensors after calibration.
SensorType–ModelMeasured QuantityUncertainty
TemperatureNTC 10 kOhm at 25 °CTemperature (°C)±0.4 K
HumidityDHT11Relative humidity (%)±5%
HumidityAHT10Relative humidity (%)±3%
CO2 sensorMHZ14ACO2 concentration (ppm)±(50 ppm + 5% reading value)
Current sensorZMCT103CCurrent (A)±1%
VoltageZMPT101BVoltage (V)±1%
Table 2. Thickness (m) and transmittance (U-value, W/(mK)) of the main envelope components of the analyzed building.
ComponentU-Value (W/(m2K))Thickness (m)
Dividing walls2.0740.10
External walls0.6670.30
Inter-floor0.5950.42
Table 3. Main settings of the performed analyses employing the gas boiler (cases C1–C6) and the air-to-air heat pump, HP (cases C7 and C8); water temperature refers to the water supply temperature to the radiators in cases C1–C6.
CaseC1C2C3C4C5C6C7C8
Heating systemBOILERBOILERBOILERBOILERBOILERBOILERHPHP
Air set-point, tset (°C)2121212020202120
Water temperature, tw (°C)455565455565--
Gas volume (Sm3)2.612.713.491.942.491.87--
HP electricity demand (kWh)------4.072.34
Table 4. Results obtained from comfort analysis. “HS-ON factor” is the ratio between the time the heating system was on relative to the 15 h of daily heating, while URext and text are the mean outdoor relative humidity and temperature, respectively (the latter averaged over the 24 h of the day and during the 15 h when the heating system is on).
CaseC1C2C3C4C5C6C7C8
Heating systemBOILERBOILERBOILERBOILERBOILERBOILERHPHP
tset (°C)2121212020202120
tw (°C)455565455565--
HS-ON factor (-)0.390.350.280.070.110.050.380.15
text (°C) (24 h)10.710.812.214.19.95.914.714.8
text (°C) (HS-ON)121212.614.810.46.314.915.2
URext (%) (24 h)8587747889839291
PMV BATH (-)−0.32−0.28−0.33−0.77−0.57−0.75−0.85−0.79
PMV BED (-)−0.73−0.76−0.73−1.06−1.00−0.92−0.90−0.93
PMV SOFA (-)−0.11−0.15−0.04−0.53−0.42−0.44−0.35−0.37
PMV DESK (-)−0.17−0.17−0.07−0.51−0.46−0.54−0.36−0.38
PMV TABLE (-)−0.11−0.15−0.04−0.53−0.42−0.44−0.35−0.37
PPD BATH (%)7.16.67.317.511.816.820.218.2
PPD BED (%)16.217.216.228.726.122.922.123.3
PPD SOFA (%)5.35.55.010.98.79.07.57.8
PPD DESK (%)5.65.65.110.49.411.17.78.0
PPD TABLE (%)5.35.55.010.98.79.07.57.8
Table 5. Air temperature (tair (°C)), mean radiant temperature (tmr (°C)), and relative humidity (RH, (%)) averaged over the 15 h of the heating system operation for cases C1–C8.
CaseC1C2C3C4C5C6C7C8
tair bathroom21.221.421.219.520.419.619.219.3
tair bedroom19.319.319.418.418.517.918.718.8
tair sofa21.821.620.020.220.620.420.320.7
tair desk21.521.421.820.420.419.920.320.6
tair table21.721.722.120.020.620.119.920.2
tmr living23.123.223.721.422.122.022.822.2
tmr bathroom22.022.322.320.021.220.319.619.9
tmr bedroom21.121.121.419.320.021.420.219.8
RH living6462597164697070
RH bathroom6962607965758282
RH bedroom6965627669747576
Table 6. Average values during the 15 h when the heating system is on for the air temperature at the ankles and neck, and the average value of the percentage of dissatisfied people (PD, calculated from Equation (2)) due to the temperature gradient between neck and ankles.
CaseC1C2C3C4C5C6C7C8
temp. ankles (°C)19.418.918.918.218.218.418.118.4
temp. neck (°C)21.221.121.52020.319.920.220.3
PD (%)1.73.44.71.82.51.32.21.7
Table 7. Average carbon dioxide concentration over 24 h for cases C3–C8.
CaseC1C2C3C4C5C6C7C8
CO2 concentration (ppm)17751551146018041396136014601860
Disclaimer/Publisher’s Note: The statements, opinions and data contained in all publications are solely those of the individual author(s) and contributor(s) and not of MDPI and/or the editor(s). MDPI and/or the editor(s) disclaim responsibility for any injury to people or property resulting from any ideas, methods, instructions or products referred to in the content.