Article

Two-Stage Transformer–Customer Relationship Identification Strategy for Low-Voltage Distribution Grid Using Physics-Guided Graph Attention Network

1
Power Science Research Institute of State Grid Hubei Electric Power Co., Wuhan 430048, China
2
Power Science Research Institute of State Grid Shanxi Electric Power Co., Taiyuan 030021, China
3
Institute of Power Distribution, College of Electrical Engineering, Southeast University, Nanjing 210096, China
*
Author to whom correspondence should be addressed.
Energies 2025, 18(16), 4380; https://doi.org/10.3390/en18164380 (registering DOI)
Submission received: 28 May 2025 / Revised: 14 July 2025 / Accepted: 7 August 2025 / Published: 17 August 2025

Abstract

Accurate transformer–customer relationships are crucial for the efficient operation and high-quality service of the low-voltage distribution grid (LVDG). This paper proposes a novel two-stage transformer–customer relationship identification strategy for LVDG using physics-guided graph attention network (PGAT). First, considering both transient and steady-state voltage fluctuations, a modified piecewise aggregate approximation (MPAA) algorithm is developed to preprocess raw measurement data through compression and denoising while preserving key voltage correlation features. Second, electrical similarity among customers is explored using the Modified Piecewise Aggregate Approximation K-means (MPAA-K-means) algorithm, enabling preliminary identification of transformer–customer relationships. Then, a training paradigm based on PGAT is introduced to characterize node features constrained by grid topology and electrical properties, achieving refined identification of transformer–customer relationships. Finally, testing results on real LVDG demonstrate the effectiveness and accuracy of the proposed two-stage identification strategy, providing new insights for transformer–customer relationship identification.

1. Introduction

The LVDG is the terminal part of the power distribution system, directly supplying electricity to end customers. Its operational efficiency and service quality are of utmost importance [1,2]. The transformer–customer relationship is defined as the corresponding relationship between each end customer and the distribution transformer that supplies power to that customer. Accurate transformer–customer relationships serve as a critical foundation for tasks such as line loss management [3], fault location [4], and three-phase imbalance maintenance [5] in LVDG. Traditionally, transformer–customer relationship establishment and maintenance primarily rely on manual inspections, which not only incur high costs but are also prone to documentation errors due to human factors. Fortunately, the development of advanced metering infrastructure (AMI) or smart meters and their widespread deployment in LVDG have provided new approaches to addressing the issue of transformer–customer relationship identification [6,7]. AMI system data show considerable potential for identifying transformer–customer relationships. Therefore, accurately identifying and maintaining transformer–customer relationships in low-voltage distribution networks by integrating smart meter data with advanced algorithms has become an important research focus and technical challenge.
Currently, the primary methods for transformer–customer relationship identification can be categorized into manual inspection, carrier communication [8,9], and data-driven methods. The manual inspection method relies on maintenance personnel physically checking power lines to update and maintain transformer–customer relationships. This method proves inefficient and prone to documentation errors. The carrier communication method identifies connection relationships through signal exchange between transformers and customer sides, albeit at the cost of expensive additional measurement equipment [10]. With the widespread adoption of AMI in recent years, data-driven methods have gained significant attention in transformer–customer relationship identification.
Data-driven methods for transformer–customer relationship identification can be primarily classified into two categories: one based on voltage correlation principles and the other founded on energy conservation principles.
Reference [11] proposes a two-stage algorithm combining data-driven and physical principles to correct grouping errors between residential meters and their corresponding transformers in distribution grid models. Transformer–customer grouping errors are first identified through correlation coefficient analysis, followed by error correction using linear regression models. This method improves distribution grid model accuracy while reducing the time cost for error correction. Addressing transformer–customer relationship identification in low-voltage grids, Zhou et al. [12] propose a User–Transformer Connectivity Relationship (UTCR) recognition algorithm incorporating multi-dimensional voltage prior knowledge. A knowledge-driven recognition model based on voltage correlation prior knowledge is established to enhance identification accuracy under low distinguishability and noise interference. To address the high-cost, low-efficiency limitations of traditional manual inspections, reference [13] proposes an automated topology identification method for low-voltage grids using voltage similarity and key time-segment grey correlation analysis. Grey correlation analysis determines transformer–customer relationships and phase connections, while an innovative key time-segment processing method improves long-sequence data computation efficiency. To mitigate the precision degradation of existing voltage correlation methods under noisy conditions, reference [14] proposes an improved FCM clustering-based transformer–customer relationship identification method. The robustness against noise interference is enhanced through Gaussian kernel correlation coefficients. Khafaf et al. [15] propose an unsupervised learning algorithm using smart meter voltage data for the automatic identification of transformer–customer connections in LVDG. Three algorithms are developed to improve accuracy on real-world datasets while eliminating dependence on manually labeled data. To address frequent topology changes caused by grid maintenance, reference [16] proposes a dynamic relationship identification method combining Bayesian inference and spectral clustering for low-voltage transformer areas. Voltage similarity is calculated using Gaussian kernel functions and IIR filtering to construct time-series similarity matrices, with spectral clustering enabling dynamic topology identification. Reference [17] proposes a two-stage identification method employing sliding-window dynamic time warping and Hausdorff distance for transformer–customer relationship recognition. Accuracy and scalability are improved through data preprocessing and the dual-stage identification framework. This method is particularly suitable for large-scale distribution network topology change scenarios. Huang et al. [18] propose a voltage data-driven automatic identification method using deep Gaussian mixture models for transformer–customer relationships. Feature extraction, clustering, and split-merge networks are integrated to achieve adaptive transformer quantity adjustment and abnormal data identification. This method addresses challenges including imbalanced customer distribution and data missing issues.
Reference [19] proposes a layer-wise stepwise regression method for low-voltage topology identification. A multiple linear regression model is constructed, with significance factors introduced for error correction and parameters iteratively updated layer by layer. This method effectively addresses data distortion caused by electricity theft and communication crosstalk, providing reliable topology information for source-load-storage coordinated operation. Liao et al. [20] propose a hierarchical topology identification method combining regression analysis and knowledge reasoning. Active power is adopted as the electrical characteristic, with power fluctuations processed through Elastic-Net regression. The AMIE algorithm extracts logical knowledge to derive complete hierarchical topology structures. Reference [21] proposes an advanced metering infrastructure-based data-driven method for end customer identification. An association convolution recognition algorithm and Markov random field voltage correlation model are employed to construct and optimize transformer–customer mapping relationships, effectively identifying physical connections between end customers and transformers. Li et al. [22] propose a transformer–customer connection identification method suitable for LVDG with high PV penetration. A weighted convolution model is developed, incorporating PV fluctuation-adaptive weighted convolutional power optimization and an improved convolutional voltage correlation optimization model, effectively mitigating PV fluctuation impacts and suppressing voltage asymmetry issues. In reference [23], Hu et al. propose an identification method combining voltage profile coefficient and power loss coefficient optimization. An optimization objective is constructed through voltage correlation analysis and power balance constraints, with adjacency matrices iteratively updated to identify transformer–customer connections. Field tests verify its high accuracy and robustness even with poor data quality.
Nevertheless, energy conservation-based methods impose stringent requirements on data quality. In large transformer zones, the accumulation of correlation errors from numerous sub-meters may lead to significant power discrepancies between master and sub-meters. Moreover, electricity thieves may bypass meters or adjust consumption patterns (e.g., nighttime theft) to evade detection, further compromising identification effectiveness.
In summary, existing research has made significant contributions to transformer–customer relationship identification. However, two notable limitations persist in these references. First, current-voltage correlation methods lack proper data preprocessing. These show poor robustness when dealing with data discrimination and noise. Additionally, too much redundant information hides important features. This prevents models from accurately identifying basic voltage correlation patterns. Second, neural network and machine learning methods mainly focus on data patterns during training. However, they lack adequate physical constraints. This limitation reduces their generalizability and affects the reliability and interpretability of identification results.
In recent years, the Physics-Guided Neural Network (PGNN), an innovative method combining physical knowledge with deep learning, has gained widespread attention in the power sector [24,25]. Inspired by this, this paper proposes a novel two-stage transformer–customer relationship identification strategy for LVDG using PGAT. The initial identification of transformer–customer relationships is achieved through a MPAA-K-means algorithm. A PGAT model is proposed to ensure node representations align with grid topology and electrical characteristics. This enables more accurate identification of transformer–customer relationships. This study makes three key contributions:
(1)
A novel two-stage identification strategy integrating PGAT for transformer–customer relationships in LVDG. Initial identification is achieved through clustering algorithms, followed by graph-learning-based refinement of transformer–customer mappings. This method provides a cost-effective, noise-resistant, and highly implementable solution for relationship identification.
(2)
A voltage fluctuation-based MPAA algorithm is developed for data compression and denoising of raw measurements. Time-series weighted aggregation using voltage fluctuation intensity metrics (considering both transient and steady-state fluctuations) preserves crucial voltage correlation features. This method resolves the “feature submergence” issue in conventional methods while improving computational efficiency.
(3)
A PGAT training paradigm is proposed. The loss function design incorporates customer power source uniqueness, transformer capacity constraints, and real-time power balance between customers and transformers. This ensures the learning paradigm adheres to grid topology and electrical characteristic constraints. Efficient learning of transformer–customer electrical information and connection patterns is achieved, significantly improving identification accuracy.

2. Transformer–Customer Relationship Identification Architecture for LVDG

Figure 1 illustrates the proposed two-stage transformer–customer relationship identification architecture for LVDG. In Stage 1, the MPAA algorithm based on voltage fluctuations preprocesses raw measurement data by compression and denoising. This establishes the data foundation for initial and refined identification. Next, the number of cluster K is set based on regional transformer counts. Customer electrical similarity is then extracted through the K-means algorithm. This achieves preliminary identification of transformer–customer relationships. The preliminary results from Stage 1 are then used to construct adjacency matrix A and feature matrix X, which serve as inputs for Stage 2. A PGAT network dynamically adjusts node feature aggregation weights, enabling efficient learning of transformer–customer electrical information and connection patterns. Finally, a physics-guided loss function L design paradigm is proposed. The paradigm forces the model to learn node representations that comply with grid topology and electrical characteristic constraints. The network is iteratively updated to refine identification results until the maximum training epochs are reached. The final output provides transformer–customer relationship identification results that satisfy physical principles of power.

3. Preliminary Identification of Transformer–Customer Relationships Using MPAA-K-Means

3.1. MPAA Algorithm Based on Voltage Fluctuation

Smart metering device data show high dimensionality, strong noise, and non-stationary characteristics. Therefore, an MPAA algorithm using voltage fluctuations is proposed to compress and denoise raw monitoring data. The original sequence is approximated with low-dimensional representations to reduce computational complexity in subsequent steps. The mathematical formulation is detailed as follows:
For a voltage time series V = { v 1 , v 2 , , v N } of length N, the PAA algorithm divides it into T time windows S = { S 1 , S 2 , , S T } . The kth value v ¯ k of the dimensionality-reduced series V ¯ = { v ¯ 1 , v ¯ 2 , , v ¯ T } can then be calculated using Equation (1).
v ¯ k = 1 S k i S k v i   ,       k = 1 , 2 , , T
where S k is the length of the window time. i S k is the time point i belonging to the time window S k .
However, the PAA algorithm employs averaging for dimensionality reduction, which fails to accurately capture the variation trends and morphological characteristics of the original voltage sequences [26]. To address this limitation, this paper proposes an indicator δ i to quantify voltage fluctuation intensity, followed by weighted aggregation to preserve the critical feature information of voltage sequences. The voltage fluctuation intensity δ i , accounting for both transient and steady-state fluctuations, can be calculated using Equation (2).
δ i = v i v i 1 Δ t + ψ v i v ¯ k ,     i S k
ϖ i = δ i j S k δ j ,       i S k
where δ i is the voltage fluctuation intensity of the voltage point v i at time i. Δ t is the sampling time interval. ψ is the penalty coefficient for steady-state fluctuations. i S k denotes all time points i belonging to the time window S k . ϖ i is the fluctuation weighting factor for the voltage point v i at time i.
Furthermore, based on Equation (4), a weighted aggregation is performed on the voltage sequence within time window S to obtain the weighted sequence V that accounts for voltage fluctuations. Each element v ˜ k in V ˜ = { v ˜ 1 , v ˜ 2 , , v ˜ T } can be calculated as follows:
v ˜ k = i S k ϖ i v i ,       k = 1 , 2 , , T

3.2. Preliminary Identification of Transformer–Customer Relationships Using Mpaa-K-Means

For the MPAA-compressed voltage time-series dataset X, electrical similarity among customers is explored using the K-means algorithm to achieve preliminary identification of transformer–customer relationships [27].
First, the number of clusters K = N T is set equal to the number of regional transformers N T , with initial cluster centers c 1 , c 2 , , c K randomly selected. The Euclidean distance between each customer’s voltage data and all cluster centers is computed, with customers assigned to the cluster represented by the nearest cluster center.
l i = arg min k c k x i 2 ,   i = 1 , 2 , , N U
where l i is the cluster label for customer i.
Subsequently, the mean value of each cluster is recalculated as new cluster centers according to Equation (6):
c k = 1 C k j C k x j ,   k = 1 , 2 , , K
where c k and C k denote the cluster center and customer set of the kth cluster, respectively. C k is the number of elements in set C k . j C k represents all customers belonging to set C k .
These two steps are then iteratively repeated until reaching the maximum iteration count, yielding cluster labels for all customers.
Finally, the geographic locations of customers within each cluster are averaged to obtain virtual center coordinates g k . The spatial distances between virtual centers and actual transformer coordinates are calculated. The transformer–cluster affiliation relationships are ultimately determined, accomplishing preliminary identification of transformer–customer relationships.
g k = 1 C k j C k l o n j , 1 C k j C k l a t j
where g k is the virtual center coordinates of cluster k. l o n j and l a t j denote the longitude and latitude of customer j, respectively.

4. Refined Identification Using PGAT

4.1. Graph Structured Representation of the Transformer–Customer Relationships Based on Preliminary Identification Results

The preliminary identification of transformer–customer relationships is obtained through the proposed MPAA-K-means algorithm. However, in areas with overlapping power supply radii, transformer–customer pairs with similar voltage characteristics are prone to misidentification. Clustering-based methods fail to consider the physical connection constraints of the distribution grid. To address these challenges, this paper employs graph structures to represent both transformer–transformer and transformer–customer connection relationships. A PGAT model is applied for the refined identification of transformer–customer relationships.
An adjacency matrix A N all × N all is constructed to represent the connection relationships between transformer nodes and customer nodes, where N all = N T + N U .
A = T T - U U - T U
where A i j = 1 denotes nodes i and j are connected in the graph topology, otherwise they are disconnected. T is transformer nodes, where transformers on the same distribution line are considered connected. T - U and U - T denote the connection relationships between transformer nodes and customer nodes, obtained from the preliminary identification of transformer–customer relationships. U is customer node and is a zero matrix.
Subsequently, the node feature matrix X N all ×   2 T is constructed to characterize the basic information of transformer nodes and customer nodes.
X = [ P 1 T P T T V 1 T V T T P 1 U P T U V 1 U V T U ]
where P t T is the active power load of all transformers at time t, with dimension N T × 1 . P t U is the power consumption of all customers at time t, with dimension N U × 1 . V t T is the voltage magnitude of all transformers at time t. V t U is the voltage magnitude of all customer nodes at time t.

4.2. Transformer–Customer Feature Extraction and Connection Refinement Using Modified GAT

(1)
Feature fusion based on GAT
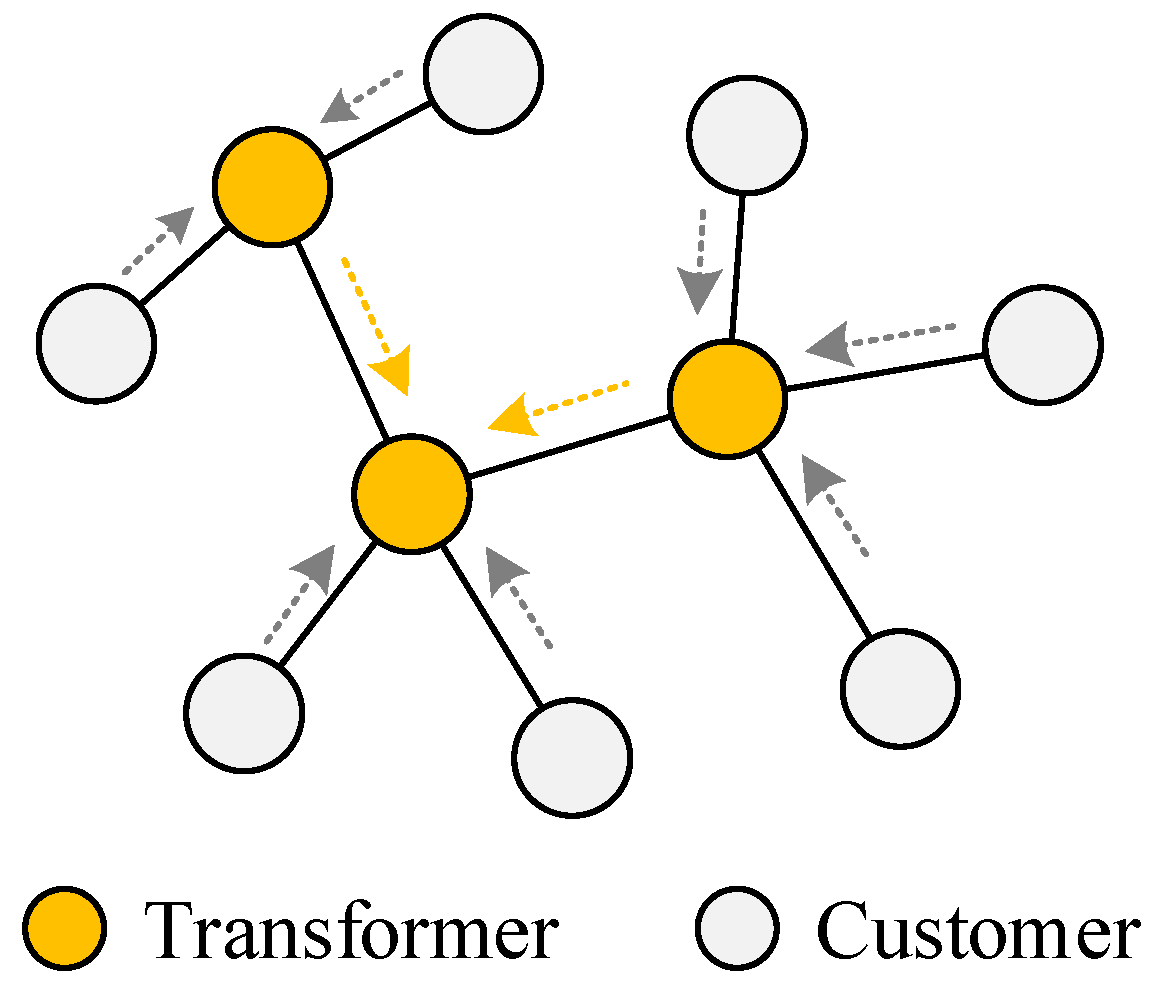
For adjacency matrix A and node feature matrix X, this paper employs a GCN-based GAT model to characterize the adjacency feature relationships among transformers and between transformers and customers. Figure 2 illustrates the hierarchical feature fusion process of GAT. The model first aggregates local features at the customer level. Then it captures characteristics at the system level through information interaction among transformer nodes. Finally, the attention mechanism dynamically adjusts feature fusion weights [28,29], enabling efficient learning of transformer–customer electrical information and connection patterns.
First, the adjacency matrix A undergoes a self-loop transformation by adding an identity matrix, ensuring both neighbor information and self-features are considered during feature aggregation. Meanwhile, a degree matrix is introduced to eliminate the feature dominance effect of high-degree nodes over low-degree nodes.
A = A + I
A = D 1 2 A D 1 2
where I is the identity matrix. A denotes the adjacency matrix after self-loop transformation. D denotes the degree matrix of A . A denotes the normalized adjacency matrix.
Subsequently, deep feature extraction of transformer–customer relationships is achieved through layer-wise feature propagation, with the graph convolution process for the matrix A described in Equation (12).
H l + 1 = σ ( A H l W l ) ,     l = 0 , 1 , , L
where σ ( · ) is the activation function. H l is the output features of the lth graph convolutional layer. L denotes the number of graph convolutional layers. W l denotes the learnable weight coefficients for the lth graph convolutional layer.
Finally, a multi-head attention mechanism is employed to dynamically adjust feature propagation weights between nodes. This mechanism suppresses erroneous connections from preliminary identification while enhancing aggregation weights for significant neighboring nodes. Consequently, potential topological relationships in the graph are accurately captured.
h i = d = 1 N d σ j N ( i ) α i j d W d h j
α i j = exp LeakyReLU a [ W h i W h j ] k N ( i ) exp LeakyReLU a [ W h i W h k ]
where h i is the output feature of node i after attention mechanism adjustment. Nd denotes the number of attention heads. N ( i ) denotes the neighboring nodes of node i. α i j is the attention weight coefficient. W is the weight parameter matrix. a denotes the attention parameter matrix.
As shown in Equation (13), the concatenation operation in multi-head attention generates more comprehensive node representations, preventing misidentification caused by single-feature bias. Furthermore, the influence of outliers on the model is significantly reduced, thereby enhancing the robustness and noise resistance of the model.
(2)
Proposed physics-guided loss function design paradigm
For the preliminary identification results of transformer–customer relationships, a cross-entropy loss function is employed to further enhance the model’s identification capability.
L CE = i = 1 N U k = 1 K y i , k ln ( ρ i , k )
where N U and K denotes the number of customers and transformers, respectively. y i , k denotes the true class distribution. It is 1 when customer i is connected to transformer k, otherwise it is 0. ρ i , k denotes the probability of customer i being assigned to transformer k.
However, in transformer–customer relationship identification tasks, conventional neural networks rely on cross-entropy loss functions for model updating and training, suffering from lack of physical constraints, sensitivity to noise, and poor interpretability. To address these issues, physical principles are incorporated into the loss function design of the GAT model. The radial topology of LVDG, capacity safety rules, and energy conservation laws are innovatively and explicitly integrated into the GAT model. This approach forces the model to learn node representations that conform to grid topology and electrical characteristic constraints.
(a)
Single power supply operation for customers
In LVDG, a customer can only be connected to a single transformer during normal operation. It should be noted that dual-power customers may temporarily connect to two power sources (during short-term low-voltage loop switching), but they never maintain dual-power operation simultaneously.
L single = i = 1 N U ln max k T ρ i , k + i = 1 N U 1 max k T ρ i , k 2
where L single denotes the single-power-supply loss function for customers. T denotes the transformer set.
(b)
Transformer capacity constraint
L cap = k T ReLU i Ω k P i , max U S k rated
where L cap is the transformer capacity constraint loss function. P i , max U is the maximum power of customer i. S k rated is the rated capacity of transformer k. i Ω k denotes the set of all customers connected to transformer j. ReLU( ) denotes the rectified linear unit, which activates the penalty term when a transformer’s expected maximum load exceeds its rated capacity.
(c)
Real-time power balance between transformers and customers
This paper proposes a real-time power balance loss function between transformers and customers, enforcing precise matching between predicted transformer loads and the total load of connected customers. Considering measurement errors and line losses, the power relationship between transformers and their supplied customers should satisfy the following:
P k , t T = i Ω k P i , t U + ε t ,     k T
where P k , t T is the actual power value of transformer k at is the error term. P i , t U represents the power of user i at time t  ε t represents the error term caused by measurement errors and line losses.
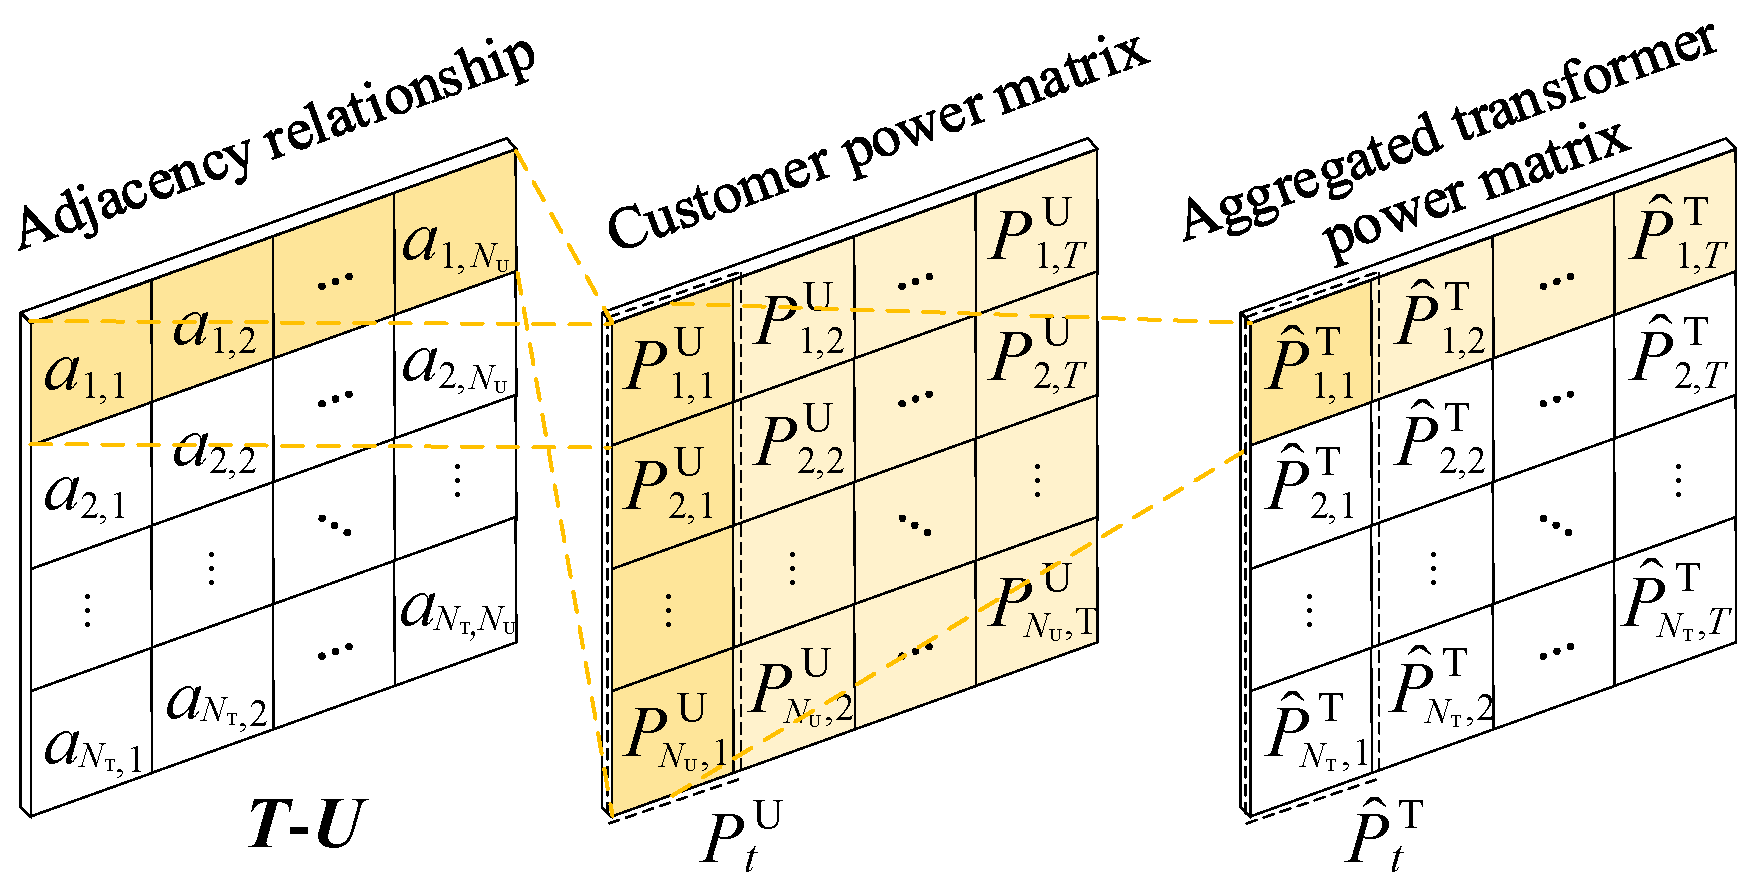
Furthermore, Figure 3 illustrates the customer load aggregation process considering power balance. T-U is the adjacency matrix between transformers and customers, obtained from preliminary transformer–customer relationship identification. P ^ k , t T is the aggregated power value of transformer k at time t, derived from customer load aggregation. P t U is the total power consumption of all customers at time t. P ^ t T is the aggregated power value of all transformers at time t, calculated from customer load aggregation. Equation (18) presents the loss function incorporating real-time power balance between transformers and customers.
L balance = t = 1 T Re LU P ^ t T P t T ε t 2
P ^ t T = T - U P t U
where L balance is the real-time power balance loss function, which is the loss function that arises from the difference between the actual power of a transformer and the aggregated power of customers that are predicted to be connected to this transformer.
In summary, the proposed physics-guided loss function L can be expressed as
L = L CE + λ 1 L single + λ 2 L cap + λ 3 L balance
where λ 1 , λ 2 , λ 3 denote the coefficients for electrical constraint loss terms.
The physics-guided loss function ensures that the transformer–customer relationship identification results strictly adhere to the radial topology and safe capacity constraints of distribution grids, achieving a deep integration of electrical physics principles with data-driven learning.

5. Two-Stage Transformer–Customer Relationship Identification Process for LVDG Using PGAT

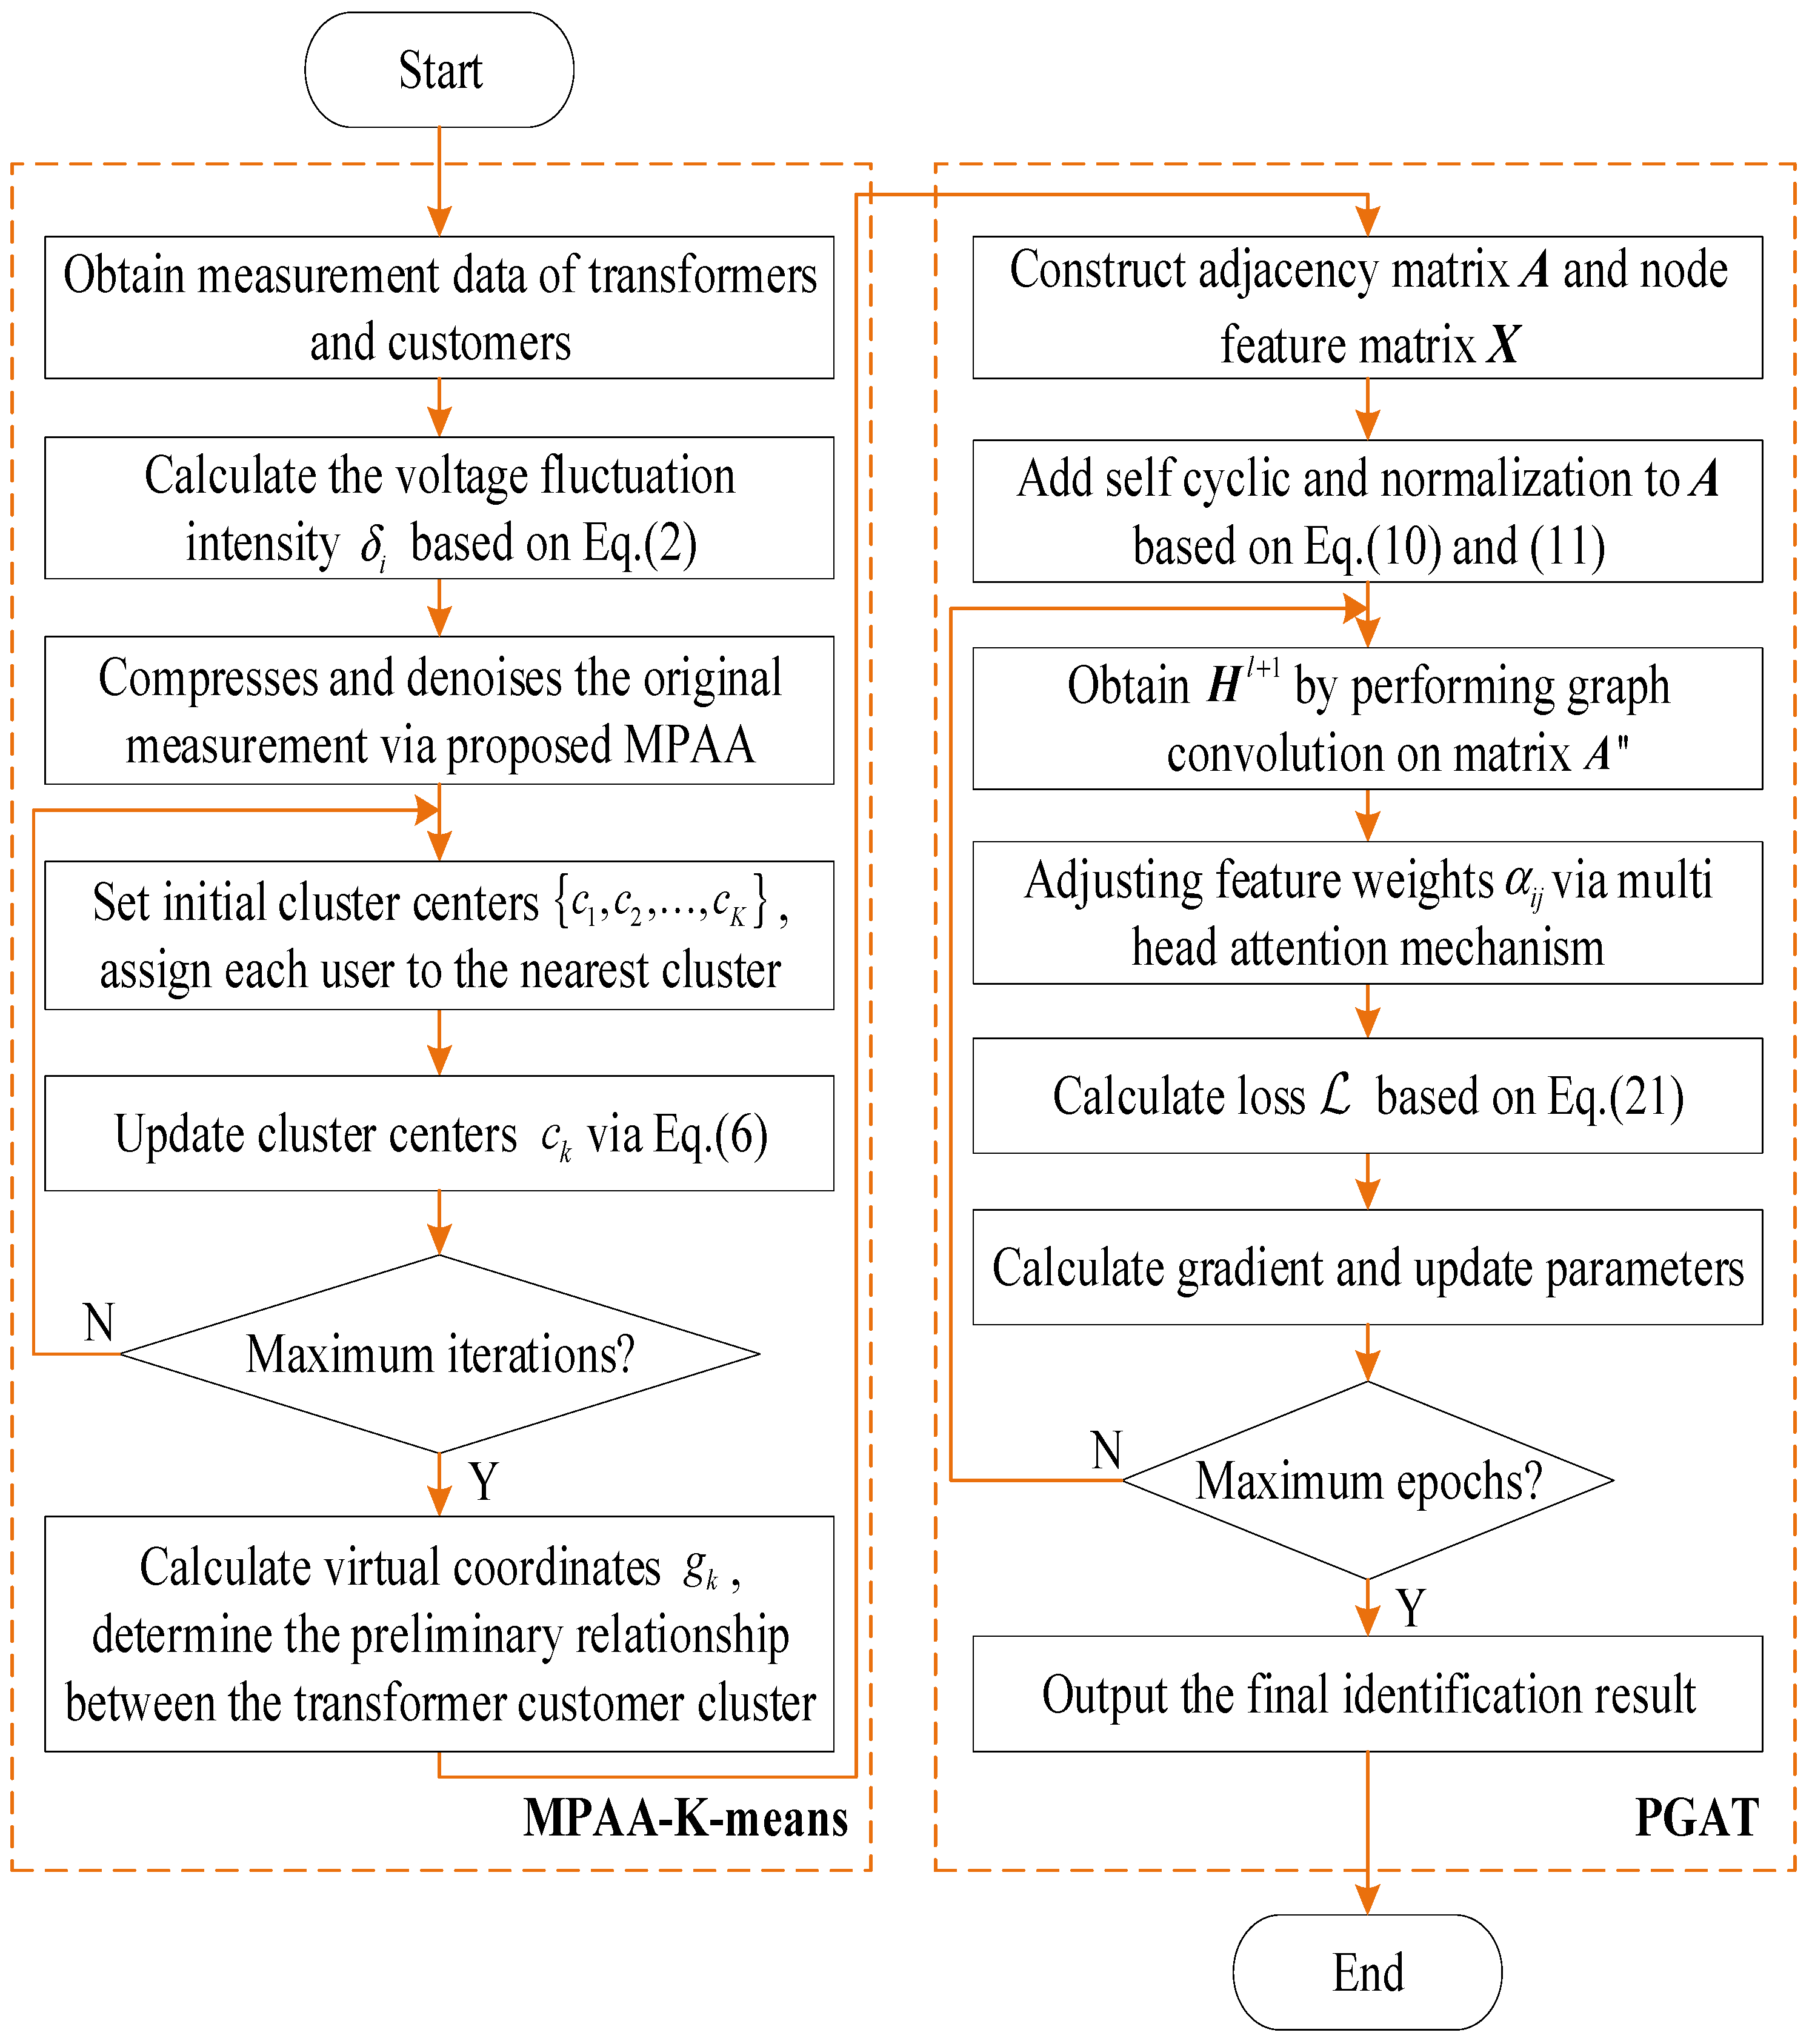
The proposed two-stage identification process for transformer–customer relationships in LVDG is illustrated in Figure 4. Initially, the voltage fluctuation intensity between transformers and customers is calculated, and the raw measurement data are compressed and denoised using the MPAA algorithm. Subsequently, K cluster centers c 1 , c 2 , , c K are initialized according to the number of transformers and iteratively updated using Equation (6) until convergence. Preliminary identification of transformer–customer relationships is achieved by matching the virtual cluster center coordinates g of customer groups with transformer geographical locations. Then, the adjacency matrix A and feature matrix X are constructed based on the preliminary identification results. A GAT based on the multi-head attention mechanism is employed for node feature aggregation and learning. Finally, the physics-guided loss function L is computed using Equation (21) to update network parameters. The identification results are iteratively refined until reaching maximum training epochs, ultimately yielding transformer–customer relationships that comply with electrical and physical principles.

6. Case Studies

6.1. Case Configuration

The proposed two-stage identification strategy for transformer–customer in LVDG relationships is validated through experimental tests on a practical LVDG in a specific region. The test grid consists of 7 transformers serving 391 customers. The number of customers connected to each transformer is presented in Table 1. The information database contains power consumption records for each user and their electricity usage data from 1 July to 31 July 2024. The sampling interval is set at 15 min intervals. The measurement accuracy of voltage data maintains an error margin of ± 2%. The dataset is partitioned into training (70%), validation (15%), and test (15%) sets. The coefficients for electrical constraint loss terms are set as λ 1 = 0.005, λ 2 = 0.01, and λ 3 = 0.01. Voltage data are collected from the AMI system from 1 July to 31 July 2024, with a sampling interval of 15 min. The measurement accuracy of voltage data is maintained within ± 2%. The computational environment comprises an i5-14600kF CPU, RTX4070s GPU, and 32 GB RAM, with simulation platforms Matlab2021b and TensorFlow.

6.2. Analysis of the Model Training Process

The PGAT model is configured with two hidden layers. The numbers of units in hidden layers are set to 128 and 256, respectively. The learning rate is set to 0.001. The dropout rate is set to 0.4. The Adam optimizer is employed with 500 epochs. Figure 5 presents the convergence curve of the training loss function for the PGAT model. As shown in Figure 5, the initial training loss is relatively high. This results from insufficient representation capability caused by random weight initialization. However, the training loss decreases rapidly as epochs increase, achieving significant convergence in about 100 epochs. This indicates that the initial identification results from Stage 1 provide high-quality input data for the model. Subsequently, the model examines deeper relationships between electrical similarity and topology. This ensures node feature aggregation aligns with operational characteristics of the LVDG. The loss eventually stabilizes with fluctuations around 0.42. This confirms that the physics-guided approach improves model convergence and feature representation.

6.3. Results of Transformer–Customer Relationship Identification

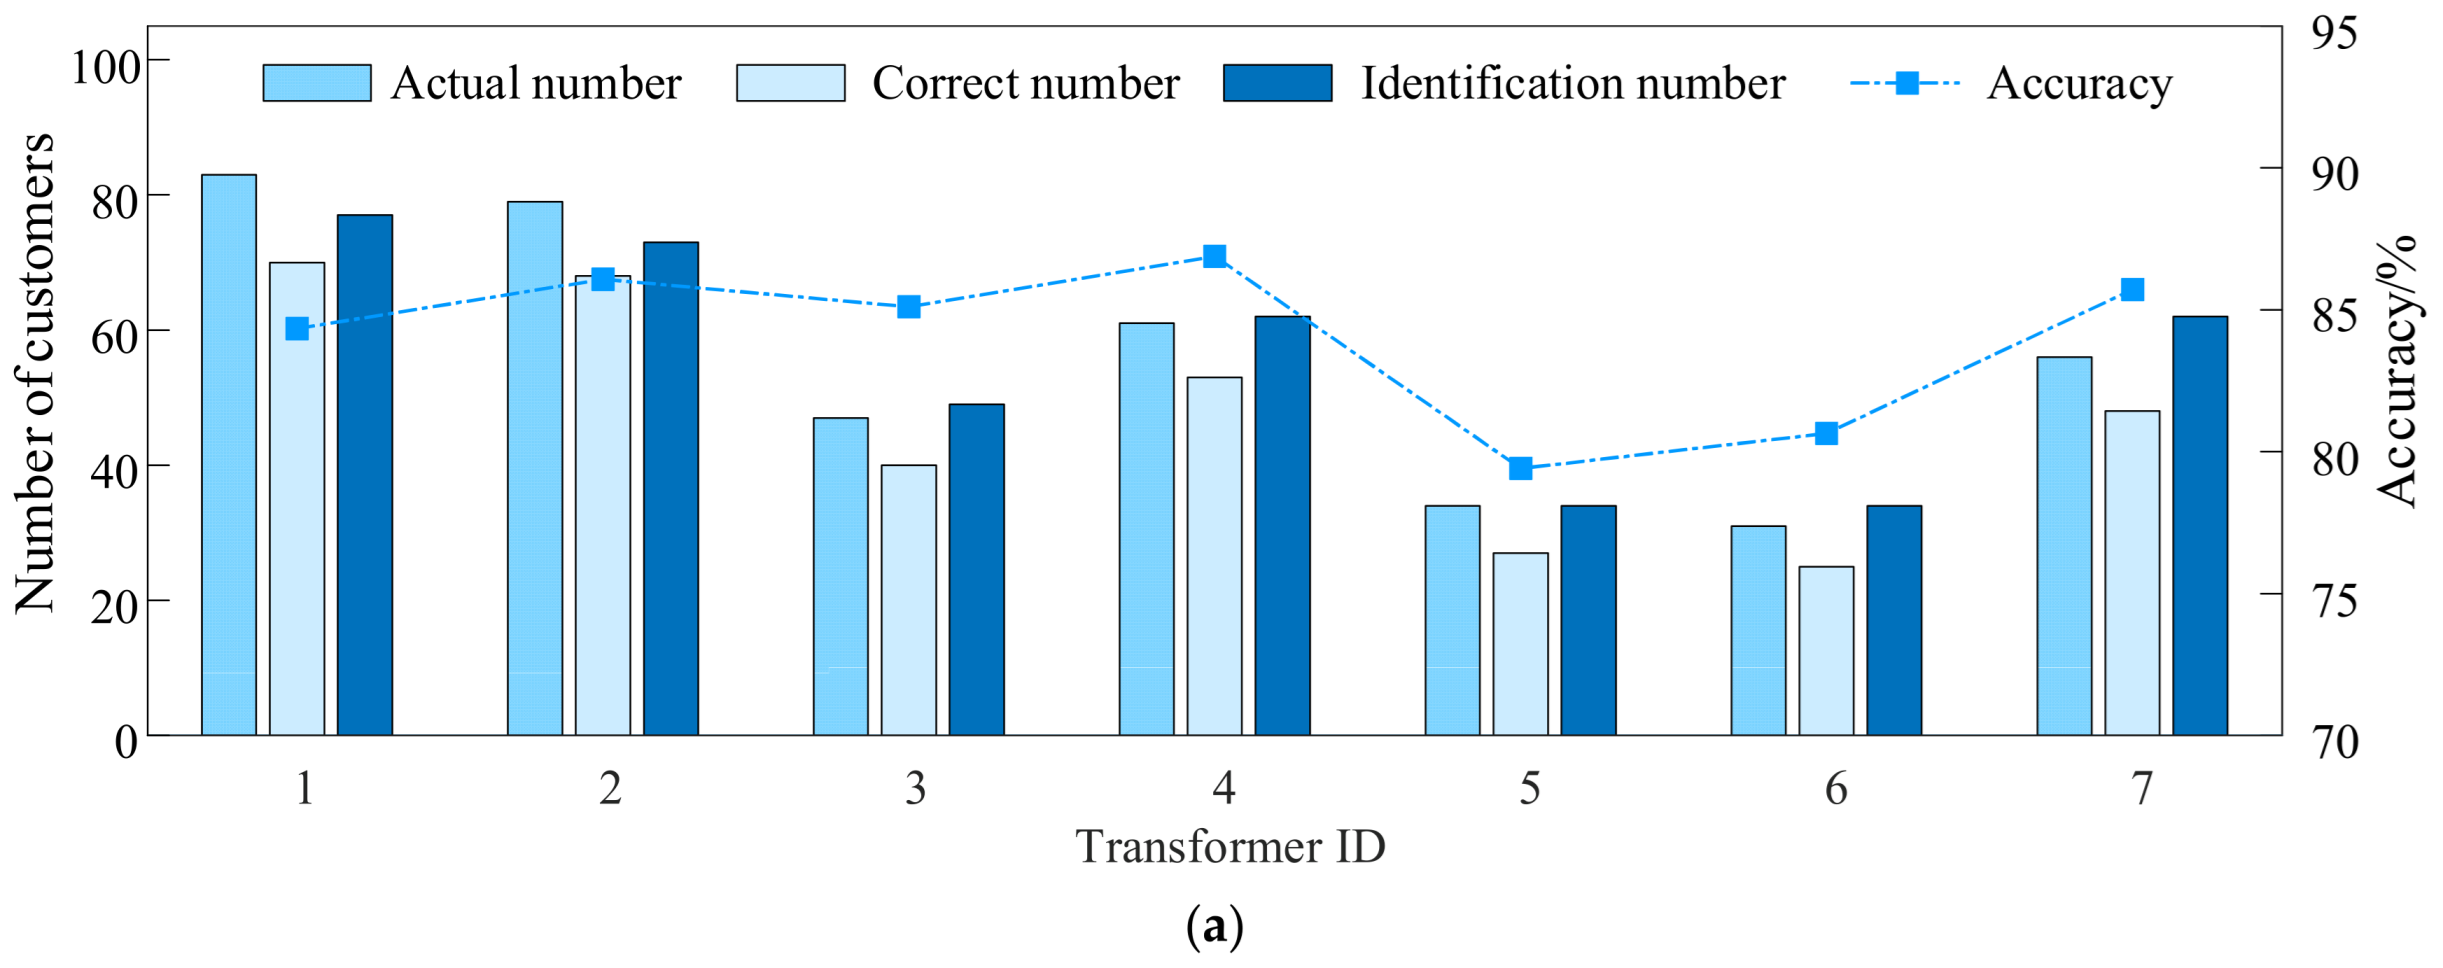
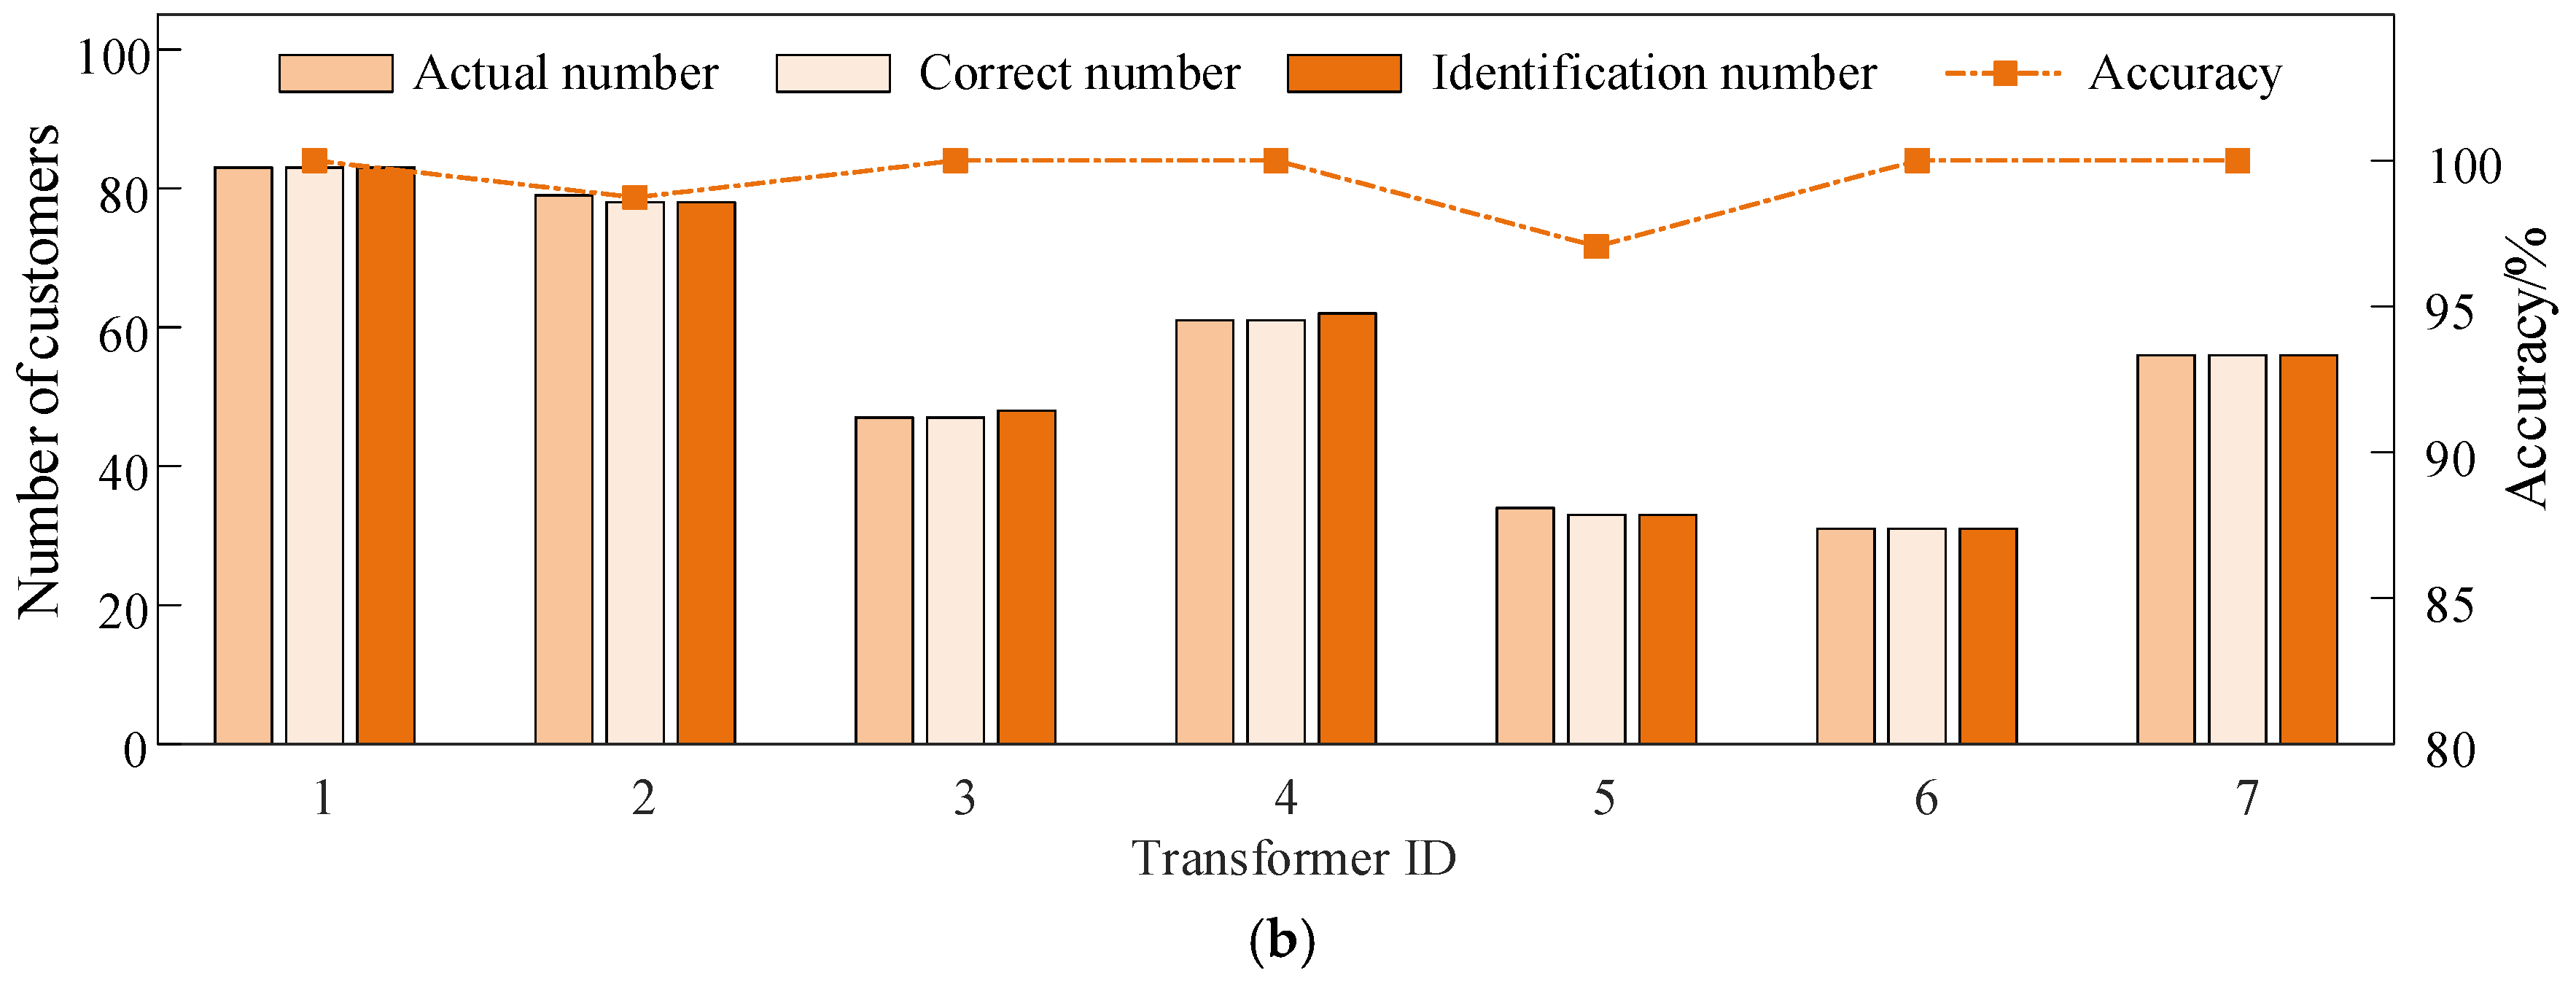
Figure 6 and Figure 7 present the identification results and accuracy of the proposed two-stage transformer–customer relationship identification strategy, respectively. In Figure 6, dark blocks denote connected transformer–customer relationships while white blocks denote unconnected ones. As shown in Figure 6 and Figure 7, the proposed two-stage strategy using PGAT effectively captures complex transformer–customer relationship patterns. The method performs refinement based on preliminary results, achieving accurate identification of actual transformer–customer connections. For the results of Stage 1, the proposed MPAA-K-means algorithm initially clusters customers to their corresponding transformers. A total of 331 customers are correctly identified with an accuracy of 84.65% in this stage. Taking Transformer 1 as an example, while it serves 83 customers, the preliminary stage identifies 77 customers. Among these, 70 are correctly identified, yielding a preliminary accuracy of 84.34% for this transformer. In Stage 2, the proposed PGAT model learns electrical coupling relationships between nodes through graph attention mechanisms. The model refines preliminary results by incorporating power grid physical constraints. The final identification achieves 99.49% accuracy, demonstrating precise transformer–customer relationship identification.

6.4. Comparison of Different Methods

To validate the superiority of the proposed two-stage transformer–customer identification algorithm, four comparative methods are implemented for simulation verification. Method 1: Voltage correlation-based K-means clustering of customer voltage data [27]. Method 2: The proposed MPAA algorithm for measurement data compression and denoising, followed by K-means clustering (i.e., the stage 1 MPAA-K-means method in this paper). Method 3: Based on Method 2, the GAT model is adopted for refined identification. Method 4: The proposed two-stage transformer–customer identification strategy.
Figure 8 shows the accuracy of all methods across seven transformers. Table 2 summarizes the identification results of each method. Method 1 shows significant accuracy fluctuations due to its direct K-means clustering on raw voltage data without noise filtering or relationship modeling. The lowest accuracy (70.97%) occurs for Transformer 6. Method 2 achieves more stable clustering (84.65% accuracy) through MPAA-based preprocessing that effectively removes noise and redundant information. This represents a 3.83% improvement over Method 1. Method 3 addresses the limitations of K-means in complex relationship modeling through refined identification based on the results of MPAA-K-means. The proposed method embeds LVDG characteristics into the training paradigm, significantly improving both accuracy and stability. It achieves 99.49% accuracy, representing a 5.37% improvement over Method 3. The effectiveness and superiority of the proposed physics-guided embedding paradigm are thus verified. The proposed method incorporates electrical characteristic constraints of low-voltage distribution networks into the model training paradigm, significantly improving recognition accuracy and stability. In summary, the significant advantages of the method proposed in this paper for the task of transformer–customer relationship identification are validated.

6.5. Analysis of Model Sensitivity

Finally, to analyze the impact of AMI measurement noise on model performance, Figure 9 presents the identification accuracy of the four methods under different noise levels. The results show that while all methods experience accuracy decline with increasing noise levels, their extent of decline differs significantly. Method 1 demonstrates the highest sensitivity to noise, with an average accuracy reduction of 4.73% per 4% noise increase. This occurs primarily because noise significantly distorts voltage distribution characteristics, leading to clustering errors. Method 2 employs the MPAA algorithm for data compression and denoising preprocessing, providing K-means with input data that better approximate true characteristics. An average accuracy reduction of 3.41% per 4% noise increase is shown. However, the limited clustering capability of K-means still constrains its performance under high noise conditions. Method 3 mitigates noise interference on local features through attention mechanism-based dynamic node weighting.

7. Conclusions

This paper proposes a two-stage transformer–customer relationship identification strategy for LVDG. The MPAA-K-means algorithm is employed to mine feature similarity among customers for preliminary identification. Based on this foundation, a physics-guided loss function is designed. The PGAT model characterizes node features according to grid topology and electrical constraints. This enables more accurate identification of transformer–customer relationships. Experiments conducted across seven different distribution areas yield the following conclusions:
(1)
The proposed two-stage transformer–customer relationship identification strategy achieves preliminary identification through the MPAA-K-means algorithm. The PGAT model further learns the electrical coupling relationships between transformers and customers, incorporating grid physical constraints for refined identification. The strategy achieves a final identification accuracy of 99.49%, demonstrating efficient learning and precise identification of transformer–customer association patterns.
(2)
Comparative experiments validate that the MPAA algorithm effectively compresses and denoises measurement data while preserving voltage correlation features, significantly improving K-means clustering stability. The proposed PGAT model embeds the electrical constraints of LVDG into the training paradigm. The proposed model achieves 5.37% higher identification accuracy compared to conventional GAT models.
(3)
The proposed two-stage strategy demonstrates superior noise resistance performance. The attention mechanism dynamically adjusts node weights to effectively address challenges posed by AMI measurement noise. For every 4% increase in noise, the identification accuracy reduces by only 2.09% on average. This provides an effective solution for accurate and reliable transformer–customer relationship identification in practical grid operations.
Future research will explore the application of the proposed method further in complex scenarios involving distributed energy and electric vehicle charging stations. The study will focus on integrating incremental learning with stream processing techniques to achieve real-time dynamic identification and maintenance of transformer–consumer relationships, thereby enhancing the flexibility and resilience of smart grids.

Author Contributions

Conceptualization, Y.L.; Methodology, F.Y.; Software, Y.F.; Validation, Y.L.; Formal analysis, Y.F.; Investigation, F.Y.; Resources, Y.F.; Data curation, W.H.; Writing—original draft, W.H.; Writing—review & editing, Y.C.; Visualization, Y.C.; Supervision, Y.F. All authors have read and agreed to the published version of the manuscript.

Funding

This research and APC was funded by Science and Technology Project of State Grid Corporation of China grant number [5400-202322566A-3-2-ZN].

Data Availability Statement

The original contributions presented in the study are included in the article, further inquiries can be directed to the corresponding author.

Conflicts of Interest

Authors Yang Lei, Fan Yang and Wei Hu were employed by the company Power Science Research Institute of State Grid Hubei Electric Power Co. Author Yanjun Feng was employed by the company Power Science Research Institute of State Grid Shanxi Electric Power Co. The remaining authors declare that the research was conducted in the absence of any commercial or financial relationships that could be construed as a potential conflict of interest.

References

  1. Fang, L.; Pengwah, A.B.; Andrew, L.L.; Razzaghi, R.; Muñoz, M.A. Three-phase voltage sensitivity estimation and its application to topology identification in low-voltage distribution networks. Int. J. Electr. Power Energy Syst. 2024, 158, 109949. [Google Scholar] [CrossRef]
  2. Wu, W.; Zhou, Y.; Li, P.; Sun, G.; Lin, H.; Xu, G. Survey on negative line loss rate of transformer region: Rectification measures and challenges. AIP Adv. 2020, 10, 045124. [Google Scholar] [CrossRef]
  3. Ashok Babu, P.; Mazher Iqbal, J.L.; Siva Priyanka, S.; Jithender Reddy, M.; Sunil Kumar, G.; Ayyasamy, R. Power control and optimization for power loss reduction using deep learning in microgrid systems. Electr. Power Compon. Syst. 2024, 52, 219–232. [Google Scholar] [CrossRef]
  4. Wang, Y.; Xie, L.; Liu, F.; Yu, K.; Zeng, X.; Bi, L.; Tang, X. Fault location method for distribution network Considering distortion of traveling wavefronts. Int. J. Electr. Power Energy Syst. 2024, 159, 110065. [Google Scholar] [CrossRef]
  5. Wang, X.; Guo, Q.; Tu, C.; Che, L.; Xu, Z.; Xiao, F.; Li, T.; Chen, L. A Comprehensive Control Strategy for F-SOP Considering Three-Phase Imbalance and Economic Operation in ISLDN. IEEE Trans. Sustain. Energy 2024, 16, 149–159. [Google Scholar] [CrossRef]
  6. Al Khafaf, N.; Rezaei, A.A.; Amani, A.M.; Jalili, M.; McGrath, B.; Meegahapola, L.; Vahidnia, A. Impact of battery storage on residential energy consumption: An Australian case study based on smart meter data. Renew. Energy 2022, 182, 390–400. [Google Scholar] [CrossRef]
  7. Chen, Z.; Amani, A.M.; Yu, X.; Jalili, M. Control and optimisation of power grids using smart meter data: A review. Sensors 2023, 23, 2118. [Google Scholar] [CrossRef]
  8. Ge, H.; Xu, B.; Zhang, X.; Bi, Y. Low-voltage overhead lines topology identification method based on high-frequency signal injection. Arch. Electr. Eng. 2021, 70, 791–800. [Google Scholar]
  9. Byun, H.J.; Zheng, Y.P.; Choi, S.J.; Shon, S.G. New identification method for power transformer and phase in distribution systems. Appl. Mech. Mater. 2018, 878, 291–295. [Google Scholar] [CrossRef]
  10. von Meier, A.; Stewart, E.; McEachern, A.; Andersen, M.; Mehrmanesh, L. Precision micro-synchrophasors for distribution systems: A summary of applications. IEEE Trans. Smart Grid 2017, 8, 2926–2936. [Google Scholar] [CrossRef]
  11. Blakely, L.; Reno, M.J. Identification and correction of errors in pairing AMI meters and transformers. In Proceedings of the 2021 IEEE Power and Energy Conference at Illinois (PECI), Urbana, IL, USA, 1–2 April 2021; IEEE: New York, NY, USA, 2021; pp. 1–8. [Google Scholar]
  12. Zhou, L.; Wen, F.; Yang, X.; Zhong, Y. User-transformer connectivity relationship identification based on knowledge-driven approaches. IEEE Access 2022, 10, 54358–54371. [Google Scholar] [CrossRef]
  13. Liu, J.; Zang, W.; Lu, Y.; Zhang, Y.; Cong, R. Transformer-customer Relationship and Phase Identification Method of Low-voltage Distribution Networks Based on Critical Time Segments. J. Phys. Conf. Ser. 2023, 2666, 012010. [Google Scholar]
  14. Song, J.; Jiang, Y.; Wei, Y.; Sheng, Z.; Song, X. Consumer-Transformer Relationship Identification Based on Improved FCM Clustering. In Proceedings of the 2024 5th International Conference on Clean Energy and Electric Power Engineering (ICCEPE), Yangzhou, China, 9–11 August 2024; IEEE: New York, NY, USA, 2024; pp. 863–868. [Google Scholar]
  15. Al Khafaf, N.; Song, H.; McGrath, B.; Jalili, M. Identification of low voltage distribution transformer–customer connectivity based on unsupervised learning. Energy Rep. 2023, 9, 72–79. [Google Scholar] [CrossRef]
  16. Ren, H.N.; Wang, Y.; Li, J.; Cai, H.D.; Wei, W. Dynamic identification of customer-transformer relationship based on Bayesian inference and spectral clustering. Power Syst. Prot. Control. 2023, 51, 1–10. [Google Scholar]
  17. Zhu, Y.; Yang, X.; Yan, H. Data-driven identification of household-transformer relationships in power distribution networks using Hausdorff similarity assessment. Front. Energy Res. 2023, 11, 1233827. [Google Scholar] [CrossRef]
  18. Huang, L.; Zhou, G.; Zeng, Y.; Zhang, J.; Feng, Y. Transformer-customer relationship identification based on deep Gaussian mixture model in low-voltage distribution system. Electr. Power Syst. Res. 2024, 234, 110591. [Google Scholar] [CrossRef]
  19. Zhang, Y.; Yi, Y.; Deng, W.; Liu, S.; Zhou, L.; Lin, K.; Cai, Y. Consumer-branch connectivity identification of low voltage distribution networks based on data-driven approach. Prot. Control. Mod. Power Syst. 2024, 9, 69–82. [Google Scholar] [CrossRef]
  20. Liao, Z.; Liu, Y.; Wang, B.; Tao, W. Topology Identification of Active Low-Voltage Distribution Network Based on Regression Analysis and Knowledge Reasoning. Energies 2024, 17, 1762. [Google Scholar] [CrossRef]
  21. Zhao, J.; Xu, M.; Wang, X.; Zhu, J.; Xuan, Y.; Sun, Z. Data-driven based low-voltage distribution system transformer-customer relationship identification. IEEE Trans. Power Deliv. 2021, 37, 2966–2977. [Google Scholar] [CrossRef]
  22. Li, L.; Zhao, J.; Wang, X.; Xu, Z.; Zhu, Y. Transformer-customer connectivity relationship identification for low-voltage distribution system with high penetration of household PV systems. IEEE Trans. Smart Grid 2024, 16, 356–368. [Google Scholar] [CrossRef]
  23. Hu, H.; Zhao, J.; Bian, X.; Xuan, Y. Transformer-customer relationship identification for low-voltage distribution networks based on joint optimization of voltage silhouette coefficient and power loss coefficient. Electr. Power Syst. Res. 2023, 216, 109070. [Google Scholar] [CrossRef]
  24. Liu, L.; Shi, N.; Wang, D.; Ma, Z.; Wang, Z.; Reno, M.J.; Azzolini, J.A. Voltage calculations in secondary distribution networks via physics-inspired neural network using smart meter data. IEEE Trans. Smart Grid 2024, 15, 5205–5218. [Google Scholar] [CrossRef]
  25. Hu, X.; Hu, H.; Verma, S.; Zhang, Z.-L. Physics-guided deep neural networks for power flow analysis. IEEE Trans. Power Syst. 2020, 36, 2082–2092. [Google Scholar] [CrossRef]
  26. Hu, L.; Wang, L.; Chen, Y.; Hu, N.; Jiang, Y. Bearing fault diagnosis using piecewise aggregate approximation and complete ensemble empirical mode decomposition with adaptive noise. Sensors 2022, 22, 6599. [Google Scholar] [CrossRef]
  27. Ahmed, M.; Seraj, R.; Islam, S.M.S. The k-means algorithm: A comprehensive survey and performance evaluation. Electronics 2020, 9, 1295. [Google Scholar] [CrossRef]
  28. Liao, W.; Yang, D.; Liu, Q.; Jia, Y.; Wang, C.; Yang, Z. Data-driven reactive power optimization of distribution networks via graph attention networks. J. Mod. Power Syst. Clean Energy 2024, 12, 874–885. [Google Scholar] [CrossRef]
  29. Brody, S.; Alon, U.; Yahav, E. How attentive are graph attention networks? arXiv 2021, arXiv:2105.14491. [Google Scholar]
Figure 1. Proposed two-stage transformer–customer relationship identification architecture for LVDG.
Energies 18 04380 g001
Figure 2. Schematic diagram of feature fusion of GAT.
Energies 18 04380 g002
Figure 3. Customer load aggregation process considering power balance.
Energies 18 04380 g003
Figure 4. Proposed two-stage identification process for transformer–customer relationships in LVDG.
Energies 18 04380 g004
Figure 5. Convergence curve of the training loss function for the PGAT model.
Energies 18 04380 g005
Figure 6. Results of the proposed two-stage transformer–customer relationship identification. (a) Preliminary identification result of Stage 1. (b) Refined identification results of Stage 2.
Energies 18 04380 g006
Figure 7. Accuracy of the proposed two-stage transformer–customer relationship identification. (a) Preliminary identification accuracy of Stage 1. (b) Refined identification accuracy of Stage 2.
Energies 18 04380 g007aEnergies 18 04380 g007b
Figure 8. Accuracy of all methods across 7 transformers.
Energies 18 04380 g008
Figure 9. Identification accuracy of four methods under different noise levels.
Energies 18 04380 g009
Table 1. Number of customers connected to each transformer.
Transformer IDNumber of Customers
183
279
347
461
534
631
756
Table 2. Identification results of four methods on 391 customers.
Correctly Identified Household CountIncorrectly Identified Household CountAccuracy/%
Method 13167580.82
Method 23316084.65
Method 33682394.12
Method 4389299.49
Disclaimer/Publisher’s Note: The statements, opinions and data contained in all publications are solely those of the individual author(s) and contributor(s) and not of MDPI and/or the editor(s). MDPI and/or the editor(s) disclaim responsibility for any injury to people or property resulting from any ideas, methods, instructions or products referred to in the content.