Article

Global Energy Trajectories: Innovation-Driven Pathways to Future Development

by
Yuri Anatolyevich Plakitkin
1,
Andrea Tick
2,*,
Liudmila Semenovna Plakitkina
3 and
Konstantin Igorevich Dyachenko
3
1
Center for Analysis and Innovation in Energy, Energy Research Institute of the Russian Academy of Sciences (ERIRAS), 117186 Moscow, Russia
2
Department of Business Sciences and Digital Skills, Keleti Karoly Faculty of Business and Management, Obuda University, Tavaszmező Str. 17, 1084 Budapest, Hungary
3
Center of Research of World and Russian Coal Industry, Energy Research Institute of the Russian Academy of Sciences (ERIRAS), 117186 Moscow, Russia
*
Author to whom correspondence should be addressed.
Energies 2025, 18(16), 4367; https://doi.org/10.3390/en18164367 (registering DOI)
Submission received: 30 April 2025 / Revised: 6 August 2025 / Accepted: 11 August 2025 / Published: 16 August 2025

Abstract

In recent years, experts have associated forecasts of global energy consumption with energy transitions. This paper presents the research results of the paths and trajectories of the global transformations of world energy, including demographic, technological, energy, transport, and communication changes. After demonstrating the long-term trends in global energy consumption, fossil and renewable energy sources, and nuclear energy using neuroforecasting methods, this study explains global demographic development and its relationship with global innovation and technological processes as explained by the flow of global patent applications. The relationship between energy transition and the previously mentioned two factors is also justified based on the trajectories developed by the neural network forecasting. By leveraging the fundamental laws of energy conservation, robust patterns in the evolution and development of global energy could be identified. It is demonstrated that mankind has entered the era of four closely interconnected global transitions: demographic, energy, technological, and political–economic, all at once. According to the results, civilizational changes are currently taking place in global energy advancement, indicating an energy transition to a new quality of energy development. The permanent growth patterns of the energy density of energy sources used and their impact on labor productivity and the speed of movement of people and goods in the economy are also discussed. Finally, the contour of future developments in energy technologies is determined. It is also forecast that future energy technologies are expected to be largely associated with the exploration of outer space, development of robotics, and the expansion of artificial intelligence capabilities.

1. Introduction

Recently, many experts have associated global energy consumption forecasting with energy transition. Some identify such a transition with the implementation of the so-called “climate agenda” [1,2], or with the decarbonization of the global economy [3,4] and the development of “green” energy, or even with the replacement of certain energy sources with others [5]. This identification is valid, although only partially so. In addition to local energy source transitions [6,7,8] which have been taking place in the energy sector for many years and are not at all related to climate change, there is also a global energy transition, the implementation of which is accompanied by civilizational development, namely demographic, technological, and geopolitical, affecting the future nature of global development [9,10].
To navigate the path toward the future, one must not only focus on the immediate steps to avoid stumbling but also look ahead to make informed decisions about the direction of progress. Those who can envision a plausible long-term future tend to make fewer errors in the present.
Energy is a driving force behind natural phenomena and a core aspect of scientific study, which has its own laws and patterns of development, and ignoring them can lead to negative consequences in the future. Therefore, considering scientific viewpoints, energy dictates the necessity of “seeing further than the visible”, that is, not only into the immediate future but also to the long-term horizons of energy advancement.
Energy resides in the foundational strata of social product redistribution and influences all economic sectors. Energy is crucial for social, demographic, and economic growth, as stated by Johnstone [11] and supported by Hall et al.’s energy return on investment (EROI) calculations, which assess the minimal energy required to fulfill a society’s needs and ambitions at each tier of the Hierarchy of Society [12]. The minimum energy intensity is increasing at all levels of the Hierarchy of Society, and the extent of the energy surplus significantly influences the quality and advancement of technology.
The scientific novelty of this research is threefold. While statistical methods, such as ARIMA, SARIMA, or MAPE regression, have been used to forecast energy consumption trends for a sustainable energy future and provide insight into energy patterns [3,13,14], the present research applies neural forecasting combined with a ‘reverse’ forecasting method to substantiate future energy technologies implemented in the long run, and to establish the global patterns of energy development and the global technological process developed by the authors. Neural networks have already been used in energy forecasting, mainly in the context of renewable energy, with a focus on their performance. Convolutional Neural Networks (CNNs), Multilayer Perception (MLP) Networks and Recurrent Neural Networks (RNNs) have been applied specifically to predict photovoltaic solar power or electricity load and price [15,16,17]. Artificial Neural Networks (ANNs) have already been applied in various aspects of energy forecasting owing to their ability to handle nonlinear relationships and large datasets; however, they either consider local energy consumption forecasting [18,19,20] or short-term forecasting [19]. The Echo State Network (ESN) model restricts forecasting to short-term energy consumption [21]. MLP networks have been used for solar energy and wind velocity, restricting the use of ANN to the forecasting of a single energy source [22,23]. Furthermore, in certain cases, ARIMA was combined with neural networks to provide short-term energy forecasting [24], and deep neural networks were also applied to mid-term electricity load forecasting [25].
In contrast, this study integrates demographics, technological innovation, speed of movement, and energy density to forecast energy transitions. To address the challenges of uncertainty and entropy in forecasting, we have anchored our approach in fundamental laws, particularly the law of conservation of energy. By leveraging this principle, we were able to identify robust patterns in the evolution and development of global energy.
Analyzing the patterns of the implementation of global transformations helps shape the dynamics of future technological breakthroughs. Simultaneously, information and communication innovations will influence the development of new global economic segments. The findings outline the future development of energy technologies. The long-term neural network forecast results of global railway and sea transportation volumes are also presented, which enables the substantiation of the main directions of the transport and communication transition associated with the increase in the volume of aerospace transportation.
Third, the neural network-based forecast allows the authors to define the energy crossroads, and it justifies that further development requires the utilization of outer space.
This research primarily focuses on the paths and trajectories of global energy development and aims to confirm the patterns of global development of world energy with the help of neural modeling. The primary focus is on the development patterns of global energy within the framework of energy cycle theory, concentrating on physical energy and its transformations. This paper does not address social, climate, energy poverty, or equitable access issues.
The paper is organized as follows: after detailing the Research Design and Methodology and providing justification for neural network forecasting, global trends in demographic and energy transitions are discussed. Subsequent sections present future energy transition scenarios and trajectories in light of technological innovation. Finally, the Section 6 outlines some forecast contours of future energy.

2. Research Design and Research Methodology

The research methodology is based on a complex combination of laws and patterns of global energy development with neural network methods to forecast the consumption of the main energy sources—coal, oil, gas, and renewable energy—up to the end of the 21st century [26].
The analysis of worldwide transformations, including those related to demographics, technology, energy, transportation, and communication, as well as the use of the fundamental laws of physics in the assessment of the development of global energy, served as the basis for the formulation of laws and patterns in the global energy transition. The application of these fundamental laws enabled the elimination of implausible development scenarios, which significantly increased the reliability of the obtained forecast results. Long-term trends in energy source consumption were analyzed in order to predict energy source usage, and forecast calculations were carried out using intelligent analysis and modeling methods that rely on the construction of neural networks.
The model was trained utilizing advanced multilayer perceptron networks with backpropagation methods (2/3 and 1/3 split for training and validation), and the resultant forecast estimates were corrected using the error between the model output and true values. The following network generation algorithm was implemented within the framework of this architecture.
Neural networks were populated with information using statistical series for energy sources used over long periods. These long-term statistical data (spanning over 30 years) on the researched indicator were transformed into an ever-growing information flow of accumulated information on the studied process, as reflected by the specific indicator. Based on the pattern of information collection and accumulation, here, it was characterized by an S-shaped change over time.
Simultaneously, each value within the information series reflected the state of the indicator in question all through its entire preceding development history. The resulting information series was split by time into segments, each of which later formed a column of the information matrix, thus creating the input information matrices. The components of these matrices were represented as neural network nodes that sequentially transmitted information “signals” from one matrix node to the next. For every information layer of the matrix, the pattern of information expansion was determined when transitioning from one matrix node to another. Subsequent forecast nodes of the matrix were constructed for each information layer by applying the identified pattern of information expansion.
The neural network calculations involved the sequential processing and transformation of numerous information matrices. These matrices are fundamental to each computational stage within the network. Each matrix is conceptualized as an arrangement of neural network nodes. A key characteristic of their construction is the inclusion of an unknown node within each matrix, the value of which must be estimated or predicted based on the information propagated through the existing layers of the network’s architecture. This iterative estimation process is central to the operation of the neural network. The information matrix looks like the following:
X 1 Y 1 Z 1 X 2 X i X t Y 2 Y i Y t Z 2 Z i
The final node Z t within each matrix represents an unknown variable requiring prediction. The forecast of this specific matrix element is achieved through the application of regression models. In this architecture, each preceding layer (e.g., X, Y, and others) is systematically connected to the target layer, denoted as Z. The prediction of the unknown node in Z is derived by establishing regression relationships between Z and its preceding layers, such as Z and X, as well as Z and Y. The final estimated Z t value is determined by averaging these individual regression-based predictions.
Given that the input information is populated into the matrix as accumulated data, which inherently smooths the statistical fluctuations, it is possible to achieve high coefficients of determination, typically ranging from 85 to 90%. For each subsequent forecasting step, the matrix is dynamically reconfigured. This reconfiguration ensures that there is always a single unknown “node”, which is then estimated based on the currently available “complete” information layers. At every iterative step, an unknown node is thus “completed” utilizing the accessible information layers and regression models that consistently exhibit a high determination coefficient of 85–90%. Concurrently, based on the computational model, the root-mean-square errors (RMSE) are observed to be approximately 10–15%.
Considering that the information matrix was composed in a way that it had “leading” and “complementary” layers, at every step of information growth, it was checked and subsequently adjusted for compliance with the real and recorded nodes of the information matrix in the preceding step. This method increases the reliability of information network formation. Figure 1 shows the flowchart of the neural network forecasting process.
In the final stage, to increase reliability, the entire algorithm was executed in reverse order, where the forecast information was accepted as retrospective and vice versa. This allowed the initial information to be compared with the assessment of the initial information obtained using the inverse algorithm. By adjusting the acquired forecast data, the discrepancy between these options was removed, allowing a learning process using the obtained results to take place.
Concerning the approach to error checking, a two-stage error-checking scheme was implemented to ensure the robustness of our algorithm’s output. This approach allowed us to refine our forecasts and maintain a high level of accuracy. In the initial stage of algorithm verification (retrospective validation), two-thirds of the available data were dedicated to forming a retrospective statistical base. The algorithm then performed calculations on the remaining one-third of the data set. These calculated results were compared against the actual data from that same one-third subset. Only algorithms demonstrating an RMSE below 10–15% were advanced for further consideration. This threshold ensured a foundational level of accuracy.
The second stage (bidirectional accuracy control) involved an additional and more rigorous accuracy control. The prospective forecast results were integrated back into the algorithm. This allowed the evaluation of the retrospective information in reverse order, using the newly generated prospective data as a reference. If this “reverse calculation” yielded an RMSE exceeding the 10–15% threshold, the forecast information was meticulously adjusted until it met the acceptable error standard. This double-check error control scheme for enhanced reliability provided a comprehensive validation of the algorithm, contributing to the reliability and acceptability of our results. This systematic approach effectively minimizes potential inaccuracies. Figure 2 displays the flowchart of the algorithm.
Standard deviation techniques were used accurately in the calculations. These methods enable the model’s implementation to guarantee an actual forecast accuracy of over 85–90%. To summarize the performance of the applied model, Table 1 presents the RMSE and the R2 values for the input, between and output layers for the applied neural forecasting model.
The forecast accuracy with the reverse forecasting method, which allowed for the correction of the results obtained by the direct forecasting method exclusively within the accuracy range, was also accepted at a level higher than 85–90%. Table 2 summarizes the RMSE performance of the direct and reverse forecasting.
Consequently, the internal and external learning processes of the algorithms enabled the production of reasonably reliable and trustworthy results.
Neural network modeling was performed on a twenty-year retrospective time series (2000–2022). Predictive calculations have been performed using intelligent analysis methods and modeling based on neural network construction [26]. Using simulation methods, the maximum correspondence of the conversion forecast parameters of the indicators to their retrospective values was achieved. The forecasts were made using various methods, including balance and simulation methods, which specified various scenarios for the world’s GDP growth and changes in its energy, oil, gas, and coal intensity. The output data were checked for compliance with the results of previously developed balances of the production and consumption of primary energy sources. Furthermore, the study’s outcomes were contrasted against the results of the implementation of the “digital twins” model of the global fuel and energy complex sectors, in which macro indicators were employed, such as the dynamics of global GDP, oil and coal prices, and indices of oil, gas, energy, and electricity usage relative to world GDP. Standard tools from the MS Office suite were used for software modeling.
The authors further show that these calculation results are reasonably consistent with the currently existing patterns of global energy advancement, as detailed in Section 4.3.
The establishment of laws and patterns of energy development, including the global energy transition, in combination with the results of the neural network forecast of energy consumption of energy sources, made it possible to comprehensively form the contour of energy in the future period. In addition, ensuring the expansion of outer space and the development of artificial intelligence were among the top priorities of energy development, which also included nuclear and thermonuclear energy, as well as gridless energy from small-sized energy sources. Figure 3 shows the logical scheme of the study.

3. Theoretical Background

3.1. The Main Global Transformations of World Development

Proximate and long-term global developmental pathways are under the influence of four concurrently unfolding global transformations, with their initial effects detectable in the present era: (1) demographic, (2) energy, (3) technological, and (4) economic–political transformations [27]. All these transformations, one way or another, “knock out” traditional energy from the economic cycles of the world economy and would lead to an increase in the use of alternative energy sources.

3.1.1. Demographic Transformation

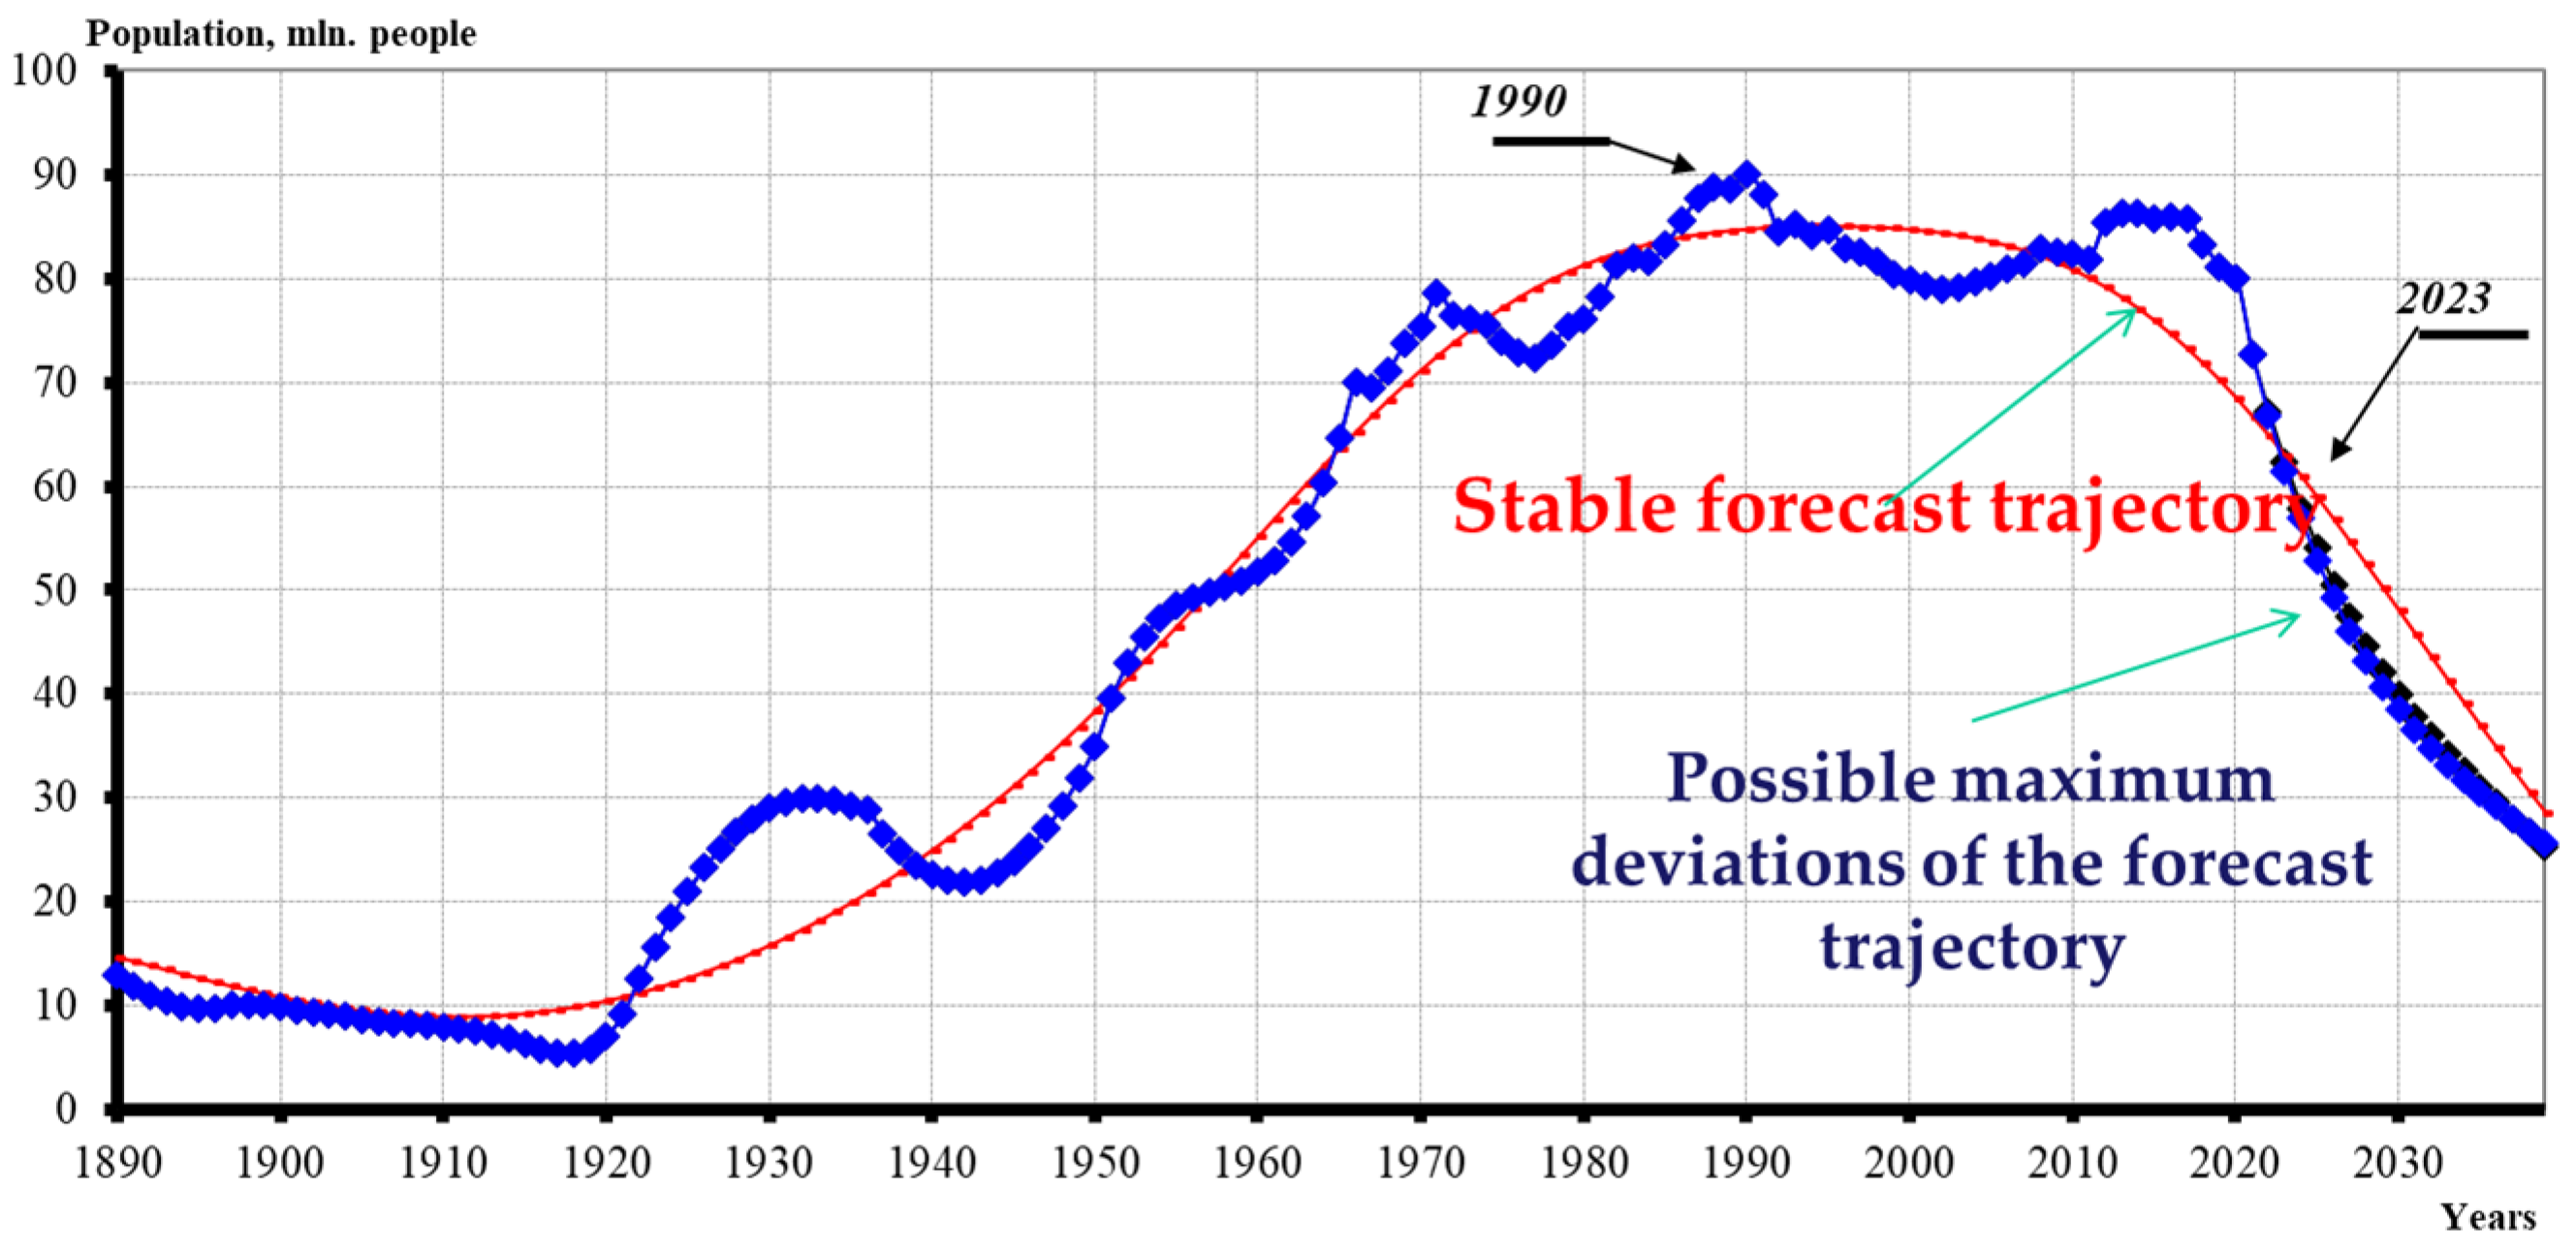
Apparently, the most important global transformation is demographic [28,29] and is associated with a change in the world population [30]. The fact is that, approximately by the beginning of the 1990s, the increase in the growth rate of the world’s population ceased [31] and stabilized at the level of 80–90 million people per annum by the end of the 2010s’ (Figure 4).
Between 2010 and 2015, this annual increase began to decline rapidly per year, and by 2023, the annual increase dropped by 1.5 times to an annual 60 million people. Several analysts have asserted that civilization is entering a global demographic shift, implying future stabilization or even a potential decline in the world’s population. Several international and scientific institutions have published population forecasts [33,34,35,36] that are characterized by very high variability, including the direction of a significant increase in the world population or the application of various demographic coefficients. Russian scientists have made a major contribution to demographic process modeling [37], which studies were based not only on an assessment of demographic coefficients but also on the level of human energy consumption throughout the entire civilizational path of development. Moreover, in the early 2000s, positive international evaluations were given to Kapitsa’s demographic transition theory [38,39,40,41], according to which the world population should stabilize at around 11 billion people in the long term.
However, there are models not only of stabilization in the world population but also of a possible decline [33,34,35,42,43,44]. In addition, recently, various scientific discussion platforms have debated studies on the impact of artificial intelligence on the population, leading to a decrease in the population [45,46,47]. Based on these forecasts, estimates of the world population in the 21st century, which can be classified as a compromise and consistent with existing theoretical trends, were obtained. Moreover, for a hundred-year period, they differ from the United Nations Organization forecasts by no more than 10%. To clarify their values in the long term, a neural network forecast of population dynamics for the 21st century was conducted, and the results are presented in Figure 5.
As calculations show, contrary to the opinion of several analysts expecting the world population to grow in the 21st century, it is unlikely to grow in the long run, but it will reach a stable level of approximately 9 billion people. Its further growth will probably not exceed 10 billion people, and according to our calculations, in subsequent periods, the world population may even decrease.

3.1.2. Energy Transition

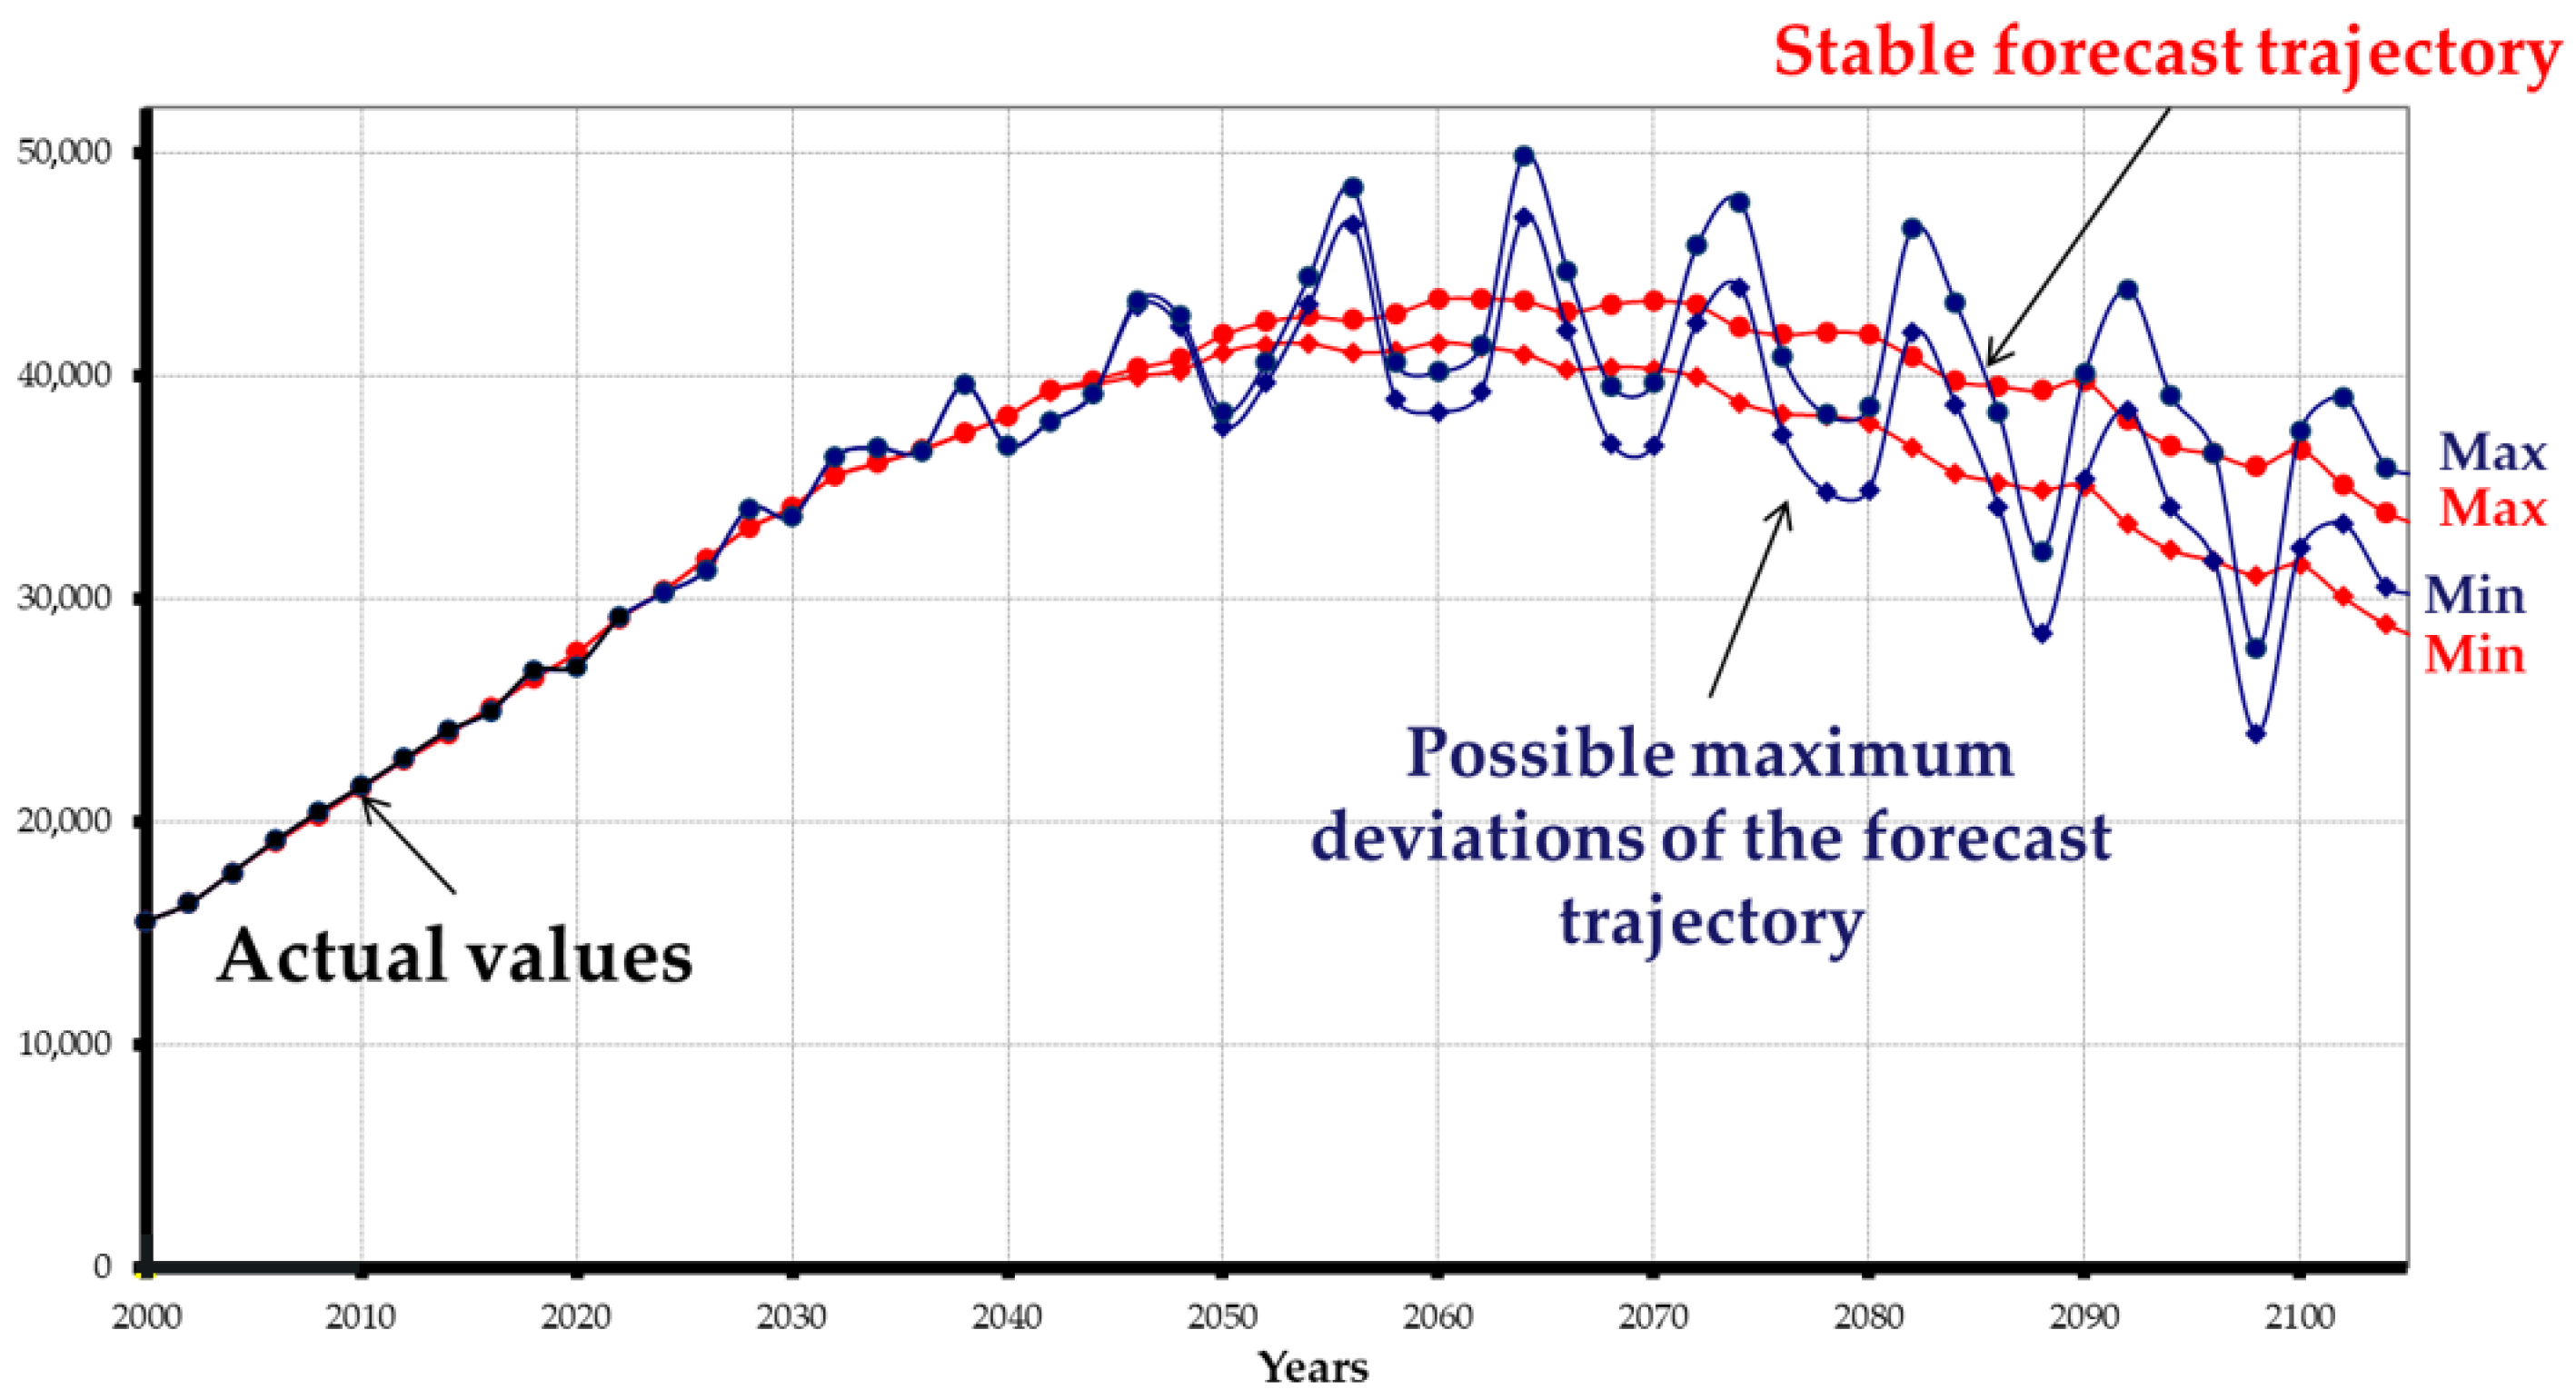
Owing to the influence of demographic transition, an energy transition has also begun. With world population stabilization and energy efficiency growth in the world economy, the volume of energy used will most likely decrease. This is also evidenced by the results of our neural network forecast of energy consumption in the 21st century (displayed in Figure 6), which, contrary to the opinion of a number of experts, will not grow continuously in the long run, but, in reverse, it will stabilize during the period 2050–2070, and then its systematic reduction can be expected (Figure 6).
Such a decline is indicated by the long-term trends of falling energy consumption in developed countries.

3.2. Global Trends of the Past Period and Unlearned Lessons of Yesterday

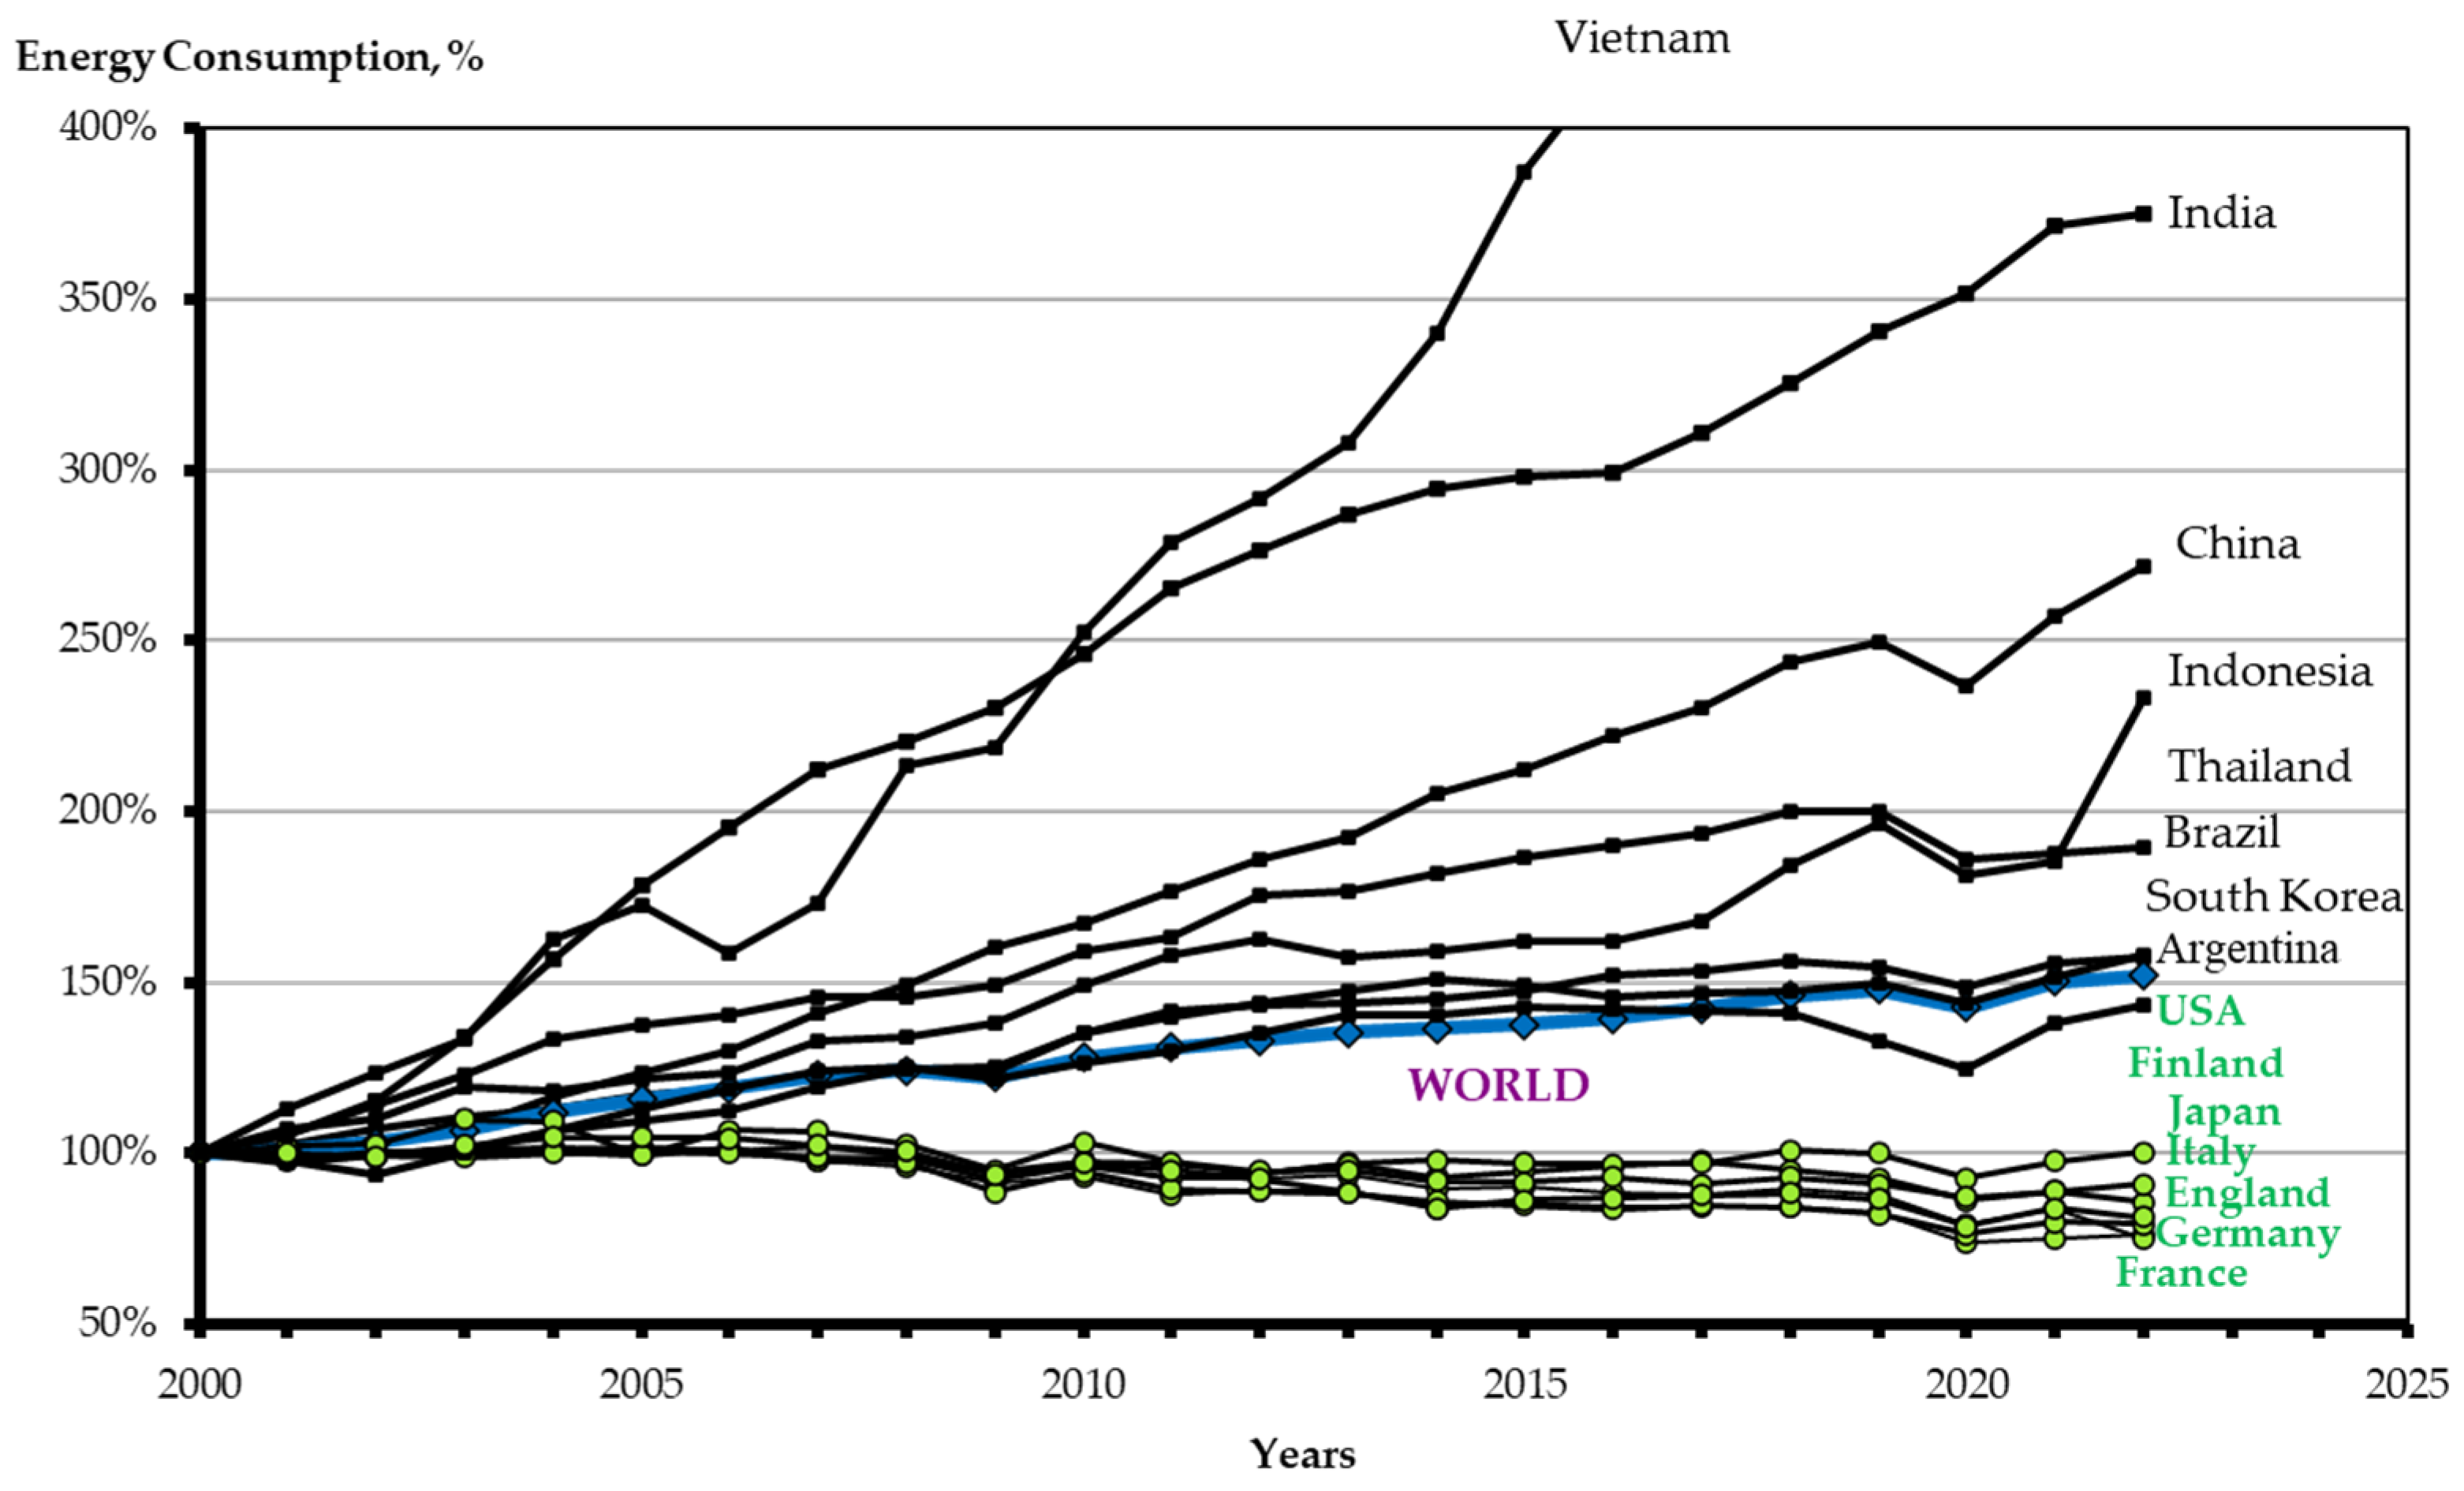
As the findings of the Energy Institute and BP report show, developed countries have been systematically reducing energy consumption for more than 20 years (Figure 7) [49].
Developing countries, on the other hand, including India, China, Vietnam are still actively increasing their energy consumption, but taking into account demographic and innovative technological processes, they will also strive to stabilize or even reduce their volumes of energy use in the forecast period up till 2100 [50,51,52,53]. Definitely, this reduction occurs primarily because of the reduction in the volume of traditional energy sources [54].
Consequently, developed countries have been systematically reducing their coal consumption for more than 20 years, and even developing countries, including China and India, have already stopped the sharp increase in their coal consumption rates [55]. In the patterns of coal consumption in developing countries, a clear “ceiling” is “visible”, beyond which a steady decline will quite naturally take place. In general, the world economy achieved stabilization of coal resource consumption in 2011–2012 (Figure 8).
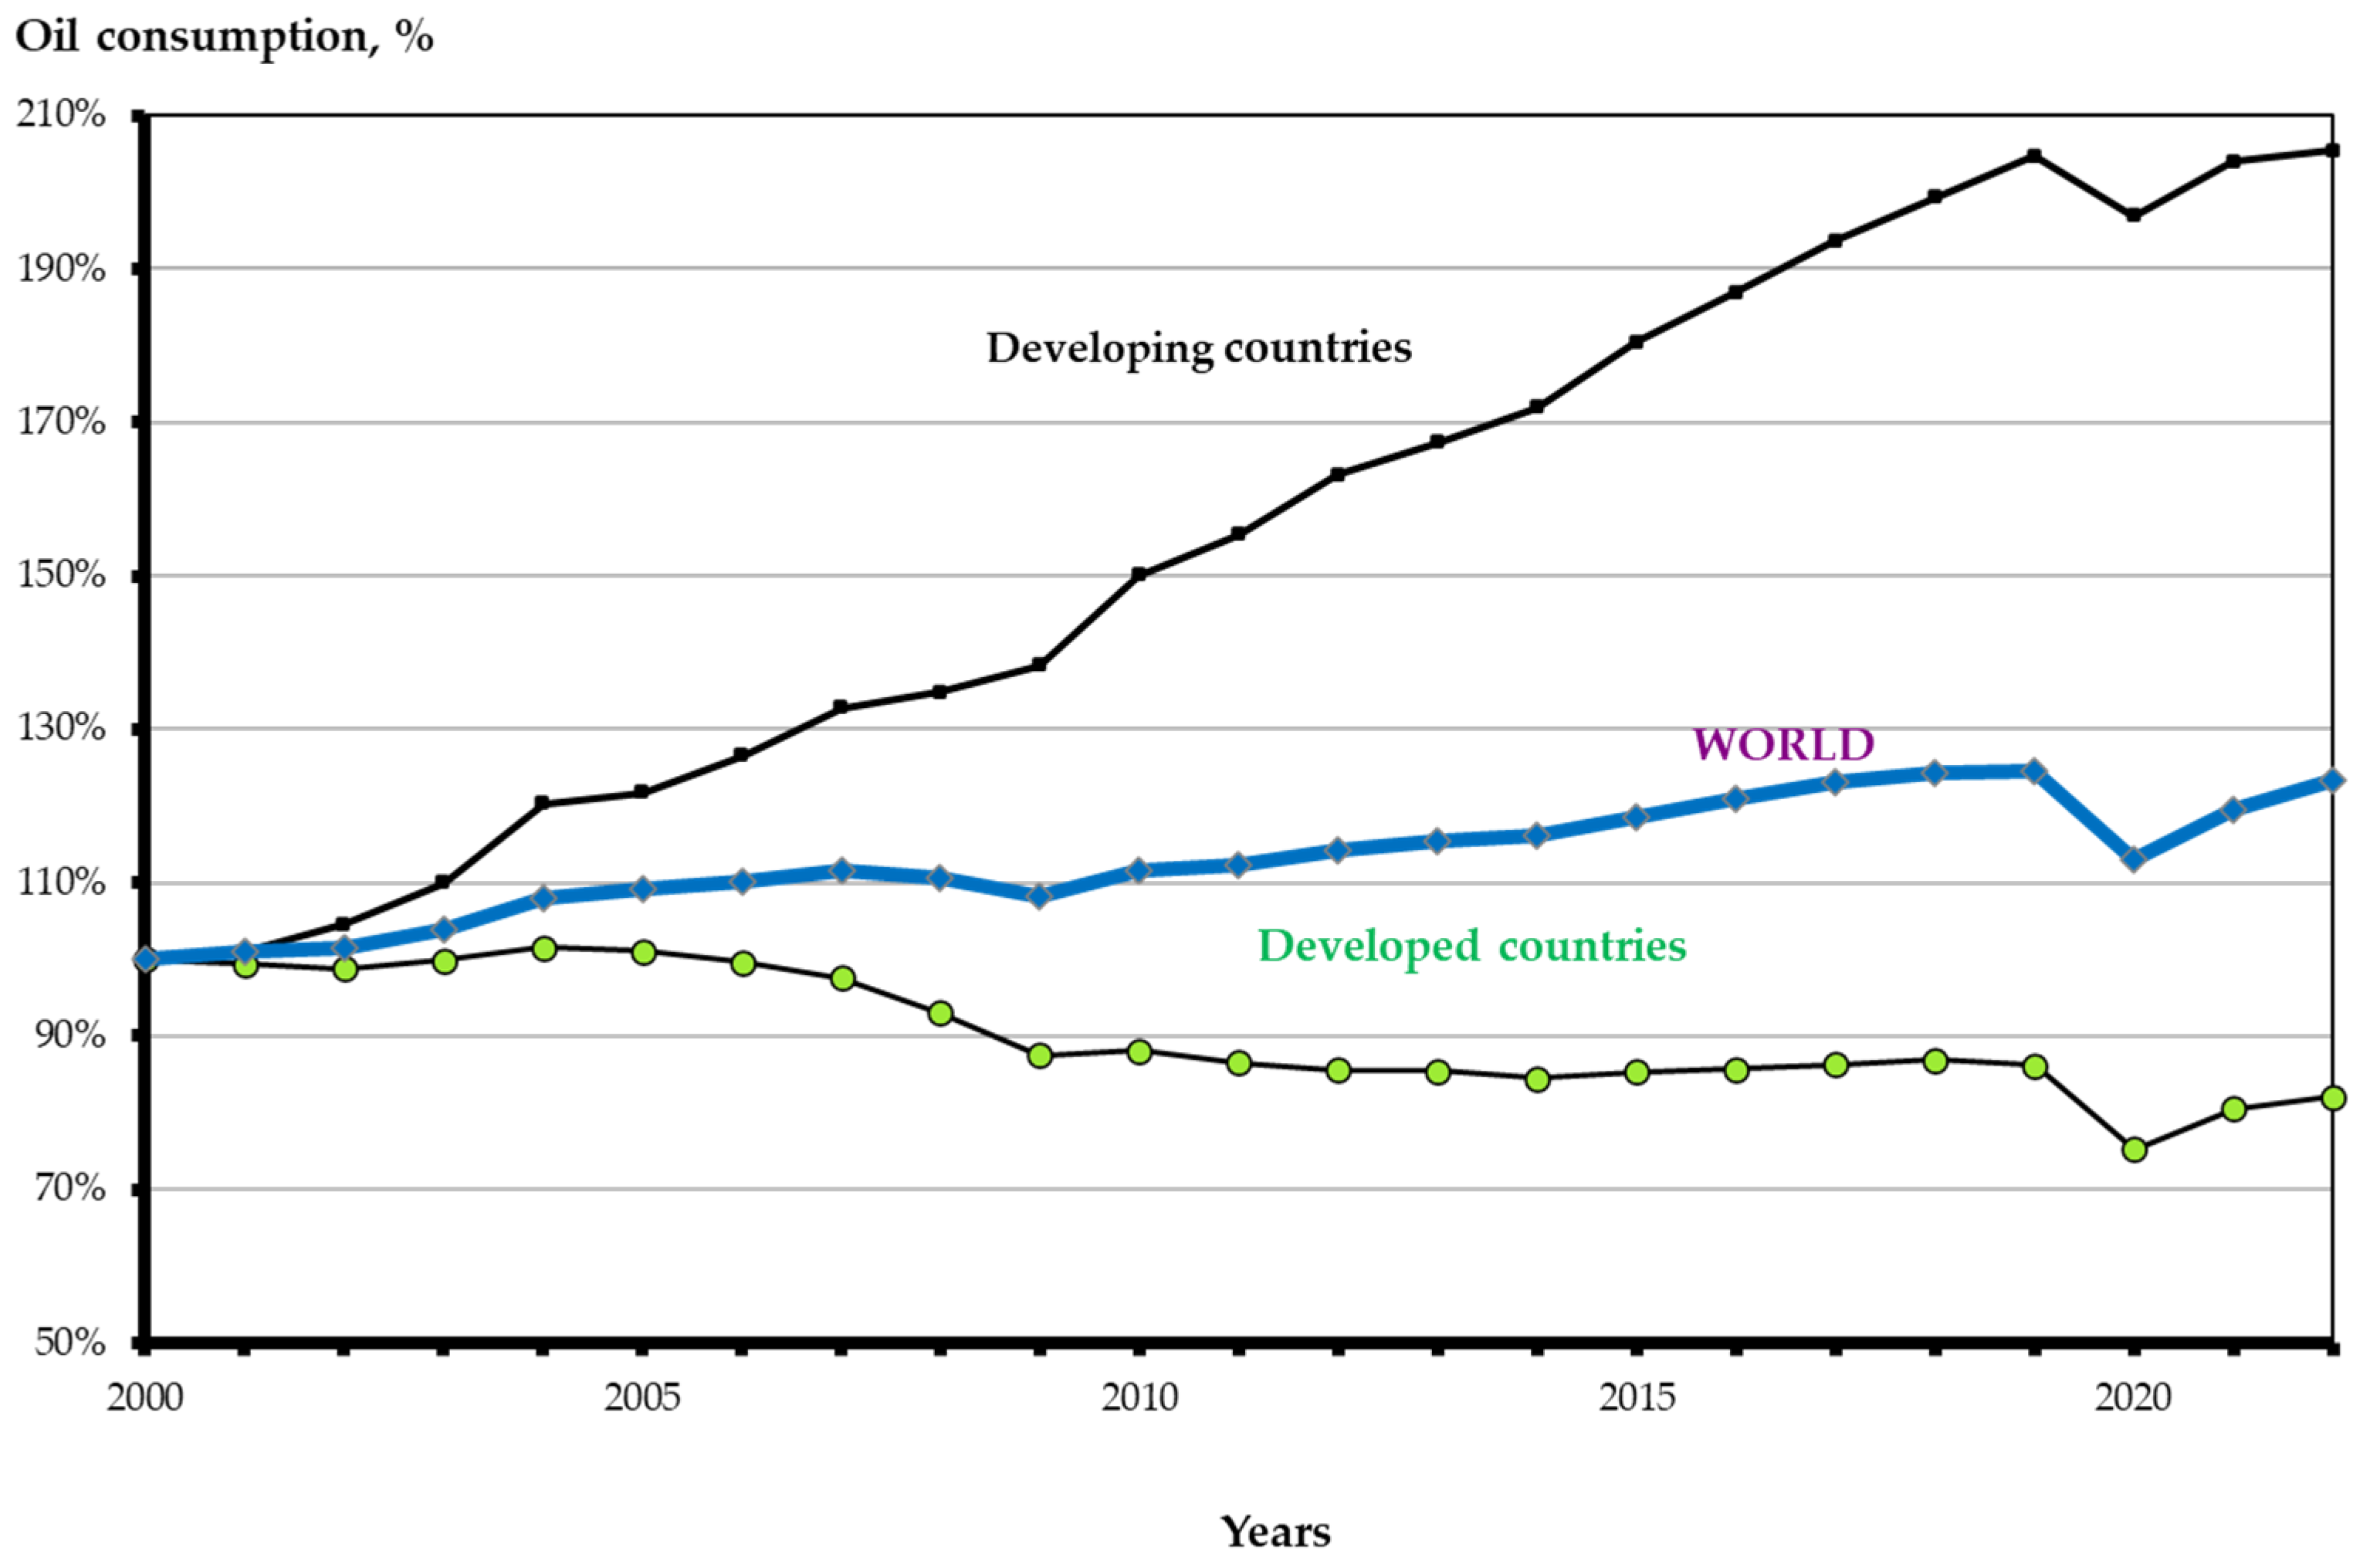
In parallel, developed countries are rapidly reducing their coal consumption as well as their oil usage. Consequently, over the past 22 years, oil consumption in these countries has decreased by almost 20% (Figure 9). However, owing to the growth in oil consumption in developing countries (approximately doubling over the last 22 years), global consumption has increased by approximately 20%.
Undoubtedly, the emergence of such a trend is alarming because of its contradiction to the global focus on the significant expansion of electrified transport.
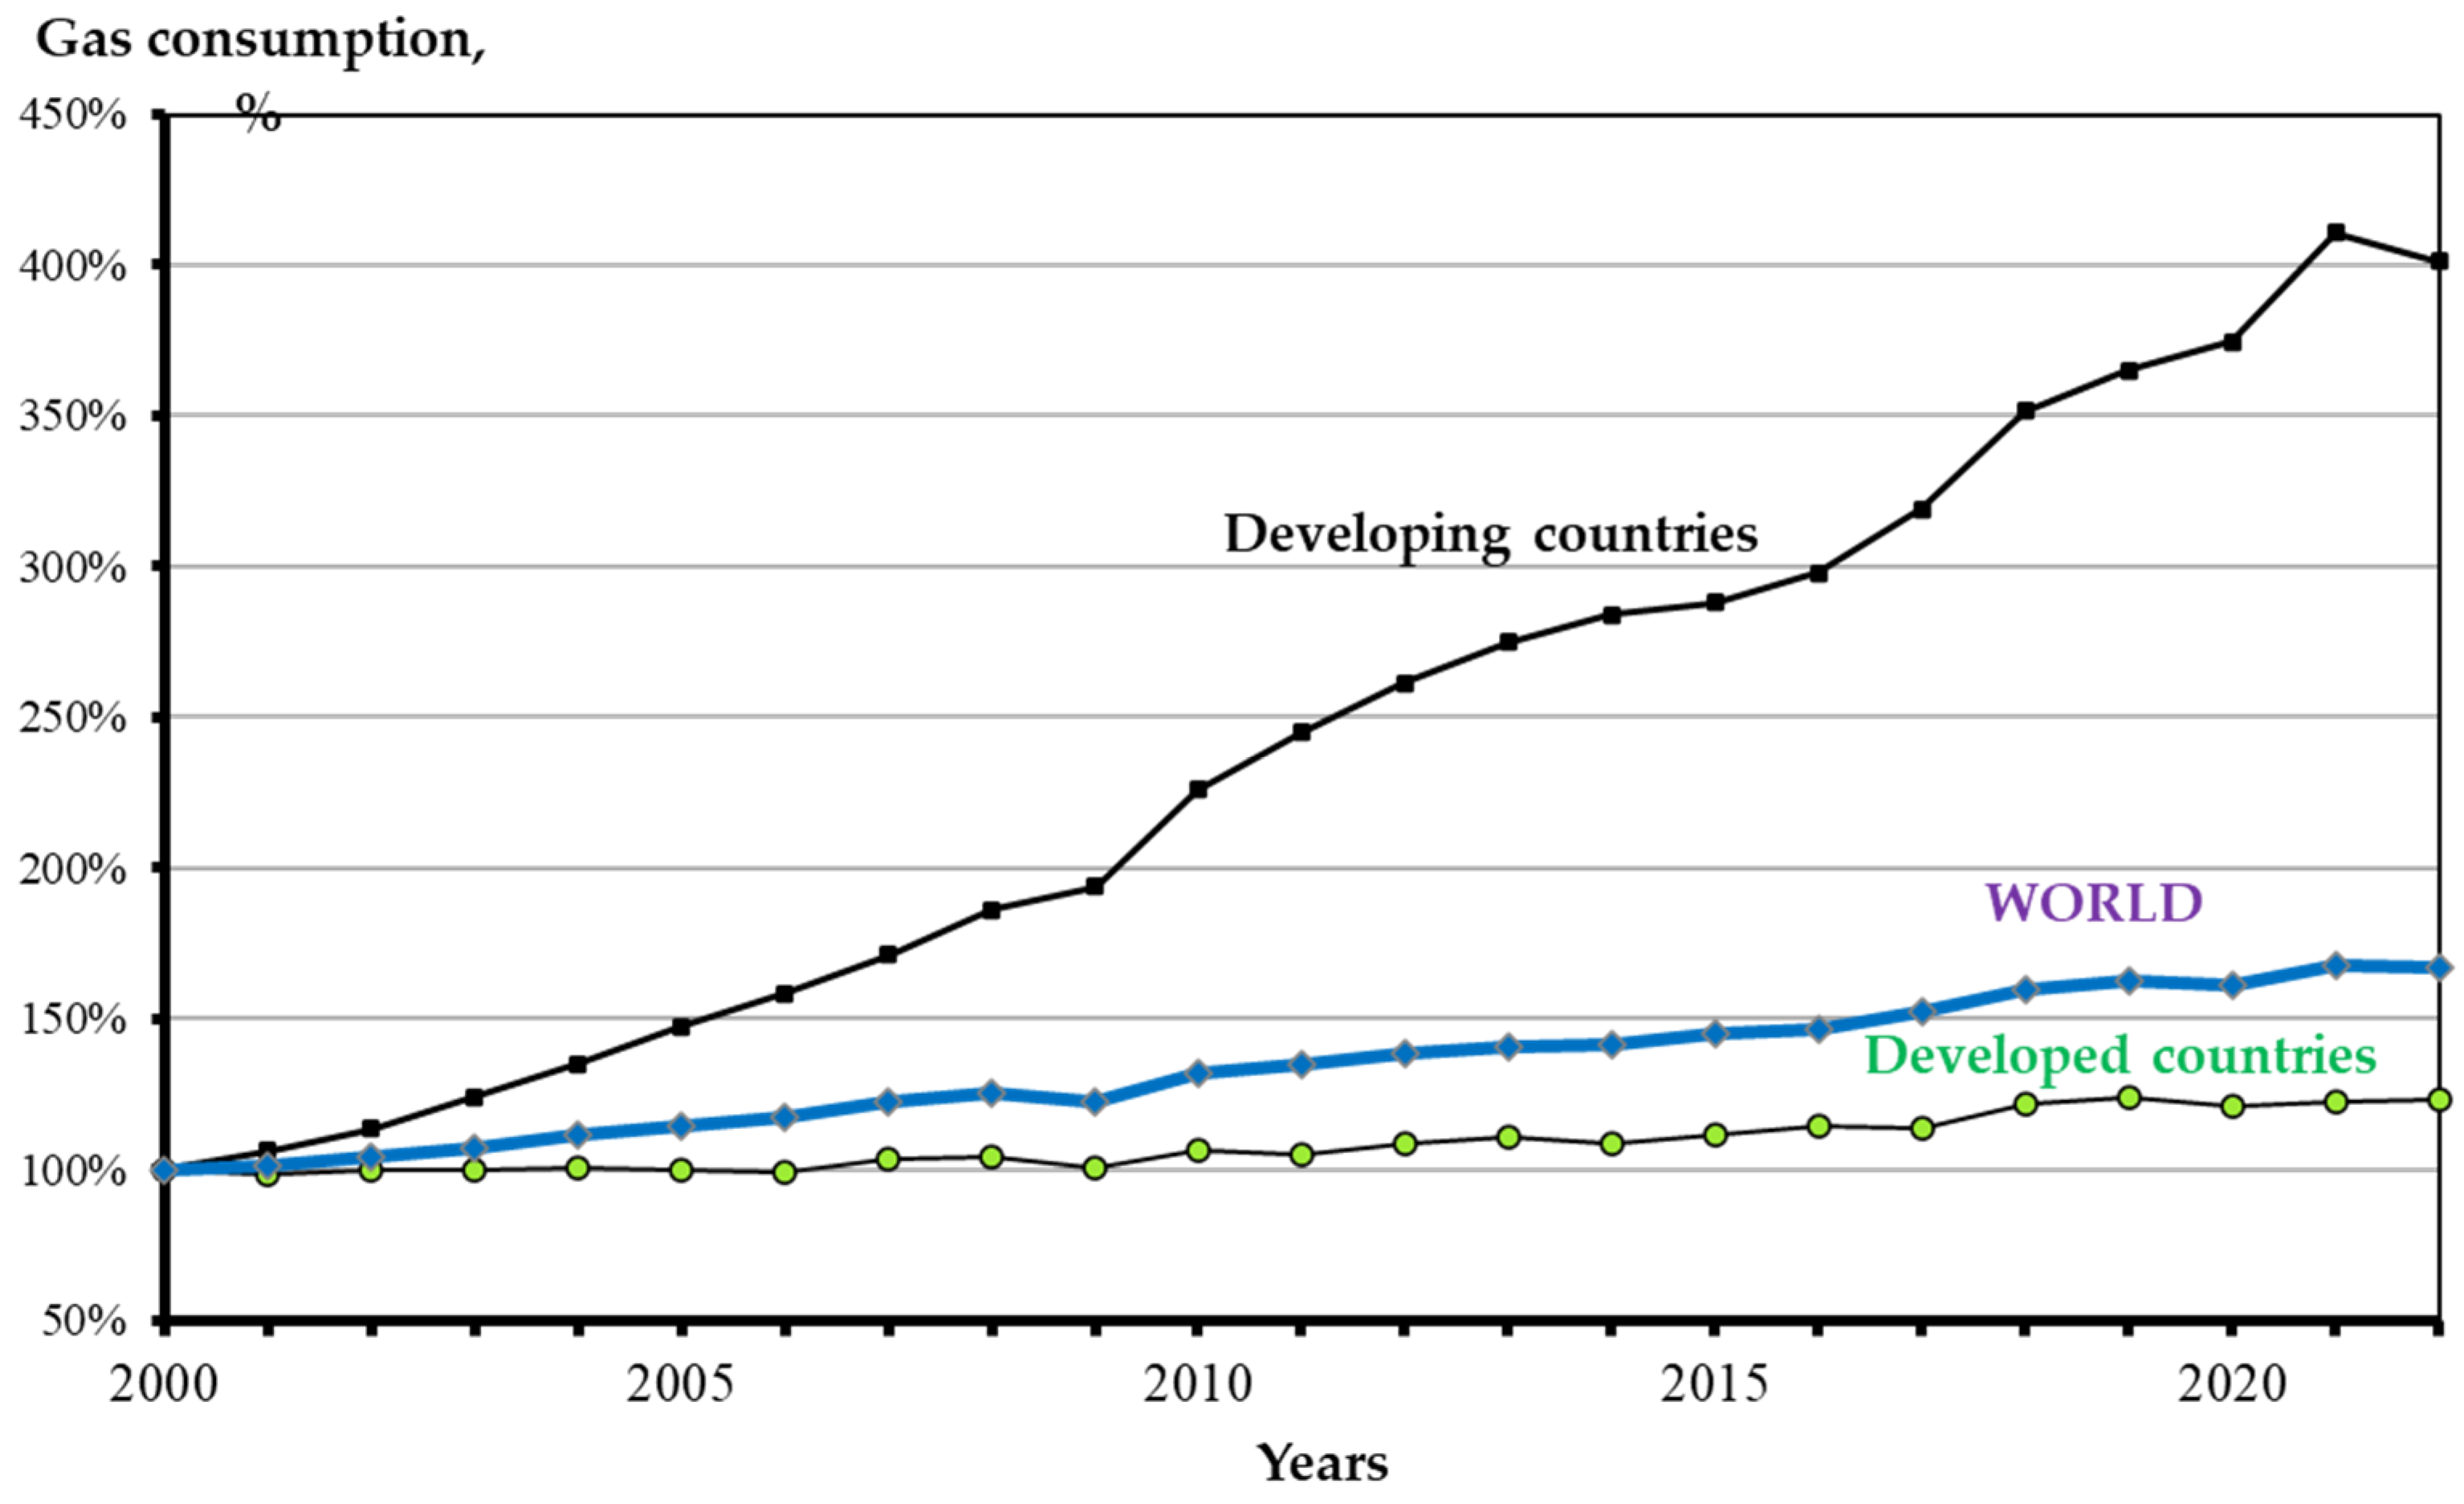
Even when considering the analysis of gas consumption, one cannot claim its long-term growth in the upcoming period. Although developed countries have increased their gas consumption over the last 22 years, the rate of growth was quite moderate at no more than 20%. Simultaneously, should we consider aggregate consumption in developed countries in a differentiated manner, we can state that European countries as a whole not only did not increase but slowly reduced the volumes of gas consumption in their economies. In contrast, developing countries have been increasing their gas consumption at a fairly high rate, with an average increase of approximately four times over the last 20 years (Figure 10).
However, in the long run, under the pressure of global transformations, developing countries are also expected to follow a track similar to that of developed countries. Notably, throughout the period under consideration, the latter systematically reduced their consumption of coal, oil, and even gas. In general, the share of non-renewable energy sources in the energy balances of developed countries has decreased from 84% to 74%, by approximately 10%, over the past 22 years (Figure 11).
The share of non-renewable energy sources’ global consumption was at the “ceiling” of 85–87% until approximately 2013–2014, but since 2014, it has begun to decrease and dropped to 82% by 2022. Despite the rapid growth in gas, oil, and coal consumption in developing countries, the share of non-renewable energy sources in these countries not only did not grow, but, on the contrary, it has decreased. Consequently, over the last 22-year period, the share dropped from a stable level of 90% up to 2010–2011 to 82% by 2022. Such dynamics indicate the serious intentions of developing countries to transform their energy balances towards a significant increase in the share of renewable energy sources [56].
This pattern reflects a trend that is valid for the world as a whole and for both developed and even developing countries. In the latter, there is a systematic and accelerated reduction in the share of oil consumption in the energy balance (Figure 12) [32,48].
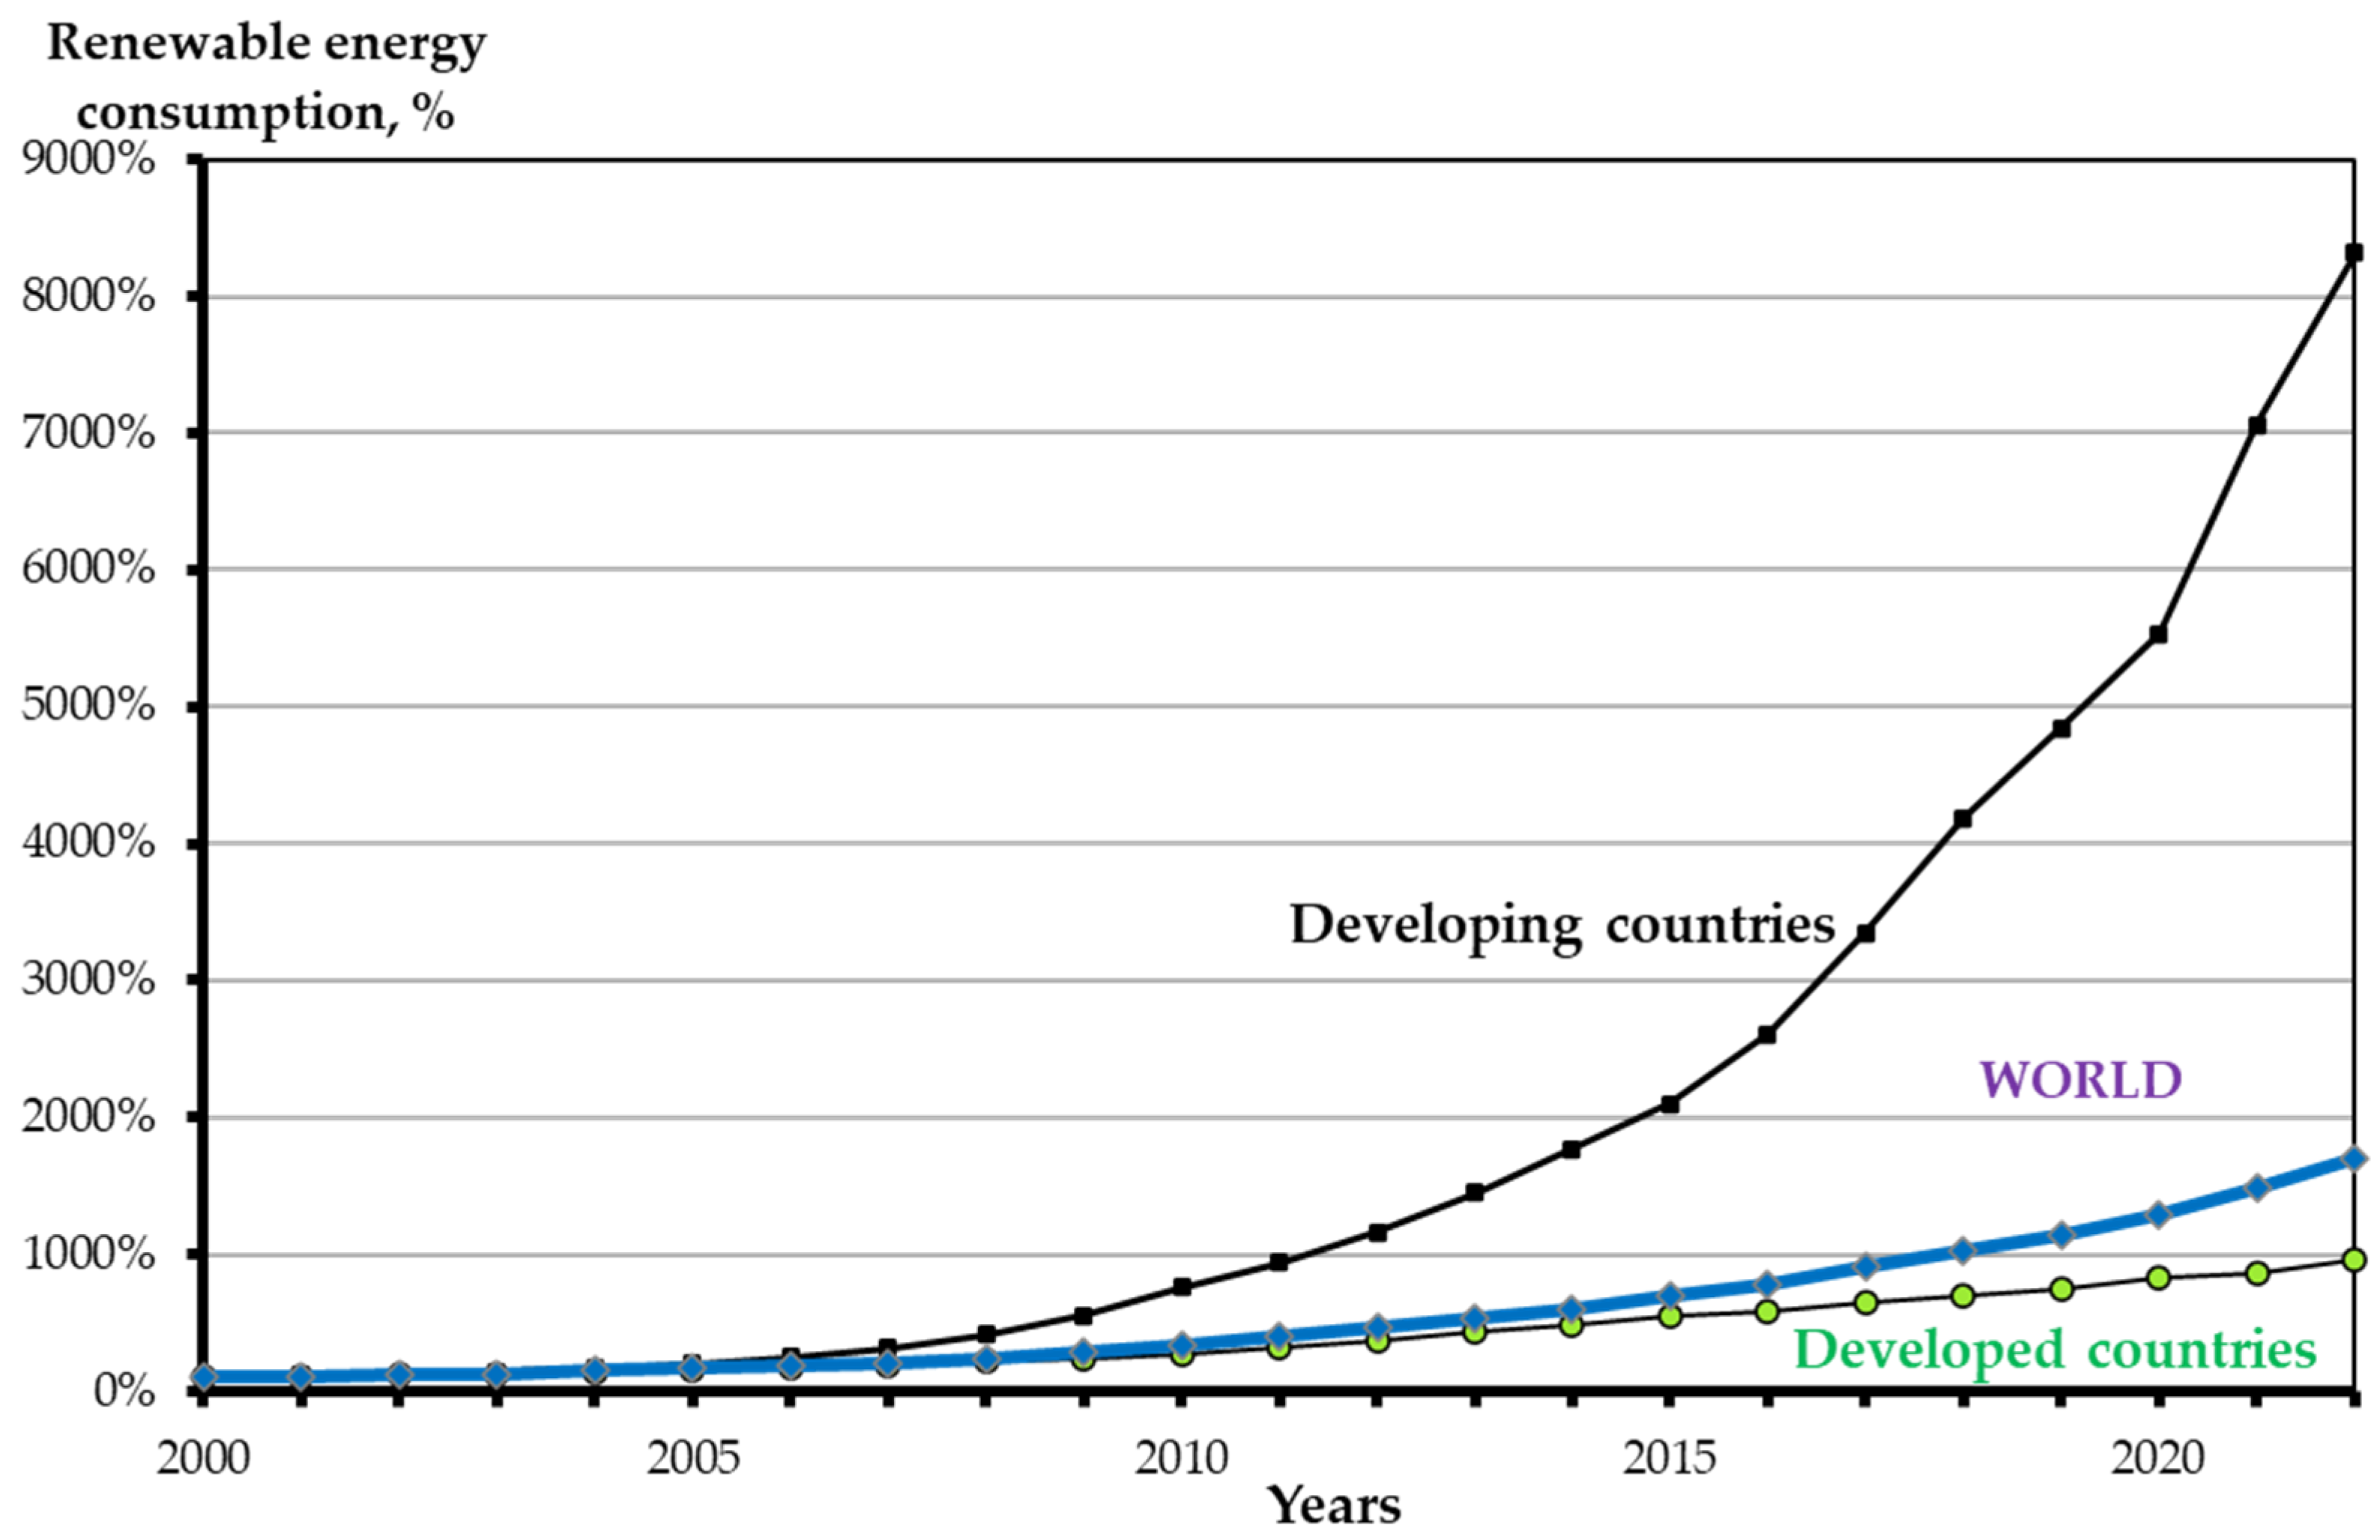
Notably, over the last 22 years, developed countries reduced their oil consumption share from 42% to 36–37%, namely, by 5–6%, while developing countries cut back their oil consumption share even more, from 33–34% to 23–25%, namely, by approximately 9–10%. A higher level of reduction in the share of oil consumption in developing countries indicates these countries’ ambitious intentions to switch to renewable energy sources and large-scale electrification of all types of transport. The growth in renewable energy consumption in developing countries is almost “explosive” and follows an exponential trend, as shown in Figure 13.
Assuming developed countries increased their renewable energy source consumption by 10.9 times over the 22-year period, then the figure for developing countries was more than 40 times that. Even considering the “low start-up problem,” the growth of these sources’ consumption did not reach a threefold increase from 2000 to 2010 in developed countries, but an eightfold increase was detected in developing countries [57,58,59,60], which definitely influenced the rapid growth of the share of renewable energy sources in the energy balance of developing countries. Furthermore, by 2022, it increased from approximately 10% (2000) to 18–19% and approached the values of developed countries (20–21%).

4. Energy Transition Forecasts and Prediction

The following section, after presenting the results of the neural network forecast for fossil and renewable energy consumption trajectories, demonstrates the neural network forecast of the shares of traditional and alternative energy in the global energy balance, as well as the relationship between global transitions and global technological transition patterns. Furthermore, the chapter discusses the development of energy density forecasts by neural networks and how they anticipate and prefigure the use of outer space for energy development.

4.1. Energy Transition in Neural Network Forecast of Future Energy Consumption

The trend analysis of the period 2000–2022 provides an almost unambiguous understanding that for more than 20 years, an energy transition has been systematically taking shape in the global energy sector, with its starting point set for the years 2013–2014, when the share of non-renewable energy sources started to decrease globally, including in developing countries. This period also marked a turning point in global demographic trends, as the previously relatively stable annual increase in the world’s population began to slow down and decline (see Figure 4).
In fact, the demographic transition “provoked” the transition to new renewable energy sources, which in the forecast period is expected to lead to stabilization and subsequent reduction in energy consumption (see Figure 6). The figures show a reduction in the consumption of coal, oil, and gas and the achievement of maximum renewable energy sources in the forecast period. Provided that all these processes take place, a reduction in energy consumption is possible beyond the 2060s owing to the growth of energy efficiency. In addition, the forecast schedule for electricity production confirms that the values will decrease by the end of the forecast period. However, this transition process will affect not only the total energy consumption but also the volume of electricity generated. The fact is that the volumes of electricity generated by developed countries from 2000 to 2022 have reached a stabilization level [32,48]. Moreover, between 2000 and 2022, these volumes gradually decreased in several European countries. The growth in global electricity generation was mainly driven by high rates in developing countries (Figure 14).
Between 2000 and 2022, the volume of electricity generation in developing countries increased by 4.5 times, and in general, by approximately 1.9 times for all countries worldwide. Most likely, such significant rates of increase in the volume of electricity generation in developing countries determined their high rates of GDP growth [61]. However, the emerging structural transformations in the global dynamics of electricity generation volumes, in fact, predetermine their stabilization for developing countries in the forecast period until 2100. Based on the neural network forecasting of global electricity production, the growth of these volumes is predicted to cease and reach a stabilization level between 2060 and 2080 (Figure 15).
In all likelihood, regarding electricity production, by the period of 2060–2080, developing countries will follow the same path and, with a 60-year delay, will copy the trend between 2000 and 2022 in the developed countries. After the 2070s, the electricity production volume in general will most likely decrease. Undoubtedly, this seems a bit paradoxical, because by the middle of the century the extent of electrification in everyday life and all types of transportation should increase significantly [62]. In addition, the growth of intellectualization is forecast to lead to a significant increase in the use of super-powerful computing equipment, requiring electricity. Meanwhile, in the specified period, processes based on the use of quantum technologies and photonics will be actively developing in parallel [63,64,65,66].
The latter will significantly increase electrical efficiency in all sectors of the economy. In addition, more energy-efficient new sectors will emerge. According to the neural network forecast and the justification provided earlier, in the coming period up to 2100, stabilization and further reduction in energy consumption and even electricity production will be accompanied by a decline in the global consumption of traditional energy resources. Thus, in accordance with the results of the neural network forecast, global coal production will most likely halve by around the middle of the century, and, in fact, by the end of the century, it will reach practically “zero” level (Figure 16).
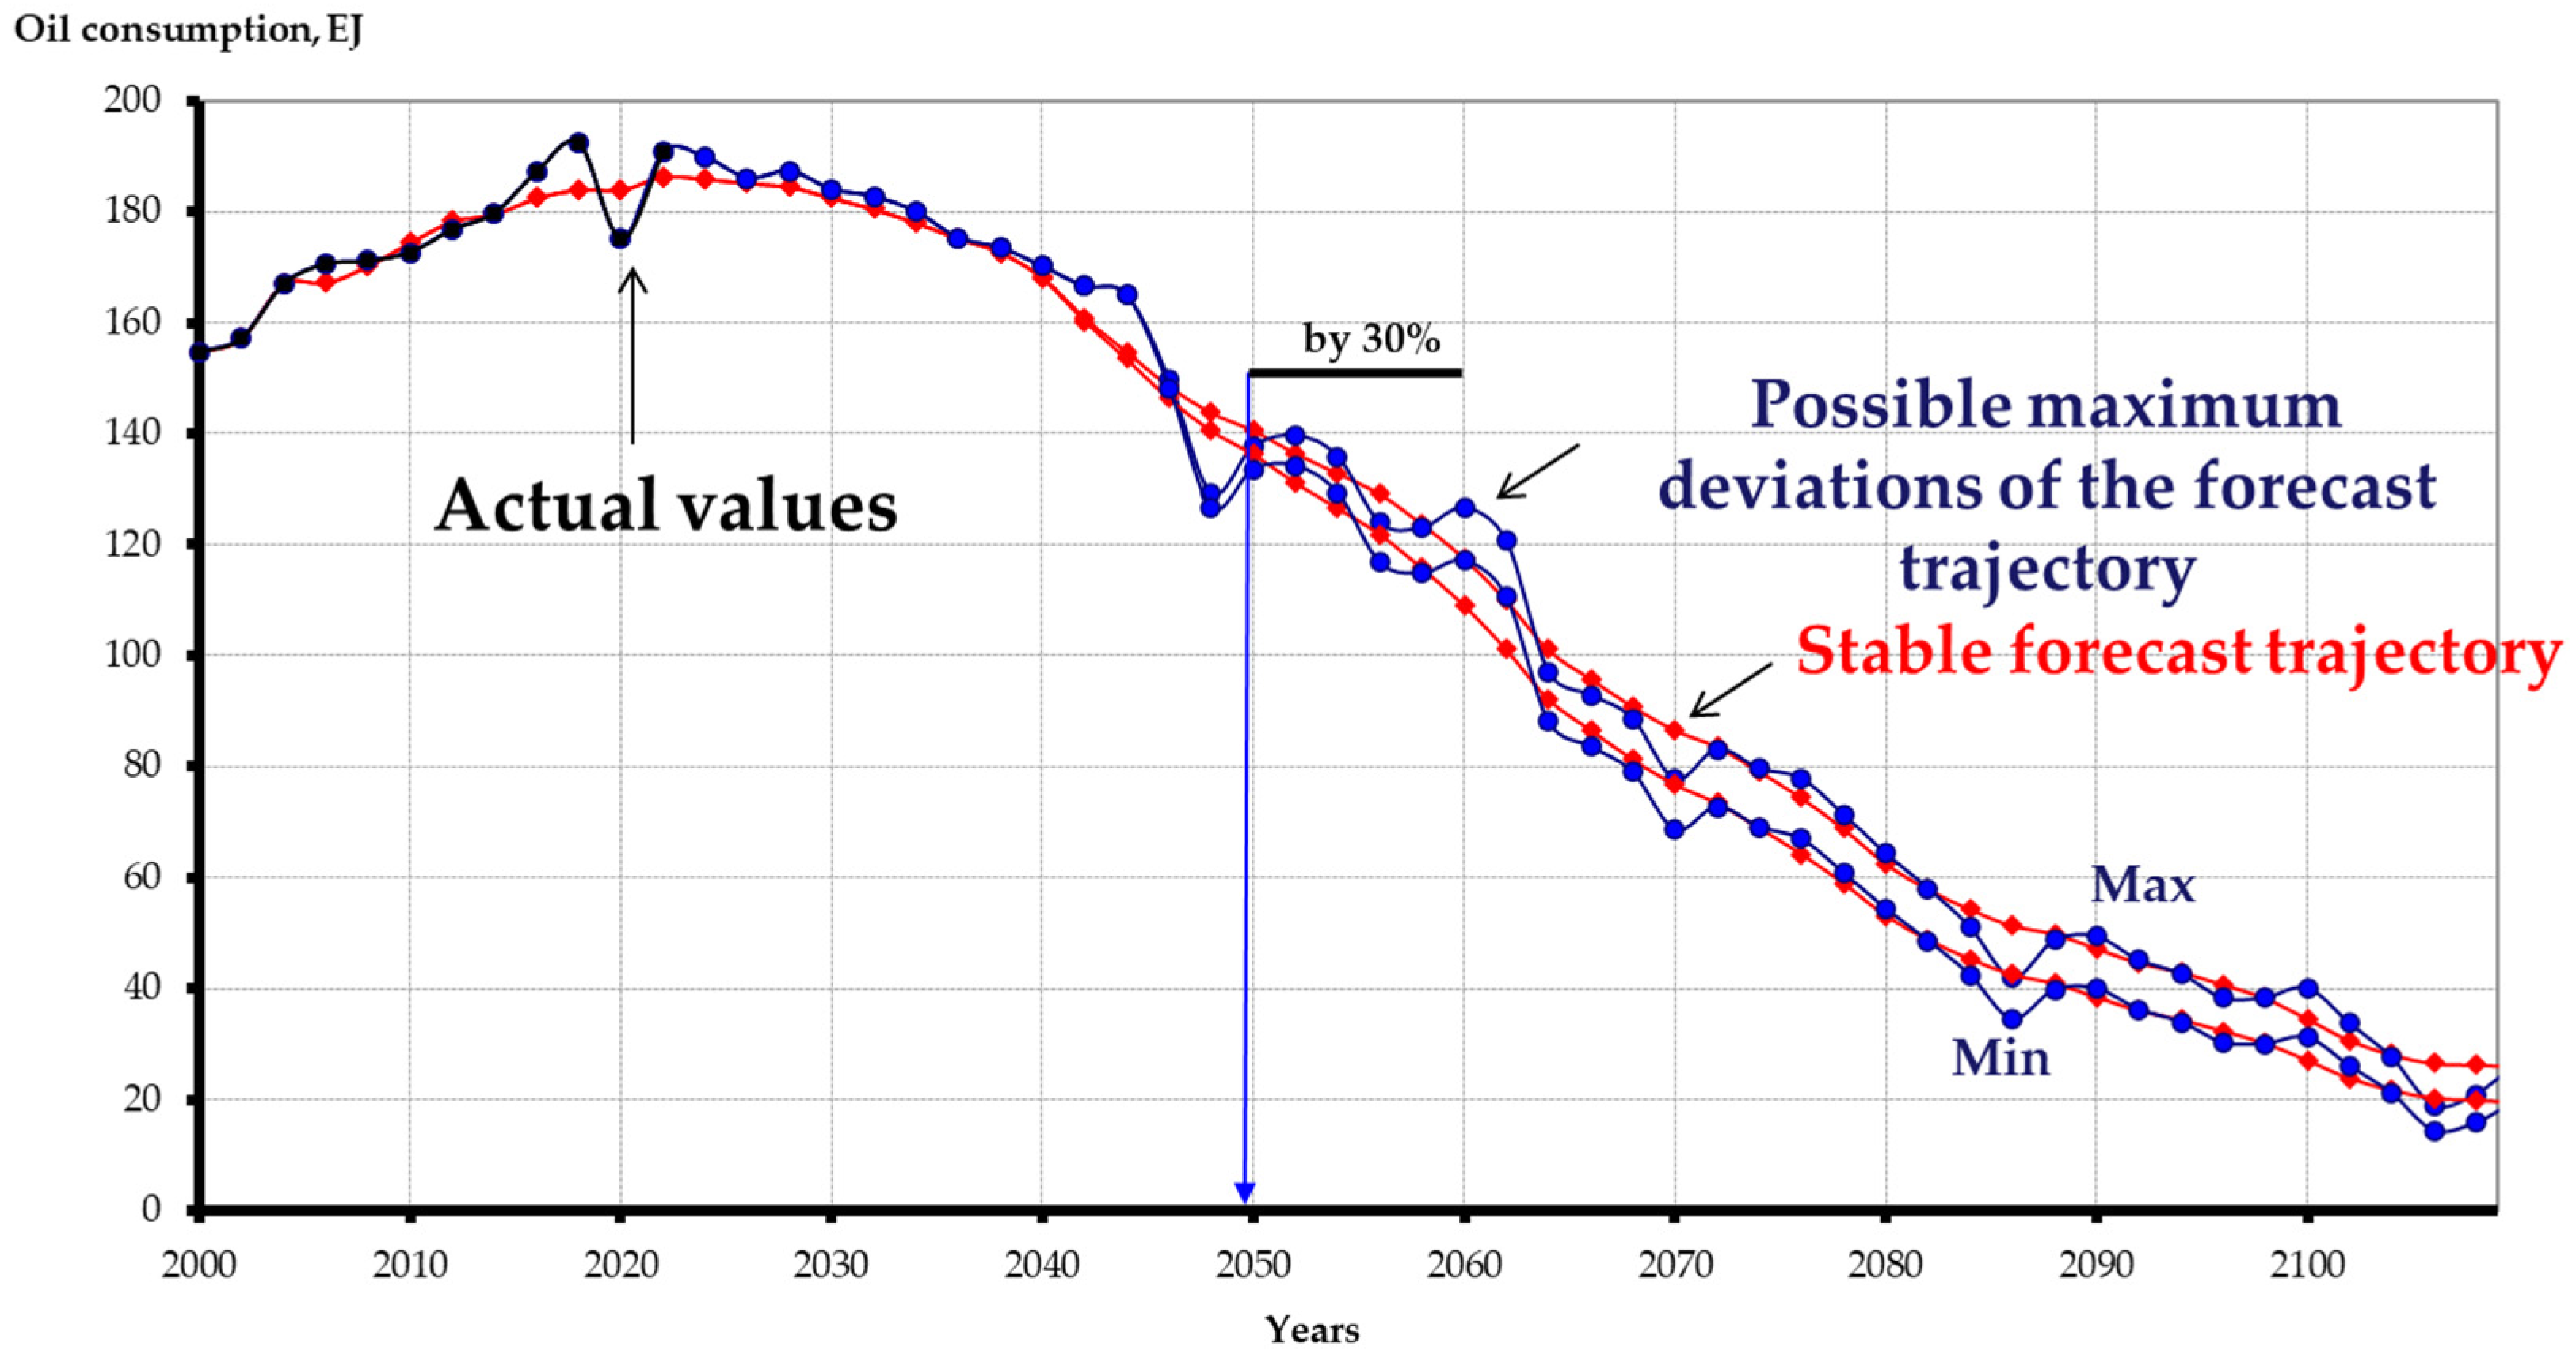
Similar trends with a slight difference can be detected in the global oil consumption forecast, where if the stabilization period of global coal production lasts until approximately 2025–2030, then similar to the trend of coal consumption, a declining phase for oil consumption will continue until 2030–2035 (Figure 17).
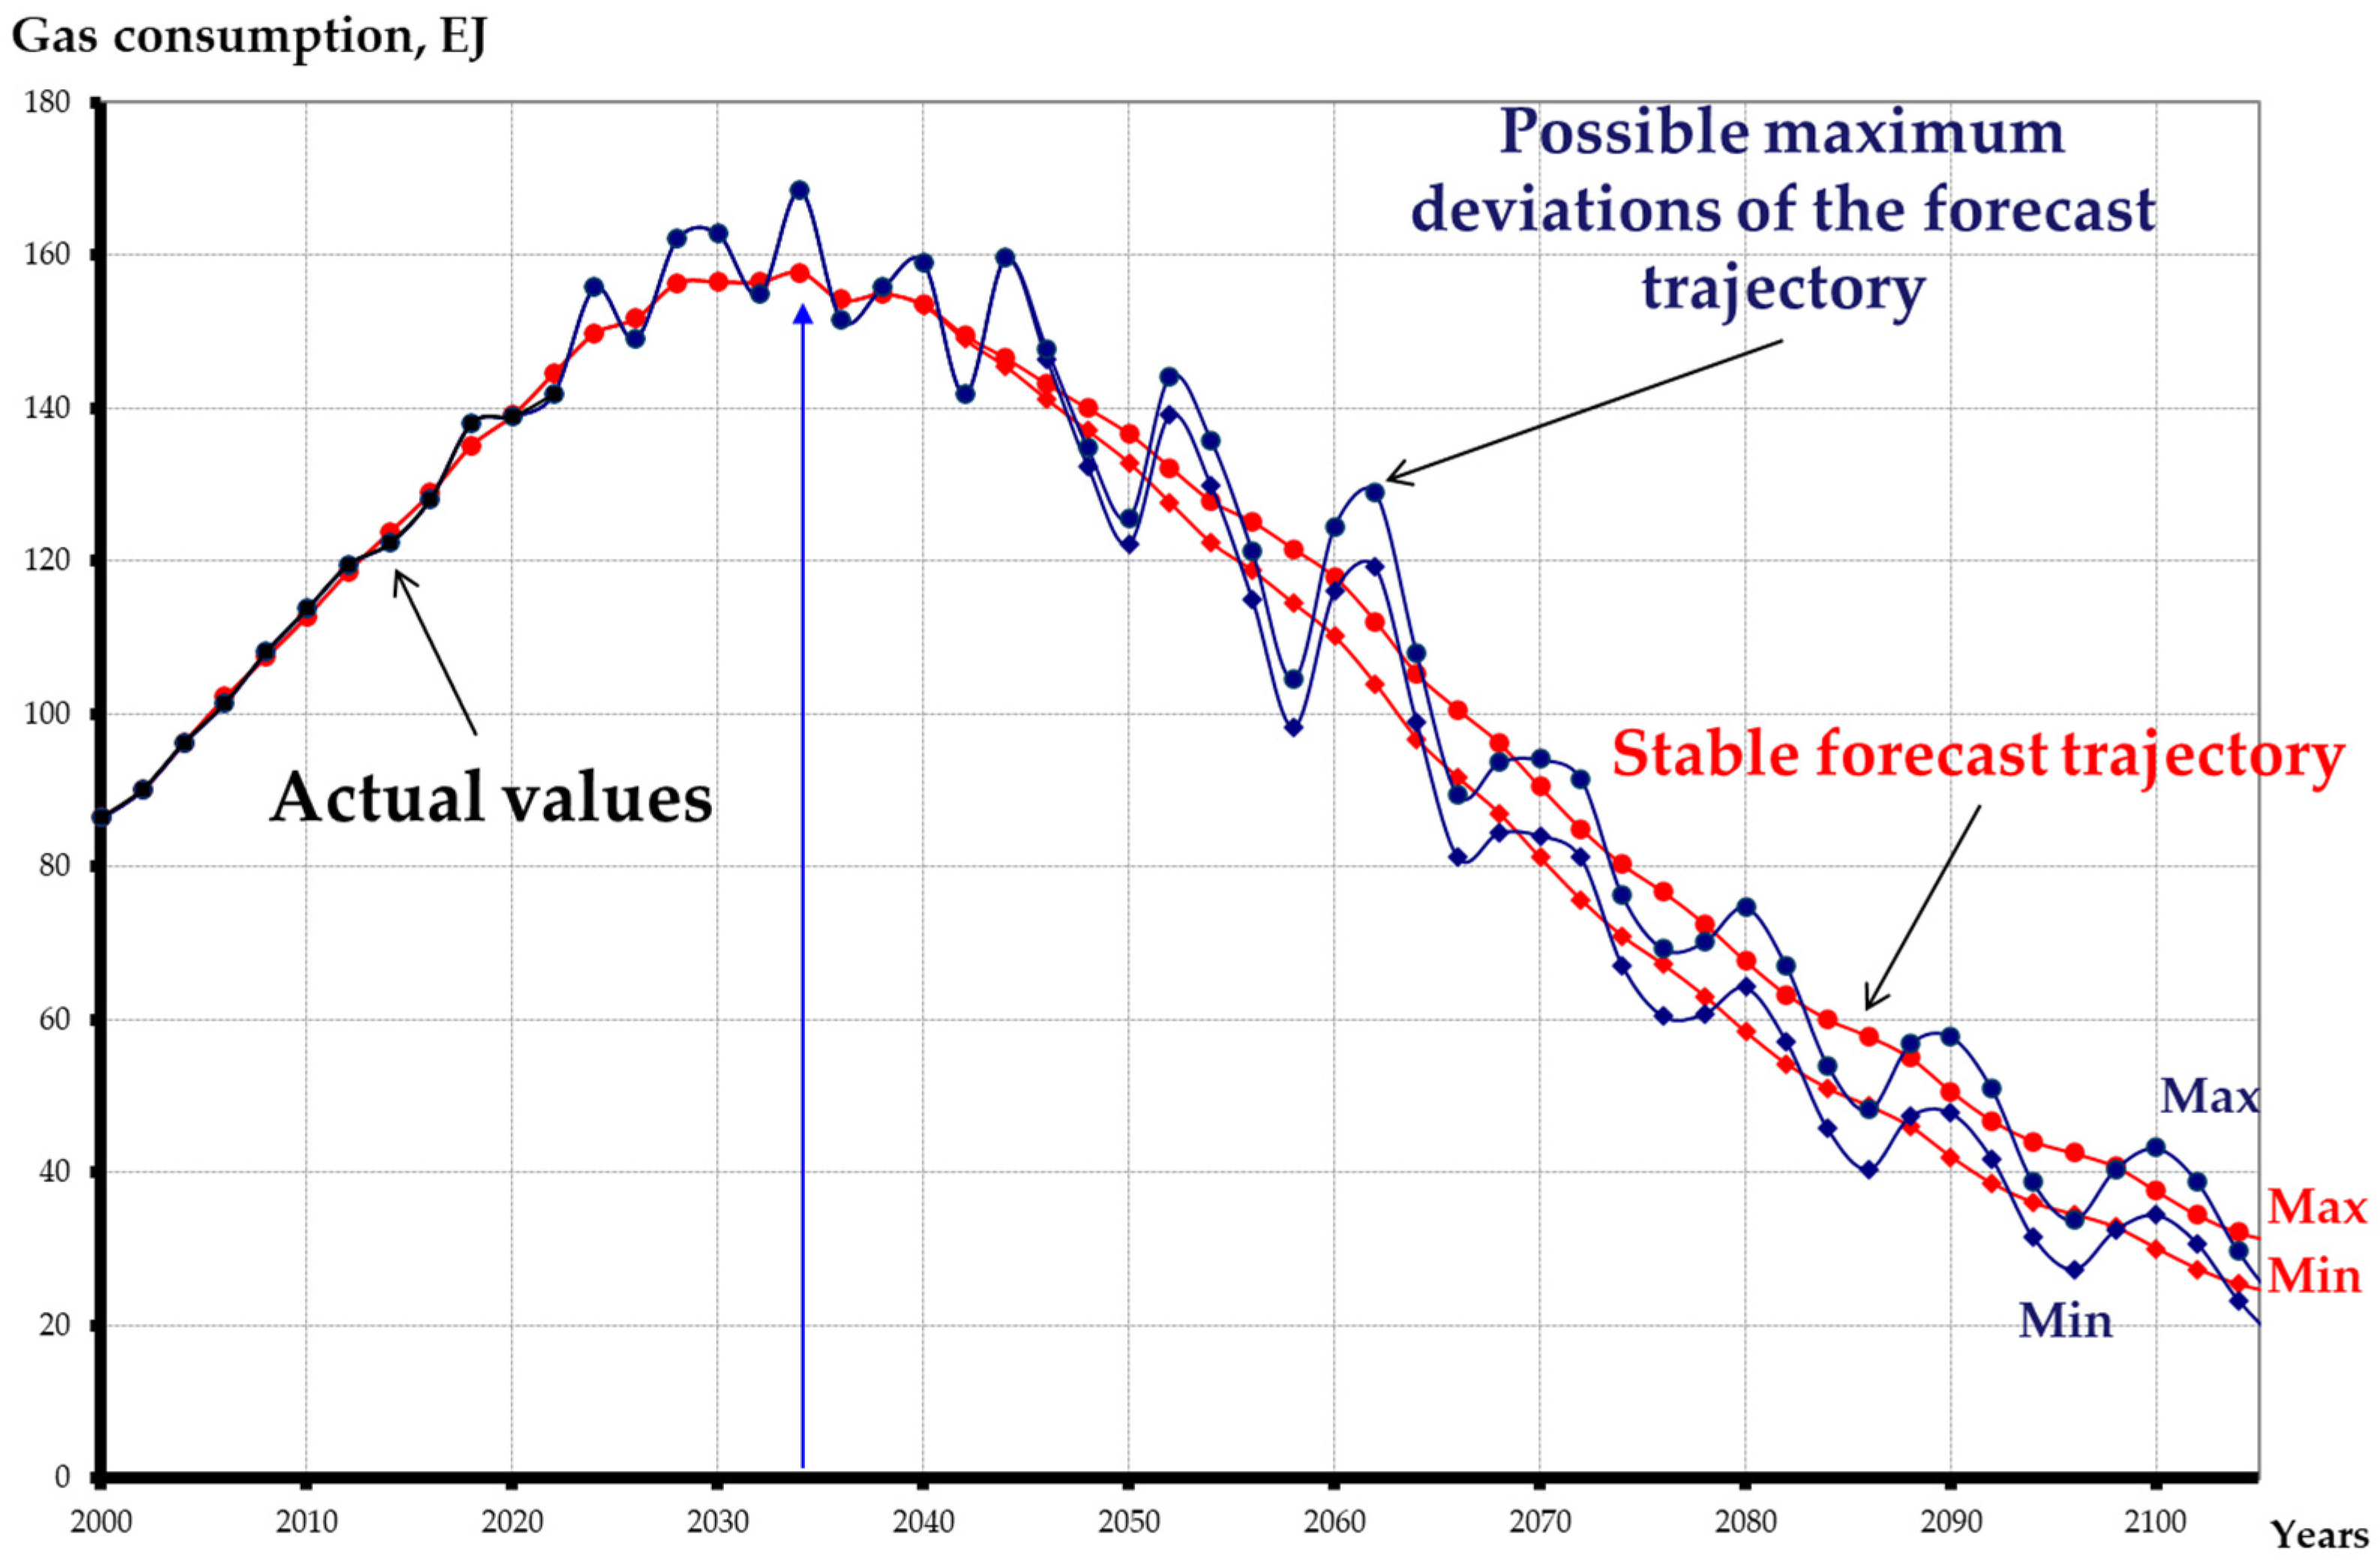
By the middle of the century, oil consumption will most likely decrease by 30%, and it will converge to extremely close to “zero” by the end of the century. Only global gas consumption may have a longer stabilization phase in this century (Figure 18).
In the period of 2030–2035, global gas consumption is expected to reach its peak value and remain stable until approximately 2040. After this period, a systemic reduction in gas consumption seems possible, and by the end of the 21st century, its consumption may apparently be only 20% of the maximum achieved level.
Based on these predictions, the reduction in the consumption of traditional energy sources is expected to be rapidly replaced by alternative energy sources. Consequently, according to the results of the present neural network forecast, the global consumption of renewable energy sources will increase by 4–6 times by the middle of the 21st century (Figure 19).
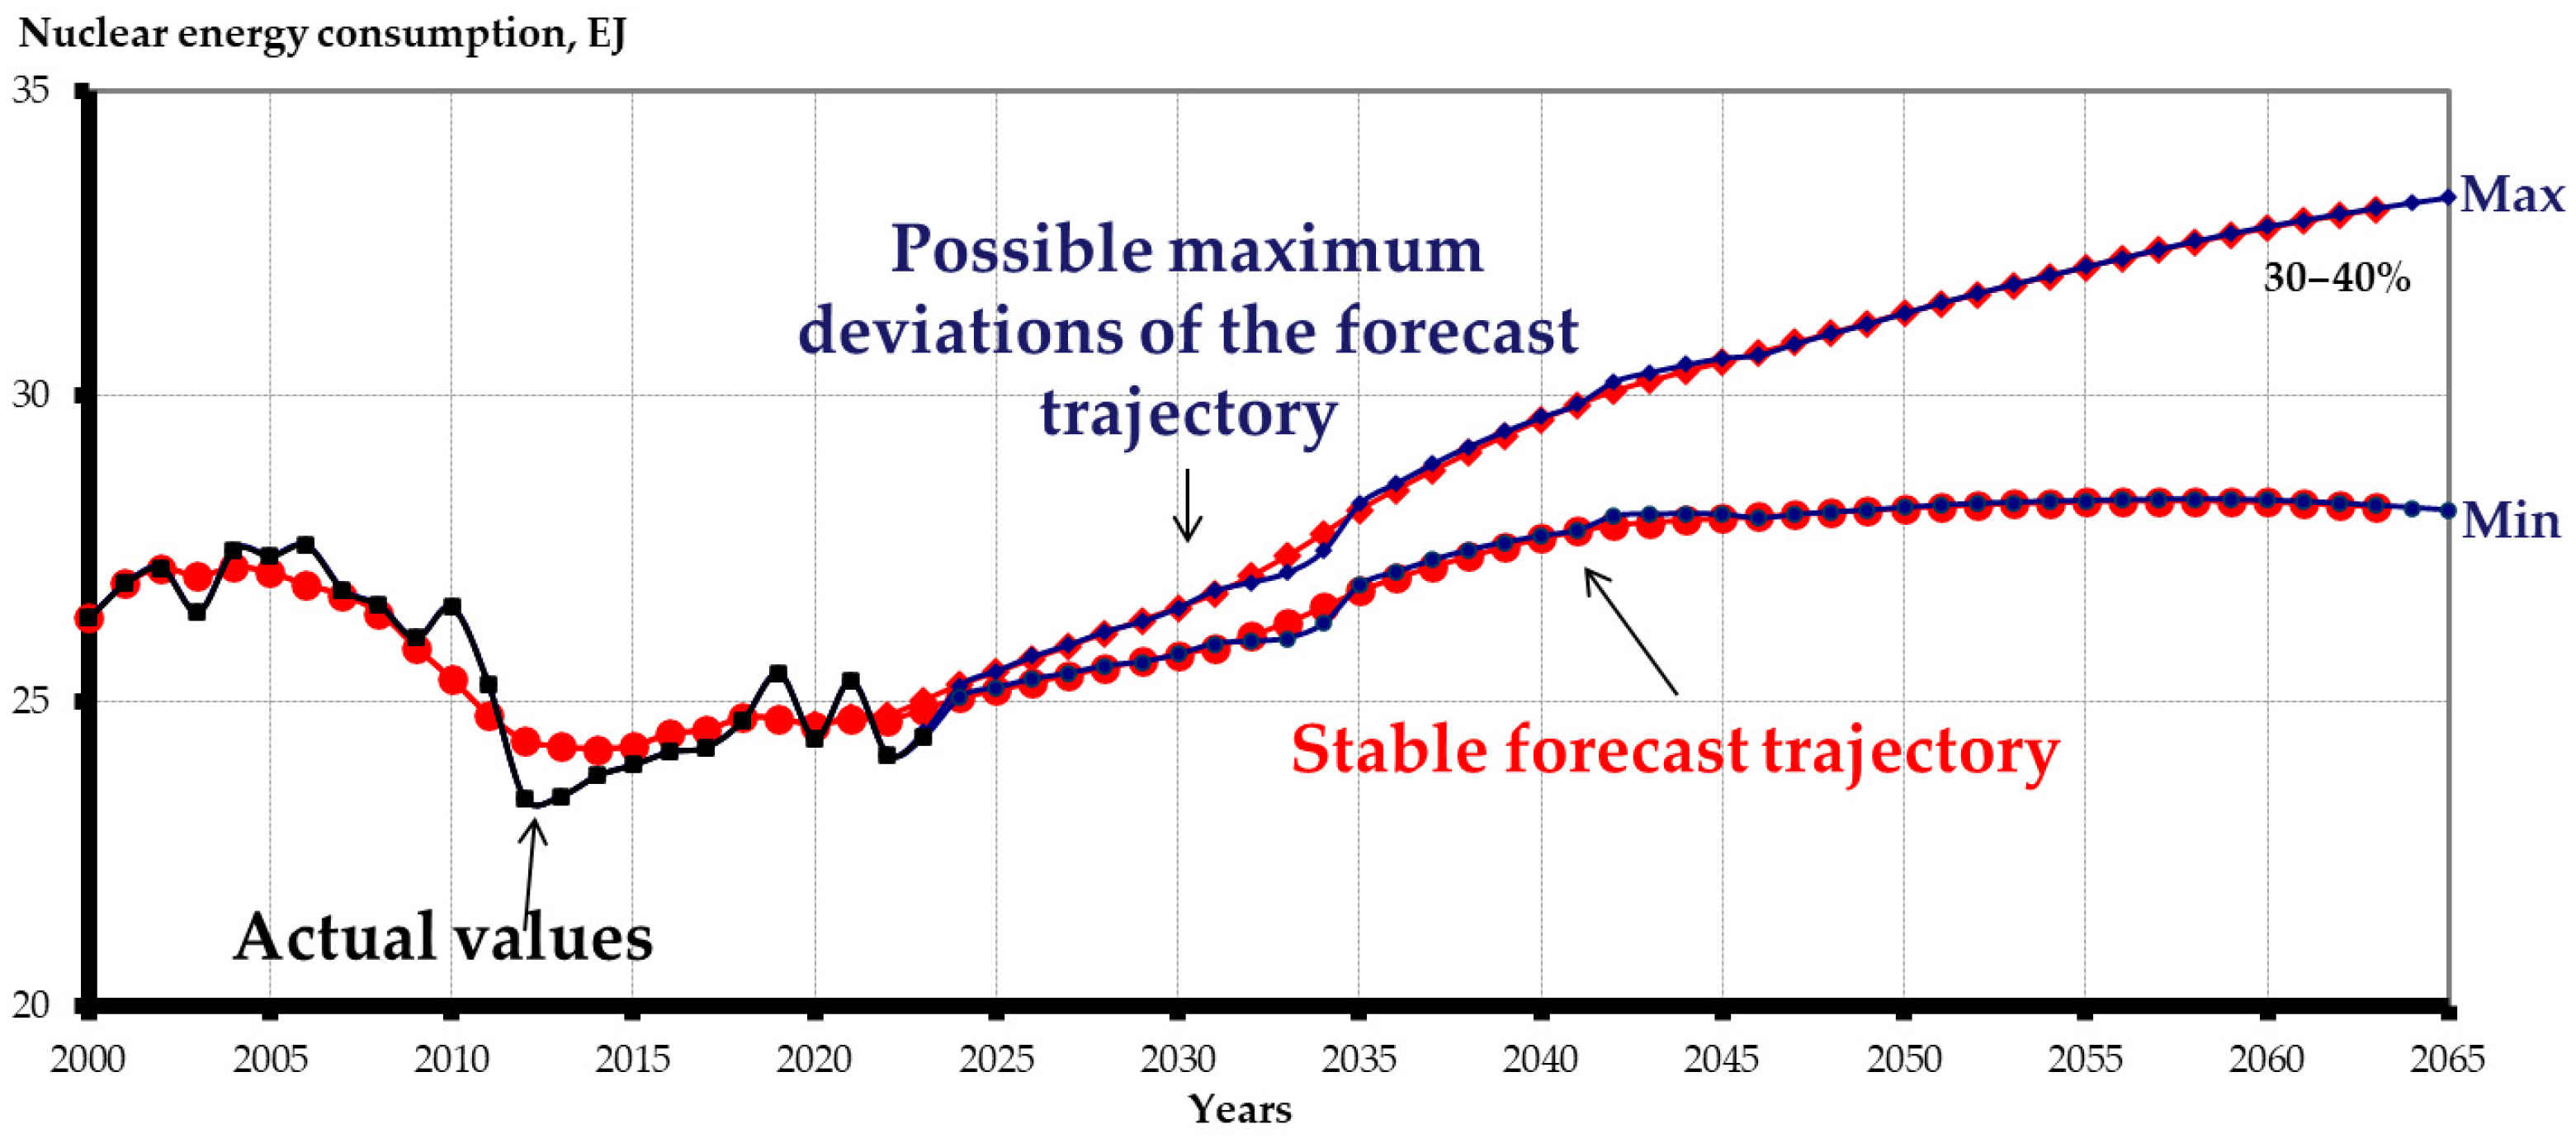
The reduction in the cost of renewable energy technologies, as well as the possibility of combining them with energy storage devices and integrating them into the general energy system of traditional energy, significantly increases their share in the global fuel and energy balance. In addition, after a “cooling” period (2010–2020) for the use of nuclear power, understanding of the importance of nuclear energy in future global energy development will begin to revive.
According to the results of the neural network forecast, the volume of global energy consumption by nuclear power plants may increase by 30–40% by 2060–2065 (Figure 20).

4.2. Energy Transition as a New Quality of World Energy Development

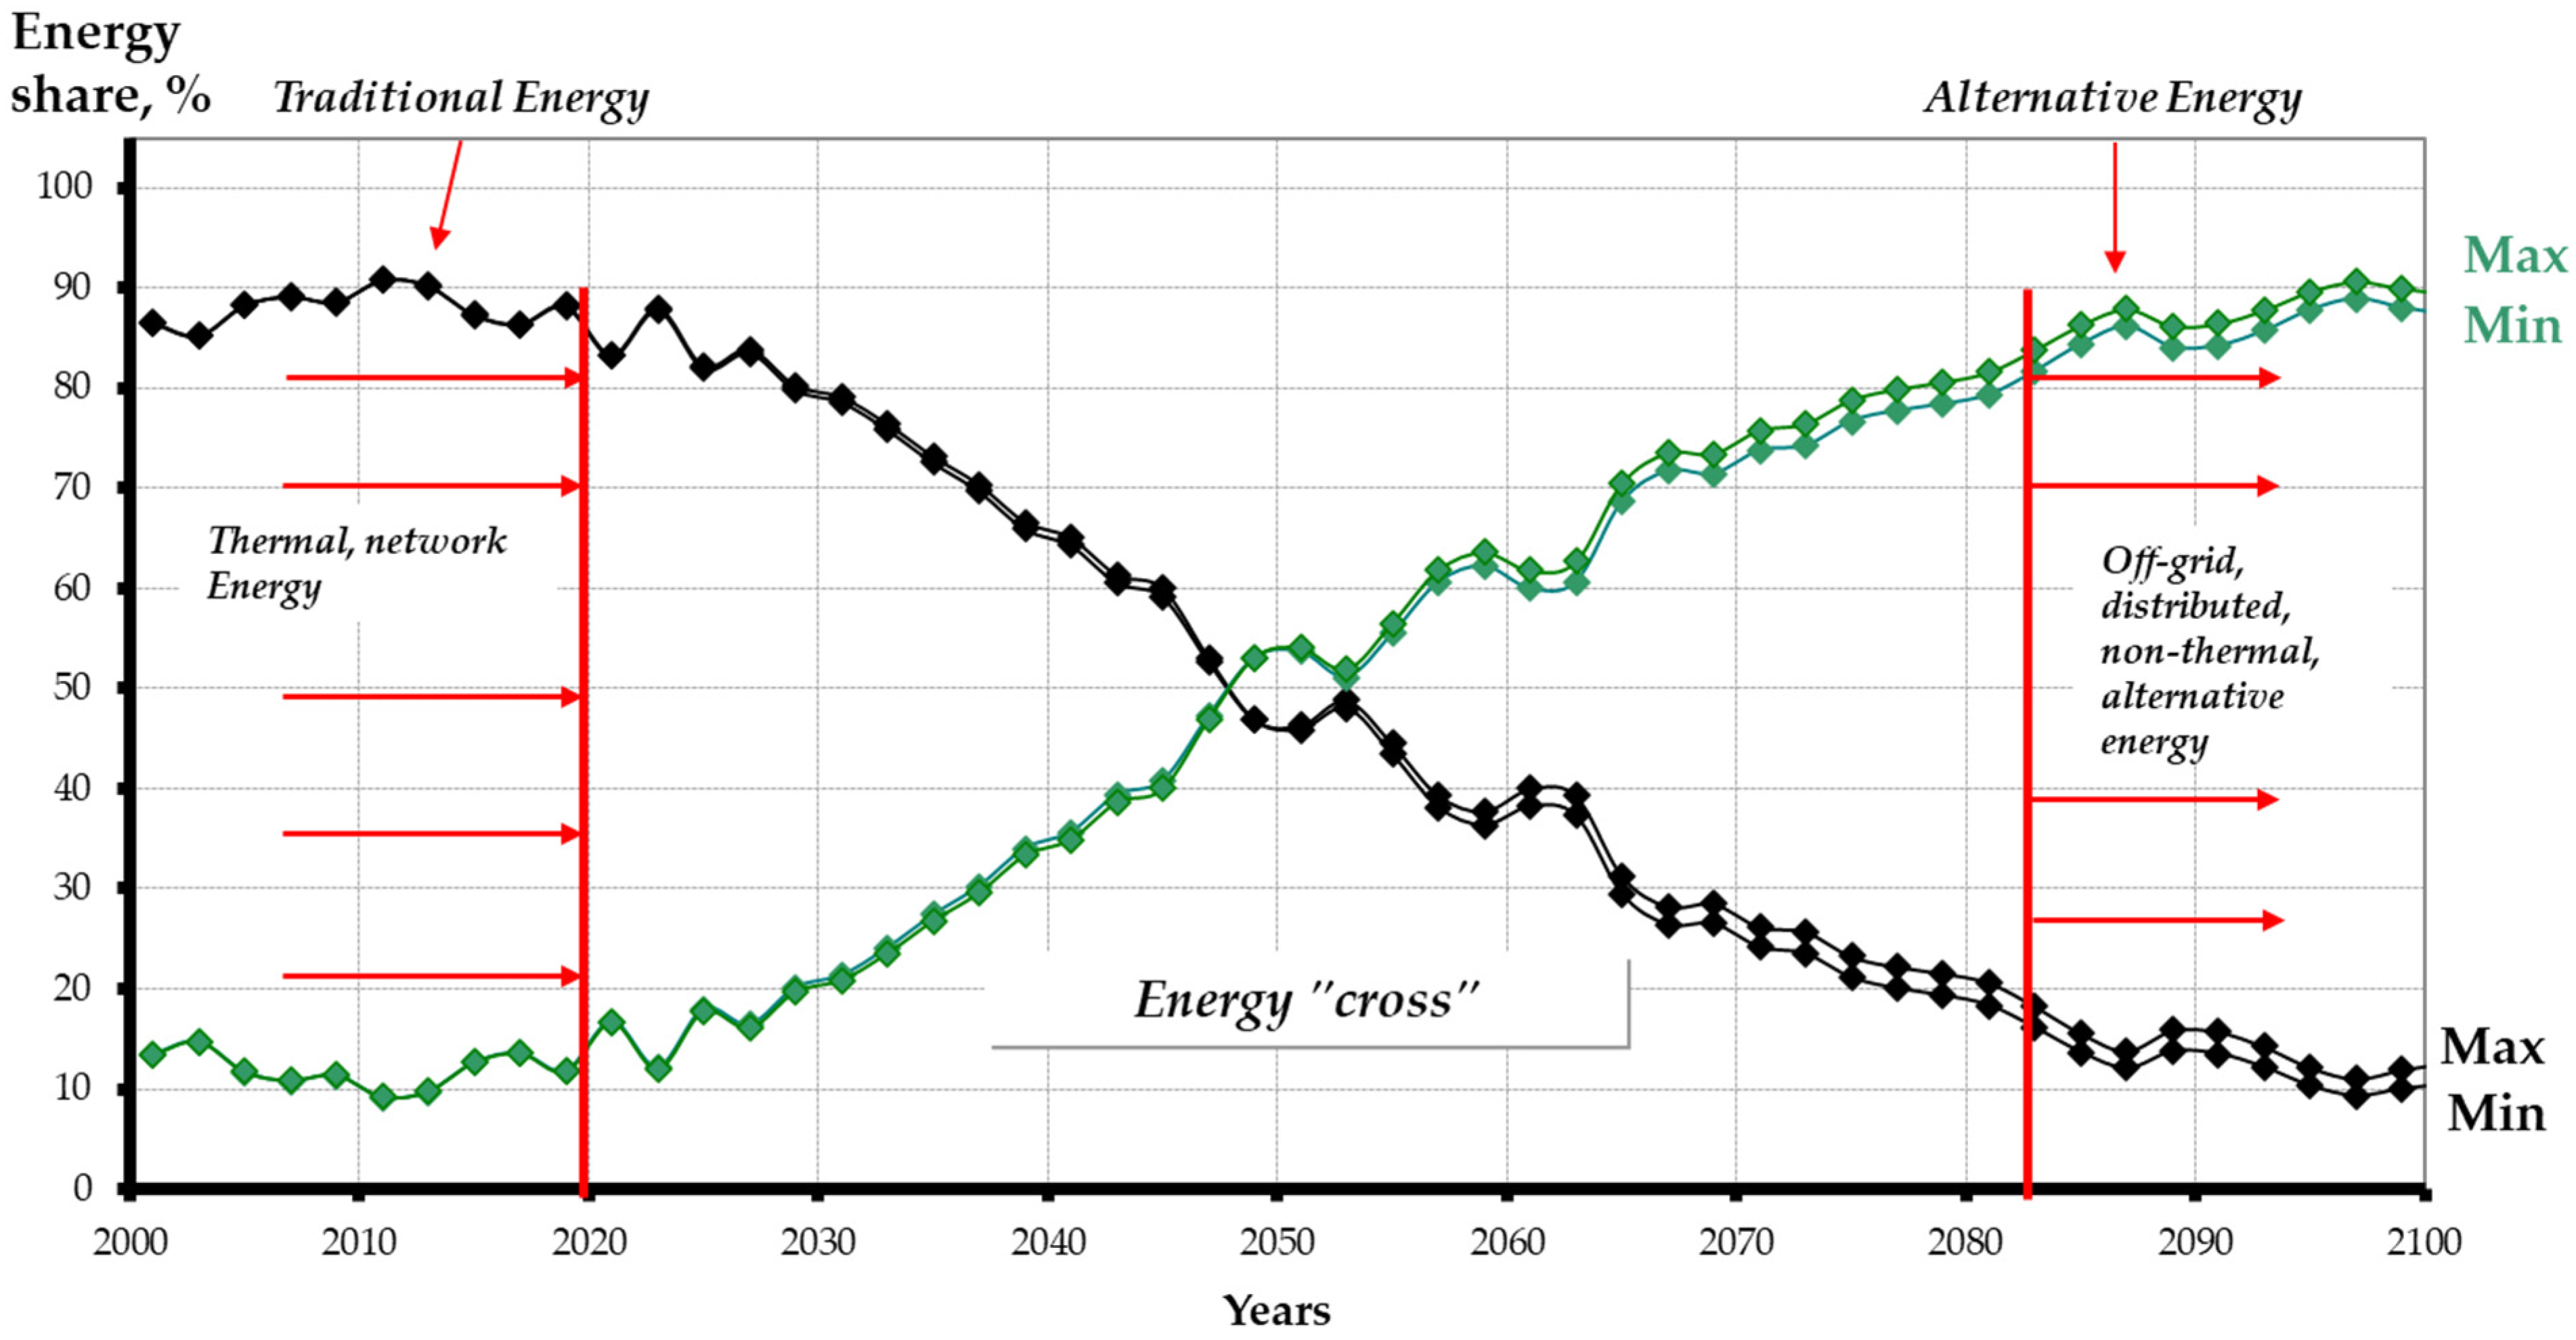
As alternative energy sources expanded, energy began to shift from one state to another, or more precisely, qualitatively different/opposite. At present, a turning point, a change of polarity, a so-called “polarity reversal” of energy development is taking place, which means an energy transition, namely a transition to a new quality of energy development (Figure 21), where alternative, more advanced quality energy will replace traditional energy sources and will gradually take over the market and gain the same share of the world energy balance as traditional energy had earlier. The concept refers to the shift from a predominant reliance on fossil fuels to an increased adoption of new quality energy sources, but it also refers to the polarity change from the supply market to the demand market depending on the demographic, technological innovation, and political–economic status of developed and developing countries [38,67].
Given that the energy sector was mainly traditional in 2020, based on the thermal generation of large capacities and an extensive power transmission network, then, approximately by 2080, opposite features to the current pattern will be detected, meaning non-thermal energy generation of small, distributed capacities, where a gradual reduction in the network component occurs.
Two periods of energy transformation can be distinguished. The first 30-year period (2020–2050), in which traditional energy is declining but still remains dominant, and the subsequent 30-year period (2050–2080), in which alternative energy will almost completely replace traditional energy sources with an increasing share in the global energy balance. By around 2050, world energy will reach a “crossroads,” namely a kind of “energy cross,” symbolizing the end of the traditional energy dominance era. This turning point indicates and is the beginning of alternative energy dominance. This concept refers to the critical juncture at which global energy transitions from traditional fossil fuels to renewable energy sources, influenced by the factors discussed in this paper. At local levels, some economies are already at critical junctures in their energy transitions [68,69,70]. In essence, 2050 is the year of the final transition to a new quality of global energy, at which point the global energy transition can be declared complete. Moreover, it has caused the emergence of a new quality in both global technological and economic–political development.

4.3. Main Laws of the Global Energy Transition

In order to answer the question of the essence of the new quality of energy, we must consider the fact that energy, as a driving force behind natural phenomena and a core aspect of scientific study, is governed by a number of fundamental laws that must be taken for granted. Perhaps one of the main laws of energy development in the world is the law of permanent growth of the energy density of the used energy sources. In this case, the energy density is understood as the amount of energy per unit mass of the energy source (energy resource) [26].
The indicator for energy density is widely used by power engineers, and is called the caloric equivalent of the fuel used (k) [71]. Firewood (k = 0.2 tU/t), coal (k = 0.7 tU/t), oil (k = 1.0 tU/t), gas (k = 1.8 tU/t), and hydrogen (k = 4.0 tU/t), etc., are energy sources consistently used during the economic turnover of the world economy, systematically increasing the density of consumed energy (1 tU/t = 29.3 Gj = 0.7 BOE). However, such permanent growth has its limit (Figure 22), which, in accordance with Einstein’s formula, does not exceed the value of c2 (the square of the speed of light) [29,72,73].
In fact, the growth of the energy density of energy sources over time reflects the law of energy conservation. The total energy of the used energy sources (W) is the sum of the realized energy E and the potentially unrealized energy P:
W = E + P
In this case, the realized energy is defined as
E = q × m ,
where q equals the energy density, T/t, and m is the fuel mass, t.
The potentially unrealized energy can be determined using the following equation:
P = Δ q × m ,
where Δq is the unrealized energy density, that is, Δ q = c 2 q .
It should be noted that realized energy is primarily converted into the kinetic energy of machines and mechanisms used in the world economy, whereas unrealized energy indicates how much of it has been maximally utilized.
In light of the above, it is easier to understand that, in general, the sum of the two energies is a constant value, and the growth of energy density, in accordance with the S-shaped curve, for example, from point (1) to point (2) in Figure 22, is subject to the law of energy conservation. In this regard, the process of movement along this curve is fundamental in nature and has the property of irreversibility, that is, up and only up, in the direction of increasing realized energy.
The increase in energy is the work performed by a certain force of development. Leaving aside all discussions about the nature of this force, we note that the increase in energy per unit of time is power. In this regard, the global energy transition that is currently being implemented in the world economy, the transition from the lower “horizontal platform” of movement (t1 time in Figure 22) to the zone of vertical escalation (t2 time in Figure 22), is a huge “leap” in the power of development. Such a transition occurs only once during the entire existence of human civilization. World energy is moving from the zone of low energy densities to the zone of high and very high energy densities.
Currently, mankind is shifting towards a new civilizational path of advancement via energetic, technological, political, economic, and ultimately, military conflict, whereas the causes for progressing into high energy density zones must be identified and clarified.
The truth is that energy is the fundamental basis of global technological development. It is primary in regard to technologies found in the economy, such as technological innovations during the global industrial revolutions that have occurred in history [74]. The development of energy sources is outpacing that of technology, and energy is used and required in each and every sector of the economy [12].
The first industrial revolution is associated with the introduction of the coal-fired steam engine in industry [75], and coal appeared as an energy source. The use of coal triggered the invention and development of the steam boiler, steam locomotives, and subsequently rails, sleepers, and railway stations were constructed. The appearance of oil as a new energy source triggered the second industrial revolution, and just after the internal combustion engine was invented, cars, highways, and gas stations were constructed [76]. The transition from oil to gas hallmarks the era of the third industrial revolution, whereas a transition to renewable energy sources could be associated with the beginning of the fourth industrial revolution.
In this sense, the use and adoption of newer energy sources with higher energy densities can be explained by the desire of mankind for new knowledge while implementing new technologies.

4.4. Interrelation of Global Transitions and Global Technological Transition Patterns

The pattern of the primacy of energy in global technological development explains the current global technological transition. It is based on the energy transition to the zone of vertical escalation of the energy density of energy sources used (see the transition from time t1 to time t2 in Figure 22). As explained earlier in this paper, at present, mankind has entered the era of four closely interconnected global transitions at once: (1) demographic, (2) energy, (3) technological, and (4) political–economic [27]. Figure 23 demonstrates the dynamics of these transformations, where Phase 1 (blue) shows the average annual population growth rate, relative units (year1912 = 1), Phase 2 (red) is the average annual growth of patent applications, thousand pieces, and Phase 3 (green) displays the level of global escalation (military–political), relative units (year1992 = 1) (* = units of measurement).
The demographic transition “pulls” along the energy transition (estimated by the dynamics of the intensity of global patent applications [78]) as well as the technological transition. The latter has become the basis for the formation of the global political and economic transition (measured by experts by the level of sanctions and military–political tension). It should be highlighted that, just as in the energy sector, there is a “polarity reversal” of global technological development at the moment, as the annual growth of global patent applications drops into the negative zone (see Figure 23) [67,79].
The essence of such a transition is a change in the paradigm of technological development. During the first, second, and third industrial revolutions, labor productivity grew due to the expansion of manual labor mechanization; however, by now this type of mechanization has reached its limit. Civilization, implementing the fourth industrial revolution, is entering a new stage of development, in which labor productivity will increase owing to the growth of its intellectualization level [80]. A new era is on the horizon, where the main driving force of and the key to global development will be the effective management of material resources and energy rather than just their volumes accumulated and used in economies and societies.
In conclusion, it is essential to note that, according to our calculations, the level of military and political escalation, having reached its maximum value in 2024–2025, will most likely continue to decrease in the near future. Political and economic development is also entering a phase of qualitative change.
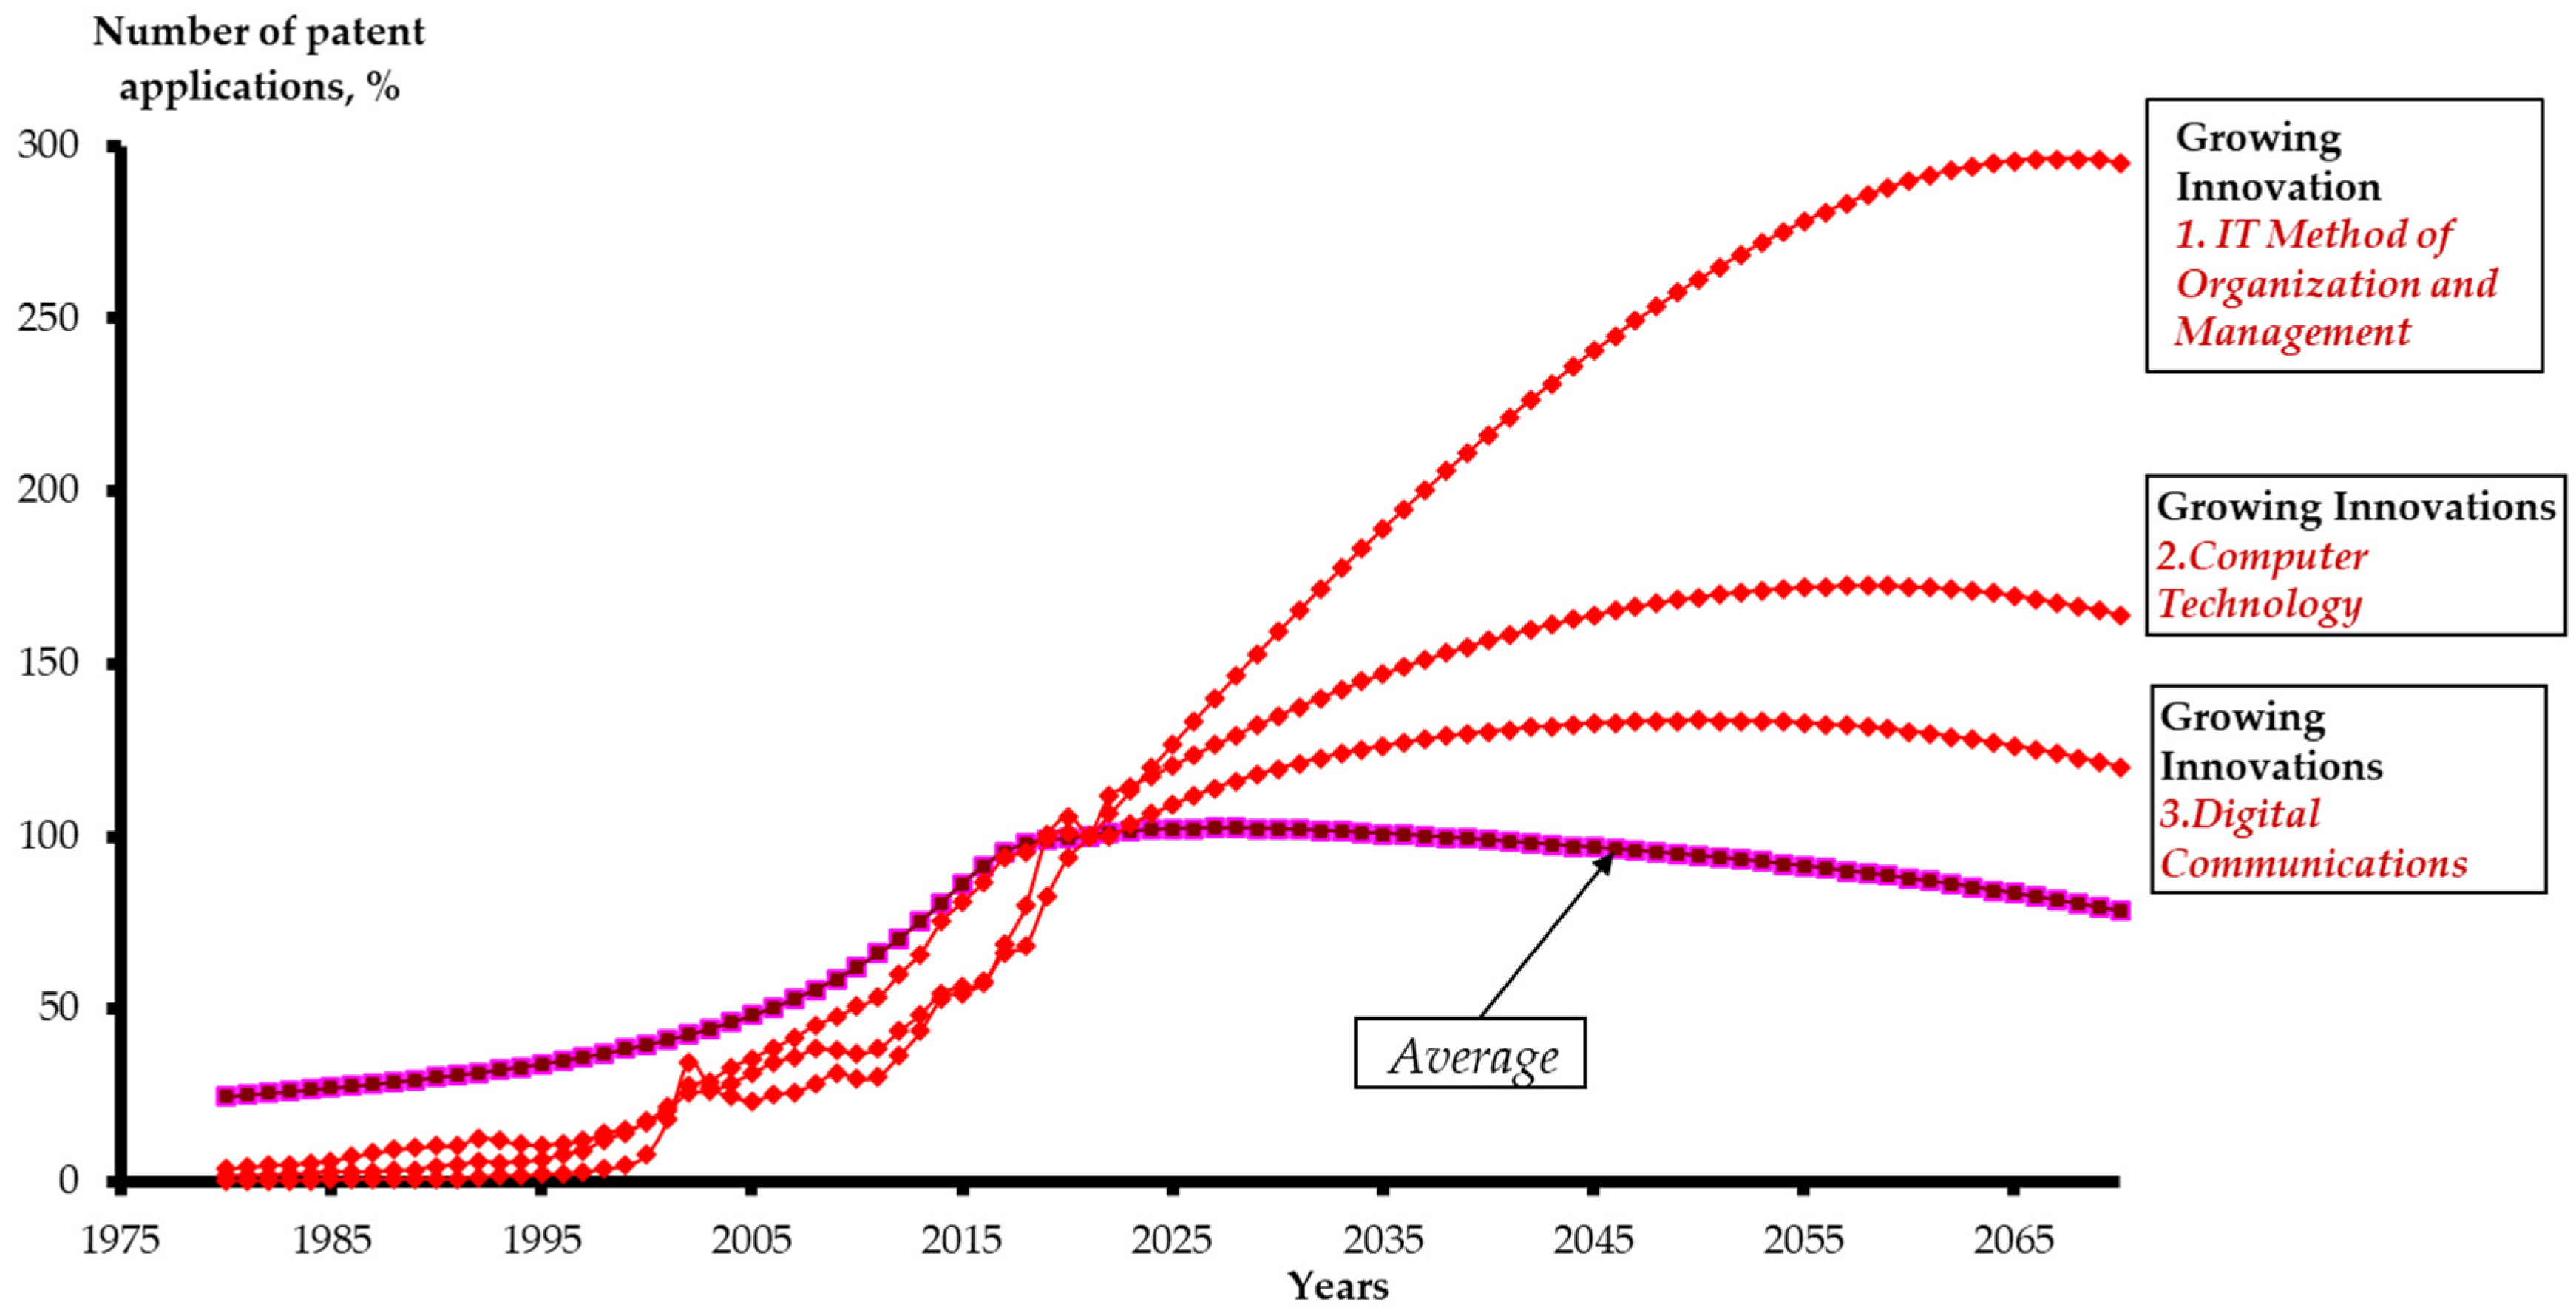
The question arises as to whether the above dynamics of the global technological transition are confirmed. As the statistical analysis of the dynamics of global patent applications shows, the growth of technological innovations after 2020 will decrease. However, after the specified period (up to 2030), non-technical innovations (organizational, managerial, social, economic, cultural, and informational) will increase sharply, implying that the technological transition is associated with a highly significant increase in intellectual innovation [78]. In fact, the fourth industrial revolution is the beginning of global intellectualization; first in industry (the program “Industry 4.0”), and then in all spheres of society (the program “Society 5.0”) [81,82,83]. Analyses and forecasts of global patent applications made the identification of “stable” and “growing” innovation groups possible (Figure 24).
The most “expanding” innovations in the future will most probably be IT methods of organization and management, computer technologies, and digital avenues of communication. As calculations show, these technologies will take around a 40% share of the entire new technological portfolio in the period up to 2040–2050, meaning that completely new, not yet existing economic sectors will emerge, including new production and social infrastructure.
Consequently, the widespread intellectualization of the economy will most likely require a change in the current system of assessments and criteria for the effectiveness of implemented projects.

4.5. Neural Network Forecast of Energy Density, Space as a Space of New Opportunities for Energy Development

The growth of intellectual innovations is aimed at increasing the level of robotization of production and labor productivity in the economy. The growth of labor productivity requires a transition to alternative and more productive energy sources, which is evidenced by the earlier presented pattern of energy transition to the zone of vertical escalation of the energy density of energy sources (see transition from time t1 to time t2 in Figure 22).
The dependence of labor productivity on the energy density of energy sources has been established in this study. In the global economy, labor productivity as a whole grows proportionally to the energy density of energy sources, taken to the power of 1.5 / 2 , meaning that in the phase of the vertical escalation of the above-mentioned indicator (phase between time t1 and time t2 in Figure 22), we should expect a very significant increase in labor productivity, exceeding the growth of the energy density of the energy sources used.
According to the research estimates, the energy density of solar and wind energy sources is equivalent to a value approximately 4–6 tU/t. For comparison, the energy density of natural gas is approximately 1.8 tU/t. These sources, as well as the development of nuclear energy, ensure the transition to the zone of high energy density values (after time t2 in Figure 22). In accordance with the results of the neural network forecasts, the following dynamics of changes in the energy density of energy sources can be detected in the 21st century (Figure 25).
In the forecast period, two zones of change in energy density can be distinguished, namely the transition zone (Period I) and the vertical escalation zone (Period II). In the transition zone, energy density (worldwide) increases from the current level ( 1.1 1.3 T U / t ) to approximately 2.5 3 T U / t by the end of 2050, i.e., by 2.5 / 3 times during the entire transition period. This level of energy density can be fully ensured by wind and solar power sources found on the Earth’s surface. Moreover, such energy density can be achieved using constantly progressing energy storage devices and batteries.
By the end of the transition period (Period I), alternative energy share will reach a turning point, an “energy crossroads” (see Figure 20), and become dominant. However, this alternative energy will differ significantly from the current one, as it must respond and correspond to the achievement of high and very high energy densities.
According to our estimates, compared to the existing level, the average energy density will increase by approximately 6 times already by 2060–2070, amounting to 6–7 TU.t/t, meaning that renewable energy sources will be increasingly taken out into outer space, i.e., into the zone of high intensity of solar radiation. The scale of orbital energy formation with the deployment of space groups of solar power plants in the Earth’s orbit is expected to increase significantly [84,85], which is expected to be in high and increasing demand.
In addition to the growth of labor productivity mentioned earlier, the average speed of movement of people and goods in the global economy will increase in approximately the same proportions as of energy density. Should we assume that the average energy density will, for example, double, the average labor productivity and speed of movement in the global economy can be tripled, which is quite achievable in the near future. Calculations show that such energy density can be ensured by batteries already in use in practice.
It can be stated that with an increase in energy density, the average speed of movement of people and goods increases significantly, that is, in the case of a 6–7-times increase in energy density in the vertical escalation zone compared to the current period, a more than 10-times jump in the average speed of movement should be expected. Should we estimate the current average speed to be 80–100 km/h, in the years 2060–2070, it should reach at least 800–1000 km/h, which speed of movement of people and goods could be achievable due to the widescale use of aerospace transport. In fact, it implies a transition to a new quality of development in the world’s transport and communication infrastructure. Numerous aerospace and, most likely, unmanned groups (a set of vehicles that are calibrated to provide a specific function) could be fueled with energy generated at orbital power stations, transmitting energy to aircraft remotely.
The exploration of outer space will largely give a new impetus for the development of energy technologies, including those used in everyday life. In the zone of the vertical escalation of the energy density of energy sources, a specific “link” will occur between the parallel development of space and energy technologies. Simultaneously, the pace of outer space expansion will be determined by the speed of energy and information transformations.

4.6. Global Transport and Communications Transition

The increasing demand for high-speed transit in the global economy is evidently reshaping worldwide transportation dynamics. Consequently, the transportation of both individuals and goods is progressively shifting away from reliance on conventional rail and sea operations. Supporting this trend, global rail freight volumes (in million tons) peaked between 2015 and 2020 (Figure 26) [86,87].
Based on the results of the neural network forecast, a steady decrease in the volume of rail-transported cargo is projected post-2020. By 2050, compared to its peak volume, it may decrease by approximately 56 62 % . This is a fairly large reduction in the volume of rail freight, which, in all likelihood, will be observed in the future despite the future widespread development of high-speed train traffic.
A similar situation, however, with a shift to the right by 10 years, is most likely to be observed in the sea transportation sector (Figure 27).
The forecast results show that the volumes of these shipments peaked around 2020–2022, and their systematic decline will begin post-2030 [88]. In 2050, the volume of global sea freight is expected to decrease by an average of 39 42 % . The observed reduction in maritime and rail transportation volumes indicates a shift in the global transport and communication paradigm towards aerospace modalities. However, it is crucial to recognize that this represents only one facet of a more complex systemic evolution.
Conversely, the structure of sea and rail transportation is significantly affected by the delivery of oil, oil products, liquefied natural gas, and coal. As predicted, due to the economies’ energy transition to the zone of vertical escalation of the energy density of energy sources, the demand for the transportation of these products will be significantly reduced, which, in addition to the shift to renewable energy sources, will be due to the development of nuclear energy, an energy with high energy densities, millions of times higher than the energy density of hydrocarbon energy sources. Therefore, this transition implies a substantial advancement in fuel logistics optimization, considering that a contemporary nuclear reactor consumes approximately 22 tons of fuel annually [89].
In contrast, a coal thermal power plant of the same capacity consumes coal of two trains of 60 cars per day, with a carrying capacity of 60 tons of coal, which is more than 1.3 million tons of coal per year. Therefore, due to the transition, the effects of reducing transportation volumes are enormous.
In the transportation structure, large-tonnage energy products will be increasingly reduced, and cargo will increasingly become low-tonnage, small-sized, and more suitable for delivery by aerospace transport. Advancements in aerospace transport will be increasingly combined with progress in orbital energy technologies.

5. Forecast Contour of Future Energy

The results of the neural network forecast of the energy density of energy sources predict a significant transformation in the world energy balance. The high energy density of energy sources with a prediction of almost complete exhaustion of traditional energy capabilities by the end of the 21st century indicates a significant share of nuclear and, probably, thermonuclear energy sources possessing an energy density potential thousands and millions of times greater than the energy density of traditional energy sources.
The conducted neural network forecast predicts that by the end of the 21st century the expected energy balance will have around 20% of renewable energy sources, including orbital groups, and about 80% of nuclear, potentially including thermonuclear energy sources.
The research results are in line with the forecasts of the world’s leading agencies, especially the IEA forecasts and scenarios [56,58,90], namely the Stated Policies Scenario (STEPS), the Announced Pledges Scenario (APS), and the Net Zero Emissions by 2050 Scenario (NZE) [90]. Table 3 compares the performance of the developed model with the results of the BP and IEA performances, using relative standard deviation (%). IEA applies the GEC (Global Energy and Climate) Model, which is a bottom-up partial-optimization model that integrates price sensitivities to meet energy demand, transformation, and supply. It builds on the principles of the TIMES (The Integrated MARKAL-EFOM System) model [91], a linear-programming tool that minimizes system costs to explore different energy futures [92].
The parameters for the development of the energy sectors presented in the article predominantly align with the “APS” scenario, which reflects the commitment of a lot of countries to decarbonize their economies. The replacement of traditional energy with alternative energy, as presented in Figure 21, corresponds to the levels between the “STEPS” and the “APS” alternatives. According to the IEA forecast options, the level of traditional energy should drop from 60% to 30% by 2050. According to the authors’ calculations, it will be approximately between 50 and 45%, which means that the authors’ results are adequate and satisfactory.
This ratio allows us to ensure the energy density levels achieved during the forecast calculations (see Figure 24). A significant “impetus” for the development of global energy in the period of 2050–2060 will apparently be associated with the widespread use of advanced closed-cycle nuclear plants operating on fast neutrons, which will significantly increase the average energy density of energy sources used in the economy. Apparently, the use of thermonuclear energy sources will also be possible during this period, which is evidenced by the great assertiveness of many countries in the implementation of thermonuclear projects [93,94]. As evidence, on 14 April 2023, the “Innovation Strategy for Thermonuclear Energy” was adopted in Japan, which is the first open document that very clearly assesses the prospects for the development of thermonuclear energy [93]. It outlines measures to create thermonuclear plants for commercial operation around 2050. As thermonuclear energy sources are safe in terms of radioactivity, the development of thermonuclear energy is closely “linked” with the solution of the problems of the so-called “green” climate agenda. In fact, thermonuclear energy solves two major problems. On the one hand, it ensures environmental cleanliness, and on the other, it achieves energy abundance, which could eliminate the energy poverty of the world’s population.
The path to the development of thermonuclear energy lies in the improvement of nuclear energy technologies. The most likely directions of its transformation are the desire to implement technologies for direct conversion into electrical energy and minimize the size of energy sources. In this regard, Japan’s intentions, which are actively working on the creation of small (up to 300 MW) nuclear installations, are indicative. Meanwhile, great importance is attached to the development of small mobile nuclear sources (up to 1 MW, weighing up to 40 tons) that could fit into standard containers. Although the cost of such reactors may initially exceed that of conventional energy generation, the benefits of their mobility and flexibility is undeniable, especially in the electrification of individual local zones and hard-to-reach areas of a country [94]. The development of small-scale thermonuclear energy for direct energy conversion is presumably the most promising direction. Overall, it is highly probable that energy systems will transition towards distributed and gridless configurations, primarily utilizing a form of “nuclear battery”. The higher the energy density of energy sources, the smaller their sizes. Arvanitidis et al. [95] assessed the viability of a nuclear-based microgrid integrating small modular reactors and battery storage systems. Badakhshan [96] presented the optimizing of small modular reactors to support maritime transportation. The study by Paul et al. [97] focuses on nuclear batteries (fitting in a container) in urban environments and demonstrates its application in grid reinforcement, for instance. The authors refer to the 2050 timeline and state that such nuclear batteries are not in commercial use yet, while the UK’s National Nuclear Laboratory (UKNNL) provides information on space batteries for customer services [98]. Boungiorno et al. [99] discuss the competitiveness of nuclear batteries in large markets and introduce a compact plug-and-play reactor for commercial use. Bartak et al. [100] evaluate the benefits and challenges of SMRs and argue for their competitiveness in the long run. Nuclear batteries, such as Radioisotope Thermoelectric Generators (RTGs), are vital for space missions, providing reliable and long-lasting power [101,102]. Three-dimensional nuclear batteries are also being developed, leveraging advanced semiconductor technology and microfabrication to create high-density, long-lasting power for remote uses [103]. The utilization of outer space dates back to the 20th century [104], and the need for nuclear batteries has already arisen in space exploration missions [105], where nuclear batteries provide electricity generated from natural radioactive decay to spacecraft. There are several innovative developments in this technology such as, for example, Americium-241 as a potential alternative to plutonium-239 for deep space mission to be used in RTGs and space batteries [106]. Zeno Power cooperates with the U.S. Department of Defense (DoD) on off-grid nuclear batteries [107]. In Russia, the Keldysh Research Center has developed a nuclear space energy program up to 2035, presented in 2024, which includes the deployment of nuclear and solar power plants on the lunar surface within a joint project with China [108]. Russia has also made great strides towards developing small compact energy sources, as for several years now, the floating mini power plant “Lomonosov” [109] has been operating in the North, generating energy from nuclear fuel. It operates independently and autonomously from the general centralized power supply network.
The experience of the United Arab Emirates (UAE) in developing an Energy Strategy with a forecast horizon up to 2075 also deserves a positive assessment. The rapid pace of scientific and technological development requires more distant horizons for energy forecasting. Certainly, these may only be forecast contours, but they also represent significant value in determining strategic paths for energy development.

Integrating the ‘Energy-Density Law’ with IAM Pathways and Socio-Technical Transition Theory

The ‘law of energy density’, being a civilizational law of changing energy sources used in the development of society, is grounded in fundamental physical principles, including the law of conservation of energy and Einstein’s equation, E = mc2. This research aims to illustrate how these principles govern the historical shifts and cycles in energy sources, and the growth of energy density—from wood to coal, oil, gas and non-traditional energy sources—and their impact on societal development.
Integrated-assessment models (IAMs) model complex interactions between human and natural systems, and project future energy scenarios [110,111]. Key to contemporary IAM analysis are the Shared Socioeconomic Pathways (SSPs), which outline plausible future socio-economic developments and are extensively used in conjunction with Representative Concentration Pathways (RCPs) by the Intergovernmental Panel on Climate Change (IPCC) to explore climate change mitigation and adaptation strategies [112,113,114].
The ‘energy-density law’ supports certain IAM assumptions, which relates energy use and societal development, as increasing societal complexity requires higher energy density (societal development from agrarian to industrial societies meant a move from lower energy density to higher energy density), which requires more efficient and intensive energy processing, resulting in reducing emissions and mitigating climate goals.
The physically grounded ‘energy-density law’ could potentially offer a means to challenge and test the physical plausibility of the IAM assumptions, particularly related to energy and technological progress, therefore enhancing the robustness and realism of IAM projections. The utility and reliability of these scenarios are directly dependent on the quality and character of the assumptions and the data [115], and if the assumptions regarding physical limits of energy, technology and economic growth are inaccurate or incomplete, these scenarios might lead to misleading policy recommendations [116]. As presented earlier, energy is necessary for economic production and growth [117], and the ‘energy-density law’ describes the constraints within which economic systems must operate, which factors are not always included in economic models often integrated in IAMs [118]. Therefore, the ‘energy-density law’ complements IAMs by offering a more fundamental perspective on the intrinsic physical limits and potential growth trajectories of energy technologies, refining assumptions within IAMs regarding the feasibility and pace of certain technological transitions, particularly concerning novel energy carriers or storage solutions. As IAM assumptions may implicitly assume that innovation can continuously overcome resource or efficiency limitations without hitting fundamental physical ‘ceilings’, the ‘energy density law’ can then serve as a physical constraint or boundary condition for IAM scenarios, integrated to ensure that the projected energy transitions remain plausible; thus, it could serve as a ‘reality check’ on the plausibility of certain scenarios, thereby enhancing the utility and credibility of IAM outputs.
For instance, comparing the energy density of fossil fuels versus various renewable sources would highlight not just their environmental impact but the understanding of the quality of energy sources, the cost–benefit analysis and their implications for societal complexity. Finally, the proposed ‘energy-density law’ might contribute to the improvement of feedback loops that characterize real-world energy systems and to the better illustration of how societal energy demand and technological innovation co-evolve.
Furthermore, it might challenge optimistic IAM scenarios by highlighting spatial and efficiency constraints of low-density systems. By highlighting such implications, it can help guide the development of more robust and physically constrained IAM scenarios.
The ‘energy-density law’ also offers a crucial physical dimension to socio-technical transition theory, particularly frameworks such as the Multi-Level Perspective (MLP) and Strategic Niche Management (SNM). The authors argue that the transition from one energy source to another (e.g., from wood to coal, and from coal to oil) is fundamentally driven by the pursuit of higher energy density. This dynamic, in turn, influences the socio-technical transitions and niche-to-regime dynamics that frameworks like MLP and SNM describe.
These frameworks offer a robust lens for understanding how system-wide transformations in energy, transport, and other sectors unfold through the dynamic interaction of landscape pressures, regime structures, and niche innovations [119,120,121]. The ‘energy-density law’ provides a physical dimension to niche development, explaining scalability and infrastructure needs, influencing a niche’s ability to ‘break out’ of the niche and challenge established regimes [122]. From the ‘energy-density law’ perspective, the success of a niche innovation, particularly in the energy sector, can be seen as its ability to either achieve a higher energy density than existing regime technologies or to deliver comparable energy density at significantly lower societal or environmental cost, or with greater flexibility on energy flow. For example, advances in energy storage, such as distributed, gridless nuclear batteries’ potential to disrupt the regime is that they might offer a pathway to higher overall system energy density.
Conversely, it can explain physical limitations of existing regime technologies, thus highlighting driving forces for transformation, regardless of socio-political inertia. By highlighting physically optimal or constrained pathways, this law can help explain the emergence of certain ‘path dependencies’ and inform strategic choices in steering socio-technical transitions towards more physically viable and sustainable outcomes, beyond purely economic or social considerations. For example, fossil fuels offer relatively high energy density at the point of use; however, their extraction and usage create significant environmental entropy in the broader planetary system, leading to climate change and pollution, which externalized phenomenon/disorder represents inefficiency at a higher system level [123]. This imbalance creates ‘pressure’ on the existing regime, which necessitates a shift in how energy is sourced, converted and utilized across the entire system. Therefore, the ‘energy-density law’ perspective shows that sustainability is part of a larger ‘energy-density law-based’ complex system, while it offers a sustainable development pathway that considers how to sustain societal complexity and optimize energy density, energy flow and minimize the externalized disorder. The transition leads to either societal, technological or civilizational development and evolution [124]. These transitions might be slower or more challenging but might contribute to release path dependencies and support path creation [125]. The systemic co-evolution between levels is strengthened by the proposed law, which triggers corresponding changes in energy technologies, infrastructure and governance. A positive feedback loop is integrated where innovation in energy systems enables greater societal complexity, which in turn demands further energy system evolution.
We argue that the ‘law of energy density’ does not necessarily contradict the above models but rather provides a causal mechanism for the transitions they observe. The shift to a higher energy density source creates the conditions for a new ‘niche’ to emerge and eventually challenge the existing ‘regime’. Our contribution, therefore, is to provide a unifying principle that explains why and how these shifts occur, adding a layer of physical and historical reasoning to the socio-technical dynamics. Our current focus is to present the ‘law of energy density’ as a standalone theoretical contribution that can inform and deepen the analysis within these other frameworks. The ‘energy-density law’ offers a unique and valuable contribution and provides a new lens for understanding the feasibility, scalability, and long-term implications of various energy technologies and transition pathways.

6. Conclusions

A lot of researchers have recently started to realize that in order to form more informed strategic decisions, it is necessary to increase the depth of the forecasts being developed. The indicators presented in this article differ significantly from those presented in prior studies. The theoretical contribution of this research is to establish and study the fundamental patterns of global energy development when forecasting future volumes of energy source use. One of the fundamental patterns established by the authors is the pattern of steady growth in the energy density of the energy sources used. Concurrently, the authors showed that this density varied over time along an S-shaped trajectory (as shown in Figure 20). Such a pattern in forecasting the development of global energy has not previously been used in either Russian or other international studies. Furthermore, the authors found that the modern energy transition, which, in studies, is very often associated only with a shift in the use of some energy sources to others, as well as with the need to implement a “green deal,” is in effect a global shift of energy from using energy sources with low energy density to those with high energy density. This is the phase of the “vertical escalation of energy density growth” (see Figure 20). The authors have determined that this zone should start to actively manifest itself around 2050–2060.
It has been demonstrated with neural network forecasting that in the vertical escalation zone, the energy density of energy sources can be amplified by approximately 6–7 times. Consequently, the pace of scientific and technological developments will grow by approximately the same amount. Given that the current projections in principle span a duration of 15 to 20 years, a notable increase is warranted.
The results of the neural network forecasting confirmed the calculations previously made by the authors, and the laws and patterns of global energy development were identified. The research results revealed that, in addition to local energy transitions, of which there may be several, there is also a global energy transition, which is the only one in the entire history of civilization. Strictly speaking, as all local energy transitions are associated with an increase in the energy density of the energy sources used, the global energy transition is a transition from low-density energy sources (wood, coal, oil, gas) to high-density energy sources (solar, wind, nuclear, thermonuclear), which is associated with the “zone” of vertical escalation of increasing energy density, shown in Figure 20 by an S-shaped dependence. As indicated by the results, this is the zone that world development is currently entering.
The research has its limitations, as the transition to new energy, especially space energy, makes special demands on the humanitarian and cultural level of human development. The authors argue that the development of artificial intelligence and space energy must necessarily be accompanied by a change in human consciousness. The research has considered the ongoing global energy transition and has shown that energy development is subject to objective laws of development being of a civilizational nature, independent of a specific group of people consuming energy. This research primarily investigated the dynamics of global energy development through the lens of energy cycle theory, with a particular emphasis on the behavior and transformation of physical energy. It is important to note that the scope of this work does not extend to social, climate-related challenges, global energy poverty, or questions of fair energy access. Research on ethical concerns, the analysis and evaluation of energy justice and equitable energy access will be the subject of future research.
In our opinion, in order to develop strategic decisions on energy in the context of the global transition system implementation (including energy and technological explosions) it is advisable to “increase” the time span of forecasts to 90 to 120 years. The question still remains open as to why modern societies are planning their production and economic activity for 10 to 20 years when intensively making a request for a long-term forecast, and what kind of long “journey”—especially with high travel speeds—they are heading towards. The answer seems obvious based on the neural network forecast analysis, as it is heading to outer space [109,126,127]. In one way or another the main production and economic projects of the future period will probably be associated with expansion into outer space. With such a great depth of forecasting, it is impossible to use economic assessments of the decisions made. For example, it is impossible to foresee the inflation rate or the price level for a century in the future. In such cases, assessments are required to determine whether project implementations based on the use of fundamental categories of development, such as matter (m), space (S) and time (t), are necessary. Surprisingly, these categories are comprehensively accumulated in the “energy” indicator:
E = m × S 2 2 × t 2
This means that it is advisable to evaluate future development in the long term using energy indicators and, first of all, the energy density of the energy sources used, which determines the pace of the ongoing global civilizational transition.

Author Contributions

Conceptualization, Y.A.P. and L.S.P.; methodology, Y.A.P. and L.S.P.; software, K.I.D.; validation, L.S.P. and K.I.D.; formal analysis, Y.A.P. and K.I.D.; investigation, Y.A.P. and L.S.P.; data curation, K.I.D.; writing—original draft preparation, Y.A.P., L.S.P. and K.I.D.; writing—review and editing, K.I.D. and A.T.; visualization, K.I.D.; supervision, A.T.; project administration, A.T.; funding acquisition, A.T. All authors have read and agreed to the published version of the manuscript.

Funding

This research received no external funding.

Data Availability Statement

The data presented in this study are available in public domains as listed in the References. These data were derived from the following resources available in the public domain [30,31,32,35,36,48,49,51,52,53,56,57,58,59,60,87,88,90].

Conflicts of Interest

The authors declare no conflicts of interest.

References

  1. Trimech, A. Exploring the Interplay of Renewable Energy and Carbon Dioxide Emissions across US Sectors through Wavelet Approach. Environ. Prog. Sustain. Energy 2024, 43, e14454. [Google Scholar] [CrossRef]
  2. Pokazeev, K.V.; Solovyev, D.A. Renewable Energy Transition: Timelines and Prospects in the Context of Climate Change and Sustainable Development. Physical and Mathematical Modeling of Earth and Environment Processes; Karev, V., Ed.; Springer Nature: Cham, Switzerland, 2025; pp. 198–205. [Google Scholar]
  3. Ramya, M.; Ranjitha, U.N.; Dalal, Y. Forecasting Global Energy Consumption Trends: A Statistical Analysis of Low-Carbon Transition Using ARIMA. In Proceedings of the 3rd International Conference on Communication, Control, and Intelligent Systems, CCIS 2024, Marutha, India, 6–7 December 2024; pp. 1–6. [Google Scholar] [CrossRef]
  4. Mykhailyshyn, K.; Polyanska, A.; Psyuk, V.; Antoniuk, O. How to Achieve the Energy Transition Taking into Account the Efficiency of Energy Resources Consumption. In 8th International Conference “Physical & Chemical Geotechnologies” 2024—Innovations in Mining and Energy; Dychkovskyi, R., Dyczko, A., Borojević Šoštarić, S., Eds.; E3S Web Conf.; Edpsciences: Dnipro, Ukraine; Krakow, Poland; Dubrovnik, Croatia, 2024; Volume 567, p. 01026. ISBN 9798331303242. [Google Scholar] [CrossRef]
  5. Gielen, D.; Boshell, F.; Saygin, D.; Bazilian, M.D.; Wagner, N.; Gorini, R. The Role of Renewable Energy in the Global Energy Transformation. Energy Strategy Rev. 2019, 24, 38–50. [Google Scholar] [CrossRef]
  6. Vallarta-Serrano, S.I.; Santoyo-Castelazo, E.; Santoyo, E.; Ramirez-Mendoza, R.A.; Bustamante-Bello, R.; Beltrán-Rodríguez, L. Scenarios of Sustainable Energy Transition towards the Decarbonisation of the Road Transport Sector: A Case Study for Mexico. Renew. Sustain. Energy Rev. 2025, 212, 115341. [Google Scholar] [CrossRef]
  7. Bhattacharyya, R. Changing Patterns of Energy Use and Its Linkage With Some Macroeconomic Variables in India and China. In Research Anthology on Clean Energy Management and Solutions; Information Resources Management Association, Ed.; IGI Global: Hershey, PA, USA, 2021; pp. 1615–1633. [Google Scholar] [CrossRef]
  8. Demircioğlu, M.; Eşİyok, S. Energy Consumption Forecast of Turkey Using Artificial Neural Networks from a Sustainability Perspective. Int. J. Sustain. Energy 2022, 41, 1127–1141. [Google Scholar] [CrossRef]
  9. Mastepanov, A.M. The Future of the Oil Industry in the Face of Energy Transition. View Analysis and Ratings of Foreign Experts. Neft. Khozyaystvo—Oil Ind. 2020, 2020, 10–14. [Google Scholar] [CrossRef]
  10. Garcier, R.J. Consuming Energy. In Consuming the Environment; Hird, M.J., Ed.; SCORAI Studies in Sustainable Consumption; Routledge: Abingdon, UK, 2025; pp. 38–49. ISBN 978-1-03-253536-4. [Google Scholar] [CrossRef]
  11. Johnstone, I.M. EROI Hierarchy of Society. Available online: https://www.issuesofsustainability.org/helpndoc-content/EROIHierarchyofSociety.html (accessed on 27 June 2025).
  12. Hall, C.A.S.; Lambert, J.G.; Balogh, S.B. EROI of Different Fuels and the Implications for Society. Energy Policy 2014, 64, 141–152. [Google Scholar] [CrossRef]
  13. Pali, F.; Dsouza, R.; Ryu, Y.; Oishee, J.; Aikkarakudiyil, J.; Gaikwad, M.A.; Norouzzadeh, P.; Buckner, S.; Rahmani, B. Energy Transitions over Five Decades: A Statistical Perspective on Global Energy Trends. Computers 2025, 14, 190. [Google Scholar] [CrossRef]
  14. Jenko, J.; Costa, J.P. Using Temporal Fusion Transformer Predictions to Maximise Use of Renewable Energy Sources. In Proceedings of the 2024 International Workshop on Artificial Intelligence and Machine Learning for Energy Transformation, AIE 2024—Proceedings, Vaasa, Finland, 20–22 May 2024; Institute of Electrical and Electronics Engineers Inc.: Vaasa, Finland, 2024; pp. 1–10, ISBN 979-835036496-5. [Google Scholar] [CrossRef]
  15. Koprinska, I.; Wu, D.; Wang, Z. Convolutional Neural Networks for Energy Time Series Forecasting. In Proceedings of the International Joint Conference on Neural Networks (IJNN)—Proceedings, Rio de Janeiro, Brazil, 8–13 July 2018; Volume 2018, pp. 1–8. [Google Scholar] [CrossRef]
  16. Romero, A.F.; Quilumba, F.L.; Arcos, H.N. Short-Term Active Power Forecasting of a Photovoltaic Power Plant Using an Artificial Neural Network. In Proceedings of the 2017 IEEE Second Ecuador Technical Chapters Meeting (ETCM), Salinas, Euador, 16–20 October 2017; Volume 2017, pp. 1–5. [Google Scholar] [CrossRef]
  17. Usman, M.; Ali Khan, Z.; Khan, I.U.; Javaid, S.; Javaid, N. Data Analytics for Short Term Price and Load Forecasting in Smart Grids Using Enhanced Recurrent Neural Network. In Proceedings of the ITT 2019—Sixth Information Technology Trends: Emerging Technologies Blockchain and IoT, Ras Al Khaiman, United Arab Emirates, 20–21 November 2019; pp. 84–88. [Google Scholar] [CrossRef]
  18. Hamzaçebi, C.; Kutay, F. Electric Consumption Forecasting of Turkey Using Artificial Neural Networks up to Year 2010. J. Fac. Eng. Archit. Gazi Univ. 2004, 19, 227–233. Available online: https://dergipark.org.tr/tr/download/article-file/76153 (accessed on 7 July 2025).
  19. Madhugeeth, K.P.M.; Premaratna, H.L. Forecasting Power Demand Using Artificial Neural Networks for Sri Lankan Electricity Power System. In Proceedings of the 2008 IEEE Region 10 and the Third international Conference on Industrial and Information Systems, Kharagpur, India, 8–10 December 2008; pp. 1–6. [Google Scholar] [CrossRef]
  20. Lopez-Leyva, J.A.; Barrera-Silva, C.; Sarmiento-Leyva, L.F. Advanced Power Generation & Demand Forecasting Considering the Complete Energy Matrix Using an Artificial Neural Network. In Proceedings of the 2021 IEEE International Conference on Engineering Veracruz (ICEV)—Proceedings, Boca del Río, Veracruz, Mexico, 25–28 October 2021; pp. 1–5. [Google Scholar] [CrossRef]
  21. Asadian, S.; Nazari-Heris, M. Short-Term Electric Load Forecasting Using ESN Neural Networks. In Artificial Intelligence in the Operation and Control of Digitalized Power Systems; Azad, S., Nazari-Heris, M., Eds.; Power Systems; Springer: Cham, Switzerland, 2024; Volume F3666, pp. 157–183. [Google Scholar] [CrossRef]
  22. Paoli, C.; Voyant, C.; Muselli, M.; Nivet, M.-L. Use of Exogenous Data to Improve an Artificial Neural Networks Dedicated to Daily Global Radiation Forecasting. In Proceedings of the 2010 9th Conference on Environment and Electrical Engineering, EEEIC 2010, Prague, Czech Republic, 16–19 May 2010; pp. 49–52. [Google Scholar] [CrossRef]
  23. Ichikawa, T.; Ichiyanagi, K.; Yukita, K.; Goto, Y. Forecasting Method of Time Series of Solar Energy and Wind Power by Using Wide Meteorological Data. In Proceedings of the 10th WSEAS/IASME International Conference on Electric Power Systems, High Voltages, Electric Machines, POWER’10, 6th WSEAS International Conference on Remote Sensing, REMOTE’10—Proceedings, Takizawa, Japan, 4–6 October 2010; pp. 33–38, ISBN 978-960-474-233-2. [Google Scholar]
  24. Reşat, H.G. Design and Development of Hybrid Forecasting Model Using Artificial Neural Networks and ARIMA Methods for Sustainable Energy Management Systems: A Case Study in Tobacco Industry. J. Fac. Eng. Archit. Gazi Univ. 2020, 35, 1129–1140. [Google Scholar] [CrossRef]
  25. Oreshkin, B.N.; Dudek, G.; Pełka, P.; Turkina, E. N-BEATS Neural Network for Mid-Term Electricity Load Forecasting. Appl. Energy 2021, 293, 116918. [Google Scholar] [CrossRef]
  26. Kugaevskikh, A.V.; Muromtsev, D.I.; Kirsanova, O.V. Clssical Methods of Machine Training; ITMO University: St. Petersburg, Russia, 2022; Available online: https://books.ifmo.ru/file/pdf/3075.pdf (accessed on 10 June 2025).
  27. Devezas, T.; Tick, A.; Sarygulov, A.; Rukina, P. The Slow Pace of Green Transformation: Underlying Factors and Implications. Energies 2024, 17, 4789. [Google Scholar] [CrossRef]
  28. Ageev, A.I.; Belogoriev, A.M.; Bushuev, V.V.; Golubev, V.S.; Gromov, A.I.; Dobrocheev, O.V.; Klepach, A.N.; Muntiyan, V.I.; Plakitkin, B.A.; Sokotushchenko, V.N.; et al. On the Way to Space-Planetary Civilization; Energia Publishing House: Moscow, Russia, 2023; ISBN 978-5-98908-493-7. Available online: https://zenodo.org/record/7684441 (accessed on 10 June 2025).
  29. Plakitkin, Y. Energy and World Development Forecast in XXI Century. AIP Conf. Proc. 2023, 2552, 080032. [Google Scholar] [CrossRef]
  30. Worldometer. World Population Clock: 8.2 Billion People (LIVE, 2025)—Worldometer. Available online: https://www.worldometers.info/world-population/ (accessed on 27 January 2025).
  31. Population Reference Bureau. World Population Data Sheet 2023. Available online: https://2023-wpds.prb.org/wp-content/uploads/2023/12/2023-World-Population-Data-Sheet-Booklet.pdf (accessed on 5 June 2025).
  32. Energy Institute. Statistical Review of World Energy 2024. 2024. Available online: https://www.energyinst.org/statistical-review/home (accessed on 5 June 2025).
  33. Pavlov, M. Population Projection in the World’s Countries for 2100. Available online: http://en.ostranah.ru/_lists/population.php?id=2100 (accessed on 10 June 2025).
  34. Goujon, A.; Samir, K.C. Population and Human Capital Projections (SSP 2023). Available online: http://iiasa.ac.at/models-tools-data/ssp-2023 (accessed on 10 June 2025).
  35. IHME. Fertility Forecasts and Their Implications for Population Growth|Institute for Health Metrics and Evaluation. Available online: https://www.healthdata.org/research-analysis/library/fertility-forecasts-and-their-implications-population-growth (accessed on 10 June 2025).
  36. UN. UN Population Division Data Portal. Available online: https://population.un.org/dataportal/home?df=c5505b8a-5073-4528-a72a-83aed5a80dc1 (accessed on 10 June 2025).
  37. Korotaev, A.V.; Khalturina, D.A.; Malkov, A.S.; Bozhevolnov, Y.V.; Kobzeva, S.V.; Zinkina, Y.V. Mathematical Modeling and Forecasting Russia’s Demographic Future: Five Scenarios. In Laws of History: Mathematical Modeling and Forecasting of World and Regional Development; URSS: Moscow, Russia, 2010; pp. 227–265. ISBN 9785382012520. Available online: https://web.archive.org/web/20160601122425/http://cliodynamics.ru/download/3_3N08Glava6.pdf (accessed on 10 June 2025).
  38. Kapitza, S.P. Global Population Blow-up and After: The Demographic Revolution and Sustainable Development. Bull. Georgian Natl. Acad. Sci. 2009, 3, 5–12. Available online: http://www.science.org.ge/old/3-1/Kapitza.pdf (accessed on 6 June 2025).
  39. Kapitza, S.P. Global Population Blow-Up and After. The Demographic Revolution and Information Society (A Report to the Club of Rome and the Global Marshall Plan Initiative); Tolleranza: Hamburg, Germany, 2006; ISBN 978-3-9809723-5-2. Available online: https://www.clubofrome.org/publication/global-population-blow-up-and-after-2006/ (accessed on 10 June 2025).
  40. Kapitsa, S.P.; Kurdyumov, S.P.; Malinetsky, G.G. Synergetics and Future Forecasts; URSS: Moscow, Russia, 1997; Available online: https://reallib.org/reader?file=482191 (accessed on 7 June 2025).
  41. Kapitza, S.P. General Theory of Human Growth: How Many People Lived, Lives and Will Live on Earth; Nauka: Moscow, Russia, 1999; Available online: https://litresp.ru/chitat/ru/%D0%9A/kapica-sergej/obschaya-teoriya-rosta-chelovechestva# (accessed on 8 June 2025).
  42. Akaev, A.A.; Sadovnichii, V.A. A Mathematical Model to Predict Global Demographic Dynamics in the Age of Intelligent Machines. Her. Russ. Acad. Sci. 2022, 92, 636–642. [Google Scholar] [CrossRef]
  43. Akaev, A.A.; Sadovnichii, V.A. Mathematical Model of Population Dynamics with the World Population Size Stabilizing about a Stationary Level. Dokl. Math. 2010, 82, 978–981. [Google Scholar] [CrossRef]
  44. Kapitza, S.P. On the Theory of Global Population Growth. Phys.-Usp. 2010, 53, 1287. [Google Scholar] [CrossRef]
  45. Kak, S. The Age of Artificial Intelligence; Garuda Prakashan Pvt. Ltd.: Haryana, India, 2025; ISBN 9798885752138. [Google Scholar]
  46. Dzerzhinsky, R.I.; Zausailov, A.S.; Vorontsov, A.A. Modelling World Population Dynamics. In Data Science and Intelligent Systems; Silhavy, R., Silhavy, P., Prokopova, Z., Eds.; Lecture Notes in Networks and Systems; Springer International Publishing: Cham, Switzerland, 2021; Volume 231, pp. 423–432. ISBN 978-3-030-90320-6. [Google Scholar]
  47. Pellecchia, P. The Future of AI. Extinction or Death of the Human? Sci. Fides 2025, 13, 39–55. [Google Scholar] [CrossRef]
  48. Energy Institute. Statistical Review of World Energy; Energy Institute: London, UK, 2024; p. 73. Available online: https://www.energyinst.org/statistical-review#regional-overview (accessed on 27 January 2025).
  49. BP. Bp Energy Outlook 2024; BP: London, UK, 2024; p. 107. Available online: https://www.bp.com/content/dam/bp/business-sites/en/global/corporate/pdfs/energy-economics/energy-outlook/bp-energy-outlook-2024.pdf (accessed on 27 January 2025).
  50. Do, T.N.; Burke, P.J.; Nguyen, H.N.; Overland, I.; Suryadi, B.; Swandaru, A.; Yurnaidi, Z. Vietnam’s Solar and Wind Power Success: Policy Implications for the Other ASEAN Countries. Energy Sustain. Dev. 2021, 65, 1–11. [Google Scholar] [CrossRef]
  51. Dong, X. Monthly China Energy Update|2023 China Electricity Mix Yearly Review; Climate Energy Finance: Sydney, Australia, 2024; p. 7. Available online: https://climateenergyfinance.org/wp-content/uploads/2024/01/MONTHLY-CHINA-ENERGY-UPDATE-_-2023-China-Electricity-Mix-Yearly-Review-1-1.pdf (accessed on 27 January 2025).
  52. Government of India. Energy Statistics India 2023; Energy Statistics Division (ESD): New Delhi, India, 2023; p. 115.
  53. National Bureau of Statistics of China. Stastical Communiqué of the People’s Republic of China on the 2023 National Economic and Social Development. Available online: https://www.stats.gov.cn/english/PressRelease/202402/t20240228_1947918.html (accessed on 30 April 2024).
  54. Do, T.N.; Burke, P.J. Phasing out Coal Power in a Developing Country Context: Insights from Vietnam. Energy Policy 2023, 176, 113512. [Google Scholar] [CrossRef]
  55. Plakitkina, L.S.; Plakitkin, Y.A.; Dyachenko, K.I. Current Trends and a Forecast of Coal Industry Development in Russia and Worldwide in Conditions of the World Economy Transformation Part I. Existing Trends in Coal Industry Operation in Russia and World-Wide since the Beginning of the 21st Century. Ugol’ 2024, 44–51. [Google Scholar] [CrossRef]
  56. IEA. Net Zero by 2050—A Roadmap for the Global Energy Sector; IEA: Paris, France, 2024; p. 224. Available online: https://www.iea.org/reports/net-zero-by-2050 (accessed on 27 January 2025).
  57. IEA. Renewables 2020—Analysis and Forecast to 2025; IEA: Paris, France, 2020; p. 172. Available online: https://iea.blob.core.windows.net/assets/1a24f1fe-c971-4c25-964a-57d0f31eb97b/Renewables_2020-PDF.pdf (accessed on 27 January 2025).
  58. IEA. Renewables—Energy System. Available online: https://www.iea.org/energy-system/renewables (accessed on 23 May 2024).
  59. Our World in Data Share of Electricity Production from Renewables 2023. Available online: https://ourworldindata.org/grapher/share-electricity-renewables (accessed on 15 August 2024).
  60. UNEP. Renewables 2022 Global Status Report; UN: New York, NY, USA, 2022; Available online: https://www.unep.org/resources/report/renewables-2022-global-status-report (accessed on 27 January 2025).
  61. World Economics. GDP Rankings 2025. Available online: https://www.worldeconomics.com/Indicator-Data/Economic-Size/Revaluation-of-GDP.aspx (accessed on 20 May 2024).
  62. Varga, J.; Csiszárik-Kocsir, Á. The Impact of Human Activity on Environmental Elements Based on the Results of a Primary Research. Acta Polytech Hung 2024, 21, 147–168. [Google Scholar] [CrossRef]
  63. Georgescu, I.M.; Ashhab, S.; Nori, F. Quantum Simulation. Rev. Mod. Phys. 2014, 86, 153–185. [Google Scholar] [CrossRef]
  64. Ladd, T.D.; Jelezko, F.; Laflamme, R.; Nakamura, Y.; Monroe, C.; O’Brien, J.L. Quantum Computers. Nature 2010, 464, 45–53. [Google Scholar] [CrossRef] [PubMed]
  65. Peruzzo, A.; McClean, J.; Shadbolt, P.; Yung, M.-H.; Zhou, X.-Q.; Love, P.J.; Aspuru-Guzik, A.; O’Brien, J.L. A Variational Eigenvalue Solver on a Photonic Quantum Processor. Nat. Commun. 2014, 5, 4213. [Google Scholar] [CrossRef]
  66. Politi, A.; Matthews, J.; Thompson, M.G.; O’Brien, J.L. Integrated Quantum Photonics. IEEE J. Select. Top. Quantum Electron. 2009, 15, 1673–1684. [Google Scholar] [CrossRef]
  67. Plakitkin, Y. New Technological Track of the World Economy and Its Impact on the Vector of Global Energy Development. Russ. Dev. Trends Prospect. 2011, 6, 714–716. Available online: https://cyberleninka.ru/article/n/novyy-tehnologicheskiy-trek-mirovoy-ekonomiki-i-ego-vliyanie-na-vektor-razvitiya-mirovoy-energetiki/viewer (accessed on 10 June 2025).
  68. Bouramdane, A.-A. Morocco’s Path to a Climate-Resilient Energy Transition: Identifying Emission Drivers, Proposing Solutions, and Addressing Barriers. Sci. Technol. Energ. Transit. 2024, 79, 26. [Google Scholar] [CrossRef]
  69. Tan, N.; Harrison, J.; Howells, M. Comparing Long-Term Power Sector Pathways in Viet Nam: A Simple Cost-Optimization Approach with OSeMOSYS. Energies 2024, 17, 6158. [Google Scholar] [CrossRef]
  70. Allan, G.; McGregor, P.G.; Swales, J.K.; Turner, K. Impact of Alternative Electricity Generation Technologies on the Scottish Economy: An Illustrative Input—Output Analysis. Proc. Inst. Mech. Eng. Part A J. Power Energy 2007, 221, 243–254. [Google Scholar] [CrossRef]
  71. Trishna, S. Calorific Value of Fuels: Definition, How to Calculate, Liquid Fuel and Gaseous Fuels|Thermal Engineering. Eng. Notes India 2018. Available online: https://www.engineeringenotes.com/thermal-engineering/calorific-value-of-fuel/calorific-value-of-fuels-definition-how-to-calculate-liquid-fuel-and-gaseous-fuels-thermal-engineering/51356 (accessed on 20 April 2024).
  72. Boughn, S. Fritz Hasenöhrl and E = Mc2. Eur. Phys. J. H 2013, 38, 261–278. [Google Scholar] [CrossRef]
  73. Markovich, P.A. Strategic Tranformation f Russia’s Energy Sector: Challenges and Prospects/Cтpaтeгичeскaя Тpaнсфopмaция Энepгeтичeскoгo Ceктopa Рoссии: Bызoвы и Пepспeктивы. ЭH 2024, 8, 202–208. [Google Scholar] [CrossRef]
  74. Anufriev, I.E.; Khusainov, B.; Tick, A.; Devezas, T.; Sarygulov, A.; Kaimoldina, S. Mathematical Model for Assessing New, Non-Fossil Fuel Technological Products (Li-Ion Batteries and Electric Vehicle). Mathematics 2025, 13, 143. [Google Scholar] [CrossRef]
  75. Müller, G.; Parker, G. Experimental Investigation of the Atmospheric Steam Engine with Forced Expansion. Renew. Energy 2015, 75, 348–355. [Google Scholar] [CrossRef]
  76. Butz, J.S. Powerplants—Piston & Turbine. Fly. Mag. 1963, 73, 33–36, 102–104. [Google Scholar]
  77. Plakitkin, Y. Global Energy Transition and Modern World Transformations in Energy Development Forecasts. Energy Policy 2023, 8, 8–25. [Google Scholar] [CrossRef]
  78. WIPO. IP Facts and Figures 2024, 1st ed.; WIPO: Geneva, Switzerland, 2024; ISBN 978-92-805-3705-5. Available online: https://www.wipo.int/web-publications/ip-facts-and-figures-2024/index.html (accessed on 21 March 2024).
  79. Plakitkin, Y.; Plakitkina, L.; Diachenko, K. Energy of Yesterday and Tomorrow: Contours of Long-Term Development. Energy Policy 2024, 9, 10–31. [Google Scholar] [CrossRef]
  80. Schwab, K. The Fourth Industrial Revolution; Crown: Sydney, Australia, 2017; ISBN 978-1-5247-5887-5. [Google Scholar]
  81. Government of Japan. Report on the 5th Science and Technology Basic Plan; Council for Science, Technology and Innovation Cabinet Office, Government of Japan: Tokyo, Japan, 2015; p. 18. Available online: https://www8.cao.go.jp/cstp/kihonkeikaku/5basicplan_en.pdf (accessed on 20 April 2024).
  82. Government of Japan Society 5.0. Available online: https://www8.cao.go.jp/cstp/english/society5_0/index.html (accessed on 31 January 2025).
  83. i-scoop from Industry 4.0 to Society 5.0: The Big Societal Transformation Plan of Japan. Available online: https://www.i-scoop.eu/industry-4-0/society-5-0/ (accessed on 20 May 2024).
  84. US Department of Energy (DOE). Space-Based Solar Power. Energy.gov. 2014. Available online: https://www.energy.gov/articles/space-based-solar-power (accessed on 30 April 2024).
  85. Li, W. Overview on Space Solar Power Station. Adv. Astronaut. Sci. Technol. 2022, 5, 1–2. [Google Scholar] [CrossRef]
  86. Kurhan, M.; Kurhan, D.; Hmelevska, N. Enhancing Railway Section Capacity, during Expansion of the European Railway Network. Acta Polytech Hung 2025, 22, 159–171. [Google Scholar] [CrossRef]
  87. Railisa UIC Statistics. Railway Statistics Synopsis 2024. Available online: https://uic.org/IMG/pdf/railway_statistics_synopsis_2024web_1866037339.pdf (accessed on 21 January 2025).
  88. Statista Worldwide Maritime Trade—Transport Volume of Seaborne Trade from 1990 to 2021. Available online: https://www.statista.com/statistics/264117/tonnage-of-worldwide-maritime-trade-since-1990/ (accessed on 31 January 2025).
  89. Kharitonov, V.V.; Stoyanov, A.D. Potential for Nuclear Energy Development in Uzbekistan. Econ. Strateg. 2024, 1, 26–35. [Google Scholar] [CrossRef]
  90. IEA. World Energy Outlook 2022—Analysis; IEA: Paris, France, 2022; p. 524. Available online: https://www.iea.org/reports/world-energy-outlook-2022 (accessed on 10 June 2025).
  91. Loulou, R.; Remme, U.; Kanudia, A.; Lehtilä, A.; Goldstein, G. Documentation for the TIMES Model 2005. Available online: https://www.iea-etsap.org/docs/TIMESDoc-Intro.pdf (accessed on 1 August 2025).
  92. IEA. Global Energy and Climate Model Documentation 2024. 2024. Available online: https://iea.blob.core.windows.net/assets/a2aaddf1-a0f8-4ecb-8b20-31622423bc2e/GlobalEnergyandClimateModelDocumentation2024.pdf (accessed on 28 July 2025).
  93. Yurkov, S. Desperate Importance of Nuclear Renaissance for the Future of Japan. ES 2024, 193, 18–25. [Google Scholar] [CrossRef]
  94. Rosatom. Small Nuclear Power Plants. Available online: https://rosatom.ru/en/rosatom-group/small-nuclear-power-plants/ (accessed on 2 August 2025).
  95. Arvanitidis, A.I.; Talbot, P.; Gatsis, N.; Alamaniotis, M. Comprehensive Assessment of Deep Reinforcement Learning Approaches for Economic Dispatch in Nuclear-Driven Microgrids. Comput. Electr. Eng. 2025, 126, 110528. [Google Scholar] [CrossRef]
  96. Badakhshan, S.; Kaushik, H.D.; Zhang, J. Stochastic Optimization of Small Modular Reactor and Battery Sizing for Maritime Decarbonization Under Voyage Uncertainties. IEEE Trans. Transp. Electrif. 2025, 11, 1. [Google Scholar] [CrossRef]
  97. Paul, S.; Klimenka, M.; Duarte, F.; Crawford, C.; Gorman, C.; Ratti, C.; Buongiorno, J. When Cities Go Nuclear: Exploring the Applications of Nuclear Batteries Toward Energy Transformation. Urban Sci. 2024, 8, 226. [Google Scholar] [CrossRef]
  98. United Kingdom National Nuclear Laboratory. How a Space Battery Works; United Kingdom National Nuclear Laboratory: Warrington, UK, 2025; Available online: https://uknnl.com/customer-solutions/space-exploration/how-a-space-battery-works/ (accessed on 3 July 2025).
  99. Buongiorno, J.; Carmichael, B.; Dunkin, B.; Parsons, J.; Smit, D. Can Nuclear Batteries Be Economically Competitive in Large Markets? Energies 2021, 14, 4385. [Google Scholar] [CrossRef]
  100. Bartak, J.; Bruna, G.; Cognet, G. Economics of Small Modular Reactors: Will They MakeNuclear Power More Competitive? JEPE 2021, 15, 193–201. [Google Scholar] [CrossRef]
  101. World Nuclear Association. Nuclear Reactors and Radioisotopes for Space 2025. Available online: https://world-nuclear.org/information-library/non-power-nuclear-applications/transport/nuclear-reactors-for-space (accessed on 3 July 2025).
  102. Vining, C.; Bennett, G. Power for Science and Exploration: Upgrading the General-Purpose Heat Source Radioisotope Thermoelectric Generator (GPHS-RTG). In Proceedings of the 46th AIAA/ASME/SAE/ASEE Joint Propulsion Conference & Exhibit, Nashville, TN, USA, 25–28 July 2010; American Institute of Aeronautics and Astronautics: Washington, DC, USA, 2010; pp. 1–15. [Google Scholar] [CrossRef]
  103. Jarell, J. Nuclear Batteries with Potential. STR 2022, March, 20–23. Available online: https://str.llnl.gov/past-issues/march-2022/nuclear-batteries-potential (accessed on 3 July 2025).
  104. Tsiolkovskiy, K.E. Study of Outer Space by Reaction Devices; Mashinoastroyeniye: Moscow, Russia, 1967; Available online: http://archive.org/details/nasa_techdoc_19750021068 (accessed on 24 June 2025).
  105. Pathak, A.D.; Saha, S.; Bharti, V.K.; Gaikwad, M.M.; Sharma, C.S. A Review on Battery Technology for Space Application. J. Energy Storage 2023, 61, 106792. [Google Scholar] [CrossRef]
  106. Vigier, J.-F.; Freis, D.; Pöml, P.; Prieur, D.; Lajarge, P.; Gardeur, S.; Guiot, A.; Bouëxière, D.; Konings, R.J.M. Optimization of Uranium-Doped Americium Oxide Synthesis for Space Application. Inorg. Chem. 2018, 57, 4317–4327. [Google Scholar] [CrossRef]
  107. Fox, A. Zeno Power’s Nuclear Battery Tech: A Strategic Play in the Off-Grid Energy Revolution. AiInvest 2025. Available online: https://www.ainvest.com/news/zeno-power-nuclear-battery-tech-strategic-play-grid-energy-revolution-2506/ (accessed on 3 July 2025).
  108. Keldysch Research Center. Space Power Engineering. Available online: https://www.keldysh-space.ru/en/nasha-deyatelnost/raketno-kosmicheskaya-deyatelnost/kosmicheskaya-energetika/ (accessed on 24 June 2025).
  109. Anderson, L. Akademik Lomonosov: The Floating Power Plant. DevX 2023. Available online: https://www.devx.com/daily-news/akademik-lomonosov-the-floating-power-plant/ (accessed on 3 July 2025).
  110. Weyant, J.; Davidson, O.; Dowlatabadi, H.; Edmonds, J.; Grubb, M.; Parson, E.; Richels, R.; Rotmans, J.; Shukla, P.; Tol, R.; et al. Integrated Assessment of Climate Change: An Overview and Comparison of Approaches and Results. In Climate Change 1995: Economic and Social Dimensions of Climate Change; Cambridge University Press: New York, NY, USA, 1996; pp. 367–396. [Google Scholar]
  111. Clarke, L.; Edmonds, J.; Jacoby, H.; Pitcher, H.; Reilly, J.; Richels, R. Scenarios of Greenhouse Gas Emissions and Atmospheric Concentrations; Sub-Report 2.1A of Synthesis and Assessment Product 2.1 by the U.S. Climate Change Science Program and the Subcommittee on Global Change Research; Department of Energy, Office of Biological & Environmental Research: Washington, DC, USA, 2007; p. 154.
  112. O’Neill, B.C.; Kriegler, E.; Ebi, K.L.; Kemp-Benedict, E.; Riahi, K.; Rothman, D.S.; van Ruijven, B.J.; van Vuuren, D.P.; Birkmann, J.; Kok, K.; et al. The Roads Ahead: Narratives for Shared Socioeconomic Pathways Describing World Futures in the 21st Century. Glob. Environ. Change 2017, 42, 169–180. [Google Scholar] [CrossRef]
  113. Riahi, K.; van Vuuren, D.P.; Kriegler, E.; Edmonds, J.; O’Neill, B.C.; Fujimori, S.; Bauer, N.; Calvin, K.; Dellink, R.; Fricko, O.; et al. The Shared Socioeconomic Pathways and Their Energy, Land Use, and Greenhouse Gas Emissions Implications: An Overview. Glob. Environ. Change 2017, 42, 153–168. [Google Scholar] [CrossRef]
  114. Calvin, K.; Dasgupta, D.; Krinner, G.; Mukherji, A.; Thorne, P.W.; Trisos, C.; Romero, J.; Aldunce, P.; Barrett, K.; Blanco, G.; et al. IPCC, 2023: Climate Change 2023: Synthesis Report. Contribution of Working Groups I, II and III to the Sixth Assessment Report of the Intergovernmental Panel on Climate Change; Lee, H., Romero, J., Eds.; IPCC: Geneva, Switzerland, 2023. [Google Scholar]
  115. Asefi-Najafabady, S.; Villegas-Ortiz, L.; Morgan, J. The Failure of Integrated Assessment Models as a Response to ‘Climate Emergency’ and Ecological Breakdown: The Emperor Has No Clothes. Globalizations 2021, 18, 1178–1188. [Google Scholar] [CrossRef]
  116. Gambhir, A.; Butnar, I.; Li, P.-H.; Smith, P.; Strachan, N. A Review of Criticisms of Integrated Assessment Models and Proposed Approaches to Address These, through the Lens of BECCS. Energies 2019, 12, 1747. [Google Scholar] [CrossRef]
  117. Chaisson, E.J. The Natural Science Underlying Big History. Sci. World J. 2014, 2014, 384912. [Google Scholar] [CrossRef]
  118. Stern, D.I. The Role of Energy in Economic Growth; CCEP Working Paper 3.10; Centre for Climate Economics & Policy, Crawford School of Economics and Government, The Australian National University: Canberra, Australia, 2010; pp. 1–50. [Google Scholar] [CrossRef]
  119. Geels, F.W. Technological Transitions as Evolutionary Reconfiguration Processes: A Multi-Level Perspective and a Case-Study. Res. Policy 2002, 31, 1257–1274. [Google Scholar] [CrossRef]
  120. Schot, J.; Geels, F.W. Strategic Niche Management and Sustainable Innovation Journeys: Theory, Findings, Research Agenda, and Policy. Technol. Anal. Strateg. Manag. 2008, 20, 537–554. [Google Scholar] [CrossRef]
  121. Berkhout, F.; Smith, A.; Stirling, A. Chapter 3 Socio-Technological Regimes and Transition Contexts. System Innovation and the Transition to Sustainability: Theory, Evidence and Policy; Edward Elgar Publishing: Northampton, MA, USA, 2004; ISBN 978-1-84542-342-1. [Google Scholar]
  122. Smith, A.; Stirling, A. The Politics of Social-Ecological Resilience and Sustainable Socio-Technical Transitions. Ecol. Soc. 2010, 15, 11. [Google Scholar] [CrossRef]
  123. Bejan, A. Evolution in Thermodynamics. Appl. Phys. Rev. 2017, 4, 011305. [Google Scholar] [CrossRef]
  124. Chaisson, E.J. Energy Flows in Low-Entropy Complex Systems. Entropy 2015, 17, 8007–8018. [Google Scholar] [CrossRef]
  125. Kanger, L. Rethinking the Multi-Level Perspective for Energy Transitions: From Regime Life-Cycle to Explanatory Typology of Transition Pathways. Energy Res. Soc. Sci. 2021, 71, 101829. [Google Scholar] [CrossRef]
  126. Mizrahi, O.S.; Jahelka, P.; Gdoutos, E.; Brunet, J.; Ayling, A.; Fikes, A.; Wu, A.; Madonna, R.; Atwater, H.A.; Pellegrino, S.; et al. Space Solar Power Generation: A Viable System Proposal and Technoeconomic Analysis. Joule 2025, 9, 101928. [Google Scholar] [CrossRef]
  127. Navarro-Medina, F.; Aguado-Agelet, F.; Garcia-Luis, U.; Ulloa, C.; Orgeira-Crespo, P.; Camanzo-Mariño, A.; Dragos-Darau, V.; Maia, M.M.; Gomez-San-Juan, A.; Furtado, C.; et al. WiPTherm: A Novel Energy Harvesting Paradigm for CubeSats. In Proceedings of the 73rd International Astronautical Congress IAC (2022), Paris, France, 18–22 September 2022; International Astronautical Federation, IAF: Paris, France, 2022; Volume 2022. [Google Scholar]
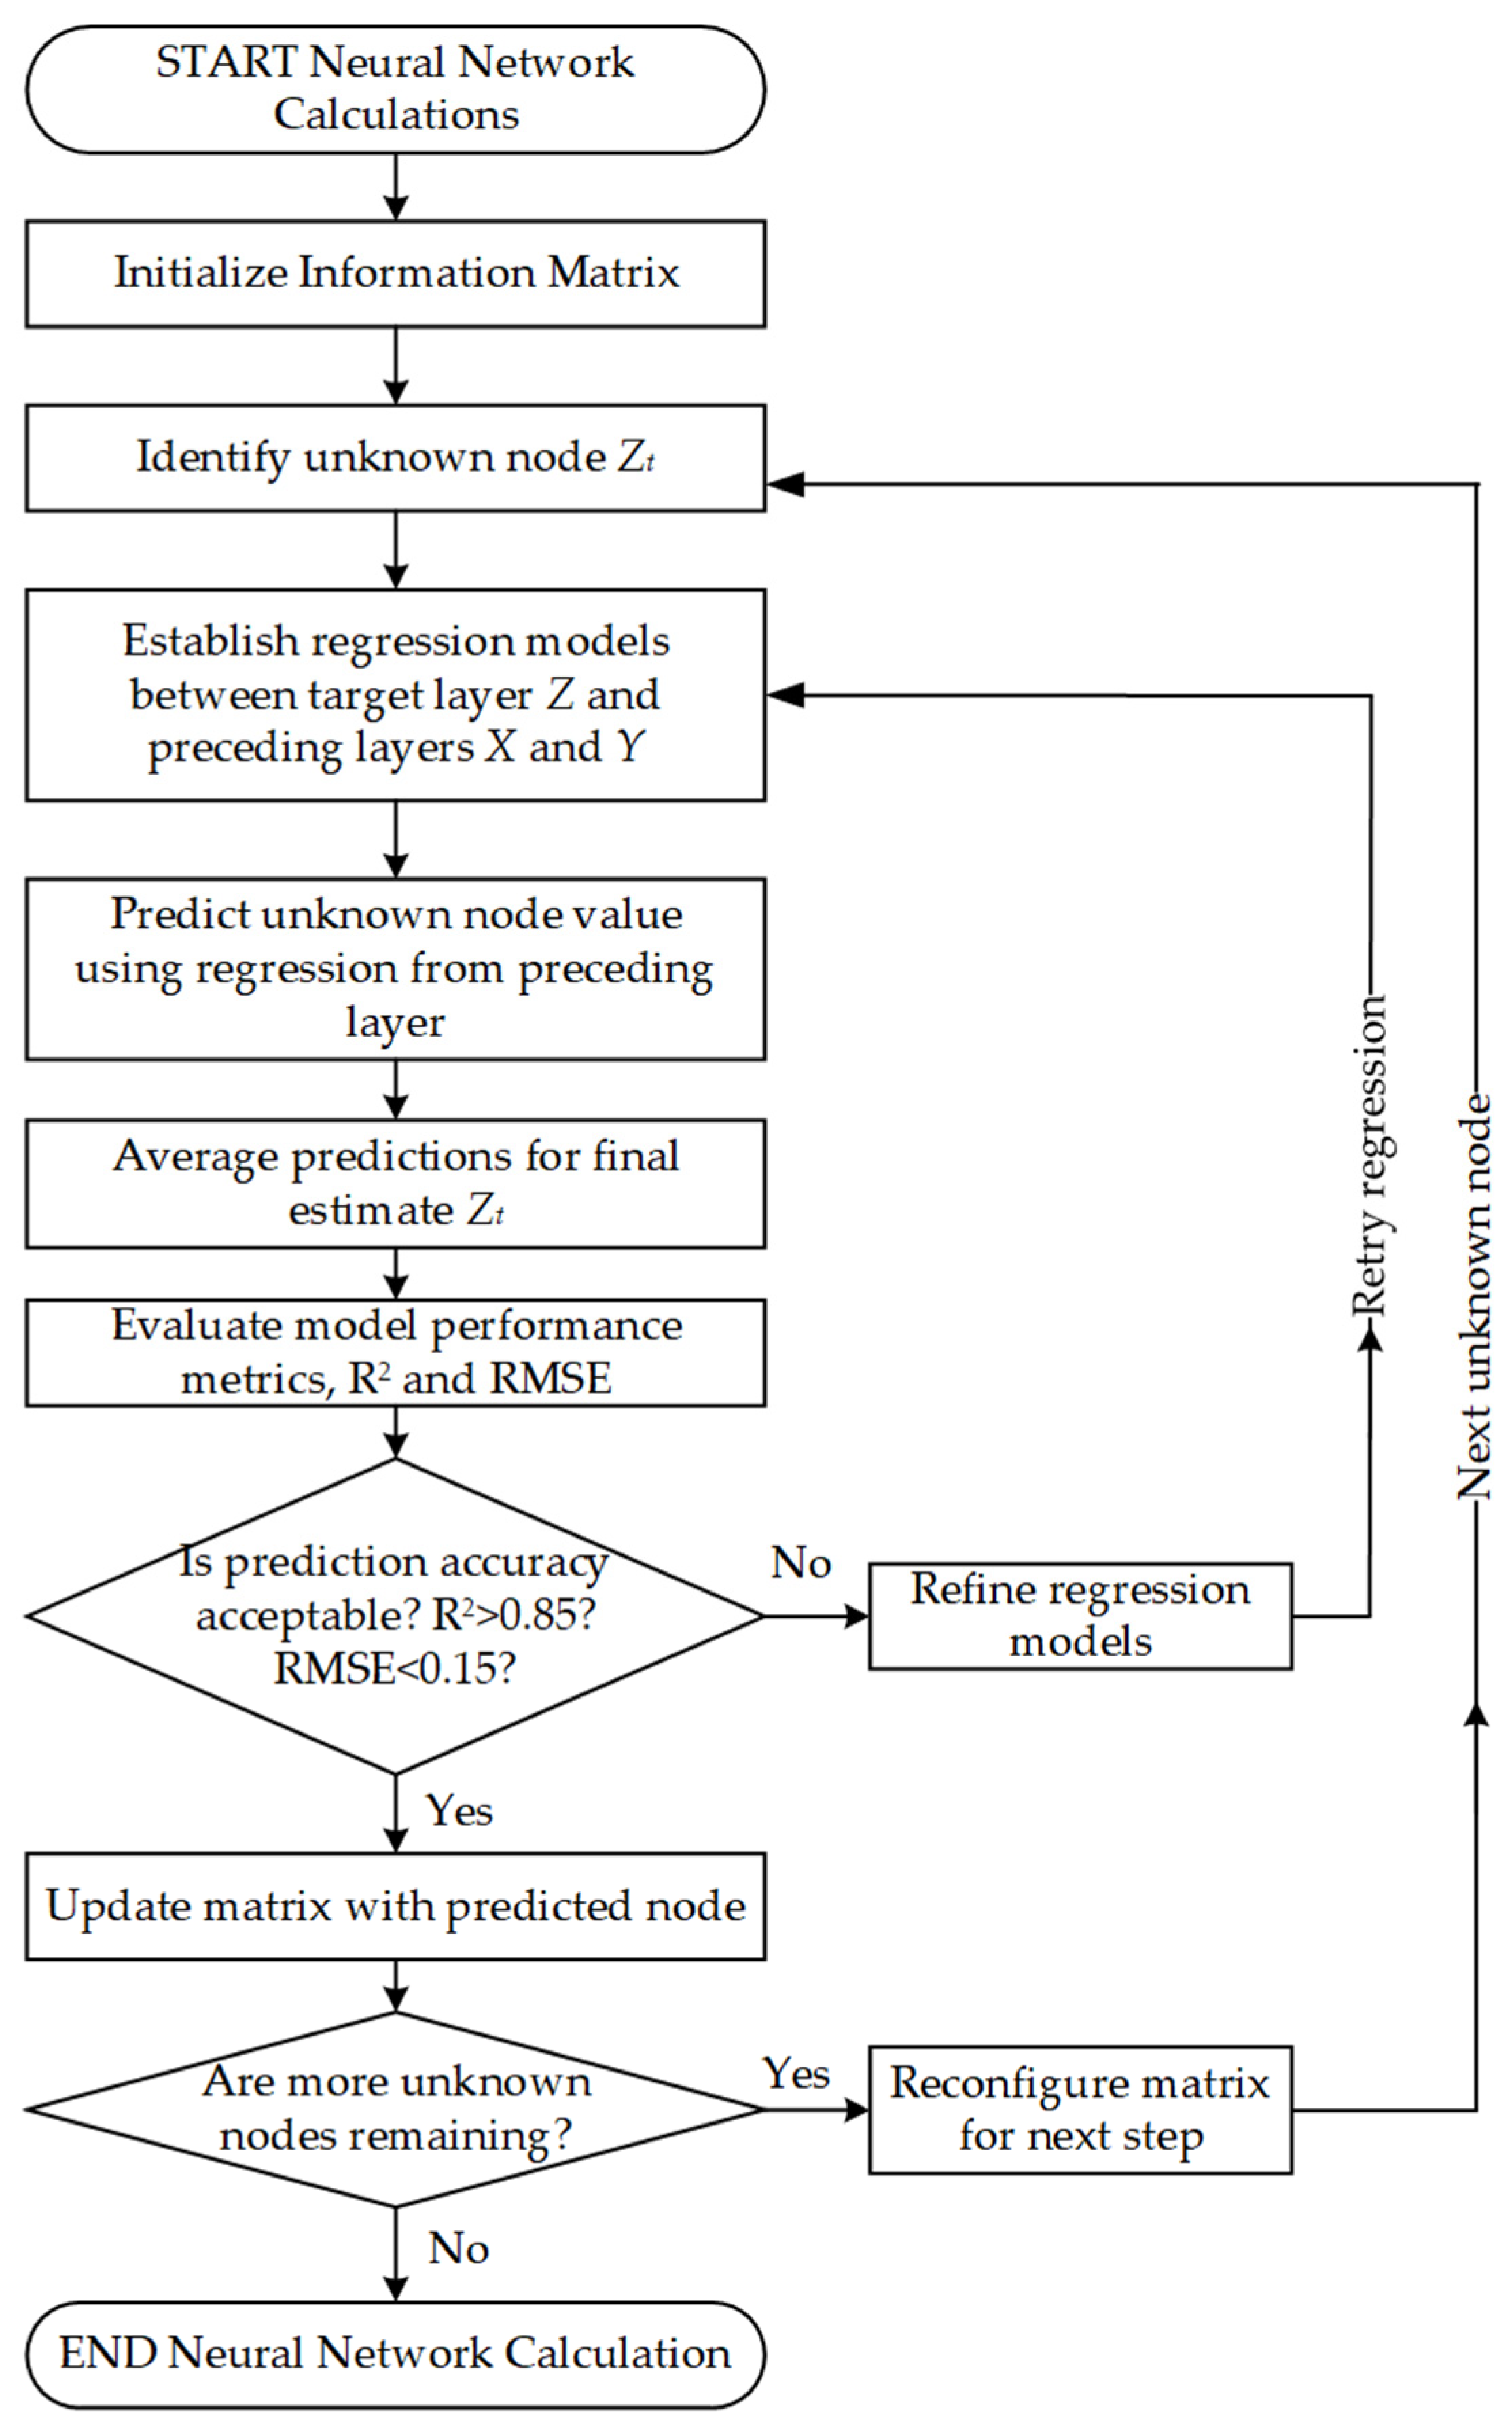
Figure 1. Flowchart of neural network tuning.
Energies 18 04367 g001
Figure 2. The error-checking algorithm flowchart.
Energies 18 04367 g002
Figure 3. The research framework for energy of the future (developed by the authors).
Energies 18 04367 g003
Figure 4. Dynamics of world population growth between 1890–2040, source: developed by authors based on [32].
Energies 18 04367 g004
Figure 5. Results of neural network forecast of the world population trajectory, source: developed by authors based on [32].
Energies 18 04367 g005
Figure 6. Results of the neural network forecast of the global energy consumption trajectory, source: developed by the authors based on [32,48].
Energies 18 04367 g006
Figure 7. Dynamics of energy consumption (2000 = 100%), source: developed by authors based on [32,48].
Energies 18 04367 g007
Figure 8. Dynamics of coal consumption (2000 = 100%), source: developed by the authors [32,48].
Energies 18 04367 g008
Figure 9. Dynamics of oil consumption (2000 = 100%), source: developed by the authors [32,48].
Energies 18 04367 g009
Figure 10. Dynamics of gas consumption (2000 = 100%), source: developed by the authors [32,48].
Energies 18 04367 g010
Figure 11. Dynamics of the shares of non-renewable sources in the energy balances of countries around the world, source: developed by the authors [48].
Energies 18 04367 g011
Figure 12. Dynamics of the share of oil in the energy balances of countries around the world, source: developed by the authors based on [32,48].
Energies 18 04367 g012
Figure 13. Dynamics of renewable energy consumption in the energy balances of countries around the world, source: developed by the authors based on [32,48].
Energies 18 04367 g013
Figure 14. Dynamics of electricity production, source: developed by the authors based on [32,48].
Energies 18 04367 g014
Figure 15. Results of the neural network forecast of the trajectory of global electricity production (Terawatt-hours), Source: developed by the authors based on [32,48].
Energies 18 04367 g015
Figure 16. Results of the neural network forecast of the global coal production trajectory (million tons), source: developed by the authors based on [32,48].
Energies 18 04367 g016
Figure 17. Results of the neural network forecast of the global oil consumption trajectory (Exajoules), source: developed by the authors based on [32,48].
Energies 18 04367 g017
Figure 18. Results of the neural network forecast of the global gas consumption trajectory (Exajoules), source: developed by the authors based on [32,48].
Energies 18 04367 g018
Figure 19. Results of the neural network forecast of the global renewable energy consumption trajectory (Exajoules), source: developed by the authors based on [32,48].
Energies 18 04367 g019
Figure 20. Results of the neural network forecast of the global NPP energy consumption trajectory (Exajoules), source: developed by the authors based on [32,48].
Energies 18 04367 g020
Figure 21. Results of the neural network forecast of the shares of traditional and alternative energy in the global energy balance, source: developed by the authors, based on [32,48].
Energies 18 04367 g021
Figure 22. Regularity of permanent growth of energy density of the energy sources used (developed by the authors).
Energies 18 04367 g022
Figure 23. Regularity of implementation of global world transformations (developed by the authors based on [32,48,77,78]).
Energies 18 04367 g023
Figure 24. Dynamics of technical innovations measured by the number of global patent applications (2021 = 100%), Source: developed by the authors based on [78].
Energies 18 04367 g024
Figure 25. Results of neural network forecast of growth of energy density of used energy sources, source: developed by the authors based on [32,48].
Energies 18 04367 g025
Figure 26. Results of the neural network forecast of the trajectory of world rail freight transportation volumes, 1999 = 100% (developed by authors based on [32,48]).
Energies 18 04367 g026
Figure 27. Results of neural network forecast of the corridor of volumes of world sea transportation (million tons), 1999 = 100% (developed by the authors based on [32,48].
Energies 18 04367 g027
Table 1. RMSE and R2 performance measures of the applied neural forecasting model.
Information Transfer from Node to NodeInformation Transfer Physics TypeRoot Mean Square ErrorDetermination Coefficient R2 (%)
1. Coal consumption model
Inside layerLogistic0.0979
Between layersLogistic0.0882
Output layerLogistic0.0783
2. Oil consumption model
Inside layerLogistic0.1583
Between layersLogistic0.1285
Output layerLogistic0.1182
3. Gas consumption model
Inside layerLogistic0.1381
Between layersLogistic0.1678
Output layerLogistic0.1480
4. Energy consumption model
Inside layerLogistic0.1080
Between layersLogistic0.1382
Output layerLogistic0.1283
Table 2. RMSE results from direct and reverse forecasting.
Types of Training1. Coal Consumption Model2. Oil Consumption Model3. Gas Consumption Model4. Energy Consumption Model
Root Mean Square Error
Direct0.100.130.110.12
Reverse0.140.150.140.16
Table 3. Performance comparison of the developed MLP neural forecasting model with BP and IEA results.
Developed ModelsRelative Standard Deviation from the Model, CV (%)
Developed MLP Forecasting ModelBPIEA
1. Coal consumption model171315
2. Oil consumption model151418
3. Gas consumption model192120
Disclaimer/Publisher’s Note: The statements, opinions and data contained in all publications are solely those of the individual author(s) and contributor(s) and not of MDPI and/or the editor(s). MDPI and/or the editor(s) disclaim responsibility for any injury to people or property resulting from any ideas, methods, instructions or products referred to in the content.